
the Creative Commons Attribution 4.0 License.
the Creative Commons Attribution 4.0 License.
 | 23 Oct 2026
Net primary productivity in the Gulf of California: spatio-temporal patterns and drivers in a warming climate (2003–2024)
Eduardo González-Rodríguez

Juan David Acevedo-Acosta
Jaime Gómez-Gutiérrez
The Gulf of California is a tropical–subtropical, productive and biodiverse marine ecosystem that supports nearly 70 % of Mexico's fisheries. Despite its ecological and socio-economic importance, the basin-scale patterns and drivers of seasonal and interannual spatial variability in net primary productivity (NPP) remain incompletely understood. Here, we analyse 22 years (2003–2024) of satellite-derived NPP data to identify the principal spatio-temporal patterns of NPP and their environmental controls. Monthly climatology shows that the cold season (December–May) contributes 68 % of annual NPP, whereas the warm season (June–November) accounts for only 32 %. To characterise regional variability, we applied the k-means clustering algorithm, selected the optimal number of clusters using the elbow and silhouette criteria, and validated the resulting classification through discriminant analysis. This procedure identified three distinct productivity zones: low-productivity (LPZ; < 900 ), mid-productivity (MPZ; 900–1700 ), and high-productivity (HPZ; > 1700 ). Interannually, the LPZ covered 36 % of the area but produces only 16.9 % of total NPP, whereas the HPZ contributes 61.4 % of total NPP while occupying only 30 % of the gulf's area. A pronounced NPP negative anomaly during 2013–2019 reduced NPP by approximately 9 % relative to the long-term mean (124 Tg C yr−1). This decline coincided with sustained ocean warming, including multiple marine heatwaves and the strong 2015–2016 El Niño event. A partial recovery was observed during 2020–2024. Nitrate availability and water-column stratification were the dominant predictors of NPP, but their effects differed among productivity zones: nitrate was negatively associated with NPP and stratification index positively associated with NPP in the LPZ, whereas the opposite relationships were observed in the MPZ and HPZ. Wind forcing, sea-surface salinity and phosphate availability exerted additional zone-specific effects. Overall, our results indicate that anomalously warm conditions reduce the spatial extent of HPZ zones and favour the expansion of oligotrophic areas. Continued warming and enhanced stratification are therefore expected to increase the extent of LPZ, with potentially significant ecological consequences for the Gulf of California.
- Article
(3842 KB) - Full-text XML
-
Supplement
(1434 KB) - BibTeX
- EndNote


The Gulf of California is a highly biodiverse ecosystem that supports approximately 70 % of Mexico's fisheries (Lluch-Cota et al., 2007). This gulf is influenced by multiple atmospheric and oceanic processes that complicate the characterisation of this complex marine system (Kahru et al., 2004; Bustos-Serrano and Castro-Valdez, 2006; López-Martínez et al., 2023; Marin-Enríquez et al., 2024). Among these processes, prolonged anomalous warming of the surface ocean exerts widespread negative impacts on marine ecosystems, with large-scale repercussions for ecological and biogeochemical functioning (Somavilla et al., 2017). Such events can alter particulate carbon flux (Xie et al., 2019), reduce biodiversity (Wernberg et al., 2016; Jones et al., 2018), and affect fisheries and aquaculture (Mills et al., 2013; Oliver et al., 2017). Enhanced ocean–atmosphere heat exchange during warming events strengthens water-column stratification (Jacox et al., 2016; Somavilla et al., 2017), disrupting nutrient supply and driving changes throughout marine food webs (Cavole et al., 2016). For instance, reductions in phytoplankton biomass and primary productivity have been documented during anomalous warming episodes such as El Niño events (Jacox et al., 2016).
Despite ongoing global warming, the responses of oceans and marine ecosystems to changing sea-temperature patterns remain uncertain (Somavilla et al., 2017). In recent decades, anomalous warming events, including the positive phase of El Niño-Southern Oscillation (ENSO) and the marine heatwaves, have increased in frequency across multiple ocean regions (Di Lorenzo and Mantua, 2016; Oliver et al., 2019). These events produce positive sea-surface temperature (SST) anomalies over a range of spatial and temporal scales and are generally associated with declines in primary productivity (Wernberg et al., 2016; Oliver et al., 2017). Concurrently, global ocean heat content has risen over the past five decades (NOAA, https://www.ncei.noaa.gov/access/global-ocean-heat-content/, last access: 1 October 2026), suggesting that marine ecosystems may be approaching resilience thresholds with potentially irreversible consequences (Frölicher et al., 2018).
The northeastern Pacific Ocean represents a transitional marine ecosystem (Fiedler and Talley, 2006; Cepeda-Morales et al., 2013), where warming events across diverse spatiotemporal scales have been reported in the Gulf of California (Sánchez-Cabeza et al., 2022; López-Martínez et al., 2023). Notably, the combined influence of the Blob in the North Pacific, strong equatorial El Niño event and overlapping marine heatwaves between 2013 and 2016 produced persistent warm anomalies in northwestern Mexico (Joh and Di Lorenzo, 2017; Jiménez-Quiroz et al., 2019; García-Fernández et al., 2023). These anomalies propagated through mid- and upper-trophic levels, altering species distributions, including euphausiids, copepods, pelagic crabs, and tunas, in the Eastern Tropical Pacific (Cavole et al., 2016; García-Fernández et al., 2023). As global temperatures rise, such anomalies are expected to disrupt the biological carbon pump, reducing oceanic carbon storage and increasing atmospheric carbon concentrations (Cavole et al., 2016; Xie et al., 2019). These changes will likely reshape community structures and ecosystem functioning (Cavole et al., 2016).

Figure 1Bathymetric map of the Gulf of California, conceptually delimited from the Pacific Ocean by a red line. The gulf is a large and deep pull-apart basin formed by right-lateral strike-slip motion along faults associated with the San Andreas system. The resulting geological configuration supports oceanographic processes that sustain high phytoplankton productivity, with contrasting dynamics along the opposing coasts.
The Gulf of California (20–32° N, 105–115° W) is among the most diverse and productive marine regions in Mexico (Fig. 1), characterised by regions with high net primary productivity (NPP, defined as gross primary productivity minus respiration) and phytoplankton biomass expressed as chlorophyll a concentration (Chl a) (Lluch-Cota, 2004; O'Reilly and Sherman, 2016). Its elongate geometry, steep bathymetry, and pronounced orographic relief modulate regional pressure-gradient forcing and orographic channelling of the winds, generating seasonally coherent along-gulf winds whose wind-stress curl drives Ekman upwelling, coastal divergence, and vertical mixing that inject nutrient-rich subsurface waters into the euphotic zone (Miranda-Alvarez et al., 2020; Robles-Tamayo et al., 2020). However, anomalous warming associated with the positive phases of ENSO and Pacific Decadal Oscillation (PDO) reduce mean Chl a concentration in the gulf (Hakspiel-Segura et al., 2022; López-Martínez et al., 2023). In situ NPP measurements in the region remain scarce, particularly during winter, limiting our understanding of latitudinal gradients and seasonal cycles (Zeitzschel, 1969; Álvarez-Borrego and Lara-Lara, 1991; Mercado-Santana et al., 2017). Remote-sensing estimates of NPP and Chl a, based on Vertically Generalised Production Model (VGPM) incorporating light-use efficiency and absorbed photosynthetically active radiation, have partially addressed these gaps. However, most studies have focused on local variability rather than basin-scale-dynamics. Furthermore, while satellite-derived Chl a is often used as a proxy forphytoplankton biomass within the first optical depth, whereas NPP integrates production across the entire euphotic zone and daylight period (Balch et al., 1992; Behrenfeld and Falkowski, 1997).
In this study, we investigate the response of NPP in the Gulf of California to recent anomalous warming events, using a 2003–2024 satellite record to establish the seasonal and interannual baseline against which anomalies are assessed. We specifically focus on the 2013–2024 period, encompassing the 2014–2016 anomalously warming event, to evaluate how elevated SSTs and enhanced stratification modify the spatial distribution of productivity and its environmental controls. We hypothesize that anomalous warming events intensify water column stratification, restricting the flux of nutrient-rich water to the euphotic zone and thereby reducing NPP. By combining satellite observations with environmental reanalysis-based water-column variables, we identify the key drivers that modulate NPP under anomalously warm conditions.
2.1 Study area
The Gulf of California (20–32° N, 105–115° W) is a marginal tropical–subtropical sea of the eastern Pacific located in northwestern Mexico (Fig. 1). It extends ∼ 1500 km from its northernmost limit to Bahía de Banderas in the south and is 150–200 km wide. South of 28° N, the gulf comprises a series of six deep basins separated by bathymetric sills (Álvarez-Borrego and Lara-Lara, 1991). The region exhibits dynamic and heterogeneous conditions driven by tidal currents, wind momentum transfer, bathymetrically controlled and wind-driven coastal upwelling, and intense solar heating (Álvarez-Borrego, 2007). In the Midriff Archipelago, bathymetric upwelling maintains low temperatures year-round. From December to May, north-westerly winds induce strong coastal upwelling along the eastern coast, transporting nutrient-rich subsurface waters into the euphotic zone, fuelling phytoplankton growth. In contrast, from July to October southeasterly winds are generally weaker and insufficient to disrupt the pronounced thermal stratification that develops during summer. June and November are considered transitional months between the cold-warm and warm-cold seasonal regimes (Santamaría-del-Ángel et al., 1994; Hidalgo-González and Álvarez-Borrego, 2004). The Baja California mountain ranges block low-lying clouds from the Pacific, resulting in predominantly clear skies over the gulf except during summer monsoon incursions (Badan-Dangon et al., 1985). For this study, the southern boundary of the Gulf of California was defined by a line connecting Cabo San Lucas on the Baja California peninsula (23° N) to Cabo Corrientes in Nayarit (∼ 20° N; Fig. 1).
2.2 Data collection
Net primary productivity (NPP) was obtained from the satellite-based VGPM product distributed through NOAA Environmental Research Division’s Data Access Program (ERDDAP). This product was selected because it provides spatially coherent NPP fields for the Gulf of California and reproduces the expected seasonal cycle of regional productivity, with enhanced winter-spring production and reduced summer productivity under stronger stratification. Reanalysis products were used only for subsurface and water-column variables, including satellite observations of mixed-layer depth, nutrients, salinity, temperature profiles, and the derived stratification index, for which long-term basin-scale observational datasets with consistent spatial and temporal coverage are not currently available in the Gulf of California. The following subsections summarize the datasets used for NPP, physical, biogeochemical, and climate variables.
2.2.1 Satellite variables
Monthly sea surface temperature (SST) and Chlorophyll a concentration (Chl a; OCI algorithm) were obtained from Aqua-MODIS Level 3 global composites (4 km × 4 km) spanning January 2003 to December 2024, downloaded from NASA Ocean Colour (https://oceancolor.gsfc.nasa.gov/l3/, last access: 1 October 2026).
Euphotic-zone depth (EZD) was derived from Chl a using the chlorophyll a dependent bio-optical parametrisation with piecewise power-law relationships for different trophic regimes (Morel and Berthon, 1989; Morel and Maritorena, 2001).
Net primary productivity (NPP) at the same nominal resolution (4 km × 4 km) was obtained from monthly Level-3 products of the Vertically Generalised Production Model (VGPM) via NOAA CoastWatch (https://coastwatch.pfeg.noaa.gov/erddap/griddap/erdMH1ppmday.graph, last access: 1 October 2026). Monthly 10-m wind components (u,v) were taken from Remote Sensing System (RSS) CCMP V3.1 Level-3 dataset (25 km × 25 km) for 2003–2024 (https://data.remss.com/ccmp/v03.1/, last access: 1 October 2026). To account for the gulf's orientation, the coordinate axes were rotated by 40°, aligning the total u-component with the gulf's axis and the rotated v-component perpendicular to it. The along-gulf wind u-component (URT) was used in statistical analyses.
Daily sea current components (u,v; Level 4; 12.5 km × 12.5 km) were obtained from the Copernicus Marine Environment Monitoring Service (CMEMS, https://doi.org/10.48670/moi-00148). Monthly means were computed for 2003–2024, and rotated analogously to the winds; only the along-gulf u-component (UAR) was used in statistical analyses.
Monthly global gap-free Level-4 (L4) sea surface salinity (SSS) analyses at 12.5 km spatial resolution were obtained from CMEMS (https://doi.org/10.48670/moi-00051) for the period 2003–2024 and included in the statistical analyses.
2.2.2 Reanalysis variables and derived parameters
Monthly Global Ocean Biogeochemistry Hindcast reanalysis (GLOBAL_REANALYSIS_BIO_001_029) for nitrate (NO3), phosphate () and silicate (SiO2) concentrations were downloaded from CMEMS (https://doi.org/10.48670/moi-00019). These Level 4 products are provided on a 25 km × 25 km grid with 75 depth levels. Mixed layer depth (MLD), potential temperature (θ), and practical salinity (PSU) were obtained from the Global Ocean Physics Reanalysis (GLOBAL_REANALYSIS_PHY_001_030; ∼ 8 km × 8 km horizontal resolution, 50 standard depth levels; https://doi.org/10.48670/moi-00021).
2.2.3 Data regridding
To ensure consistency, NO3, , SiO2, MLD, and the stratification index (Sect. 2.3.2) were bilinearly interpolated to the 4 km grid used for NPP, SST, and EZD. Only grid cells within the Gulf of California domain (Fig. 1) were retained for analyses.
2.3 Data processing
2.3.1 Identification of warm events, climate indices, and spatial trends
Anomalous warm periods were identified using monthly SST anomalies (SSTa), and marine heatwaves (MHWs) were detected using daily SST following Hobday et al. (2016) who define MHWs as periods when SST exceeds a seasonally varying 90th-percentile threshold for ≥ 5 consecutive days. To this end, daily L4 SST data (GHRSST, https://www.ncei.noaa.gov/archive/accession/GHRSST-MUR-JPL-L4-GLOB, last access: 1 October 2026) were used for the Gulf.
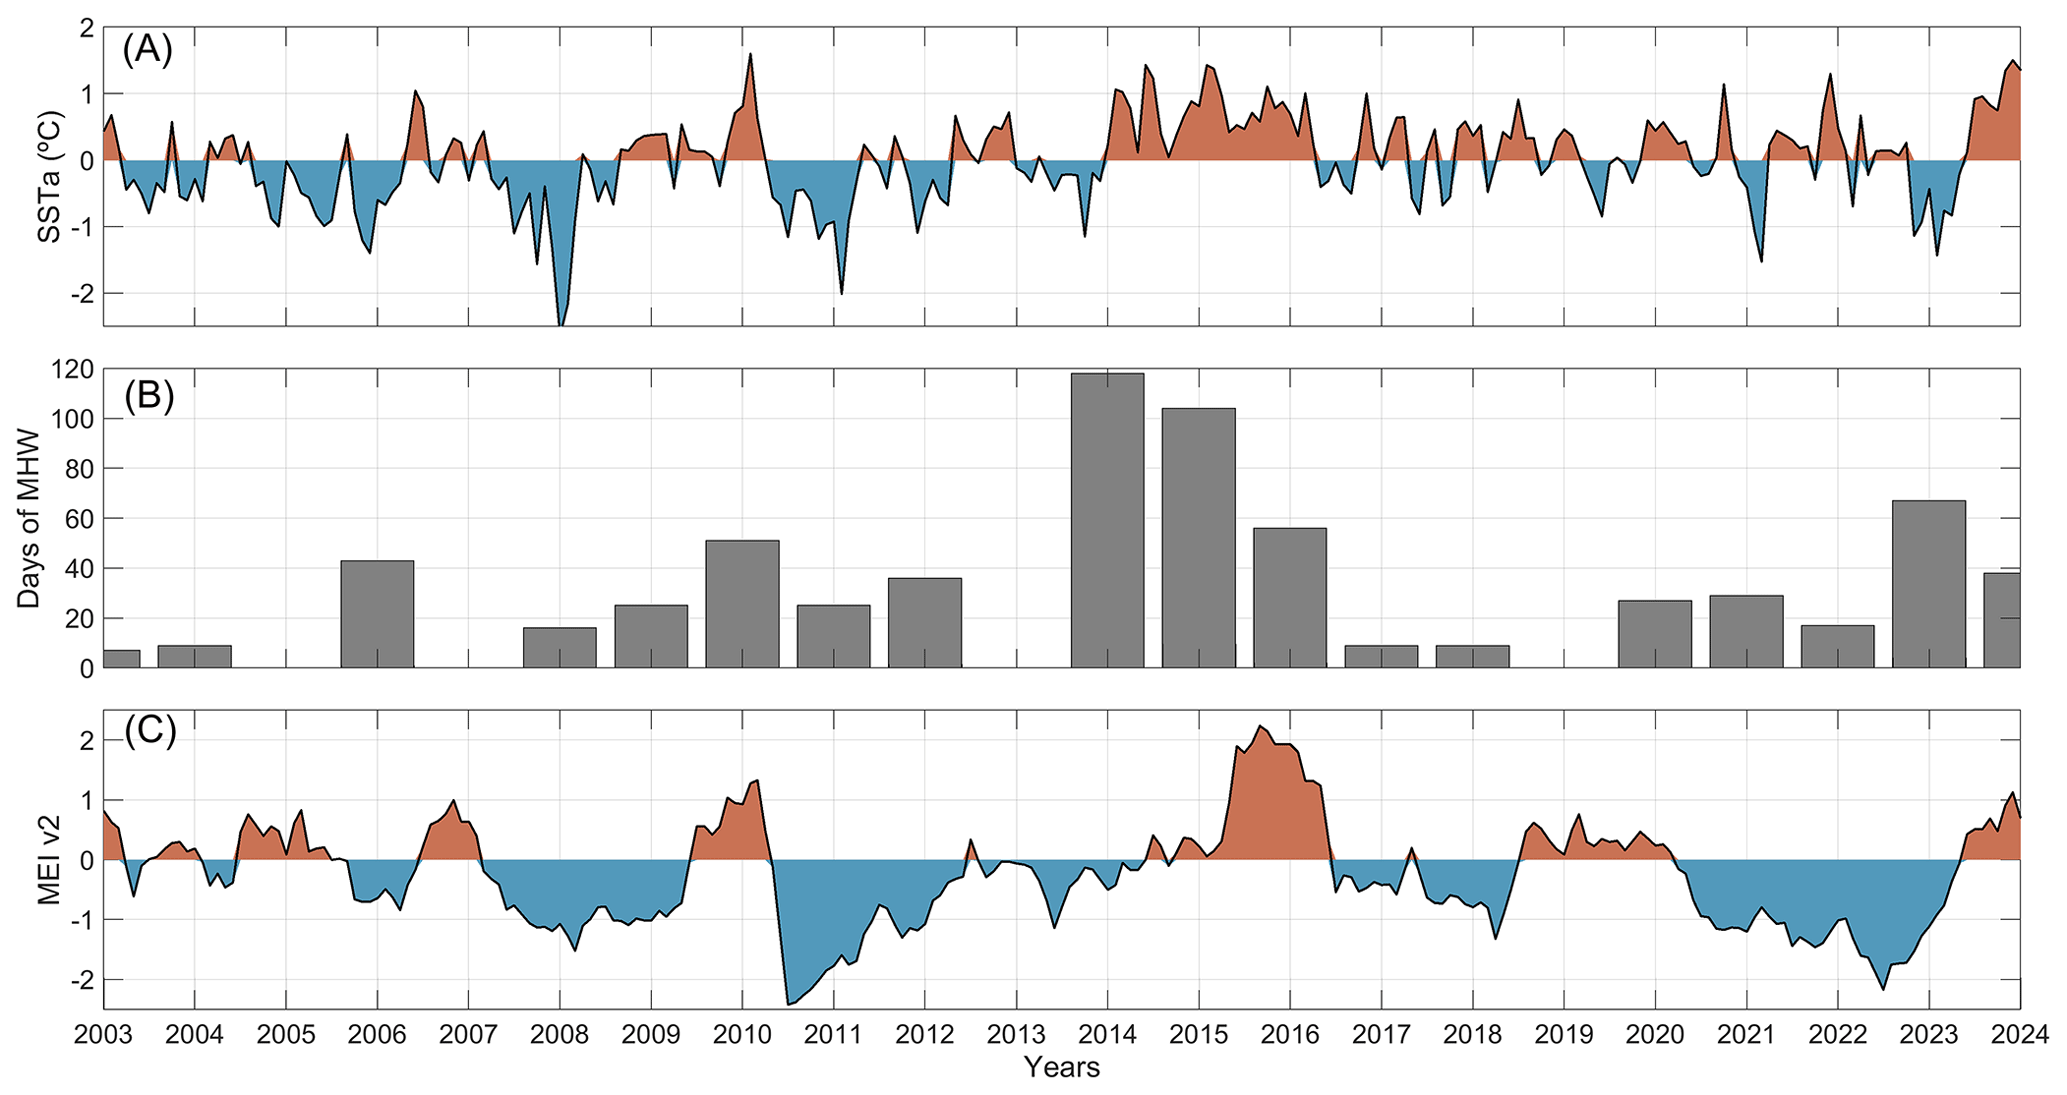
Figure 2Time series for the Gulf of California of (A) monthly sea surface temperature anomaly (SSTa), (B) annual number of marine heat waves (MHW) days, and (C) multivariate ENSO index version 2 (MEI.v2) from January 2003 to December 2024.
The Multivariate ENSO Index version 2 (MEI.v2) was used to represent ENSO variability during the study period. MEI.v2 is an index for overlapping 2-month periods (December–January, January–February, etc.) based on the leading combined empirical orthogonal function of five ocean–atmosphere variables over the tropical Pacific: sea-level pressure, SST, zonal and meridional surface winds, and outgoing longwave radiation using an empirical orthogonal function (EOF) framework over the tropical Pacific (30° S to 30° N) (Wolter and Timlin, 2011; Kobayashi et al., 2015). The MEI.v2 index is calculated for 12 overlapping 2-month seasons, which allows the seasonal structure of ENSO variability to be represented more appropriately. MEI.v2 values were obtained from National Oceanic and Atmospheric Administration (NOAA) Physical Sciences Laboratory webpage (https://psl.noaa.gov/enso/mei/, last access: 1 October 2026) for the entire study period. ENSO influence was assessed by comparing SST anomaly (SSTa) time series with MEI.v2 (Fig. 2).
In addition, the Pacific Decadal Oscillation (PDO) and the North Pacific Gyre Oscillation (NPGO) indices were included to evaluate the potential influence of large-scale Pacific climate variability on productivity patterns in the Gulf of California. The PDO index represents the dominant mode of monthly SSTa variability in the North Pacific. It is calculated as the leading EOF of monthly SSTa between 20 and 70° N, after removing the monthly climatology and the global mean SSTa. Monthly PDO values were downloaded from the NOAA Physical Sciences Laboratory climate time-series database: https://psl.noaa.gov/data/timeseries/month/PDO/ (last access: 1 October 2026).
The NPGO index represents the second dominant mode of sea surface height variability in the Northeast Pacific. It is derived from an EOF analysis of sea surface height anomalies and reflects changes in the intensity of the central and eastern branches of the North Pacific gyre circulation. The NPGO is also associated with variability in salinity, nutrients, and chlorophyll a in the Northeast Pacific. Monthly NPGO values were downloaded from the North Pacific Gyre Oscillation webpage (https://o3d.org/npgo/, last access: 1 October 2026).
Spearman's rank correlation coefficients were calculated to evaluate the relationships among hydrographic variables, climate indices, and NPP across gulf regions. To account for temporal autocorrelation, statistical significance was assessed using an effective sample size correction following the method of Pyper and Peterman (1998). Monotonic trends were assessed using the Mann–Kendall test to determine their statistical significance and the Theil–Sen slope estimator to quantify their magnitude. Both analyses were performed using the Mann–Kendall and Theil–Sen functions implemented in the Climate Data Toolbox for MATLAB (Greene et al., 2019).
2.3.2 Calculation of stratification index
Water-column stratification was quantified with a density-based index calculated from vertical profiles of potential temperature (θ) and practical salinity (PSU). The stratification index (SI; kg m−3) was defined as:
where: σθ is potential density anomaly referenced to 0 dbar. Practical Salinity was converted to Absolute Salinity (g kg−1) using latitude, longitude, and pressure. Potential density anomaly referenced to 0 dbar was subsequently calculated at the surface and at the mixed-layer depth (MLD), following the Thermodynamic Equation of Seawater 2010 (TEOS-10) (IOC, SCOR, and IAPSO, 2010). With this definition, positive SI values indicate stable stratification (lighter surface waters overlying denser subsurface waters), whereas values near zero denote well-mixed conditions. This metric represents the physical barrier to vertical mixing and links surface warming to reduced nutrient supply (Jacox et al., 2016).

Figure 3Regionalisation of net primary productivity (NPP) based on (A) the k-means clustering of the January 2003–December 2024 global climatology, (B) warm seasonal (June–November), and (C) cold seasonal (December–May). NPP classes: low-productivity (LPZ < 900 ), mid-productivity (MPZ 900–1700 ), and high-productivity (HPZ > 1700 ).
2.3.3 Regional classification of net primary productivity
To analyse spatio-temporal variability in NPP, monthly observations for each grid cell were assigned to one of three productivity classes according to their satellite-derived NPP values. Consequently, the classes represent dynamic productivity conditions rather than fixed geographical regions, and the spatial extent of each class was allowed to vary among months, seasons, and years. Prior to clustering, outliers were removed following the interquartile range (IQR) criterion (1.5 × IQR) of Moore and McCabe (1999). The resulting filtered dataset was used in all subsequent analyses. NPP was then classified using the k-means algorithm (Kapoor and Singhal, 2017; Zhang et al., 2025). To evaluate the appropriate number of clusters, we compared alternative solutions using the elbow and silhouette methods (Fig. S1). These diagnostics indicated that a small number of clusters, particularly K = 2–4, provided the most robust classifications, whereas higher values, K≥5, resulted in lower clustering performance and increased spatial fragmentation. Because NPP varies along a continuous environmental gradient, K=3 was selected as the most parsimonious and ecologically interpretable solution, resolving three coherent NPP regimes corresponding to low-, intermediate-, and high-productivity waters.
A discriminant analysis was subsequently performed to evaluate whether the NPP-derived productivity classes corresponded to distinct environmental regimes. The productivity classes obtained from the k-means classification were used as the grouping variable, whereas the environmental variables, SST, EZD, MLD, NO3, , SiO2, URT, UAR, SI, and SSS, were included as explanatory variables (Johnson and Wichern, 2018). NPP was deliberately excluded from this analysis because it was the variable used to define the original k-means classification. Its inclusion would therefore have introduced circularity and artificially inflated the classification performance. Thus, the purpose of the discriminant analysis was not to validate the clustering procedure or the selected number of clusters, but rather to determine whether the resulting NPP-based productivity classes could be independently distinguished by hydrographic and biogeochemical characteristics.
Spatial distribution and seasonal patterns (cold season: December–May and warm season: June–November) were visualised (Fig. 3) (Santamaría-del-Ángel et al., 1994; Hidalgo-González and Álvarez-Borrego, 2004). The areal coverage for each cluster was calculated by counting grid cells within each class, converting to km2, and then to percentage coverage (%) per month, season, and year. Monthly anomalies were calculated from the coverage time series (Kushnir, 1994; Ramos-Rodríguez et al., 2012). Monthly climatological NPP was estimated for each cluster, and cluster contributions were integrated to obtain total monthly productivity. NPP is reported as teragrams of carbon per month (Tg C month−1) and per year (Tg C yr−1). Annual distribution patterns were visualised (Figs. 5, S2 and S3).
2.3.4 Assessment of NPP drivers
To explain spatial and temporal variability in NPP, the following biophysical variables were analysed for each NPP zone: SST, EZD, MLD, NO3, , SiO2, URT, UAR, SI, and SSS. Monthly time series were computed by zone for each variable. Nutrients (NO3, , SiO2) were vertically integrated from the surface to the EZD prior to analysis.
Potential collinearity among predictors was evaluated with correlation matrices considering Spearman correlations > 0.7; highly correlated variables were excluded from the final predictor set (Table S1 in the Supplement).
To avoid potential circularity between the response variable and predictor variables, SST, euphotic zone depth (EZD), and SiO2 were excluded from the final GLMM because these variables are directly involved in, or derived from quantities used in, the VGPM algorithm employed to estimate NPP. To identify the environmental drivers of NPP and evaluate whether their effects differed among productivity zones, we fitted a Generalised Linear Mixed Model (GLMM) using a Gamma error distribution and a log-link function, which is appropriate for continuous, positive, and right-skewed response variables such as NPP (Corrales and Cepeda-Cuervo, 2019; Miyamoto et al., 2019). Prior to modelling, all continuous predictor variables were standardised (z-scores) to facilitate comparison of effect sizes and improve model convergence. Separate models were fitted for each productivity zone; within each model, MLD, NO3, , URT, UAR, SI, and SSS were included as fixed effects. To account for temporal dependence among observations and repeated measurements through time, month was included as a random intercept term (1|Month). The model structure was:
where NPPzone indicates the response variable and the same GLMMs structure was fitted independently to each net productivity zone class (low-productivity zone (LPZ), mid-productivity zone (MPZ), and high productivity zone (HPZ) as defined in result section); therefore, zone was used only to stratify the dataset prior to model fitting and was not included as a predictor in the models. MLD = mixed-layer depth, NO3 = nitrate concentration, = phosphate concentration, UAR = along-gulf (u) sea current component; URT = along-gulf (u) wind component; SI = stratification index, SSS = sea surface salinity, and 1|Month represents the random effect, and the environmental variables correspond to fixed effects.
Positive coefficients indicate that higher predictor values are associated with increased NPP, whereas negative coefficients suggest inhibitory or limiting effects. Model fitting was performed using the fitglme function in MATLAB. Model assumptions and goodness of fit were evaluated through graphical and statistical diagnostics. Because a Gamma distribution with a log-link function was employed, diagnostic evaluation focused on the distribution of deviance and Pearson residuals, the absence of systematic patterns in residual-versus-fitted value plots, and the assessment of homoscedasticity across the range of fitted values. Quantile-quantile plots of residuals were also inspected to evaluate potential departures from normality. The adequacy of the linear predictor was examined by inspecting residual patterns against each covariate, while the inclusion of month as a random effect accounted for non-independence among observations collected within the same temporal group. Model performance was further assessed using Akaike's Information Criterion (AIC) and Bayesian Information Criterion (BIC). Fixed-effect coefficients (estimate, standard error, t-statistic, and p-value) were evaluated with marginal ANOVA to identify significant predictors. Predictors with p < 0.05 were considered significant drivers of NPP.
3.1 Anomalous warming events
Sea surface temperature anomalies (SSTa) in the Gulf of California were predominantly negative from 2003 to 2013. Beginning in 2014, anomalies transitioned to positive values, with increasing frequency and duration over time. The most intense and persistent positive anomalies occurred between late–2013 and late–2016 (Fig. 2A). During 2014–2016, the annual number of MHW days reached 118, 95, and 51 d, respectively, amounting to 50.2 % of all MHW days in the 2003–2024 record (Fig. 2B). The MEI.v2 also showed strong positive anomalies and extreme values during 2015–2016, consistent with the 2015–2016 El Niño event and was flanked by prolonged negative anomalies associated with La Niña conditions during 2010–2014 and 2016–2018 (Fig. 2C). Based on SSTa, MHW occurrence, and MEI.v2, the warmest period in the study was 2014–2016, followed by 2023–2024, which recorded the second-highest number of MHW days.
3.2 Regional classification of NPP
The k-means clustering analysis identified three groups. The discriminant analysis indicated clear environmental separation among the NPP-derived productivity classes. The overall misclassification rate was low (8.7 %), while assignment accuracy was high across groups, with values of 92.4 %, 96.1 %, and 80.1 % for Groups 1–3, respectively. Groups were categorised as low-productivity (LPZ, < 900 ), mid-productivity (MPZ, 900–1700 ), and high-productivity (HPZ, > 1700 ) productivity zones (Fig. 3). By dividing the Gulf of California into three productivity zones, we evaluate how anomalous warming affects their temporal spatial extent, their total carbon contribution, and the physical drivers underlying these changes.
3.3 Seasonal and interannual variability in primary productivity
The 2003–2024 NPP mean seasonal cycle ranged from 642 to 3487 . The average annual spatial pattern showed a gulf-latitudinal gradient along the continental coast, extending from the mouth (∼ 20° N) to the northern gulf (∼ 31.5° N) (Fig. 3A). The most productive regions (HPZ, > 1700 ) included the Nayarit, Sinaloa, and Sonora coasts, the Midriff Archipelago (1200–2000 ), and the Colorado River mouth extending ∼ 40 km offshore (Fig. 3A).
Mid-productivity (MPZ, 900–1700 ) occupied coastal waters near the gulf's mouth and southern sector, forming a coast-shore gradient from the coast to the shelf edge. The MPZ extended from ∼ 25° N to the Midriff Archipelago region and along the entire peninsular coast, with a core in the upper gulf. Low productivity waters (LPZ, < 900 ) characterised oligotrophic conditions from the mouth to ∼ 26° N (Fig. 3A). Seasonality was pronounced during the warm season (June–November), HPZ and MPZ coverage decreased, while LPZ expanded northward to ∼ 28° N, forming a core in the upper gulf (Fig. 3B). In contrast, during the cold season (December–May), HPZ expanded over the upper gulf and along both continental and peninsular coasts (Fig. 3C).

Figure 4(A) Monthly mean NPP (bars) for January 2003–December 2024, showing class contribution (%) as stacked bars and total NPP (Tg C month−1), (B) mean annual NPP (Tg C yr−1) per zone for 2003–2024. The dashed line denotes time series mean.
Gulf-wide climatological monthly mean NPP over the 22-year period was 8.6 Tg C month−1. During the cold season, NPP peaked in March at 14.9 Tg C month−1, whereas during the warm season it reached a minimum in August (4.4 Tg C month−1) (Fig. 4A). HPZ coverage increased from 34 % to 71 % (mean 54 %) in cold season but declined to 19 % in warm season, reaching ∼ 8 % in July–August (Figs. 3C and 4A). LPZ covered 8 %–20 % (∼ 10 %) in cold season and expanded to 49 % in warm season, peaking ∼ 66 % in July–August. MPZ accounted for ∼ 34 % annually (Figs. 3B and 4A).
Gulf-wide annual NPP per productivity zone ranged from 84 to 198 Tg C yr−1 (mean of 124 ± 27.3 Tg C yr−1) (Fig. 4B). Contributions over the entire period were HPZ = 61.5 %, MPZ = 21.6 %, and LPZ = 16.9 % (Fig. 4B). During 2003–2012 (predominantly negative SSTa), HPZ contributed 63.9 %, MPZ = 20.9 %, and LPZ = 15.2 %. During 2013–2024 (positive SSTa), LPZ increased to 18.4 %, while HPZ declined to 59.4 %, indicating a progressive reduction in HPZ extent, MPZ remained ∼ 21.6 %. Years 2006–2012 exceeded the historical mean (124 ± 27.3 Tg C yr−1), with 2008, 2011, and 2012 being most productive (167, 198, and 164 Tg C yr−1, respectively). In those years, HPZ contributed ∼ 78 % of NPP, while LPZ contributed 14 %–17 %. In contrast, the anomalously warm interval (2014–2016) recorded the lowest mean NPP (∼ 101 Tg C yr−1), with LPZ contributing 21.8 % and HPZ declining to 54.7 % in 2016. MPZ exceeded 25 % of NPP in 2004, 2013, 2018, and 2021 (Fig. 4B). The longest below-average period occurred during 2013–2019, followed by recovery in 2020–2024, only 2023 (111 Tg C yr−1) remained below the mean. Notably, 2024 ranked fourth (152 Tg C yr−1), after 2008, 2011, and 2012.

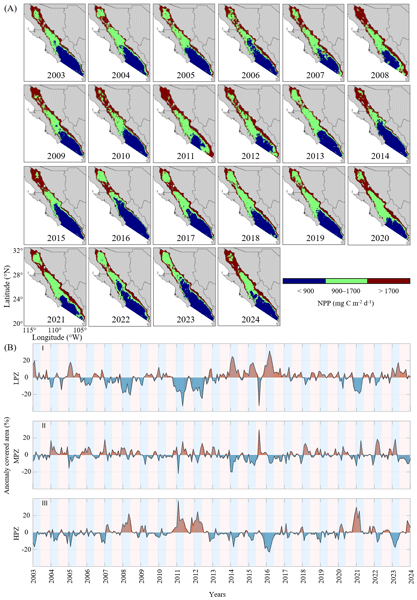
Figure 5(A) NPP annual maps showing low-productivity (LPZ), mid productivity (MPZ), and high productivity (HPZ) variability during 2003–2024; (B) anomalies in class coverage (%) through time for (A) low (LPZ), (B) mid (MPZ), and (C) high (HPZ). Cold (blue) represents a reduction in cover, and warm (red) represents an increase in cover relative to the historical average distribution.
3.4 Spatial and interannual variability of primary productivity
The annual spatial distribution of the LPZ, MPZ and HPZ (Fig. 5) exhibited distinct patterns closely tied to temperature regimes. Here, percentages refer to the spatial extent of each zone. During 2003–2012, when SSTa were predominantly negative, the LPZ was mostly located south of 26° N, covering on average 32.4 % of the gulf. In these years, HPZ was prominent in the upper gulf, the Midriff Archipelago, and along the continental coast, extending > 40 km offshore, and accounting for 33.3 % of the gulf area. In contrast, during 2013–2023, when SSTa were mostly positive, HPZ coverage decreased markedly in coastal areas and the upper gulf (< 26 % of the area), while MPZ expanded to ∼ 33.9 %, occupying much of the basin. The most pronounced spatial reorganisation occurred during the 2014–2016 warm anomaly period, when LPZ increased to nearly 50 %, advanced north of 26° N and reached ∼ 28° N in 2016. Years with widespread HPZ coverage (e.g., 2008, 2011, 2012, 2021 and 2024) coincided with positive NPP anomalies > 25 %, whereas 2013–2016 showed LPZ expansions > 20 % (Fig. 5).
Seasonality was most pronounced in the cold season (December–May). On average, HPZ covered 44.3 % of the gulf, followed by MPZ (33.5 %) and LPZ (22.2 %). HPZ varied from 22.9 % (2016) to 63 % (2012), MPZ from 25.7 % (2010) to 42.5 % (2013), and LPZ from 2 % (2021) to 44 % (2016). HPZ exceeded 50 % in 2008 (58 %), 2011 (61.4 %), 2012 (63 %), and 2021 (59.7 %), with LPZ nearly absent (< 10 %) in 2021. Conversely, HPZ fell below the historical average in 2014, reaching 22.9 % in 2016 and 42 % in 2017 (Fig. S2).
During the warm season (June-November), interannual variability was lower. LPZ dominated averaging 68.5 % (range 57.9 %–76.2 %) and shifting northward into the upper gulf. MPZ averaged 19.7 % (15.6 %–26.9 %), and HPZ averaged 11.7 % (7 %–22 %) concentrated near the Midriff Archipelago, Colorado River mouth, and along the continental coast, with limited offshore extent (Fig. S3). Additional latitude-time distributions of NPP and SST anomalies are shown in Figs. S4 and S5.
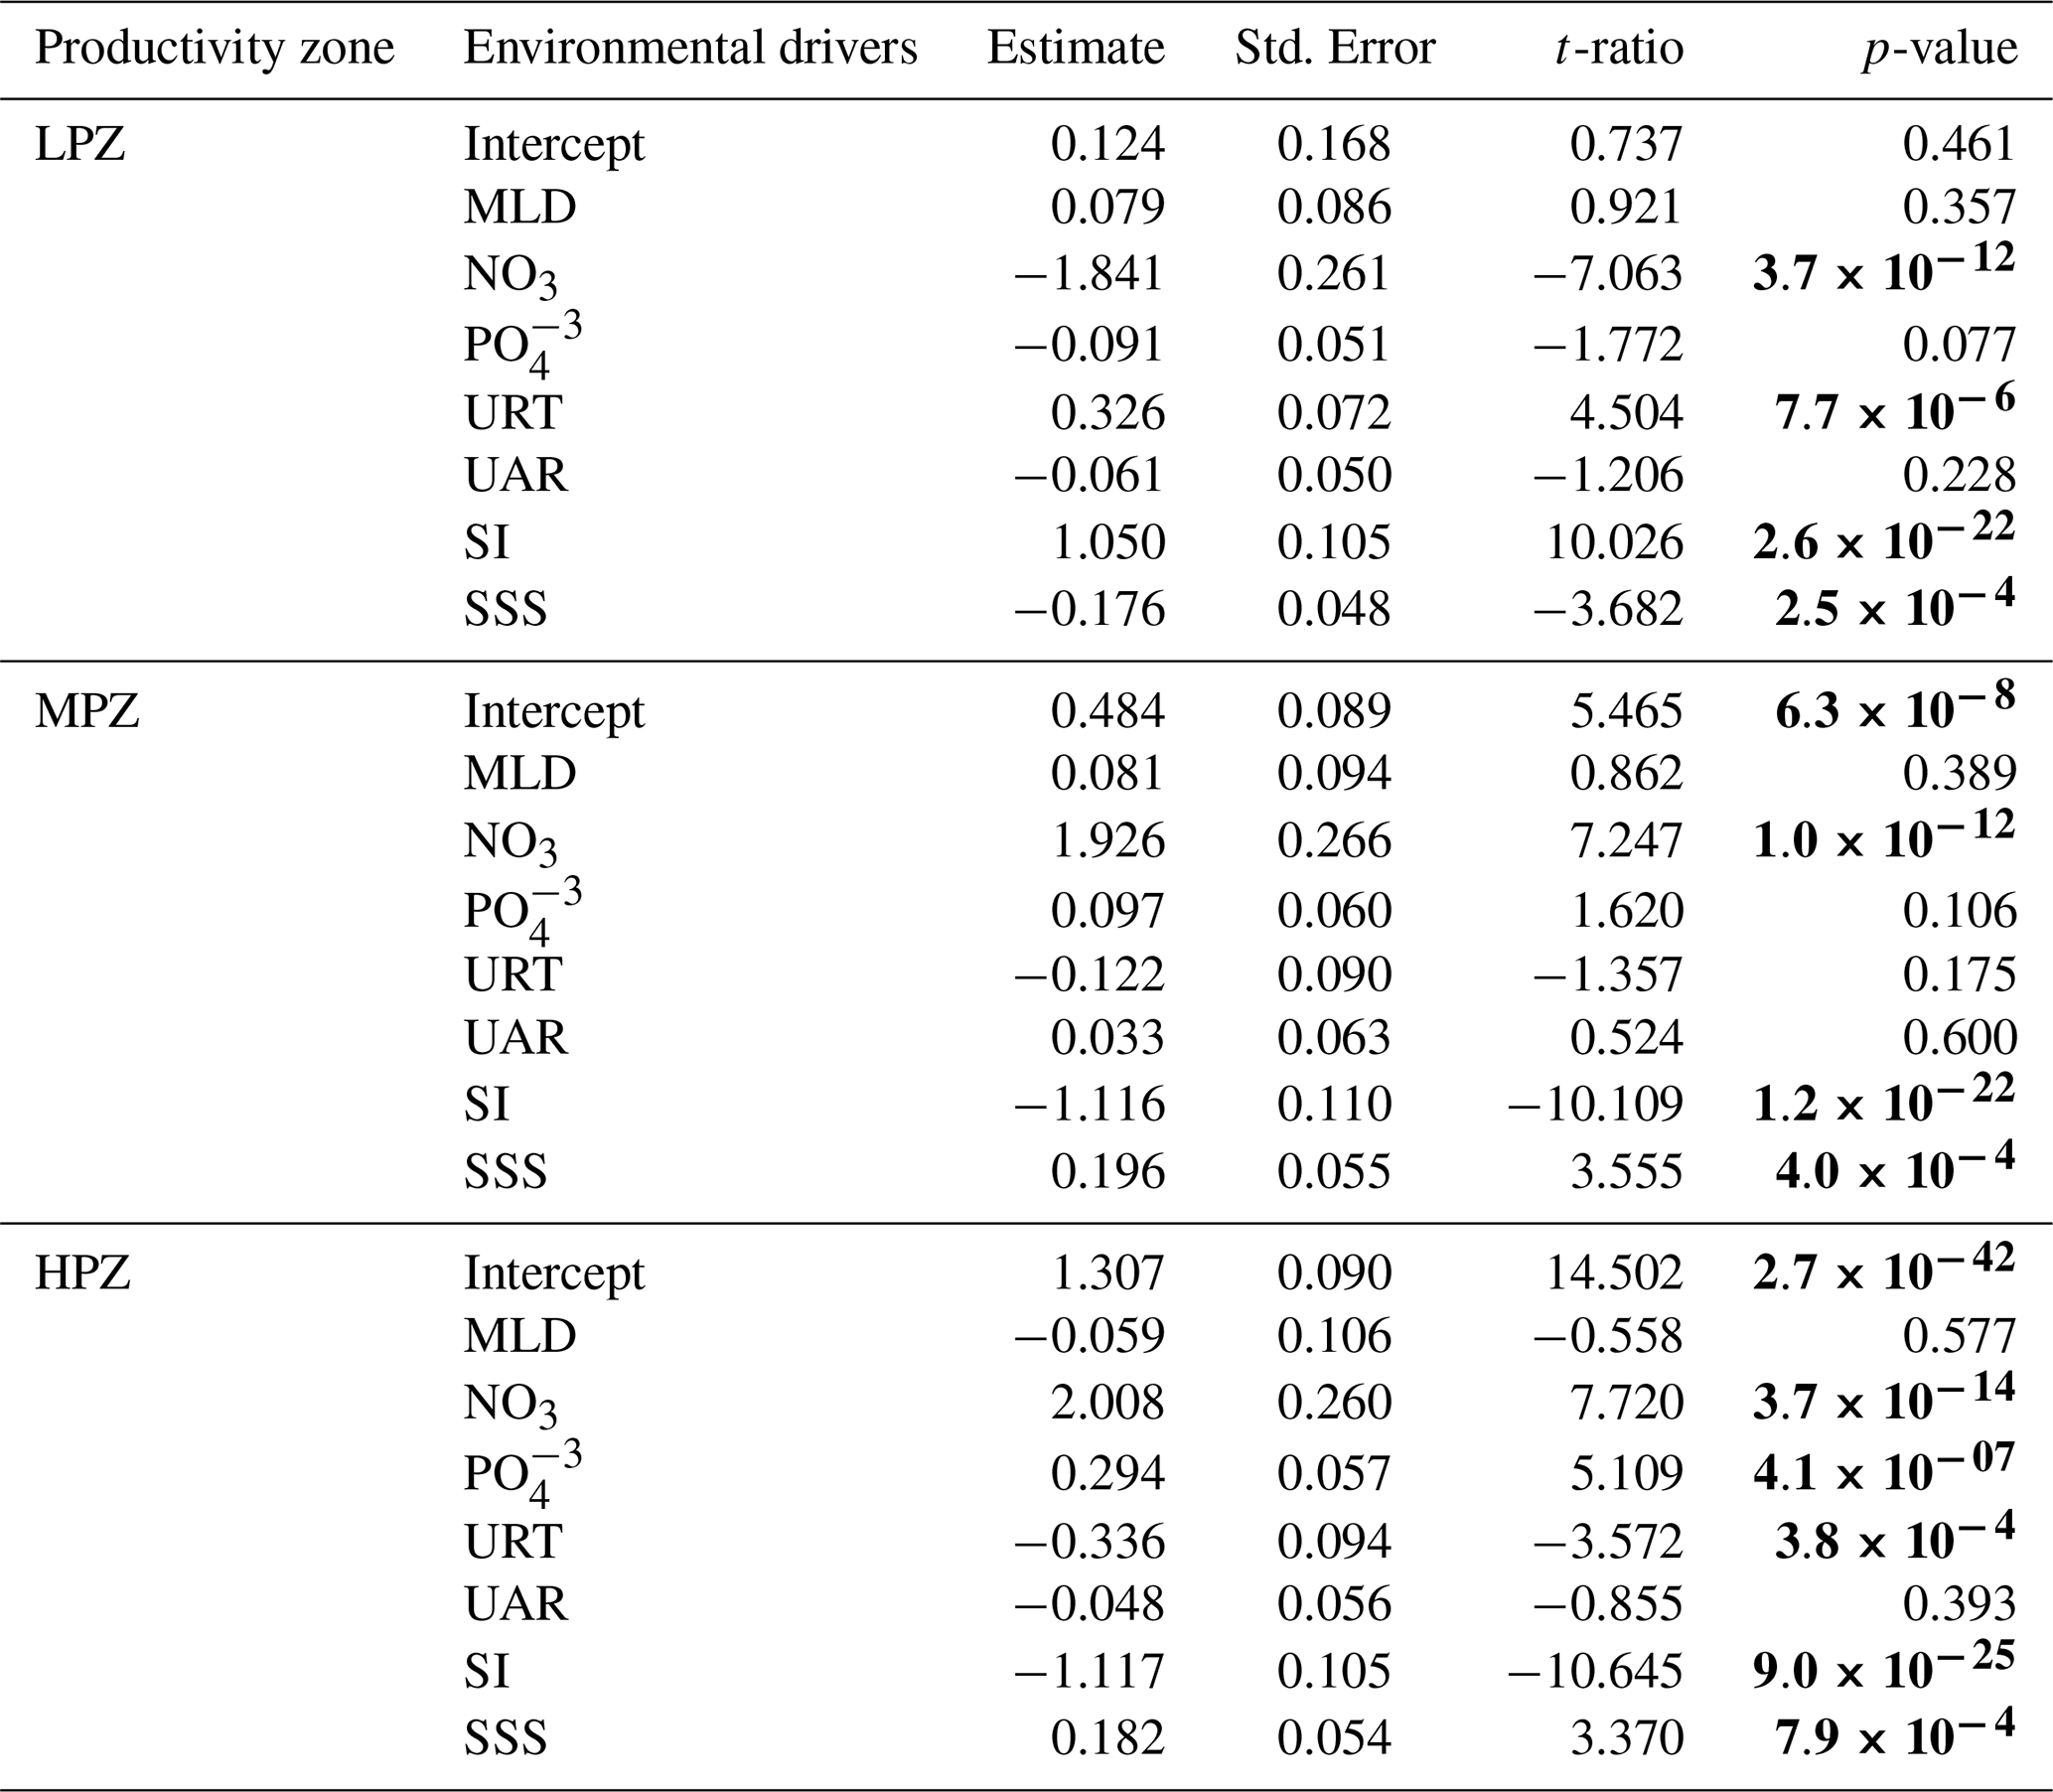
Table 1GLMM results for main effects of biophysical variables on NPP by productivity zone classification (LPZ, MPZ, and HPZ). Coefficients p < 0.05 are shown in bold. Abbreviations: LPZ = low-productivity zone; MPZ = mid-productivity zone; HPZ = high-productivity zone; MLD = mixed layer depth; NO3 = nitrate concentration; = phosphate concentration; UAR = along-gulf (u) sea current component; and URT = along-gulf (u) wind component; SI = stratification index, and SSS = sea surface salinity.
3.5 Responses of biophysical drivers (GLMM analysis)
Correlation analysis indicated strong collinearity between and SiO2 (r = 0.88; p < 0.05). was retained in the model given its broader relevance to primary productivity, whereas SiO2 primarily constrains siliceous phytoplankton, like diatoms. Best-fitting Generalised Linear Mixed Models (GLMMs) for each NPP class identified the significant environmental drivers (Table 1). The model provided a good fit to the data (AIC = 1057.4, BIC = 1178.9, log-likelihood = −502.69). Month was included as a random intercept to account for temporal dependence among observations, yielding an estimated random-effect standard deviation of 0.504.
The stratification index (SI), sea surface salinity (SSS), and nitrate (NO3) were significant predictors of NPP across the three productivity zones, although their effects differed in both magnitude and direction (Table 1). In the LPZ, SI was positively associated with NPP (β = 1.050, p < 0.001), whereas salinity (β = −0.176, p < 0.001) and nitrate (β = −1.841, p < 0.001) showed significant negative relationships. In contrast, both the MPZ and HPZ exhibited the opposite pattern. SI was negatively associated with NPP (MPZ: β = −1.116; HPZ: β = −1.117; p < 0.001), whereas salinity (MPZ: β = 0.196; HPZ: β = 0.182; p < 0.001) and nitrate (MPZ: β = 1.926; HPZ: β = 2.008; p < 0.001) were positively associated with productivity. The effect of URT also varied among productivity zones. URT was positively associated with NPP in the LPZ (β = 0.326, p < 0.001), whereas a significant negative relationship was observed in the HPZ (β = −0.336, p < 0.001). In contrast, URT was not a significant predictor in the MPZ. Phosphate () was significant only in the HPZ, where it exhibited a positive association with NPP (β = 0.294, p < 0.001). These results underscore strong regional differences in environmental controls on NPP across the Gulf of California. The complete anomaly time series for all variables (2003–2024) is provided in the Supplement (Figs. S4–S9, and Table S1).
Monitoring NPP in the Gulf of California is essential for assessing the availability of phytoplankton production to upper trophic levels and for evaluating the ecological and socioeconomic impacts of climate variability and anthropogenic pressures, and their ecological and socioeconomic consequences. NPP underpins fisheries, mediates carbon cycling, and contributes to ecosystem resilience, making it a key indicator of ocean health. Despite its ecological importance, long-term NPP records, both in situ and satellite-derived, remain scarce, constraining assessments of variability from seasonal to interannual scales.
The Gulf of California's spatial organisation has been analysed through various regionalization schemes, evolving from early classifications using biological indicators and physical properties to more complex schemes leveraging satellite observations. Initial frameworks identified regions based on phytoplankton community structure (Round, 1967; Zeitzschel, 1969), thermohaline structures (Roden and Emilsson, 1979) and bathymetry (Merrifield and Winant, 1989), while later methods introduced detailed classifications based on photosynthetic pigments (Santamaría-del-Ángel et al., 1994) and multivariate variables and machine-learning techniques (Santamaría-del-Ángel et al., 1994; Kahru et al., 2004; Petatán-Ramírez, 2015; Heras-Sánchez et al., 2019; Marín-Enríquez et al., 2024). Recent approaches exhibit increased complexity, ranging from simplified divisions to schemes with up to 22 regions. Nonetheless, effective regionalisation should prioritize parsimony and mechanistic understanding to maintain interpretability and enhance insights into productivity controls.
We utilised the K-means algorithm with k-means initialisation for its probabilistic centroid selection, enhancing accuracy and convergence in classifying meteorological, hydrographic (Kapoor and Singhal, 2017; Zhang et al., 2025; Zhang and Qian, 2025) and primary productivity patterns in the Gulf of California. We established three NPP categories: HPZ (> 1700 ), MPZ (900–1700 ), and LPZ (< 900 ). Although the HPZ covers∼ 30 % and contribute ∼ 61.4 % of total NPP, LPZ covers ∼ 36 % and accounts for only ∼ 16.9 %. These findings align with previous studies indicating a latitudinal gradient in productivity linked to factors such as upwelling and tidal currents, especially in areas with strong mixing along the eastern coast and Midriff Archipelago (Valdez-Holguín and Lara-Lara, 1987; Gaxiola-Castro et al., 1995).
HPZ regions are found along the eastern coast, the Midriff Archipelago, and the upper gulf, characterised by strong mixing and upwelling (Mercado-Santana et al., 2017), particularly during winter when north-westerly winds influence the coasts of Sonora, Sinaloa, and Nayarit (Santamaría-del-Ángel et al., 1994; Mercado-Santana et al., 2017). MPZ contributes ∼ 21 % of total NPP with moderate conditions (SST ∼ 25 °C, salinity ∼ 35 ups, and a mixed layer depth ∼ 24 m), influenced by various water types that enhance productivity through complex interactions with mesoscale processes (Lavín and Marinone, 2003; Lavín et al., 2013). In contrast, LPZ is the most oligotrophic area of the southern gulf, with historically low NPP, largely due to eastern Pacific influences and warm, low-salinity waters that increase stratification and limit nutrient availability, further complicated by thermohaline structures and mesoscale dynamics (Mercado-Santana et al., 2017; Marín-Enríquez et al., 2024; Trasviña-Castro et al., 2024).
The GLMM analysis revealed that the environmental controls on NPP vary markedly among productivity regimes, highlighting the spatial heterogeneity of the mechanisms regulating phytoplankton NPP across the Gulf of California. Despite these regional differences, NO3 availability and water-column stratification (SI) consistently emerged as the dominant predictors of NPP. The HPZ and MPZ exhibited the strongest dependence on nutrient availability, with NO3 representing the most influential positive predictor in both spatio-temporal variable zones, whereas contributed significantly only within the HPZ. In contrast, increasing stratification (SI) exerted a strong negative effect in both NPP zones, indicating that enhanced water-column stability limits the upward transport of nutrients into the euphotic layer. These results are consistent with the hydrographic dynamics of the upper gulf, the Midriff islands region, and eastern continental coast, where seasonal cooling, wind-driven mixing, and tidal processes enhance the upward transport of nutrients and sustain high rates of primary production (Santamaría-del-Ángel et al., 1994; Mercado-Santana et al., 2017; Marín-Enríquez et al., 2024). The MPZ appears to represent a transitional environment where biological production is primarily regulated by nutrient supply, and where stronger stratification restricts the vertical nutrient transport into the euphotic zone (Marín-Enríquez et al., 2024). Although nitrogen is widely recognised as the principal limiting nutrient in the Gulf of California (Álvarez-Borrego, 2012), our results indicate that availability also significantly affects NPP within the HPZ. This pattern is consistent with observations from the Guaymas Basin, where intense summer stratification restricts nutrient fluxes, promoting nitrogen limitation and favouring picophytoplankton-dominated communities (Millán-Núñez et al., 2023; Martínez-López et al., 2023). In contrast, the LPZ, influenced by oligotrophic, highly stratified waters entering from the Pacific Ocean, remains persistently low in productivity and is typically dominated by picophytoplankton. Consequently, the LPZ maintains relatively low but persistent productivity, whereas the MPZ exhibits greater seasonal variability associated with winter mixing and episodic nutrient enrichment.
At the seasonal scale, NPP peaks in the cold season (December–May), with maxima in February-March (Fig. S2). This increase is driven by prevailing north-westerly winds and cooling that enhance upwelling along the eastern gulf coast, enriching the euphotic zone and stimulating phytoplankton growth (Santamaría-del-Ángel et al., 1994; Escalante et al., 2013). During this period, HPZ and MPZ together typically cover ∼ 77 % of the gulf. Hakspiel-Segura et al. (2022) reported a negative correlation of SST and meridional wind stress with surface Chl a concentrations in the central gulf, reinforcing the role of wind-driven mixing.
Conversely, during the warm season (June–November), oligotrophic conditions dominate: NPP < 900 covers ∼ 68 % of the basin due to weaker southeasterly winds, the intrusion of warm tropical waters, and strong stratification that limits nutrient supply (Figs. S3, S4, S8, and S9) (Lavín and Marinone, 2003; Escalante et al., 2013; Mercado-Santana et al., 2017; Trasviña-Castro et al., 2024).
The 2003–2024 NPP time series exhibited significant interannual variability. Spearman's rank correlation analyses indicated that neither the PDO nor the NPGO was significantly associated with the spatial coverage of any productivity zone (Table S1). In contrast, MEI.v2 showed a weak but statistically significant negative correlation with the extent of the HPZ (rs[264] = −0.136, pCorr = 0.027), suggesting that ENSO-related variability exerts a measurable, although limited, influence on regional productivity patterns. Consistent with this relationship, La Niña conditions were generally associated with lower SST, intensified north-westerly winds, a deeper mixed layer, and enhanced nutrient availability (NO3, and SiO2) within the euphotic zone, conditions that favour elevated NPP. During the La Niña events of 2008, 2011, 2012, and 2021, the HPZ contributed more than 70 % of the total gulf-wide NPP while occupying only 35 %–44 % of the gulf area. This response was most pronounced during the cold season, when the HPZ and MPZ together occupied approximately 95 % of the Gulf of California, confining the LPZ primarily to the southern entrance of the basin (Fig. S2).
Stratification index (SI) analysis indicated varying productivity regimes (Fig. S9): HPZ had low SI (0–0.5 kg m−3) due to mixing processes (upwelling, tidal forcing, and north-westerly winds), while LPZ exhibited high SI (up to ∼ 2.0 kg m−3), indicating strongly stratified waters. MPZ showed an intermediate SI (0.5–1.1 kg m−3). Notably, from mid–2013, warming trends led to increased stratification (Figs. S5 and S9), reduced nutrient concentrations (NO3, ), and negative anomalies in NPP (Fig. S8). This pattern mirrors global trends of warming-driven stratification documented in the North Atlantic, North Pacific, and elsewhere (Xie et al., 2019; Fischer et al., 2020; Honda, 2020), with cascading effects on hydrography, primary productivity, phytoplankton functional composition, and coastal carbon fluxes (Xie et al., 2019; Fischer et al., 2020; Honda, 2020; Hakspiel-Segura et al., 2022; Song et al., 2022)
The 2014–2016 period marked a significant decline in NPP in the Gulf of California, characterised by severe negative anomalies. This period was associated with strong atmospheric forcing related to ENSO (MEI.v2) and coincided with a positive phase of the PDO, a transition toward a negative NPGO, and widespread marine heatwaves. Together, these large-scale climate conditions have been previously linked to changes in the physical and biogeochemical structure of the Gulf of California (Hakspiel-Segura et al., 2022). The persistent increase in SST during this period diminished cold season HPZ coverage to below 5 % and expanded the LPZ to approximately 50 % of the gulf. SST anomalies exceeding +2 °C led to intensified thermal stratification and limited nutrient transport into the euphotic zone, conditions that are consistent with reduced productivity in the HPZ and MPZ, which depend on vertical mixing and coastal upwelling for nutrient supply (Di Lorenzo and Mantua, 2016; Hakspiel-Segura et al., 2022). Stratification increased significantly, reaching oligotrophic conditions, and caused diminished nutrient flux, correlating with declines in PO4 and a reduction in productive habitats.
A key mechanism affecting the marine ecosystem between 2014 and 2016 was the weakening of north-westerly winds (∼ 8 m s−1 versus climatological mean > 20 m s−1), which reduced coastal upwelling efficiency. This led to a shift in seasonal productivity maximum and a decline in HPZ coverage. Concurrently, Tropical Surface Water intrusion reinforced stratification and limited mesoscale activity, particularly in the southern gulf and at the mouth (Di Lorenzo et al., 2008, 2013; Di Lorenzo and Mantua, 2016), resulting in the lowest NPP recorded, with both HPZ and MPZ declining by about 7 %, and areal coverages below historical averages. The HPZ remained only in the upper gulf, while the MPZ shifted north, and the LPZ expanded to ∼ 26–27° N (Fig. S3). Additionally, nutrient records indicated a significant decline in phosphate concentrations, suggesting a N-P co-limitation and highlighting phosphorus's critical role during extreme warm events (Browning and Moore, 2023).
Long-term trends derived from this study indicate declining NPP of 50–100 in the upper gulf, in La Paz Bay, and off the coast of Nayarit (Fig. S10), while values at the mouth and near ∼ 28° N remained relatively stable. These patterns are consistent with global trends reported by Maishal (2024a, b), who documented ∼ 25 decreases in the Pacific associated with warming of 0.1–0.2 °C decade−1, rates slightly lower than those reported for the Gulf of California (0.38 and 0.57 °C decade−1; Hakspiel-Segura et al., 2022; Sánchez-Cabeza et al., 2022). Maishal (2024a) also noted concurrent decreases in density, salinity, wind stress, MLD, and nutrients (NO3, ) during the past two decades, in agreement with our findings. Despite this, NPP rebounded strongly after the prolonged low-productivity phase of 2013–2019: 2020–2024 showed recovery, and although 2023, the warmest oceanic year on record (Cheng et al., 2024), did not yield the lowest NPP (that occurred in 2016, 85 Tg C yr−1), 2024 ranked fourth (152 Tg C yr−1), suggesting resilience potentially linked to the negative PDO that began in late 2019.
Globally, NPP and Chl a with ocean warming are well documented, along with strong coupling between NPP and climate variability (Behrenfeld et al., 2006; Xie et al., 2019; Fischer et al., 2020; Honda, 2020). Positive phases of climate indices such as MEI.v2 and PDO exert negative feedback on NPP via warm-water intrusion, enhanced stratification, and oligotrophication that alter pressure centres and wind regimes, reducing upwelling and nutrient supply.
This study advances understanding of regional and phenological mechanisms affecting NPP in the Gulf of California, primarily mediated by SST and its associated processes. The integration of the long-term environmental dataset demonstrated the utility of satellite-based and modelled observations for tracking NPP variability. Our parsimonious three-zone classification (LPZ, MPZ, and HPZ) captures spatial and temporal heterogeneity efficiently. Further research should elucidate the drivers of the LPZ expansion observed over the past decade and its implications for ecosystem structure and fisheries in the Gulf of California.
The average total NPP in the Gulf of California during 2003–2024 was 124 Tg C yr−1. Classification of the Gulf of California into three NPP categories with the k-means algorithm provided an effective, parsimonious framework for explaining spatial and temporal variability. HPZ conditions predominated along the continental coast and in the Midriff Archipelago, contributing 61.4 % of total NPP while covering approximately 30 % of the Gulf area. In contrast, LPZ conditions dominated the oceanic region and the entrance to the Gulf, covering approximately 36 % of the area and contributing 16.9 % of total NPP.
The decline in NPP in the Gulf of California during 2014–2016 resulted from the non-linear interaction El Niño-related surface warming, weakened wind forcing, tropical-water intrusion, enhanced thermal stratification, reduced nutrient availability, and concurrent marine heatwaves. This coupling explains both the magnitude of the productivity decline and the unprecedented expansion of oligotrophic conditions observed during these years. Seasonal variability was also pronounced: the cold season, from December to May, accounted for 68 % of annual NPP, whereas the warm season, from June to November, contributed 32 %.
The GLMM results indicate that NO3and water-column stratification (SI) were the dominant predictors of NPP overall. In the HPZ, NPP was additionally modulated by the along-gulf wind, the salinity, and the concentrations. Warmer years were associated with reduced coverage of productive zones, including mesotrophic (MPZ) and eutrophic (HPZ), and with the expansion of oligotrophic LPZ areas. If regional warming and stratification trends persist, oligotrophic conditions and low productivity are likely to intensify, potentially extending the influence of LPZ further into the Gulf of California. These changes may have important ecological and socioeconomic implications, underscoring the need for continued monitoring and research to anticipate, understand, and mitigate the impacts of climate variability on marine phytoplankton net primary productivity.
The datasets supporting the findings of this study are openly available in Zenodo at https://doi.org/10.5281/zenodo.18776942 (González-Rodríguez et al., 2026).
The supplement related to this article is available online at https://doi.org/10.5194/os-22-3385-2026-supplement.
Conceptualisation: EGR, RCD; Data curation: EGR; Formal analysis: EGR, RCD, JDAA; Investigation: EGR, RCD; Methodology: EGR, JDAA; Project administration: EGR, RCD, JGG; Supervision: EGR, RCD, JDAA, JGG; Validation: RCD; Visualisation: EGR, JDAA; Writing – original draft: EGR, RCD, JDAA; Writing – review and editing: EGR, RCD, JDAA, JGG.
The contact author has declared that none of the authors has any competing interests.
Publisher's note: Copernicus Publications remains neutral with regard to jurisdictional claims made in the text, published maps, institutional affiliations, or any other geographical representation in this paper. The authors bear the ultimate responsibility for providing appropriate place names. Views expressed in the text are those of the authors and do not necessarily reflect the views of the publisher.
We thank National Space Administration (NASA) Ocean Biology Processing Group (OBPG), Copernicus Marine Environment Monitoring Service (https://marine.copernicus.eu/node/169, last access: 1 October 2026), and National Oceanic and Atmospheric Administration (NOAA) (https://psl.noaa.gov/enso/mei/, last access: 1 October 2026) for satellite data set availability. We also thank MacTavish Scientific Editing for English translation services. Eduardo González-Rodríguez also thanks the SERVANT laboratory from CICESE UALP for their support.
This research was supported by an internal project from CICESE awarded to Eduardo González-Rodríguez [project number 691110], Instituto Politécnico Nacional (IPN-SIP grant Multidisciplinary projects 2020–2022, 2023–2025), and the National Council of Science and Technology (CONACYT) currently known as Secretaria de Ciencia, Humanidades, Tecnología e Innovación (SECIHTI) [CF-6364]. Juan David Acevedo-Acosta deeply thanks SECIHTI for the postdoctoral grant given in 2025–2026, Rafael Cervantes-Duarte and Jaime Gómez-Gutiérrez for EDI-IPN and COFAA-IPN grants and all authors thank SECIHTI for their SNII fellowship.
This paper was edited by Angelika Renner and reviewed by two anonymous referees.
Álvarez-Borrego, S.: Flujos de carbono en los Golfos de California y México, in: Carbono en Ecosistemas Acuáticos, edited by: Hernández-de-la-Torre, B. and Gaxiola-Castro, G., Centro de Investigación Científica y de Educación Superior de Ensenada, CICESE: Ensenada, Baja California, México, 337–353, ISBN: 978-968-817-855-3, 2007.
Álvarez-Borrego, S.: New phytoplankton production as a tool to estimate the vertical component of water exchange between the Gulf of California and the Pacific, Cienc. Mar., 38, 89–99, https://doi.org/10.7773/cm.v38i1a.1885, 2012.
Álvarez-Borrego, S. and Lara-Lara, J. R.: The physical environment and primary productivity of the Gulf of California, in: The Gulf of California and peninsular province of the Californias, edited by: Dauphin, J. P. and Simoneit, B. R., Bull. Am. Asso. Petrol. Geol., 555–567, https://doi.org/10.1306/M47542C26, 1991.
Badan-Dangon, A., Koblisnksy, C. J., and Baumgartner, T.: Spring and summer in the Gulf of California: Observations of surface thermal patterns, Oceanol. Acta, 8, 13–22, 1985.
Balch, W. E., Evans, R., Brown, J., Feldman, G., McClain, C., and Esaias, W.: The remote sensing of ocean primary productivity: Use of a new data compilation to test satellite algorithms, J. Geophys. Res.-Oceans, 97, 2279–2293, https://doi.org/10.1029/91JC02843, 1992.
Behrenfeld, M. and Falkowski, P.: Photosynthetic rates derived from satellite-based chlorophyll concentration, Limnol. Oceanogr., 42, 1–20, https://doi.org/10.4319/lo.1997.42.1.0001, 1997.
Behrenfeld, M., O'Malley, R. T., Siegel, D. A., McClain, C. R., Sarmiento, J. L., Feldman, G. C., and Boss, E. S.: Climate-driven trends in contemporary ocean productivity, Nature, 444, 752–755, https://doi.org/10.1038/nature05317, 2006.
Browning, T. J. and Moore, C. M.: Global analysis of ocean phytoplankton nutrient limitation reveals high prevalence of co-limitation, Nat. Commun., 14, 5014, https://doi.org/10.1038/s41467-023-40774-0, 2023.
Bustos-Serrano, H. and Castro-Valdéz, R.: Flux of nutrients in the Gulf of California: Geostrophic Approach, Mar. Chem., 99, 210–219, https://doi.org/10.1016/j.marchem.2005.09.012, 2006.
Cavole, L. M., Demko, A. M., Diner, R. E., Giddings, A., Koester, I., Pagniello, C. M. L. S., Paulsen, M. L., Ramírez-Valdez, A., Schwenck, S. M., Yen, N. K., Zill, M. E., and Franks P. J. S.: Biological impacts of the 2013–2015 warm-water anomaly in the Northeast Pacific: winners, losers, and the future, Oceanography, 29, 273–285, https://doi.org/10.5670/oceanog.2016.32, 2016.
Cepeda-Morales, J., Gaxiola-Castro, G., Beier, E., and Godínez, V. M.: The mechanisms involved in defining the northern boundary of the shallow oxygen minimum zone in the eastern tropical Pacific Ocean off Mexico, Deep-Sea Res. Pt. I, 76, 1–12, https://doi.org/10.1016/j.dsr.2013.02.004, 2013.
Cheng, L., Abraham, J., Trenberth, K. E., Boyer, T., Mann, M. E., Zhu, J., Wang, F., Yu, F., Locarnini, R., Fasullo, J., Zheng, F., Li, Y., Zhang, B., Wan, L., Chen, X., Wang, D., Feng, L., Song, X., Liu, Y., Reseghetti, F., Simoncelli, S., Gouretski, V., Chen, G., Mishonov, A., Reagan, J., Von Schuckmann, K., Pan, Y., Tan, Z., Zhu, Y., Wei, W., Li, G., Ren, Q., Cao, L., and Lu, Y.: New record ocean temperatures and related climate indicators in 2023, Adv. Atmos. Sci., 41, 1068–1082, https://doi.org/10.1007/s00376-024-3378-5, 2024.
Corrales M. L., and Cepeda-Cuervo, E.: A Bayesian Approach to Mixed Gamma Regression Models, Rev. Colomb. Estad., 42, 81–99, https://doi.org/10.15446/rce.v42n1.69334, 2019.
Di Lorenzo, E. and Mantua, N.: Multi-year persistence of the 2014/15 North Pacific marine heatwave, Nat. Clim. Change, 6, 1042–1047, https://doi.org/10.1038/nclimate3082, 2016.
Di Lorenzo, E., Schneider, N., Cobb, K. M., Franks, P. J., Chhak, K., Miller, A. J., McWilliams, J., Bograd, S., Arango, H., Curchitser, E., Powell, T., and Rivière, P.: North Pacific Gyre Oscillation links ocean climate and ecosystem change, Geophys. Res. Lett., 35 L08607, https://doi.org/10.1029/2007GL032838, 2008.
Di Lorenzo, E., Combes, V., Keister, J., Strub, P. T., Thomas, A., Franks, P., and Parada, C.: Synthesis of Pacific Ocean climate and ecosystem dynamics, Oceanography, 26 68–81, https://doi.org/10.5670/oceanog.2013.76, 2013.
Escalante, F., Valdez-Holguín, J. E., Álvarez-Borrego, S., and Lara-Lara, J. R.: Temporal and spatial variation of sea surface temperature, chlorophyll a, and primary productivity in the Gulf of California, Cienc. Mar., 39 203–215, https://doi.org/10.7773/cm.v39i2.2233, 2013.
Fiedler, P. C. and Talley, L. D.: Hydrography of the eastern tropical Pacific: A review, Prog. Oceanogr., 69 143–180, https://doi.org/10.1016/j.pocean.2006.03.008, 2006.
Fischer, A. D., Hayashi, K., McGaraghan, A., and Kudela, R. M.: Return of the “age of dinoflagellates” in Monterey Bay: Drivers of dinoflagellate dominance examined using automated imaging flow cytometry and long-term time series analysis, Limnol. Oceanogr., 65 2125–2141, https://doi.org/10.1002/lno.11443, 2020.
Frölicher, T. L., Fischer, E. M., and Gruber, N.: Marine heatwaves under global warming, Nature, 560, 360–364, https://doi.org/10.1038/s41586-018-0383-9, 2018.
García-Fernández, F., Gómez-Gutiérrez, J., De Silva-Dávila, R., Hakspiel-Segura, C., Ambriz-Arreola, I., Martínez-López, A., and Robinson, C. J.: Interannual response of euphausiid community abundance during the anomalous warming period (2014–2016) in the Gulf of California, Prog. Oceanogr., 212, 102994, https://doi.org/10.1016/j.pocean.2023.102994, 2023.
Gaxiola-Castro, G., Garcia-Cordova, J., Valdez-Holguin, J. E., and Botello-Ruvalcaba, M.: Spatial distribution of chlorophyll α and primary productivity in relation to winter physical structure in the Gulf of California, Cont. Shelf Res., 15 1043–1059, https://doi.org/10.1016/0278-4343(94)00071-T, 1995.
González-Rodríguez, E., Acevedo-Acosta, J. D., Cervantes-Duarte, R., and Gómez-Gutiérrez, J.: Processed datasets for: “Net primary productivity in the Gulf of California: spatiotemporal patterns and drivers in a warming climate (2003–2024)”, Zenodo [data set], https://doi.org/10.5281/zenodo.18776942, 2026.
Greene, C., Thirumalai, K., Kearney, K., Delgado, J. M., Schwanghart, W., Wolfenbarger, N., Thyng, K., Gwyther, D., Gardner, A., and Blankenship, D.: The Climate Data Toolbox for MATLAB, Geochem. Geophy. Geosys., 20, 3774–3781, https://doi.org/10.1029/2019GC008392, 2019.
Hakspiel-Segura, C., Martínez-López, A., Delgado-Contreras, J., Robinson, C. J., and Gómez-Gutiérrez, J.: Temporal variability of satellite chlorophyll a as an ecological resilience indicator in the central region of the Gulf of California, Prog. Oceanogr., 205, 102825, https://doi.org/10.1016/j.pocean.2022.102825, 2022.
Heras-Sánchez, M. C., Valdez-Holguín, J. E., Garatuza-Payan, J., Cisneros-Mata, M., Díaz-Tenorio, L. M., Robles-Morua, A., and Hazas-Izquierdo, R. G.: Regiones del golfo de California determinadas por la distribución de la temperatura superficial del mar y la concentración de clorofila-a, Biotecnia, 23 13–21, https://doi.org/10.18633/biotecnia.v21i1.808, 2019.
Hidalgo-González R. M. and Álvarez-Borrego S.: Total and new production in the Gulf of California estimated from ocean color data from the satellite sensor SeaWiFS, Deep-Sea Res. Pt. II, 51, 739–752, https://doi.org/10.1016/j.dsr2.2004.05.006, 2004.
Hobday, A. J., Alexander, L. V., Perkins, S. E., Smale, D. A., Straub, S. C., Oliver, E. C. J., Benthuysen, J. A., Burrows, M. T., Donat, M. G., Feng, M., Holbrook, N. J., Moore, P. J., Scannell, H. A., Gupta, A. S., and Wernberg, T.: A hierarchical approach to defining marine heatwaves, Prog. Oceanogr., 141, 227–238, https://doi.org/10.1016/j.pocean.2015.12.014, 2016.
Honda, M. C.: Effective vertical transport of particulate organic carbon in the Western North Pacific Subarctic Region, Front. Earth Sci., 8, 366, https://doi.org/10.3389/feart.2020.00366, 2020.
IOC, SCOR and IAPSO: The international thermodynamic equation of seawater – 2010: Calculation and use of thermodynamic properties, Intergovernmental Oceanographic Commission, Manuals and Guides No. 56, UNESCO, Paris, France, 196+pp., https://www.teos-10.org/pubs/TEOS-10_Manual.pdf (last access: 24 July 2026), 2010.
Jacox, M. G., Hazen, E. L., Zaba, K. D., Rudnick, D. L., Edwards, C. A., Moore, A. M., and Bograd, S. J.: Impacts of the 2015–2016 El Niño on the California Current system: Early assessment and comparison to past events, Geophys. Res. Lett., 43 7072–7080, https://doi.org/10.1002/2016GL069716, 2016.
Jiménez-Quiroz, M. C., Cervantes-Duarte, R., Funes-Rodríguez, R., Barón-Campis, S. A, García-Romero, F. J., Hernández-Trujillo, S., Hernández-Becerril, D. U., González-Armas, R., Martell-Dubois, R., Cerdeira-Estrada, S., Fernández-Méndez, J. I., González-Ania, L. V., Vásquez-Ortiz, M., and Barrón-Barraza, F. J.: Impact of “The Blob” and “El Niño” warming phenomena in the SW Baja California peninsula: Plankton and environmental variability of Bahia Magdalena, Front. Mar. Sci., 6, 25, https://doi.org/10.3389/fmars.2019.00025, 2019.
Joh, Y. and Di Lorenzo, E.: Evidence for stronger and more prolonged Northeast Pacific marine heatwaves, Geophys. Res. Lett., 44 11663–11671, https://doi.org/10.1002/2017GL075930, 2017.
Johnson, R. A. and Wichern, D. W.: Applied Multivariate Statistical Analysis, Biometrics, 54 1203, https://doi.org/10.2307/2533879, 2018.
Jones, T., Parrish, J. K., Peterson, W. T., Bjorkstedt, E. P., Bond, N. A., Ballance, L. T., Bowes, V., Hipfner, J. M., Burgess, H. K., Dolliver, J. E., Lindquist, K., Lindsey, J., Nevins, H. M., Robertson, R. R., Roletto, J., Wilson, L., Joyce, T., and Harvey, J.: Massive mortality of a planktivorous seabird in response to a marine heatwave, Geophys. Res. Lett., 45, 3193–3202, https://doi.org/10.1002/2017GL076164, 2018.
Kahru, M., Marinone, S. G., Lluch-Cota, S. E., Parés-Sierra A., and Mitchell, G. B.: Ocean color variability in the Gulf of California: Scales from days to ENSO, Deep-Sea Res. Pt. II, 51, 139–146, https://doi.org/10.1016/j.dsr2.2003.04.001, 2004.
Kapoor, A. and Singhal, A. A.: Comparative Study of K-Means, K-Means and Fuzzy C-Means Clustering Algorithms, in: 3rd International Conference on Computational Intelligence & Communication Technology (CICT), Ghaziabad, India, 9–10 February 2017, 1–6, https://doi.org/10.1109/ciact.2017.7977272, 2017.
Kobayashi, S., Ota, Y., Harada, Y., Ebita, A., Moriya, M., Onoda, H., Onogi, K., Kamahori, H., Kobayashi, C., Endo, H., Miyaoka, K., and Takahashi, K.: The JRA-55 Reanalysis: general specifications and basic characteristics, J. Meteorol. Soc. Jpn., 93, 5–48, https://doi.org/10.2151/jmsj.2015-001, 2015.
Kushnir, Y.: Interdecadal variations in North Atlantic sea surface temperature and associated atmospheric conditions, J. Climate, 7 141–157, https://doi.org/10.1175/1520-0442(1994)007<0141:IVINAS>2.0.CO;2, 1994.
Lavín, M. F. and Marinone, S. G. L.: An overview of the physical oceanography of the Gulf of California, in: Nonlinear Processes in Geophysical Fluid Dynamics, edited by: Velasco-Fuentes, O. U., Sheinbaum, J., and Ochoa de la Torre, J. L., Kluwer Academic Publishers, 173–204, https://doi.org/10.1007/978-94-010-0074-1_11, 2003.
Lavín, M. F., Castro, R., Beier, E., and Godínez, V. M.: Mesoscale eddies in the southern Gulf of California during summer: Characteristics and interaction with the wind stress, J. Geophys. Res.-Oceans, 118 1367–1381, https://doi.org/10.1002/jgrc.20132, 2013.
Lluch-Cota, S. E.: Gulf of California, in: Marine Ecosystems of the North Pacific, edited by: Perry, R. I. and McKinnell, S. M., PICES Special Publication, Sidney, Canada, 193–199, ISBN 1-897176-00-7, 2004.
Lluch-Cota, S. E., Aragón-Noriega, E. A., Arreguín-Sánchez, F., Aurioles-Gamboa, D., Bautista-Romero, J., Brusca, R. C., Cervantes-Duarte, R., Cortés-Altamirano, R., Del-Monte-Luna, P., Esquivel-Herrera, A., Fernández, G., Hendrickx, M. E., Hernández-Vázquez, S., Herrera-Cervantes, H., Kahru, M., Lavín, M., Lluch-Belda, D., Lluch-Cota, D. B., López-Martínez, J., Marinone, S. G., Nevárez-Martínez, M. O., Ortega-García, S., Palacios-Castro, E., Parés-Sierra, A., Ponce-Díaz, G., Ramírez-Rodríguez, M., Salinas-Zavala, C. A., Schwartzlose, R. A., and Sierra-Beltrán, A. P.: The Gulf of California: Review of ecosystem status and sustainability challenges, Prog. Oceanogr., 73, 1–26, https://doi.org/10.1016/j.pocean.2007.01.013, 2007.
López-Martínez, J., Farach Espinoza, E. B., Herrera Cervantes, H., and García Morales, R.: Long-term variability in sea surface temperature and chlorophyll a concentration in the Gulf of California, Remote Sens., 15 4088, https://doi.org/10.3390/rs15164088, 2023.
Maishal, S.: Decadal changes in global oceanic primary productivity and its drivers, Ocean-Land-Atmos. Res., 3, 0066, https://doi.org/10.34133/olar.0066, 2024a.
Maishal, S.: Unravelling the declining Indian ocean primary productivity and key drivers, Discov. Ocean., 1, 17, https://doi.org/10.1007/s44289-024-00018-5, 2024b.
Marín-Enríquez, E., Cruz-Escalona, V. H., Enríquez-García, A. B., and Félix-Ortiz, J. A.: Physical geographic regions in the Gulf of California defined using unsupervised learning algorithms, Reg. Stud. Mar. Sci., 80, 103923, https://doi.org/10.1016/j.rsma.2024.103923, 2024.
Martínez-López, A., Hakspiel-Segura, C., Robinson, C. J., and Gómez-Gutiérrez, J.: Winter picoplankton composition, abundance, and vertical distribution in the Midriff islands and central regions of the Gulf of California, Reg. Stud. Mar. Sci., 63, 103000, https://doi.org/10.1016/j.rsma.2023.103000, 2023.
Mercado-Santana, J. A., Santamaría-del-Ángel, E., González-Silvera, A., Sánchez-Velasco, L., Gracia-Escobar, M. F., Millán-Núñez, R., and Torres-Navarrete, C.: Productivity in the gulf of California large marine ecosystem, Environ. Dev., 22, 18–29, https://doi.org/10.1016/j.envdev.2017.01.003, 2017.
Merrifield, M. A. and Winant, C. D.: Shelf circulation in the Gulf of California: A description of the variability, J. Geophys. Res.-Oceans, 94, 18133–18160, https://doi.org/10.1029/JC094iC12p18133, 1989.
Millán-Núñez, E., Delgadillo-Hinojosa, F., Hakspiel-Segura, C., Torres-Delgado, E. V., Félix-Bermúdez, A., Segovia-Zavala, J. A., and Muñoz-Barbosa, A.: Phytoplankton composition and biomass under oligotrophic conditions in the Guaymas Basin (Gulf of California), Cienc. Mar., 49, e3302, https://doi.org/10.7773/cm.y2023.3302, 2023.
Mills, K. E., Pershing, A. J., Brown, C. J., Chen, Y., Chiang, F. S., Holland, D. S., Lehuta, S., Nye, J., Sun, J., Thomas, A., and Wahle, R.: Fisheries management in a changing climate: Lessons from the 2012 ocean heat wave in the Northwest Atlantic, Oceanography, 26 191–195, https://doi.org/10.5670/oceanog.2013.27, 2013.
Miranda-Alvarez, C., González-Silvera, A., Santamaría-del-Angel, E., López-Calderón, J., Godínez, V. M., Sánchez-Velasco, L., and Hernández-Walls, R.: Phytoplankton pigments and community structure in the northeastern tropical Pacific using HPLC-CHEMTAX analysis, J. Oceanogr., 76, 91–108, https://doi.org/10.1007/s10872-019-00528-3, 2020.
Miyamoto, Y., Nakano, T., Yamada, K., Hatakeyama, K., and Hamaguchi, M.: Combined effects of drift macroalgal bloom and warming on occurrence and intensity of diel-cycling hypoxia in a eutrophic coastal lagoon, Estuaries Coasts, 42 494–503, https://doi.org/10.1007/s12237-018-0484-6, 2019.
Moore, D. and McCabe, G. (Eds.): Introduction to the Practice of Statistics, 3rd edn., W. H. Freeman,. 825 pp., https://doi.org/10.2307/3619120, 1999.
Morel, A. and Berthon, J. F.: Surface pigments, algal biomass profiles, and potential production of the euphotic layer: Relationships reinvestigated in view of remote-sensing applications, Limnol. Oceanogr., 34 1545–1562, https://doi.org/10.4319/lo.1989.34.8.1545, 1989.
Morel, A. and Maritorena, S.: Bio-optical properties of oceanic waters: A reappraisal. J. Geophysi. Res.: Oceans, 106 7163–7180, https://doi.org/10.1029/2000JC000319, 2001.
Oliver, E. C. J., Benthuysen, J. A., Bindoff, N. L., Hobday, A. J., Holbrook, N. J., Mundy, C. N., Perkins-Kirkpatrick, S. E.: The unprecedented 2015/16 Tasman Sea marine heatwave, Nat. Commun., 8, 16101, https://doi.org/10.1038/ncomms16101, 2017.
Oliver, E. C. J., Burrows, M. T., Donat, M. G., Sen-Gupta, A., Alexander, L. V., Perkins-Kirkpatrick, S. E., Benthuysen, J. A., Hobday, A. J., Holbrook, N. J., Moore, P. J., Thomsen, M. S., Wernberg, T., and Smale, D. A.: Projected marine heatwaves in the 21st Century and the potential for ecological impact, Front. Mar. Sci., 6, 734, https://doi.org/10.3389/fmars.2019.00734, 2019.
O'Reilly, J. and Sherman, K.: Primary productivity patterns and trends, in: Large Marine Ecosystems: Status and Trends, edited by: IOC-UNESCO and UNEP, United Nations Environment Programme, Nairobi, 91–99, 2016.
Petatán-Ramírez, D.: Propuesta de zonación del golfo de california con base en variables oceanográficas y distribución de macroinvertebrados, Masters degree thesis, UABCS, Mexico, 106 pp., 2015.
Pyper, B. J. and Peterman, R. M.: Comparison of methods to account for autocorrelation in correlation analyses of fish data, Can. J. Fish. Aquat. Sci., 55, 2127–2140, https://doi.org/10.1139/f98-104, 1998.
Ramos-Rodríguez, A., Lluch-Cota, D. B., Lluch-Cota, S. E., and Trasviña-Castro, A.: Sea surface temperature anomalies, seasonal cycle and trend regimes in the Eastern Pacific coast, Ocean Sci., 8, 81–90, https://doi.org/10.5194/os-8-81-2012, 2012.
Robles-Tamayo, C. M., García-Morales, R., Valdez-Holguín, J. E., Figueroa-Preciado, G., Herrera-Cervantes, H., López-Martínez, J., and Enríquez-Ocaña, L. F.: Chlorophyll a concentration distribution on the mainland coast of the Gulf of California, Mexico, Remote Sens., 12, 1335, https://doi.org/10.3390/rs12081335, 2020.
Roden, G. I. and Emilsson, I.: Physical oceanography of the Gulf of California, Dissertation, Mexico, 1979.
Round, F. E.: The phytoplankton of the Gulf of California Part 1. Its composition, distribution and contribution to the sediments, J. Exp. Mar. Biol. Ecol. 1, 76–97, 1967.
Sánchez-Cabeza, J. A., Herrera-Becerril, C. A., Carballo, J. L., Yáñez, B., Álvarez-Sánchez, L. F., Cardoso-Mohedano, J. G., and Ruiz-Fernández, A. C.: Rapid surface water warming and impact of the recent (2013–2016) temperature anomaly in shallow coastal waters at the eastern entrance of the Gulf of California, Prog. Oceanogr., 202, 102746, https://doi.org/10.1016/j.pocean.2022.102746, 2022.
Santamaría-del-Ángel, E., Álvarez-Borrego, S., and Muller-Karger, F. E.: Gulf of California biogeographic regions based on coastal zone color scanner imagery, J. Geophys. Res.-Oceans, 99, 7411–7421, https://doi.org/10.1029/93jc02154, 1994.
Somavilla, R., Gonzalez-Pola, C., and Fernandez-Diaz, J.: The warmer the ocean surface, the shallower the mixed layer. How much of this is true?, J. Geophys. Res.-Oceans, 122, 7698–7716, https://doi.org/10.1002/2017JC013125, 2017.
Song, Y., Guo, Y., Liu, H., Zhang, G., Zhang, X., Thangaraj, S., and Sun, J.: Water quality shifts the dominant phytoplankton group from diatoms to dinoflagellates in the coastal ecosystem of the Bohai Bay, Mar. Pollut. Bull., 183, 114078, https://doi.org/10.1016/j.marpolbul.2022.114078, 2022.
Trasviña-Castro, A., Torres-Hernández, M. Y., Valle-Rodríguez, J. B., and González-Rodríguez, E.: Interannual variability (2014–2016) of coastal mesoscale activity at the entrance of the Gulf of California as determined by remote sensing, Reg. Stud. Mar. Sci., 77, 103609, https://doi.org/10.1016/j.rsma.2024.103609, 2024.
Valdez-Holguín, J. E. and Lara-Lara, J. R.: Primary productivity in the Gulf of California: Effects of El Niño 1982–1983 event, Cienc. Mar., 13 34–50, https://doi.org/10.7773/cm.v13i2.533, 1987.
Wernberg, T., Bennett, S., Babcock, R. C., Bettignies, T., Cure, K., Depczynski, M., Dufois, F., Fromont, J., Fulton, C. J., Hovey, R. K., Harvey, E. S., Holmes, T. H., Kendrick, G. A., Radford, B., Santana-Garcon, J., Saunders, B. J., Smale, D. A., Thomsen, M. S., Tuckett, C. A., Tuya, F., Vanderklift, M. A., and Wilson, S.: Climate-driven regime shift of a temperate marine ecosystem, Science, 353, 169–172, https://doi.org/10.1126/science.aad8745, 2016.
Wolter, K. and Timlin, M. S.: El Niño/Southern Oscillation behavior since 1871 as diagnosed in an extended multivariate ENSO index (MEI.ext), Intl. J. Climatol., 31, 1074–1087, https://doi.org/10.1002/joc.2336, 2011.
Xie, F., Tao, Z., Zhou, X., Lv, T., and Wang, J.: Spatial and temporal variations of particulate organic carbon sinking flux in global ocean from 2003 to 2018, Remote Sens., 11 2941, https://doi.org/10.3390/rs11242941, 2019.
Zeitzschel, B.: Primary productivity in the Gulf of California, Mar. Biol., 3, 201–207, https://doi.org/10.1007/BF00360952, 1969.
Zhang, Q. and Qian, J.: Identification and temporal distribution of typical rainfall types based on K-means clustering and probability distribution analysis, Hydrology, 12 88, https://doi.org/10.3390/hydrology12040088, 2025.
Zhang, Z., Chen, X., Wang, C., Wang, R., Song, W., and Nie, F.: Structured multi-view k-means clustering, Pattern Recognit., 160, 111113, https://doi.org/10.1016/j.patcog.2024.111113, 2025.
.