
the Creative Commons Attribution 4.0 License.
the Creative Commons Attribution 4.0 License.
 | 28 Sep 2026
Intercomparison of three SWOT-derived Level-4 products: from mapping accuracy to multi-scale dynamical representation
Qifan Wu
Chaojie Zhou

Bijin Liu
Wei Wu
Jianlong Li
Jungang Yang
Oceanic submesoscale dynamics play a critical role in energy cascades and vertical tracer transport. The Surface Water and Ocean Topography (SWOT) mission, through its high-resolution wide-swath sea surface height (SSH) observations, provides an unprecedented capability for resolving these processes. While this enhanced spatial coverage represents a major advance over conventional nadir altimetry, it also introduces new challenges for constructing dynamically consistent gridded Level-4 products. To address these challenges, a range of data fusion and reconstruction approaches have been developed to incorporate SWOT observations into next-generation SSH mapping systems. This study presents a comparative evaluation of three SWOT-derived Level-4 products (MIOST, 4DvarQG, and 4DvarNET) over the North Atlantic (25–50° N, 80–10° W). The assessment combines Eulerian metrics of mapping accuracy, Lagrangian trajectory prediction skill based on surface drifter observations, and diagnostics of dynamical structures using Rossby number (Ro) and finite-size Lyapunov exponent (FSLE) fields, with SWOT Level-3 data as a reference. The results reveal a pronounced scale dependence in product performance. In mesoscale-dominated regimes such as the Gulf Stream, 4DvarQG achieves the highest velocity reconstruction accuracy and improves short-term (0–4 d) Lagrangian prediction skill, reflecting the benefits of quasi-geostrophic dynamical constraints. In contrast, 4DvarNET shows greater sensitivity to smaller-scale variability, characterized by sharper SSH gradients, elevated Ro, and more filamentary strain structures, indicating an enhanced representation of fine-scale features. However, the physical realism of these intensified small-scale signals requires further validation against higher-resolution or less-filtered observations. MIOST demonstrates stable and consistent performance across a wide range of spatial scales for global ocean mapping. These results highlight inherent trade-offs between dynamical consistency and small-scale variability representation among current SWOT-based Level-4 products. Future developments may therefore benefit from hybrid approaches that integrate data-driven flexibility with explicit physical constraints.
- Article
(12456 KB) - Full-text XML
- BibTeX
- EndNote


Oceanic submesoscale processes (O(1–10 km)), including submesoscale eddies, fronts, and filaments, play a central role in mediating energy transfers from mesoscale motions toward smaller turbulent scales, while driving enhanced vertical velocities and the vertical transport of momentum, energy, and tracers (Dong et al., 2014; McWilliams, 2016; Tang et al., 2020). Despite their dynamical importance, direct observation of submesoscale variability remains challenging due to limitations in the spatial sampling of existing observing systems. In particular, conventional nadir altimetry, while providing accurate along-track sea surface height (SSH) measurements with an effective resolution of ∼ 7 km, is restricted to one-dimensional ground tracks separated by several hundred kilometers, thereby limiting its ability to resolve two-dimensional fine-scale structures.
The Surface Water and Ocean Topography (SWOT) mission, equipped with the Ka-band Radar Interferometer (KaRIn), represents a major advance in satellite altimetry by providing high-resolution, two-dimensional SSH observations over a ∼ 120 km-wide swath centered on the satellite ground track (Vaze et al., 2018). Owing to its enhanced spatial sampling and swath coverage, SWOT extends the observable SSH variability toward submesoscale wavelengths on the order of ∼ 15 km, significantly beyond the effective limits of conventional nadir altimetry (Fu et al., 2024; Wang et al., 2025; Zhang and Callies, 2025). Recent studies have further demonstrated that SWOT observations capture dynamically consistent submesoscale variability across a wide range of oceanic regimes. At the basin scale, SWOT reveals widespread submesoscale features, including eddies, fronts, and internal waves, with coherent two-dimensional signatures and enhanced spectral energy at higher wavenumbers compared to conventional altimetric products (Archer et al., 2025). At the process-resolving scale, comparisons with moored and in situ observations indicate that balanced submesoscale eddies with horizontal scales larger than ∼ 10 km are reliably represented in SWOT SSH fields (Zhang et al., 2024). Direct comparisons of SWOT-derived velocities with surface drifters in the Southern Ocean further show that balanced motions dominate SSH down to ∼ 15 km, supporting the derivation of geostrophic currents from SWOT swaths (Tranchant et al., 2025). These fine-scale signals, however, are often attenuated when the swath observations are merged into gridded products (Carli et al., 2025). In energetic boundary current systems, SWOT further resolves sharper SSH gradients and more coherent small-scale structures than conventional multi-mission products, highlighting its ability to capture intense submesoscale activity (Coadou-Chaventon et al., 2025).
These observational advances suggest that SWOT has the potential to substantially improve Level-4 (L4) gridded SSH products by extending their effective resolution toward smaller spatial scales. However, integrating SWOT wide-swath observations into multi-mission mapping systems remains a nontrivial task. A key difficulty arises from the coexistence of observations with markedly different spatial resolutions and error characteristics (Ballarotta et al., 2019; Fouchet et al., 2025), which may introduce scale inconsistencies and lead to partial attenuation or distortion of submesoscale signals during data fusion (Ballarotta et al., 2025). A central challenge is therefore to reconcile the enhancement of small-scale variability with the preservation of large-scale accuracy and dynamical consistency in the mapped fields. In practice, this implies identifying an effective resolution range that leverages the added information content of SWOT without degrading the coherence of the reconstructed SSH fields (Bellemin-Laponnaz et al., 2025). Addressing this issue is essential for fully exploiting SWOT observations in operational mapping systems and for improving the representation of mesoscale-to-submesoscale ocean dynamics.
In this context, the integration of SWOT observations into L4 SSH products has been actively explored through coordinated community efforts, notably within the Ocean Data Challenges (ODC) framework. Rather than defining a single optimal mapping solution, these initiatives aim to evaluate how the additional information provided by SWOT can be effectively incorporated into gridded products across a range of methodological approaches. Existing strategies include multiscale inversion techniques such as MIOST (Ubelmann et al., 2021, 2022; Ballarotta et al., 2025), dynamically constrained assimilation methods based on quasi-geostrophic models (4DvarQG; Le Guillou et al., 2025), and data-driven reconstruction approaches such as 4DvarNET (Fablet et al., 2021; Beauchamp et al., 2023). A preliminary intercomparison of these approaches was reported in the appendix of Ballarotta et al. (2025), focusing on SSH reconstruction error, effective spatial resolution, and relative vorticity diagnostics over the North Atlantic. While these results demonstrate that SWOT observations systematically improve mapping accuracy and enhance effective resolution, they also indicate that such Eulerian metrics alone provide only a partial view of product performance, particularly with respect to flow reconstruction fidelity and the representation of dynamically relevant structures.
Building on this context, this study presents a comprehensive intercomparison of three SWOT-derived L4 products (MIOST, 4DvarQG, and 4DvarNET) over the North Atlantic. The evaluation combines Eulerian diagnostics of mapping accuracy, Lagrangian trajectory prediction skill based on surface drifters, and analyses of dynamical structures using relative vorticity and finite-size Lyapunov exponent (FSLE) fields. By jointly assessing these complementary aspects, this work aims to provide a more complete characterization of the scale-dependent performance and dynamical consistency of current SWOT-based mapping approaches, and to offer insights for the development of next-generation mapping methodologies.
This paper is organized as follows. Section 2 describes the datasets and evaluation methodology. Section 3 presents the intercomparison results. Section 4 discusses the implications of these findings and outlines perspectives for future developments of SWOT-derived L4 products.
2.1 SWOT-derived L4 sea surface height and current products
This study analyzes three experimental L4 gridded SSH products derived from SWOT wide-swath altimetry. The products are distributed by AVISO within the framework of the ODC initiative, which aims to evaluate alternative mapping strategies for incorporating SWOT KaRIn observations into multi-mission altimetric systems, with a particular focus on the representation of fine-scale ocean dynamics.
All three products are generated from a common set of input observations processed within the Data Unification and Altimeter Combination System (DUACS) and distributed by AVISO with CNES support (https://doi.org/10.24400/527896/A01-2024.007, AVISO/DUACS, 2024a). The observational dataset includes along-track measurements from eight nadir altimeter missions (SARAL/AltiKa, CryoSat-2, HaiYang-2B, Jason-3, Copernicus Sentinel-3A and -3B, Sentinel-6A, and SWOT nadir), together with SWOT KaRIn wide-swath observations. As the input data sources are consistent across products, differences among the L4 solutions primarily arise from the mapping methodologies, thereby enabling a controlled intercomparison of reconstruction approaches. These three products represent distinct strategies for addressing the heterogeneous sampling, resolution, and error characteristics of nadir and wide-swath altimetry.
-
MIOST is based on a multiscale statistical interpolation framework, in which SSH variability is decomposed into a set of prescribed dynamical components – geostrophic mesoscale, barotropic, and equatorial wave modes – represented in a reduced wavelet space with mode-specific covariances. This formulation allows for scale-dependent covariance modeling and provides a robust reconstruction under heterogeneous sampling conditions. Because no explicit dynamical constraint is imposed, variability that falls outside these modeled modes is not reconstructed and is effectively damped by the scale-dependent covariance regularization. The MIOST product provides near-global coverage (80° S–90° N, 0–360° E) at a spatial resolution of ° with daily temporal sampling (Ballarotta et al., 2025).
-
4DvarQG relies on a four-dimensional variational assimilation scheme constrained by a reduced-order quasi-geostrophic (QG) dynamical model. By introducing physically grounded dynamical constraints, this approach aims to reconstruct dynamically consistent SSH and surface current fields while mitigating limitations associated with SWOT's sparse temporal sampling. The 4DvarQG product is currently available over the North Atlantic domain (25–50° N, 80–10° W), with a spatial resolution of approximately ° and a temporal resolution of 6 h (Le Guillou et al., 2025).
-
4DvarNET adopts a data-driven variational framework in which both the dynamical prior and the assimilation operator are learned using deep neural networks. The model is trained within an observing system simulation experiment (OSSE) framework based on high-resolution NATL60 (°) simulations, with the objective of capturing nonlinear and non-Gaussian characteristics of fine-scale ocean variability. Because its learned prior is not restricted to geostrophic balance, 4DvarNET can in principle retain small-scale unbalanced variability; however, it does not physically separate balanced from unbalanced components, and the realism of such features cannot be established from the available validation data. The current implementation focuses on the same North Atlantic domain as 4DvarQG and provides daily fields on a ° grid (Beauchamp et al., 2023).
In this study, we focus on the North Atlantic Ocean, with particular emphasis on the Gulf Stream region. This region corresponds to the common spatial domain of all three products and is characterized by energetic mesoscale and submesoscale dynamics, providing a stringent testbed for evaluating the representation of fine-scale ocean processes.
2.2 Validation data
2.2.1 (a) SWOT level-3 sea surface height observations
To facilitate a qualitative assessment of fine-scale dynamics, individual surface features are identified using the SWOT Level-3 (L3) KaRIn low-rate SSH Expert product, version 2.0.1 (https://doi.org/10.24400/527896/A01-2023.018, AVISO/DUACS, 2025), which provides two-dimensional SSH fields on the 2 km × 2 km delivered grid. These L3 products have been validated for their ability to resolve fine-scale SSH variability, capturing surface signatures of submesoscale eddies, fronts, and internal waves. The spatial structure, location, and coherence of selected submesoscale eddies are compared against their representations in the three L4 products, providing a case study perspective on how different mapping approaches preserve or distort fine-scale dynamical features.
2.2.2 (b) Surface drifter measurements
Surface current fields derived from drifting buoys are used as an independent reference to evaluate the accuracy of the L4-derived velocity fields. Drifter data are obtained from the Copernicus Marine Environment and Monitoring Service (CMEMS, https://doi.org/10.48670/moi-00041, E.U. Copernicus Marine Service Information, 2024a), which provides quality-controlled trajectories and near-surface velocity estimates representative of upper-ocean circulation. Here, the drifter velocities measured at 15 m depth capture the total upper-ocean current, which includes both geostrophic and ageostrophic (wind-driven, tidal, and inertial) components. In contrast, the L4 velocity fields primarily capture the geostrophic current. This mismatch constitutes a source of representativeness error in the validation.
A total of 176 drifter platforms were deployed within the study domain during the analysis period from 27 July 2023 to 20 April 2024. As shown in Fig. 1, their spatial distribution is heterogeneous: drifters are more concentrated in lower-energy regions and sparser within the Gulf Stream. This uneven distribution primarily reflects the reduced residence time of drifters in energetic boundary current systems, where strong advection and dispersion rapidly remove platforms from the region. Despite the sparser coverage in high-energy regimes, observations in such areas are particularly valuable for assessing the representation of fine-scale dynamics. Temporally, the number of active drifters decreases after early 2024, resulting in reduced sampling during winter months. This constitutes a known constraint on the validation analysis.

Figure 1(a) Study area and spatial distribution of drifter platforms. The background shading represents ocean bathymetry, and the trajectories of the drifters are indicated by lines, with line color representing drifter speed magnitude. (b) Temporal distribution of drifter platforms in the North Atlantic during the study period.
2.2.3 (c) DUACS multi-mission merged L4 products
The DUACS multi-mission L4 gridded SSH and geostrophic current products have been widely used in operational oceanography and climate studies. DUACS products are generated using optimal interpolation techniques applied to multi-mission nadir altimetry, providing spatially and temporally continuous fields that primarily represent mesoscale variability. Recent developments in the DUACS processing chain have initiated the integration of wide-swath altimetry. In particular, near-real-time products have transitioned toward the MIOST mapping framework, enabling an extended multiscale representation of ocean dynamics. In parallel, a demonstrative delayed-time (DT) reprocessing (version DT-2024, released in November 2025) has been carried out using the updated MIOST approach with additional physical modes, in which SWOT KaRIn wide-swath measurements are explicitly incorporated into the L4 production. This development represents a key step toward enhancing the effective spatial resolution of DUACS products and improving the representation of mesoscale-to-submesoscale variability, while maintaining the robustness required for global operational applications.
In this study, the DUACS DT L4 product (version 4.1) is used as a reference dataset. This daily product, with a spatial resolution of °, integrates observations from eight nadir altimeter missions, including SWOT nadir, but does not include SWOT KaRIn wide-swath measurements. As such, it provides a stable and well-characterized mesoscale benchmark against which the impact of explicitly incorporating SWOT wide-swath observations into experimental L4 mapping systems can be evaluated. Comparisons between DUACS and the SWOT-derived L4 products therefore reflect differences arising from the inclusion of wide-swath information and advanced reconstruction methodologies.
The inclusion of SWOT KaRIn wide-swath observations has been shown to systematically improve SSH mapping accuracy and effective resolution (Ballarotta et al., 2025). To date, preliminary intercomparisons of SWOT-derived L4 products indicate pronounced scale-dependent differences: MIOST, 4DvarQG, and 4DvarNET exhibit distinct performance across different wavelength bands. However, the relative merits of quasi-geostrophic dynamical constraints versus data-driven flexibility across dynamical regimes, and the implications for Lagrangian predictability, have not been systematically examined. To further quantify the relative strengths of these approaches, the present study evaluates their performance using two complementary perspectives: Eulerian mapping accuracy and Lagrangian predictability.
3.1 Eulerian mapping accuracy
Validation against surface drifter observations follows the methodology of Ballarotta et al. (2020) and Le Guillou et al. (2023). Hourly drifter velocities are matched to the L4 velocity fields using linear interpolation to the drifter timestamps. Let U and V denote the zonal (eastward) and meridional (northward) velocity components at the sampling locations. The velocity difference is defined as:
To visualize the spatial distribution of errors, drifter observations are aggregated onto 1°×1° grids. The Root Mean Square Error (RMSE) is computed using:
where N is the number of sampling points within each grid cell and i indexes individual observations. The ageostrophic component of the observed velocities is retained, assuming it affects all L4 products similarly.
To quantify relative performance between products, a gain loss ratio R is defined. For instance, comparing MIOST and 4DvarQG:
Positive values indicate larger errors in MIOST relative to 4DvarQG, whereas negative values indicate superior MIOST performance.
Given the spatial heterogeneity of ocean dynamics, the evaluation is conducted within dynamically distinct regions. Based on the mean surface velocity magnitude over the study period, the North Atlantic domain is partitioned into three dynamic regimes (Fig. 2):
-
Region I. Shelf–slope regime, influenced by coastal and boundary processes.
-
Region II. Energetic quasi-geostrophic regime associated with the Gulf Stream, characterized by intense multiscale dynamics. SWOT observations are expected to provide the greatest added value here.
-
Region III. Weakly nonlinear quasi-geostrophic open-ocean regime, representing the dominant drifter-sampled environment.
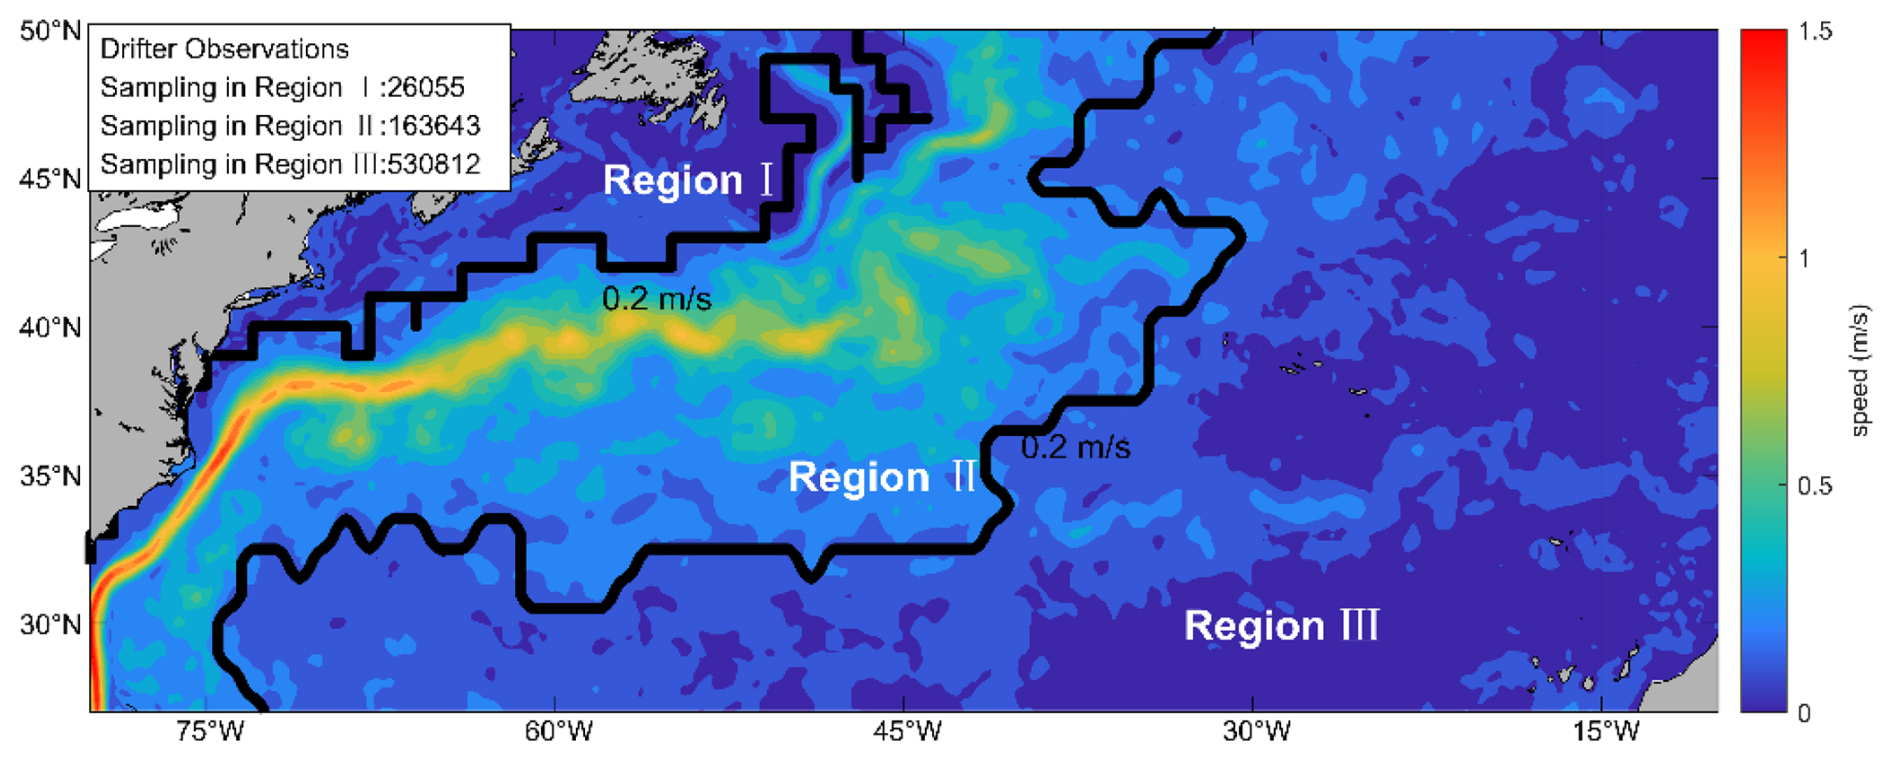
Figure 2Mean surface velocity and dynamic regime partition derived from DUACS geostrophic velocity fields over 27 July 2023–20 April 2024. Black contours delineate the boundaries of the three dynamic regimes, broadly following the 0.2 m s−1 speed contour. Moderate spatial smoothing was applied to ensure coherent regime boundaries. The number of drifter samples within each regime is annotated in the upper-left corner.
The classification broadly follows a 0.2 m s−1 speed contour, with minor smoothing applied to define contiguous regions, yielding a spatial structure similar to the dynamical partitioning proposed by Ballarotta et al. (2025). Within this framework, Regions II (163 643 samples, ∼ 22 %) and III (530 182 samples, ∼ 74 %) together account for the vast majority of observations and capture the dominant dynamical regimes resolved by SWOT. Consequently, these two regions constitute the primary focus of the subsequent analysis, whereas Region I plays a comparatively limited role due to its sparse sampling.
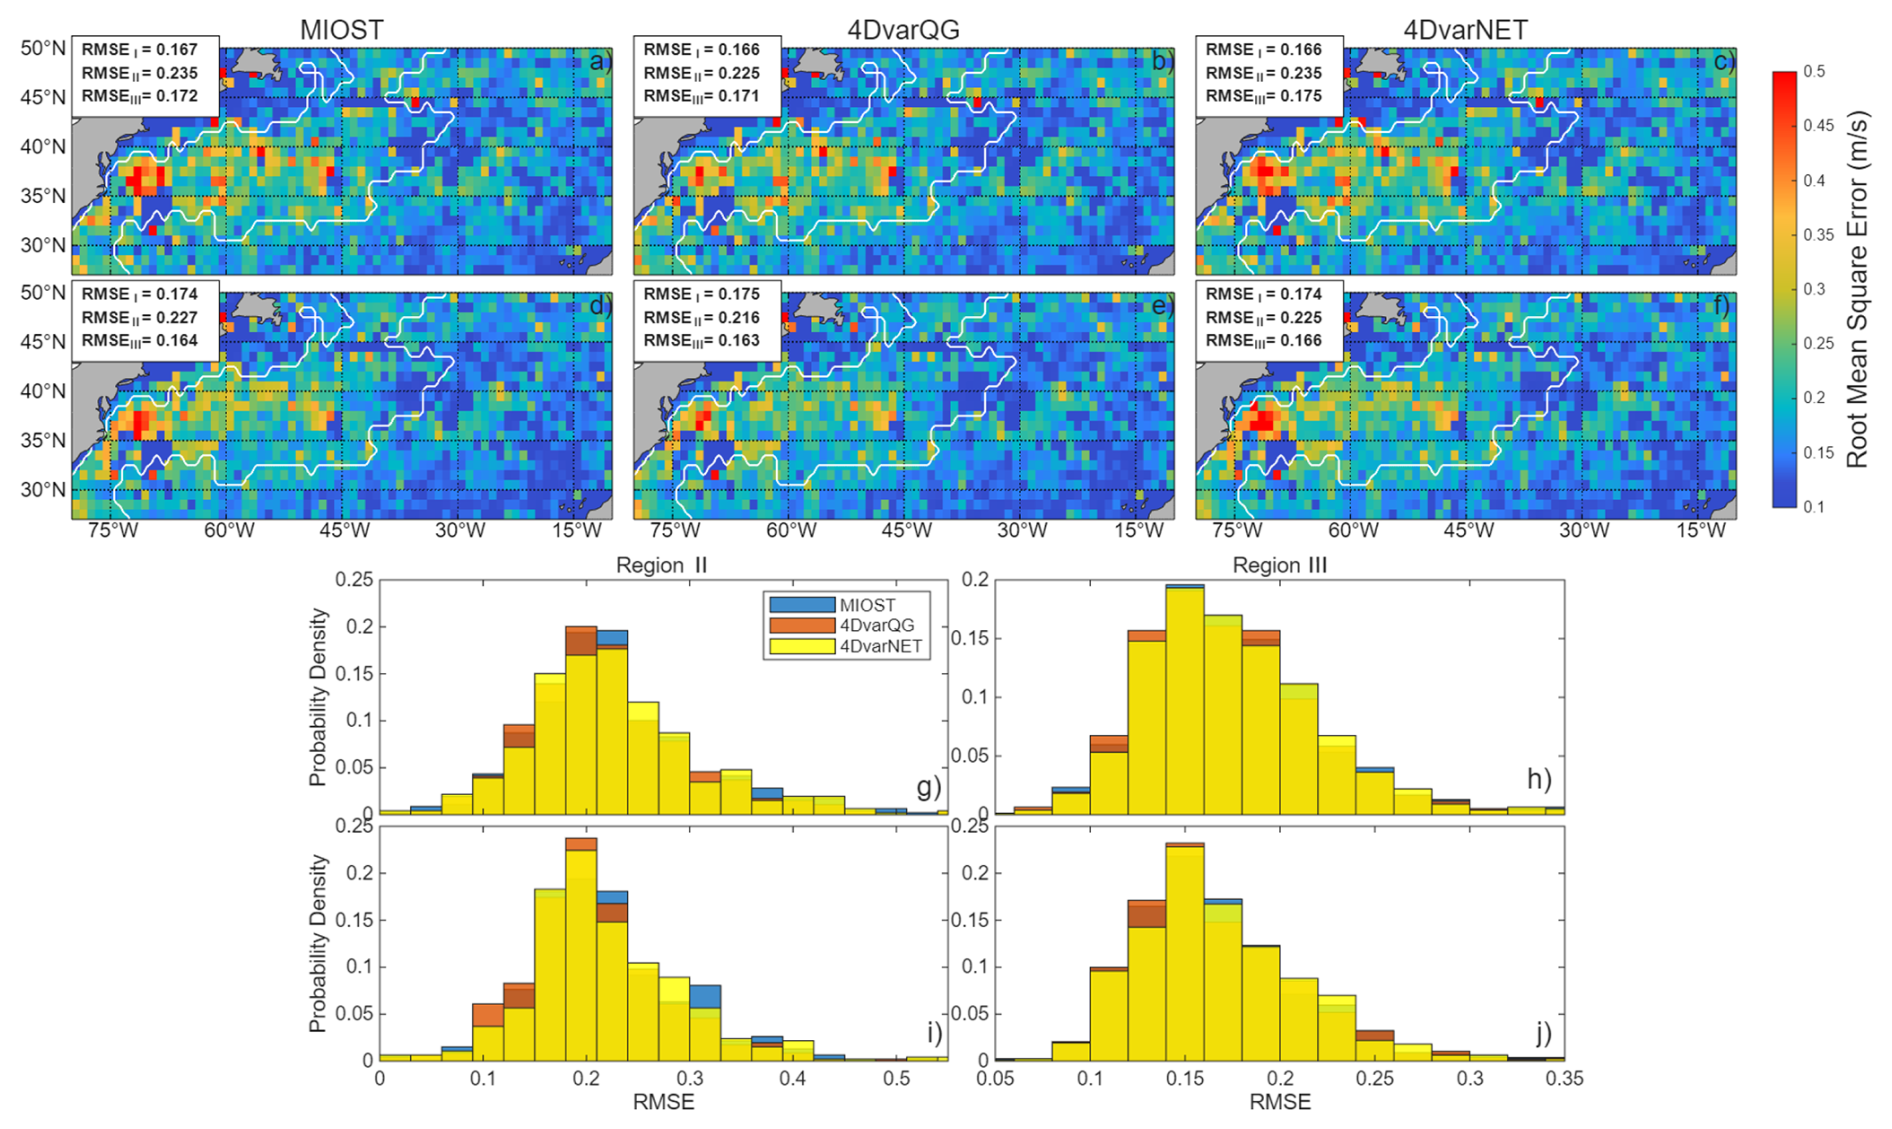
Figure 3(a–f) The RMSE of L4 products computed on 1°×1° grids. Columns correspond to different L4 products, and rows correspond to meridional (top) and zonal (bottom) velocity components. Region-averaged velocity RMSE within each dynamic regime are indicated in the upper-left annotation of each panel. (g–j) PDFs of the RMSE in Regions II and III, for zonal and meridional velocity components.
Eulerian reconstruction accuracy is quantified using RMSE and pairwise gain loss ratios computed across 1°×1° grids. Figure 3 presents the RMSE maps for each L4 product, together with the probability density functions (PDFs) of the RMSE in Regions II and III, allowing a direct assessment of their absolute reconstruction skill prior to the relative comparison. Figure 4 summarizes the pairwise gain loss ratios. As summarized in Fig. 4, Region I (shelf–slope regime) exhibits no statistically significant differences among the three L4 products, with region-averaged gain loss ratios remaining within ±1 %, indicating similar reconstruction skill. In contrast, Region II, corresponding to the energetic quasi-geostrophic regime associated with the Gulf Stream system, shows the most pronounced differences in relative performance. Region-averaged gain loss ratios indicate that 4DvarQG consistently outperforms MIOST and 4DvarNET by approximately 4 %–5 %. These improvements are spatially coherent along the Gulf Stream core and its downstream extension, as reflected by predominantly negative R values in the gain loss maps. MIOST and 4DvarNET, by comparison, show no systematic advantage over one another in this regime, with near-zero region-averaged gain loss ratios. In Region III, representing the weakly nonlinear open-ocean regime, 4DvarQG and MIOST perform comparably, with region-averaged gain loss ratios below 1 %. 4DvarNET, however, exhibits a consistent degradation of approximately 1 %–2 % relative to both 4DvarQG and MIOST, indicating reduced reconstruction skill under low-energy conditions. While RMSE values include contributions from ageostrophic motions present in the drifter velocities, the pairwise gain loss ratio largely removes this component, providing a conservative estimate of relative performance differences.
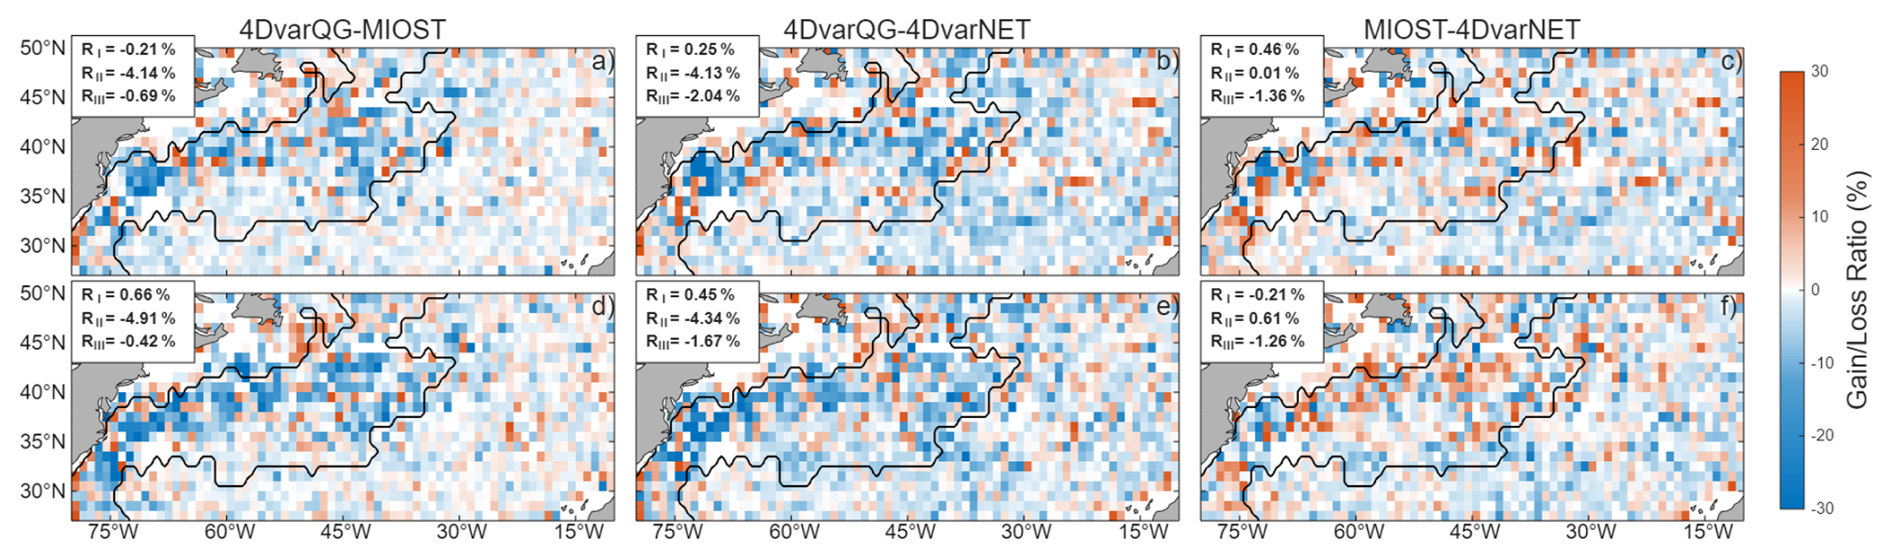
Figure 4Pairwise comparison of RMSE gain loss ratio R computed on 1°×1° grids. Columns correspond to comparisons between different L4 products, and rows correspond to meridional (top) and zonal (bottom) velocity components. Blue shading indicates negative R values, corresponding to reduced RMSE and superior performance of the first product in each comparison; red shading indicates increased RMSE. Region-averaged gain loss ratios for total velocity RMSE within each dynamic regime are indicated in the upper-left annotation of each panel.
Overall, 4DvarQG demonstrates clear superiority in the energetic quasi-geostrophic regime (Region II) and performs comparably to MIOST in the weakly nonlinear open-ocean regime (Region III). 4DvarNET exhibits the weakest performance across the study area in terms of Eulerian RMSE. This pattern can be interpreted in the context of information content and the dynamical constraints imposed by the respective methods. At the nominal ∼ ° resolution, mesoscale variability dominates the SSH signal within a quasi-geostrophic framework. Consequently, the physical constraints of the QG formulation allow 4DvarQG to reduce RMSE significantly, particularly in Region II, where energetic mesoscale eddies are well represented. By contrast, MIOST employs a statistically based linear analysis framework, in which SSH variability is decomposed into multiple components (e.g., geostrophic, equatorial wave, barotropic), each represented in a reduced wavelet-based subspace with distinct covariance structures. This formulation enables an efficient multiscale representation of ocean variability by explicitly modeling scale-dependent signals. However, the statistical separation among components does not explicitly account for dynamical interactions across scales, and cross-component coupling remains only implicitly represented through their linear superposition. As a result, in the energetically constrained Gulf Stream regime (Region II), MIOST does not fully exploit quasi-geostrophic relationships, leading to systematically higher RMSE. In the weakly nonlinear open-ocean regime (Region III), where dynamical constraints are less stringent, MIOST performs similarly to 4DvarQG. In such conditions, improved spatial sampling from SWOT wide-swath observations is likely to enhance the performance of statistically based approaches such as MIOST.
Interestingly, 4DvarNET does not outperform the other products in the Eulerian RMSE-based evaluation. This can be attributed to the fact that, at the spatial and temporal scales considered here, Eulerian RMSE computed against drifter velocities is dominated by errors in the quasi-geostrophically balanced component of the flow. The gridded L4 velocity products, owing to their spatiotemporal resolution and primarily geostrophic nature, represent the large-scale, time-averaged circulation rather than rapidly evolving ageostrophic motions. Consequently, improvements in reconstructing nonlinear or ageostrophic variability contribute little to the total RMSE and may even appear as additional noise in a pointwise, Eulerian sense.
3.2 Lagrangian predictability
In contrast to the gridded Eulerian analysis presented in the previous section, which focuses on the spatial distribution of reconstruction errors, the Lagrangian diagnostic evaluates product performance over increasing temporal scales. Following the framework of Le Guillou et al. (2023), simulated drifter trajectories predicted using the velocity fields under evaluation are compared with observed trajectories, and the prediction error is quantified as the Lagrangian separation error between predicted and observed positions.
For each drifter, trajectory predictions are initialized from the observed positions at regular daily intervals (e.g., 00:00 UTC) and integrated forward for lead times ranging from 0 to 20 d with a 3 h time step, using velocity fields from DUACS, MIOST, 4DvarQG, and 4DvarNET. Figure 5 presents a representative case study in Region II, illustrating both the trajectory prediction methodology and the lead-time-dependent error growth. Closer alignment between predicted and observed trajectories, together with smaller separation errors, indicates higher trajectory prediction skill. At short lead times (less than approximately 5 d), Lagrangian errors are primarily governed by small-scale, high-frequency velocity variability. During this early stage, trajectories predicted with 4DvarQG and 4DvarNET remain closer to observations than those predicted with MIOST and DUACS, indicating improved representation of short-term Lagrangian transport. As lead time increases, separation errors grow for all products due to the accumulation of velocity errors during trajectory integration. Beyond approximately 7 d, the separation error associated with 4DvarNET increases rapidly, reflecting the propagation of unresolved velocity discrepancies. At longer lead times (beyond ∼ 10 d), trajectory prediction becomes increasingly sensitive to mesoscale-dominated transport, with MIOST and DUACS outperforming other products, as evidenced by errors converging to within ∼ 1° after 15 d, highlighting the robustness of their mesoscale circulation representation.
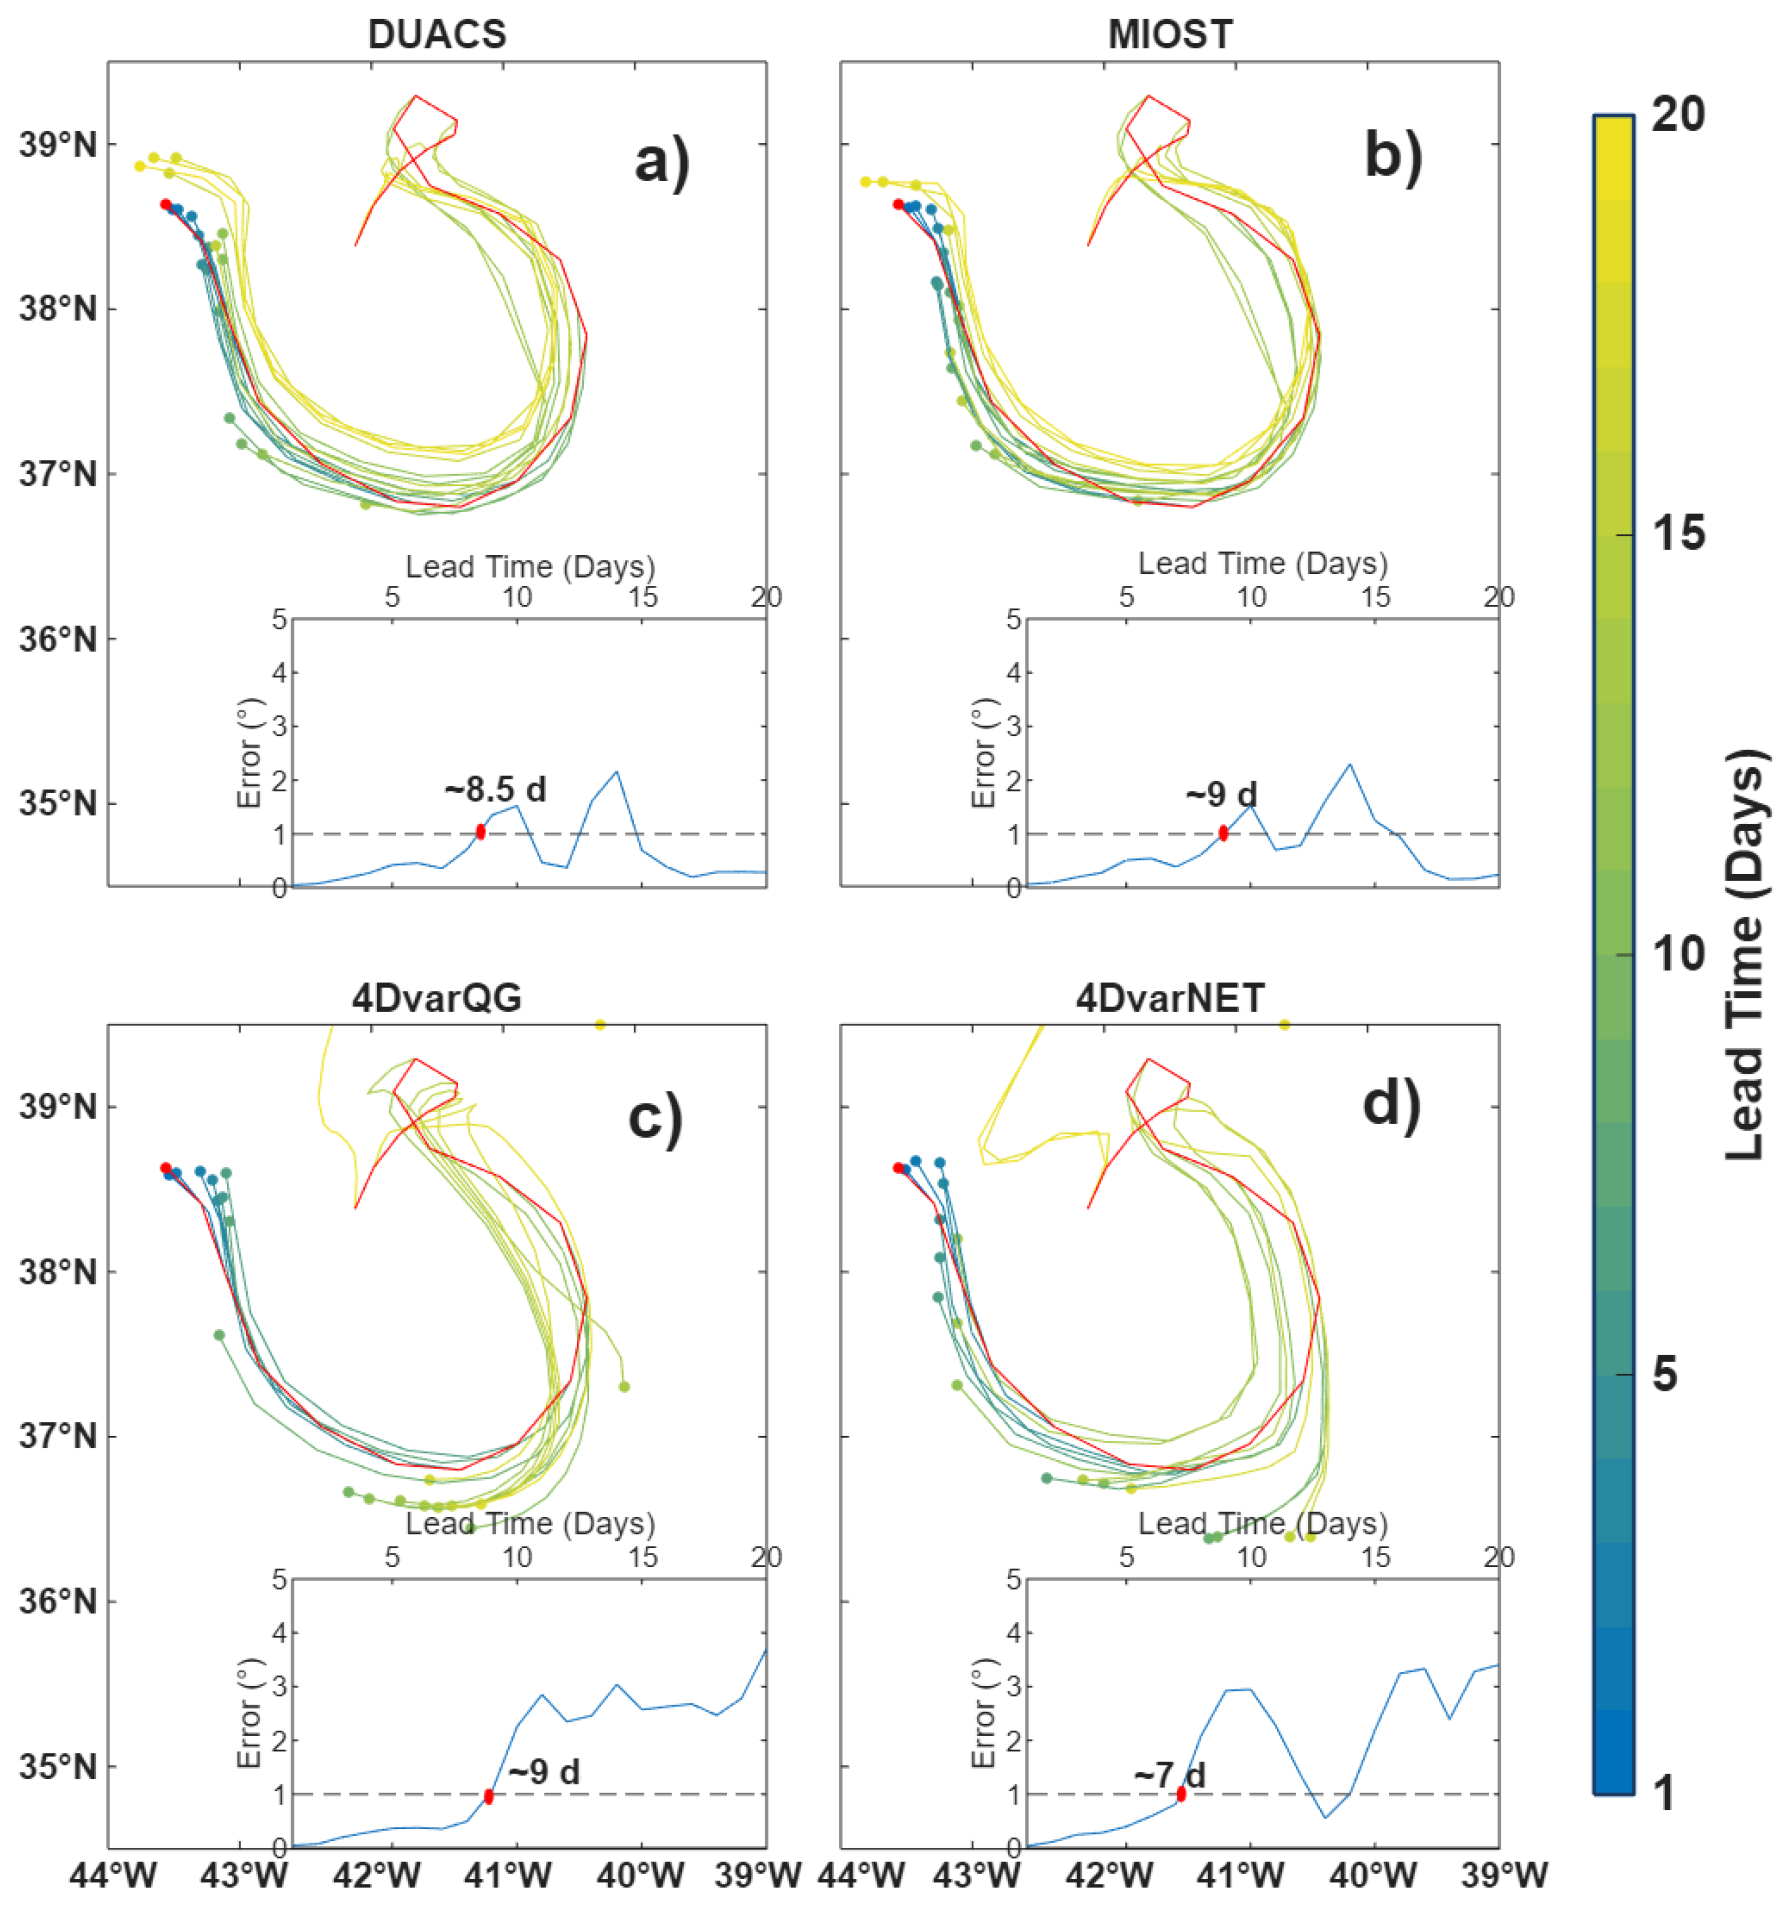
Figure 5Example of predicted and observed drifter trajectories in Region II. The red line represents the observed trajectory of drifter GL TS DC 3801596 from 1–21 August 2023, with the observed position at 00:00 UTC on 21 August marked by a red dot. Colored lines show predicted trajectories initialized from observed positions at different lead times, with predicted positions at 00:00 UTC on 21 August indicated by color-matched markers. The lower-right panel of each subplot displays prediction error (calculated using the Spherical Law of Cosines) as a function of lead time; the dashed gray line denotes a reference error of 1°.
To quantify the lead-time dependence of relative performance, the Lagrangian prediction experiment was repeated for 164 drifter trajectories in the North Atlantic between 27 July and 31 December 2023. For each trajectory, the evolution of the Lagrangian separation error with lead time was computed. Using DUACS as a benchmark, gain loss ratios of trajectory prediction errors were calculated for the three SWOT-derived products, and the combined results across all trajectories are shown in Fig. 6. The results indicate that, for short lead times (approximately 0–4 d), 4DvarQG provides the largest improvement relative to DUACS, reflecting its enhanced reconstruction of short-time-scale velocity variability. MIOST exhibits relatively smaller improvements, whereas 4DvarNET does not demonstrate systematic gains at any lead time. As lead time increases, all three SWOT-derived products gradually underperform DUACS, consistent with the increasing influence of large- and mesoscale reconstruction errors on long-term trajectory predictability.
Although 4DvarNET is specifically designed to better capture nonlinear and ageostrophic variability, Lagrangian diagnostics based on drifter observations at the resolved spatial and temporal scales are primarily sensitive to the balanced, quasi-geostrophic component of the flow. Consequently, potential improvements in high-frequency or nonlinear velocity components may contribute only marginally to trajectory prediction skill, or may manifest as phase inconsistencies that accumulate during trajectory integration. The cumulative impact of velocity errors across spatial and temporal scales ultimately constrains the Lagrangian predictability of 4DvarNET over the full range of lead times considered. Overall, the Lagrangian diagnostics indicate that 4DvarQG provides the most consistent improvements in short-term trajectory prediction, followed by MIOST. In contrast, 4DvarNET does not exhibit a clear enhancement relative to DUACS across the range of lead times considered, reflecting both the scale-dependent information content of drifter observations and the limited ability of the available validation data to fully resolve the nonlinear dynamics represented by 4DvarNET.
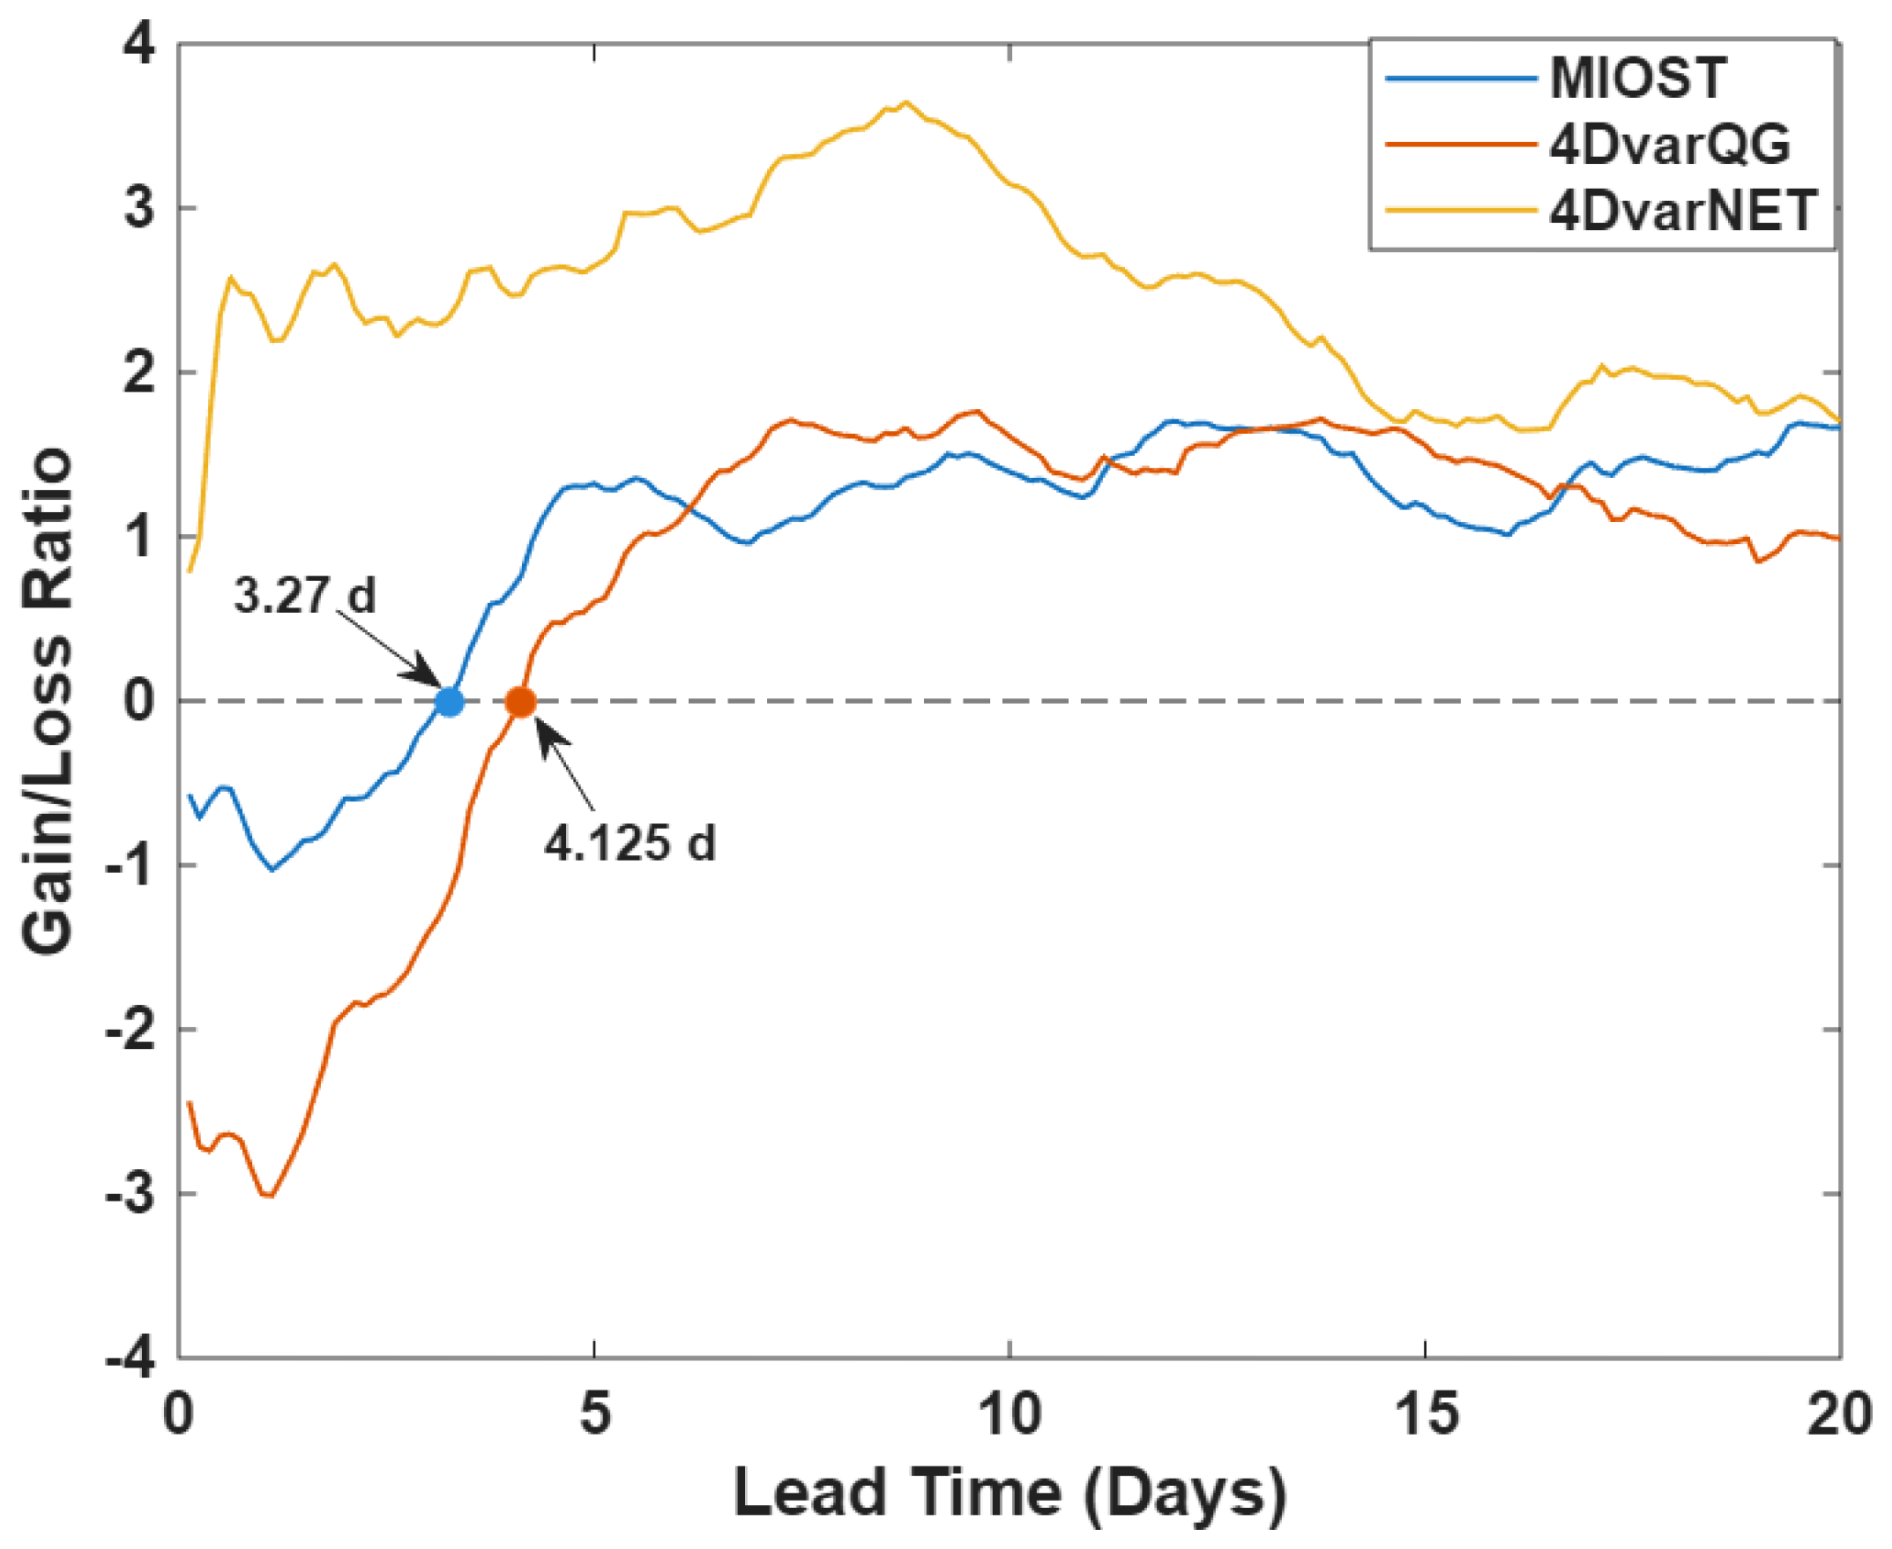
Figure 6Gain loss ratio of trajectory prediction errors for MIOST, 4DvarQG, and 4DvarNET relative to DUACS as a function of lead time. Negative values (below the zero line) indicate smaller prediction errors and improved performance compared to DUACS.
While the Eulerian and Lagrangian evaluations in Sect. 3 provide quantitative assessments of reconstruction accuracy, they offer limited insight into the dynamical consistency of resolved multi-scale motions, partly due to the intrinsic limitations of drifter observations. To address this, we further examine the dynamical realism of the products using case studies based on SWOT L3 along-track observations, focusing on diagnostics that capture submesoscale-to-mesoscale variability, specifically the Rossby number (Ro) and the FSLE. These metrics allow us to evaluate the ability of each product to represent dynamically active fine-scale processes across different regimes.
The Rossby number Ro, defined here as the normalized relative vorticity
where f is the local Coriolis parameter, provides a measure of the relative importance of local vorticity compared to planetary rotation. Larger values of indicate stronger submesoscale activity and departures from quasi-geostrophic balance (Thomas et al., 2008; Yang et al., 2017; Jing et al., 2021).
To assess the representation of fine-scale dynamics by the three products, we first examine the PDFs and spatial distributions of (Fig. 7). The PDFs of for all products are approximately Gaussian, with most values concentrated at low amplitudes and only a small fraction approaching unity, consistent with a predominantly quasi-geostrophic flow. Among the three products, 4DvarNET exhibits the broadest distribution and the highest mean , indicating increased sensitivity to regions of elevated relative vorticity and intensified fine-scale activity.
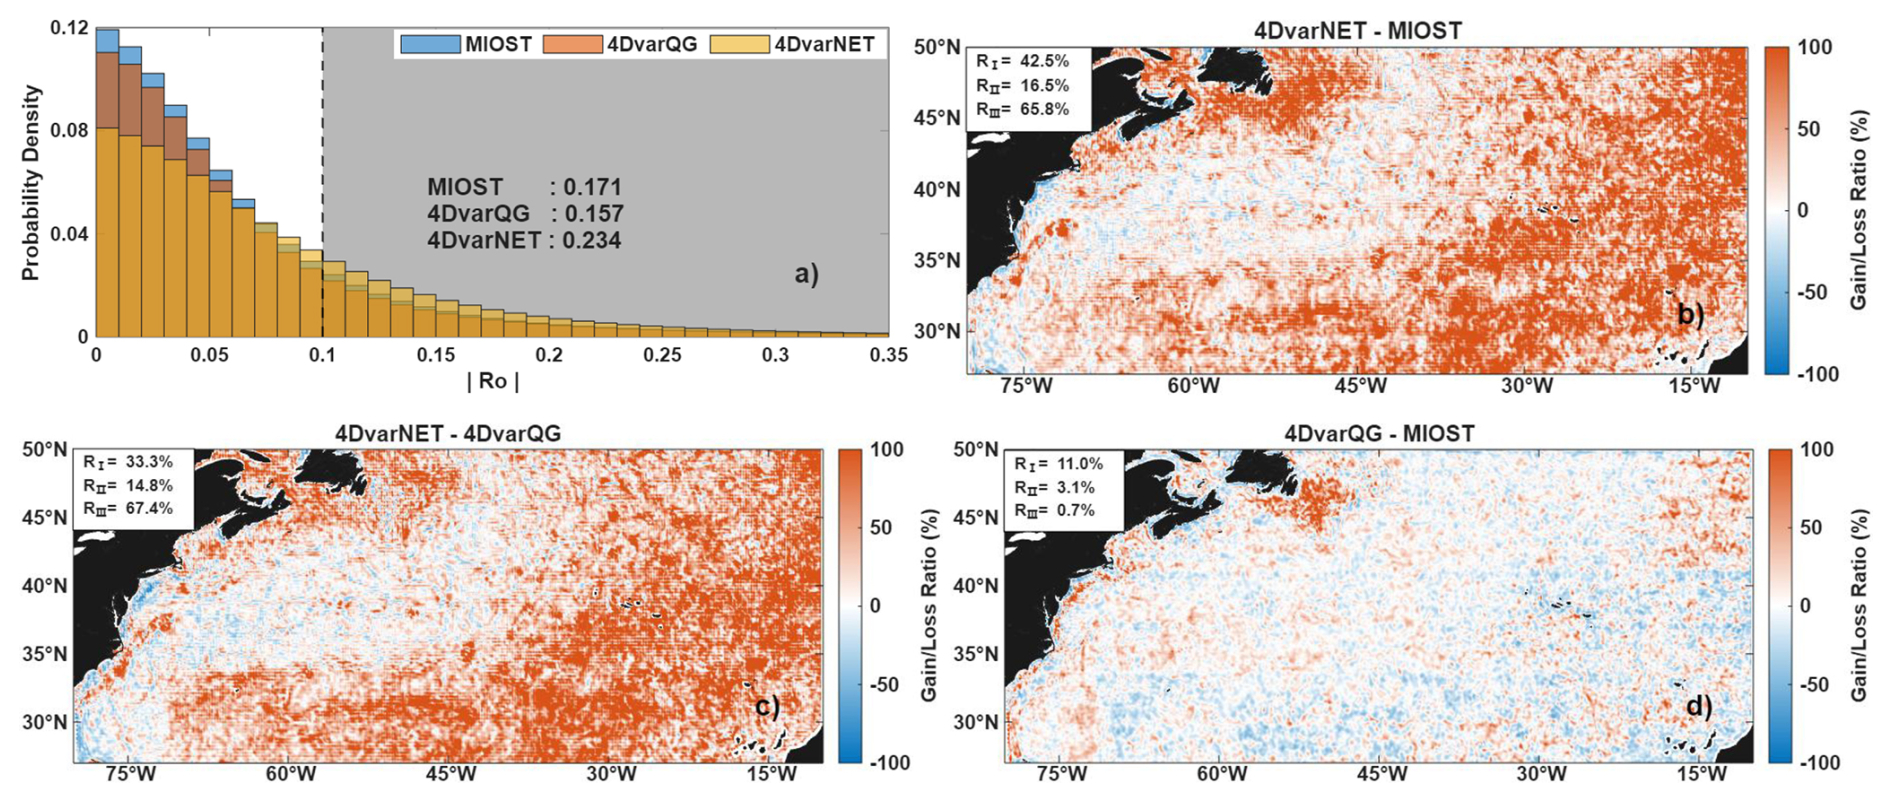
Figure 7(a) PDFs of the absolute Rossby number for the three L4 products. Mean values are annotated. (b–d) Spatial distributions of the gain loss ratio between pairs of products. Warm colors indicate regions where the first-listed product exhibits larger relative to the reference product, while cold colors indicate regions where it exhibits smaller . Insets report region-averaged gain loss ratios (R) over the three predefined dynamical regimes.
Spatial maps of gain loss ratios (Fig. 7b–d) reveal pronounced regional differences in fine-scale representation. Relative to MIOST and 4DvarQG, 4DvarNET shows substantial enhancement in Region I (≈ 40 %) and, more prominently, in the weakly nonlinear open-ocean Region III (> 60 %). In the energetically dominant Gulf Stream Region II, characterized by strong mesoscale and submesoscale dynamics, the relative improvement provided by 4DvarNET remains moderate (> 10 %). This scale- and region-dependent pattern indicates that the observed amplification in 4DvarNET primarily occurs in regions where the background flow is weaker and dynamical constraints are less stringent, rather than in the core energetic regime where submesoscale activity is most dynamically robust. Therefore, although 4DvarNET systematically produces higher values across all regions, this does not necessarily imply a more physically consistent reconstruction of fine-scale dynamics. In particular, the large increases observed in Region III may partly reflect the amplification of weak gradients or observational noise into high-vorticity signals, rather than the faithful representation of dynamically driven submesoscale motions. This behavior likely reflects both the characteristics of the training dataset and the absence of explicit physical constraints in the neural-network formulation. Notably, the NATL60 configuration used for training does not include explicit tidal forcing and only partially represents fast-moving inertia-gravity waves, so unresolved wave-like SSH variance may be misattributed to vortical structures. This is consistent with the largest enhancements occurring in wave-influenced regions outside the energetic Gulf Stream. As such, -based enhancements in dynamically quiescent regimes should be interpreted with caution, particularly in wave-dominated environments.
As a continuation of the previous large-scale assessment, we examine a set of representative eddy case studies to evaluate the ability of the three L4 products to capture fine-scale dynamical structures. Figure 8 illustrates the geographic locations and characteristic sizes of the selected cases, spanning dynamical regimes from an energetic ∼ 100 km mesoscale eddy near the Gulf Stream core to ∼ 10 km submesoscale vortices in weaker-flow regions. Together, these cases provide a nested framework for assessing how the products represent eddies across increasing levels of dynamical complexity.
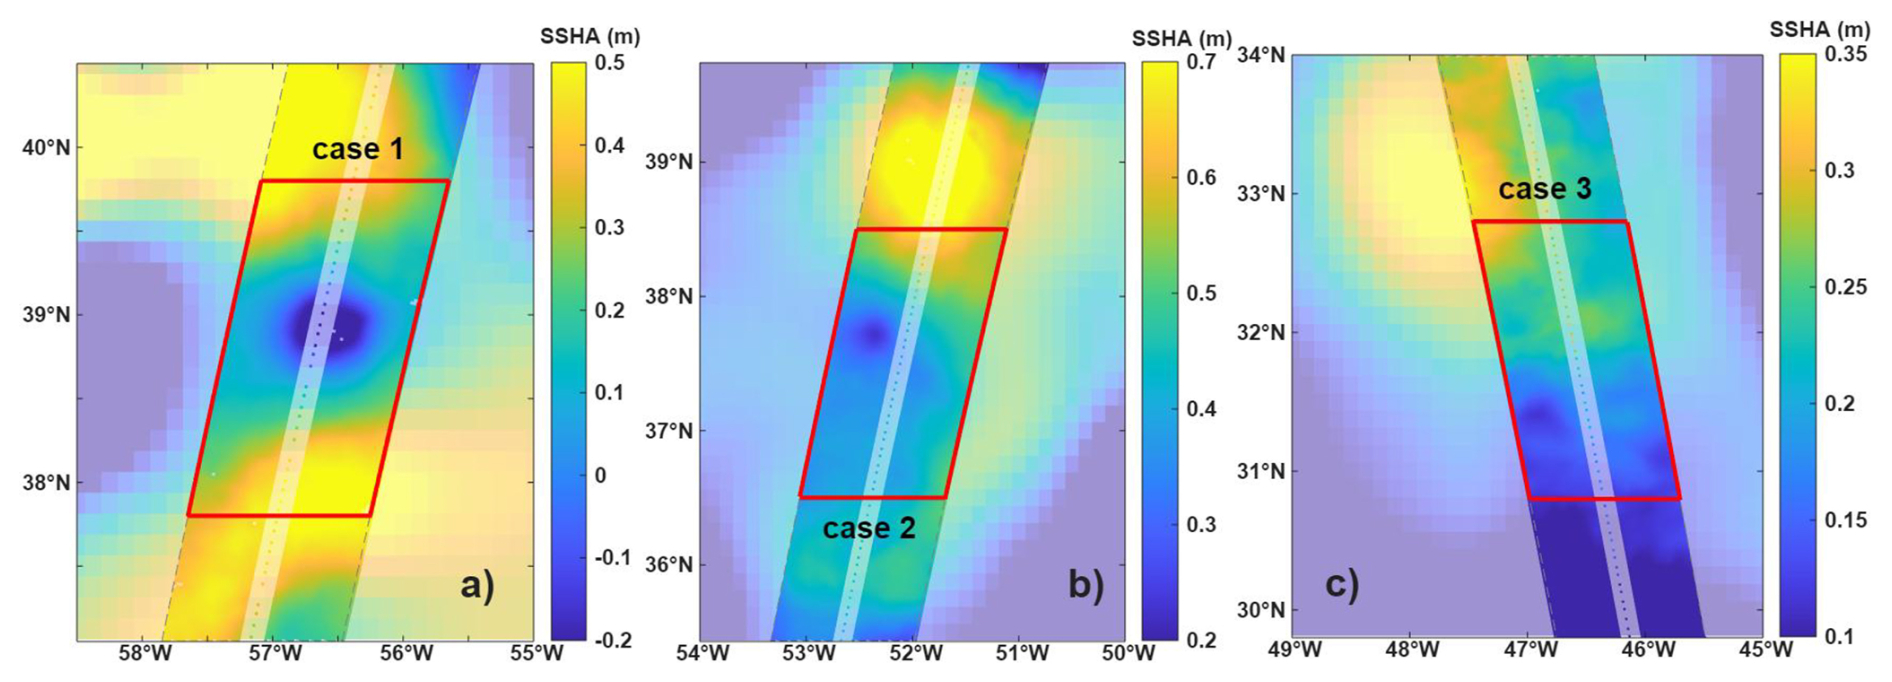
Figure 8Geographic location and dynamical context of the three case studies. Background color shows sea surface height anomaly (SSHA) magnitude from DUACS. Red boxes denote SWOT L3 observation domains analyzed in Cases 1–3. Approximate eddy diameters (∼ 100, ∼ 50, ∼ 10 km) illustrate characteristic spatial scales. Cases are selected to sample distinct dynamical regimes within the Gulf Stream system.
To complement Eulerian diagnostics, we employ the FSLE as a local Lagrangian measure, widely used to characterize stirring and mixing of ocean tracers such as sea surface temperature and chlorophyll (d'Ovidio et al., 2004; Titaud et al., 2011). FSLE can resolve subgrid-scale deformation and strain structures from coarser velocity fields while maintaining numerical stability (Lacorata et al., 2001; Gaultier et al., 2013). For the three L4 products at ∼ ° resolution, FSLE provides an effective approach to investigate submesoscale dynamics that may not be fully captured in the gridded velocity fields. The FSLE is defined as follows: for two initially adjacent particles in a velocity field starting at position x and time t, their separation grows from δ0 to δf over a time τ. The FSLE is then inversely proportional to τ
where δ0 corresponds to the FSLE grid resolution (°) and δf is set to 0.5°.
In the largest-scale and most energetic case (Case 1; Figs. 9–10), located adjacent to the Gulf Stream core and influenced by surrounding mesoscale activity, the eddy has an approximate diameter of 100 km and an SSHA amplitude of ∼ 30 cm. Despite gaps between the Nadir and KaRIn tracks, the overall vortex geometry can be reliably inferred from the surrounding SSH contours. This case represents a strongly mesoscale-dominated regime, in which quasi-geostrophic balance governs the primary flow structure. All three products successfully reconstruct the large-scale vortex geometry in SSHA, indicating consistent skill at this scale. Differences among products are most evident in amplitude fidelity and structural sharpness.
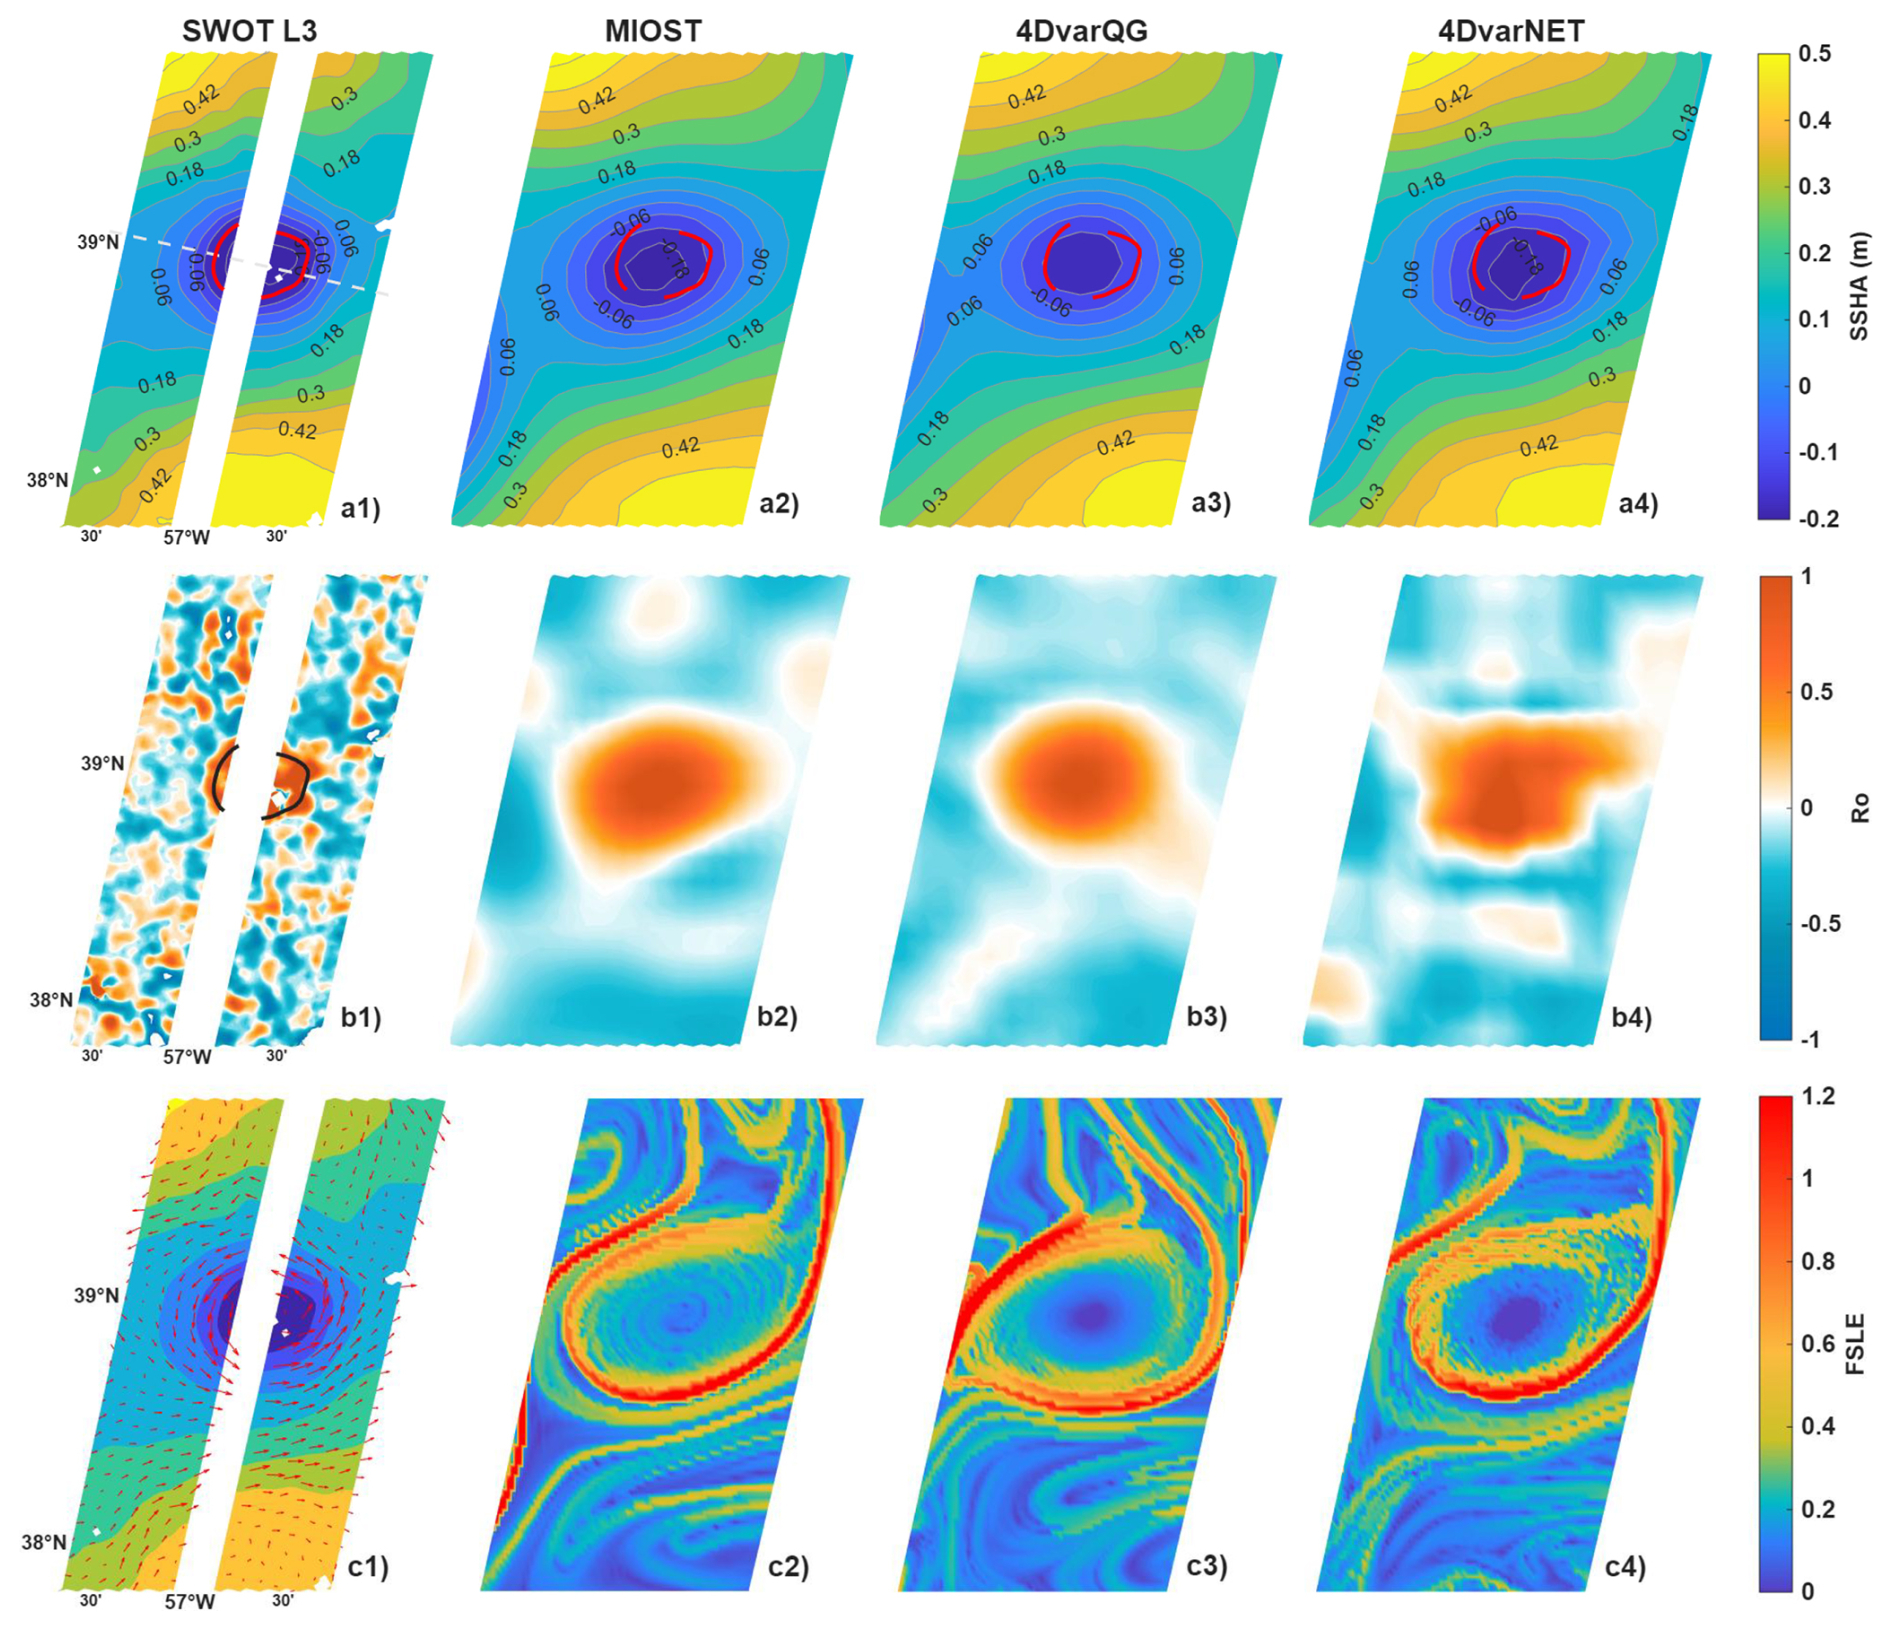
Figure 9Case 1 (SWOT L3 cycle 002, pass 145; 16 August 2023). Spatial comparison of: (a) sea surface height anomaly (SSHA), (b) Rossby number (Ro), (c) Geostrophic current of SWOT L3 (left column) and FSLE derived from three L4 products (MIOST, 4DvarQG, 4DvarNET). White crosses mark SWOT-identified eddy cores; colored crosses indicate reconstructed cores from each product. Note that Ro color scales differ to account for sharper gradients and higher amplitudes in SWOT L3 relative to L4 reconstructions.
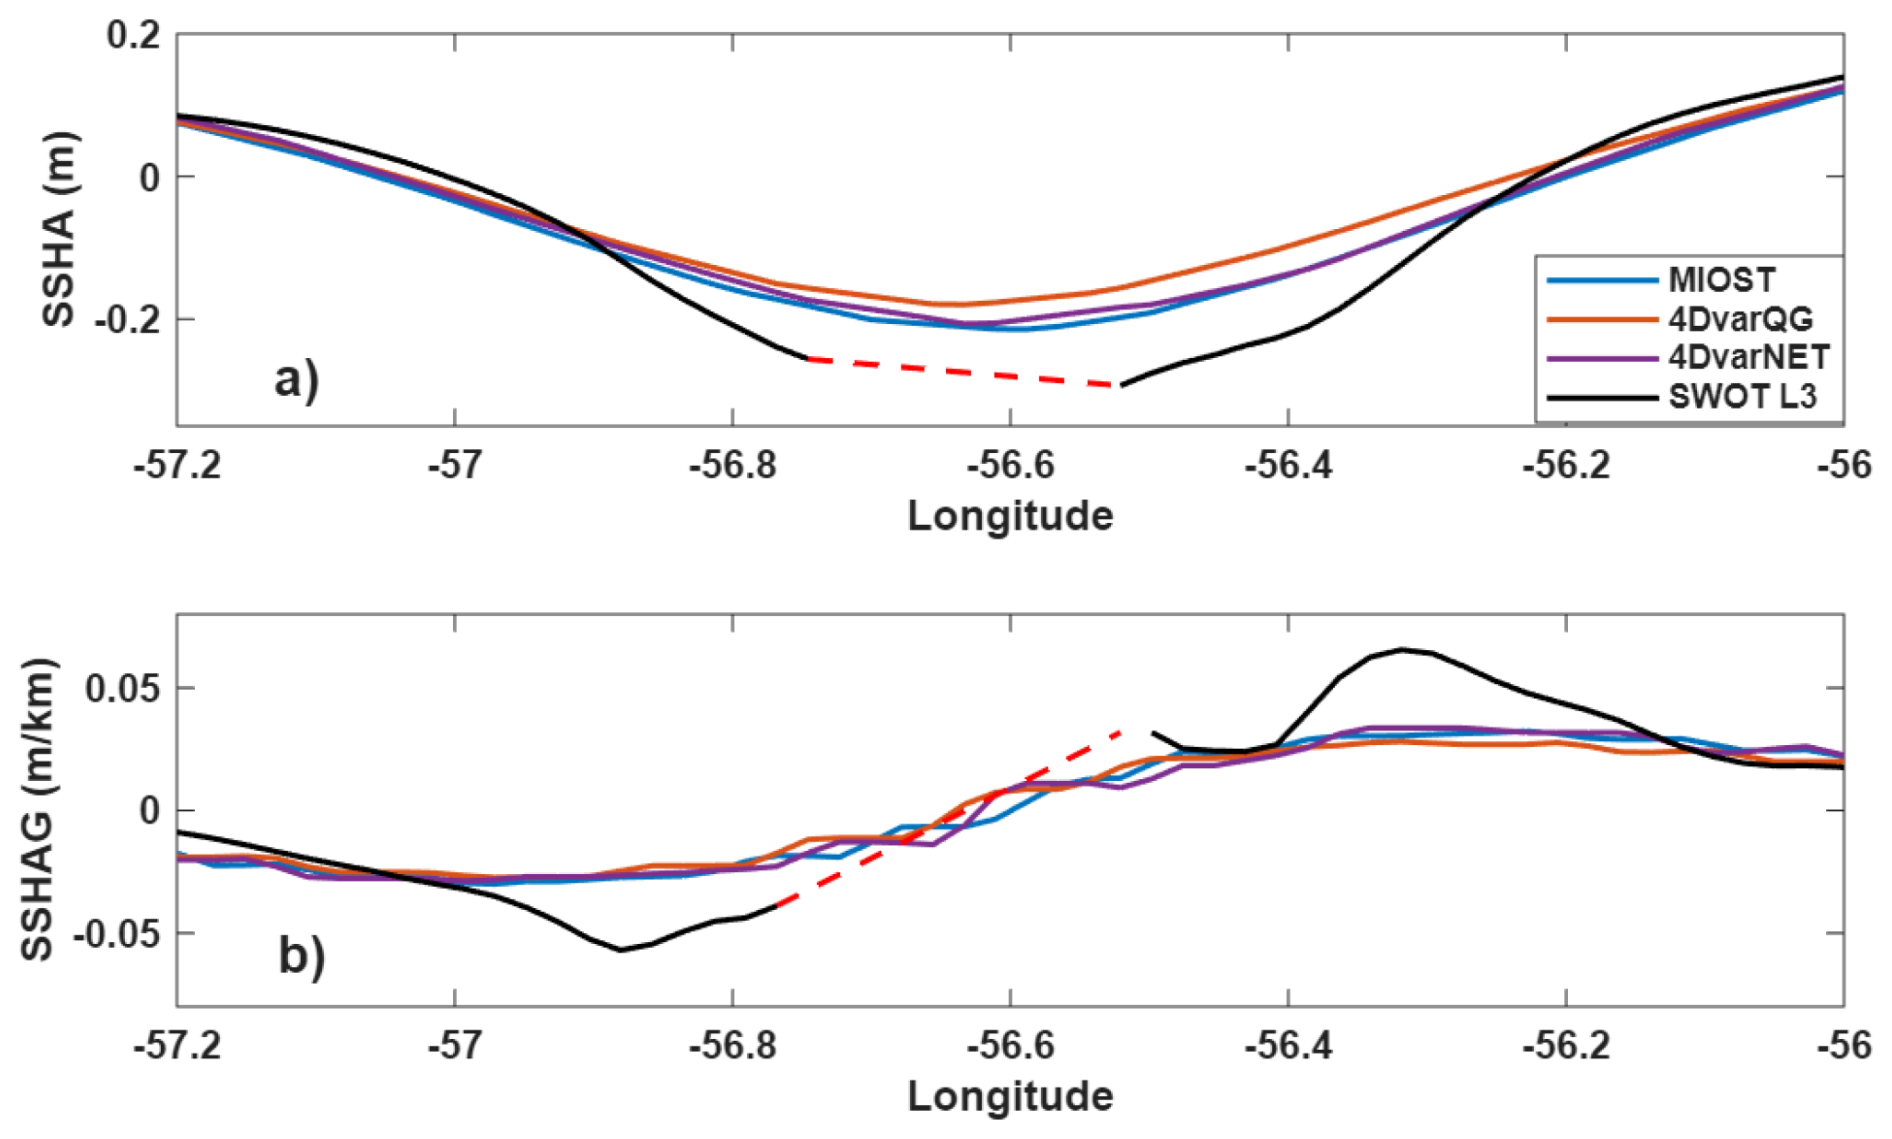
Figure 10Cross-sectional comparison of SSHA and its along-track gradient across the eddy core in Case 1 (section indicated in Fig. 8a1). (a) SSHA profiles and (b) corresponding SSHA gradients from SWOT L3 and L4 products. Differences in amplitude and gradient sharpness highlight the products' varying ability to reconstruct eddy intensity and frontal structure.
Cross-sectional analysis (Fig. 10) shows that 4DvarQG systematically underestimates SSHA amplitude at the eddy core relative to SWOT L3, consistent with smoothing imposed by its variational QG constraint. 4DvarNET better preserves local gradient magnitude, but introduces subtle deviations from the observed quasi-circular morphology. These differences are also visible in the Ro and FSLE fields (Fig. 9b–c), where enhanced small-scale variability and irregular boundary structures appear. Such features may reflect the neural network's ability to represent nonlinear, high-frequency motions beyond QG-constrained dynamics; however, this cannot be fully verified using L3 observations alone, and the dynamical realism of these sharpened structures requires validation with unfiltered SWOT Level-2 data or independent higher-resolution measurements. MIOST exhibits the smoothest gradients among the three products. The magnitude and spatial distribution of Ro are broadly consistent across products, indicating that under strong mesoscale control, normalized vorticity is relatively insensitive to methodological differences. Similarly, FSLE fields reveal comparable strain organization, although 4DvarQG captures deformation structures that are most consistent with the observed frontal features.
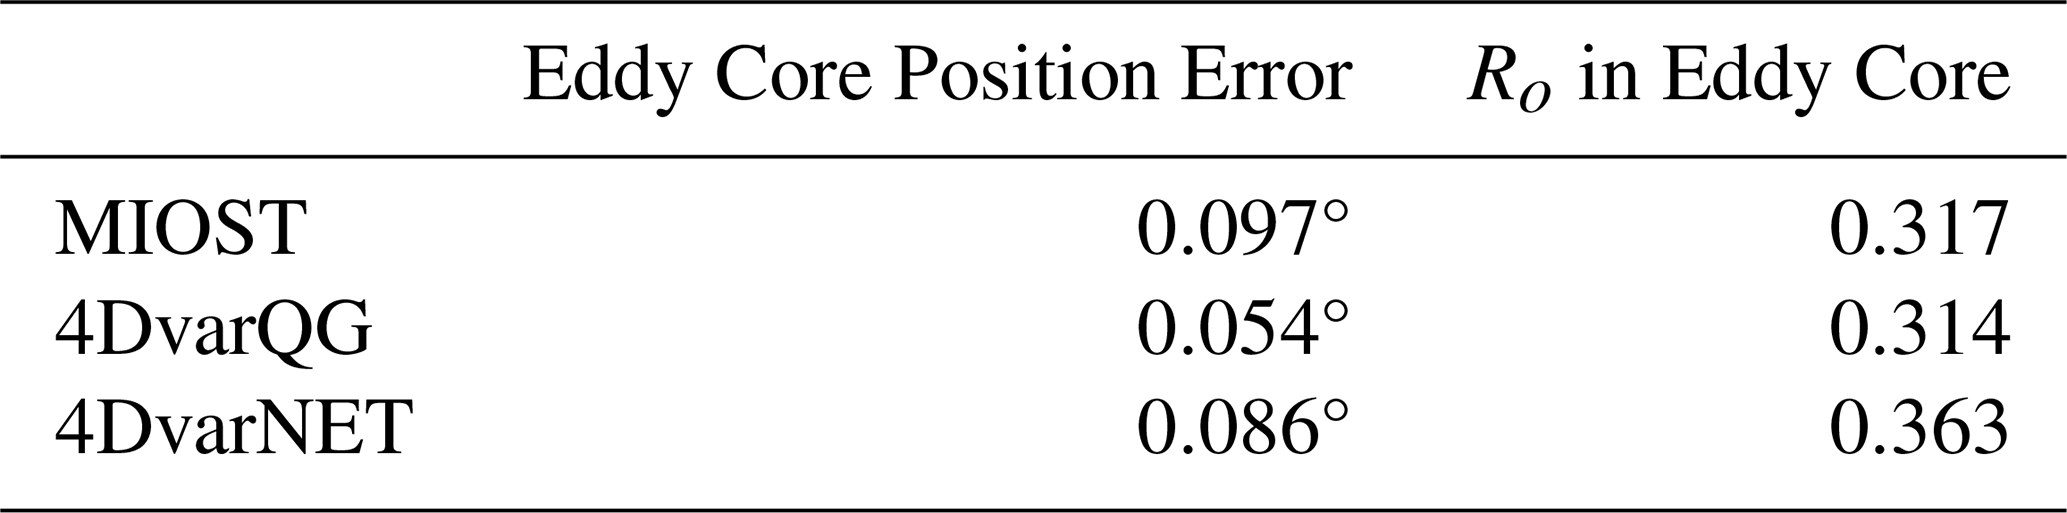
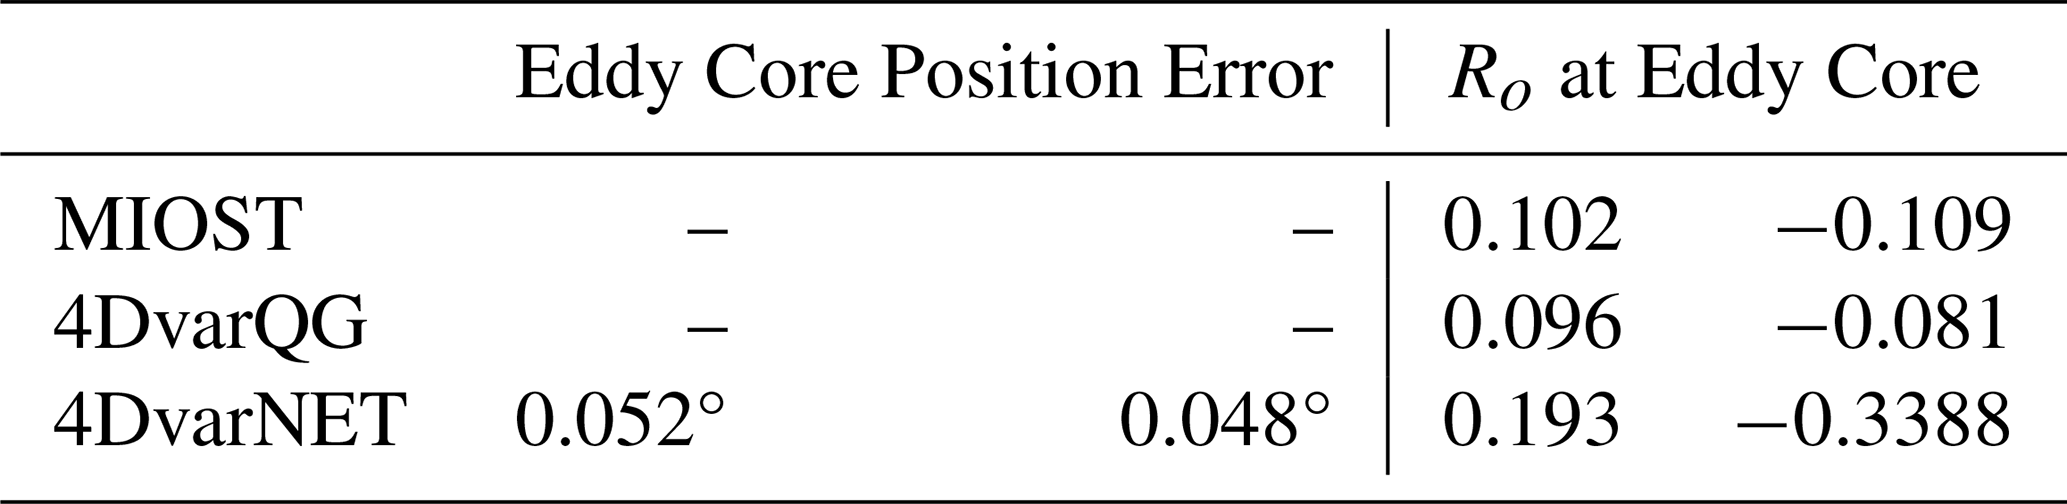
In the intermediate-scale event (Case 2; Figs. 11–12; Table 1), a ∼ 50 km-diameter eddy is embedded within the energetic Gulf Stream core, where background velocities exceed 0.5 m s−1. Relative to Case 1, this case represents a transitional dynamical regime in which mesoscale balance remains dominant, while finer-scale variability becomes increasingly prominent. All three products correctly identify the vortex location in the SSHA field. Among them, 4DvarQG yields the smallest eddy-core position error (Table 1) and most accurately reproduces the observed elliptical geometry aligned with the background jet, suggesting that quasi-geostrophic constraints remain effective in strong-shear environments. Diagnostics of Ro reveal clearer methodological differences than in Case 1. While the overall magnitudes are comparable across products, the spatial distribution of vorticity exhibits greater structural variability in 4DvarNET, indicating enhanced sensitivity to smaller-scale features. Cross-sectional analysis shows that all three products underestimate the SSHA gradient across the eddy core. Reconstructed slopes cluster near zero, in contrast to the observed gradients of approximately −0.02 m km−1, highlighting a shared limitation in resolving frontal steepness at this scale. In the FSLE fields, 4DvarQG reproduces a coherent elliptical strain structure consistent with the observed southeast frontal orientation. In contrast, 4DvarNET introduces additional small-scale variability without substantially improving mesoscale strain organization.

Figure 11Case 2 (SWOT L3 cycle 002, pass 089; 14 August 2023), presented with the same layout and diagnostics as Fig. 8.
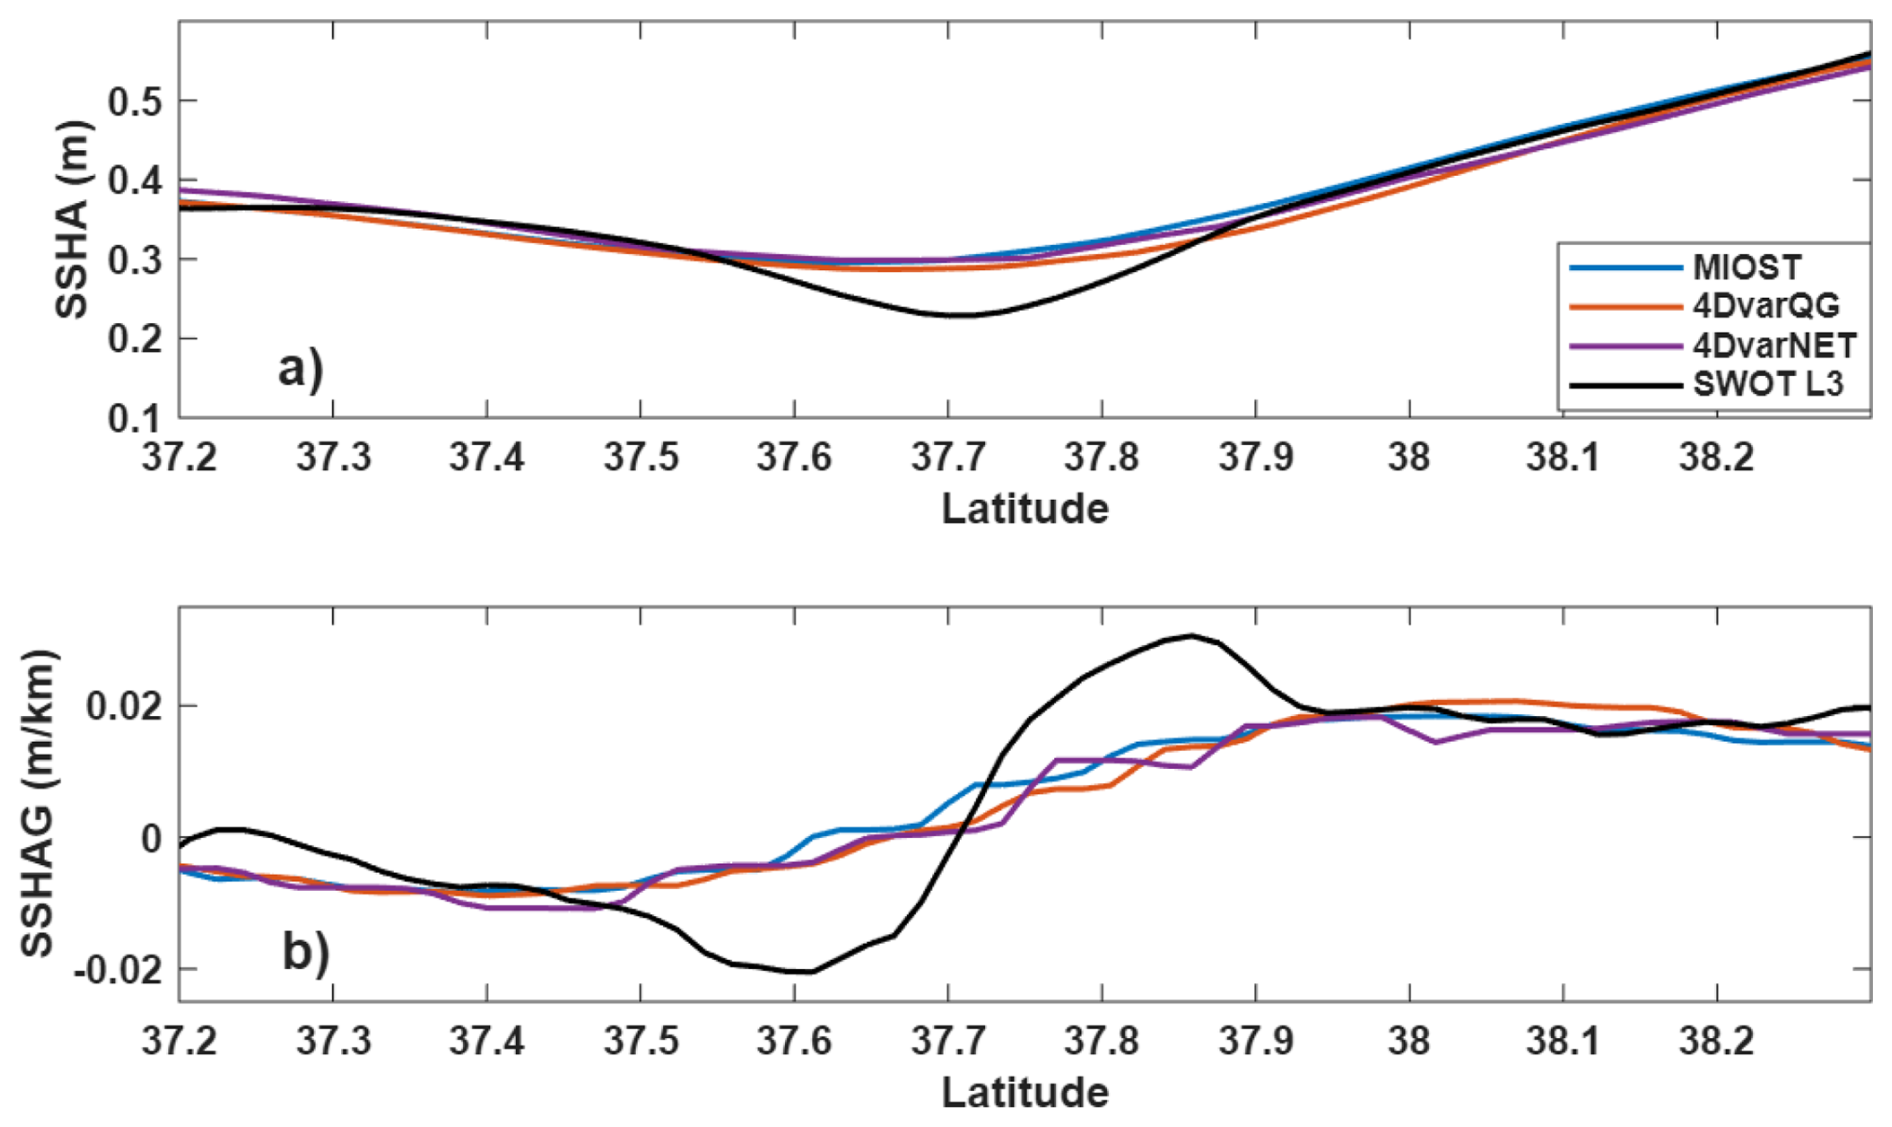
Figure 12Cross-sectional SSHA and gradient profiles across the eddy core in Case 2 (section indicated in Fig. 10a1), same as Fig. 9.
Table 1Eddy-core position error (°) and Ro at the eddy core for Case 2.
The weakest and smallest structures (Case 3; Figs. 13–14; Table 2) consist of two ∼ 10 km vortices located several hundred kilometers south of the Gulf Stream core. These eddies generate SSHA gradients of only a few centimeters and are difficult to discern even in SWOT L3 observations, underscoring the intrinsic challenge of reconstructing low-amplitude submesoscale signals. Methodological differences become pronounced at this scale. Only 4DvarNET reproduces closed SSHA anomaly contours comparable to SWOT L3, enabling the identification of coherent eddy cores with position errors of ∼ 0.05°. In contrast, MIOST and 4DvarQG largely retain background mesoscale gradients and fail to recover fully closed vortex structures. Cross-sectional analysis further highlights this discrepancy. MIOST and 4DvarQG primarily capture large-scale linear trends, whereas 4DvarNET resolves submesoscale undulations that, although smaller in amplitude, are well aligned in phase and gradient with SWOT L3 observations. Diagnostics of Ro reinforce this distinction. 4DvarNET exhibits substantially larger magnitudes and sharper polarity boundaries, consistent with stronger vortical organization. In the FSLE fields, 4DvarNET contains filamentary strain structures that are an order of magnitude stronger than those in the other products. By contrast, MIOST produces comparatively smooth fields, while 4DvarQG suppresses most fine-scale strain variability.
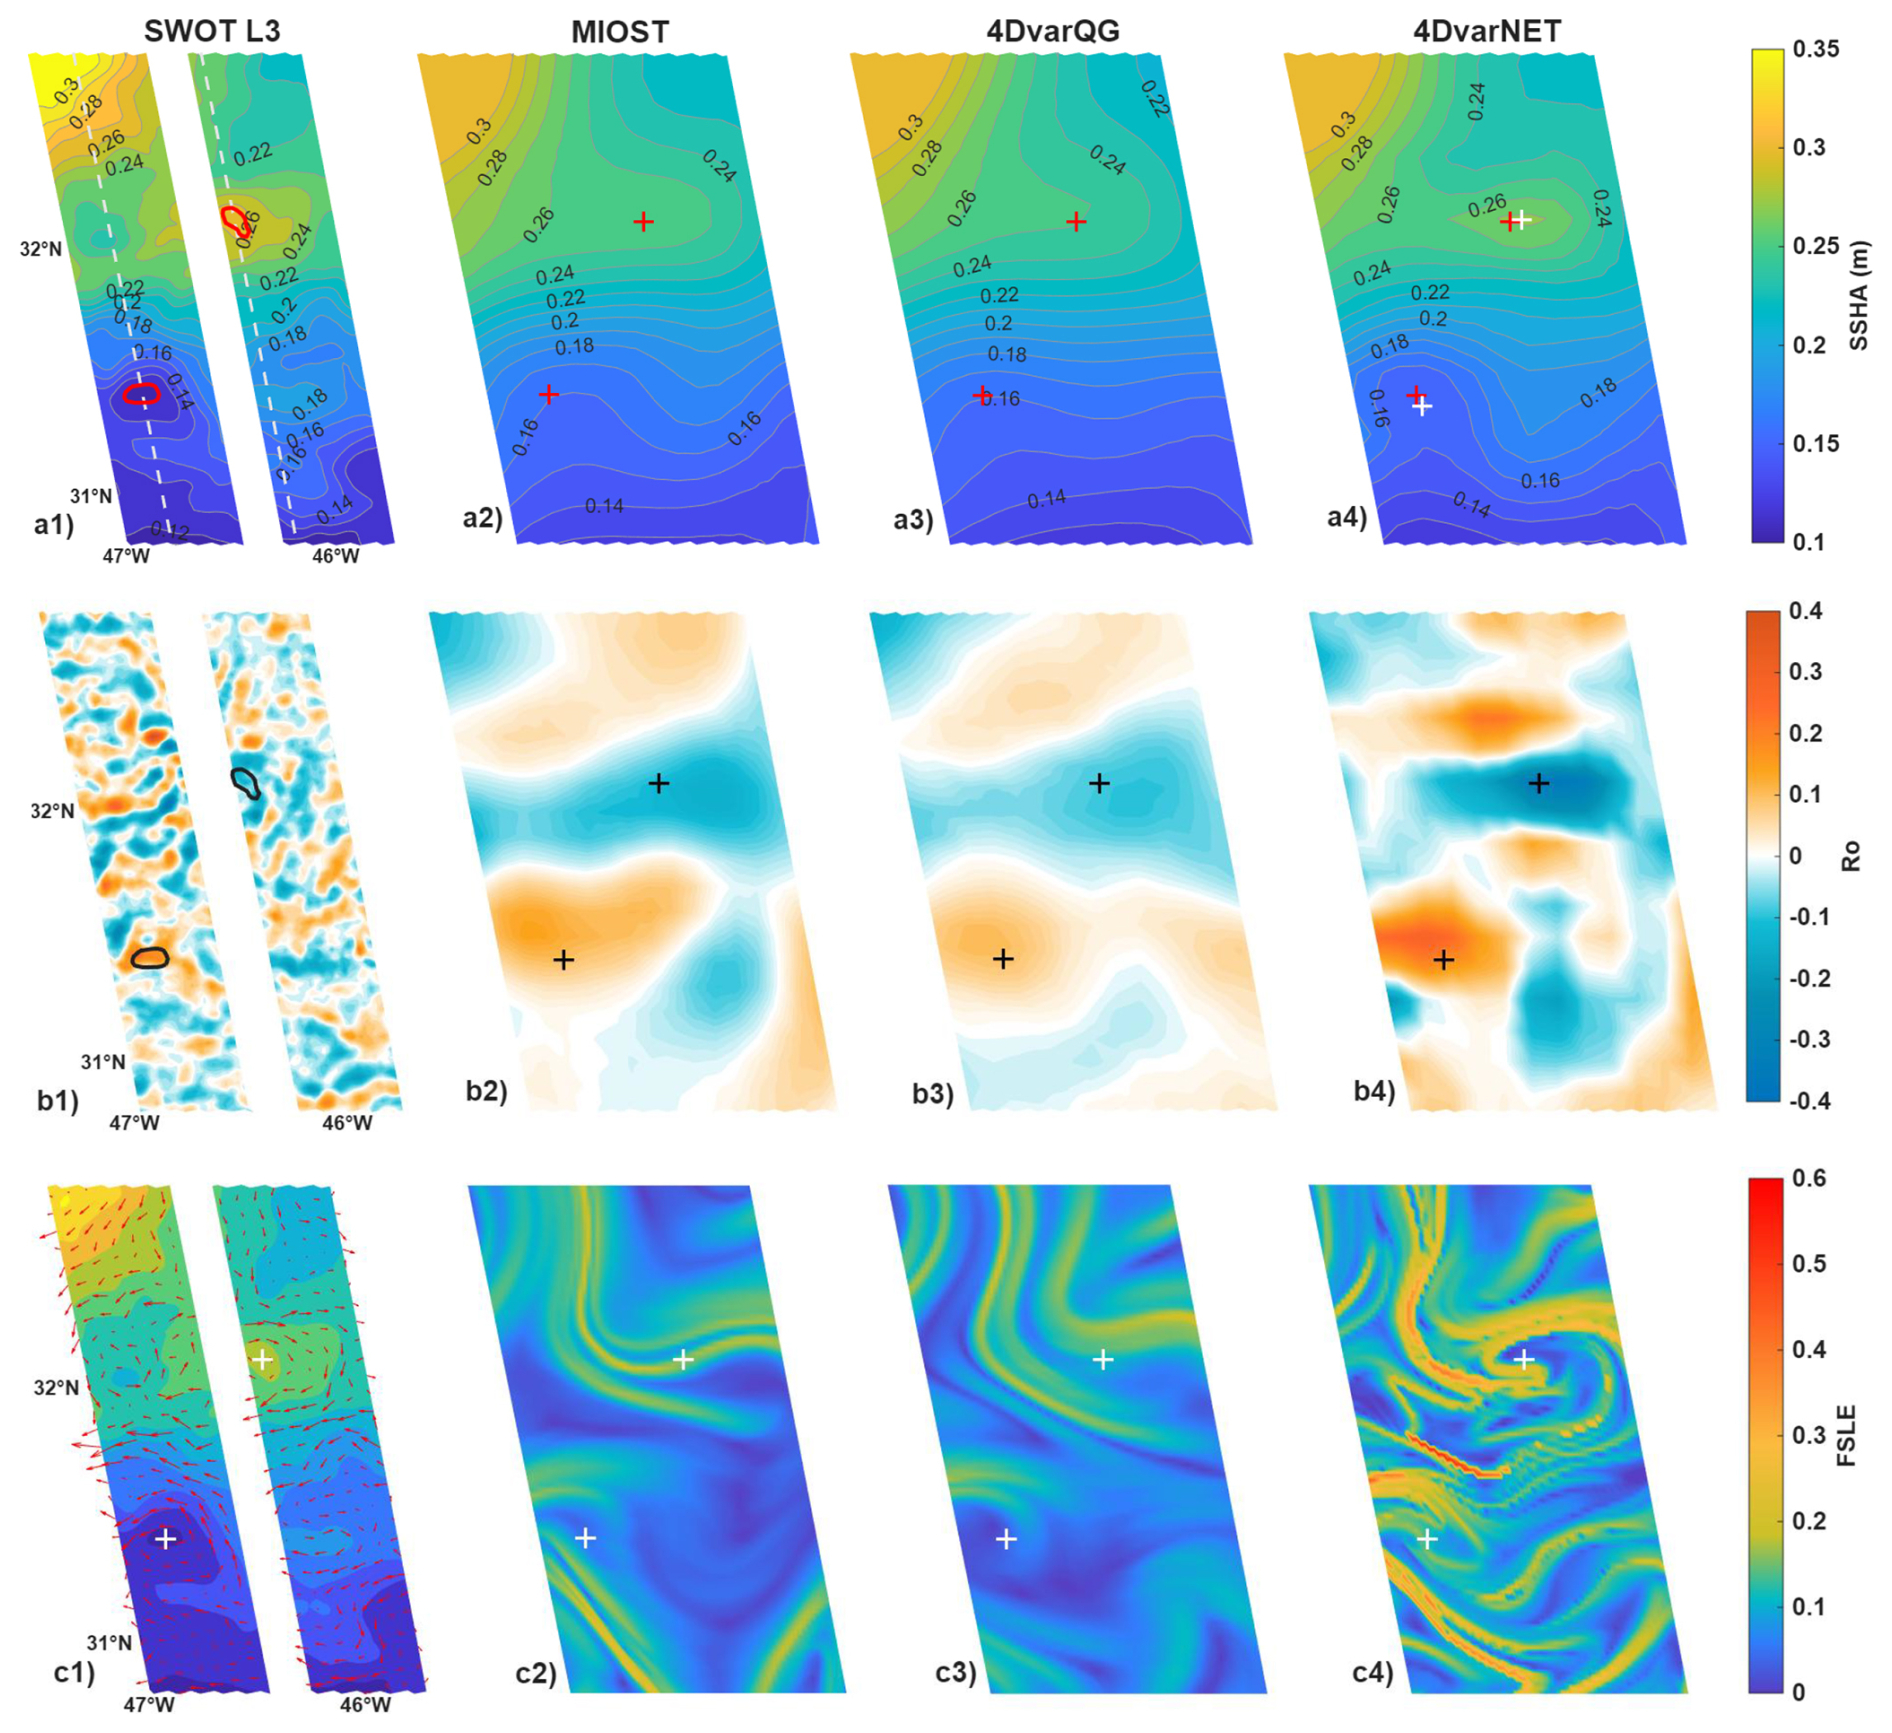
Figure 13Case 3 (SWOT L3 cycle 001, pass 324; 1 August 2023), presented with the same layout and diagnostics as Fig. 8.
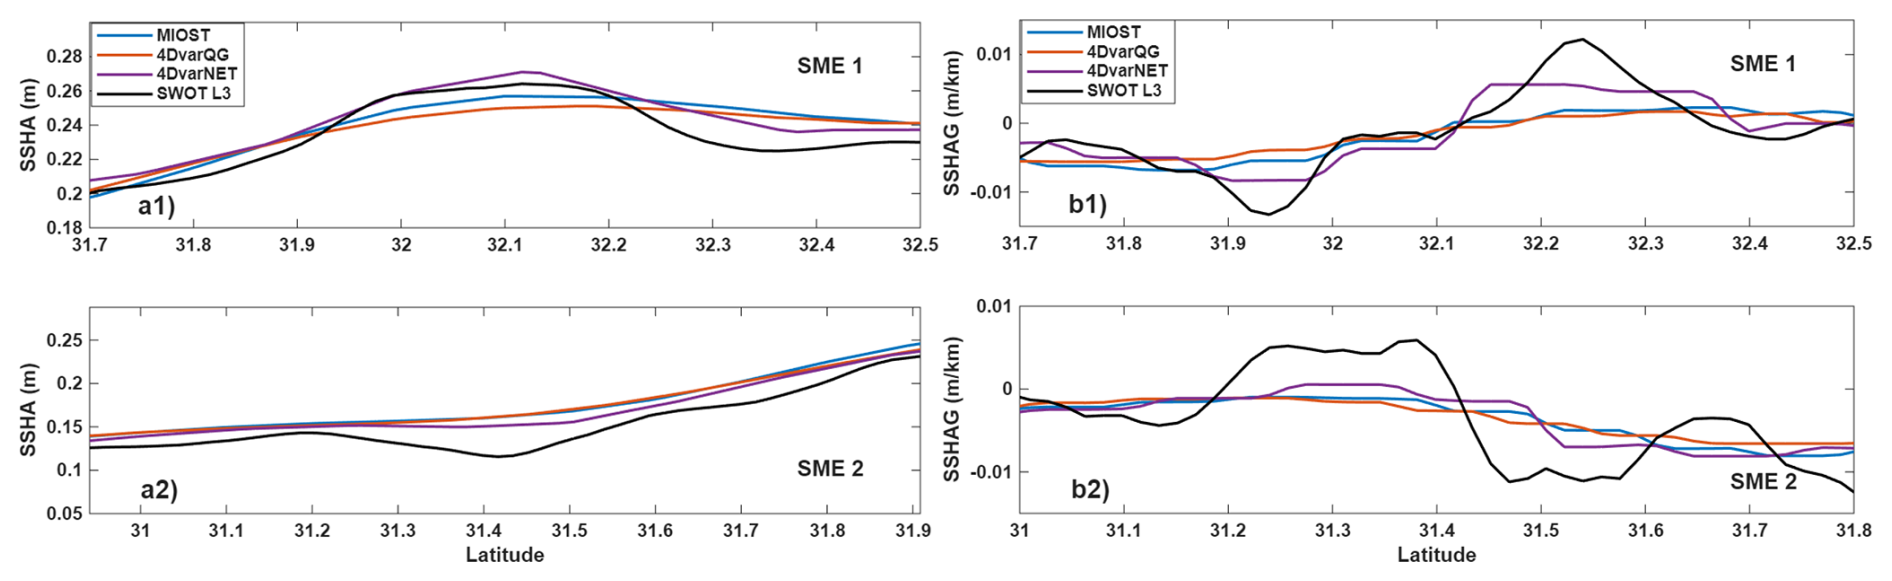
Figure 14Cross-sectional SSHA and gradient profiles across the eddy core in Case 3 (section indicated in Fig. 12a1), same as Fig. 9.
Table 2Eddy-core position error (°) and Ro at the eddy core for Case 3.
Overall, the three case studies reveal a clear scale-dependent transition in reconstruction behavior. Under strongly mesoscale-dominated conditions (Case 1), methodological differences are minimal, and quasi-geostrophic formulations produce geometrically consistent and dynamically balanced reconstructions, with only modest amplitude attenuation. In intermediate mesoscale–submesoscale regimes (Case 2), mesoscale constraints remain beneficial, but structural differences among approaches become increasingly evident, particularly in the representation of vorticity and strain organization. In flows dominated by weak, fine-scale variability (Case 3), methodological contrasts become pronounced. The nonlinear 4DvarNET framework exhibits enhanced sensitivity to submesoscale structures, whereas QG-constrained and reduced-space linear approaches increasingly smooth or filter these signals. However, this enhanced sensitivity can also generate spurious small-scale flow features that look realistic but are not supported by any validation data. Hence, dynamical inferences from this product should be avoided. MIOST provides comparatively stable reconstructions across scales, capturing large-scale patterns while moderately smoothing finer structures. Taken together, these results demonstrate that the relative performance of the three methods is intrinsically scale dependent and dynamically conditioned, providing a complementary dynamical perspective to the Eulerian and Lagrangian statistical diagnostics presented earlier.
This study provides a comprehensive evaluation of three experimental L4 products derived from merged SWOT observations, based on Eulerian mapping accuracy, Lagrangian trajectory prediction skill, and dynamical diagnostics derived from Rossby number (Ro) and FSLE statistics. Their performance is further examined through three representative case studies spanning distinct dynamical regimes.
Statistical evaluations indicate that 4DvarQG achieves the highest velocity reconstruction accuracy in the Gulf Stream region, reducing RMSE by approximately 4 %–5 % relative to the other products. It also improves short-term (0–4 d) Lagrangian trajectory prediction skill compared with 4DvarNET and MIOST. These results, validated against extensive drifter observations, suggest that physically constrained quasi-geostrophic formulations effectively enhance mesoscale-balanced reconstruction at the nominal ° resolution. Complementary strengths emerge in dynamical diagnostics. 4DvarNET exhibits systematically sharper SSHA gradients, larger magnitudes, and more intricate strain structures in the FSLE fields. These characteristics may indicate enhanced sensitivity to fine-scale variability, but they could equally reflect noise amplification or artifacts related to the training data or the assumed noise level; with the available SWOT L3 data alone, their physical realism cannot be determined. This manifests as a structural advantage in resolving weak submesoscale eddies, particularly in flow regimes where mesoscale constraints are relaxed. Conversely, 4DvarQG provides more geometrically consistent reconstructions of energetic mesoscale eddies, reflecting the stabilizing influence of quasi-geostrophic balance. MIOST maintains comparatively smooth and stable performance across all evaluations, providing reliable but moderate reconstructions without strongly favoring either extreme of the spatial scale spectrum.
The present results extend the findings of Ballarotta et al. (2025), who reported that SWOT observations systematically reduce SSH mapping errors and enhance effective resolution. By adding Lagrangian and dynamical diagnostics, this study demonstrates that improved Eulerian SSH reconstruction does not uniformly translate into superior Lagrangian skill or fine-scale representation – the benefits are regime-dependent and metric-specific. This finding aligns with Le Guillou et al. (2023), who showed that regional QG-based mapping improves mesoscale reconstruction in the Mediterranean Sea, and extends this conclusion to the Gulf Stream system and to the Lagrangian dimension.
From a methodological perspective, the observed performance differences can be understood in terms of the underlying assumptions and design choices of each approach. MIOST offers two principal advantages. First, its multiscale linear inversion framework explicitly represents multiple dynamical components within an extended state space, with each component represented in a reduced wavelet subspace with distinct covariance structures. This scale-dependent decomposition ensures robustness across diverse flow regimes, as it does not rely on regime-specific dynamical assumptions. However, the statistical separation among components does not explicitly account for dynamical interactions across scales, and cross-component coupling remains only implicitly represented through linear superposition. As a result, in strongly energetic environments such as the Gulf Stream, MIOST does not fully exploit quasi-geostrophic relationships, leading to systematically higher RMSE relative to 4DvarQG. Second, its reduced-basis representation facilitates computational efficiency and accommodates large spatio-temporal assimilation windows, making it well suited for operational and global applications. 4DvarQG significantly enhances mesoscale reconstruction within the quasi-geostrophic approximation. The strength of this approach in Region II is consistent with quasi-geostrophic dynamics, which provides an accurate description of mesoscale flows where the Rossby number is small and motions are predominantly balanced (Vallis, 2017). By imposing quasi-geostrophic dynamics as a weak constraint within a reduced-order state space, 4DvarQG strongly suppresses ageostrophic variability and maintains dynamical consistency, resulting in lower RMSE, improved short-term Lagrangian prediction skill, and more coherent mesoscale eddy geometries in energetic regimes. However, this inherent smoothing and the reliance on QG assumptions constrain its ability to resolve submesoscale motions, consistent with our observation that 4DvarQG suppresses fine-scale vorticity and strain variability in the weakly nonlinear open-ocean regime (Region III). Furthermore, the QG formulation limits applicability in low-latitude regions where geostrophic balance becomes less valid. In contrast, 4DvarNET leverages data-driven nonlinear representations learned from high-resolution NATL60 simulations to exploit the dense spatial sampling of SWOT wide-swath observations. As an end-to-end learned method, it optimizes the mapping operator directly against model outputs, which tends to preserve sharp gradients and fine-scale variance. This explains its systematically higher magnitudes, sharper SSHA gradients, and more intricate FSLE structures observed across regimes, as well as its enhanced sensitivity to weak submesoscale eddies in Case 3. However, because 4DvarNET does not incorporate explicit dynamical constraints, some of the intensified small-scale signals may reflect the amplification of observational noise or representativeness errors into high-vorticity features, rather than the faithful representation of dynamically driven submesoscale motions. This is particularly relevant in Region III, where the ∼ 60 % enhancement relative to MIOST and 4DvarQG occurs in a dynamically quiescent environment that would not typically sustain intense submesoscale activity. As additional wide-swath missions are deployed and training datasets expand, the performance of 4DvarNET may further improve. Nevertheless, the physical realism of its amplified small-scale structures requires validation against unfiltered SWOT Level-2 data or independent high-resolution in situ observations. Overall, these results suggest that the relative merits of the three approaches are intrinsically tied to the dynamical regime: QG-constrained methods excel in energetic mesoscale environments where the underlying assumptions hold, whereas data-driven methods offer greater sensitivity to fine-scale variability, at the potential cost of reduced dynamical consistency in regions where background gradients are weak. This trade-off between large-scale accuracy and fine-scale representation echoes broader discussions in the satellite altimetry community regarding the optimal balance between dynamical constraints and data-driven flexibility in next-generation mapping systems (Le Traon et al., 2025).
For users whose primary interest lies in obtaining reliable, well-characterized sea surface height or surface current fields – such as researchers in marine biology or marine geology who are not specialists in physical oceanography – MIOST is the most suitable choice. As the only global-coverage product among the three, it offers a distinct practical advantage, and its stable performance across dynamical regimes means that it introduces no extreme biases in any particular environment. For physical oceanographers investigating specific dynamical processes, the choice of product can be tailored to the regime and scale of interest. Studies focused on mesoscale ocean circulation, eddy tracking, or Lagrangian trajectory prediction in midlatitude energetic regions will benefit most from 4DvarQG, whose quasi-geostrophic constraints yield the highest Eulerian accuracy and the most skilful short-term Lagrangian forecasts. Conversely, investigations targeting fine-scale frontal structures, filaments, or submesoscale eddy detection may find 4DvarNET more informative, as it more closely reproduced the observed SSH gradient sharpness in Case 3. However, the physical realism of the enhanced strain organization produced by 4DvarNET cannot be assessed with the available validation data and should be interpreted with caution. In all cases, cross-comparing multiple products is encouraged to assess the sensitivity of the conclusions to the choice of mapping methodology.
Looking forward, the development of next-generation L4 SSH products may follow two complementary pathways. One emphasizes global applicability and operational robustness, for which multiscale linear frameworks such as MIOST provide reliable, user-oriented products, as demonstrated by DUACS in November 2025. The other emphasizes targeted reconstruction of specific dynamical processes, for which hybrid methodologies integrating neural networks with physically based constraints may hold longer-term methodological potential, rather than a demonstrated advantage based on the present results. By combining data-driven sensitivity to fine-scale variability with explicit dynamical regularization, such approaches could enable physically consistent, high-resolution reconstruction of specialized processes, including internal waves and submesoscale dynamics. Overall, this study demonstrates that the relative strengths of current SWOT-assimilating L4 approaches are intrinsically scale dependent and dynamically conditioned. A balanced integration of physical constraints and data-driven adaptability therefore represents a critical direction for future ocean surface topography mapping systems.
All the data sets used in this study are publicly accessible and listed here. Global ocean gridded L4 sea surface heights and derived variables reprocessed 1993 ongoing: https://doi.org/10.48670/moi-00148 (E.U. Copernicus Marine Service Information, 2024b). Global ocean-in-situ near real time observations of ocean currents: https://doi.org/10.48670/moi-00041 (E.U. Copernicus Marine Service Information, 2024a). SWOT Level-3 ocean products: https://doi.org/10.24400/527896/A01-2023.017 (AVISO/DUACS, 2024b). Experimental multimission gridded level-4 sea level heights and velocities with SWOT: https://doi.org/10.24400/527896/A01-2024.007 (AVISO/DUACS, 2024a). SWOT Level-3 (L3) expert SSH data (https://doi.org/10.24400/527896/A01-2023.018, AVISO/DUACS, 2025).
Qifan Wu served as the primary author, leading the investigation, performing the experiments, and preparing the original draft, including visualization. Chaojie Zhou (Corresponding author) contributed to conceptualization, methodology, supervision, funding acquisition, and review/editing. Bijin Liu, Wei Wu, Jianlong Li and Jungang Yang contributed to conceptualization, project administration, and review/editing. All authors approved the final manuscript.
The contact author has declared that none of the authors has any competing interests.
Publisher's note: Copernicus Publications remains neutral with regard to jurisdictional claims made in the text, published maps, institutional affiliations, or any other geographical representation in this paper. The authors bear the ultimate responsibility for providing appropriate place names. Views expressed in the text are those of the authors and do not necessarily reflect the views of the publisher.
This research has been supported by the National Natural Science Foundation of China (grant no. 62231028), the Project of Sanya Yazhou Bay Science and Technology City (grant no. SKJC-JYRC-2024-71), and the Hainan Provincial Natural Science Foundation of China (grant no. 422RC742).
This paper was edited by Karen J. Heywood and reviewed by two anonymous referees.
Archer, M., Wang, J., Klein, P., Dibarboure, G., and Fu, L. L.: Wide-swath satellite altimetry unveils global submesoscale ocean dynamics, Nature, 640, 691–696, https://doi.org/10.1038/s41586-025-08722-8, 2025.
AVISO/DUACS: SSALTO/DUACS Experimental Product Handbook Gridded Sea Level Heights and geostrophic velocities computed with SWOT Level-3 products (using both KaRIn and nadir instruments) (v1.0), CNES [data set], https://doi.org/10.24400/527896/A01-2024.007, 2024a.
AVISO/DUACS: SWOT L3_LR_SSH_Basic, SWOT Level-3 KaRIn Low Rate SSH Basic (v3.0), CNES [data set], https://doi.org/10.24400/527896/A01-2023.017, 2024b.
AVISO/DUACS: SWOT level‐3 KaRIn low rate SSH expert (V2.0.1), CNES [data set], https://doi.org/10.24400/527896/A01-2023.018, 2025.
Ballarotta, M., Ubelmann, C., Pujol, M.-I., Taburet, G., Fournier, F., Legeais, J.-F., Faugère, Y., Delepoulle, A., Chelton, D., Dibarboure, G., and Picot, N.: On the resolutions of ocean altimetry maps, Ocean Sci., 15, 1091–1109, https://doi.org/10.5194/os-15-1091-2019, 2019.
Ballarotta, M., Ubelmann, C., Rogé, M., Fournier, F., Faugère, Y., Dibarboure, G., Morrow, R., and Picot, N.: Dynamic Mapping of Along-Track Ocean Altimetry: Performance from Real Observations, J. Atmos. Ocean. Tech., 37, 1593–1601, https://doi.org/10.1175/JTECH-D-20-0030.1, 2020.
Ballarotta, M., Ubelmann, C., Bellemin-Laponnaz, V., Le Guillou, F., Meda, G., Anadon, C., Laloue, A., Delepoulle, A., Faugère, Y., Pujol, M.-I., Fablet, R., and Dibarboure, G.: Integrating wide-swath altimetry data into Level-4 multi-mission maps, Ocean Sci., 21, 63–80, https://doi.org/10.5194/os-21-63-2025, 2025.
Beauchamp, M., Febvre, Q., Georgenthum, H., and Fablet, R.: 4DVarNet-SSH: end-to-end learning of variational interpolation schemes for nadir and wide-swath satellite altimetry, Geosci. Model Dev., 16, 2119–2147, https://doi.org/10.5194/gmd-16-2119-2023, 2023.
Bellemin-Laponnaz, V., Le Guillou, F., Clément, U., Eric, B., and Cosme, E.: A variational method for reconstructing and separating balanced motions and internal tides from wide-swath altimetric sea surface height observations, Authorea [preprint], https://doi.org/10.22541/essoar.175455107.74338212/v1, 2025.
Carli, E., Tranchant, Y.-T., Siegelman, L., Le Guillou, F., Morrow, R., Ballarotta, M., and Vergara, O.: Southern ocean 3D eddy diagnostics derived from SWOT, J. Geophys. Res.-Oceans, 130, e2024JC022307, https://doi.org/10.1029/2024JC022307, 2025.
Coadou‐Chaventon, S., Swart, S., Novelli, G., and Speich, S.: Resolving sharper fronts of the Agulhas Current Retroflection using SWOT altimetry, Geophys. Res. Lett., 52, e2025GL115203, https://doi.org/10.1029/2025GL115203, 2025.
Dong, C., McWilliams, J. C., Liu, Y., and Chen, D.: Global heat and salt transports by eddy movement, Nat. Commun., 5, 3294, https://doi.org/10.1038/ncomms4294, 2014.
d'Ovidio, F., Fernández, V., Hernández‐García, E., and López, C.: Mixing structures in the Mediterranean Sea from finite‐size Lyapunov exponents, Geophys. Res. Lett., 31, https://doi.org/10.1029/2004GL020328, 2004.
E.U. Copernicus Marine Service Information: Global Ocean gridded L4 sea surface heights and derived variables nrt, E.U. Copernicus Marine Service Information (CMEMS) [data set], https://doi.org/10.48670/moi-00041, 2024a.
E.U. Copernicus Marine Service Information: Global Ocean Gridded L 4 Sea Surface Heights And Derived Variables Reprocessed 1993 Ongoing, E.U. Copernicus Marine Service Information [data set], https://doi.org/10.48670/moi-00148, 2024b.
E.U. Copernicus Marine Service Information: Global Ocean gridded L4 sea surface heights and derived variables nrt, E.U. Copernicus Marine Service Information (CMEMS) [data set], https://doi.org/10.48670/moi-00149, 2025.
Fablet, R., Beauchamp, M., Drumetz, L., and Rousseau, F.: Joint interpolation and representation learning for irregularly sampled satellite-derived geophysical fields, Front. Appl. Math. Stat., 7, 655224, https://doi.org/10.3389/fams.2021.655224, 2021.
Fouchet, E., Benkiran, M., Le Traon, P. Y., and Remy, E.: Comparison of a global high-resolution ocean data assimilation system with SWOT observations, Front. Mar. Sci., 12, 1563934, https://doi.org/10.3389/fmars.2025.1563934, 2025.
Fu, L. L., Pavelsky, T., Cretaux, J. F., Morrow, R., Farrar, J. T., Vaze, P., Sengenes, P., Vinogradova-Shiffer, N., Sylvestre-Baron, A., Picot, N., and Dibarboure, G.: The surface water and ocean topography mission: A breakthrough in radar remote sensing of the ocean and land surface water, Geophys. Res. Lett., 51, e2023GL107652, https://doi.org/10.1029/2023GL107652, 2024.
Gaultier, L., Verron, J., Brankart, J. M., Titaud, O., and Brasseur, P.: On the inversion of submesoscale tracer fields to estimate the surface ocean circulation, J. Mar. Syst., 126, 33–42, https://doi.org/10.1016/j.jmarsys.2012.02.014, 2013.
Jing, Z., Fox-Kemper, B., Cao, H., Zheng, R., and Du, Y.: Submesoscale fronts and their dynamical processes associated with symmetric instability in the northwest Pacific subtropical ocean, J. Phys. Oceanogr., 51, 83–100, https://doi.org/10.1175/JPO-D-20-0076.1, 2021.
Lacorata, G., Aurell, E., and Vulpiani, A.: Drifter dispersion in the Adriatic Sea: Lagrangian data and chaotic model, Ann. Geophys., 19, 121–129, https://doi.org/10.5194/angeo-19-121-2001, 2001.
Le Guillou, F., Gaultier, L., Ballarotta, M., Metref, S., Ubelmann, C., Cosme, E., and Rio, M.-H.: Regional mapping of energetic short mesoscale ocean dynamics from altimetry: performances from real observations, Ocean Sci., 19, 1517–1527, https://doi.org/10.5194/os-19-1517-2023, 2023.
Le Guillou, F., Chapron, B., and Rio, M.‐H.: VarDyn: Dynamical joint‐reconstructions of sea surface height and temperature from multi‐sensor satellite observations, J. Adv. Model. Earth Sy., 17, e2024MS004689, https://doi.org/10.1029/2024MS004689, 2025.
Le Traon, P.-Y., Dibarboure, G., Lellouche, J.-M., Pujol, M.-I., Benkiran, M., Drevillon, M., Drillet, Y., Faugère, Y., and Remy, E.: Satellite altimetry and operational oceanography: from Jason-1 to SWOT, Ocean Sci., 21, 1329–1347, https://doi.org/10.5194/os-21-1329-2025, 2025.
McWilliams, J. C.: Submesoscale currents in the ocean, P. Roy. Soc. A, 472, 20160117, https://doi.org/10.1098/rspa.2016.0117, 2016.
Tang, Q., Gulick, S. P., Sun, J., Sun, L., and Jing, Z.: Submesoscale features and turbulent mixing of an oblique anticyclonic eddy in the Gulf of Alaska investigated by marine seismic survey data, J. Geophys. Res.-Oceans, 125, e2019JC015393, https://doi.org/10.1029/2019JC015393, 2020.
Thomas, L. N., Tandon, A., and Mahadevan, A.: Submesoscale processes and dynamics, in Ocean Modeling in an Eddying Regime, edited by: Hecht, M. W. and Hasumi, H., https://doi.org/10.1029/177GM04, 2008.
Titaud, O., Brankart, J. M., and Verron, J.: On the use of finite-time Lyapunov exponents and vectors for direct assimilation of tracer images into ocean models, Tellus A, 63, 1038–1051, https://doi.org/10.1111/j.1600-0870.2011.00533.x, 2011.
Tranchant, Y. T., Legresy, B., Foppert, A., Pena-Molino, B., and Phillips, H.: SWOT reveals fine-scale balanced motions driving near-surface currents and dispersion in the Antarctic Circumpolar Current, Earth Space Sci., 12, e2025EA004248, https://doi.org/10.1029/2025EA004248, 2025.
Ubelmann, C., Dibarboure, G., Gaultier, L., Ponte, A., Ardhuin, F., Ballarotta, M., and Faugère, Y.: Reconstructing ocean surface current combining altimetry and future spaceborne Doppler data, J. Geophys. Res.-Oceans, 126, e2020JC016560, https://doi.org/10.1029/2020JC016560, 2021.
Ubelmann, C., Carrere, L., Durand, C., Dibarboure, G., Faugère, Y., Ballarotta, M., Briol, F., and Lyard, F.: Simultaneous estimation of ocean mesoscale and coherent internal tide sea surface height signatures from the global altimetry record, Ocean Sci., 18, 469–481, https://doi.org/10.5194/os-18-469-2022, 2022.
Vallis, G. K.: Atmospheric and oceanic fluid dynamics, Cambridge University Press, https://doi.org/10.1017/9781107588417, 2017.
Vaze, P., Kaki, S., Limonadi, D., Esteban-Fernandez, D., and Zohar, G.: The surface water and ocean topography mission, in: 2018 IEEE Aerospace Conference, IEEE, https://doi.org/10.1109/AERO.2018.8396504, 2018.
Wang, J., Lucas, A. J., Stalin, S., Lankhorst, M., Send, U., Schofield, O., Kachelein, L., Haines, B., Meinig, C., Pinkel, R., Farrar, J. T., and Fu, L. L.: SWOT mission validation of sea surface height measurements at sub‐100 km scales, Geophys. Res. Lett., 52, e2025GL114936, https://doi.org/10.1029/2025GL114936, 2025.
Yang, Q., Zhao, W., Liang, X., Dong, J., and Tian, J.: Elevated mixing in the periphery of mesoscale eddies in the South China Sea, J. Phys. Oceanogr., 47, 895–907, https://doi.org/10.1175/JPO-D-16-0256.1, 2017.
Zhang, X. and Callies, J.: Assessing submesoscale sea surface height signals from the SWOT mission, J. Geophys. Res.-Oceans, 130, e2025JC022879, https://doi.org/10.1029/2025JC022879, 2025.
Zhang, Z., Miao, M., Qiu, B., Tian, J., Jing, Z., Chen, G., and Zhao, W.: Submesoscale eddies detected by SWOT and moored observations in the Northwestern Pacific, Geophys. Res. Lett., 51, e2024GL110000, https://doi.org/10.1029/2024GL110000, 2024.
- Abstract
- Introduction
- Data
- Performance validation using drifter data: Eulerian mapping accuracy and Lagrangian predictability
- Representation of Submesoscale-to-Mesoscale Dynamic Structures
- Conclusion and Discussion
- Data availability
- Author contributions
- Competing interests
- Disclaimer
- Financial support
- Review statement
- References
- Abstract
- Introduction
- Data
- Performance validation using drifter data: Eulerian mapping accuracy and Lagrangian predictability
- Representation of Submesoscale-to-Mesoscale Dynamic Structures
- Conclusion and Discussion
- Data availability
- Author contributions
- Competing interests
- Disclaimer
- Financial support
- Review statement
- References