
the Creative Commons Attribution 4.0 License.
the Creative Commons Attribution 4.0 License.
 | 14 Sep 2026
Evaluation of a coupled regional reanalysis for the Mediterranean region covering the period 1993–2024

Vincenzo de Toma
Regional reanalyses provide physically consistent reconstructions of past climate, offering a powerful tool for understanding the processes that shape regional responses to climate change. Here, we introduce MESMAR-R (Mediterranean Earth System Model at ISMAR – Reanalysis), a newly developed coupled atmosphere-ocean-hydrology reanalysis for the Mediterranean region. The system couples state-of-the-art numerical models with data assimilation in both the ocean and the atmosphere, producing a dynamically coherent reconstruction of the 1993–2024 period. MESMAR-R shows strong performance in the ocean, particularly for sea level, sea-surface salinity, and upper-layer temperature, confirming its skill in the most relevant layers for air–sea interactions. The atmospheric component performs reasonably well given its simplified assimilation based on three-dimensional scale-selective nudging, yielding basin-scale fields comparable to state-of-the-art reanalyses and maintaining internally consistent coupled air–sea interactions. Sensitivity experiments show that data assimilation in both the ocean and atmosphere is essential for optimal performance: coupling alone does not necessarily improve reanalysis skill, but its benefits are relevant for salinity and surface fluxes and amplify when complemented by data assimilation. The ocean and atmospheric trends reconstructed by MESMAR-R are physically coherent and consistent with observations, reproducing basin-wide salinification, thermo-halo compensation in steric sea level, mass-driven sea-level rise, and pronounced near-surface atmospheric warming and drying. MESMAR-R therefore provides a unique, balanced reconstruction of past Mediterranean climate, suitable for investigating coupled air–sea processes, compound events, marine extremes, and other phenomena where dynamically consistent atmosphere-ocean interactions are essential.
- Article
(10809 KB) - Full-text XML
- BibTeX
- EndNote


Reanalysis datasets provide temporally and spatially continuous representations of the Earth system, or any of its components, by combining numerical model simulations with historical observations through data assimilation techniques (e.g., Storto et al., 2019a). These datasets are essential for climate monitoring, model validation, and understanding past climate variability. While global reanalyses, such as ERA5 (Hersbach et al., 2020) and MERRA-2 (Gelaro et al., 2017) in the atmosphere or GREP (Storto et al., 2019b) in the ocean, offer broad coverage, their limited horizontal resolution may hinder their ability to accurately represent mesoscale processes, especially in regions with complex geography such as the Mediterranean, which is the focus of the present study. The Mediterranean basin is widely recognized as a climate change hotspot, experiencing rates of warming exceeding the global average and undergoing rapid changes in hydro-climatic extremes (Cramer et al., 2018; Lionello and Scarascia, 2018). Projected increases in temperature, decreases in precipitation, and enhanced variability in oceanographic and atmospheric conditions pose serious challenges for ecosystems, water resources, and human activities across the region.
In contrast to global products, high-resolution regional climate models (RCMs) have been developed to dynamically downscale global reanalyses and provide a refined depiction of climate processes at local to regional scales (e.g., Ruti et al., 2016). These regional reanalyses are particularly important in areas with significant land-sea contrasts, steep topography, and densely populated coastal zones, where the impact of climate extremes can be severe (e.g., Senatore et al., 2020; Fox-Hughes et al., 2022).
The importance of regional reanalyses is testified by their increasing development and adoption. The Copernicus Marine Service provides a Mediterranean ocean reanalysis (e.g., Escudier et al., 2021), while the Copernicus Climate Service has developed European-scale regional atmospheric reanalyses (e.g., CERRA; Ridal et al., 2024). However, to date, most available products are either uncoupled or limited to single components: ocean-only or atmosphere-only. Furthermore, some downscaled reanalyses lack any form of data assimilation, limiting their utility for monitoring and decision-making. Regional coupled reanalyses over the Mediterranean Sea are expected to become critically important for climate services and downstream applications because they provide a physically consistent, high-resolution reconstruction of the complex air–sea–land interactions, enabling improved assessment of marine heatwaves (e.g., Camus et al., 2021), storm surge and coastal flooding risks (e.g., Juza et al., 2022), which directly support sectors like fisheries management, renewable energy planning, and coastal adaptation strategies (e.g., Soukissian et al., 2021). Furthermore, regional coupled reanalyses will be increasingly vital for training deep-learning emulators (Doury et al., 2023) because they offer high-resolution, physically consistent input-output datasets that capture air–sea–land feedback, enabling efficient and accurate surrogate modeling of regional climate processes for applications such as bias correction, super-resolution downscaling, and rapid scenario exploration (e.g., van der Meer et al., 2023).
Coupled reanalysis systems, which combine ocean and atmosphere models with concurrent assimilation, offer a more physically consistent reconstruction of the Earth system by representing feedback across components. While global coupled reanalyses such as CERA-20C (Laloyaux et al., 2018) have demonstrated the value of this approach, no such product has been available at the regional scale for the Mediterranean. Recent studies highlight the potential of coupled regional systems to improve the representation of events like medicanes (Storto et al., 2023a).
To fill this gap, we present a new high-resolution regional coupled reanalysis for the Mediterranean Sea over the period 1993–2024, with an approximately 15 km atmospheric grid and an approximately 7 km ocean grid with 72 vertical levels. The system is based on the MESMAR (Mediterranean Earth System Model at ISMAR) coupled model configuration (Storto et al., 2023a), which integrates the WRF atmospheric model and the NEMO ocean model, with interactive river runoff and land surface modelling components. Ocean data assimilation is implemented via a 3D variational (3DVAR) scheme, while the atmosphere is constrained at the large scale, through spectral nudging, toward ERA5. The configuration thus ensures that large-scale consistency with global reanalyses is preserved while allowing the model to resolve regional-scale features (Storto et al., 2023a). The system assimilates in-situ and satellite observations in the ocean, providing a dynamically consistent estimate of the Mediterranean climate state across the atmosphere and ocean components.
This paper introduces the dataset (Sect. 2) and presents a first evaluation against many observational datasets (in Sect. 3). Additionally, comparisons with existing regional and global reanalyses provided by Copernicus Marine and Climate Services are included for selected metrics, together with an analysis of sensitivity experiments (Sect. 4) and key climatic trends (Sect. 5). The coupled nature of this reanalysis and the inclusion of data assimilation in both ocean and atmosphere, although the latter as large-scale constraint, represent a significant advancement in regional Earth system reanalyses for the Mediterranean region.
2.1 Earth system model configuration
The MESMAR modeling system couples three components: an atmosphere (WRF), ocean (NEMO), and hydrology (HD) models, via the OASIS3-MCT coupler, and it is described in detail in Storto et al. (2023a). The atmospheric core is WRF (v4.3.3, Skamarock et al., 2021), implemented over the Euro-Mediterranean domain (∼15 km horizontal grid, 41 hybrid vertical levels). WRF is a non-hydrostatic model with a 60 s timestep. Physics options include Thompson microphysics, RRTMG radiation, the Noah-MP land surface model (4 soil layers), the Mellor-Yamada (Nakanishi and Niino, 2006), PBL closure, and the Grell–Freitas cumulus scheme for subgrid convection. Lateral atmospheric forcing is provided via a 10-point sponge layer relaxing toward three-hourly ERA5 reanalysis fields (Hersbach et al., 2020).
The ocean component is NEMO (v4.0.7, Madec and the NEMO System Team, 2017) covering the Mediterranean (Atlantic box to Dardanelles) on a regular ∼7 km grid with 72 vertical levels (with partial steps at bottom). The NEMO baroclinic timestep is 450 s, while the barotropic timestep is 6s, with the split-explicit free-surface formulation. Shortwave radiation follows a three-band scheme (Morel and Maritorena, 2001) using monthly satellite chlorophyll data (Brewin et al., 2015). Horizontal mixing uses a Laplacian diffusion (viscosity via bi-Laplacian) with coefficients ∼80 m2 s−1 (4.5×10⁹ m4 s−3), increased by 20 % near Gibraltar and the Aegean. Vertical mixing is handled by a General Length Scale (GLS) scheme (Mellor and Yamada, 1982; closure with Canuto et al., 2001, stability). Ocean boundaries are forced by the ECMWF ORAS5 reanalysis (Zuo et al., 2019) with Flather barotropic conditions and prescribed baroclinic velocities, and a 10-point relaxation of temperature and salinity toward ORAS5 fields. River discharge from the HD model is injected at coastlines; the Black Sea (Dardanelles) outflow uses climatology (Kourafalou and Barbopoulos, 2003). No additional basin-wide volume-restoration term is imposed, thus Mediterranean volume changes arise from the split-explicit free-surface equation, the net surface freshwater flux, river input, and the net transport through the open boundaries. The astronomical tidal forcing is not included in the present NEMO configuration.
Interactive rivers are provided by the hydrological discharge model (HD v5.1, Hagemann and Ho-Hagemann, 2021). HD is based on the MPI hydrology scheme (MPI-HM; Hagemann and Dümenil Gates, 2001) with specialized developments for coupling. It runs at 0.5° resolution over Europe, with a 30 min timestep. To improve stability, HD implements a conservative smoothing of river outflow: each discharge is spread to a 5×5 grid around the target ocean point. HD collects surface and subsurface runoff from WRF, and routes it to NEMO coastal points via the coupler.
The coupling between the models is handled by OASIS3-MCT (v5.0, Craig et al., 2017). All exchanged fields are mapped with first-order conservative interpolation, at 30 min intervals. Key coupling variables include surface fluxes of momentum, heat, and freshwater (computed in WRF using the Janjić surface scheme), sea surface temperature (SST) and salinity (SSS) from NEMO, surface pressure from WRF (for inverse-barometer correction), and river discharge from HD to NEMO. Thus, air–sea fluxes are generated in the atmosphere and passed to the ocean, while SST and currents and atmospheric pressure influence the atmosphere and ocean, respectively, and runoff links hydrology and ocean. Air–sea momentum, heat, and freshwater fluxes are indeed computed in WRF to ensure consistency with its surface-layer formulation, PBL closure, and implicit vertical turbulent-diffusion scheme. The shorter atmospheric timestep also better resolves rapid boundary-layer and diurnal adjustments; fluxes are then accumulated over the coupling interval and conservatively remapped to NEMO. Computing them on the finer ocean grid would instead require interpolation of the atmospheric state and a separate bulk formulation, without adding atmospheric information. Temporally synchronized atmospheric fluxes also reduce coupling-splitting and solar-radiation phase errors (Marti et al., 2021; Schüller et al., 2025).
2.2 Data assimilation
MESMAR-R employs a weakly coupled data assimilation system; details of the formulation are provided in Appendix A, while here we summarize the main features. The ocean uses a 3DVAR scheme (Storto et al., 2018) updated every 3 d. Background-error covariances are derived from multi-year monthly mean anomalies with respect to the long-term climatology (1998–2021), from a previous iteration of the coupled reanalysis. Observations include subsurface profiles (XBT, CTD, moored instruments, Argo/glider floats) from the UK Met Office EN4 dataset (Good et al., 2013), with variational quality control enabled (Storto, 2016), and along-track altimetry data from CMEMS (Pujol et al., 2023), after the standard geophysical and tidal corrections, assimilated with a dynamic height observation operator (Storto et al., 2011) and the latest Mediterranean Sea Mean Dynamic Topography (MDT) from the Copernicus Marine Service (Jousset et al., 2026). A weak surface relaxation of SST and SSS is applied toward reference analyses (CNR-ISMAR SST and EN4 SSS), with e-folding times of ∼15 d (SST) and 300 d (SSS). Additionally, a large-scale bias correction scheme, as in Storto and Yang (2024), is applied to minimize drifts in the deep ocean layers.
Atmospheric assimilation is achieved by spectral nudging in the WRF model. Using spectral nudging is appropriate for a 32-year coupled downscaling because it provides a computationally affordable and temporally homogeneous large-scale constraint from ERA5, while allowing atmospheric small scales to evolve according to the regional model dynamics, physics, and air–sea feedbacks. Nudging also avoids the need for a full observation collection and re-processing, which is extremely demanding for a long reanalysis exercise. Large-scale (synoptic) components of wind, temperature, and humidity are continuously relaxed toward three-hourly ECMWF ERA5 fields. Scales longer than ∼850 km (wavenumbers ≤ 6 zonally and ≤5 meridionally) are constrained, with nudging timescales of order 1 h for winds and temperature, and 1 d for humidity. This approach maintains large-scale consistency with the ERA5 reanalysis (Hersbach et al., 2020), while mesoscale features can develop freely (in both the atmosphere and the ocean, like medicanes, see Storto et al., 2023a). Tests with the MESMAR configuration showed that spectral nudging better retained the effective regional resolution than full-field nudging and provided improved coupled ocean and medicane behavior (Storto et al., 2023a).
2.3 Changes with respect to the pilot version
The MESMAR-R reanalysis is an improved version compared to a first, unpublished, iteration (covering the period 1998–2022), with a few upgrades that mostly concern the ocean component. Besides the temporal extension, the present version now includes (i) the assimilation of altimetry data in the ocean data assimilation system; (ii) a different set of background-error covariances, calculated from the long-term mean anomalies of the previous reanalysis iteration, thus better representing the error structures of the coupled reanalysis and leading to better verification skill scores; (iii) a deep-ocean large-scale bias correction scheme. Additionally, the NEMO model now uses XIOS 2.5 (Yepes-Arbós et al., 2022) for input/output operations, permitting a more flexible choice of ocean output fields.
2.4 Experiments
In addition to the nominal reanalysis setup (MESMAR-R), covering the 32 years from 1993 to 2024, we have also performed a few other sensitivity experiments, mostly devoted to understanding the relative impact of data assimilation and coupling for the enhancement of the reanalysis skill scores and key processes, with emphasis on the ocean component of the coupled reanalysis. Experiments are summarized in Table 1, and are all run for the shorter period from 2000 to 2020.
We performed a set of experiments switching on/off the data assimilation in both components and the coupling to the atmosphere. Such a set allows us to disentangle the effects of ocean data assimilation or atmosphere relaxation and the coupling, on key oceanic skill scores and metrics that will be introduced in Sect. 4. Note that, in UOS and UOA, the atmospheric forcing is not interactive and provided by the ERA5 reanalysis, meaning that it differs from COS and COA experiments not only by the coupling on/off, but also by the underlying atmospheric forcing source, and the bulk flux formulation.
2.5 Verification data and methods
Several datasets were used for verifying the reanalysis against. We used in particular:
- i.
Gridded sea surface temperature, salinity, and sea level (absolute dynamic topography, ADT) data from the Copernicus Marine Service (L4 ADT, Ballarotta et al., 2023, from which also EKE is calculated; L4 SST, Pisano et al., 2016; L4 SSS, Sammartino et al., 2022).
- ii.
In-situ profiles extracted from the UK MetOffice EN4 dataset (Good et al., 2013).
- iii.
e-OBS gridded near-surface atmospheric variables from the Copernicus Climate Change Service (Haylock et al., 2008). Here, we used monthly means from version 30.0e at 0.1° of spatial resolution, and all model data were compared to e-OBS after interpolation onto the e-OBS native grid.
- iv.
Mixed layer depth (MLD) data from the SeaDataCloud (SDC_MED_DP1).
- v.
Ocean heat content from the Copernicus Marine Service Ocean Monitor Indicator (von Schuckmann et al., 2018).
- vi.
Precipitation over ocean from the Global Precipitation Climatology Project (GPCP, Adler et al., 2003); note that, while e-OBS provide near-surface atmospheric variables over land only, verification of precipitation is seamless over land and ocean because of the joint use of e-OBS and GPCP.
Some of these datasets are not independent, strictly speaking, as they are assimilated into the system. However, we use lower-frequency based metrics for SST, SSH, and SLA validation (monthly), while for in-situ profiles, statistics are computed from innovation data before the assimilation of the observations. RMSEs in Sect. 3 are calculated from the daily mean fields; for altimetry, given the fact that each product may use different MDTs, the long-term mean SSH from each experiment is subtracted, meaning in facts that RMSE corresponds to the standard deviation of the innovations.
As reference datasets to compare skill score metrics, we used the Mediterranean Sea ocean reanalysis MEDREA24 (Escudier et al., 2021) and the Mercator Ocean International global ocean reanalysis GLORYS12 (Lellouche et al., 2021) for the ocean component, and the ECMWF ERA5 reanalysis (Hersbach et al., 2020) and CERRA (Ridal et al., 2024) for the atmosphere. All these reanalyses represent state-of-the-science systems, either with global or regional focus.
Note that MEDREA24 and the UOA experiment (Table 1) are both uncoupled, NEMO-based ocean reanalyses, but they are not equivalent configurations. MEDREA24 uses NEMO v3.6 at approximately 1/24° horizontal resolution with 141 vertical levels and the Mediterranean OceanVar implementation described by Escudier et al. (2021). There are several differences with our UOA configuration: beside model version and spatial resolution, bulk formulas, lateral boundary conditions and frequency of input atmospheric forcing, setting and estimates of background-error covariances, river runoff specification, vertical mixing and advection schemes, use of sea surface relaxation, all contributing significantly to the differences between the two datasets, whose detailed investigation is beyond the scope of the present manuscript. For strict temporal consistency, all intercomparisons that include MEDREA24 are evaluated over the common period 2000–2019; the 2000–2020 period is used only where all compared datasets are available.
Table 1List of reanalysis experiments performed. Simulation means that no data assimilation is employed.

Climate diagnostics presented later mostly consist of linear trends over the full period. Total trends are calculated from the monthly mean data. Additionally, for ocean diagnostics, we subdivide the Mediterranean Sea into the western Mediterranean Sea (WMED) and the eastern Mediterranean Sea (EMED), divided by a straight line across the Strait of Sicily (at 37° N from Tunisia to Sicily).
In this section, we revise basic validation metrics from the MESMAR-R reanalysis and compare them with reference reanalysis datasets, introduced in Sect. 2.5, for comparison. Table 2 shows the RMSE for ocean parameters (temperature and salinity for different depth ranges, and sea surface temperature, salinity, and height), over the 2000–2020 period.
Table 2Root mean square error for the ocean, in comparison with other state-of-the-art reanalyses. The parameters include temperature (T, in °C) and salinity (S, in psu), sea surface temperature (SST, in °C), sea surface salinity (SSS, in psu), and sea surface height (SSH, in m). The calculation covers the period 2000–2020.
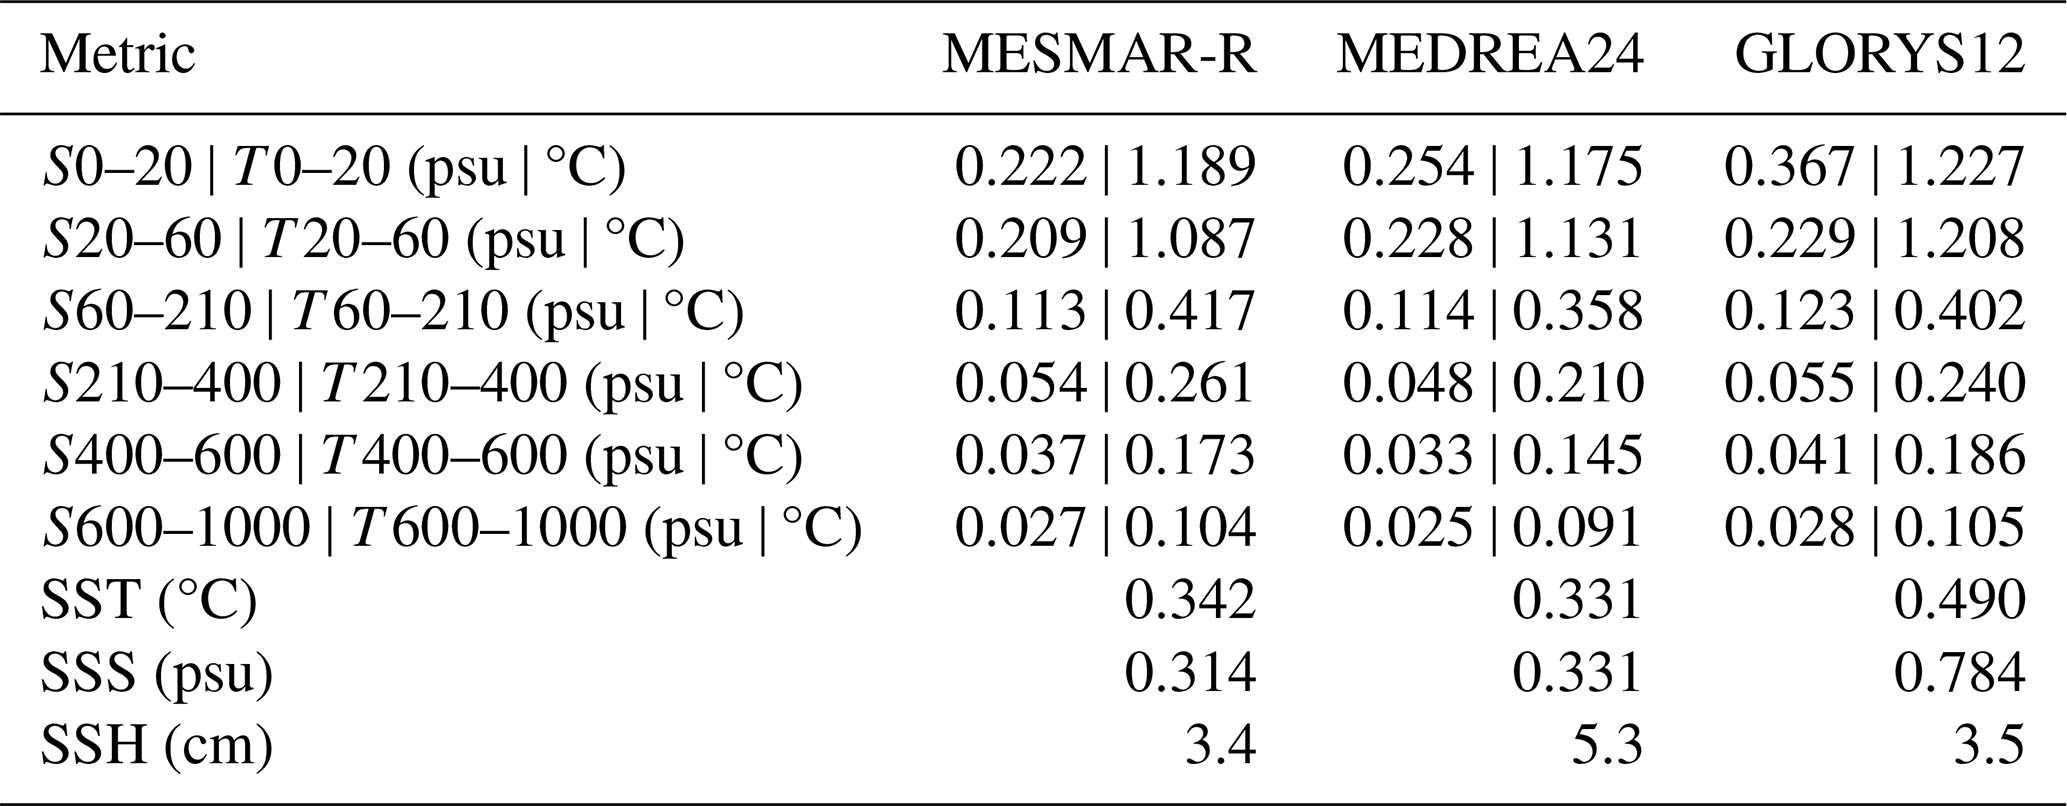
The MESMAR-R reanalysis shows particularly strong skill at the sea surface. Compared with the regional MEDREA24 and the global GLORYS12, it delivers the lowest RMSE for sea surface height, with values slightly better than GLORYS12 and markedly better than MEDREA24. Similarly, MESMAR-R clearly outperforms both competitors in sea surface salinity, where the error is reduced by more than half compared with GLORYS12. For sea surface temperature, MESMAR-R is nearly indistinguishable from MEDREA24, both substantially outperforming GLORYS12. These results highlight the robustness of the coupled reanalysis in capturing surface variability, which is critical for mesoscale dynamics, air–sea fluxes, and the freshwater balance of the Mediterranean.
In the upper ocean, MESMAR-R maintains a strong performance. Temperature in the 20–60 m layer shows the lowest RMSE among all products, while at 0–20 m the skill is essentially comparable to MEDREA24 and better than GLORYS12. Salinity in the upper 210 m is well represented, too, with MESMAR-R either leading or effectively tied for the best performance. Below 210 m, MEDREA24 generally yields slightly lower RMSE than MESMAR-R, particularly for temperature between 210 and 600 m. At deeper layers (400–1000 m), differences among the three systems are small, and MESMAR-R typically places second behind MEDREA24 but ahead of GLORYS12.
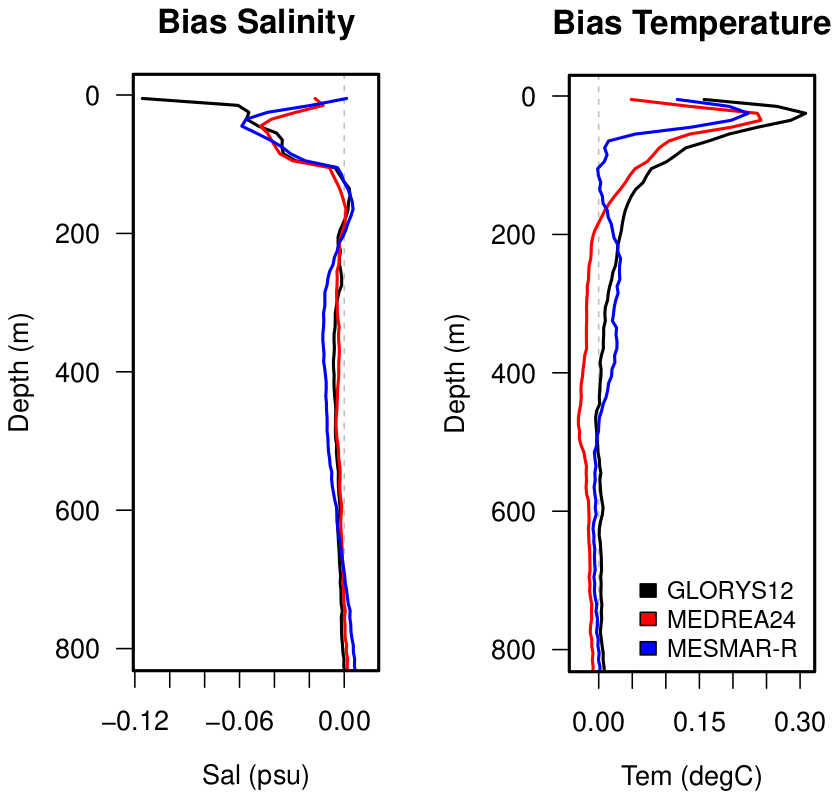
Figure 1Profiles of salinity (left panel) and temperature (right panel) bias, calculated against all available in-situ profiles, for MESMAR-R in comparison with other state-of-the-art reanalyses. The calculation covers the period 2000–2020, and the bias is defined as model minus observations.
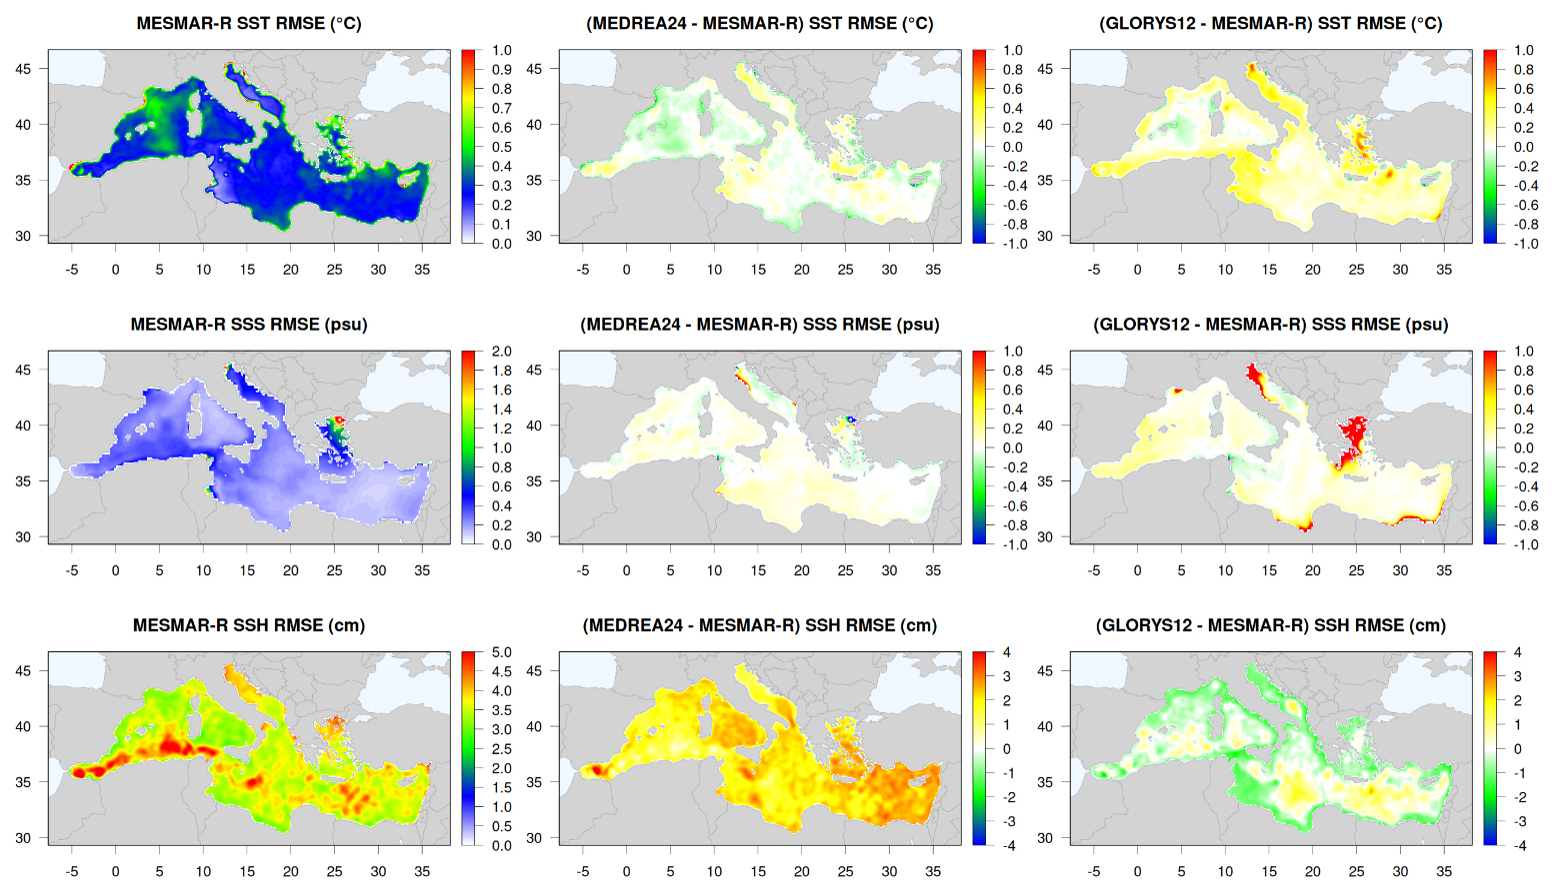
Figure 2Maps of RMSE against sea surface observations (SST in °C, SSS in psu, and SSH in cm), in comparison with other state-of-the-art reanalyses. Left panels show the MESMAR-R RMSE, while middle and right panels show the RMSE difference between either MEDREA24 or GLORYS12 and MESMAR-R (where positive, MESMAR-R provides the smallest RMSE). The calculation covers the period 2000–2020.
Looking at profiles of bias (Fig. 1), all three reanalyses show a small fresh bias in the upper layers, most pronounced in the top 50 m, but MESMAR-R (blue) exhibits the smallest amplitude at the sea surface. Below about 100 m, all products converge toward near-zero bias. For temperature, the three systems exhibit a weak warm bias near the surface that decreases with depth. MESMAR-R shows a bias magnitude comparable to or slightly smaller than MEDREA24 above 100 m, and both regional reanalyses outperform GLORYS12, which displays a more persistent warm bias extending deeper into the thermocline. Below 200 m, MESMAR-R's bias remains very close to zero, suggesting good thermal consistency with in-situ observations and minimal drift at depth.
The spatial distribution of RMSE (Fig. 2) confirms the overall strengths of MESMAR-R, while also highlighting regional differences. For sea surface temperature (SST), the absolute RMSE map shows widespread errors below 0.5 °C across most of the basin, with slightly elevated values along the northern Adriatic and Aegean Seas, and locally in the western basin. The difference plots (middle and right panels of Fig. 2) indicate that MESMAR-R generally performs as good as MEDREA24, with small areas of improvement in the Levantine Basin and central Mediterranean, but slightly higher errors along parts of the western basin and, locally, elsewhere. In contrast, MESMAR-R systematically outperforms GLORYS12 almost everywhere, with particularly marked improvements in the Adriatic and Aegean Sea, the Levantine Basin, and the Alboran Sea.
For sea surface salinity (SSS), MESMAR-R achieves basin-wide errors below 0.5 psu except for localized peaks in the northern Aegean. Compared with MEDREA24, there are uniform and widespread improvements, with peaks near the Po river mouth and local deterioration in proximity to the Dardanelles, likely amplified by differences in the boundary conditions therein. The localized difference near the Po River mouth is most plausibly linked to the different river-discharge specifications and coastal mapping used by the systems, rather than any possible indirect effect of the coupled data assimilation, as suggested also by pure simulation runs (see Storto et al., 2023a). Against GLORYS12, MESMAR-R demonstrates a clear gain almost everywhere, with the largest improvements in the northern Adriatic and Aegean seas, likely driven by the better river discharge specification than in the global reanalysis.
The sea surface height (SSH) comparison is especially promising, as MESMAR-R exhibits low RMSE values across the entire basin, typically under 0.04 m. The difference maps confirm that MESMAR-R consistently outperforms MEDREA24 throughout the Mediterranean, with the most pronounced improvements in the western basin and Levantine Sea. Compared with GLORYS12, MESMAR-R shows a systematic advantage in the eastern Mediterranean, while locally GLORYS12 tends to outperform MESMAR-R.
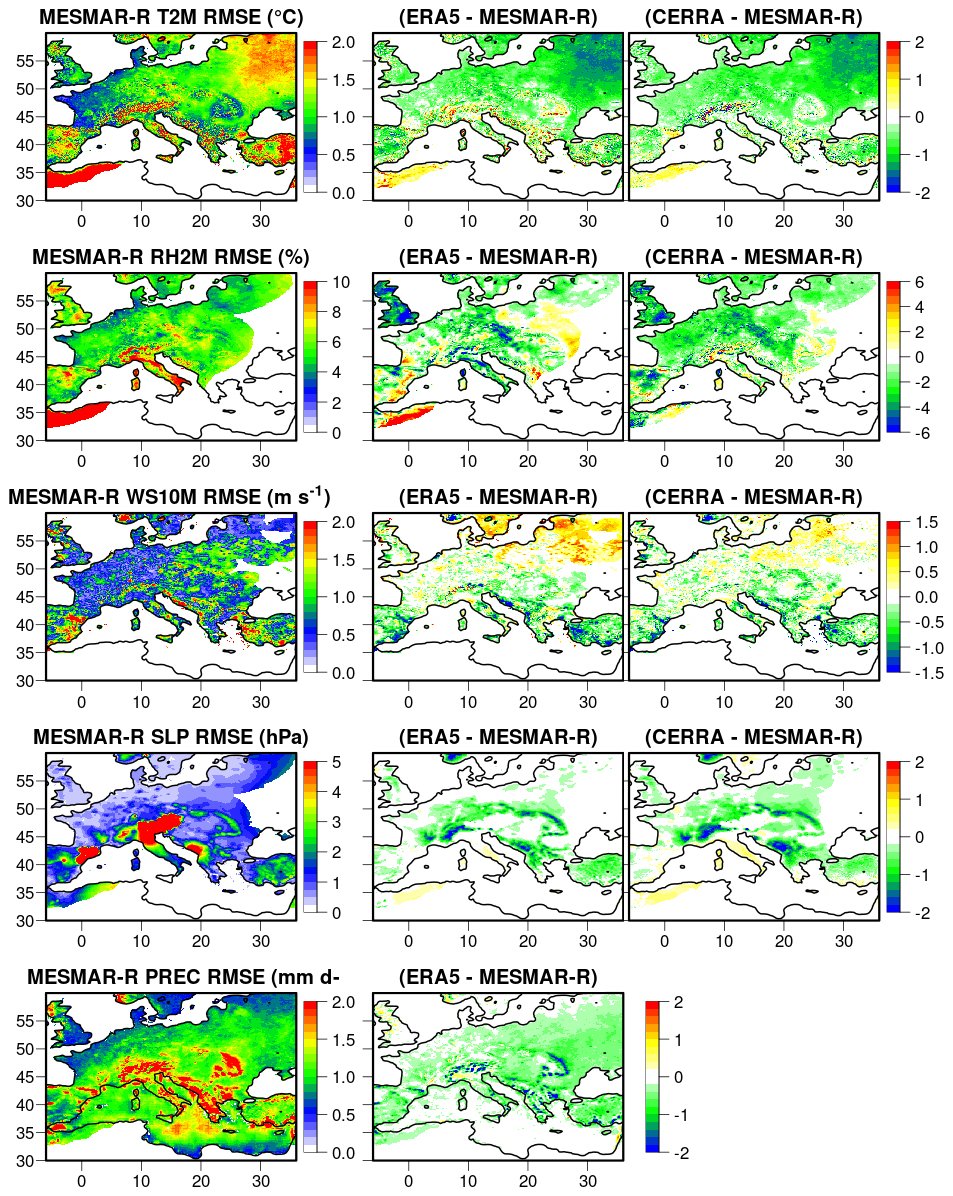
Figure 3Maps of RMSE against atmospheric near-surface gridded observations (T2M in °C, RH2M in %, WS10M in m s−1, SLP in hPa, and PREC in mm d−1), in comparison with other state-of-the-art reanalyses. Left panels show the MESMAR-R RMSE, while middle and right panels show the RMSE difference between either ERA5 or CERRA and MESMAR-R (where positive, MESMAR-R provides the smallest RMSE). The calculation covers the period 2000–2020.
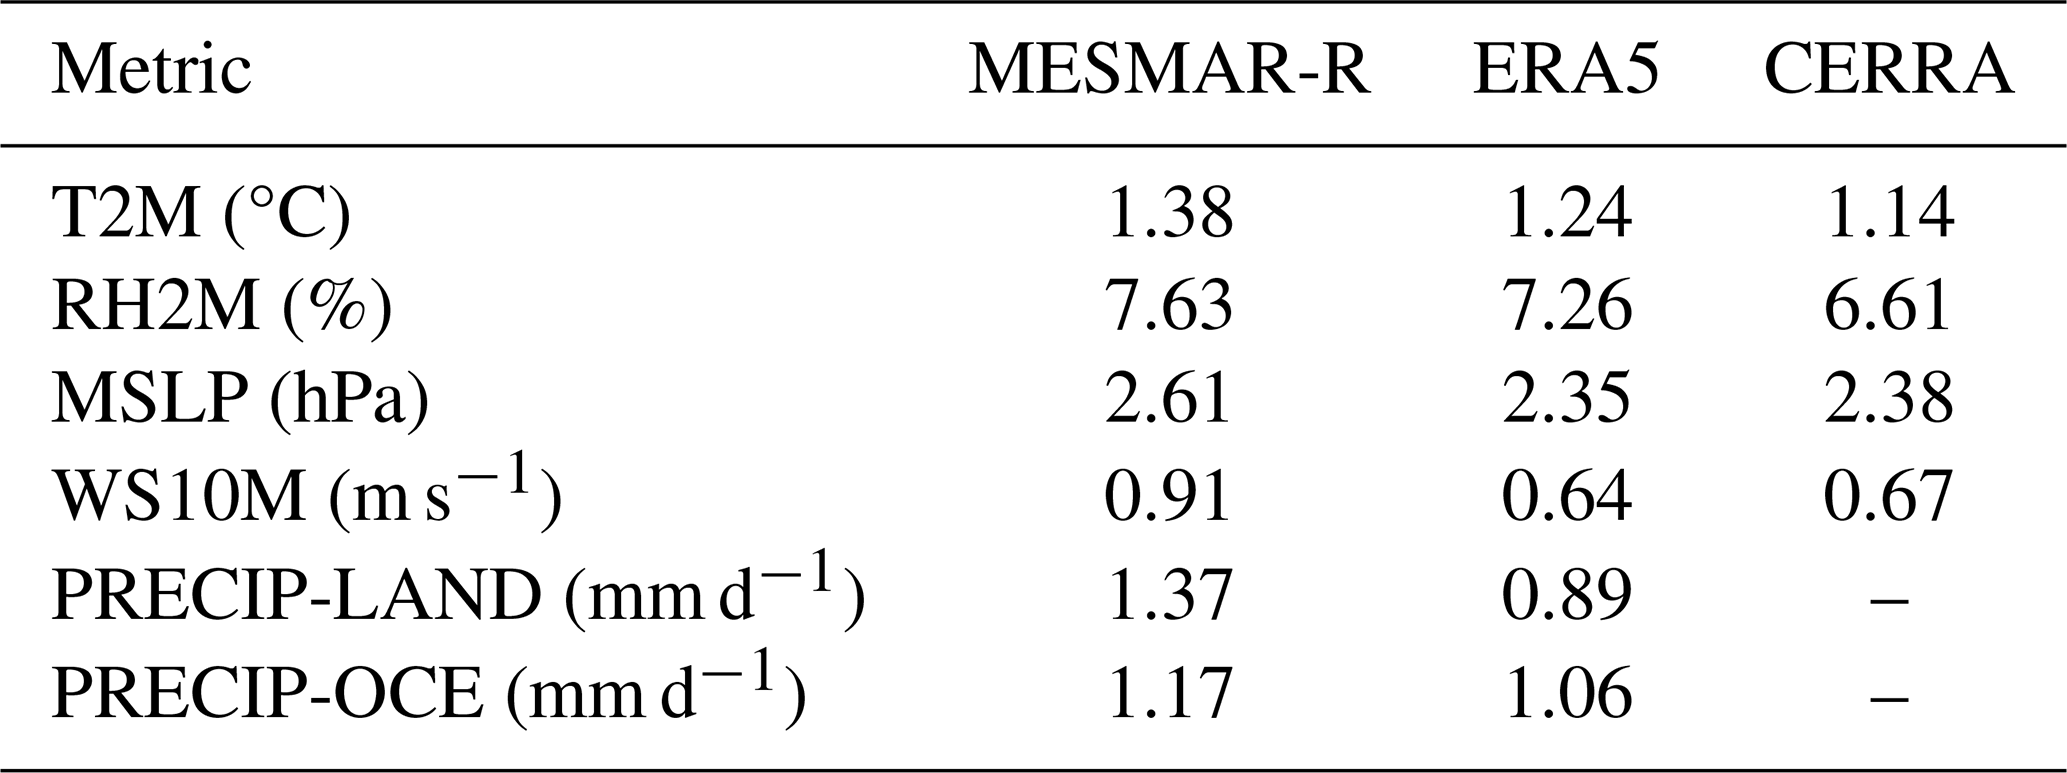
Moving to atmospheric parameter validation, area-averaged scores show MESMAR-R generally has slightly higher RMSE than ERA5 or CERRA for near-surface variables (Table 3, see the caption therein for the abbreviation of parameters): T2M (1.38 °C vs. 1.24/1.14 °C), RH2M (7.63 % vs. 7.26 %/6.61 %), WS10M (0.91 m s−1 vs. 0.64/0.67 m s−1), and MSLP (2.61 hPa vs. 2.35/2.38 hPa). For precipitation, the gap is larger over land (1.37 mm d−1 vs. 0.89 mm d−1 to ERA5) and modest over ocean (1.17 mm d−1 vs. 1.06 mm d−1), where evaluation uses GPCP. MESMAR-R is worse overall but still within the same order of magnitude as the state-of-the-art reanalyses. Note that the comparison may also be affected by representativeness inaccuracies, due to the smoothing procedure in e-OBS and the different spatial resolutions of data and models; yet the comparison provides a qualitative indication of the model-data agreement.
Table 3Root mean square error for selected atmospheric parameters, in comparison with other state-of-the-art reanalyses. T2M: 2 m air temperature; RH2M: 2 m relative humidity; MSLP: mean sea level pressure; WS10M: wind speed at 10 m; PRECIP: total precipitation (either over land or ocean).
The maps and RMSE-difference panels, in Fig. 3, confirm the picture. For all variables, most of the domain shows ERA5/CERRA with equal or lower RMSE than MESMAR-R (negative differences), but MESMAR-R achieves localized improvements (positive differences). The fine-scale RMSE-difference patterns contain both positive and negative values; they are concentrated near complex coastlines and orography, where representativeness differences between a 15 km regional model and gridded observations are large and where the WRF surface-layer, land-surface, boundary-layer, and precipitation schemes may generate gradients that are absent or smoothed in the reference datasets. Over the sea, coupled SST and surface-current feedback can additionally modify near-surface temperature, humidity, and wind, while spectral nudging constrains only long scales and therefore permits mesoscale departures from ERA5. A large cold bias near Siberia affects the skill scores for MESMAR-R in the eastern part of the domain, due to suboptimal land model performances therein (Storto et al., 2023a); for WS10M, the northern part of the domain and scattered marine areas exhibit marginal gains; MSLP shows very narrow bands in the southernmost part of the MESMAR domain, where MESMAR-R reduces error relative to ERA5/CERRA; and for precipitation, ERA5 provides the best skill scores almost everywhere. Taken together, the maps indicate MESMAR-R worsens most of the time, but can outperform locally, typically in small, dynamically or observationally challenging sub-regions.
In this section, we compare the MESMAR-R reanalysis with the sensitivity experiments described in Sect. 2.4, to assess the relative merits of data assimilation and interactive coupling in the MESMAR-R performances. This section includes both a comparison of skill scores and key oceanic processes.
The sensitivity experiments confirm the expected hierarchy among configurations in the comparison of RMSE (see the RMSE increase bar plots in Fig. 4). The fully coupled free simulation (COS) consistently shows the largest RMSE increases, particularly at depth, indicating that the absence of any data assimilation in coupled mode leads to a rapid degradation of the subsurface structure. In contrast, the uncoupled ocean simulation (UOS) performs better than COS but is still significantly worse than MESMAR-R, reflecting the stabilizing influence of the ERA5 atmospheric forcing, which effectively acts as a weak atmospheric constraint. Interestingly, for some parameters (most notably sea surface salinity (SSS) and upper-ocean salinity), the coupling provides a measurable improvement, suggesting that the explicit exchange of freshwater fluxes helps preserve a more realistic surface salinity balance. This may also be due to the different bulk formulas employed in the coupled configuration compared to the NEMO uncoupled setup, although it is not technically possible to disentangle the two changes.
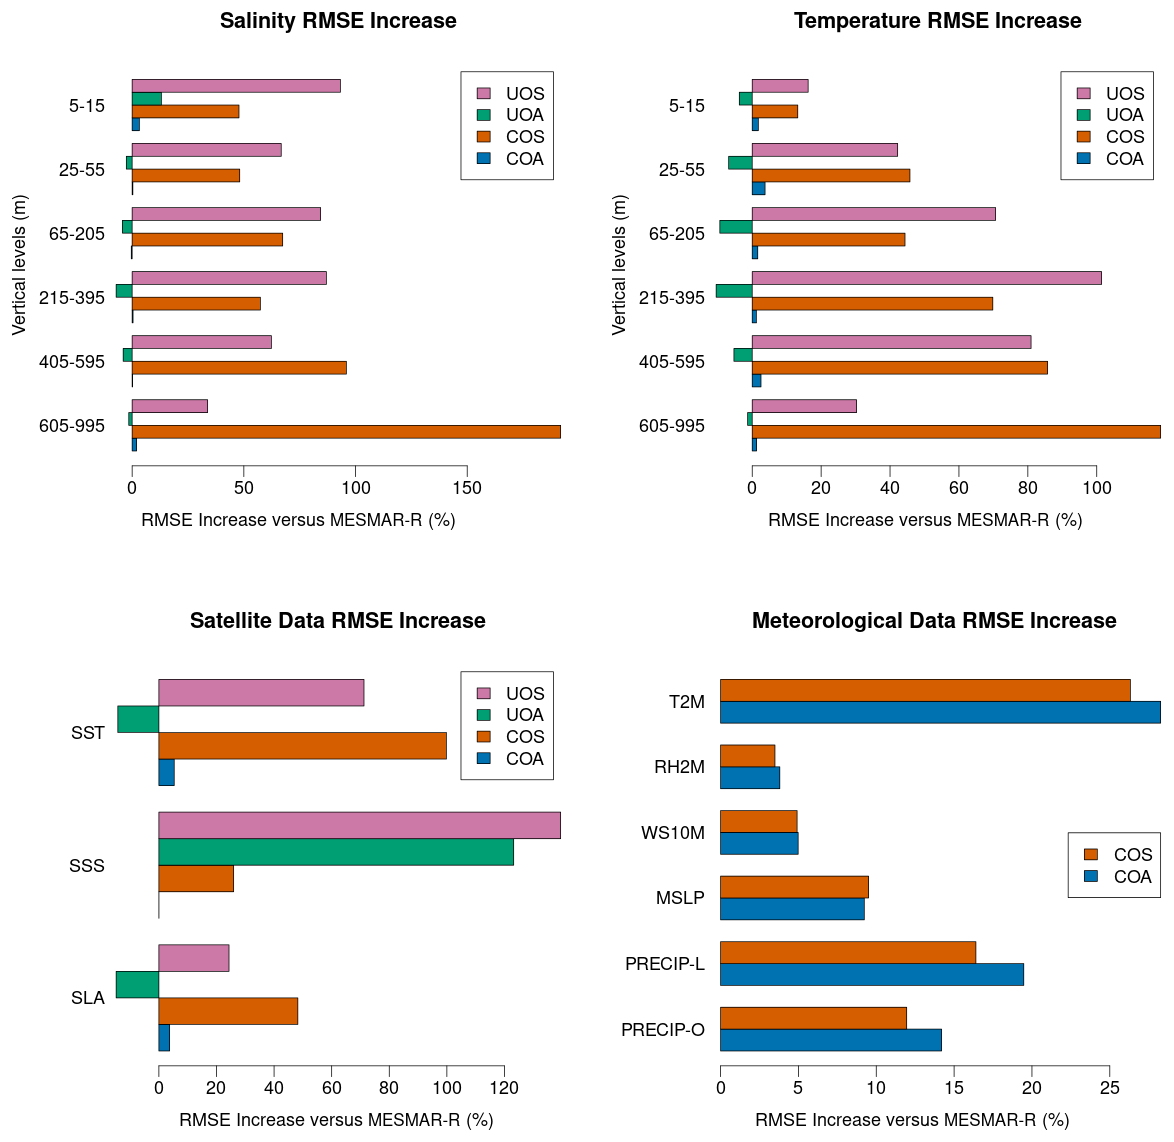
Figure 4RMSE increase (in %) compared to MESMAR-R for the experiments described in Table 1, for several oceanic and atmospheric parameters.
The uncoupled ocean reanalysis (UOA) exhibits slight overall improvements compared with MESMAR-R, except for SSS and salinity in-situ verification in the top 15m, where the coupled configuration performs marginally better, as explained earlier. This outcome indicates that the combination of ocean data assimilation and prescribed atmospheric reanalysis forcing tends to outperform the coupled system when coupling errors outweigh flux benefits, except for metrics directly linked to freshwater closure. Conversely, the coupled ocean analysis (COA), which retains ocean data assimilation but excludes atmospheric assimilation, shows small but statistically significant degradations in a few key parameters, namely temperature near the base of the mixed layer, sea level anomaly (SLA), and sea surface temperature (SST). These changes imply that the atmospheric large-scale constraint employed in MESMAR-R exerts a positive influence on the air–sea interface, improving consistency in surface heat and momentum fluxes.
The verification against meteorological observations (Fig. 4, bottom right panel) reveals moderate RMSE increases for both coupled configurations (COS and COA) compared with the full reanalysis. The largest degradation occurs for near-surface air temperature (T2M), where RMSE increases exceed 20%, followed by precipitation, particularly over land (PRECIP-L), where errors rise by about 15 %–20 %. In contrast, relative humidity (RH2M) and 10 m wind speed (WS10M) show only minor increases of a few percent, while mean sea level pressure (MSLP) exhibits intermediate sensitivity (around 10 %). Notably, COS generally performs slightly better than COA for several parameters, especially T2M and precipitation; the COA-COS differences, summarized in Fig. 5, are concentrated mainly over the Mediterranean Sea and broadly follow the SST adjustments induced by ocean data assimilation, with the clearest responses in 2 m temperature and specific humidity and generally weaker changes in 10 m wind speed. SST anomalies modify the air–sea temperature and moisture contrasts and lower-atmospheric stability, thereby affecting turbulent momentum mixing and producing locally coherent wind-speed changes. The signal occasionally extends inland, particularly for winter air temperature, summer humidity, and precipitation in both seasons, indicating a limited downstream propagation of the oceanic constraint into the atmosphere. Noting that verification of atmospheric parameters against e-OBS T2M is over land, this indicates that such inland propagation of ocean observations may require further constraints in the system.
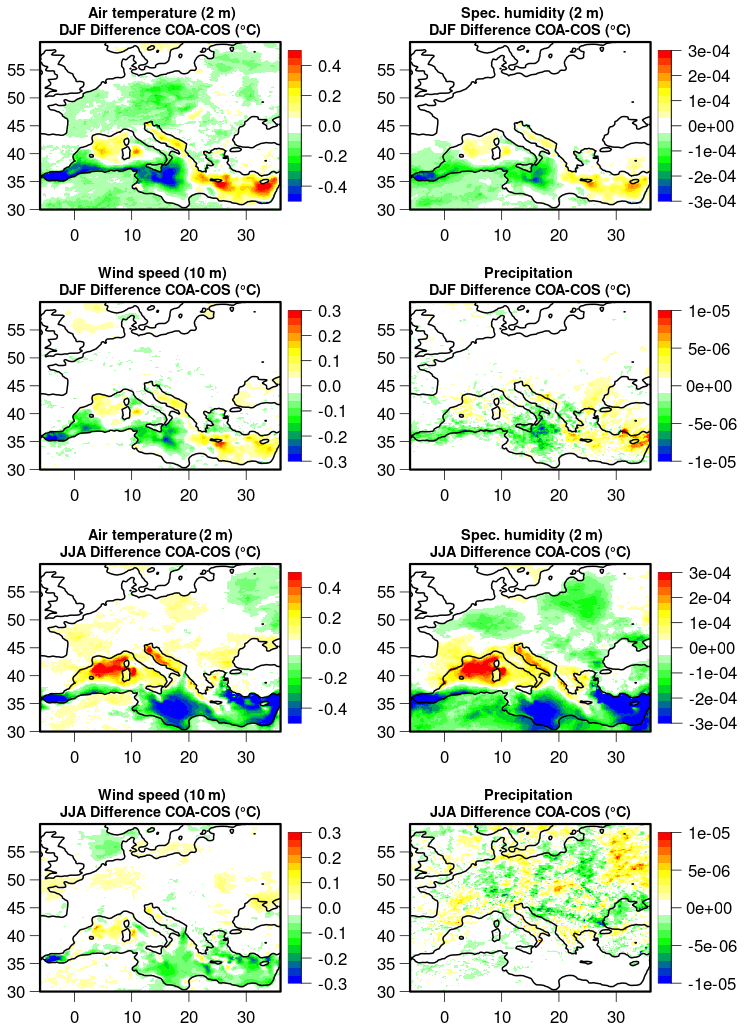
Figure 5Long-term averaged (2000–2020) near-surface atmospheric parameter differences between COA and COS sensitivity experiments (namely, showcasing the impact of ocean data assimilation on atmospheric variables).
The surface flux differences (Fig. 6) between the coupled (COS) and uncoupled (UOS) simulations highlight the physical mechanisms through which coupling alters SST and SSS, and they are broadly consistent with the performance differences documented in the sensitivity experiments. In the Aegean Sea, and to a lesser extent in the area south of Sicily, the signal is particularly clear: the net heat flux difference is negative (reduced downward heat flux), while the net freshwater flux (upward) difference is positive, indicating enhanced evaporation. Together, these patterns point to stronger latent heat loss in COS, which cools the surface and simultaneously increases salinity through evaporative concentration. This mechanism aligns well with the SSS RMSE improvement observed for COS in this region and explains the localized SST differences. In other regions, the coupling influence is more heterogeneous. Along the Alboran and Levantine basins, patches of increased downward heat flux coincide with small reductions in evaporation, suggesting coupling-induced adjustments in wind speed and humidity that alter the surface energy balance without producing a uniform SST or SSS response. The runoff anomalies shown in the bottom panel are spatially limited and generally small but mostly positive, implying that river-input differences may not be the dominant driver of basin-wide changes but can affect local variations in salinity.
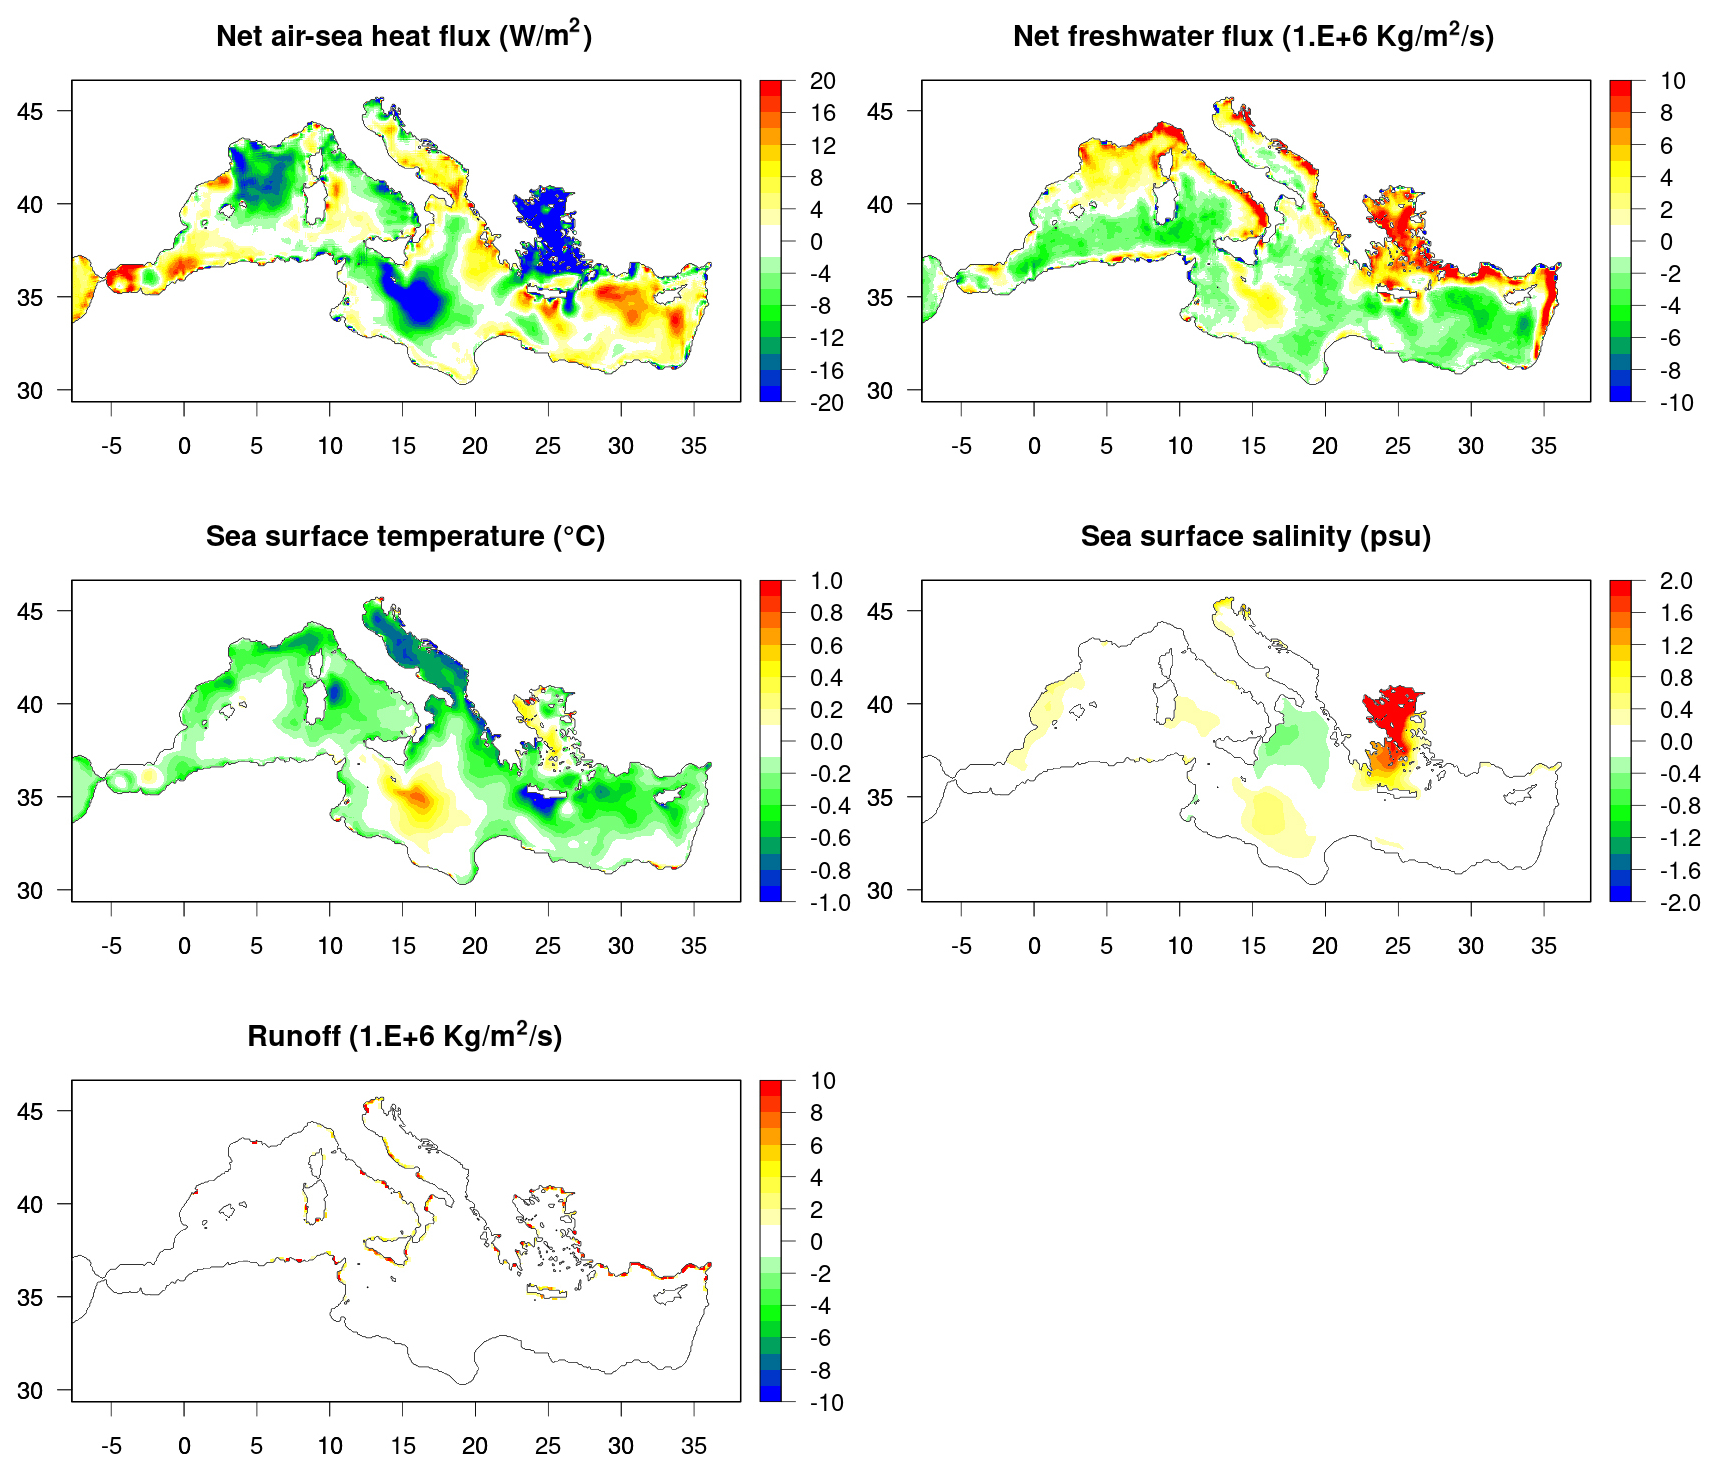
Figure 6Long-term averaged (2000–2020) air–sea flux and surface parameter differences between the COS and UOS sensitivity experiments (namely, showcasing the impact of the interactive coupling with WRF). Positive net heat flux is directed downward into the ocean and therefore represents ocean heat gain. Positive net freshwater flux is directed upward out of the ocean and therefore represents net freshwater loss through evaporation minus precipitation and runoff.
Next, we review the impact of the different configurations on mesoscale eddy activity, ocean heat content, and deep-water formation. Eddy Kinetic Energy (EKE), computed from SSH under the geostrophic assumption for all datasets for the sake of consistency, reveals distinct dynamical signatures across the experiments (see Fig. 7 for EKE timeseries in the Mediterranean Sea, and Fig. 8 for EKE maps and differences). MESMAR-R exhibits consistently elevated EKE, both in the spatial maps and the basin-averaged time series, indicating that both data assimilation and coupling actively energize the mesoscale. Its values fall reasonably close to the observational benchmark derived from L4 altimetric sea-level anomalies (SLA), with the main discrepancy appearing near the Strait of Gibraltar, where steep topography, and intense barotropic flows may amplify representation errors in either observations or the model. In contrast, MEDREA24 shows EKE values that are substantially higher than all other systems, consistently with its much finer horizontal resolution (1/24°), which can resolve smaller eddies and sharper gradients that naturally increase EKE. The spatial patterns suggest that MESMAR-R differs most strongly from SLA and GLORYS12 in parts of the southern Mediterranean.
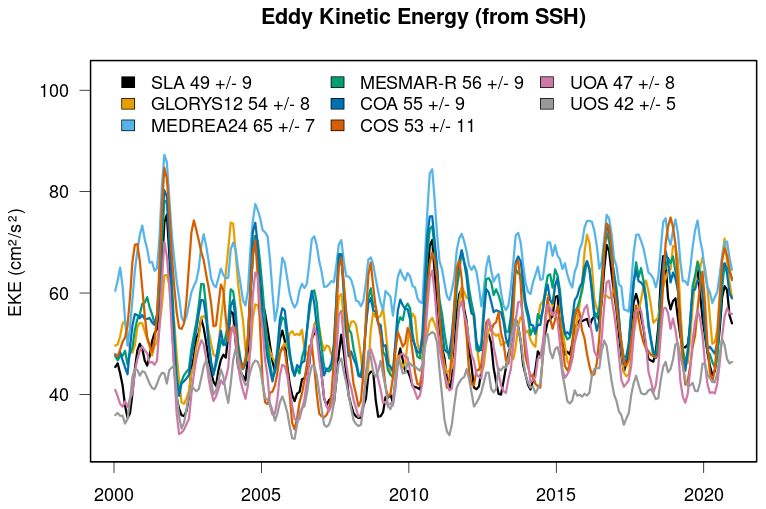
Figure 7Eddy kinetic energy (EKE) timeseries, calculated from the MESMAR-R reanalysis, gridded altimetry data, the MEDREA24 and GLORYS12, and the sensitivity experiments, over the period 2000–2020. For all datasets, EKE is calculated from sea level, adopting the usual geostrophic relationship to calculate geostrophic currents.
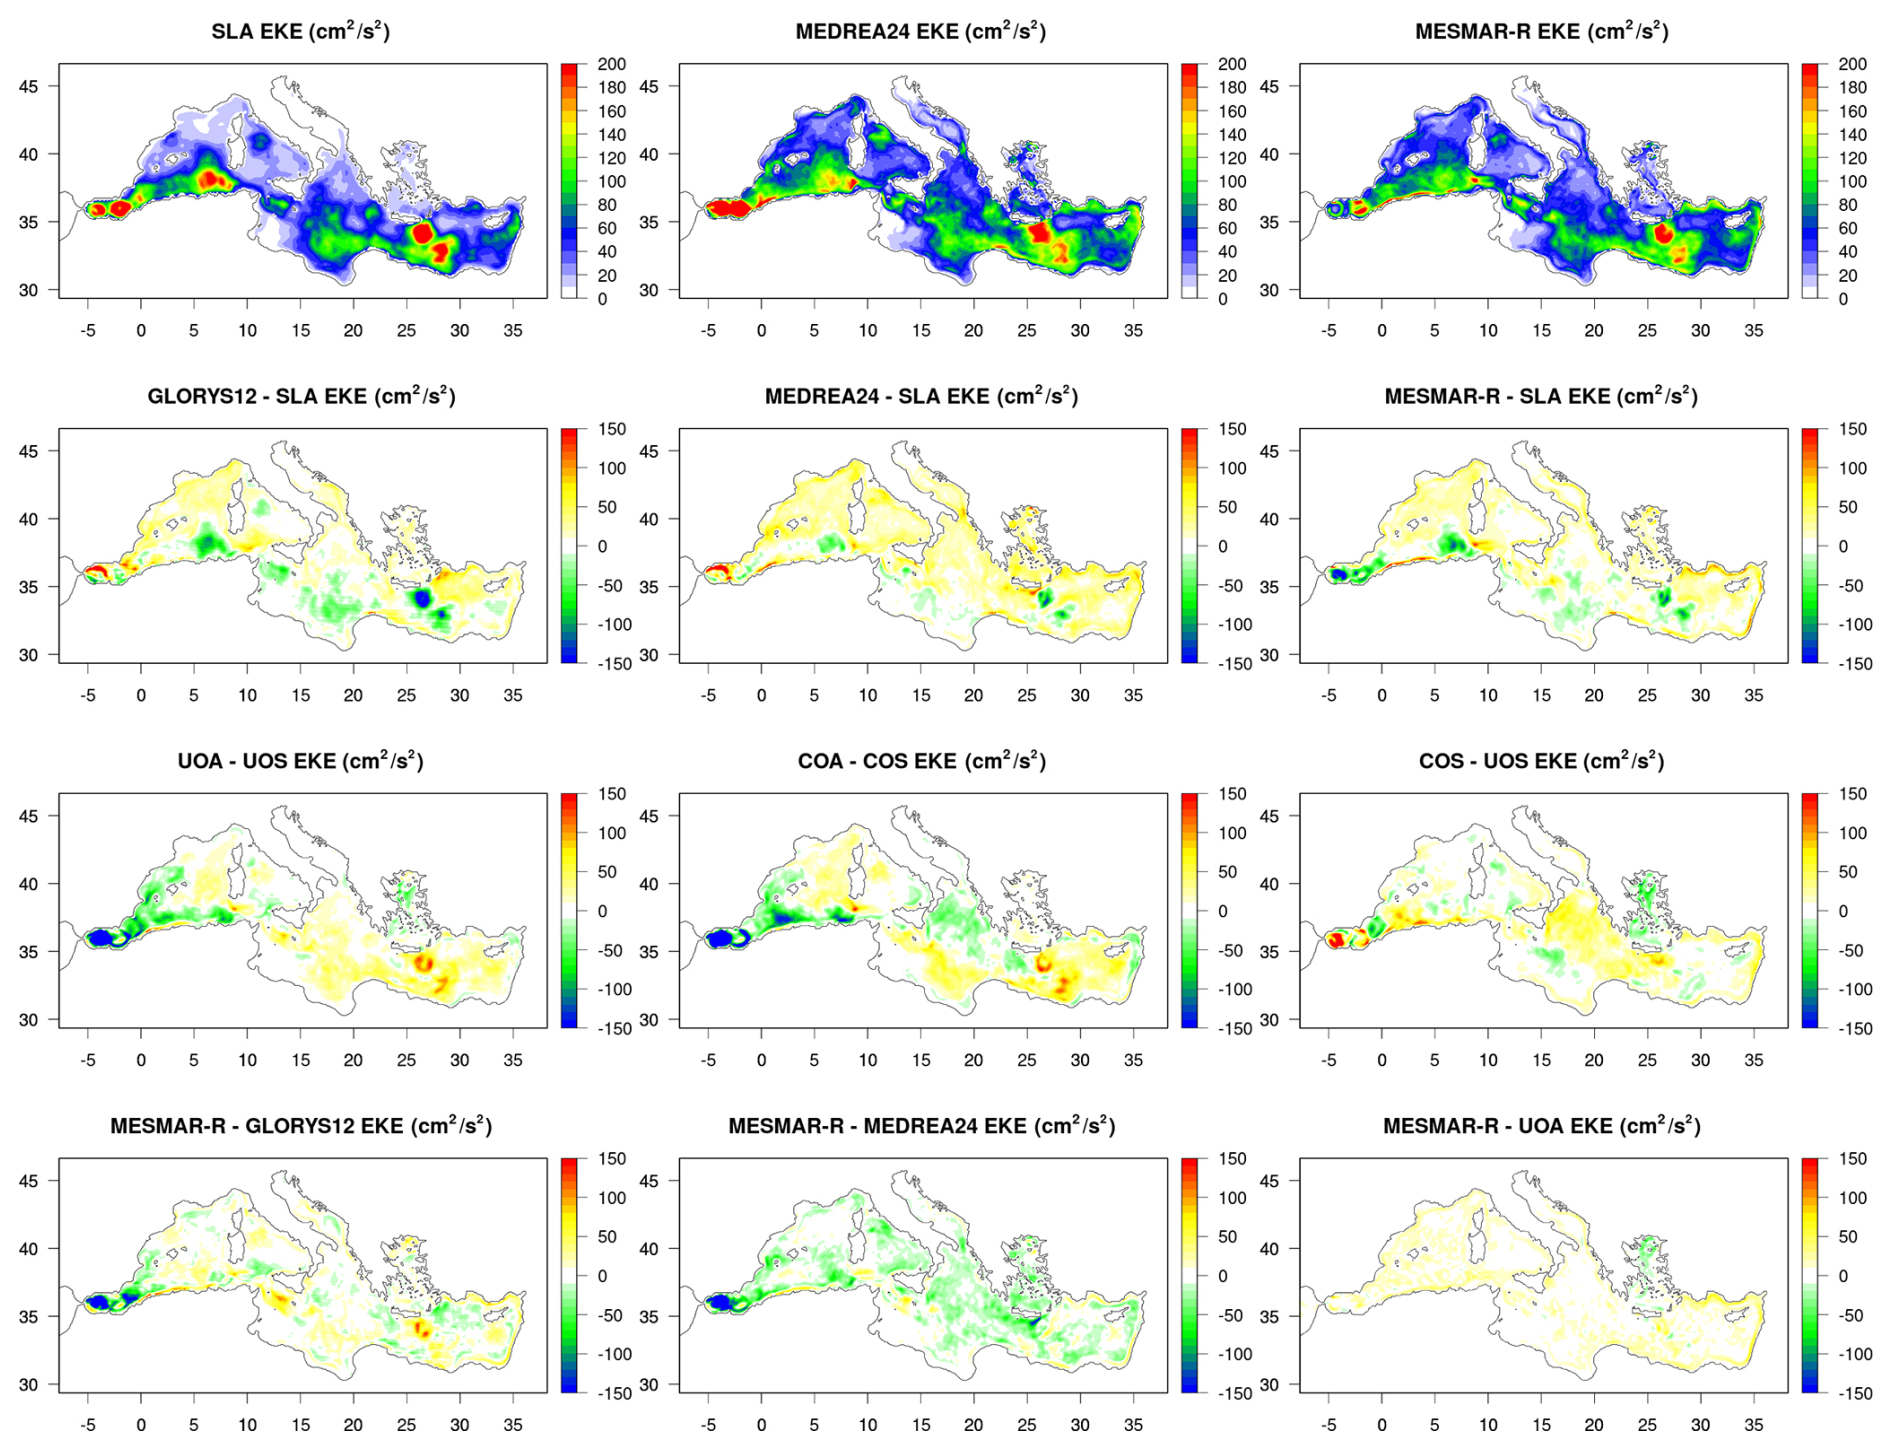
Figure 8Eddy kinetic energy (EKE) maps, calculated from the MESMAR-R reanalysis, gridded altimetry data, the MEDREA24 and GLORYS12, and the sensitivity experiments, over the period 2000–2020. For all datasets, EKE is calculated from sea level, adopting the usual geostrophic relationship to calculate geostrophic currents. The top panels show the absolute EKE values, while the panels below show differences of EKE between pairs of experiments as indicated in each panel title.
The sensitivity experiments highlight the contributions of individual modelling components. COA and COS exhibit higher EKE than uncoupled systems, underscoring the tendency of coupling alone to energize the mesoscale; nevertheless, without the constraint of ocean DA (COS), this may lead to less realistic variability. Conversely, UOA and UOS retain lower EKE levels, with UOS showing the weakest mesoscale activity overall, reflecting the damping imposed by prescribed atmospheric forcing and the absence of DA-induced eddy enhancement. The time series confirms this hierarchy: MESMAR-R ≈ COA > COS > UOA > UOS, mirroring the combined influence of coupling and data assimilation.
Together, these results highlight that MESMAR-R achieves a dynamically active mesoscale field that remains close to altimetric estimates, while coupling and data assimilation jointly act to enhance EKE relative to uncoupled or unassimilated configurations.
The evolution of ocean heat content (OHC, Fig. 9 as yearly anomalies) in the upper 700 m is reproduced remarkably well by all configurations except COS, with very high correlations (0.93–0.99) relative to observed OHC estimates. The MESMAR-R, COA, and UOA simulations each display a correlation of 0.93–0.94, closely matching the amplitude and timing of observed decadal variability, while UOS performs similarly well (0.99), albeit with slightly damped interannual variability and a smaller trend. In contrast, COS shows a markedly weaker correlation (0.66), reflecting the impact of the unconstrained coupled atmosphere–ocean system, which introduces spurious variability and phase errors, whereas COS ingests indirectly the atmospheric observations as it is forced by the ERA5 atmospheric reanalysis. The fact that MESMAR-R, COA, and UOA all produce nearly identical heat-content trends highlights that ocean data assimilation exerts the primary control on the basin-scale OHC signal, whereas coupling without DA (COS) deviates substantially. The long-term warming rate inferred from MESMAR-R, COA, and UOA (∼1.3 W m−2) also closely matches the observational estimate (∼1.4 W m−2), suggesting that the system's heat uptake is robustly constrained by the assimilation of temperature and sea-level observations.
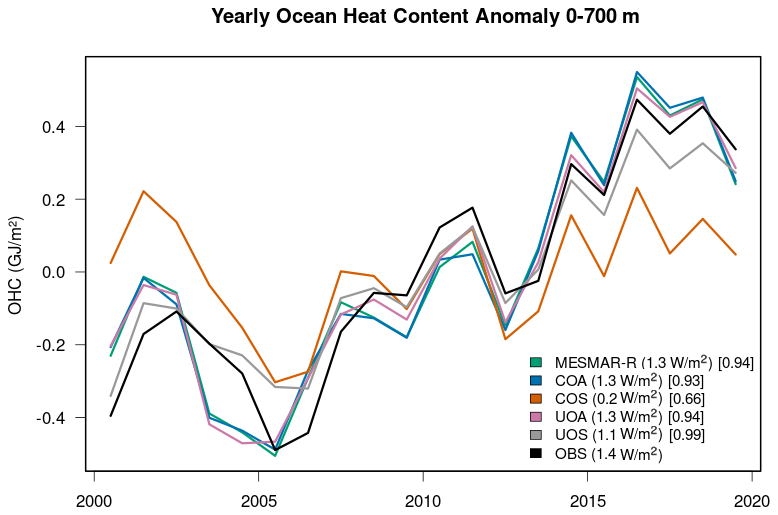
Figure 9Yearly ocean heat content anomalies for the period 2000–2020 from MESMAR-R, the sensitivity experiments, and observation-based values. The legend also reports the trend in W m−2, and the correlation with the observation-based time series.
The mixed layer depth (MLD) fields, shown for winter (JFM), reveal a clearer impact of coupling on vertical structure (Fig. 10). The comparison between COS and UOS highlights that coupling deepens the mixed layer in large areas of the western Mediterranean and Levantine Basin, consistent with the enhanced wind stress and modified heat-flux patterns seen earlier. However, the COS-UOS contrast does not isolate coupling alone. COS contains an interactive WRF–NEMO–HD system, whereas UOS is an ocean-only simulation forced by ERA5-derived atmospheric fields and uses a different surface-forcing pathway. Their difference therefore combines interactive feedbacks, atmospheric-forcing differences, and bulk-formulation differences. Consequently, different ventilation and ocean stratification cannot unambiguously be attributed to the coupling itself, but to the combination of the above factors.
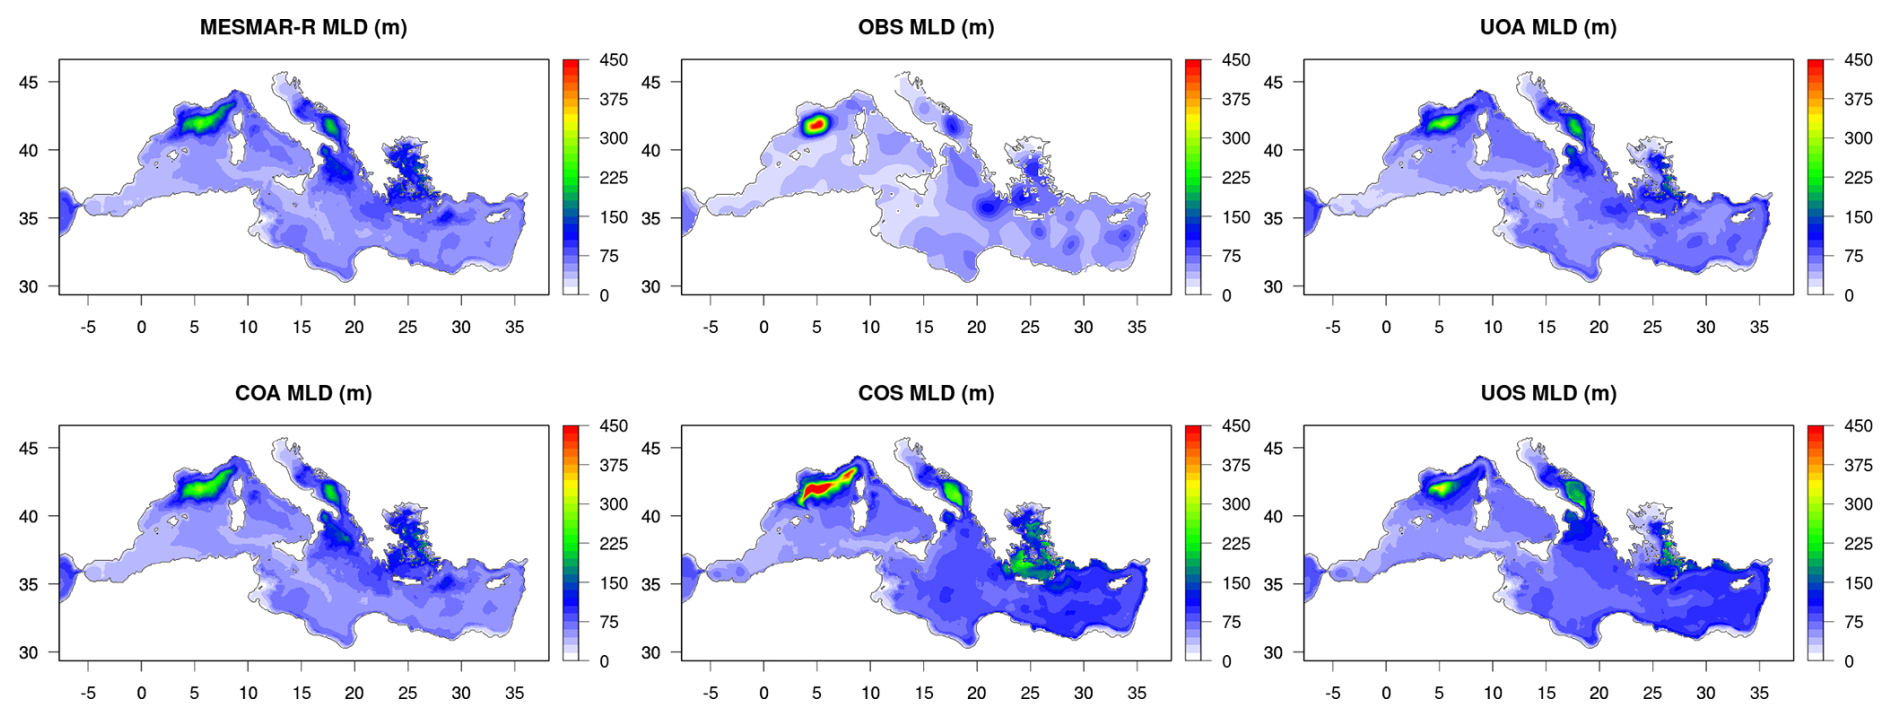
Figure 10Long-term mean winter mixed layer depth (JFM) over 2000–2020 for the MESMAR-R reanalysis and the sensitivity experiments, together with values derived from in-situ observations.
The addition of ocean data assimilation in COA considerably reduces these differences, bringing the MLD patterns closer to those of the uncoupled configurations. Similarly, MESMAR-R exhibits a more moderate MLD distribution, showing that data assimilation effectively damps the excessive deepening (or shoaling) introduced by the free coupled dynamics. This behavior mirrors the EKE results, in which coupling tends to energize the system while data assimilation restores balance: together, these findings indicate that coupling intensifies upper-ocean overturning and stratification adjustments, but assimilation acts as a strong physical constraint that controls spurious variability.
Taken together, the OHC and MLD diagnostics show that ocean DA provides the dominant control on basin-scale heat-content evolution, ensuring close agreement with observations, while coupling primarily modifies vertical mixing and mixed-layer dynamics, with effects that become exaggerated in the absence of data constraints. The combined MESMAR-R system therefore achieves a balanced compromise: it preserves the physically consistent surface-flux feedback of a coupled model while maintaining a realistic representation of heat storage and vertical structure through assimilation.
The last comparison involves ocean data assimilation increments, which are in turn a measure of systematic model errors when averaged over time (e.g., Bhargava et al., 2018). The comparison of analysis increments among the three ocean–DA-enabled configurations (MESMAR-R, COA, and UOA) provides direct insight into how strongly the data assimilation system must correct the model state in each experiment. The comparison is summarized in Fig. 11 (time-averaged increments) and Fig. 12 (Hovmöller diagram of spatial standard deviation over the Mediterranean Sea). Because increments represent the adjustments required to reconcile the model with observations, their time-averaged values reveal systematic model biases, whereas their spatial standard deviation quantifies how strongly and how frequently the assimilation acts. By comparing the increments across experiments, we can diagnose how coupling and atmospheric forcing influence the ocean state: if increments are smaller, the model is closer to observations, meaning that the combination of physics, coupling, and forcing used in that configuration is more self-consistent.
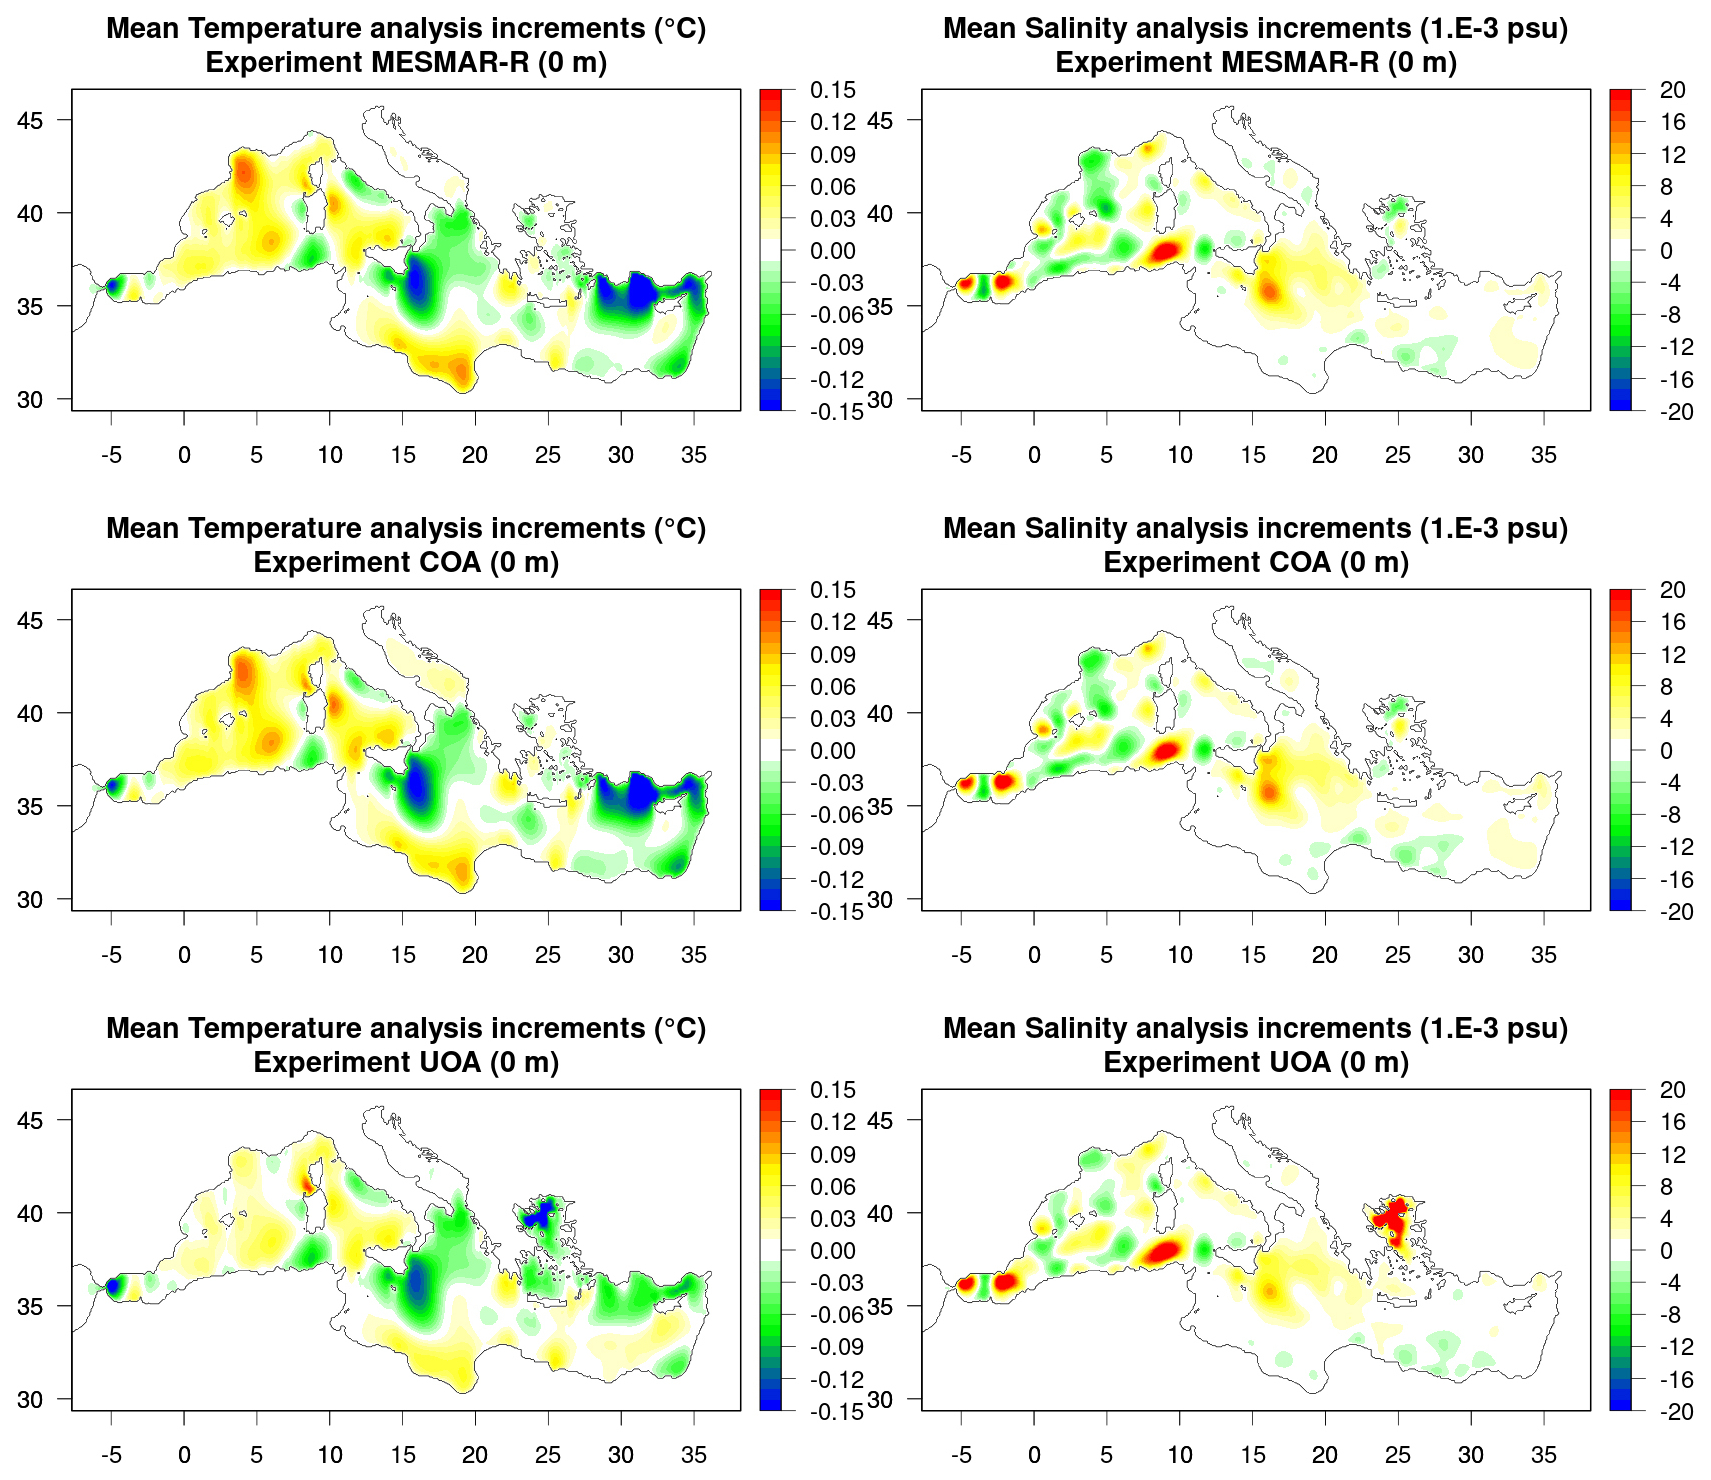
Figure 11Time-averaged analysis increments at the sea surface for MESMAR-R and the other two experiments with ocean data assimilation enabled. The period is 2000–2020.
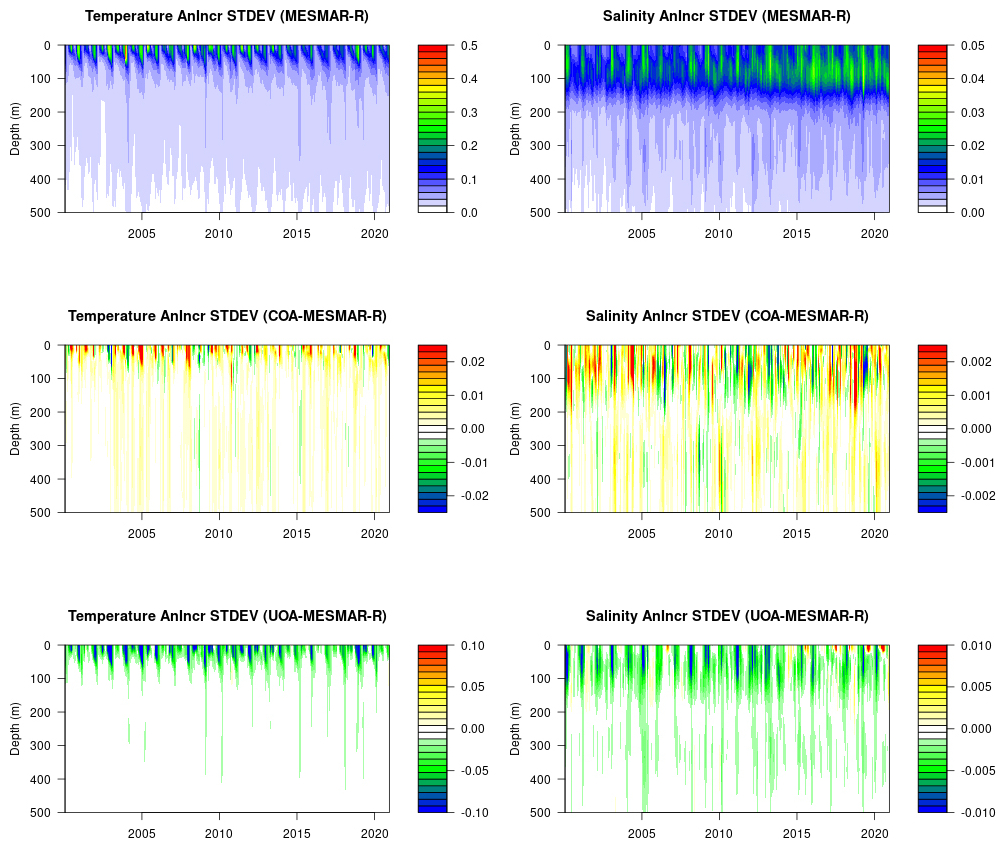
Figure 12Hovmöller diagram (time-depth) of the analysis increments spatial standard deviation for MESMAR-R and the other two experiments with ocean data assimilation enabled. The period is 2000–2020.
The time-averaged increments at the surface highlight a robust pattern present in all experiments: positive temperature increments in the western Mediterranean and negative increments in the eastern basin. This structure indicates a cold bias in the west and a warm bias in the east before analysis, consistent with the SST RMSE patterns discussed earlier. Notably, UOA shows smaller surface temperature increments than MESMAR-R or COA, especially in the central and eastern Mediterranean, confirming that the prescribed ERA5 atmospheric forcing provides a more accurate near-surface heat flux constraint than the interactive coupling. UOA increments are, however, consistent in sign with those from MESMAR-R, showcasing persistent biases likely originating in the ocean model component. This result aligns with the surface flux analysis, where coupling produced regional discrepancies in latent and sensible heat fluxes, particularly in the Levantine and Aegean Seas.
For salinity at 0 m, the increments again show broad similarities across experiments, but UOA displays a distinct freshening increment in the Aegean Sea that is not present in the coupled configurations. This feature likely reflects the fresh bias introduced by ERA5 freshwater forcing, which lacks the dynamically consistent evaporation–precipitation adjustments of the coupled system. It also echoes earlier findings that coupling improves SSS in the Aegean by enhancing realistic evaporative fluxes and, to a lesser extent, river discharge. These consistencies strengthen the interpretation that salinity is especially sensitive to air–sea freshwater coupling, whereas temperature is more sensitive to heat-flux accuracy.
At 30 and 100 m (not shown), the differences among experiments are substantially reduced. The increments remain spatially coherent but become weaker and less distinct across configurations, indicating that the influence of atmospheric forcing and coupling diminishes rapidly below the surface mixed layer. Nevertheless, a persistent feature across all three experiments is the salinity correction in the southwestern Mediterranean, which likely reflects biases in the water exchanged through the Strait of Gibraltar, consistently with the EKE and SSS anomalies noted near the entrance of the basin. Beyond this, the experiments converge, confirming that the main differences between configurations are confined to the upper ∼50 m, where coupling and surface fluxes exert the strongest control.
The Hovmöller diagrams (Fig. 12) further clarify the behavior of the assimilation system. In MESMAR-R, temperature increments peak in summer, when strong stratification makes the model more sensitive to surface forcing errors and limits vertical redistribution of heat. Over time, a modest decrease in increment magnitude is evident, suggesting that the reanalysis improves internally throughout the period, likely via better-constrained large-scale circulation and gradual spin-up of the coupled and data assimilation systems.
For salinity, MESMAR-R exhibits larger increment variability, particularly in the upper 100 m. Part of this arises from the greater density of salinity observations (ARGO, gliders, ship-based), but it also reflects the intrinsic sensitivity of Mediterranean salinity to evaporation, runoff, and mixing, all of which contribute to persistent local biases.
Differences relative to MESMAR-R provide further insight. The COA minus MESMAR-R differences are slightly positive almost everywhere, confirming that the atmospheric DA included in MESMAR-R marginally reduces the need for ocean corrections. This reinforces earlier conclusions that atmospheric assimilation improves the air–sea flux balance, particularly for heat and freshwater, thereby generally reducing ocean misfits.
Conversely, UOA minus MESMAR-R differences show generally negative values in the upper 50 m, consistent with the higher fidelity of ERA5 forcing for near-surface fields. These differences peak in winter, when atmospheric forcing dominates mixed-layer dynamics, and coupling errors can accumulate most easily. Below ∼50 m, the differences vanish, reinforcing that ERA5 and coupling primarily diverge near the surface.
5.1 Oceanic long-term changes from the MESMAR-R reanalysis
The MESMAR-R coupled reanalysis provides a dynamically consistent multidecadal reconstruction of the Mediterranean circulation and its climate evolution over 1993–2024. Beyond the validation metrics discussed previously, the long-term trends in sea level, temperature, salinity, and heat/salt content offer a representation of the climate response of the Mediterranean basin. The Mediterranean is a semi-enclosed concentration basin whose thermohaline characteristics evolve rapidly under climate forcing, and where salinity-driven density changes can dominate over thermal effects. The climate indices derived from MESMAR-R are therefore particularly informative in assessing regional climate changes.
The halosteric component of sea level exhibits a strong, basin-wide negative trend in MESMAR-R, with a basin-mean decrease of approximately −3.87 mm yr−1 over 1993–2024 and even stronger halosteric decline in the western basin (−5.02 mm yr−1) relative to the eastern basin (−3.27 mm yr−1) (see Fig. 13 and Table 4). These values are fully consistent with the intensifying salinification of the Mediterranean reported in observational and modelling studies (Liu et al., 2025; Skliris et al., 2018; Aydogdu et al., 2023). The trend maps show particularly strong halosteric lowering in the Alboran Sea and western Mediterranean gyre, a region identified in previous work as a hotspot of salinity-driven density increase, likely associated with enhanced evaporation and changes in Atlantic inflow properties (Skliris et al., 2018). A pronounced east–west contrast persists across depth, indicating that salinity anomalies penetrate well into intermediate waters, consistent with evidence of progressive warming and salinification of Levantine Intermediate Water (Pinardi and Masetti, 2000; Margirier et al., 2020). This halosteric signal strongly compensates for the thermosteric rise, leading to the well-known thermo–halo compensation characteristic of the Mediterranean (Liu et al., 2025). Local features such as weaker halosteric trends in the Adriatic, influenced by river discharge and dense-water formation, further corroborate the realism of MESMAR-R.
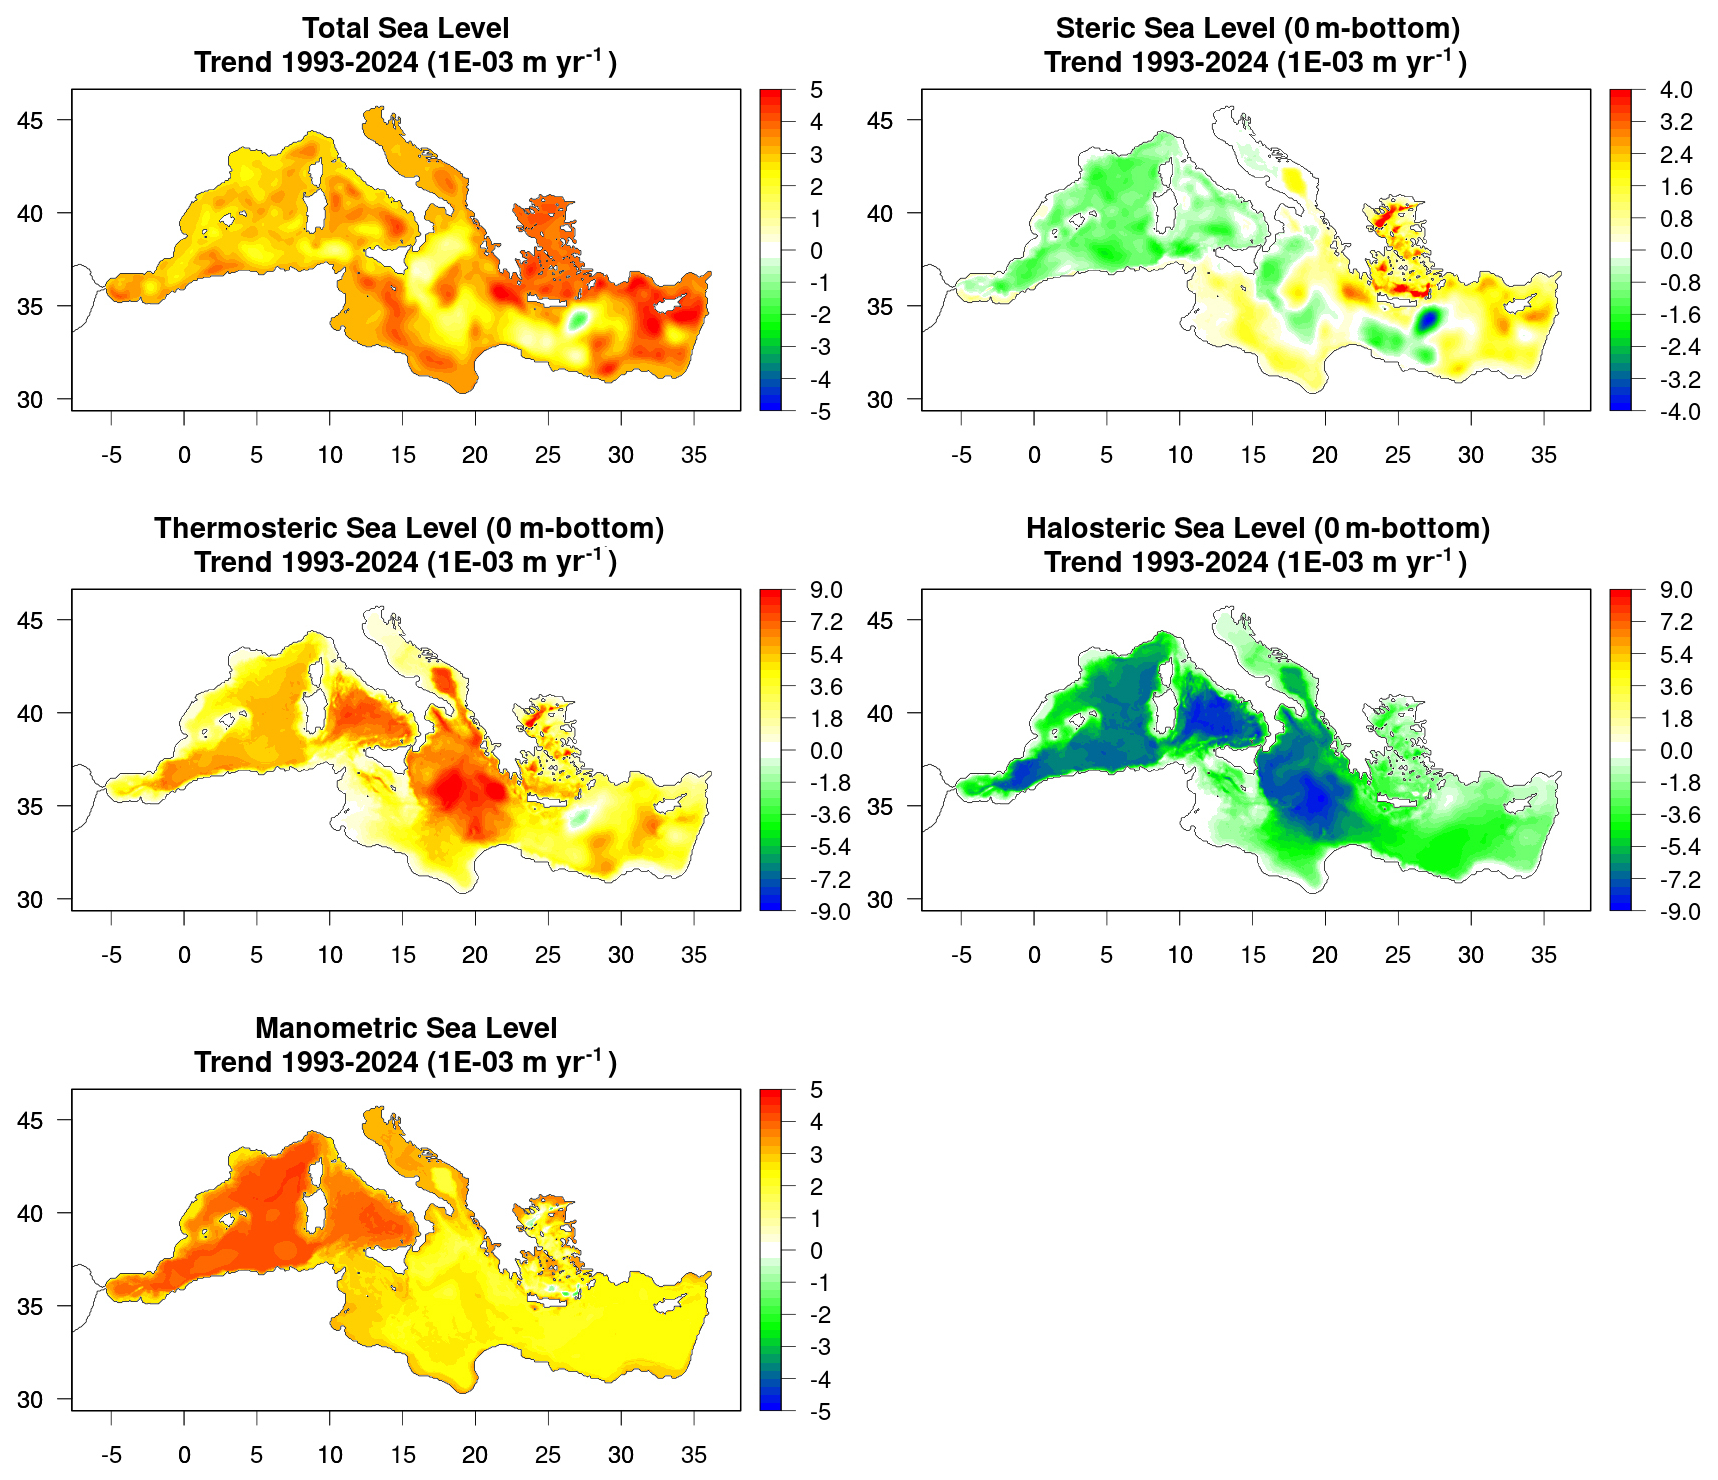
Figure 13Maps of linear trends (1993–2024) for sea level and its components, from MESMAR-R.
Table 4Mediterranean Sea averaged long-term trends over the periods 1999–2024 (1993–2024 in parentheses), separated for the entire basin, the western and eastern basins as defined in Sect. 2.5.
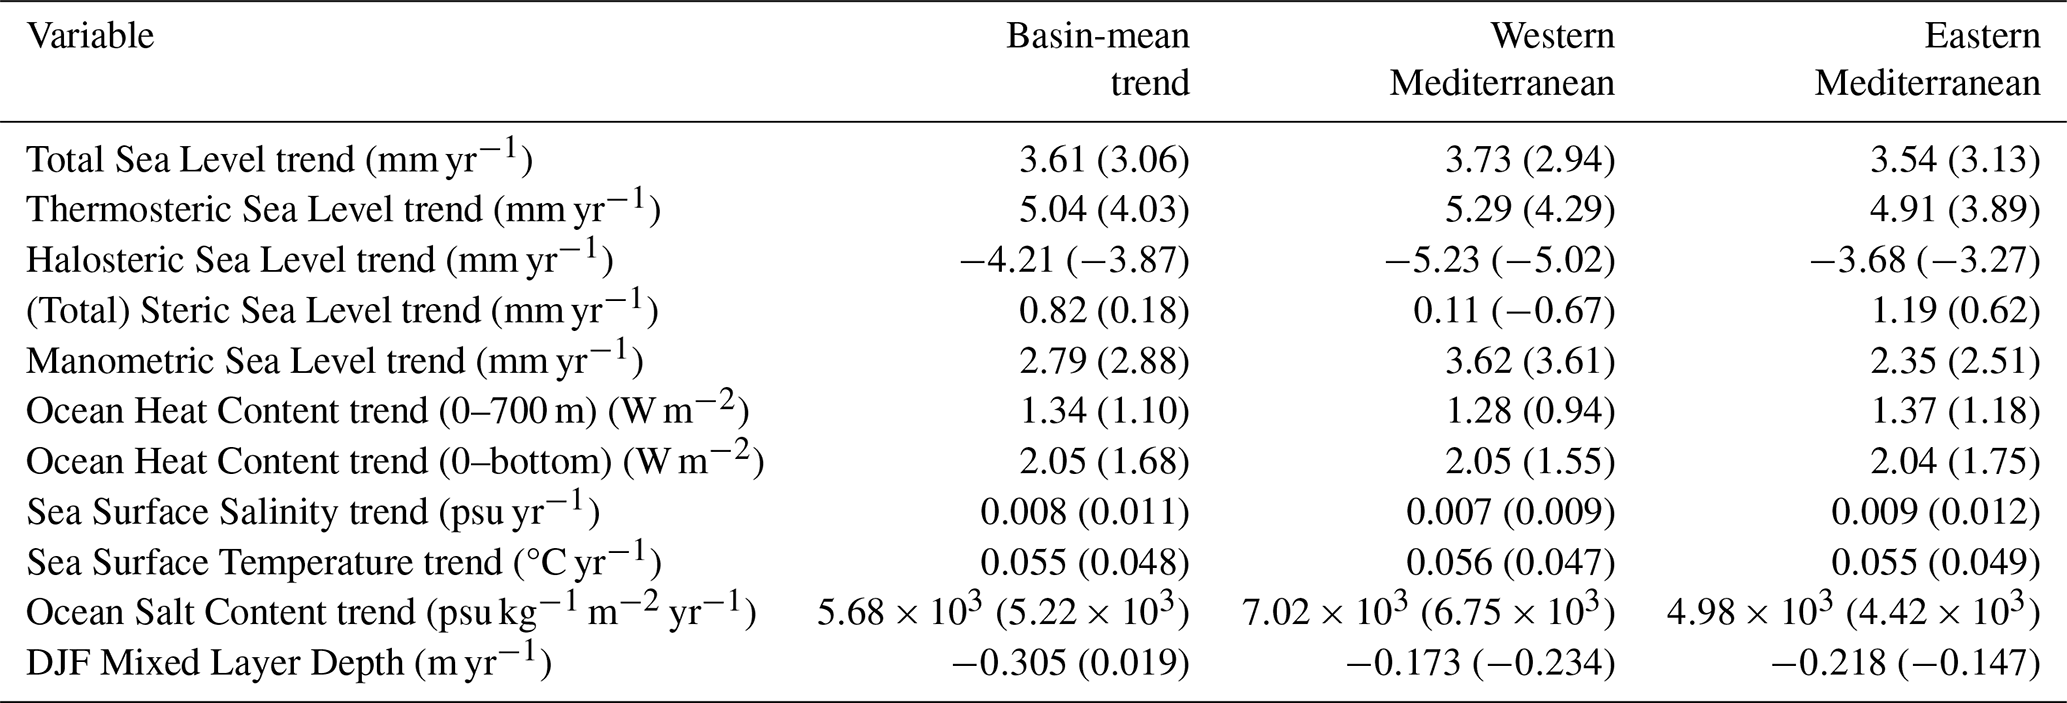
The decomposition of sea-level rise into steric and manometric components (by difference) shows that basin-mean Mediterranean sea-level rise in MESMAR-R is dominated by mass changes rather than steric contributions, i.e., the basin's response to the Atlantic sea-level rise via exchanges through the Strait of Gibraltar. The basin-average total sea-level trend of approximately 3.06 mm yr−1 is in excellent agreement with the Copernicus Marine Service Mediterranean Sea Level Indicator and with external literature estimates ranging from 2.5 to 4.0 mm yr−1 (Calafat et al., 2012; Marcos and Tsimplis, 2008). By contrast, the manometric sea level rise is equal to 2.88 mm yr−1, accounting for 94 % of the sea level rise over 1993–2024 and in agreement with independent estimates based on sea level budget analysis (Storto et al., 2024). Wind-stress-curl trends in MESMAR-R do not appear to exert first-order control on the basin-mean sea-level rise; however, positive curl anomalies over parts of the eastern Mediterranean (Fig. 15) may contribute locally to the intermediate-layer warming signal.
The basin-average ocean heat content (OHC in the top 700 m, Fig. 14 and Table 4) trend from MESMAR-R is 1.10 (1.34) W m−2 for the period 1993–2024 (1999–2024), in line with recent observational and reanalysis-based assessments (Pisano et al., 2020; von Schuckmann et al., 2016). MESMAR-R also captures the characteristic east–west contrast in heat-content evolution: the eastern basin exhibits the stronger long-term warming trend, whereas the western-basin time series shows the larger seasonal-to-interannual amplitude. Trend maps show spatially coherent warming extending from the surface to intermediate depths (∼300–700 m), associated with the warming and deep penetration of LIW. The implied vertical structure is consistent with the findings of Margirier et al. (2020), who documented abrupt warming and salinification of intermediate waters beginning in the early 2000s. The warming pattern in MESMAR-R aligns with the basin's sensitivity to changes in surface heat fluxes and stratification, and the weak wind-stress-curl trends suggest that mechanical forcing plays a secondary role compared with thermohaline adjustments.
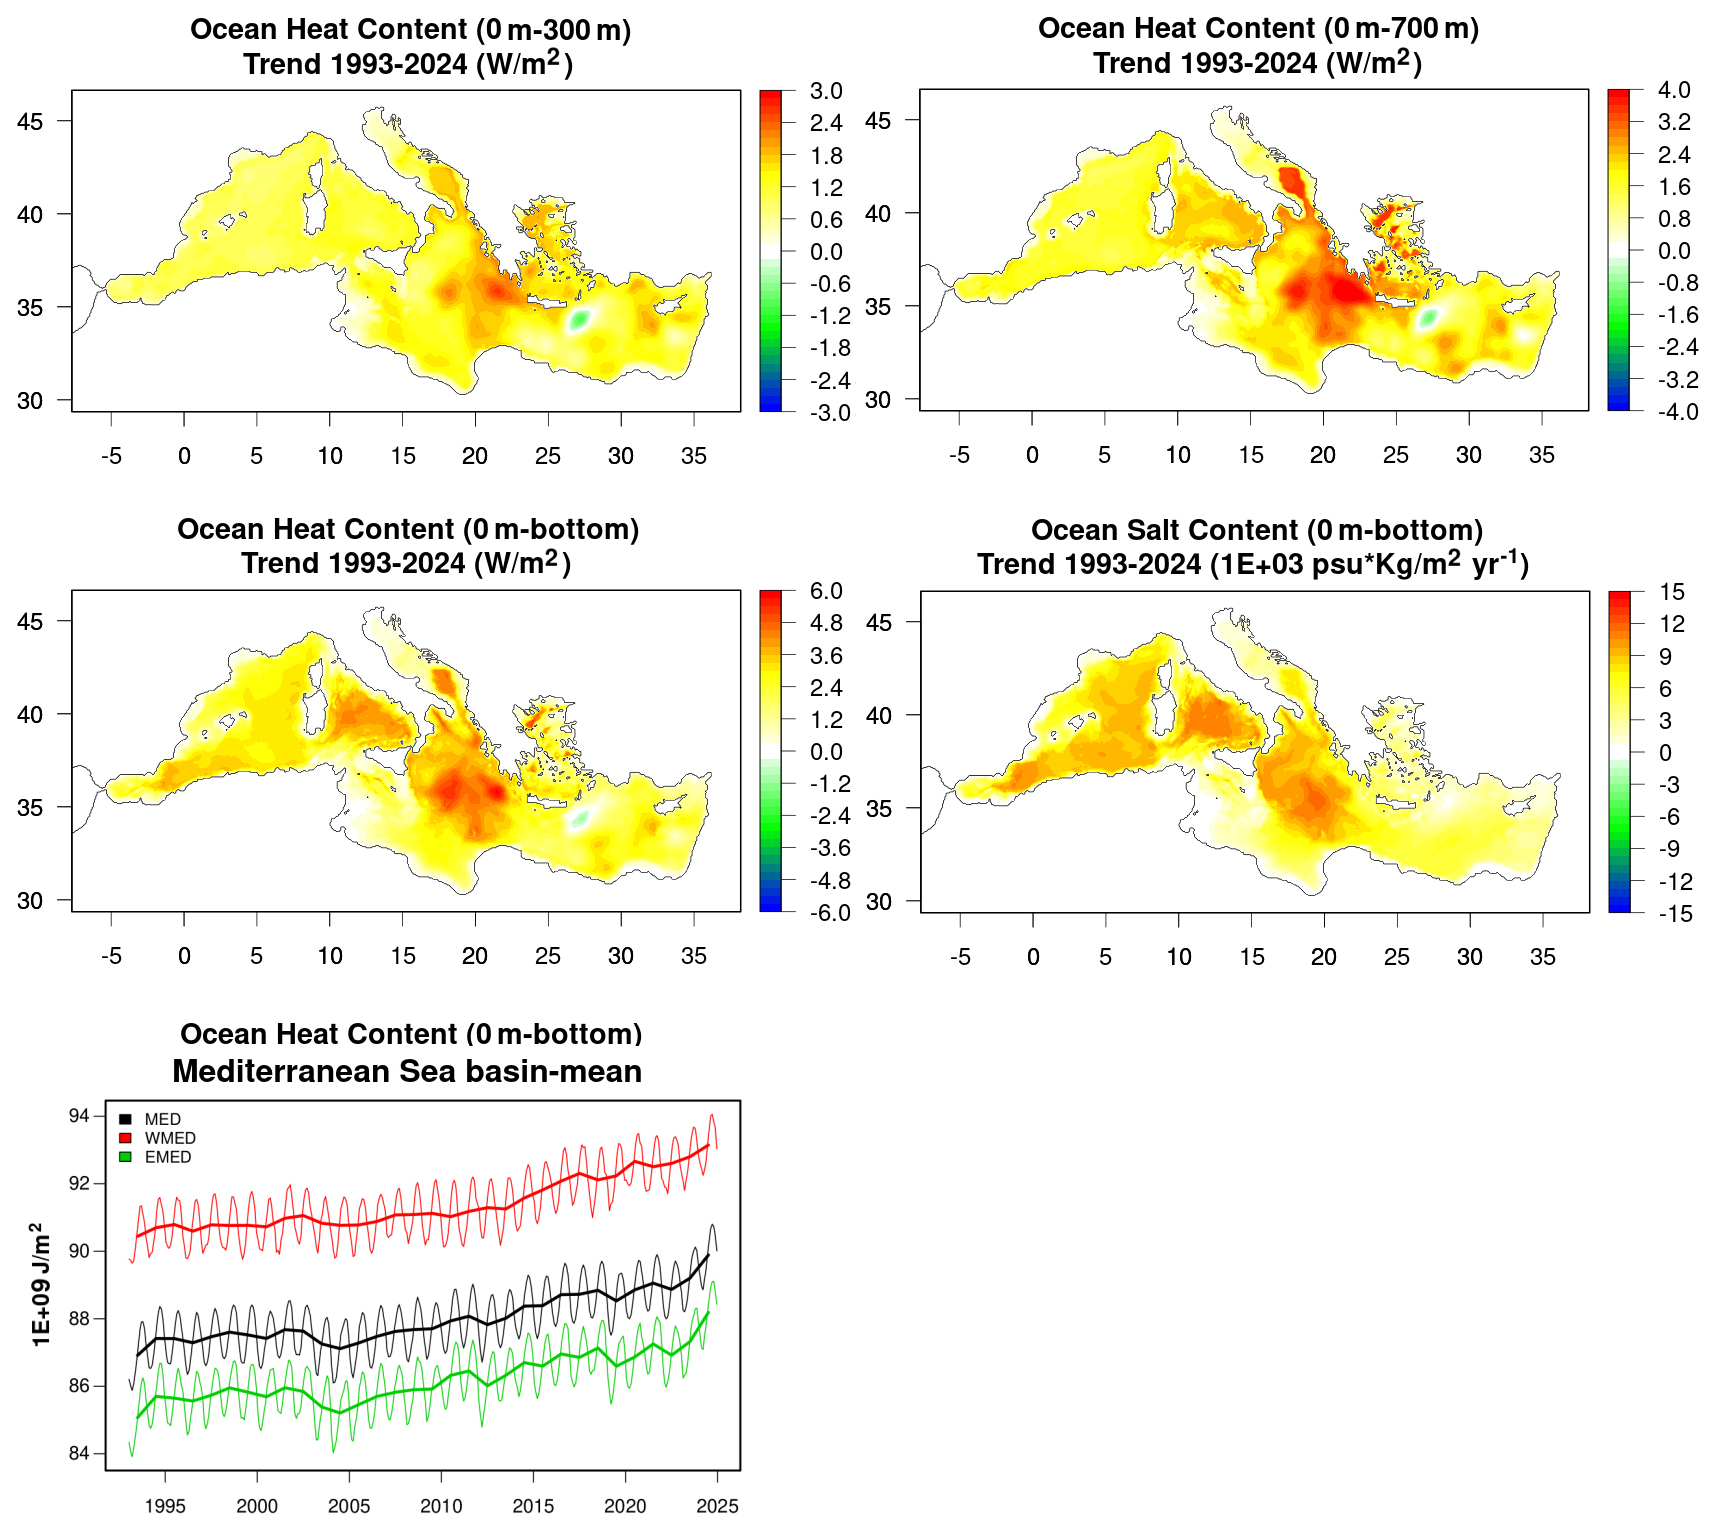
Figure 14Maps of linear trends (1993–2024) for ocean heat and salt content, and OHC timeseries from MESMAR-R.
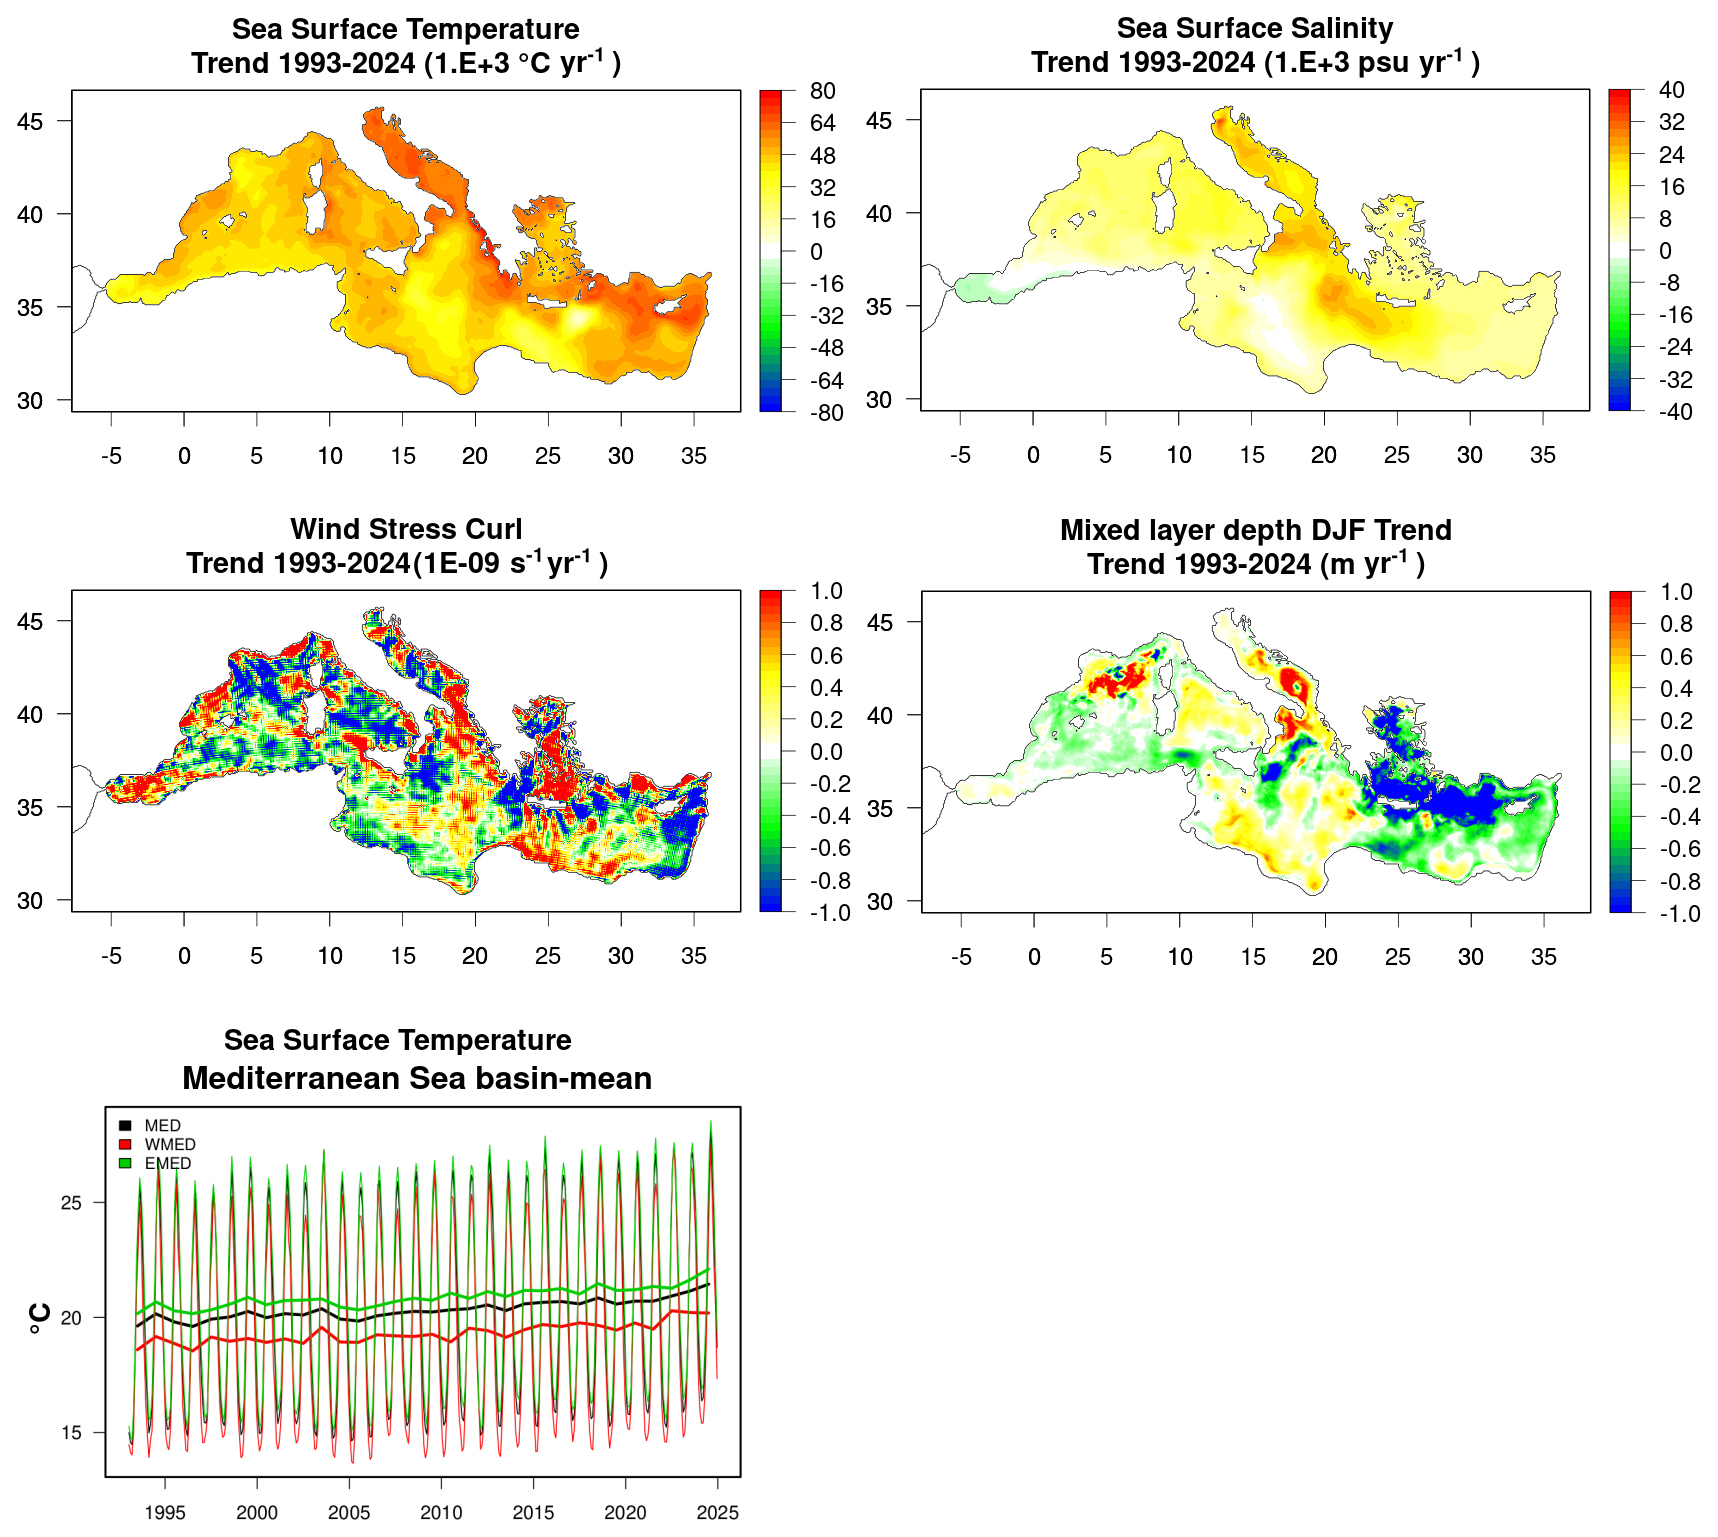
Figure 15Maps of linear trends (1993–2024) for selected variables, and time series of SST, from MESMAR-R.
5.2 Atmospheric long-term changes from the MESMAR-R reanalysis
The trends in near-surface atmospheric variables over 1993–2024 (Fig. 16 and Table 5) depict a Mediterranean–southern Europe climate signal that is fully consistent with the “hot-spot” character of the region described in previous work (Giorgi and Lionello, 2008; MedECC, 2020). In winter (DJF), 2 m air temperature shows a robust warming over almost the entire domain, with maxima over central and eastern Europe and weaker positive trends over the Mediterranean Sea itself; this corresponds well to the MED-average DJF warming of +0.040 °C yr−1. Precipitation trends are more heterogeneous, with modest drying over much of the western and central Mediterranean and parts of North Africa, and localized increases along the northern mountain ranges (e.g., Alps-Dinaric arc), in line with earlier observational and modelling studies that report winter precipitation decreases over the Mediterranean land areas but more mixed signals at higher latitudes and elevations (Hoerling et al., 2012; Hertig and Tramblay, 2017; Beranová et al., 2025). Localized coastal trends are also in agreement with global reanalyses such as ERA5 (not shown). Column-integrated precipitable water increases almost everywhere in DJF (+0.023 % yr−1 increase on average), while near-surface relative humidity shows a dipole structure, with slight moistening over northern Europe and drying over the southern flanks of the basin. These changes point to a more moisture-laden but thermally driven winter atmosphere in which enhanced water vapour does not systematically translate into increased mean precipitation (with an average DJF precipitation trend of mm d−1 yr−1), consistent with recent moisture-budget analyses based on ERA5 that highlight the dominant role of transient processes in transporting oceanic moisture onto surrounding land (Tootoonchi et al., 2025).
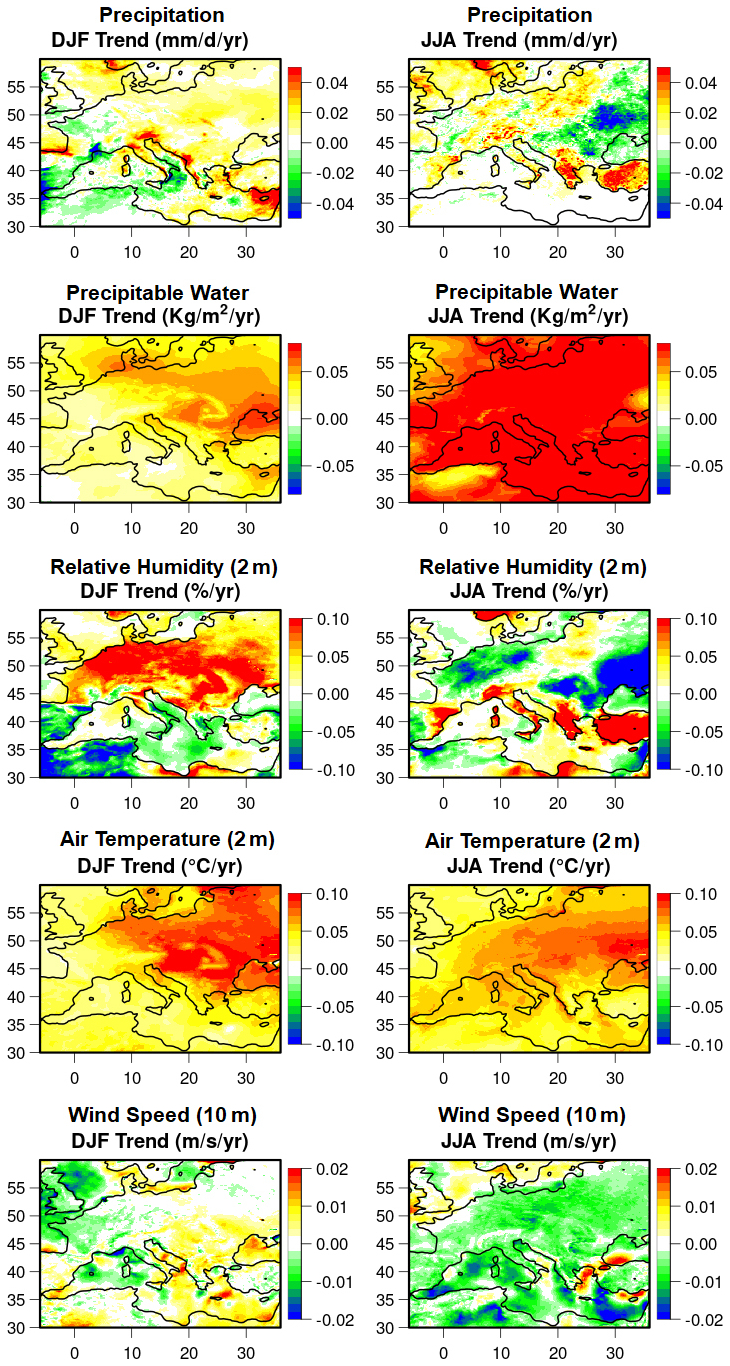
Figure 16Winter (DJF) and summer (JJA) trends of selected atmospheric variables from MESMAR-R, computed over the period 1993–2024.
Table 5Mediterranean region-averaged trends for the four seasons and selected variables, from MESMAR-R over the period 1993–2024. The region is defined as 30–45° N, 10° W–40° E (land and sea combined), close to the domain used by Giorgi and Lionello (2008) but without the Alpine region.
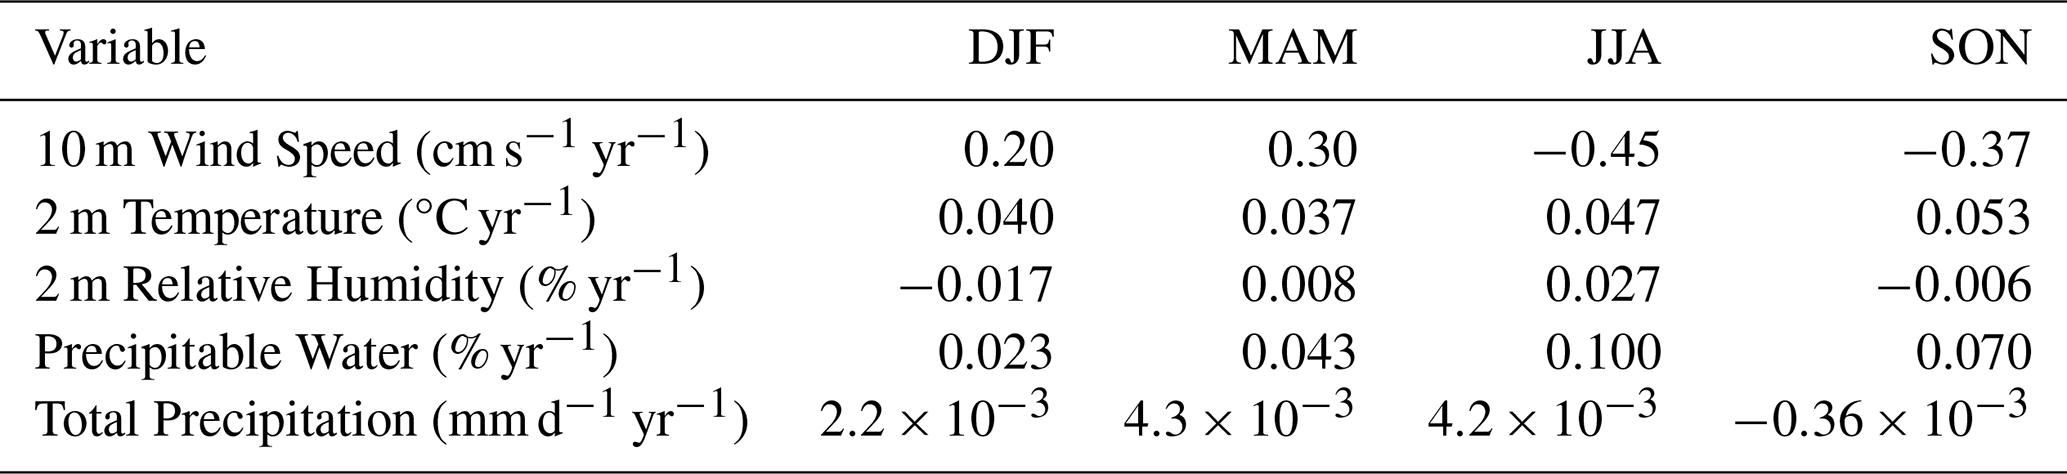
Summer (JJA) trends display an even clearer expression of Mediterranean aridification. Near-surface temperature increases are larger than in winter in southern Europe and the Mediterranean region and exhibit a strong meridional gradient (average JJA warming of +0.047 °C yr−1, in line with projections and recent assessments of compound hot–dry summers over the region, i.e., Giorgi and Lionello, 2008; Lhotka et al., 2023; MedECC, 2020). Mean precipitation shows heterogeneous behavior, with neutral tendency in the southern Mediterranean and mixed above; at the same time, precipitable water exhibits strong positive trends over essentially the whole domain (average JJA trend of +0.100 % yr−1) while near-surface relative humidity decreases over large parts of Europe while the southern Mediterranean shows a small increase. This combination of higher column water vapour, lower relative humidity, and reduced mean precipitation is typical of a warming, drying regime where the atmosphere can hold more moisture (Hoerling et al., 2012; González-Hidalgo and and Vicente-Serrano, 2025; de Figueiredo et al., 2025) but does not necessarily precipitate more often, instead favouring longer dry spells punctuated by intense events (Zittis et al., 2021; Senatore et al., 2026).
The trends in 10 m wind speed are comparatively modest, but they exhibit coherent regional structures that can lead to changes in winter oceanic mixed-layer depth (MLD, Fig. 15). In DJF, MESMAR-R shows localized increases in surface wind speed over the Gulf of Lion and parts of the northern Ionian/Aegean, consistent with the average DJF trend of +0.20 cm s−1 yr−1 together with small negative temperature trends relative to surrounding regions. These areas coincide with weakly positive DJF MLD trends for the full 1993–2024 period, indicating a deepening of the winter mixed layer that is consistent with enhanced mechanical mixing and stronger buoyancy loss. Conversely, in the Levantine and southeastern Mediterranean, winter MLD trends are negative (shoaling) and co-occur with marked warming and slight wind weakening, suggesting reduced buoyancy loss and a decline in deep or intermediate-water formation. The large-scale wind-stress-curl trends derived earlier show only modest changes, but positive curl anomalies in parts of the eastern basin support a dynamical picture in which circulation adjustments and stratification changes modulate the mixed-layer response on top of local surface-flux trends.
Achieving a dynamically consistent reconstruction of the recent atmosphere-ocean-hydrology evolution over the Mediterranean region, one of the world's most prominent climate-change hotspots, is essential for disentangling the processes that govern its regional response to global warming. Here, we have presented one of the first regional coupled reanalysis produced to date, to our knowledge. The regional reanalysis system, called MESMAR-R, features state-of-the-art ocean, weather, and river discharge numerical models, complemented with data assimilation systems in both the atmosphere and the ocean, although these are weakly coupled in the sense that observations in one medium do not directly affect analysis corrections in the other medium. Atmospheric data assimilation is somewhat simple (based on large-scale three-dimensional nudging) and not observation-space-based; yet the system provides an observation-aware atmosphere-ocean-consistent reconstruction of the latest 32 years (1993–2024).
The ocean component of MESMAR-R embeds an advanced variational data assimilation system and demonstrates clear strengths at the surface and in the upper ocean, particularly for sea level, sea surface salinity, and upper-layer temperature. These results confirm the quality of the new reanalysis in the layer most relevant to air–sea interaction and marine variability. Remaining differences in mid-depth temperature suggest areas for further improvement, possibly linked to intermediate-water representation. The spatial patterns of skill scores reinforce the basin-wide good performances of MESMAR-R at the sea surface, with the clearest benefits relative to external products, especially for salinity and sea level. Localized degradations (e.g., in the northern Adriatic and Aegean Seas) suggest areas where representation of strong riverine inputs and complex circulation could be further optimized.
Overall, the atmospheric evaluation confirms that MESMAR-R performs reasonably well given its simplified atmospheric data assimilation approach based on large-scale nudging. While its near-surface atmospheric variables generally exhibit higher RMSE than those from ERA5 and CERRA, the differences remain moderate, and the fields are of comparable quality at the basin's scale. Localized improvements indicate that the coupled system can maintain internally consistent air–sea interactions despite the limited atmospheric assimilation. These results demonstrate that, although MESMAR-R does not aim to compete with dedicated atmospheric reanalyses, its atmospheric component provides a physically coherent and sufficiently accurate representation of the Mediterranean climate to support further process-oriented investigations.
Several sensitivity tests were conducted to disentangle the impact of coupling and data assimilation in MESMAR-R. These demonstrate that data assimilation in both components is essential for optimal coupled performance. MESMAR-R achieves the best compromise between realism and stability, with coupling improving certain surface metrics (notably salinity) and atmospheric relaxation further enhancing the representation of SST and SLA. The results highlight that while coupling alone is not sufficient to match the reanalysis skill, it becomes most effective when supported by data assimilation in both the ocean and atmosphere. The sensitivity experiments indicate that coupling most strongly affects regions where the air–sea humidity and wind-speed fields are highly sensitive to ocean–atmosphere feedback, with evaporation acting as the primary mediator of salinity changes. The results are consistent with the RMSE analysis, where coupling intensifies latent heat losses (e.g., Aegean and parts of the eastern Mediterranean), and coupled configurations outperform uncoupled ones. This was also strengthened by the assessment of the analysis increments whose average signal primarily responds to systematic error corrections.
The analysis of oceanic trends demonstrates that MESMAR-R has provided a coherent and physically consistent reconstruction of Mediterranean climate evolution over the past three decades. The reanalysis captures the basin-wide salinification, the thermo–halo compensation of steric sea-level change, the mass-driven nature of Mediterranean sea-level rise, and a heat-content increase fully aligned with observational estimates. Long-term atmospheric trends from MESMAR-R (1993–2024) reveal a climate signal fully consistent with the well-documented Mediterranean hot-spot behavior. Winter and summer both exhibit pronounced near-surface warming, widespread drying, and strong moistening of the atmospheric column, confirming the thermodynamic intensification of the regional hydrological cycle.
An important caveat is that the observational information is not homogeneous over 1993–2024. Changes in the availability, type, and spatial distribution of ocean observations can affect both reanalysis accuracy and the temporal comparability of observation-based verification statistics, particularly during earlier or sparsely sampled periods (Storto et al., 2019a). A similar limitation applies to the atmospheric component: because MESMAR-R is spectrally nudged towards ERA5, its large-scale atmospheric constraint partly inherits the time-varying information content of the observing system assimilated in ERA5 (Hersbach et al., 2020). Inter-decadal variability and trends should therefore be interpreted by accounting for this temporally evolving observational data.
MESMAR-R, while presenting room for further improvement in the future (observation space-based atmospheric data assimilation and air–sea balanced corrections), represents a unique reconstruction of the past climate in the Mediterranean region with more dynamically consistent atmospheric and oceanic fields than in uncoupled systems. Its ocean-focused design mirrors state-of-the-art performance for the ocean component, despite its moderate spatial resolution. The primary advantage of the MESMAR-R reanalysis is, however, the balanced response across the atmosphere and the ocean in the Mediterranean Sea, which makes it a valuable product to assess compound events in the region, and any other strongly coupled air–sea process, including, e.g., medicanes and heavy precipitation events; the present paper, however, provides a first climatological and mean-state evaluation and does not constitute a dedicated assessment of strongly coupled events, which is left for future analyses. The six-hourly and daily MESMAR-R output is suitable for these applications, and future work will quantify event timing, amplitude, mixed-layer response, and coupled feedback against independent observations. Nonetheless, the ability of the underlying MESMAR system to represent coupled extreme events has already been examined for Mediterranean tropical-like cyclones by Storto et al. (2023a).
MESMAR-R combines an incremental three-dimensional variational analysis in the ocean with scale-selective spectral nudging of the atmospheric prognostic variables toward ERA5. The two procedures are applied independently in their respective components. Consequently, the system is weakly coupled: ocean observations do not generate an instantaneous atmospheric analysis increment, and the atmospheric large-scale constraint does not generate an instantaneous ocean analysis increment. Cross-component information is transferred dynamically during the subsequent coupled model integration through the exchanged surface fluxes, sea-surface state variables, atmospheric pressure, and river discharge.
Let xb be the ocean background state at an analysis time, the model-space increment, y the observation vector, ℋ the nonlinear observation operator, and H its tangent-linear approximation about xb. The incremental 3DVAR analysis is obtained by minimizing
where the innovation vector is
and B and R are the background- and observation-error covariance matrices, respectively. Equation (A1) is three-dimensional because no model trajectory is included in the cost function. However, the scheme is usually referred to as FGAT (First Guess at Appropriate Time) as the innovations are formed by comparing the observations entering a given analysis with the background state closer to observation time (at a 6 h frequency within the 3 d assimilation window).
For numerical efficiency, the background-error covariance is represented through a control-variable transform,
where v has approximately unit covariance. In MESMAR-R, V combines the multivariate vertical covariance structures represented by spatially varying empirical orthogonal functions with horizontal recursive-filter operators and the balance relationships used by the ocean analysis system. The covariance statistics are derived from monthly anomalies of the previous coupled-reanalysis iteration relative to the 1998–2021 climatology.
Substitution of Eq. (A3) into Eq. (A1) gives the preconditioned cost function
with gradient
The minimizing control vector va provides the analyzed ocean state
The observation vector includes temperature and salinity profiles and along-track altimetric observations. The altimetric component uses the dynamic-height observation operator and the Mediterranean mean dynamic topography described in the main text. Variational quality control reduces the influence of observations whose departures are inconsistent with the assumed background and observation errors, without the need for rejecting them.
In addition to the discrete 3DVAR analyses, weak surface constraints are applied to sea-surface temperature and salinity as Newtonian relaxation tendencies,
with e-folding times of approximately 15 d for SST and 300 d for SSS. A separate large-scale deep-ocean bias-correction term is applied as described by Storto and Yang (2024).
The atmospheric component is not analyzed through an observation-space variational method. Instead, the large spatial scales of selected WRF prognostic fields are continuously constrained toward three-hourly ERA5 fields. For a generic horizontal atmospheric field , its two-dimensional spectral representation at each model level may be written as
The large-scale projection retained by the nudging is
where Kx=6 and Ky=5 in the MESMAR-R configuration, corresponding approximately to wavelengths longer than 850 km over the model domain. The prognostic equation is augmented by the scale-selective relaxation tendency
where ℳψ contains the unnudged WRF dynamical and physical tendencies and Gψ is the nudging coefficient. It is convenient to express the latter as
with τψ≃1 h for horizontal wind and temperature and τψ≃1 d for humidity. ERA5 fields are temporally interpolated between their three-hourly input times before the nudging tendency is evaluated. Spatial scales shorter than the spectral cutoff are not directly relaxed, allowing regional circulation, boundary-layer structures, orographically forced features, and coupled mesoscale variability to develop according to the regional model dynamics and physics.
The term weakly coupled refers to the absence of cross-component terms in the instantaneous analysis operators. In compact form, the analysis step can be represented as
where 𝒜o denotes the ocean 3DVAR analysis and 𝒩a the continuous atmospheric spectral-nudging operator. There is no coupled covariance term that directly maps ocean innovations into an atmospheric increment, or vice versa. Nevertheless, the ensuing model integration transfers the analyzed information between components through dynamically consistent air–sea and land–ocean exchanges (formally, , namely the background itself depends on the previous cycle's analyses of both Earth system components ( and ), so that the cross-medium observation propagation is still present, but with delay.
The NEMO Ocean model code (v4.0.7) is available at https://forge.nemo-ocean.eu/nemo/nemo (last access: 10 September 2026), the WRF atmospheric model code (v4.3.3) is available at https://github.com/wrf-model/WRF (WRF, 2023), and the HD hydrological discharge model (v5.1) is available at https://doi.org/10.5281/zenodo.5707587 (Hagemann and Ho-Hagemann, 2021). The frozen version of the MESMAR v1 code used in this paper is available at https://doi.org/10.5281/zenodo.7898938 (Storto et al., 2023b). The ocean variational data assimilation is available at: https://baltig.cnr.it/nemo_ismar-rm/3dvar_histrea (last access: 10 September 2026). Specific configuration files of the models and coupler used within this study are contained in the dataset record (https://doi.org/10.5281/zenodo.22054519, Storto et al., 2026a).
The MESMAR-R reanalysis data files used in this study are available for download from Storto et al. (2026a) (https://doi.org/10.5281/zenodo.22054519). Such data records contain monthly mean fields, and data assimilation files (observation innovation and statistics, analysis increments), together with post-processed data as used in the manuscripts (linear trends), configuration files, and selected 2D daily mean ocean fields. Additionally, selected daily 2D atmospheric fields are available from Storto et al. (2026b) (https://doi.org/10.5281/zenodo.22229855) and Storto et al. (2026c) (https://doi.org/10.5281/zenodo.22232925). Higher-frequency fields (6-hourly), not used in this study but produced, are available on request from the authors and are planned to be published in institutional data hubs soon.
AS and VdT developed the regional coupled model; AS and CY designed the study; AS performed the reanalysis and the sensitivity experiments; AS prepared the manuscript with contributions from all co-authors.
At least one of the (co-)authors is a member of the editorial board of Ocean Science. The peer-review process was guided by an independent editor, and the authors also have no other competing interests to declare.
Publisher's note: Copernicus Publications remains neutral with regard to jurisdictional claims made in the text, published maps, institutional affiliations, or any other geographical representation in this paper. The authors bear the ultimate responsibility for providing appropriate place names. Views expressed in the text are those of the authors and do not necessarily reflect the views of the publisher.
This article is part of the special issue “Evaluation of ocean reanalyses to meet users' needs”. It is not associated with a conference.
We acknowledge the use of CINECA's computing and archive facilities in this research. We specifically acknowledge Sebastien Masson (LOCEAN/IPSL) and Sophie Valcke (CERFACS) for their valuable support in the use of the NEMO and WRF interfaces to the OASIS coupler, Stefan Hagemann and Ha Thi Minh Hagemann (Hereon) for their kind support in using the HD model, and Hao Zuo and Magdalena Balmaseda (ECMWF) for providing near-real-time ECMWF ocean data for the ocean boundary conditions of MESMAR. We thank three reviewers and the editor for their valuable suggestions that improved the quality of this paper.
This research is supported by programme CN00000013, the “National Centre for HPC, Big Data and Quantum Computing” Directorial Decree (grant no. 1031 of 17 June 2022), from the resources of the PNRR MUR – M4C2 – Investment 1.4 – “National Centers” Directorial Decree (grant no. 3138 of 16 December 2021).
This paper was edited by Bernadette Sloyan and reviewed by Xiaolin Yu, Alma Carolina Castillo-Trujillo, and one anonymous referee.
Adler, R. F., Huffman, G. J., Chang, A., Ferraro, R., Xie, P., Janowiak, J., Rudolf, B., Schneider, U., Curtis, S., Bolvin, D., Gruber, A., Susskind, J., and Arkin, P.: The Version-2 Global Precipitation Climatology Project (GPCP) Monthly Precipitation Analysis (1979–Present), J. Hydrometeorol., 4, 1147–1167, https://doi.org/10.1175/1525-7541(2003)004<1147:TVGPCP>2.0.CO;2, 2003.
Aydogdu, A., Miraglio, P., Escudier, R., Clementi, E., and Masina, S.: The dynamical role of upper layer salinity in the Mediterranean Sea, in: 7th edition of the Copernicus Ocean State Report (OSR7), edited by: von Schuckmann, K., Moreira, L., Le Traon, P.-Y., Grégoire, M., Marcos, M., Staneva, J., Brasseur, P., Garric, G., Lionello, P., Karstensen, J., and Neukermans, G., Copernicus Publications, State Planet, 1-osr7, 6, https://doi.org/10.5194/sp-1-osr7-6-2023, 2023.
Ballarotta, M., Ubelmann, C., Veillard, P., Prandi, P., Etienne, H., Mulet, S., Faugère, Y., Dibarboure, G., Morrow, R., and Picot, N.: Improved global sea surface height and current maps from remote sensing and in situ observations, Earth Syst. Sci. Data, 15, 295–315, https://doi.org/10.5194/essd-15-295-2023, 2023.
Beranová, R., Huth, R., and Vít, V.: A multidataset analysis of precipitation trends in Europe, J. Hydrometeorol., 26, 1003–1015, https://doi.org/10.1175/JHM-D-24-0114.1, 2025.
Bhargava, K., Kalnay, E., Carton, J. A., and Yang, F.: Estimation of systematic errors in the GFS using analysis increments, J. Geophys. Res.-Atmos., 123, 1626–1637, https://doi.org/10.1002/2017JD027423, 2018.
Brewin, R. J. W., Sathyendranath, S., Jackson, T., Barlow, R., Brotas, V., Airs, R., and Lamont, T.: Influence of light in the mixed-layer on the parameters of a three-component model of phytoplankton size class, Remote Sens. Environ., 168, 437–450, https://doi.org/10.1016/j.rse.2015.07.004, 2015.
Calafat, F. M., Chambers, D. P., and Tsimplis, M. N.: Mechanisms of decadal sea level variability in the eastern North Atlantic and the Mediterranean Sea, J. Geophys. Res.-Oceans, 117, C09022, https://doi.org/10.1029/2012JC008285, 2012.
Camus, P., Haigh, I. D., Nasr, A. A., Wahl, T., Darby, S. E., and Nicholls, R. J.: Regional analysis of multivariate compound coastal flooding potential around Europe and environs: sensitivity analysis and spatial patterns, Nat. Hazards Earth Syst. Sci., 21, 2021–2040, https://doi.org/10.5194/nhess-21-2021-2021, 2021.
Canuto, V. M., Howard, A., Cheng, Y., and Dubovikov, M. S.: Ocean turbulence. Part I: One-point closure model – momentum and heat vertical diffusivities, J. Phys. Oceanogr., 31, 1413–1426, 2001.
Craig, A. P., Valcke, S., and Coquart, L.: Development and performance of a new version of the OASIS coupler, OASIS3-MCT_3.0, Geosci. Model Dev., 10, 3297–3308, https://doi.org/10.5194/gmd-10-3297-2017, 2017.
Cramer, W., Guiot, J., Fader, M., Garrabou, J., Gattuso, J.-P., Iglesias, A., Lange, M. A., Lionello, P., Llasat, M. C., Paz, S., Peñuelas, J., Snoussi, M., Toreti, A., Tsimplis, M. N., and Xoplaki, E.: Climate change and interconnected risks to sustainable development in the Mediterranean, Nat. Clim. Change, 8, 972–980, https://doi.org/10.1038/s41558-018-0299-2, 2018.
de Figueiredo, D. R., Bento, S., and Condesso de Melo, M. T.: Freshwater quality challenges in southern Europe under an increasingly warmer and drier climate scenario, Water, 17, 1873, https://doi.org/10.3390/w17131873, 2025.
Doury, A., Somot, S., Gadat, S., Ribes, A., and Corre, L.: Regional climate model emulator based on deep learning: concept and first evaluation of a novel hybrid downscaling approach, Clim. Dynam., 60, 1751–1779, https://doi.org/10.1007/s00382-022-06343-9, 2023.
Escudier, R., Clementi, E., Cipollone, A., Pistoia, J., Drudi, M., Grandi, A., Lyubartsev, V., Lecci, R., Aydogdu, A., Delrosso, D., Omar, M., Masina, S., Coppini, G., and Pinardi, N.: A high-resolution reanalysis for the Mediterranean Sea, Front. Earth Sci., 9, 702285, https://doi.org/10.3389/feart.2021.702285, 2021.
Fox-Hughes, P., Su, C.-H., Eizenberg, N., White, C., Steinle, P., Jakob, D., Black, M., Dowdy, A., Brown, A., Nathan, R., and Acharya, S. C.: A review of early severe weather applications of high-resolution regional reanalysis in Australia, Meteorol. Appl., 29, e2087, https://doi.org/10.1002/met.2087, 2022.
Gelaro, R., McCarty, W., Suárez, M. J., Todling, R., Molod, A., Takacs, L., Randles, C. A., Darmenov, A., Bosilovich, M. G., Reichle, R., Wargan, K., Coy, L., Cullather, R., Draper, C., Akella, S., Buchard, V., Conaty, A., da Silva, A. M., Gu, W., Kim, G., Koster, R., Lucchesi, R., Merkova, D., Nielsen, J. E., Partyka, G., Pawson, S., Putman, W., Rienecker, M., Schubert, S. D., Sienkiewicz, M., and Zhao, B.: The Modern-Era Retrospective Analysis for Research and Applications, Version 2 (MERRA-2), J. Climate, 30, 5419–5454, https://doi.org/10.1175/JCLI-D-16-0758.1, 2017.
Giorgi, F. and Lionello, P.: Climate change projections for the Mediterranean region, Global Planet. Change, 63, 90–104, 2008.
González-Hidalgo, J. C. and Vicente-Serrano, S. M.: Is there a precipitation decline in the Mediterranean region? An assessment based on the scientific literature, Int. J. Climatol., 45, e8918, https://doi.org/10.1002/joc.8918, 2025.
Good, S. A., Martin, M. J., and Rayner, N. A.: EN4: quality controlled ocean temperature and salinity profiles and monthly objective analyses with uncertainty estimates, J. Geophys. Res.-Oceans, 118, 6704–6716, https://doi.org/10.1002/2013JC009067, 2013.
Hagemann, S. and Dümenil Gates, L.: Validation of the hydrological cycle of ECMWF and NCEP reanalyses using the MPI hydrological discharge model, J. Geophys. Res.-Atmos., 106, 17901–17917, https://doi.org/10.1029/2000JD900568, 2001.
Hagemann, S. and Ho-Hagemann, H. T. M.: The Hydrological Discharge Model – a river runoff component for offline and coupled model applications (5.1.0), Zenodo [code], https://doi.org/10.5281/zenodo.5707587, 2021.
Haylock, M. R., Hofstra, N., Klein Tank, A. M. G., Klok, E. J., Jones, P. D., and New, M.: A European daily high-resolution gridded data set of surface temperature and precipitation for 1950–2006, J. Geophys. Res.-Atmos., 113, D20119, https://doi.org/10.1029/2008JD010201, 2008.
Hersbach, H., Bell, B., Berrisford, P., Hirahara, S., Horányi, A., Muñoz-Sabater, J., Nicolas, J., Peubey, C., Radu, R., Schepers, D., Simmons, A., Soci, C., Abdalla, S., Abellan, X., Balsamo, G., Bechtold, P., Biavati, G., Bidlot, J., Bonavita, M., De Chiara, G., Dahlgren, P., Dee, D., Diamantakis, M., Dragani, R., Flemming, J., Forbes, R., Fuentes, M., Geer, A., Haimberger, L., Healy, S., Hogan, R., Hólm, E., Janisková, M., Keeley, S., Laloyaux, P., Lopez, P., Lupu, C., Radnoti, G., de Rosnay, P., Rozum, I., Vamborg, F., Villaume, S., and Thépaut, J.-N.: The ERA5 global reanalysis, Q. J. Roy. Meteor. Soc., 146, 1999–2049, https://doi.org/10.1002/qj.3803, 2020.
Hertig, E. and Tramblay, Y.: Regional downscaling of Mediterranean droughts under past and future climatic conditions, Global Planet. Change, 151, 36–48, https://doi.org/10.1016/j.gloplacha.2016.10.015, 2017.
Hoerling, M., Eischeid, J., Perlwitz, J., Quan, X., Zhang, T., and Pegion, P.: On the increased frequency of Mediterranean drought, J. Climate, 25, 2146–2161, https://doi.org/10.1175/JCLI-D-11-00296.1, 2012.
Jousset, S., Mulet, S., Greiner, E., Wilkin, J., Vidar, L., Chafik, L., Raj, R., Bonaduce, A., Picot, N., and Dibarboure, G.: New global mean dynamic topography CNES-CLS-22 combining drifters, hydrography profiles and high frequency radar data, Earth Syst. Sci. Data, 18, 2285–2303, https://doi.org/10.5194/essd-18-2285-2026, 2026.
Juza, M., Fernández-Mora, À., and Tintoré, J.: Sub-regional marine heat waves in the Mediterranean Sea from observations: long-term surface changes, sub-surface and coastal responses, Front. Mar. Sci., 9, 785771, https://doi.org/10.3389/fmars.2022.785771, 2022.
Kourafalou, V. H. and Barbopoulos, K.: High resolution simulations on the North Aegean Sea seasonal circulation, Ann. Geophys., 21, 251–265, https://doi.org/10.5194/angeo-21-251-2003, 2003.
Laloyaux, P., de Boisseson, E., Balmaseda, M., Bidlot, J.-R., Broennimann, S., Buizza, R, Dalhgren, P., Dee, D., Haimberger, L., Hersbach, H., Kosaka, Y., Martin, M., Poli, P., Rayner, N., Rustemeier, E., and Schepers, D.: CERA-20C: A coupled reanalysis of the twentieth century, J. Adv. Model. Earth Syst., 10, 1172–1195, https://doi.org/10.1029/2018MS001273, 2018.
Lellouche, J.-M., Greiner, E., Bourdallé-Badie, R., Garric, G., Melet, A., Drévillon, M., Bricaud, C., Hamon, M., Le Galloudec, O., Regnier, C., Candela, T., Testut, C.-E., Gasparin, F., Ruggiero, G., Benkiran, M., Drillet, Y., and Le Traon, P.-Y.: The Copernicus global 1/12∘ oceanic and sea ice GLORYS12 reanalysis, Front. Earth Sci., 9, 698876, https://doi.org/10.3389/feart.2021.698876, 2021.
Lhotka, O., Bešťáková, Z., and Kyselý, J.: Prolongation of compound dry–hot seasons over Europe under climate change scenarios, Earth's Future, 11, e2023EF003557, https://doi.org/10.1029/2023EF003557, 2023.
Lionello, P. and Scarascia, L.: The relation between climate change in the Mediterranean region and global warming, Reg. Environ. Change, 18, 1481–1493, https://doi.org/10.1007/s10113-018-1290-1, 2018.
Liu, C., Liang, X., and Yu, L.: Salinity trends and mass balances in the Mediterranean Sea: revisit the role of air–sea freshwater fluxes and oceanic exchange, Ocean Sci., 21, 2069–2083, https://doi.org/10.5194/os-21-2069-2025, 2025.
Madec, G. and the NEMO System Team: NEMO Ocean Engine. In Notes du Pôle de modélisation de l'Institut Pierre-Simon Laplace (IPSL) (Version v3.6-patch, Issue 27), Zenodo, https://doi.org/10.5281/zenodo.3248739, 2017.
Marcos, M. and Tsimplis, M. N.: Coastal sea level trends in southern Europe, Geophys. J. Int., 175, 70–82, https://doi.org/10.1111/j.1365-246X.2008.03892.x, 2008.
Margirier, F., Testor, P., Heslop, E., Mallil, K., Bosse, A., Houpert, L., Mortier, L., Bouin, M. N., Coppola, L., D'Ortenzio, F., Durrieu de Madron, X., Mourre, B., Prieur, L., Raimbault, P., and Taillandier, V.: Abrupt warming and salinification of intermediate waters interplays with decline of deep convection in the Northwestern Mediterranean Sea, Sci. Rep., 10, 20923, https://doi.org/0.1038/s41598-020-77859-5, 2020.
Marti, O., Nguyen, S., Braconnot, P., Valcke, S., Lemarié, F., and Blayo, E.: A Schwarz iterative method to evaluate ocean–atmosphere coupling schemes: implementation and diagnostics in IPSL-CM6-SW-VLR, Geosci. Model Dev., 14, 2959–2975, https://doi.org/10.5194/gmd-14-2959-2021, 2021.
MedECC: Climate and Environmental Change in the Mediterranean Basin – Current Situation and Risks for the Future, First Mediterranean Assessment Report, Union for the Mediterranean, Plan Bleu, UNEP/MAP, Marseille, France, 632 pp., Zenodo [data set], https://doi.org/10.5281/zenodo.4768833, 2020.
Mellor, G. L. and Yamada, T.: Development of a turbulence closure model for geophysical fluid problems, Rev. Geophys., 20, 851–875, https://doi.org/10.1029/RG020i004p00851, 1982.
Morel, A. and Maritorena, S.: Bio-optical properties of oceanic waters: a reappraisal, J. Geophys. Res.-Oceans, 106, 7163–7180, https://doi.org/10.1029/2000JC000319, 2001.
Nakanishi, M. and Niino, H.: An improved Mellor–Yamada level-3 model: its numerical stability and application to a regional prediction of advection fog, Bound.-Lay. Meteorol., 119, 397–407, https://doi.org/10.1007/s10546-005-9030-8, 2006.
Pinardi, N. and Masetti, E.: Variability of the large scale general circulation of the Mediterranean Sea from observations and modelling: A review, Palaeogeogr. Palaeocl. Palaeoecol., 158, 153–173, https://doi.org/10.1016/S0031-0182(00)00048-1, 2000.
Pisano, A., Nardelli, B. B., Tronconi, C., and Santoleri, R.: The new Mediterranean optimally interpolated pathfinder AVHRR SST Dataset (1982–2012), Remote Sens. Environ., 176, 107–116, https://doi.org/10.1016/j.rse.2016.01.019, 2016.
Pisano, A., Marullo, S., Artale, V., Falcini, F., Yang, C., Leonelli, F. E., Santoleri, R., and Buongiorno Nardelli, B.: New evidence of mediterranean climate change and variability from sea surface temperature observations, Remote Sens., 12, 132, https://doi.org/10.3390/rs12010132, 2020.
Pujol, M.-I., Dupuy, S., Vergara, O., Sánchez Román, A., Faugère, Y., Prandi, P., Dabat, M.-L., Dagneaux, Q., Lievin, M., Cadier, E., Dibarboure, G., and Picot, N.: Refining the resolution of DUACS along-track Level-3 sea level altimetry products, Remote Sens., 15, 793, https://doi.org/10.3390/rs15030793, 2023.
Ridal, M., Bazile, E., Le Moigne, P., Randriamampianina, R., Schimanke, S., Andrae, U., Berggren, L., Brousseau, P., Dahlgren, P., Edvinsson, L., El-Said, A., Glinton, M., Hagelin, S., Hopsch, S., Isaksson, L., Medeiros, P., Olsson, E., Unden, P., and Wang, Z.: CERRA, the Copernicus European Regional Reanalysis system, Q. J. Roy. Meteorol. Soc., 150, 3385–3411, https://doi.org/10.1002/qj.4764, 2024.
Ruti, P. M., Somot, S., Giorgi, F., Dubois, C., Flaounas, E., Obermann, A., Dell'Aquila, A., Pisacane, G., Harzallah, A., Lombardi, E., Ahrens, B., Akhtar, N., Alias, A., Arsouze, T., Aznar, R., Bastin, S., Bartholy, J., Béranger, K., Beuvier, J., Bouffies-Cloché, S., Brauch, J., Cabos, W., Calmanti, S., Calvet, J.-C., Carillo, A., Conte, D., Coppola, E., Djurdjevic, V., Drobinski, P., Elizalde-Arellano, A., Gaertner, M., Galàn, P., Gallardo, C., Gualdi, S., Goncalves, M., Jorba, O., Jordà, G., L'Heveder, B., Lebeaupin-Brossier, C., Li, L., Liguori, G., Lionello, P., Maciàs, D., Nabat, P., Önol, B., Raikovic, B., Ramage, K., Sevault, F., Sannino, G., Struglia, M. V., Sanna, A., Torma, C., and Vervatis, V.: Med-CORDEX Initiative for Mediterranean climate studies, B. Am. Meteorol. Soc., 97, 1187–1208, https://doi.org/10.1175/BAMS-D-14-00176.1, 2016.
Sammartino, M., Aronica, S., Santoleri, R., and Buongiorno Nardelli, B.: Retrieving Mediterranean Sea Surface Salinity Distribution and Interannual Trends from Multi-Sensor Satellite and In Situ Data, Remote Sens., 14, 2502, https://doi.org/10.3390/rs14102502, 2022.
Schüller, V., Lemarié, F., Birken, P., and Blayo, E.: Quantifying coupling errors in atmosphere–ocean–sea-ice models: a study of iterative and non-iterative approaches in the EC-Earth AOSCM, Geosci. Model Dev., 18, 9167–9187, https://doi.org/10.5194/gmd-18-9167-2025, 2025.
Senatore, A., Davolio, S., Furnari, L., and Mendicino, G.: Reconstructing flood events in Mediterranean coastal areas using different reanalyses and high-resolution meteorological models, J. Hydrometeorol., 21, 1865–1887, https://doi.org/10.1175/JHM-D-19-0270.1, 2020.
Senatore, A., Furnari, L., Nikravesh, G., Castagna, J., and Mendicino, G.: Increasing daily precipitation extremes despite declining annual totals in southern Europe: a modeling study on the effects of Mediterranean Sea warming, Hydrol. Earth Syst. Sci., 30, 2913–2930, https://doi.org/10.5194/hess-30-2913-2026, 2026.
Skamarock, W. C., Klemp, J. B., Dudhia, M. G., Gill, D.O., Liu, Z., Berner, J., Wang, W., Powers, J. O., Duda, M., Barker, D., and Huang, X.-Y.: A description of the Advanced Research WRF model version 4.3.3, NCAR Tech. Note, NCAR, https://doi.org/10.5065/1dfh-6p97, 2021.
Skliris, N., Zika, J. D., Herold, L., Josey, S. A., and Marsh, R.: Mediterranean Sea water budget long-term trend inferred from salinity observations, Clim. Dynam., 51, 2857–2876, https://doi.org/10.1007/s00382-017-4053-7, 2018.
Soukissian, T. H., Karathanasi, F., and Axaopoulos, P.: Offshore renewable energy in the Mediterranean Sea: a review of the resource, existing projects and prospects, Renew. Energy, 179, 1225–1241, https://doi.org/10.1016/j.renene.2021.07.109, 2021.
Storto, A.: Variational quality control of hydrographic profile data with non-Gaussian errors for global ocean variational data assimilation systems, Ocean Model., 104, 226–241, https://doi.org/10.1016/j.ocemod.2016.06.011, 2016.
Storto, A. and Yang, C.: Acceleration of the ocean warming from 1961 to 2022 unveiled by large-ensemble reanalyses, Nat. Commun., 15, 545, https://doi.org/10.1038/s41467-024-44749-7, 2024.
Storto, A., Dobricic, S., Masina, S., and Di Pietro, P.: Assimilating along-track altimetric observations through local hydrostatic adjustment in a global ocean variational assimilation system, Mon. Weather Rev., 139, 738–754, https://doi.org/10.1175/2010MWR3350.1, 2011.
Storto, A., Oddo, P., Cipollone, A., Mirouze, I., and Lemieux-Dudon, B.: Extending an oceanographic variational scheme to allow for affordable hybrid and four-dimensional data assimilation, Ocean Model., 128, 67–86, https://doi.org/10.1016/j.ocemod.2018.06.005, 2018.
Storto, A., Alvera-Azcárate, A., Balmaseda, M. A., Barth, A., Chevallier, M., Counillon, F., Domingues, C. M., Drevillon, M., Drillet, Y., Forget, G., Garric, G., Haines, K., Hernandez, F., Iovino, D., Jackson, L. C., Lellouche, J.-M., Masina, S., Mayer, M., Oke, P. R., Penny, S. G., Peterson, K. A., Yang, C. and Zuo, H.: Ocean reanalyses: recent advances and unsolved challenges, Front. Mar. Sci., 6, 418, https://doi.org/10.3389/fmars.2019.00418, 2019a.
Storto, A., Masina, S., Simoncelli, S., Iovino, D., Cipollone, A., Drevillon, M., Drillet, Y., von Schuckman, K., Parent, L., Garric, G., Greiner, E., Desportes, C., Zuo, H., Balmaseda, M. A., and Peterson, K. A.: The added value of the multi-system spread information for ocean heat content and steric sea level investigations in the CMEMS GREP ensemble reanalysis product, Clim. Dynam., 53, 287–312, https://doi.org/10.1007/s00382-018-4585-5, 2019b.
Storto, A., Hesham Essa, Y., de Toma, V., Anav, A., Sannino, G., Santoleri, R., and Yang, C.: MESMAR v1: a new regional coupled climate model for downscaling, predictability, and data assimilation studies in the Mediterranean region, Geosci. Model Dev., 16, 4811–4833, https://doi.org/10.5194/gmd-16-4811-2023, 2023a.
Storto, A., Hesham Essa, Y., de Toma, V., Anav, A., Sannino, G., Santoleri, R., and Yang, C.: MESMAR v1: A new regional coupled climate model for downscaling, predictability, and data assimilation studies in the Mediterranean region, Coupled model code (1.0), Zenodo [code], https://doi.org/10.5281/zenodo.7898938, 2023b.
Storto, A., Chierici, G., Pfeffer, J., Barnoud, A., Bourdalle-Badie, R., Blazquez, A., Cavaliere, D., Lalau, N., Coupry, B., Drevillon, M., Fourest, S., Larnicol, G., and Yang, C.: Variability in manometric sea level from reanalyses and observation-based products over the Arctic and North Atlantic oceans and the Mediterranean Sea, in: 8th edition of the Copernicus Ocean State Report (OSR8), edited by: von Schuckmann, K., Moreira, L., Grégoire, M., Marcos, M., Staneva, J., Brasseur, P., Garric, G., Lionello, P., Karstensen, J., and Neukermans, G., Copernicus Publications, State Planet, 4-osr8, 12, https://doi.org/10.5194/sp-4-osr8-12-2024, 2024.
Storto, A., de Toma, V., and Yang, C.: MESMAR-R: A Coupled Regional Reanalysis for the Mediterranean Region Covering the period 1993–2024 (configuration files, monthly mean and daily ocean mean data) (Version 1.1) [Data set], Zenodo [data set], https://doi.org/10.5281/zenodo.22054519, 2026a.
Storto, A., de Toma, V., and Yang, C.: Dataset Open MESMAR-R: A Coupled Regional Reanalysis for the Mediterranean Region Covering the period 1993–2024 (daily min/mean/max for surface atmospheric variables) [Data set], Zenodo [data set], https://doi.org/10.5281/zenodo.22229855, 2026b.
Storto, A., de Toma, V., and Yang, C.: Dataset Open MESMAR-R: A Coupled Regional Reanalysis for the Mediterranean Region Covering the period 1993–2024 (daily mean air–sea fluxes and atmospheric diagnostics) [Data set], Zenodo [data set], https://doi.org/10.5281/zenodo.22232925, 2026c.
Tootoonchi, R., Bordoni, S., and D'Agostino, R.: Revisiting the moisture budget of the Mediterranean region in the ERA5 reanalysis, Weather Clim. Dynam., 6, 245–263, https://doi.org/10.5194/wcd-6-245-2025, 2025.
van der Meer, M., de Roda Husman, S., and Lhermitte, S.: Deep learning regional climate model emulators: a comparison of two downscaling training frameworks, J. Adv. Model. Earth Syst., 15, e2022MS003593, https://doi.org/10.1029/2022MS003593, 2023.
von Schuckmann, K., Palmer, M., Trenberth, K., Cazenave, A., Chambers, D., Champollion, N., Hansen, J., Josey, S. A., Loeb, N., Mathieu, P.-P., Meyssignac, B., and Wild, M.: An imperative to monitor Earth's energy imbalance, Nat. Clim. Change, 6, 138–144, https://doi.org/10.1038/nclimate2876, 2016.
von Schuckmann, K., Storto, A., Simoncelli, S., Raj, R. P., Samuelsen, A., de Pascual Collar, A., Garcia Sotillo, M., Szerkely, T., Mayer, M., Peterson, K. A., Zuo, H., Garric, G., and Monier, M.: Ocean heat content, in Copernicus Marine Service Ocean State Report, J. Operat. Oceanogr., 11, S1–S142, https://doi.org/10.1080/1755876X.2018.1489208, 2018.
WRF: wrf-model, GitHub [code], https://github.com/wrf-model/WRF (last access: 10 September 2026), 2023.
Yepes-Arbós, X., van den Oord, G., Acosta, M. C., and Carver, G. D.: Evaluation and optimisation of the I/O scalability for the next generation of Earth system models: IFS CY43R3 and XIOS 2.0 integration as a case study, Geosci. Model Dev., 15, 379–394, https://doi.org/10.5194/gmd-15-379-2022, 2022.
Zittis, G., Bruggeman, A., and Lelieveld, J.: Revisiting future extreme precipitation trends in the Mediterranean, Weather Clim. Ext., 34, 100380, https://doi.org/10.1016/j.wace.2021.100380, 2021.
Zuo, H., Balmaseda, M. A., Tietsche, S., Mogensen, K., and Mayer, M.: The ECMWF operational ensemble reanalysis–analysis system for ocean and sea ice: a description of the system and assessment, Ocean Sci., 15, 779–808, https://doi.org/10.5194/os-15-779-2019, 2019.
- Abstract
- Introduction
- Data and methods
- Validation
- Sensitivity to coupling and data assimilation
- Climate indices
- Discussion and conclusions
- Appendix A: Data-assimilation formulation in MESMAR-R
- Code availability
- Data availability
- Author contributions
- Competing interests
- Disclaimer
- Special issue statement
- Acknowledgements
- Financial support
- Review statement
- References
- Abstract
- Introduction
- Data and methods
- Validation
- Sensitivity to coupling and data assimilation
- Climate indices
- Discussion and conclusions
- Appendix A: Data-assimilation formulation in MESMAR-R
- Code availability
- Data availability
- Author contributions
- Competing interests
- Disclaimer
- Special issue statement
- Acknowledgements
- Financial support
- Review statement
- References