
the Creative Commons Attribution 4.0 License.
the Creative Commons Attribution 4.0 License.
 | 09 Sep 2026
The added value of Med-CORDEX coupled high-resolution regional climate models in representing sea surface temperature and marine heatwaves in the Mediterranean Sea
Francesco De Rovere

Giulia Bonino
Ronan McAdam
Enrico Scoccimarro
Samuel Somot
Iván M. Parras-Berrocal
Bodo Ahrens
Vladimir Djurdjevic
Laurent Li
Simona Masina
Marine heatwaves (MHWs) pose significant threats to Mediterranean marine ecosystems and coastal economies, with frequency and severity projected to increase under future climate change. While Med-CORDEX fully-coupled Regional Climate System Models (RCSMs) offer enhanced resolution and improved representation of local processes relative to their parent Global Climate Models (GCMs), a systematic assessment of their added value for sea surface temperature (SST) and MHW properties has been lacking. This study quantifies the added value of Med-CORDEX RCSMs over the Mediterranean basin, evaluating their capacity to correct GCM biases and improve the representation of SST and MHW probability distributions. Results show that added value is scale-dependent and metric-specific. RCSMs generally improve the SST spatial pattern and the shape and upper tail of its temporal distribution, but mostly fail to correct Mediterranean basin-averaged errors in the mean, standard deviation, 90th percentile and linear trend. SST improvements are most consistent along coastlines and in semi-enclosed areas, where fine-scale ocean-atmosphere interactions and topographic constraints are best resolved by RCSMs. For MHW duration, downscaling provides consistent and spatially widespread improvements across nearly all models, driven by a better representation of short-lived events. For MHW intensity, added value is model-dependent and not systematic: while the majority of RCSMs improve this metric, some models exhibit deterioration linked to model-specific features. These results demonstrate that higher horizontal resolution is a necessary but not sufficient condition for improved MHW representation, and that simultaneous advances in other model components are required to fully exploit the potential of regional downscaling. In particular, within the Med-CORDEX ensemble, inter-model differences in MHW added value appear to be correlated with improvements in the thickness of the first layer.
- Article
(6561 KB) - Full-text XML
-
Supplement
(14291 KB) - BibTeX
- EndNote


The Mediterranean region has long been recognized as one of the most prominent and vulnerable climate change hotspots of the 21st century (Giorgi, 2006; Lazoglou et al., 2024). This semi-enclosed basin is experiencing temperature increases at rates exceeding the global average, with surface temperatures approximately 1.5 °C above late 19th-century levels (IPCC, 2023). In the 21st century, Mediterranean temperatures are projected to increase 20 % faster than the global average, particularly in summer (Lionello and Scarascia, 2018), intensifying pressures across key sectors as water resources, ecosystems, food production, human health, and regional security (Cramer et al., 2018; Smith et al., 2021, 2025). Marine heatwaves (MHWs, Hobday et al., 2016), i.e., prolonged periods of unusually high sea surface temperatures (SSTs), have emerged as critical manifestations of Mediterranean climate change as their frequency strongly increased from the 1980s (Darmaraki et al., 2019a; Dayan et al., 2023; Hamdeno and Alvera-Azcaráte, 2023). Such events are projected to increase their occurrence, severity and areal extension compared to today's events (Darmaraki et al., 2019b), with geographically varying impacts on marine ecosystems and coastal communities (Garrabou et al., 2022).
Reliable climate projections are critical to inform society about the implications of climate extremes. However, Global Climate Models (GCMs) from the Coupled Model Inter-comparison Project (CMIP) initiative (Taylor et al., 2012; Eyring et al., 2016) typically operate at coarse resolutions (1° ocean) that cannot adequately resolve the complex topography, coastlines, strait dynamics, regional wind systems, and fine-scale ocean-atmosphere feedbacks characteristic of the Mediterranean basin. Capturing these local features and processes is essential for accurately representing present and future SST and MHW characteristics in the region. The Mediterranean Coordinated Regional Downscaling Experiment (Med-CORDEX, https://med-cordex.github.io/, last access: 31 August 2026) represents the largest coordinated multi-model effort to address these limitations through fully coupled, high-resolution Regional Climate System Models (RCSMs) operating at typically 0.1° in the ocean and 0.1–0.5° in the atmosphere, with structural enhancements specifically designed to improve process representation in the Mediterranean (Ruti et al., 2016; Somot et al., 2018). While these improvements offer the potential for a better performance, it is crucial to quantitatively assess whether the increased computational complexity translates into actual skill improvement over the driving models. Such improvement is quantified as added value. Added value is not uniform across all variables, regions, or scales. Analysis of EURO-CORDEX (Jacob et al., 2014, 2020) and Med-CORDEX downscaling experiments revealed that large-scale and time-averaged fields over smooth terrain may show minimal improvement (Rummukainen, 2016), while regions with complex orography and coastal contrasts demonstrate clear added value in process representation (Byun et al., 2023), precipitation (Ciarlo` et al., 2021; Soares and Cardoso, 2018; Careto et al., 2022), wind speed (Herrmann et al., 2011; Molina et al., 2023, 2024), air temperature (Torma et al., 2015; Cardoso and Soares, 2022) and climate extremes (Fantini et al., 2018; Iles et al., 2020). Despite extensive research on Mediterranean climate change (Darmaraki et al., 2019b; Soto-Navarro et al., 2020; Parras-Berrocal et al., 2024, 2025) and the increasing use of Med-CORDEX simulations, a systematic assessment of their added value for SST and MHW properties remains lacking. Addressing this gap is particularly important given the Mediterranean's status as a MHW hotspot (Denaxa et al., 2025) and the crucial role of SST for such extremes. Beyond the Med-CORDEX activity, Mishra et al. (2023) already showed the benefits of enhancing horizontal resolution for oceanic variables in HighResMIP simulations in the Mediterranean region. At the global scale, Pilo et al. (2019) demonstrated the added value of higher resolution simulations, which exhibited weaker biases in MHW properties compared to their parent models. Furthermore, the gain of higher horizontal resolution is mainly focused on the duration of MHWs (Guo et al., 2019; Capotondi et al., 2024), but biases in intensity and frequency still persist (Pilo et al., 2019). By resolving fine-scale processes that GCMs cannot capture, Med-CORDEX simulations have a high potential to improve the representation of SSTs and MHWs in the Mediterranean Sea.
The objective of this study is to quantify the added value of Med-CORDEX models for Mediterranean SST and derived MHW properties (duration and intensity). To our knowledge, this represents the first systematic multi-model added value assessment based on coordinated GCM-RCSMs pairs for oceanic variables, not only in the Mediterranean but across all ocean regions worldwide. We examined the capacity of RCSMs to (i) correct GCM biases and (ii) improve the spatiotemporal representation of the probability distribution function (PDF) of these variables over a 39-year period. This assessment evaluates the effectiveness of downscaling for marine extremes and informs future modeling priorities. The article is structured as follows: Sect. 2 details the datasets and methodology of the analysis; Sect. 3 presents and discusses the main results; Sect. 4 summarizes the main findings and limitations, concluding with key recommendations.
2.1 Data
This study utilizes daily SST fields from both RCSM simulations and the corresponding GCM simulations. These SST outputs, along with their corresponding MHW properties, are compared to daily SST observations and derived MHW characteristics, sourced from the High Resolution L4 Sea Surface Temperature Reprocessed for the Mediterranean Sea, hereafter defined as OBS (see Table S1 in the Supplement for details, https://doi.org/10.48670/moi-00173, Pisano et al., 2016; Embury et al., 2024). OBS SST are available from 1982 and represent the foundation temperature at 1/16°, i.e., the surface ocean temperature free of the diurnal cycle. In contrast, models provide a daily SST average which incorporates the diurnal cycle. However, as shown in Sect. 2.3, this methodological difference is unlikely to be the primary driver of the model-observation discrepancies.
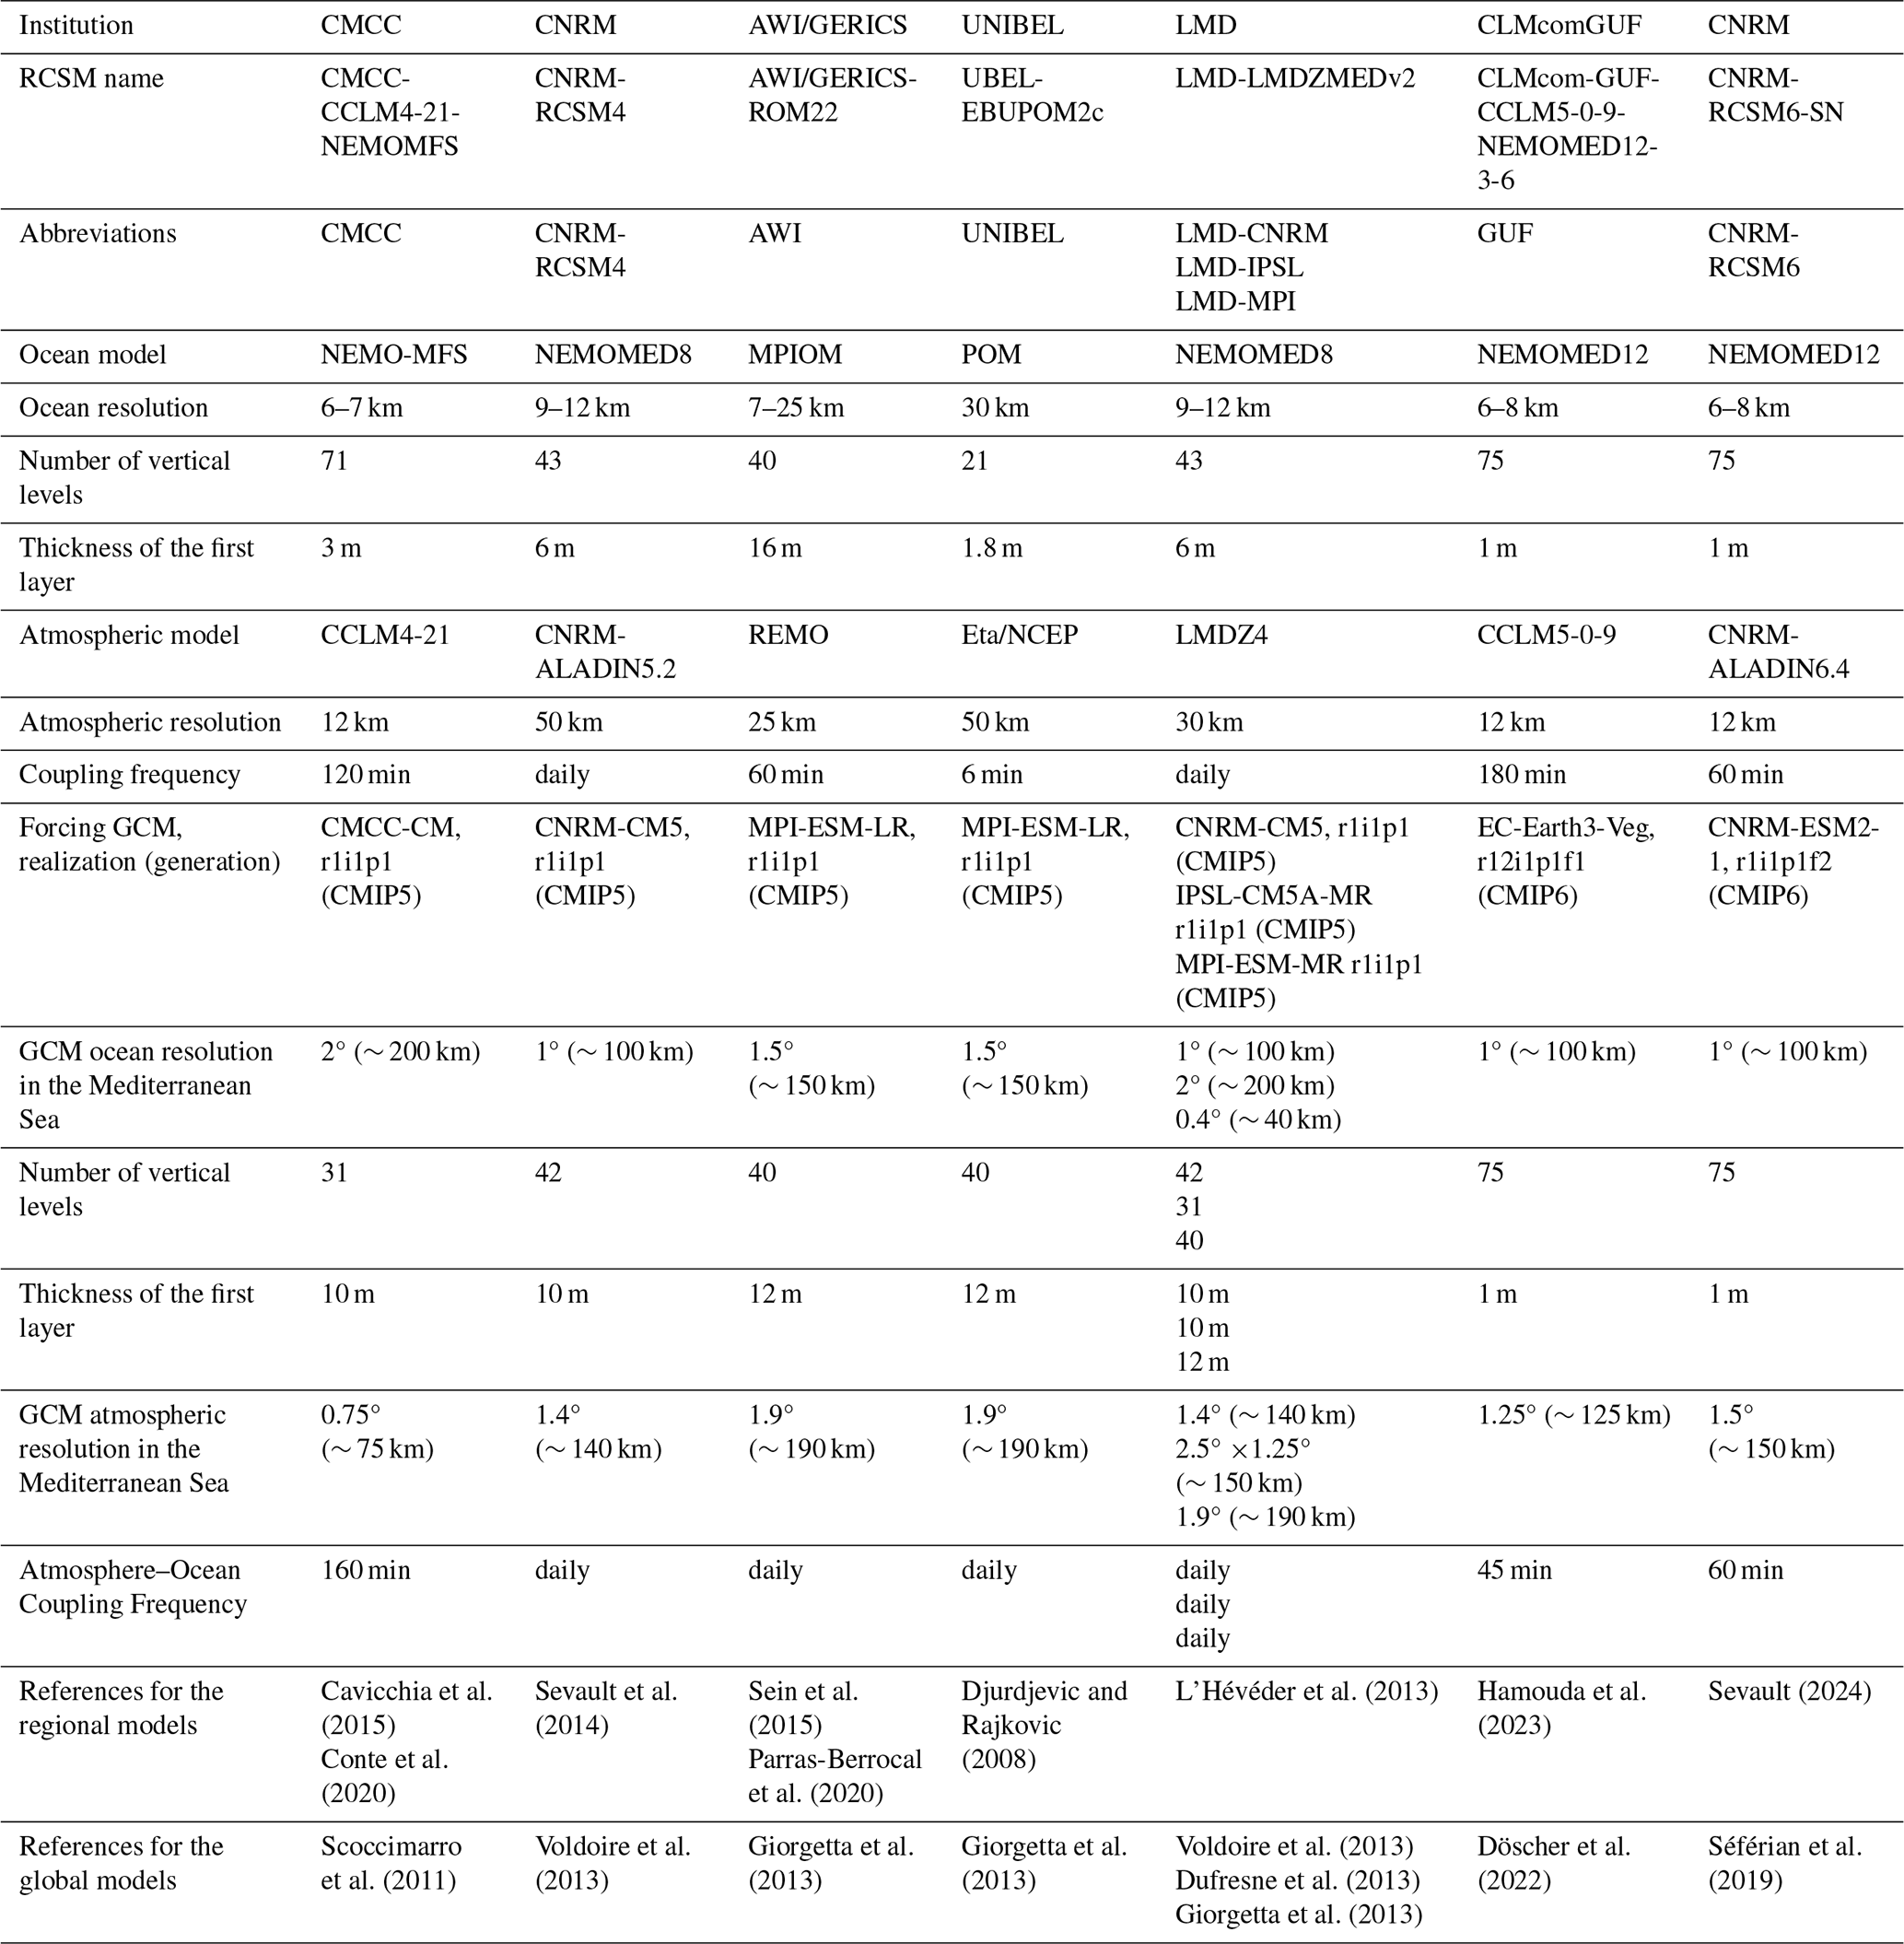
This study analyzes an ensemble of seven fully coupled Med-CORDEX RCSMs driven by CMIP5 and CMIP6 GCMs. The specific configurations (abbreviated as CMCC, AWI, UNIBEL, LMD-CNRM, LMD-IPSL, LMD-MPI, CNRM-RCSM4, CNRM-RCSM6, and GUF) feature high oceanic (6–30 km) and atmospheric (12–50 km) resolutions, enhanced vertical resolution, high-frequency atmosphere-ocean coupling, and dedicated parameterizations of vertical ocean dynamics and air-sea fluxes optimized for the Mediterranean Sea (Ruti et al., 2016). All RCSMs cover the entire Mediterranean basin and a small portion of the adjacent North Atlantic. Full model details are provided in Table 1.
Cavicchia et al. (2015)Conte et al. (2020)Sevault et al. (2014)Sein et al. (2015)Parras-Berrocal et al. (2020)Djurdjevic and Rajkovic (2008)L’Hévéder et al. (2013)Hamouda et al. (2023)Sevault (2024)Scoccimarro et al. (2011)Voldoire et al. (2013)Giorgetta et al. (2013)Giorgetta et al. (2013)Voldoire et al. (2013)Dufresne et al. (2013)Giorgetta et al. (2013)Döscher et al. (2022)Séférian et al. (2019)Table 1Characteristics of the Med-CORDEX RCSMs utilized in this study.
Simulations are evaluated over the 1982–2020 period by concatenating historical outputs with early scenario realizations: 2006–2020 from the Representative Concentration Pathway 8.5 (RCP8.5) for CMIP5 GCMs and associated RCSMs; 2015–2020 from the Shared Socio-economic Pathway 5-8.5 (SSP5-8.5) for CMIP6 GCMs and associated RCSMs. We select this period to maximize overlap with high-resolution OBS, improving the statistical robustness of the results while minimizing the use of data from future scenario simulations. This approach is standard practice (Ciarlo` et al., 2021; Sevault et al., 2014; Scoccimarro et al., 2024; Simon et al., 2025), as radiative forcing divergence in early scenario years is minimal while internal variability and model characteristics dominate the signal (Hawkins and Sutton, 2009; Lehner et al., 2020).
2.2 Methods
2.2.1 Assessment of SST and MHW statistics
The capacity of RCSMs to correct biases present in their parent GCMs was assessed by comparing a set of SST statistics and MHW properties across OBS, RCSMs, and GCMs. The SST statistics considered are the mean, standard deviation (STD), 90th percentile, linear trend, and STD of SST residuals. SST residuals were defined as anomalies obtained by removing both the long-term linear trend and the climatological seasonal cycle from each grid point. The considered MHW properties are duration, mean intensity, and number of events. All metrics were computed at each grid point over the full 1982–2020 reference period and then spatially averaged over the Mediterranean domain. GCM biases were defined as the difference between GCM and OBS values, while RCSM increments were calculated as the difference between each RCSM and its driving GCM. Spatial maps of error improvement were constructed by identifying grid points where the absolute RCSM error is smaller than the absolute GCM error for a given SST statistic, providing a spatial assessment of where the RCSMs reduce or amplify GCM errors.
2.2.2 Added Value index
We defined added value as the ability of an RCSM to reproduce observed PDFs more accurately than its driving GCM. Since regional models aim to capture local dynamics smoothed out in global simulations, improving the representation of the observed PDF structure at each simulated location is critical. To quantify this improvement, we employ the Added Value index (AVi) developed by Ciarlo` et al. (2021), computed as:
where DGCM and DRCSM are the so-called “Relative Probability Differences” for GCMs and RCSMs, calculated as
where and denote the number of data points in the model and observations, respectively, falling into bin i, and Δv is the bin width of the variable. Positive AVi values indicate that the RCSM reproduces the observed PDF more accurately than the driving GCM, while negative values indicate that the GCM provides a closer match to observations. As the definition of Δv influences the calculation of the PDF, and thus the AVi, this parameter is defined through a standard rule. The optimal Δv for each distribution is estimated through the Freedman-Diaconis rule (Freedman and Diaconis, 1981), applied to OBS, as:
where n is the number of data points considered and IQR is the inter-quartile range. Following Ciarlo` et al. (2021), we apply a correction for bins that are empty in the GCM but populated in OBS and RCSM. To prevent artificial negative AVi scores in these cases, those bins contribute zero to DRCSM, ensuring the RCSM adds value for capturing events missed by the GCM. If the RCSM fails to populate a bin where both the GCM and OBS show events, the same rule is applied symmetrically. Sensitivity tests confirmed that AVi values are not substantially affected by this correction; in particular, area-averaged AVi rankings and signs across models are preserved for all metrics. At each grid point, the statistical significance of AVi was assessed via bootstrap randomization. A reference distribution of 1000 synthetic AVi values was generated by randomly drawing two new GCM and RCSM samples from their union, simulating the null hypothesis of no systematic difference between global and regional models. The original AVi was defined significant when it fell outside the 5th–95th percentile range of this distribution. The area-averaged AVi was then computed over the Mediterranean domain, with non-significant grid points set to zero.
For each model family, OBS and GCM were bilinearly regridded on the correspondent RCSM grid to facilitate a fair comparison between regional and global models. Interpolating GCM values to a finer resolution may produce unrealistic outputs, while interpolating OBS and RCSM values to a coarser resolution can compromise the representation of the PDF (Prein et al., 2016). However, to effectively illustrate the added value of downscaling, it is crucial to demonstrate that resolving local-scale processes provides more information than simply interpolating a coarse, non-resolving grid onto a finer grid. AVi is computed independently at each point of the RCSM native grid and displayed as spatial maps. Multi-model AVi mean maps are obtained by interpolating individual AVi fields by nearest neighbor onto the NEMOMED8 grid (native to the CNRM-RCSM4 and LMD models) prior to averaging. Grid points where fewer than 6 out of 9 simulations (66 %) agree in sign with the multi-model mean are masked. Global PDFs of the selected parameters are shown, aggregating all data from AVi-significant grid points across OBS, GCMs and RCSMs, with each PDF normalized by the total number of data points. A corresponding AVi value is derived from these aggregated PDFs, providing a measure of added value that integrates the performance of all RCSMs and GCMs across the significant domain.
We analyzed the added value of four parameters: median-removed SST anomalies, upper tail SST anomalies, MHW duration and intensity. For each grid point, median-removed SST anomalies are obtained by subtracting the median from the SST distribution, focusing the analysis on its shape and excluding the influence of background model biases. Upper-tail SST anomalies are computed by subtracting the 90th percentile from all values above this percentile, isolating very high SST values relative to the local climatology, without any persistence requirement. MHWs are defined based on the criteria established by Hobday et al. (2016). An MHW event occurs when SST exceeds the 90th percentile climatology calculated over a 30-year daily climatology (1982–2011) for at least 5 consecutive days, with a maximum gap of 2 d. We focus on two MHW characteristics: duration, defined as the number of consecutive days of each event, and mean intensity, defined as the average SST anomaly above the 90th-percentile threshold computed over the reference climatology. It should be noted that defining MHWs relative to each model's own climatology effectively removes mean-state biases from all data sources, acting as an implicit bias correction. Combined with the median-removed and extreme SST, our analysis therefore captures only the variability component of SST, excluding potential added value associated with improvements in the mean state. This has implications for the interpretation of results and is discussed further.
2.3 Sensitivity to the observational reference
The OBS SST product provides the longest high-resolution SST record available for the Mediterranean Sea, but it is based on nighttime retrievals, whereas daily model outputs represent averages over the full diurnal cycle. To assess whether this difference in temporal sampling affects our results, we compared the satellite-derived nighttime L4 SST used in this study against two other independent products: the High Resolution Diurnal Subskin Sea Surface Temperature Analysis (https://doi.org/10.48670/moi-00170, Marullo et al., 2014; Buongiorno Nardelli et al., 2013) and the CMEMS Mediterranean Sea Physics Reanalysis (https://doi.org/10.48670/mds-00375, Escudier et al. (2021)), which provides hourly reanalyzed SST fields. Details of these products can be found in Table S1. The inter-product differences in SST (Fig. S1a, c in the Supplement) and extreme SST (Fig. S1b,d) PDFs over 2019–2022 are substantially smaller than the RCSM-GCM differences across the ensemble, demonstrating that the diagnosed added value is robust with respect to OBS.
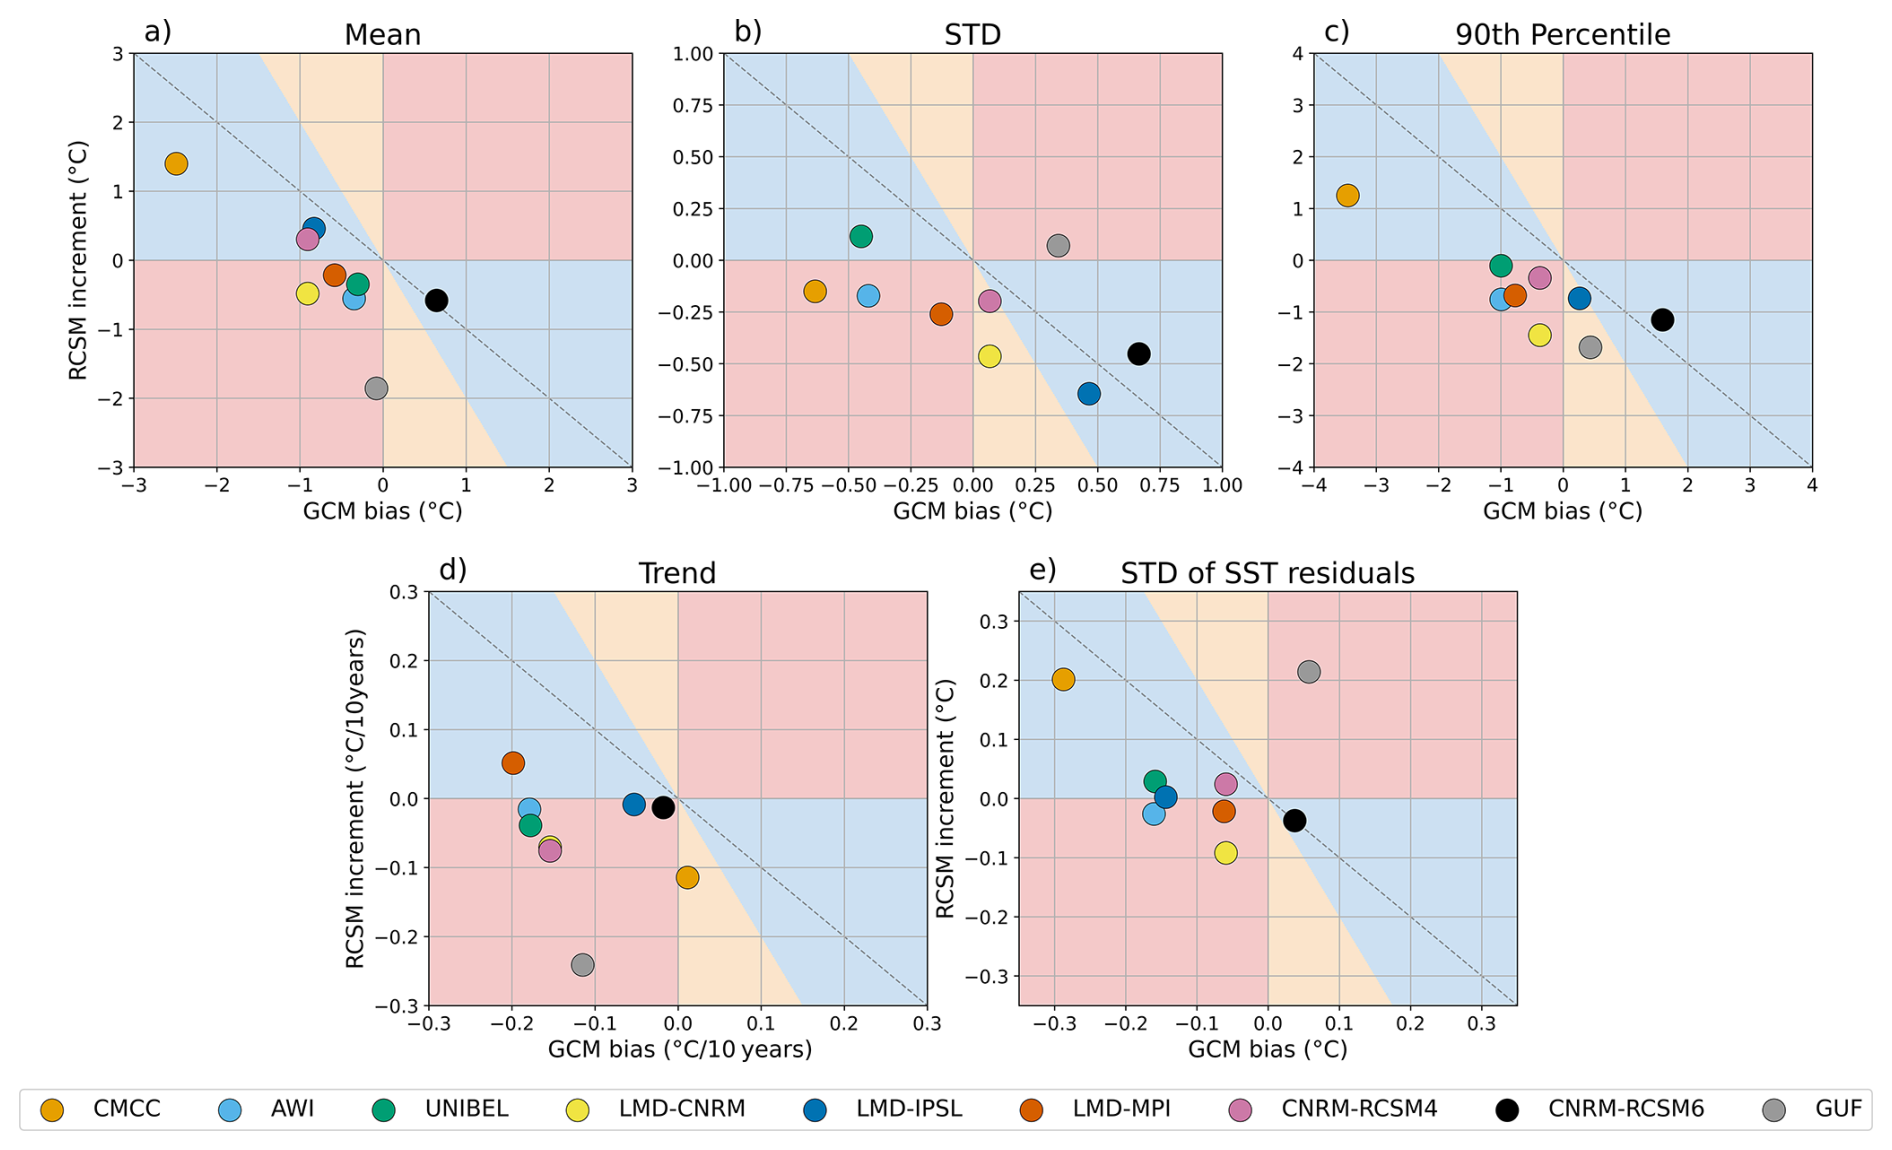
Figure 1RCSM increment versus GCM bias for area-averaged SST (a) mean, (b) STD, (c) 90th percentile, (d) trend, (e) STD of SST residuals over 1982–2020. The grey line indicates perfect error correction. Blue, red, and orange shading denote skillful error reduction, deterioration, and overcompensation (RCSM error opposite in sign but larger in magnitude than the GCM error), respectively. For the definition of the Mediterranean domain see Fig. 2.
3.1 SST
3.1.1 Evaluation of SST statistics
Figure 1 assesses whether RCSMs tend to correct area-averaged SST errors present in GCMs (blue areas) or amplify existing ones (red and orange areas). For the definition of the Mediterranean domain, see Fig. 2. RCSMs struggle to correct the area-averaged statistics. Regarding the mean state, only a subset of 4 models effectively reduces the biases present in their driving GCMs (Fig. 1a). Conversely, the majority of models amplify the existing cold bias in the driving GCMs. Spatial maps of GCM and RCSM biases (Fig. S2) confirm that this tendency is broadly distributed across the basin. However, 7 out of 9 RCSMs improve the spatial structure of the mean SST field relative to their driving GCMs, as shown by higher pattern correlations with observations (Fig. S2). Area-averaged bias improvement is connected to the capacity of RCSMs to reduce the bias across large portions of the basin, with the best-performing models improving more than 69 % of grid points (Fig. S3). Yet, all RCSMs show skillful bias reduction in key regions, particularly along the coastlines and in semi-enclosed areas such as the Adriatic Sea, the Alboran Sea, and the Aegean Sea, where the added value of downscaling is most evident (Fig. S3). Seasonally, winter is the most favorable period for bias reduction (Fig. S4d), whereas other seasons show limited improvement or further deterioration (Fig. S4a, b, c). This suggests that while RCSMs better resolve winter mixing and convection processes, they may not adequately capture the basin-wide heat fluxes or advective inputs that dominate other seasons.
Similarly, the standard deviation (STD), here used as a measure of total variability, is rarely improved (Fig. 1b). Seven regional simulations feature a lower STD than their parent GCMs, worsening the signal in most cases. As with the mean bias, RCSMs tend to degrade the STD over large portions of the basin, while showing localized improvement along the coastlines and in semi-enclosed areas (Fig. S5). For most models, autumn and winter are the seasons in which RCSMs most effectively reduce GCM STD errors (Fig. S4g, h), while in spring and summer they more commonly amplify the existing errors (Fig. S4e, f).
The representation of the 90th percentile is generally degraded (Fig. 1c), with most RCSMs improving fewer than 50 % of grid points (Fig. S6). Most models underestimate the observed 90th percentile more severely than their driving GCMs, consistent with the cold mean bias and reduced variability described above. In summer and autumn, only two models improved the representation of the 90th percentile (Fig. S4j, k), while the majority of RCSMs show correcting skills in winter and spring (Fig. S4i, l).
Most RCSMs underestimate warming relative to their driving GCMs, except LMD-MPI (Fig. 1d). Unlike the mean bias and STD, trend errors show no systematic spatial structure, with RCSMs failing to outperform their driving GCMs even in coastal and semi-enclosed areas (Fig. S7), suggesting a large-scale origin for this deterioration. Issues in representing temperature trends are not unique to Med-CORDEX models. EURO-CORDEX studies have documented similar failures in reproducing long-term surface air temperature trends, largely attributed to misrepresented aerosol evolution and resulting biases in surface solar radiation (Nabat et al., 2014; Bartók et al., 2017; Boé et al., 2020; Schumacher et al., 2024).
The variability of SST residuals is underestimated in CMIP5 GCMs, and slightly overestimated in CMIP6 GCMs (Fig. 1e). However, about half of the RCSMs manage to correct this bias, except AWI, LMD-CNRM, LMD-MPI and GUF, which amplify the variability bias of their GCMs. As noted for the mean bias and STD, spatial improvement is again concentrated along the coastlines and in semi-enclosed areas (Fig. S8).
The inability to improve area-averaged statistics indicates that large-scale SST biases in the Mediterranean are inherited from the driving GCMs and are not corrected by dynamical downscaling. This finding aligns with previous studies showing that downscaling adds value at small scales but is constrained by the large-scale errors of the driving models (Veljovic et al., 2010; Di Luca et al., 2013; Moreno-Chamarro et al., 2022).
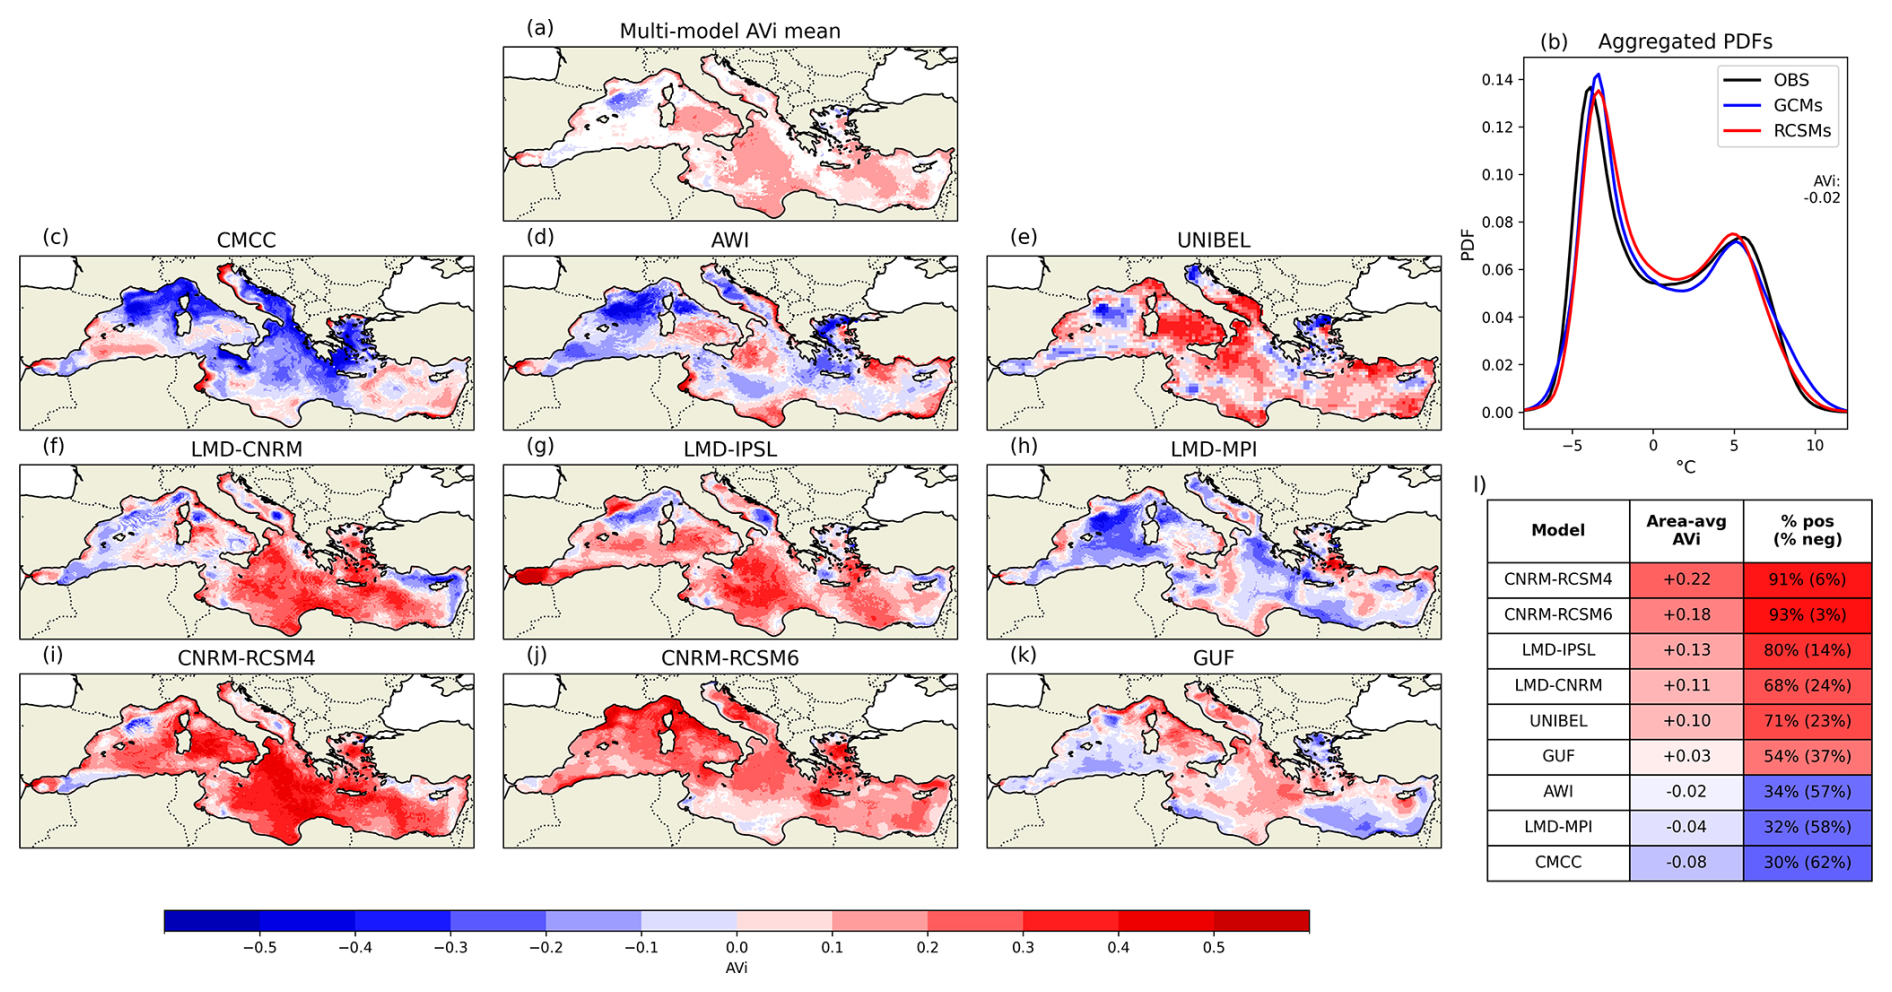
Figure 2AVi for median-removed SST in 1982–2020. (a) Multi-model AVi mean; grid points where fewer than 6 out of 9 simulations agree in sign with the mean are masked. (b) Aggregated PDFs of median-removed SST at AVi-significant grid points across all GCMs, RCSMs and OBS, with the corresponding AVi value (see Sect. 2.2.2). Individual model AVi maps for (c) CMCC, (d) AWI, (e) UNIBEL, (f) LMD-CNRM, (g) LMD-IPSL, (h) LMD-MPI, (i) CNRM-RCSM4, (j) CNRM-RCSM6, and (k) GUF. Positive (negative) values indicate that the RCSM provides a more (less) accurate representation of the observed distribution relative to the parent GCM; non-significant grid points are shown in white. (l) Area-averaged AVi computed over the Mediterranean domain (non-significant grid points set to zero), with red (blue) indicating positive (negative) area-averaged AVi. The percentage of positive and negative AVi grid points in the domain is reported in red (blue) when the positive (negative) fraction dominates.
3.1.2 AVi for SST
AVi for the median-removed SST (Fig. 2c–k) assesses the skill of RCSMs in representing SST PDFs at each grid point, independently of mean biases. Overall, there is a general improvement in the representation of the median-removed SST distribution across RCSMs. The multi-model mean (Fig. 2a) reveals a spatially distinct pattern: improvements are most pronounced in the eastern and central Mediterranean, including the Tyrrhenian Sea, while degradation prevails in the remaining part of the western basin. Six simulations exhibit positive basin-average AVi, ranging from +0.03 to +0.22, with improvements over more than 54 % of grid points (Fig. 2e, f, g, i, j, k). In contrast, AWI, LMD-MPI, and CMCC show predominantly negative AVi, with degradation affecting more than half of the basin grid points (Fig. 2c,d,h), particularly in the western Mediterranean, resulting in basin-average AVi values of −0.02, −0.04, and −0.08, respectively. Given this spatial heterogeneity, the mostly positive added value is not clearly reflected in the aggregated PDFs (Fig. 2b).
The positive added value in the central and eastern Mediterranean stems from RCSMs successfully simulating a broader SST PDF than their parent GCMs, bringing their distributions closer to observations (Fig. S9). Conversely, the Gulf of Lion remains a more nuanced case. SST variability in this region is strongly controlled by intense deep convection, which is highly sensitive to winds, buoyancy fluxes, stratification, and vertical mixing (Demirov and Pinardi, 2002; Ahumada and Cruzado, 2007; Macias et al., 2018). Although GCMs simulate larger SST variability that overlaps more closely with the observed distribution leading to negative AVi values (Fig. S10), this should be interpreted with caution: GCMs lack the fine-scale two-dimensional circulation, deep water mass formation, and wind-driven air-sea exchanges required to realistically represent deep convection in this region. The narrower SST distributions produced by RCSMs may therefore reflect a physically more consistent representation of deep convection, in which winter SST is set by the temperature of the deep layers, thereby limiting the range of surface variability. This interpretation is supported by the PDF of CNRM-RCSM6 (Fig. S10h), which shows a clear reduction on the cold tail of the distribution, consistent with a more realistic suppression of extreme cold events during convective episodes. This interpretation underscores a limitation of PDF-based added value metrics for SST: improved overlap with observed distributions does not always imply better physical representation, especially in regions where GCM performance may reflect error compensation rather than process fidelity.
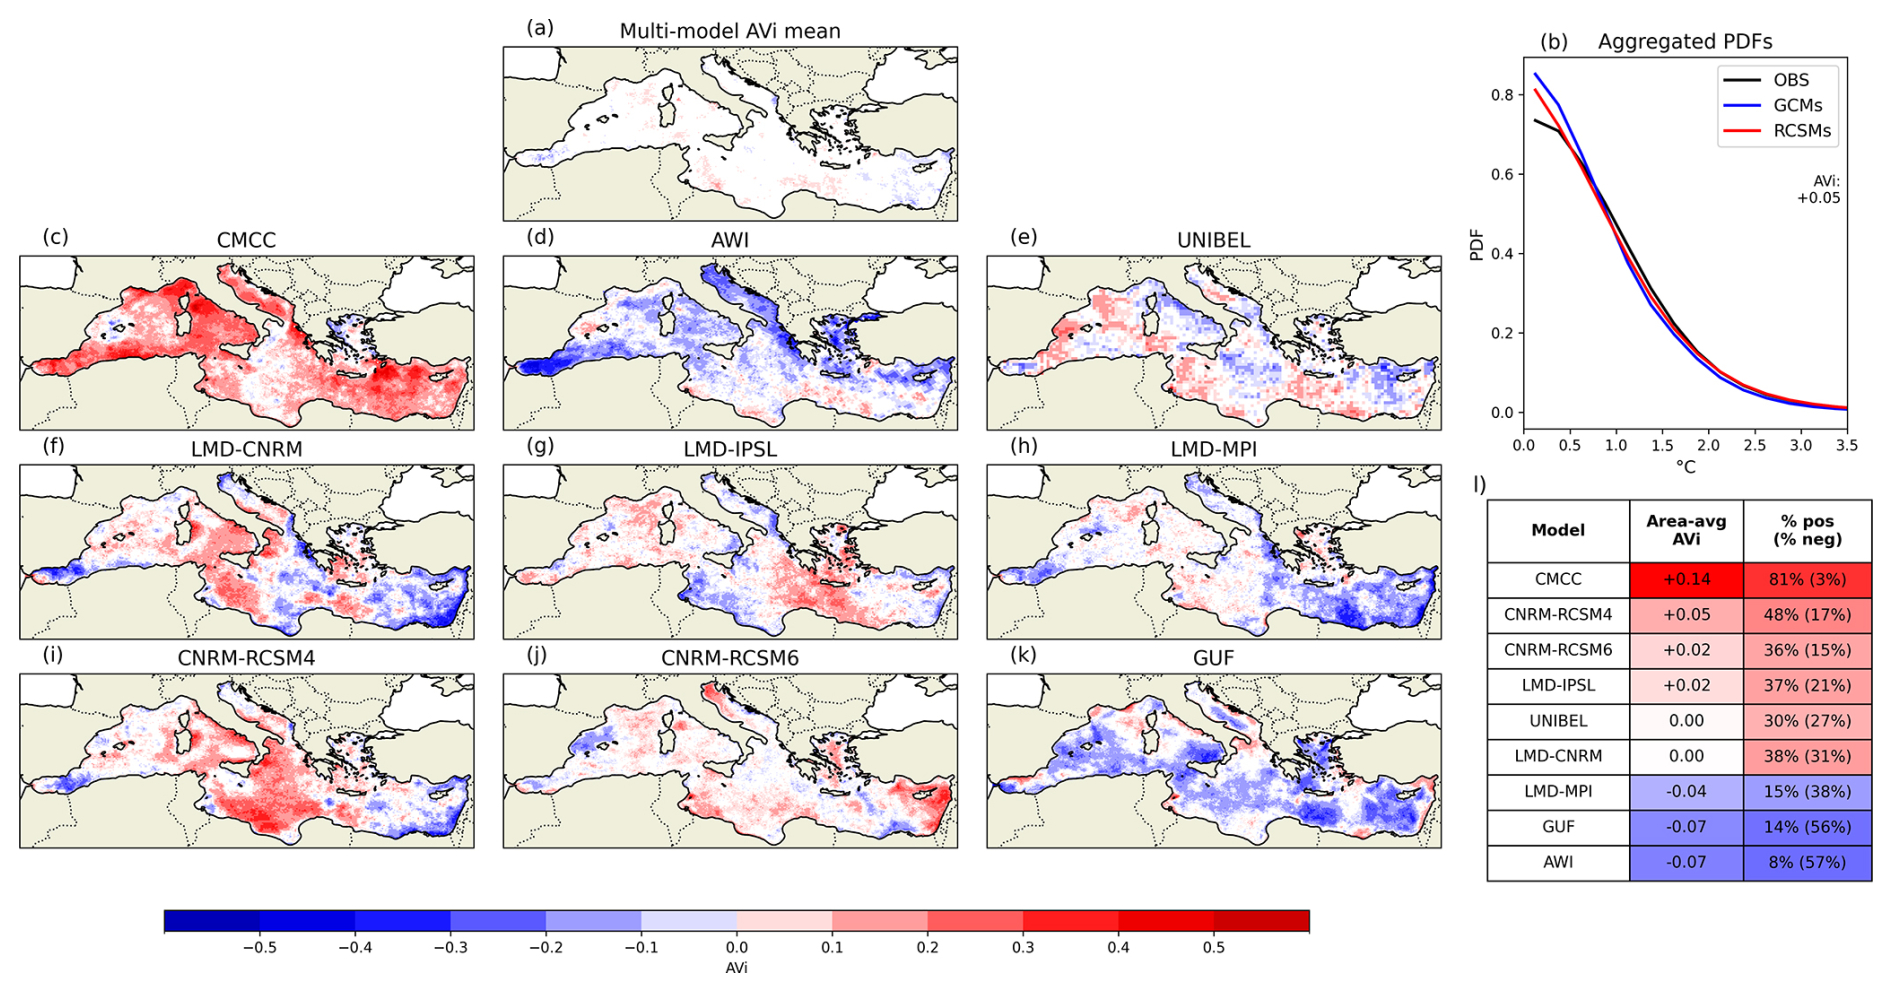
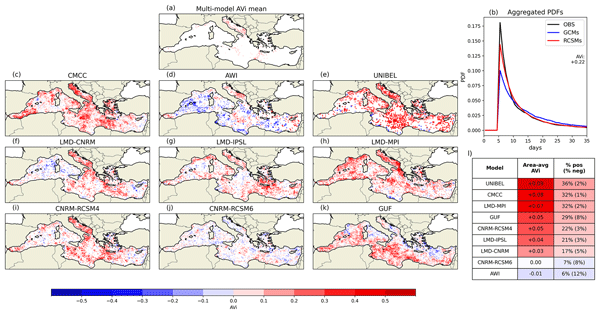
Figure 3As in Fig. 2 but for the SST upper tail distribution (SSTs above the 90th percentile) in 1982–2020.
Regarding warm SSTs (above the 90th percentile), the multi-model mean (Fig. 3a) highlights small common areas of improvements in the central Mediterranean, Tyrrhenian Sea, and Ligurian Sea, with negative values confined to the far eastern and western margins of the basin. Individual models exhibit substantially different spatial patterns of added and lost value (Fig. 3c–k), indicating a large inter-model spread in the representation of extreme SSTs. The aggregated PDFs (Fig. 3b) reveal that RCSMs generally stretch the upper tail of the SST distribution, bringing it closer to observations. However, at the individual model level, improvements arise either from an enhanced upper tail or from a constrained one (Fig. S11), both of which bring the simulated distribution closer to the observed SSTs. Six models exhibit zero (LMD-CNRM and UNIBEL) to positive (+0.14, CMCC) basin-average AVi, improving between 30 % to 81 % of grid points while limiting degradation to less than 31 %. The three models with negative AVi, ranging from −0.04 (LMD-MPI) to −0.07 (GUF and AWI), show degradation across 38 % to 57 % of grid points. Negative AVi values persist in the Alboran Sea and eastern Levantine basin, regions heavily influenced by advective dynamics and stratification (Pinardi and Masetti, 2000; Bergamasco and Malanotte-Rizzoli, 2010; Sánchez-Garrido and Nadal, 2022). This is unexpected given the known difficulty of GCMs to represent such dynamics, which would typically favor RCSM added value. The reason why the downscaling process does not lead to improved extreme SST representation remains an open question.
The added value analysis highlights a critical distinction: downscaling adds value in the representation of the shape of the SST distribution and upper tail SSTs, but mostly fails to correct biases in area-averaged statistics. However, improvements in SST statistics are present at the local level, especially along the coastlines and in semi-enclosed basins.
3.2 MHW properties
3.2.1 Mean errors
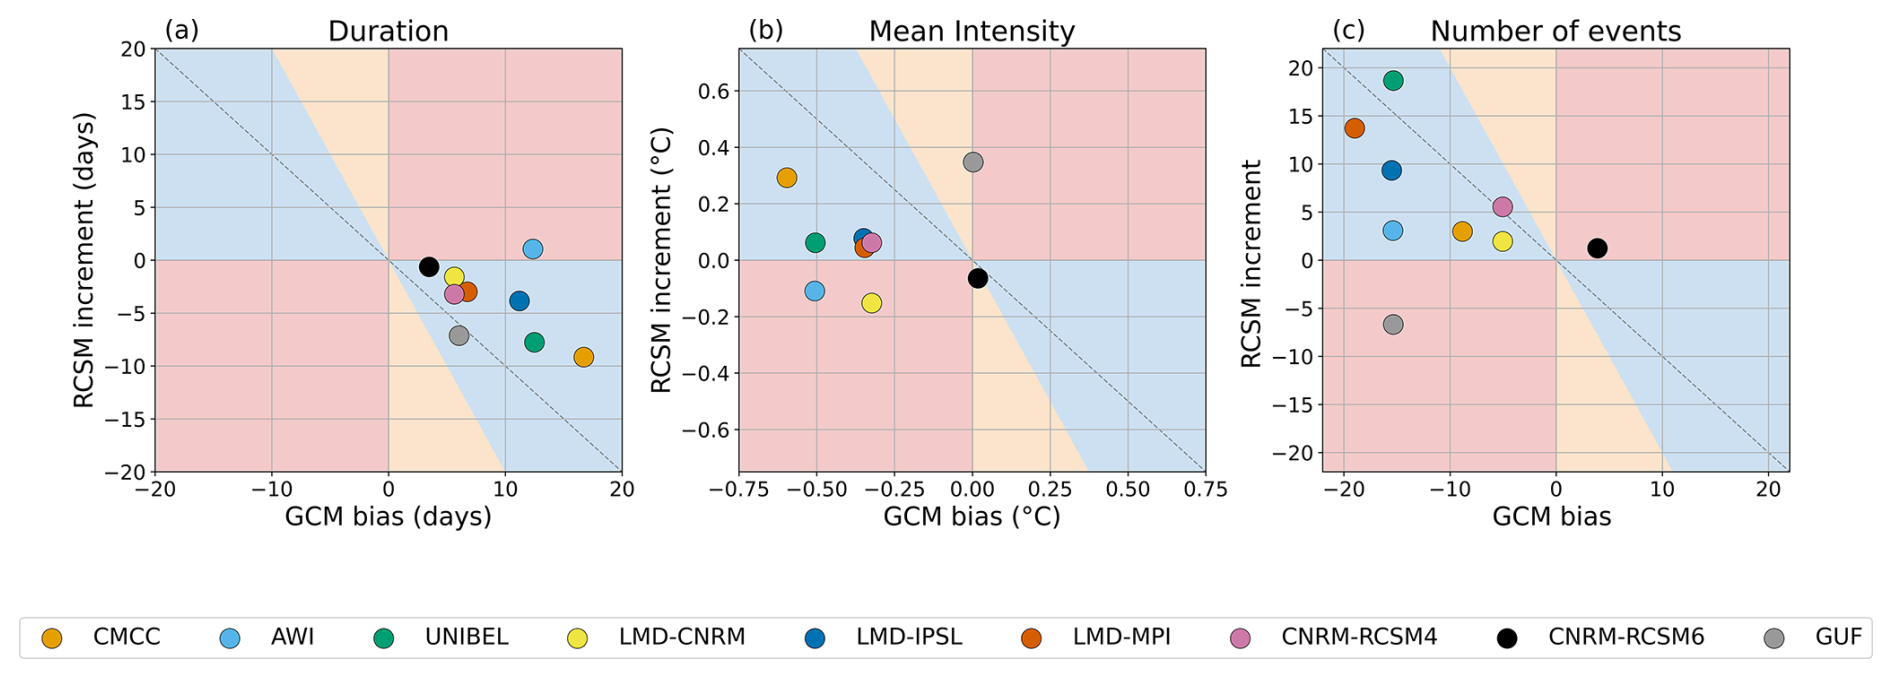
Here we evaluate the capacity of the RCSMs to correct the mean biases in MHW properties present in their driving GCMs. All GCMs considerably overestimate the duration of MHWs (Fig. 4a). However, downscaling markedly improves this metric: almost all RCSMs substantially reduce the GCM bias. This improvement is particularly pronounced in summer, autumn, and winter (Fig. S12b, c, d), when the magnitude of the GCM bias is strongest. Spring presents a more nuanced picture: the GCM bias is smaller in this season, and not all RCSMs succeed in further refining the signal (Fig. S12a). RCSMs broadly reduce the strong positive duration biases present in their driving GCMs across the Mediterranean basin (Fig. S13), with the spatial pattern of residual biases in the RCSMs largely mirroring that of the driving GCMs, albeit at a systematically lower magnitude. The only exception is AWI, which amplifies the GCM duration bias. Since these improvements are spatially ubiquitous and do not show systematic dependence on sub-basin location or local dynamical features, they can be attributed to a systematic enhancement brought by the downscaling process.
For MHW mean intensity, GCMs generally underestimate the observed values, but the ability of RCSMs to correct this bias varies considerably among models (Fig. 4b). Interestingly, the two CMIP6 GCMs accurately capture the mean MHW intensity, deviating from the general CMIP5 behaviour, consistent with the improved MHW skill of CMIP6 models reported in the literature (Qiu et al., 2021). Winter stands out as the only season in which every RCSM improves the parent GCM signal (Fig. S12h). In contrast, during the other seasons, several RCSMs tend to amplify the GCM bias (Fig. S12e, f, g). The spatial distribution of RCSM intensity biases (Fig. S14) highlights recurring hotspots of deterioration across both RCSMs and GCMs, particularly in the northern Adriatic Sea, the Gulf of Lion, and the Alboran Sea regions. Unlike the ubiquitous improvement seen for MHW duration, the general spatial pattern of intensity biases is preserved from GCMs to RCSMs, without a systematic reduction in magnitude. This suggests that what drives the consistent improvement in MHW duration does not extend to intensity, pointing to a more complex and model-dependent set of processes governing the latter.
Regarding the number of events, RCSMs generally perform well, improving the area-averaged bias relative to their driving GCMs (Fig. 4c). GCMs tend to underestimate the total number of MHWs, likely as a consequence of their tendency to overestimate event duration.
3.2.2 AVi for MHW Duration
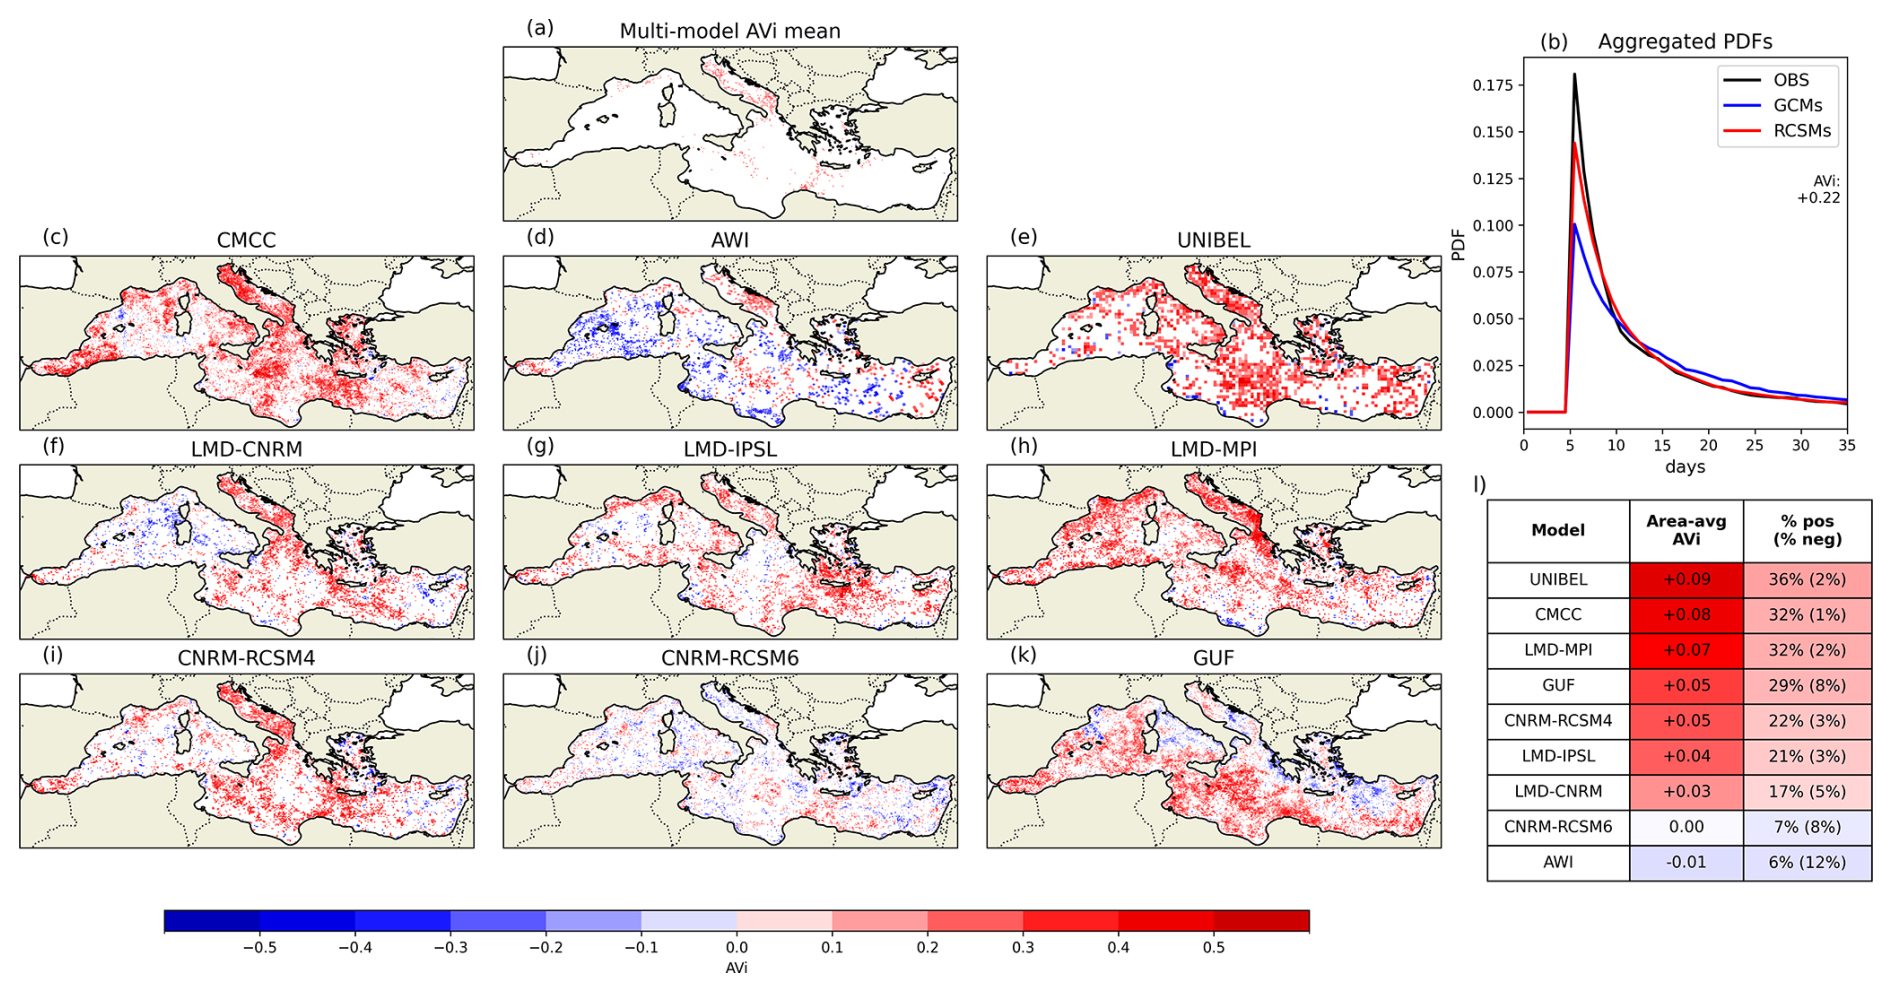
MHW duration shows substantial and widespread positive AVi. The multi-model mean reveals that improvements are particularly robust over the Adriatic Sea, parts of the central Mediterranean, and along the coasts of Gulf of Lion and Ligurian Sea (Fig. 5a), while inter-model agreement is weak in the western Mediterranean and the easternmost Levantine basin. The positive AVi largely arises from the improved representation of short-lived MHW events, which are underestimated in the GCMs but more accurately captured by the RCSMs (Fig. 5b). Furthermore, GCMs tend to overestimate long-lived MHW events, while RCSMs better capture the upper tail of the duration distribution. This behaviour is consistent across all AVi-positive models (Fig. S15a, c, d, e, f, g, i). Seven out of nine models exhibit positive basin-average AVi, ranging from +0.03 to +0.09, although the spatial distribution of improvements varies between models (Fig. 5c–k). Positive AVi models improve between 17 % and 36 % of grid points, with degradation remaining below 8 %. Notably, the ability of RCSMs to improve MHW duration appears partly conditioned by the bias of their driving GCM: models driven by GCMs with a large bias (CMCC-CM, MPI-ESM-LR and IPSL-CM5A-MR, Fig. S13d, h, l) tend to exhibit larger positive AVi, while those driven by GCMs with a small bias (CNRM-CM5 and CNRM-ESM2-1, Fig. S13f, j, r) show more limited improvement.
This result reflects the broad improvement in SST variability discussed above and agrees with prior findings (Pilo et al., 2019; Guo et al., 2019; Capotondi et al., 2024), showing that improved performance in MHW duration can be achieved by enhancing horizontal resolution, which plays a key role in better resolving the temporal build-up and dissipation of MHW events through enhanced mesoscale dynamics. RCSMs increase the realism of local and regional dynamics, producing SST fields with sharper gradients and more accurate spatial variability that better capture the conditions leading to the onset and decay of short-lived events. In the Mediterranean, MHW termination is frequently driven by regional wind systems which trigger rapid surface cooling through enhanced heat loss (Bonino et al., 2025). These mesoscale wind patterns are inherently better captured at higher resolution (Herrmann et al., 2011; Obermann et al., 2018), enabling RCSMs to more realistically simulate the atmospheric forcing episodes responsible for MHW decay. Beyond horizontal resolution, air-sea flux parameterizations and the thickness of the uppermost ocean layer further modulate the ocean's response time to such forcing, and are therefore also expected to influence MHW duration.
A notable exception is AWI, which exhibits negative area-averaged AVi for duration, degrading about 12 % of grid points while improving only 6 %, suggesting that increased resolution alone does not universally guarantee better performance and that other aspects of the RCSM configuration must also be considered. AWI is the only model in the ensemble with a coarser uppermost ocean layer, and, unlike the other RCSMs, it uses a globally coupled ocean component (Sein et al., 2015; Parras-Berrocal et al., 2020). Both factors may contribute to more damped SST temporal variability and a reduced ability to resolve the rapid onset and decay of short-lived MHW events, though disentangling their respective roles is beyond the scope of this study.
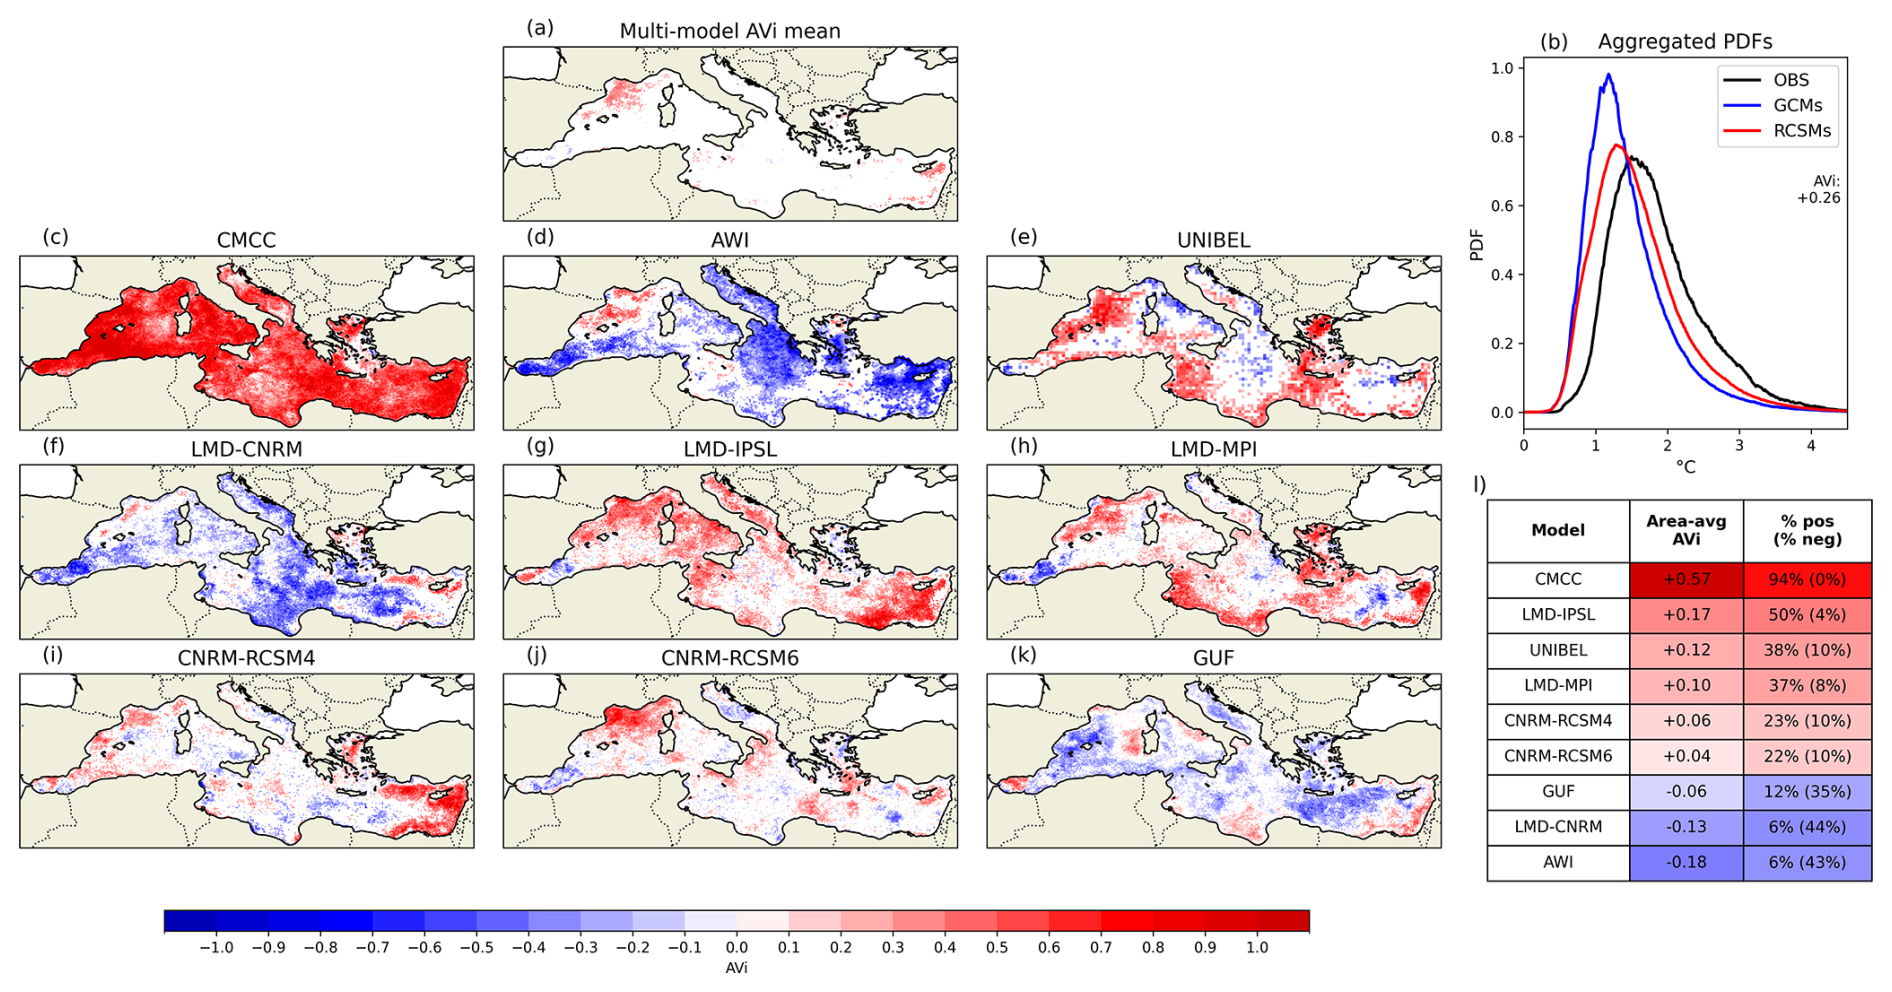
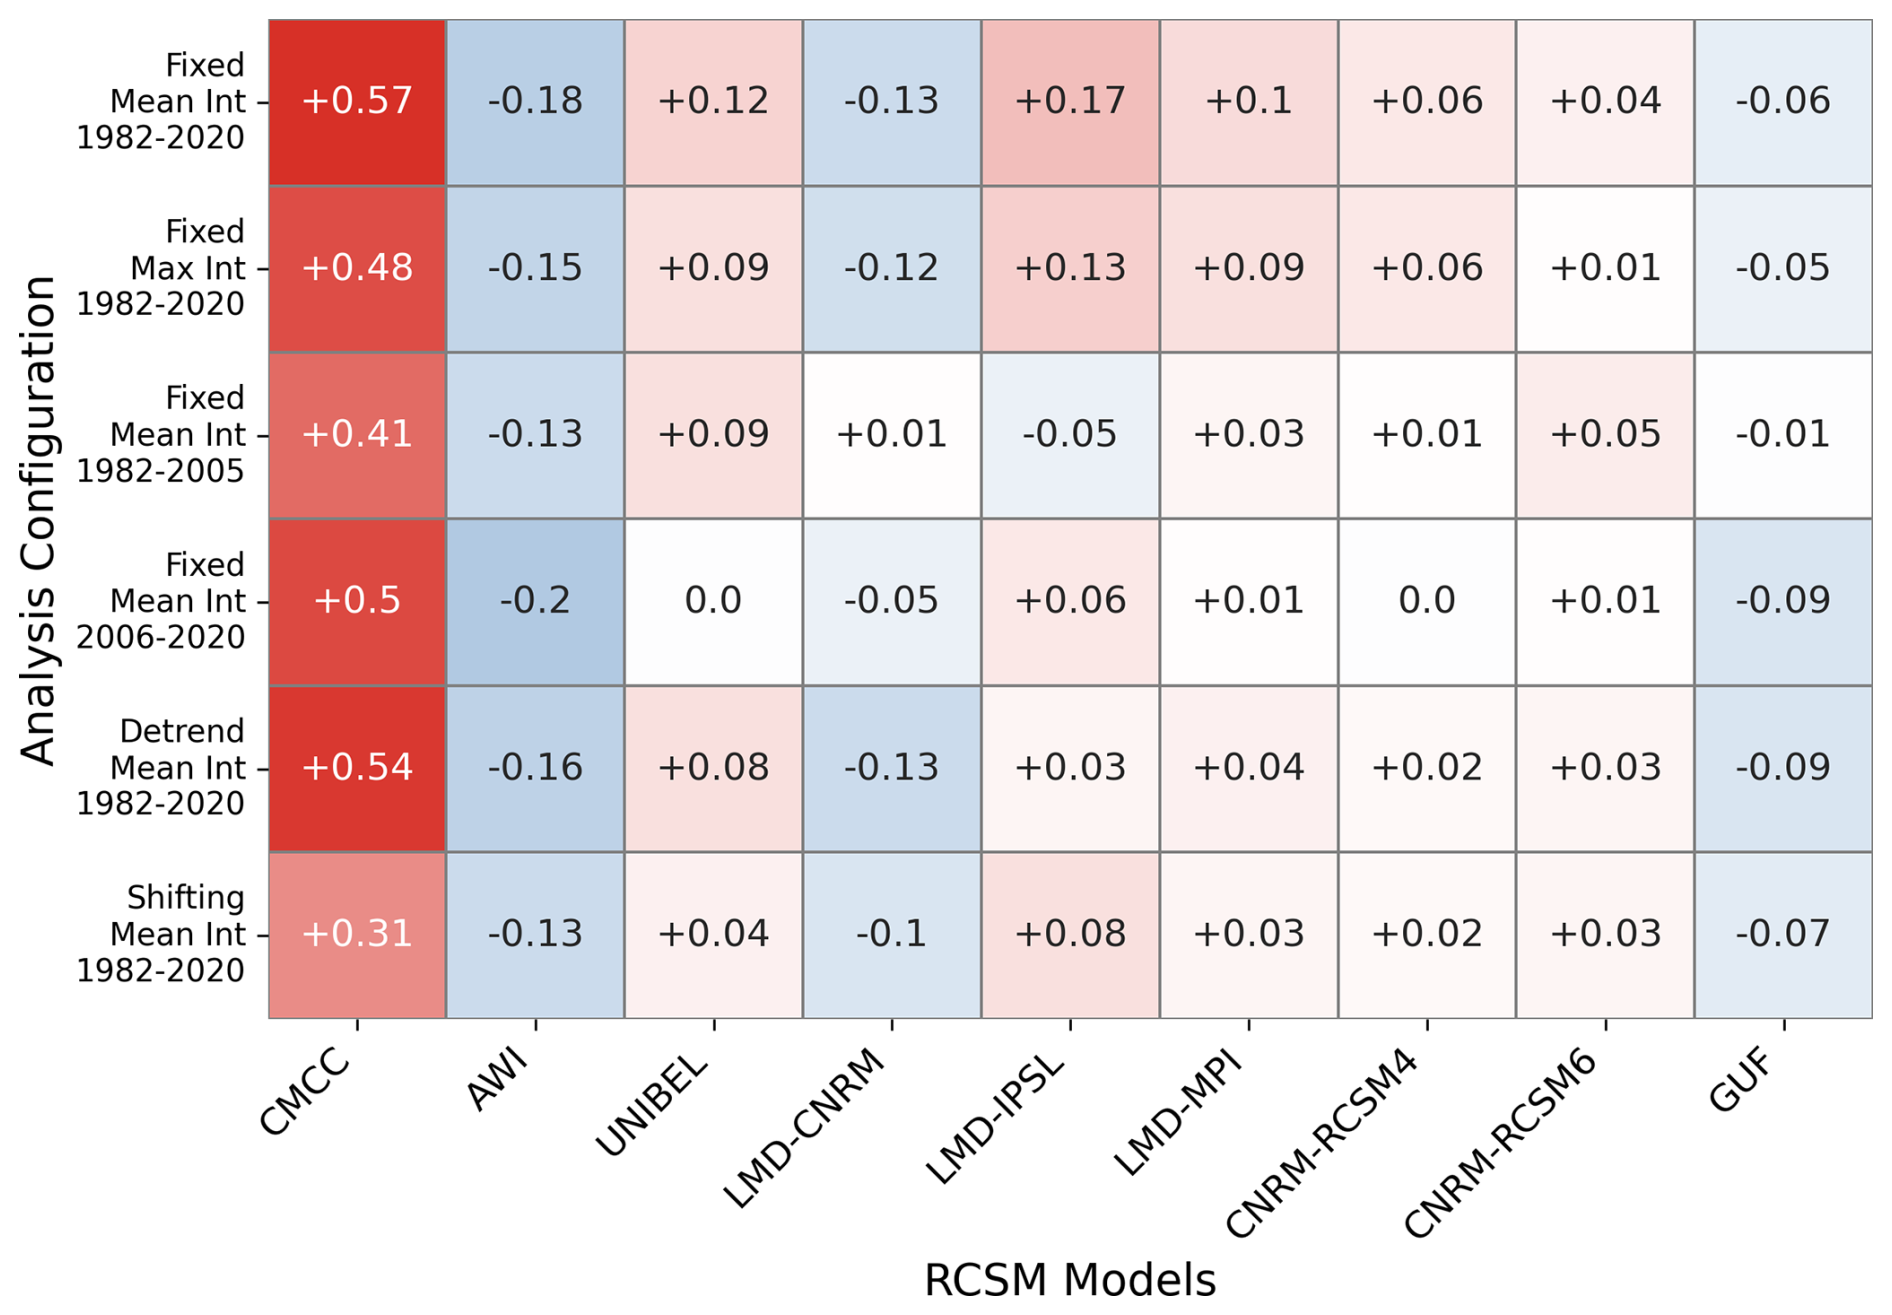
Figure 7Area-Averaged AVi for MHW intensity across the ensemble for different analysis configurations. Red (blue) shading denotes positive (negative) values, with color intensity proportional to magnitude.
3.2.3 AVi for MHW Intensity
MHW mean intensity exhibits a more variable picture across the ensemble compared to duration. The multi-model mean reveals that the Gulf of Lion is the only region with robust improvement, while inter-model agreement remains weak elsewhere (Fig. 6a). A notable exception is CMCC, which displays consistently strong performance across the whole basin, particularly in the central and the western Mediterranean (Fig. 6c), yielding the largest area-averaged AVi (+0.57), improving the signal over 94 % of the grid points. Five additional models (LMD-IPSL, UNIBEL, LMD-MPI, CNRM-RCSM4, CNRM-RCSM6) achieve positive area-averaged AVi (from +0.04 to +0.17) with areas of improvement between 22 % and 50 %, although the latter are spatially fragmented and accompanied by areas of deterioration (Fig. 6e, g, h, i, j). The remaining models (AWI, LMD-CNRM, GUF) show negative area-averaged AVi, ranging from −0.06 to −0.18, with extensive areas of deterioration (Fig. 6d, f, k) ranging from 35 % to 44 % of the Mediterranean domain. The aggregated PDFs show that RCSMs improve the representation of intensities by slightly shifting the distribution towards warmer values (Fig. 6b). Such behaviour characterizes AVi-positive models (Fig. S16a, c, e, f, g, h). In contrast, AWI and LMD-CNRM show a systematic shift toward cooler intensities compared to their parent GCMs (Fig. S16b, d), while GUF exhibits a broader distribution than both its parent model and OBS (Fig. S16i), leading to an overestimation of strong intensities rather than a simple mean shift.
Basin-average AVi values for MHW maximum intensity, defined as the peak SST anomaly within each event, closely mirror those obtained for mean intensity, suggesting that added value is not metric-specific but instead reflects broader discrepancies in the magnitude of SST departures from climatological baselines during extreme events (Fig. 7). Analyses over two additional sub-periods (1982–2005 and 2006–2020) yield results consistent with those obtained for the full 1982–2020 interval, with a general decrease in basin-average AVi magnitude but minimal change in sign or relative model ranking, demonstrating the robustness of these findings to the choice of evaluation and baseline periods (Fig. 7). Most RCSMs underestimate warming relative to their driving GCMs (Fig. 1d), reducing warm SST anomalies during late-period MHW events. Accurate representation of mean-state evolution is indeed essential for correctly characterizing present and future MHW properties (Frölicher et al., 2018; Schlegel et al., 2019; Oliver et al., 2021; Martínez et al., 2023). Removing the long-term trend generally reduces AVi values but does not alter their signs, indicating that trend biases modulate the magnitude of added value without changing the overall interpretation (Fig. 7). Similarly, applying a 15-year shifting climatology deteriorates basin-average AVi across nearly all models yet does not qualitatively alter model behaviour: AWI, LMD-CNRM, and GUF remain negative-AVi models, confirming that their degradation is not solely attributable to trend misrepresentation.
The representation of SST residuals' variability controls the magnitude of transient thermal anomalies. Negative‑AVi RCSMs degrade this variability: AWI and LMD-CNRM have larger negative biases, whereas GUF shows an amplified positive bias (Fig. 1e). We believe that the reasons for the degradation of SST residuals' variability and MHW intensity are model-dependent, as they strongly affect only a few models of the Med-CORDEX ensemble. For AWI, a key possible limitation is its coarse vertical discretization: its surface layer (16 m) is thicker than that of its parent GCM (12 m) (Table 1). Such a thick surface layer likely damps short-term temporal fluctuations, smooths stratification gradients, and weakens warm anomalies, whereas resolving the fine upper-ocean structure is crucial for simulating MHW processes (Capotondi et al., 2024; Darmaraki et al., 2024). This is supported by UNIBEL, forced by the same GCM but using sigma coordinates with a much thinner first layer (1.8 m); despite coarser horizontal resolution (30 vs. 7–25 km), it attains positive added value in both duration and intensity, showing that thickness of the first layer can be as important as horizontal resolution for MHW characteristics. GUF mainly reflects an inherited problem: its parent EC-Earth3-Veg already overestimates the variability of SST residuals (Fig. 1e) and has the broadest MHW intensity distribution among all GCMs (Fig. S16i). Such variability could have been further amplified by the RCSM, consistent with Kim et al. (2023). Hence, RCSM performance for MHW intensity is highly sensitive to the quality of the parent model and the variability transmitted across scales. For LMD-CNRM, the negative added value for MHW intensity appears rooted in the atmospheric component. LMD-CNRM and CNRM-RCSM4 share the same ocean configuration but differ in: (i) atmospheric model (stretched-grid LMDz4 vs. ALADIN5.2) and (ii) spectral nudging of atmospheric fields (absent vs. implemented) (L’Hévéder et al., 2013; Sevault et al., 2014). Although LMDz4-regional has finer horizontal resolution, it employs fewer vertical levels and exhibits weaker SST variability. The larger variability in SST residuals in CNRM-RCSM4 compared to LMD-CNRM (0.39 vs. 0.34 over 2006–2020) may be partly attributable to spectral nudging, as CNRM-CM5 itself exhibits the largest SST residual variability among the driving GCMs over the same period (0.46), suggesting that this signal is inherited from the parent model rather than generated by the downscaling process. However, the exact role of spectral nudging in shaping extreme events in downscaling simulations remains an open question requiring targeted future work.
These results highlight that the added value for MHW intensity is generally positive although not uniform across the ensemble nor systematically linked to increased horizontal resolution. Improvements in intensity are thus governed by model-specific processes that are not straightforwardly improved by resolution alone, consistently with Pilo et al. (2019).
Med-CORDEX downscaling simulations offer a powerful framework for assessing climate-change impacts in the Mediterranean Sea, a region where MHWs pose significant risks to ecosystems and human activities and reliable high-resolution simulations are crucial for defining the characteristics of future marine thermal extremes. Notably, Med-CORDEX represents one of the few coordinated multi-model ensembles worldwide to include a fully coupled ocean component, making it a unique tool for studying air-sea interactions and marine extremes at regional scale. Exploiting this ensemble approach rather than relying on a single model or a single pair of runs allows us to derive more robust conclusions about the added value of regional coupling, by separating systematic signals from model-specific behaviour. Here we ask whether Med-CORDEX RCSMs systematically improve the representation of SST and MHW properties relative to their driving GCMs, and under which conditions and at which scales this added value emerges. Identifying where and why regional downscaling succeeds or fails represents a step towards improving future generations of regional climate models.
For SST, the added value of dynamical downscaling is scale-dependent and metric-specific. Most RCSMs fail to correct area-averaged biases in the mean, standard deviation, 90th percentile, and trend, reflecting the inability of dynamical downscaling to reduce large-scale errors inherited from the driving GCMs. Nevertheless, 7 out of 9 RCSMs improve the spatial structure of the mean SST field relative to their driving GCMs and all RCSMs show error improvement localized along the coastlines and in semi-enclosed areas such as the Adriatic, Alboran, and Aegean Seas, regardless of their basin-averaged performance. Together, these results confirm that the added value of dynamical downscaling for SST is primarily a regional-scale phenomenon, concentrated where fine-scale ocean-atmosphere interactions and topographic constraints are most influential. RCSMs generally improve the representation of the shape of the SST distribution, particularly for median-removed SST in the central and eastern Mediterranean, where they simulate a broader PDF closer to observations. However, the Gulf of Lion stands out as a region of consistent negative AVi, where regional downscaling suppresses SST variability, though this may reflect a more physically consistent representation of deep convection rather than a genuine deterioration. For extreme SSTs, RCSMs generally stretch the upper tail of the distribution towards observations, with 6 out of 9 models showing positive or zero area-averaged AVi, the latter cases still featuring a larger fraction of improving than degrading grid points. Improvement remains elusive in the Alboran Sea and eastern Levantine basin for reasons that remain unclear.
For MHW duration, dynamical downscaling provides consistent and spatially widespread added value. Almost all RCSMs substantially reduce the strong positive duration biases of their parent GCMs, with improvements particularly robust over the Adriatic Sea. This added value stems primarily from the improved representation of short-lived events. The ubiquitous nature of these improvements across the ensemble points to a general enhancement brought by the downscaling process, consistent with previous studies showing that increased horizontal resolution and better representation of mesoscale dynamics improve MHW duration (Pilo et al., 2019; Guo et al., 2019; Capotondi et al., 2024). Improvements in MHW duration reinforce the usefulness of Med-CORDEX RCSMs for impact and ecosystem studies in which the persistence of thermal stress is critical. However, exceptions confirm that enhanced horizontal resolution alone is insufficient if other aspects of the model configuration are degraded.
The picture is more variable for MHW intensity. The majority of simulations improve the representation of this metric by reducing the underestimation found in the parent GCMs, yet three RCSMs exhibit clear deterioration. Accurately capturing MHW intensity requires a faithful representation of intra-seasonal SST variability, which governs the magnitude of transient thermal anomalies. In the models showing negative added value, this variability is plausibly linked to model-specific factors, though attributing specific failures to specific model components would require dedicated sensitivity experiments. Consequently, higher horizontal resolution is a necessary but not sufficient condition for improved intensity representation, and concurrent advances in other model components are needed.
We note that RCSM added value for MHW duration tends to be larger when the driving GCM has a larger bias, which is expected by construction. This relationship is not observed for MHW intensity, where added value appears instead to be governed by model-specific configuration factors. This bias-dependence for MHW duration, in any case, concerns basin-averaged metrics and does not reflect an improved representation of the local and regional-scale processes (dynamics of coastal and semi-enclosed areas) that RCSMs are designed to resolve and where their added value remains concentrated.
A key methodological consideration concerns the implicit bias correction introduced by the definition of MHWs. By computing thresholds relative to each model's own climatology, mean-state biases in the spatio-temporal structure of SST are removed for all data sources. This limits the detectability of added value to the variability component of SST. This may partly explain why added value is more readily identified for SST anomalies than for MHW characteristics. Future studies could complement the classic MHW definition with absolute threshold methods to recover the mean-state dimension of added value.
To further explore the relationship between model configuration and added value, we correlated the area-averaged AVi for each of the four metrics with RCSM improvement factors in key configurations: ocean horizontal resolution, uppermost layer thickness, atmospheric resolution, and coupling frequency, each defined as the ratio of the GCM to the RCSM value for these specific aspects (see Table 1). Of the sixteen correlations tested, only two are statistically significant: AVi for MHW duration (r=0.85, p<0.01) and intensity (r=0.77, p=0.01) both correlate with uppermost layer thickness improvement, suggesting that a thinner surface layer is a key factor in improving MHW representation. The absence of significant correlations with horizontal resolution does not contradict the literature but suggests that, within the Med-CORDEX ensemble, inter-model variance in MHW added value is better explained by the uppermost layer thickness. More broadly, the largely non-significant correlations point to either a predominant role of 1D processes and physical parameterizations, or to errors in GCM boundary conditions overwhelming the RCSMs' structural improvements.
The present study focuses exclusively on SST and derived MHW properties, without examining the atmospheric drivers that govern SST variability and MHW onset. Recent work has shown that Mediterranean MHWs are primarily driven by anomalies in surface heat fluxes, in particular reduced latent heat loss associated with weak winds, enhanced near-surface humidity, and reduced cloud cover associated with enhanced surface downwelling radiation (Bonino et al., 2025; Garfinkel et al., 2026; Paredes-Fortuny et al., 2025). RCSMs improve the representation of atmospheric fronts and mesoscale wind systems (Herrmann et al., 2011; Obermann et al., 2018), which is expected to translate into better representation of surface latent heat fluxes and evaporation (Hamon et al., 2016; Herrmann and Somot, 2008), key drivers of MHW onset and decay. However, a process-based assessment of how such atmospheric processes influence MHWs across the Med-CORDEX ensemble was beyond the scope of this study but represents an important direction for future work.
Substantial differences among Med-CORDEX RCSM configurations (boundary forcing, physics, coupling, vertical and horizontal resolution) introduce structural uncertainty that complicates the attribution of added value to individual model features. Furthermore, most RCSMs are driven by a single GCM, which further limits inter-model comparability, as distinct large-scale biases and trends inherited from the driving GCM are imprinted onto the regional simulations. Future work on added value quantification would benefit from coordinated multi-model ensembles driven by a common GCM and a more strict protocol, enabling clearer identification of the mechanisms through which regional downscaling enhances or limits model skill.
Daily SST datasets from Med-CORDEX models have been requested to model developers, whose contacts are available at https://med-cordex.github.io/ (last access: 31 August 2026). CMIP simulations are available through the ESGF portal (https://esgf-metagrid.cloud.dkrz.de/search, last access: 31 August 2026). The High Resolution L4 Sea Surface Temperature Reprocessed for the Mediterranean Sea from the Copernicus Marine Service is available at https://doi.org/10.48670/moi-00173 (CMEMS, 2024). The High Resolution Diurnal Subskin Sea Surface Temperature Analysis for the Mediterranean Sea is available at https://doi.org/10.48670/moi-00170 (CMEMS, 2023). The Mediterranean Sea Physics Reanalysis is available at https://doi.org/10.48670/mds-00375 (Escudier et al., 2020).
The supplement related to this article is available online at https://doi.org/10.5194/os-22-2725-2026-supplement.
F.D.R., G.B., R.M., E.S. and S.M. contributed to the conception and design of the study. Data collection, processing, and analysis were carried out by F.D.R., who also wrote the first draft of the manuscript. All authors commented on previous versions and approved the final manuscript. Model outputs were provided by the following co-authors: I.P.B. (AWI), S.S. (CNRM-RCSM4 and CNRM-RCSM6), V.D. (UNIBEL), B.A. (GUF), and L.L. (LMD).
The contact author has declared that none of the authors has any competing interests.
This study is partly funded by the European Union. Views and opinions expressed are however those of the author(s) only and do not necessarily reflect those of the European Union or the European Research Executive Agency (REA). Neither the European Union nor the granting authority can be held responsible for them.
Publisher's note: Copernicus Publications remains neutral with regard to jurisdictional claims made in the text, published maps, institutional affiliations, or any other geographical representation in this paper. The authors bear the ultimate responsibility for providing appropriate place names. Views expressed in the text are those of the authors and do not necessarily reflect the views of the publisher.
F.D.R., G.B., R.M. & S.M. were supported by ObsSea4Clim “Ocean observations and indicators for climate and assessments”, funded by the European Union, Horizon Europe Funding Programme for Research and Innovation under grant agreement number: 101136548. ObsSea4Clim contribution nr. 26. S.S. and I.P.B. were supported by the EU, Horizon Europe Funding Programme for research and innovation. This study was partly funded by the French government through the Agence Nationale de la Recherche (ANR) as part of France 2030, under reference ANR-22-POCE-0003, and by the European Union, Horizon Europe Funding Programme for research and innovation under grant agreement No. 101181983 (RIVIERADE). V.D. is partially supported by the Science Fund of the Republic of Serbia (Project EXTREMES) and by the Ministry of Science of the Republic of Serbia. We thank Florence Sevault from CNRM for developing and running the CNRM-RCSM models. The regional climate model simulations used in this work belong to the Med-CORDEX initiative (https://med-cordex.github.io/, last access: 31 August 2026). The global climate model simulations belong to the CMIP initiative (https://wcrp-cmip.org/, last access: 31 August 2026). We thank Felipe Costa, Sadighrad Ehsan, Rafael Gomes de Menezes and Leonardo Lima from CMCC for the development of the code used for MHW detection.
This research has been supported by the European Union, Horizon Europe Funding Programme for Research and Innovation under grant agreement number: 101136548 (ObsSea4Clim); the Agence Nationale de la Recherche, France 2030 (grant no. ANR-22-POCE-0003); the European Union, Horizon Europe Funding Programme (grant no. 101181983, RIVIERADE); the Science Fund of the Republic of Serbia (grant no. 7389, Project EXTREMES); and the Ministry of Science of the Republic of Serbia (grant no. 451-03-34/2026-03/200162).
This paper was edited by Karen J. Heywood and reviewed by Francisco Pastor and one anonymous referee.
Ahumada, M. A. and Cruzado, A.: Modeling of the circulation in the Northwestern Mediterranean Sea with the Princeton Ocean Model, Ocean Sci., 3, 77–89, https://doi.org/10.5194/os-3-77-2007, 2007. a
Bartók, B., Wild, M., Folini, D., Lüthi, D., Kotlarski, S., Schär, C., Vautard, R., Jerez, S., and Imecs, Z.: Projected changes in surface solar radiation in CMIP5 global climate models and in EURO-CORDEX regional climate models for Europe, Clim. Dynam., 49, 2665–2683, https://doi.org/10.1007/s00382-016-3471-2, 2017. a
Bergamasco, A. and Malanotte-Rizzoli, P.: The circulation of the Mediterranean Sea: a historical review of experimental investigations, Advances in Oceanography and Limnology, 1, 11–28, https://doi.org/10.1080/19475721.2010.491656, 2010. a
Bonino, G., McAdam, R., Athanasiadis, P., Cavicchia, L., Rodrigues, R. R., Scoccimarro, E., Tibaldi, S., and Masina, S.: Mediterranean summer marine heatwaves triggered by weaker winds under subtropical ridges, Nat. Geosci., 18, 848–853, https://doi.org/10.1038/s41561-025-01762-9, 2025. a, b
Boé, J., Somot, S., Corre, L., and Nabat, P.: Large discrepancies in summer climate change over Europe as projected by global and regional climate models: causes and consequences, Clim. Dynam., 54, 2981–3002, https://doi.org/10.1007/s00382-020-05153-1, 2020. a
Buongiorno Nardelli, B., Tronconi, C., Pisano, A., and Santoleri, R.: High and Ultra-High resolution processing of satellite Sea Surface Temperature data over Southern European Seas in the framework of MyOcean project, Remote Sens. Environ., 129, 1–16, https://doi.org/10.1016/j.rse.2012.10.012, 2013. a
Byun, U., Chang, E., Kim, J., Ahn, J., Cha, D., Min, S., and Byun, Y.: Investigation of Added Value in Regional Climate Models for East Asian Storm Track Analysis, J. Geophys. Res.-Atmos., 128, e2023JD039167, https://doi.org/10.1029/2023JD039167, 2023. a
Capotondi, A., Rodrigues, R. R., Sen Gupta, A., Benthuysen, J. A., Deser, C., Frölicher, T. L., Lovenduski, N. S., Amaya, D. J., Le Grix, N., Xu, T., Hermes, J., Holbrook, N. J., Martinez-Villalobos, C., Masina, S., Roxy, M. K., Schaeffer, A., Schlegel, R. W., Smith, K. E., and Wang, C.: A global overview of marine heatwaves in a changing climate, Commun. Earth Environ., 5, 701, https://doi.org/10.1038/s43247-024-01806-9, 2024. a, b, c, d
Cardoso, R. M. and Soares, P. M. M.: Is there added value in the EURO-CORDEX hindcast temperature simulations? Assessing the added value using climate distributions in Europe, Int. J. Climatol., 42, 4024–4039, https://doi.org/10.1002/joc.7472, 2022. a
Careto, J. A. M., Soares, P. M. M., Cardoso, R. M., Herrera, S., and Gutiérrez, J. M.: Added value of EURO-CORDEX high-resolution downscaling over the Iberian Peninsula revisited – Part 1: Precipitation, Geosci. Model Dev., 15, 2635–2652, https://doi.org/10.5194/gmd-15-2635-2022, 2022. a
Cavicchia, L., Gualdi, S., Sanna, A., and Oddo, P.: The Regional Ocean-Atmosphere Coupled Model COSMO-NEMO_MFS, CMCC Research Paper, https://www.cmcc.it/wp-content/uploads/2015/04/rp0254-csp-04-2015.pdf (last access: 31 August 2026), 2015. a
Ciarlo`, J. M., Coppola, E., Fantini, A., Giorgi, F., Gao, X., Tong, Y., Glazer, R. H., Torres Alavez, J. A., Sines, T., Pichelli, E., Raffaele, F., Das, S., Bukovsky, M., Ashfaq, M., Im, E.-S., Nguyen-Xuan, T., Teichmann, C., Remedio, A., Remke, T., Bülow, K., Weber, T., Buntemeyer, L., Sieck, K., Rechid, D., and Jacob, D.: A new spatially distributed added value index for regional climate models: the EURO-CORDEX and the CORDEX-CORE highest resolution ensembles, Clim. Dynam., 57, 1403–1424, https://doi.org/10.1007/s00382-020-05400-5, 2021. a, b, c, d
Conte, D., Gualdi, S., and Lionello, P.: Effect of Model Resolution on Intense and Extreme Precipitationinthe Mediterranean Region, Atmosphere, 11, 699, https://doi.org/10.3390/atmos11070699, 2020. a
Cramer, W., Guiot, J., Fader, M., Garrabou, J., Gattuso, J.-P., Iglesias, A., Lange, M. A., Lionello, P., Llasat, M. C., Paz, S., Peñuelas, J., Snoussi, M., Toreti, A., Tsimplis, M. N., and Xoplaki, E.: Climate change and interconnected risks to sustainable development in the Mediterranean, Nat. Clim. Change, 8, 972–980, https://doi.org/10.1038/s41558-018-0299-2, 2018. a
Darmaraki, S., Somot, S., Sevault, F., and Nabat, P.: Past Variability of Mediterranean Sea Marine Heatwaves, Geophys. Res. Lett., 46, 9813–9823, https://doi.org/10.1029/2019GL082933, 2019a. a
Darmaraki, S., Somot, S., Sevault, F., Nabat, P., Cabos Narvaez, W. D., Cavicchia, L., Djurdjevic, V., Li, L., Sannino, G., and Sein, D. V.: Future evolution of Marine Heatwaves in the Mediterranean Sea, Clim. Dynam., 53, 1371–1392, https://doi.org/10.1007/s00382-019-04661-z, 2019b. a, b
Darmaraki, S., Denaxa, D., Theodorou, I., Livanou, E., Rigatou, D., Raitsos E., D., Stavrakidis-Zachou, O., Dimarchopoulou, D., Bonino, G., McADAM, R., Organelli, E., Pitsouni, A., and Parasyris, A.: Marine Heatwaves in the Mediterranean Sea: A Literature Review, Mediterr. Mar. Sci., 25, 586–620, https://doi.org/10.12681/mms.38392, 2024. a
Dayan, H., McAdam, R., Juza, M., Masina, S., and Speich, S.: Marine heat waves in the Mediterranean Sea: An assessment from the surface to the subsurface to meet national needs, Front. Mar. Sci., 10, 1045138, https://doi.org/10.3389/fmars.2023.1045138, 2023. a
Demirov, E. and Pinardi, N.: Simulation of the Mediterranean Sea circulation from 1979 to 1993: Part I. The interannual variability, J. Marine Syst., 33–34, 23–50, https://doi.org/10.1016/S0924-7963(02)00051-9, 2002. a
Denaxa, D., Korres, G., Darmaraki, S., and Hatzaki, M.: Insights into sea surface temperature variability and the impact of long-term warming on marine heatwaves in the Mediterranean Sea, in: 9th edition of the Copernicus Ocean State Report (OSR9), edited by: von Schuckmann, K., Moreira, L., de Pascual Collar, Á., Grégoire, M., Brasseur, P., Garric, G., Karstensen, J., Lionello, P., Marcos, M., Poulain, P.-M., and Staneva, J., Copernicus Publications, State Planet, 6-osr9, 10, https://doi.org/10.5194/sp-6-osr9-10-2025, 2025. a
Di Luca, A., De Elía, R., and Laprise, R.: Potential for small scale added value of RCM's downscaled climate change signal, Clim. Dynam., 40, 601–618, https://doi.org/10.1007/s00382-012-1415-z, 2013. a
Djurdjevic, V. and Rajkovic, B.: Verification of a coupled atmosphere-ocean model using satellite observations over the Adriatic Sea, Ann. Geophys., 26, 1935–1954, https://doi.org/10.5194/angeo-26-1935-2008, 2008. a
Dufresne, J.-L., Foujols, M.-A., Denvil, S., Caubel, A., Marti, O., Aumont, O., Balkanski, Y., Bekki, S., Bellenger, H., Benshila, R., Bony, S., Bopp, L., Braconnot, P., Brockmann, P., Cadule, P., Cheruy, F., Codron, F., Cozic, A., Cugnet, D., De Noblet, N., Duvel, J.-P., Ethé, C., Fairhead, L., Fichefet, T., Flavoni, S., Friedlingstein, P., Grandpeix, J.-Y., Guez, L., Guilyardi, E., Hauglustaine, D., Hourdin, F., Idelkadi, A., Ghattas, J., Joussaume, S., Kageyama, M., Krinner, G., Labetoulle, S., Lahellec, A., Lefebvre, M.-P., Lefevre, F., Levy, C., Li, Z. X., Lloyd, J., Lott, F., Madec, G., Mancip, M., Marchand, M., Masson, S., Meurdesoif, Y., Mignot, J., Musat, I., Parouty, S., Polcher, J., Rio, C., Schulz, M., Swingedouw, D., Szopa, S., Talandier, C., Terray, P., Viovy, N., and Vuichard, N.: Climate change projections using the IPSL-CM5 Earth System Model: from CMIP3 to CMIP5, Clim. Dynam., 40, 2123–2165, https://doi.org/10.1007/s00382-012-1636-1, 2013. a
Döscher, R., Acosta, M., Alessandri, A., Anthoni, P., Arsouze, T., Bergman, T., Bernardello, R., Boussetta, S., Caron, L.-P., Carver, G., Castrillo, M., Catalano, F., Cvijanovic, I., Davini, P., Dekker, E., Doblas-Reyes, F. J., Docquier, D., Echevarria, P., Fladrich, U., Fuentes-Franco, R., Gröger, M., v. Hardenberg, J., Hieronymus, J., Karami, M. P., Keskinen, J.-P., Koenigk, T., Makkonen, R., Massonnet, F., Ménégoz, M., Miller, P. A., Moreno-Chamarro, E., Nieradzik, L., van Noije, T., Nolan, P., O'Donnell, D., Ollinaho, P., van den Oord, G., Ortega, P., Prims, O. T., Ramos, A., Reerink, T., Rousset, C., Ruprich-Robert, Y., Le Sager, P., Schmith, T., Schrödner, R., Serva, F., Sicardi, V., Sloth Madsen, M., Smith, B., Tian, T., Tourigny, E., Uotila, P., Vancoppenolle, M., Wang, S., Wårlind, D., Willén, U., Wyser, K., Yang, S., Yepes-Arbós, X., and Zhang, Q.: The EC-Earth3 Earth system model for the Coupled Model Intercomparison Project 6, Geosci. Model Dev., 15, 2973–3020, https://doi.org/10.5194/gmd-15-2973-2022, 2022. a
Embury, O., Merchant, C. J., Good, S. A., Rayner, N. A., Høyer, J. L., Atkinson, C., Block, T., Alerskans, E., Pearson, K. J., Worsfold, M., McCarroll, N., and Donlon, C.: Satellite-based time-series of sea-surface temperature since 1980 for climate applications, Sci. Data, 11, 326, https://doi.org/10.1038/s41597-024-03147-w, 2024. a
Escudier, R., Clementi, E., Omar, M., Cipollone, A., Pistoia, J., Aydogdu, A., Drudi, M., Grandi, A., Lyubartsev, V., Lecci, R., Cretí, S., Masina, S., Coppini, G., an Pinardi, N.: Mediterranean Sea Physical Reanalysis (CMEMS MED-Currents) (Version 1), Copernicus Monitoring Environment Marine Service (CMEMS) [data set], https://doi.org/10.48670/mds-00375, 2020. a
Escudier, R., Clementi, E., Cipollone, A., Pistoia, J., Drudi, M., Grandi, A., Lyubartsev, V., Lecci, R., Aydogdu, A., Delrosso, D., Omar, M., Masina, S., Coppini, G., and Pinardi, N.: A High Resolution Reanalysis for the Mediterranean Sea, Front. Earth Sci., 9, 702285, https://doi.org/10.3389/feart.2021.702285, 2021. a
E.U. Copernicus Marine Service Information (CMEMS): Mediterranean Sea – High Resolution Diurnal Subskin Sea Surface Temperature Analysis, Marine Data Store (MDS) [data set], https://doi.org/10.48670/moi-00170, 2023. a
E.U. Copernicus Marine Service Information (CMEMS): Mediterranean Sea – High Resolution L4 Sea Surface Temperature Reprocessed, Marine Data Store (MDS) [data set], https://doi.org/10.48670/moi-00173, 2024. a
Eyring, V., Bony, S., Meehl, G. A., Senior, C. A., Stevens, B., Stouffer, R. J., and Taylor, K. E.: Overview of the Coupled Model Intercomparison Project Phase 6 (CMIP6) experimental design and organization, Geosci. Model Dev., 9, 1937–1958, https://doi.org/10.5194/gmd-9-1937-2016, 2016. a
Fantini, A., Raffaele, F., Torma, C., Bacer, S., Coppola, E., Giorgi, F., Ahrens, B., Dubois, C., Sanchez, E., and Verdecchia, M.: Assessment of multiple daily precipitation statistics in ERA-Interim driven Med-CORDEX and EURO-CORDEX experiments against high resolution observations, Clim. Dynam., 51, 877–900, https://doi.org/10.1007/s00382-016-3453-4, 2018. a
Freedman, D. and Diaconis, P.: On the histogram as a density estimator:L 2 theory, Z. Wahrscheinlichkeit., 57, 453–476, https://doi.org/10.1007/BF01025868, 1981. a
Frölicher, T. L., Fischer, E. M., and Gruber, N.: Marine heatwaves under global warming, Nature, 560, 360–364, https://doi.org/10.1038/s41586-018-0383-9, 2018. a
Garfinkel, C. I., Knobler, S., Liberzon, D., and Rilov, G.: Precursors of Marine Heatwaves in the Eastern Mediterranean, Geophys. Res. Lett., 53, e2025GL120652, https://doi.org/10.1029/2025GL120652, 2026. a
Garrabou, J., Gómez-Gras, D., Medrano, A., Cerrano, C., Ponti, M., Schlegel, R., Bensoussan, N., Turicchia, E., Sini, M., Gerovasileiou, V., Teixido, N., Mirasole, A., Tamburello, L., Cebrian, E., Rilov, G., Ledoux, J., Souissi, J. B., Khamassi, F., Ghanem, R., Benabdi, M., Grimes, S., Ocaña, O., Bazairi, H., Hereu, B., Linares, C., Kersting, D. K., La Rovira, G., Ortega, J., Casals, D., Pagès-Escolà, M., Margarit, N., Capdevila, P., Verdura, J., Ramos, A., Izquierdo, A., Barbera, C., Rubio-Portillo, E., Anton, I., López-Sendino, P., Díaz, D., Vázquez-Luis, M., Duarte, C., Marbà, N., Aspillaga, E., Espinosa, F., Grech, D., Guala, I., Azzurro, E., Farina, S., Cristina Gambi, M., Chimienti, G., Montefalcone, M., Azzola, A., Mantas, T. P., Fraschetti, S., Ceccherelli, G., Kipson, S., Bakran-Petricioli, T., Petricioli, D., Jimenez, C., Katsanevakis, S., Kizilkaya, I. T., Kizilkaya, Z., Sartoretto, S., Elodie, R., Ruitton, S., Comeau, S., Gattuso, J., and Harmelin, J.: Marine heatwaves drive recurrent mass mortalities in the Mediterranean Sea, Glob. Change Biol., 28, 5708–5725, https://doi.org/10.1111/gcb.16301, 2022. a
Giorgetta, M. A., Jungclaus, J., Reick, C. H., Legutke, S., Bader, J., Böttinger, M., Brovkin, V., Crueger, T., Esch, M., Fieg, K., Glushak, K., Gayler, V., Haak, H., Hollweg, H., Ilyina, T., Kinne, S., Kornblueh, L., Matei, D., Mauritsen, T., Mikolajewicz, U., Mueller, W., Notz, D., Pithan, F., Raddatz, T., Rast, S., Redler, R., Roeckner, E., Schmidt, H., Schnur, R., Segschneider, J., Six, K. D., Stockhause, M., Timmreck, C., Wegner, J., Widmann, H., Wieners, K., Claussen, M., Marotzke, J., and Stevens, B.: Climate and carbon cycle changes from 1850 to 2100 in MPI-ESM simulations for the Coupled Model Intercomparison Project phase 5, J. Adv. Model. Earth Sy., 5, 572–597, https://doi.org/10.1002/jame.20038, 2013. a, b, c
Giorgi, F.: Climate change hot-spots, Geophys. Res. Lett., 33, 2006GL025734, https://doi.org/10.1029/2006GL025734, 2006. a
Guo, X., Gao, Y., Zhang, S., Wu, L., Chang, P., Cai, W., Zscheischler, J., Leung, L. R., Small, J., Danabasoglu, G., Thompson, L., and Gao, H.: Threat by marine heatwaves to adaptive large marine ecosystems in an eddy-resolving model, Nat. Clim. Change, 12, 179–186, https://doi.org/10.1038/s41558-021-01266-5, 2022. a, b, c
Hamdeno, M. and Alvera-Azcaráte, A.: Marine heatwaves characteristics in the Mediterranean Sea: Case study the 2019 heatwave events, Front. Mar. Sci., 10, 1093760, https://doi.org/10.3389/fmars.2023.1093760, 2023. a
Hamon, M., Beuvier, J., Somot, S., Lellouche, J.-M., Greiner, E., Jordà, G., Bouin, M.-N., Arsouze, T., Béranger, K., Sevault, F., Dubois, C., Drevillon, M., and Drillet, Y.: Design and validation of MEDRYS, a Mediterranean Sea reanalysis over the period 1992–2013, Ocean Sci., 12, 577–599, https://doi.org/10.5194/os-12-577-2016, 2016. a
Hamouda, M. E., Czakay, C., and Ahrens, B.: On Convection During Vb-Cyclone Events in Present and Warmer Climate, : ESS Open Archive, https://doi.org/10.22541/essoar.169447440.03083598/v1, 2023. a
Hawkins, E. and Sutton, R.: The Potential to Narrow Uncertainty in Regional Climate Predictions, B. Am. Meteor. Soc., 90, 1095–1108, https://doi.org/10.1175/2009BAMS2607.1, 2009. a
Herrmann, M., Somot, S., Calmanti, S., Dubois, C., and Sevault, F.: Representation of spatial and temporal variability of daily wind speed and of intense wind events over the Mediterranean Sea using dynamical downscaling: impact of the regional climate model configuration, Nat. Hazards Earth Syst. Sci., 11, 1983–2001, https://doi.org/10.5194/nhess-11-1983-2011, 2011. a, b, c
Herrmann, M. J. and Somot, S.: Relevance of ERA40 dynamical downscaling for modeling deep convection in the Mediterranean Sea, Geophys. Res. Lett., 35, 2007GL032442, https://doi.org/10.1029/2007GL032442, 2008. a
Hobday, A. J., Alexander, L. V., Perkins, S. E., Smale, D. A., Straub, S. C., Oliver, E. C., Benthuysen, J. A., Burrows, M. T., Donat, M. G., Feng, M., Holbrook, N. J., Moore, P. J., Scannell, H. A., Sen Gupta, A., and Wernberg, T.: A hierarchical approach to defining marine heatwaves, Prog. Oceanogr., 141, 227–238, https://doi.org/10.1016/j.pocean.2015.12.014, 2016. a, b
Iles, C. E., Vautard, R., Strachan, J., Joussaume, S., Eggen, B. R., and Hewitt, C. D.: The benefits of increasing resolution in global and regional climate simulations for European climate extremes, Geosci. Model Dev., 13, 5583–5607, https://doi.org/10.5194/gmd-13-5583-2020, 2020. a
IPCC: Climate Change 2022 – Impacts, Adaptation and Vulnerability: Working Group II Contribution to the Sixth Assessment Report of the Intergovernmental Panel on Climate Change, Cambridge University Press, 1 edn., ISBN 978-1-009-32584-4, https://doi.org/10.1017/9781009325844, 2023. a
Jacob, D., Petersen, J., Eggert, B., Alias, A., Christensen, O. B., Bouwer, L. M., Braun, A., Colette, A., Déqué, M., Georgievski, G., Georgopoulou, E., Gobiet, A., Menut, L., Nikulin, G., Haensler, A., Hempelmann, N., Jones, C., Keuler, K., Kovats, S., Kröner, N., Kotlarski, S., Kriegsmann, A., Martin, E., Van Meijgaard, E., Moseley, C., Pfeifer, S., Preuschmann, S., Radermacher, C., Radtke, K., Rechid, D., Rounsevell, M., Samuelsson, P., Somot, S., Soussana, J.-F., Teichmann, C., Valentini, R., Vautard, R., Weber, B., and Yiou, P.: EURO-CORDEX: new high-resolution climate change projections for European impact research, Regional Environmental Change, 14, 563–578, https://doi.org/10.1007/s10113-013-0499-2, 2014. a
Jacob, D., Teichmann, C., Sobolowski, S., Katragkou, E., Anders, I., Belda, M., Benestad, R., Boberg, F., Buonomo, E., Cardoso, R. M., Casanueva, A., Christensen, O. B., Christensen, J. H., Coppola, E., De Cruz, L., Davin, E. L., Dobler, A., Domínguez, M., Fealy, R., Fernandez, J., Gaertner, M. A., García-Díez, M., Giorgi, F., Gobiet, A., Goergen, K., Gómez-Navarro, J. J., Alemán, J. J. G., Gutiérrez, C., Gutiérrez, J. M., Güttler, I., Haensler, A., Halenka, T., Jerez, S., Jiménez-Guerrero, P., Jones, R. G., Keuler, K., Kjellström, E., Knist, S., Kotlarski, S., Maraun, D., Van Meijgaard, E., Mercogliano, P., Montávez, J. P., Navarra, A., Nikulin, G., De Noblet-Ducoudré, N., Panitz, H.-J., Pfeifer, S., Piazza, M., Pichelli, E., Pietikäinen, J.-P., Prein, A. F., Preuschmann, S., Rechid, D., Rockel, B., Romera, R., Sánchez, E., Sieck, K., Soares, P. M. M., Somot, S., Srnec, L., Sørland, S. L., Termonia, P., Truhetz, H., Vautard, R., Warrach-Sagi, K., and Wulfmeyer, V.: Regional climate downscaling over Europe: perspectives from the EURO-CORDEX community, Reg. Environ. Change, 20, 51, https://doi.org/10.1007/s10113-020-01606-9, 2020. a
Kim, Y., Evans, J. P., and Sharma, A.: Multivariate bias correction of regional climate model boundary conditions, Clim. Dynam., 61, 3253–3269, https://doi.org/10.1007/s00382-023-06718-6, 2023. a
Lazoglou, G., Papadopoulos-Zachos, A., Georgiades, P., Zittis, G., Velikou, K., Manios, E. M., and Anagnostopoulou, C.: Identification of climate change hotspots in the Mediterranean, Sci. Rep., 14, 29817, https://doi.org/10.1038/s41598-024-80139-1, 2024. a
Lehner, F., Deser, C., Maher, N., Marotzke, J., Fischer, E. M., Brunner, L., Knutti, R., and Hawkins, E.: Partitioning climate projection uncertainty with multiple large ensembles and CMIP5/6, Earth Syst. Dynam., 11, 491–508, https://doi.org/10.5194/esd-11-491-2020, 2020. a
Lionello, P. and Scarascia, L.: The relation between climate change in the Mediterranean region and global warming, Reg. Environ. Change, 18, 1481–1493, https://doi.org/10.1007/s10113-018-1290-1, 2018. a
L’Hévéder, B., Li, L., Sevault, F., and Somot, S.: Interannual variability of deep convection in the Northwestern Mediterranean simulated with a coupled AORCM, Clim. Dynam., 41, 937–960, https://doi.org/10.1007/s00382-012-1527-5, 2013. a, b
Macias, D., Garcia-Gorriz, E., Dosio, A., Stips, A., and Keuler, K.: Obtaining the correct sea surface temperature: bias correction of regional climate model data for the Mediterranean Sea, Clim. Dynam., 51, 1095–1117, https://doi.org/10.1007/s00382-016-3049-z, 2018. a
Martínez, J., Leonelli, F. E., García-Ladona, E., Garrabou, J., Kersting, D. K., Bensoussan, N., and Pisano, A.: Evolution of marine heatwaves in warming seas: the Mediterranean Sea case study, Front. Mar. Sci., 10, 1193164, https://doi.org/10.3389/fmars.2023.1193164, 2023. a
Marullo, S., Santoleri, R., Ciani, D., Le Borgne, P., Péré, S., Pinardi, N., Tonani, M., and Nardone, G.: Combining model and geostationary satellite data to reconstruct hourly SST field over the Mediterranean Sea, Remote Sens. Environ., 146, 11–23, https://doi.org/10.1016/j.rse.2013.11.001, 2014. a
Mishra, A. K., Jangir, B., and Strobach, E.: Does Increasing Climate Model Horizontal Resolution Be Beneficial for the Mediterranean Region?: Multimodel Evaluation Framework for High-Resolution Model Intercomparison Project, J. Geophys. Res.-Atmos., 128, https://doi.org/10.1029/2022jd037812, 2023. a
Molina, M. O., Careto, J. A. M., Gutiérrez, C., Sánchez, E., and Soares, P. M. M.: The added value of high-resolution EURO-CORDEX simulations to describe daily wind speed over Europe, Int. J. Climatol., 43, 1062–1078, https://doi.org/10.1002/joc.7877, 2023. a
Molina, M. O., Careto, J. M., Gutiérrez, C., Sánchez, E., Goergen, K., Sobolowski, S., Coppola, E., Pichelli, E., Ban, N., Belus̆ić, D., Short, C., Caillaud, C., Dobler, A., Hodnebrog, , Kartsios, S., Lenderink, G., De Vries, H., Göktürk, O., Milovac, J., Feldmann, H., Truhetz, H., Demory, M. E., Warrach-Sagi, K., Keuler, K., Adinolfi, M., Raffa, M., Tölle, M., Sieck, K., Bastin, S., and Soares, P. M. M.: The added value of simulated near-surface wind speed over the Alps from a km-scale multimodel ensemble, Clim. Dynam., 62, 4697–4715, https://doi.org/10.1007/s00382-024-07257-4, 2024. a
Moreno-Chamarro, E., Caron, L.-P., Loosveldt Tomas, S., Vegas-Regidor, J., Gutjahr, O., Moine, M.-P., Putrasahan, D., Roberts, C. D., Roberts, M. J., Senan, R., Terray, L., Tourigny, E., and Vidale, P. L.: Impact of increased resolution on long-standing biases in HighResMIP-PRIMAVERA climate models, Geosci. Model Dev., 15, 269–289, https://doi.org/10.5194/gmd-15-269-2022, 2022. a
Nabat, P., Somot, S., Mallet, M., Sanchez-Lorenzo, A., and Wild, M.: Contribution of anthropogenic sulfate aerosols to the changing Euro-Mediterranean climate since 1980, Geophys. Res. Lett., 41, 5605–5611, https://doi.org/10.1002/2014GL060798, 2014. a
Obermann, A., Bastin, S., Belamari, S., Conte, D., Gaertner, M. A., Li, L., and Ahrens, B.: Mistral and Tramontane wind speed and wind direction patterns in regional climate simulations, Clim. Dynam., 51, 1059–1076, https://doi.org/10.1007/s00382-016-3053-3, 2018. a, b
Oliver, E. C., Benthuysen, J. A., Darmaraki, S., Donat, M. G., Hobday, A. J., Holbrook, N. J., Schlegel, R. W., and Sen Gupta, A.: Marine Heatwaves, Annu. Rev. Mar. Sci., 13, 313–342, https://doi.org/10.1146/annurev-marine-032720-095144, 2021. a
Paredes-Fortuny, L., Pastor, F., and Khodayar, S.: Concurrent atmospheric heatwaves intensify marine heatwaves through air-sea heat flux change in the Mediterranean Sea, Commun. Earth Environ., 6, 638, https://doi.org/10.1038/s43247-025-02633-2, 2025. a
Parras-Berrocal, I. M., Vazquez, R., Cabos, W., Sein, D., Mañanes, R., Perez-Sanz, J., and Izquierdo, A.: The climate change signal in the Mediterranean Sea in a regionally coupled atmosphere–ocean model, Ocean Sci., 16, 743–765, https://doi.org/10.5194/os-16-743-2020, 2020. a, b
Parras-Berrocal, I. M., Waldman, R., Gonzalez, N. M., Ahrens, B., Cabos, W., Jordà, G., Lionello, P., Sannino, G., and Somot, S.: Regionalized Mediterranean relative sea level projections under high-emission regional climate scenarios, Environ. Res. Lett., 20, 114068, https://doi.org/10.1088/1748-9326/ae15a5, 2025. a
Parras-Berrocal, I. M., Waldman, R., Sevault, F., Somot, S., Gonzalez, N., Ahrens, B., Anav, A., Djurdjević, V., Gualdi, S., Hamouda, M. E., Li, L., Lionello, P., Sannino, G., and Sein, D. V.: Response of the Mediterranean Sea Surface Circulation at Various Global Warming Levels: A Multi-Model Approach, Geophys. Res. Lett., 51, https://doi.org/10.1029/2024gl111695, 2024. a
Pilo, G. S., Holbrook, N. J., Kiss, A. E., and Hogg, A. M.: Sensitivity of Marine Heatwave Metrics to Ocean Model Resolution, Geophys. Res. Lett., 46, 14604–14612, https://doi.org/10.1029/2019GL084928, 2019. a, b, c, d, e
Pinardi, N. and Masetti, E.: Variability of the large scale general circulation of the Mediterranean Sea from observations and modelling: a review, Palaeogeogr. Palaeocl., 158, 153–173, https://doi.org/10.1016/S0031-0182(00)00048-1, 2000. a
Pisano, A., Buongiorno Nardelli, B., Tronconi, C., and Santoleri, R.: The new Mediterranean optimally interpolated pathfinder AVHRR SST Dataset (1982–2012), Remote Sens. Environ., 176, 107–116, https://doi.org/10.1016/j.rse.2016.01.019, 2016. a
Prein, A. F., Gobiet, A., Truhetz, H., Keuler, K., Goergen, K., Teichmann, C., Fox Maule, C., Van Meijgaard, E., Déqué, M., Nikulin, G., Vautard, R., Colette, A., Kjellström, E., and Jacob, D.: Precipitation in the EURO-CORDEX 0.11° and 0.44° simulations: high resolution, high benefits?, Clim. Dynam., 46, 383–412, https://doi.org/10.1007/s00382-015-2589-y, 2016. a
Qiu, Z., Qiao, F., Jang, C. J., Zhang, L., and Song, Z.: Evaluation and projection of global marine heatwaves based on CMIP6 models, Deep-Sea Res. Pt. II, 194, 104998, https://doi.org/10.1016/j.dsr2.2021.104998, 2021. a
Rummukainen, M.: Added value in regional climate modeling, WIREs Climate Change, 7, 145–159, https://doi.org/10.1002/wcc.378, 2016. a
Ruti, P. M., Somot, S., Giorgi, F., Dubois, C., Flaounas, E., Obermann, A., Dell’Aquila, A., Pisacane, G., Harzallah, A., Lombardi, E., Ahrens, B., Akhtar, N., Alias, A., Arsouze, T., Aznar, R., Bastin, S., Bartholy, J., Béranger, K., Beuvier, J., Bouffies-Cloché, S., Brauch, J., Cabos, W., Calmanti, S., Calvet, J.-C., Carillo, A., Conte, D., Coppola, E., Djurdjevic, V., Drobinski, P., Elizalde-Arellano, A., Gaertner, M., Galàn, P., Gallardo, C., Gualdi, S., Goncalves, M., Jorba, O., Jordà, G., L’Heveder, B., Lebeaupin-Brossier, C., Li, L., Liguori, G., Lionello, P., Maciàs, D., Nabat, P., Önol, B., Raikovic, B., Ramage, K., Sevault, F., Sannino, G., Struglia, M. V., Sanna, A., Torma, C., and Vervatis, V.: Med-CORDEX Initiative for Mediterranean Climate Studies, B. Am. Meteor. Soc., 97, 1187–1208, https://doi.org/10.1175/bams-d-14-00176.1, 2016. a, b
Sánchez-Garrido, J. C. and Nadal, I.: The Alboran Sea circulation and its biological response: A review, Front. Mar. Sci., 9, 933390, https://doi.org/10.3389/fmars.2022.933390, 2022. a
Schlegel, R. W., Oliver, E. C. J., Hobday, A. J., and Smit, A. J.: Detecting Marine Heatwaves With Sub-Optimal Data, Front. Mar. Sci., 6, 737, https://doi.org/10.3389/fmars.2019.00737, 2019. a
Schumacher, D. L., Singh, J., Hauser, M., Fischer, E. M., Wild, M., and Seneviratne, S. I.: Exacerbated summer European warming not captured by climate models neglecting long-term aerosol changes, Commun. Earth Environ., 5, 182, https://doi.org/10.1038/s43247-024-01332-8, 2024. a
Scoccimarro, E., Gualdi, S., Bellucci, A., Sanna, A., Giuseppe Fogli, P., Manzini, E., Vichi, M., Oddo, P., and Navarra, A.: Effects of Tropical Cyclones on Ocean Heat Transport in a High-Resolution Coupled General Circulation Model, J Climate, 24, 4368–4384, https://doi.org/10.1175/2011jcli4104.1, 2011. a
Scoccimarro, E., Lanteri, P., and Cavicchia, L.: Freddy: breaking record for tropical cyclone precipitation?, Environ. Res. Lett., 19, 064013, https://doi.org/10.1088/1748-9326/ad44b5, 2024. a
Sein, D. V., Mikolajewicz, U., Gröger, M., Fast, I., Cabos, W., Pinto, J. G., Hagemann, S., Semmler, T., Izquierdo, A., and Jacob, D.: Regionally coupled atmosphere-ocean-sea ice-marine biogeochemistry model ROM: 1. Description and validation, J. Adv. Model. Earth Sy., 7, 268–304, https://doi.org/10.1002/2014ms000357, 2015. a, b
Sevault, F.: Atlas of the 1980–2018 ERA-Interim simulation with the coupled regional climate system model CNRM-RCSM6, Zenodo, https://doi.org/10.5281/zenodo.11066601, 2024. a
Sevault, F., Somot, S., Alias, A., Dubois, C., Lebeaupin-Brossier, C., Nabat, P., Adloff, F., Déqué, M., and Decharme, B.: A fully coupled Mediterranean regional climate system model: design and evaluation of the ocean component for the 1980–2012 period, Tellus A, 66, 23967, https://doi.org/10.3402/tellusa.v66.23967, 2014. a, b, c
Simon, C., Kis, A., and Torma, C. Z.: Evaluation of different bias-corrected EURO-CORDEX databases and the expected future changes in precipitation over Hungary, Sci. Total Environ., 1001, 180451, https://doi.org/10.1016/j.scitotenv.2025.180451, 2025. a
Smith, K. E., Burrows, M. T., Hobday, A. J., Sen Gupta, A., Moore, P. J., Thomsen, M., Wernberg, T., and Smale, D. A.: Socioeconomic impacts of marine heatwaves: Global issues and opportunities, Science, 374, eabj3593, https://doi.org/10.1126/science.abj3593, 2021. a
Smith, K. E., Sen Gupta, A., Burrows, M. T., Filbee-Dexter, K., Hobday, A. J., Holbrook, N. J., Malan, N., Moore, P. J., Oliver, E. C. J., Thomsen, M. S., Wernberg, T., Zhao, Z., and Smale, D. A.: Ocean extremes as a stress test for marine ecosystems and society, Nat. Clim. Change, 15, 231–235, https://doi.org/10.1038/s41558-025-02269-2, 2025. a
Soares, P. M. M. and Cardoso, R. M.: A simple method to assess the added value using high-resolution climate distributions: application to the EURO-CORDEX daily precipitation, Int. J. Climatol., 38, 1484–1498, https://doi.org/10.1002/joc.5261, 2018. a
Somot, S., Ruti, P., Ahrens, B., Coppola, E., Jordà, G., Sannino, G., and Solmon, F.: Editorial for the Med-CORDEX special issue, Clim. Dynam., 51, 771–777, https://doi.org/10.1007/s00382-018-4325-x, 2018. a
Soto-Navarro, J., Jordá, G., Amores, A., Cabos, W., Somot, S., Sevault, F., Macías, D., Djurdjevic, V., Sannino, G., Li, L., and Sein, D.: Evolution of Mediterranean Sea water properties under climate change scenarios in the Med-CORDEX ensemble, Clim. Dynam., 54, 2135–2165, https://doi.org/10.1007/s00382-019-05105-4, 2020. a
Séférian, R., Nabat, P., Michou, M., Saint-Martin, D., Voldoire, A., Colin, J., Decharme, B., Delire, C., Berthet, S., Chevallier, M., Sénési, S., Franchisteguy, L., Vial, J., Mallet, M., Joetzjer, 710 E., Geoffroy, O., Guérémy, J., Moine, M., Msadek, R., Ribes, A., Rocher, M., Roehrig, R., Salas-y-Mélia, D., Sanchez, E., Terray, L., Valcke, S., Waldman, R., Aumont, O., Bopp, L., Deshayes, J., Éthé, C., and Madec, G.: Role of Earth System Processes in Present-Day and Future Climate, J. Adv. Model. Earth Sy., 11, 4182–4227, https://doi.org/10.1029/2019ms001791, 2019. a
Taylor, K. E., Stouffer, R. J., and Meehl, G. A.: An Overview of CMIP5 and the Experiment Design, B. Am. Meteor. Soc., 93, 485–498, https://doi.org/10.1175/BAMS-D-11-00094.1, 2012. a
Torma, C., Giorgi, F., and Coppola, E.: Added value of regional climate modeling over areas characterized by complex terrain-Precipitation over the Alps, J. Geophys. Res.-Atmos., 120, 3957–3972, https://doi.org/10.1002/2014JD022781, 2015. a
Veljovic, K., Rajkovic, B., Fennessy, M. J., Altshuler, E. L., and Mesinger, F.: Regional climate modeling: Should one attempt improving on the large scales? Lateral boundary condition scheme: Any impact?, Meteor. Z., 19, 237–246, https://doi.org/10.1127/0941-2948/2010/0460, 2010. a
Voldoire, A., Sanchez-Gomez, E., Salas Y Mélia, D., Decharme, B., Cassou, C., Sénési, S., Valcke, S., Beau, I., Alias, A., Chevallier, M., Déqué, M., Deshayes, J., Douville, H., Fernandez, E., Madec, G., Maisonnave, E., Moine, M.-P., Planton, S., Saint-Martin, D., Szopa, S., Tyteca, S., Alkama, R., Belamari, S., Braun, A., Coquart, L., and Chauvin, F.: The CNRM-CM5.1 global climate model: description and basic evaluation, Clim. Dynam., 40, 2091–2121, https://doi.org/10.1007/s00382-011-1259-y, 2013. a, b