the Creative Commons Attribution 4.0 License.
the Creative Commons Attribution 4.0 License.
 | 05 Dec 2023
Equatorial wave diagnosis for the Atlantic Niño in 2019 with an ocean reanalysis
Hidenori Aiki
The propagation of equatorial waves is essential for the onset of Atlantic Niño, but diagnosing waves with ocean reanalysis or in situ data remains a challenge. This study uses an ocean reanalysis to diagnose the wave energy transfer route during the 2019 event. The climatological values and the anomaly in 2019 at each grid point are decomposed into the first four baroclinic modes based on their local density profiles. The decomposed geopotential can well reproduce the displacement of the thermocline during the event. Wave energy flux is calculated by means of a group-velocity-based scheme. In addition to detecting wind-forced Kelvin waves and reflected Rossby waves, the wave energy flux reveals another possible energy transfer route along the western boundary, where some off-equatorial wave energy can excite coastally trapped Kelvin waves and transfer back to the equatorial Atlantic. Five transects are selected, across which the passing wave energy fluxes in 2019 are integrated. The results suggest that the Kelvin waves in the third and fourth mode are locally forced, while the wave energy in the second mode is more likely from the off-equatorial region. Therefore, in the autumn of 2019, the second-mode Kelvin waves can deepen the thermocline ahead of other modes from September, serving to precondition the Niño event.
- Article
(20044 KB) - Full-text XML
- BibTeX
- EndNote


The equatorial Atlantic Ocean is known for exhibiting pronounced anomalies of sea surface temperature (SST) on interannual timescales, of which the events with positive anomalies are often referred to as Atlantic Niños (Giannini et al., 2003). This phenomenon is essentially driven by the Bjerknes feedback: the westerly wind anomaly caused by the SST anomaly in the eastern equatorial basin excites equatorial waves and consequently amplifies the SST anomaly through thermocline displacement due to the wave propagation. The impact of these SST events is not limited to affecting precipitation and monsoon patterns in the surrounding sea area and continent but extends to the Pacific and Indian oceans through atmospheric teleconnections (Carton et al., 1996; Okumura and Xie, 2004; Rodríguez-Fonseca et al., 2009; Lübbecke and McPhaden, 2012; Foltz et al., 2019).
Since 2000, the interannual variability in SST has been revealed to be becoming weaker (Tokinaga and Xie, 2011; Prigent et al., 2020). Although the cause for the suppression of the Atlantic Niño events remains unclear, the thermal dynamic rather than the oceanic dynamic was previously thought to play a critical role in the declining trend (Nnamchi et al., 2015; Crespo et al., 2022). A warmer climate deepens the upper ocean layer, making it less sensitive to upwelling anomalies (Crespo et al., 2022). That is, different from the equatorial Pacific, where the changes in the zonal SST gradient under greenhouse forcing are most relevant (Latif and Keenlyside, 2009), a basin-wide warming associated with climate change can eventually break the classic Bjerknes loop so as to limit the development of the SST anomaly. Despite the predicted long-term weakening trend for SST variability, two extremely warm SST events occurred in the winter of 2019 and the second half of 2021. As a result, a skilful prediction for those SST events is still necessary in the short term.
Evidence has been reported that the Atlantic Niño events in both 2019 and 2021 are strongly related to off-equatorial Rossby waves (RWs) (Richter et al., 2022). The equatorial Atlantic basin is narrow and has an inwardly tilted coastline in the northeast. This allows waves from off-equatorial regions to travel through the basin quickly and leads more wave energy back to the equatorial sector (Song and Aiki, 2020). When the off-equatorial RWs approach the western boundary, reflected Kelvin waves (KWs) are excited and consequently displace the thermocline to affect SST in the equatorial Atlantic (Foltz and McPhaden, 2010). This dynamic link suggests that the wave condition is still crucial for the prediction of the Niño events at this moment. Indeed, researchers have already proposed to use equatorial waves to warn about anomalous SST events in down-wave coastal regions (Imbol Koungue et al., 2017, 2019; Illig and Bachèlery, 2019). The period that wave energy transfers horizontally and vertically (it normally takes several months to pass the basin depending on the baroclinic mode and around 1 month to affect local SST depending on the thermocline depth) from the west of the equatorial Atlantic or further from the off-equatorial region gives the equatorial wave the potential to be an effective predictor for the Atlantic Niño at its onset stage.
Early warning systems based on wave propagation for the anomalous SST event in the equatorial Atlantic and the down-wave coastal regions are hence expected (Imbol Koungue et al., 2017, 2019; Song et al., 2023a). It has been suggested to implement ocean linear models in real time that simulate equatorial waves in addition to using in situ and altimetric data for prediction, since RWs in the off-equatorial region have previously been difficult to diagnose with observed or modelled data (Rossby, 1945; Philander, 1978; Schopf et al., 1981; Schiller et al., 2010). However, benefiting from a newly unified wave energy flux scheme for equatorial waves by Aiki et al. (2017), which the authors named the AGC flux (standing for the authors, Aiki, Greatbatch and Claus), the wave energy flux that is transferred in the tropical Atlantic Ocean can be diagnosed by only applying a dataset of current velocity and pressure (Song and Aiki, 2020, 2021). Currently a high-resolution dataset (e.g. ∘ horizontal resolution and 50 vertical levels provided by the Copernicus Marine Environment Monitoring Service) is available to capture the rapid gravity waves such as KWs in low baroclinic mode (Jean-Michel et al., 2021). Also, the Prediction and Research Moored Array in the Tropical Atlantic (PIRATA), initiated in 1997, can provide real-time in situ observation in the tropical Atlantic (Bourlès et al., 2019). These datasets offer an opportunity to develop a wave warning system that does not require a linear ocean model. This study is an attempt to apply the AGC flux in an ocean reanalysis to diagnose waveguides in the event year 2019. We hope that our investigation into the process of the wave energy transfer and its impact on the Atlantic Niño can inspire a simple and reliable system to predict anomalous SST events through diagnosing existing datasets.
The structure of this paper is as follows: Sect. 2 briefly explains the applied dataset and the method to extract the wave information from the data; in Sect. 3, we present the decomposed waves and construct the wave energy transfer route (the trajectory of wave energy transport) in 2019, which we compare with the climatological data to evaluate the extraordinary wave energy from both the equatorial and the off-equatorial region during the Niño event; Sect. 4 summarizes the addressed problems and conclusions of this study.
The reanalysis dataset we employed in this study is the GLORYS12V1 product from CMEMS (Copernicus Marine Environment Monitoring Service). The product is a global ocean eddy-resolving (∘ horizontal resolution, 50 vertical levels) reanalysis using a reduced-order Kalman filter and the 3D-Var scheme to involve along-track altimeter data, satellite SST, sea ice concentration, and in situ temperature and salinity vertical profiles in joint assimilation (Jean-Michel et al., 2021). The product provides daily and monthly datasets including potential temperature, salinity, current velocity, mixed-layer thickness and sea surface height (SSH) covering the altimetry (1993 onward). Daily data are used to detect the equatorial waves in the event year; monthly data are applied to obtain climatology and the mean ocean state. Readers can check the quality of the GLORYS12V1 dataset in Marie et al. (2022). Specifically in the tropical Atlantic, the root mean square error of temperature/salinity profiles is smaller than 0.4 ∘C/0.3 psu; the correlation of the zonal velocity profiles between the reanalysis data and the in situ observation from PIRATA buoys at (0∘, 23∘ W) is around 0.6 with a root mean square error of around 0.1 m s−1 in the mixed layer (10–80 m) (Marie et al., 2022). Although compared with the observation the dataset still underestimates the zonal velocity in the mixed layer by around 5 %–10 %, it should be appropriate to apply it in this study for the introduction of a diagnosis scheme.
The decomposition of baroclinic waves from the ocean reanalysis requires the solution of an eigenvalue equation in the vertical direction as follows:
which is subject to the boundary conditions . The symbol Hb is the ocean bottom depth, N is the Brunt–Väisälä frequency estimated by the mean vertical profiles of temperature and salinity, and ψ(n) is the eigenfunction of the nth baroclinic modes for the corresponding gravity wave speed (eigenvalue) c(n). Then based on linear theory, the wave-induced anomaly is subject to
where is the anomaly of the velocity component and p′ is the geopotential anomaly, representing the displacement of gravity potential by both the density anomaly and the volume transport as follows:
Here h′ is the sea level anomaly and ρ′ is the density anomaly. To decompose the wave, following Toyoda et al. (2021), we integrate both sides of Eq. (2) in the vertical direction after multiplying by ψ(n). Utilizing the orthogonality of the eigenfunction, we have
Thus, by substituting the and p′ obtained from the daily reanalysis data and the ψ(n) solved from Eqs. (1)–(4), wave-induced anomalies in the corresponding baroclinic modes are extracted. In this study, c(n) and ψ(n) are solved using N estimated by the mean vertical profiles of temperature and salinity data from 1993 to 2020 of the monthly reanalysis product. Although the yielded ψ(n) and c(n) are spatially varying (see Figs. 1 and 2), the ψ(n) in the above decomposition process is decoupled from the horizontal motions, given that the wave energy exchange between baroclinic modes is depressed during the wave propagation. Thus, V(n)=(u(n), v(n)) and p(n) are conserved in each mode, which makes it possible for the application of the AGC scheme to detect equatorial waves by diagnosing the wave energy flux in the corresponding mode. Here we utilize the AGC level-2 scheme by Aiki et al. (2017) as follows:
where is the sum of kinetic and gravitational energies and cg is the group velocity. The overline symbol in Eq. (5) is a phase average operator provided by Aiki et al. (2017). is an offset term, which includes a scalar quantity φ(n) solved by
where is Ertel's potential vorticity (EPV). Then, through Eq. (5), we can obtain the flux that orients the direction of the group velocity. The equatorial waves including KW, RW and even the mixed RW (Yanai wave) in the event year 2019 can therefore be detected from the reanalysis data by analysing the wave energy flux.
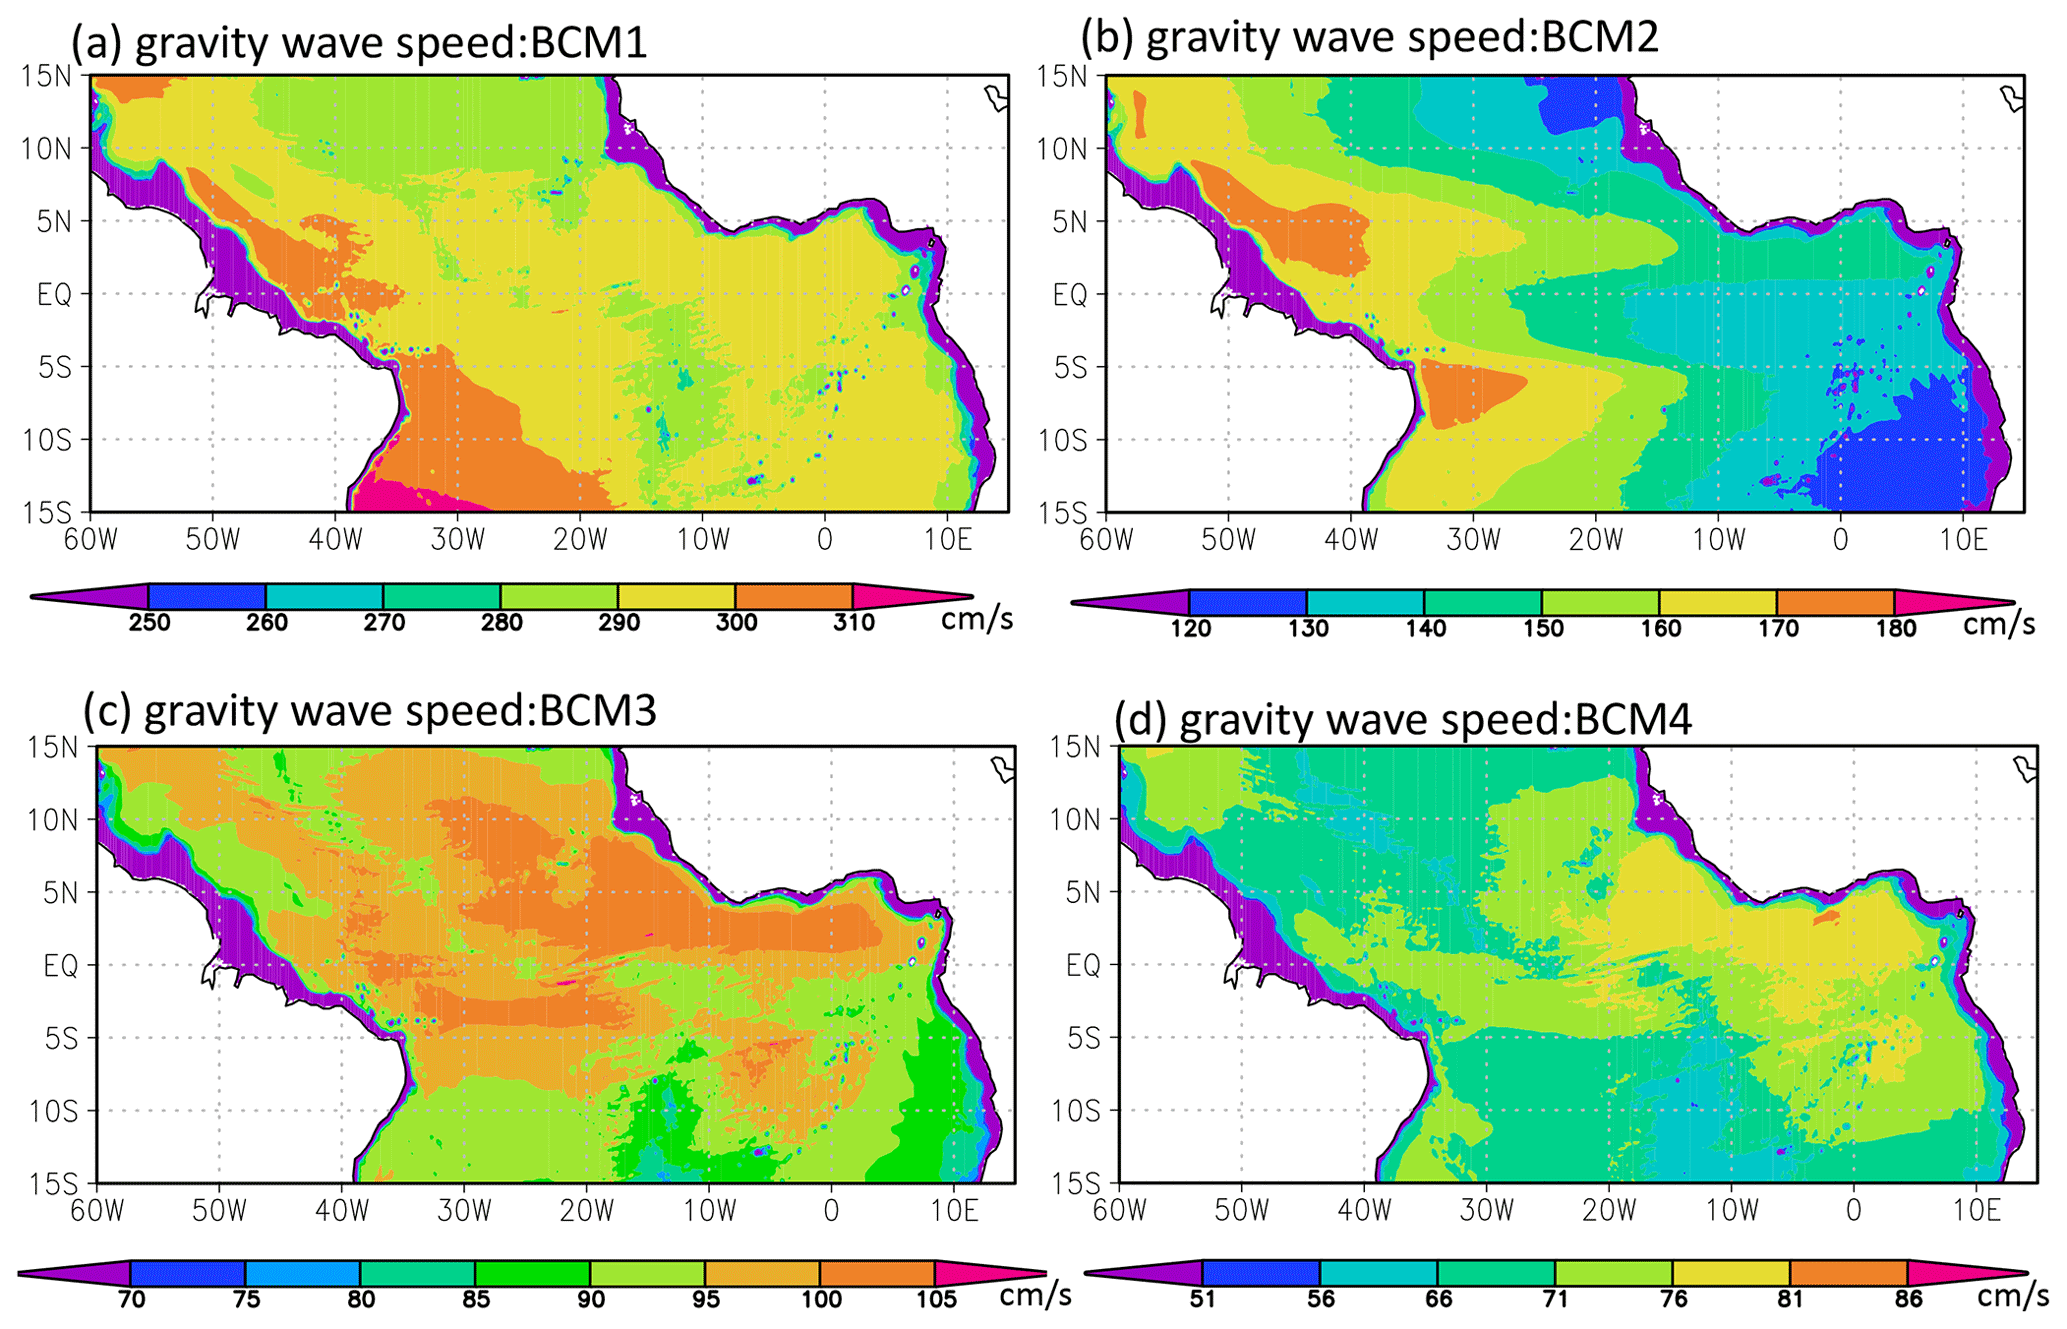
Figure 1Gravity wave speed in the tropical Atlantic for the (a) first, (b) second, (c) third and (d) fourth baroclinic mode (BCM). The gravity wave speed is solved by Eq. (1) with the mean vertical profile of salinity and temperature from the GLORYS12V1 product from 1993 to 2020.
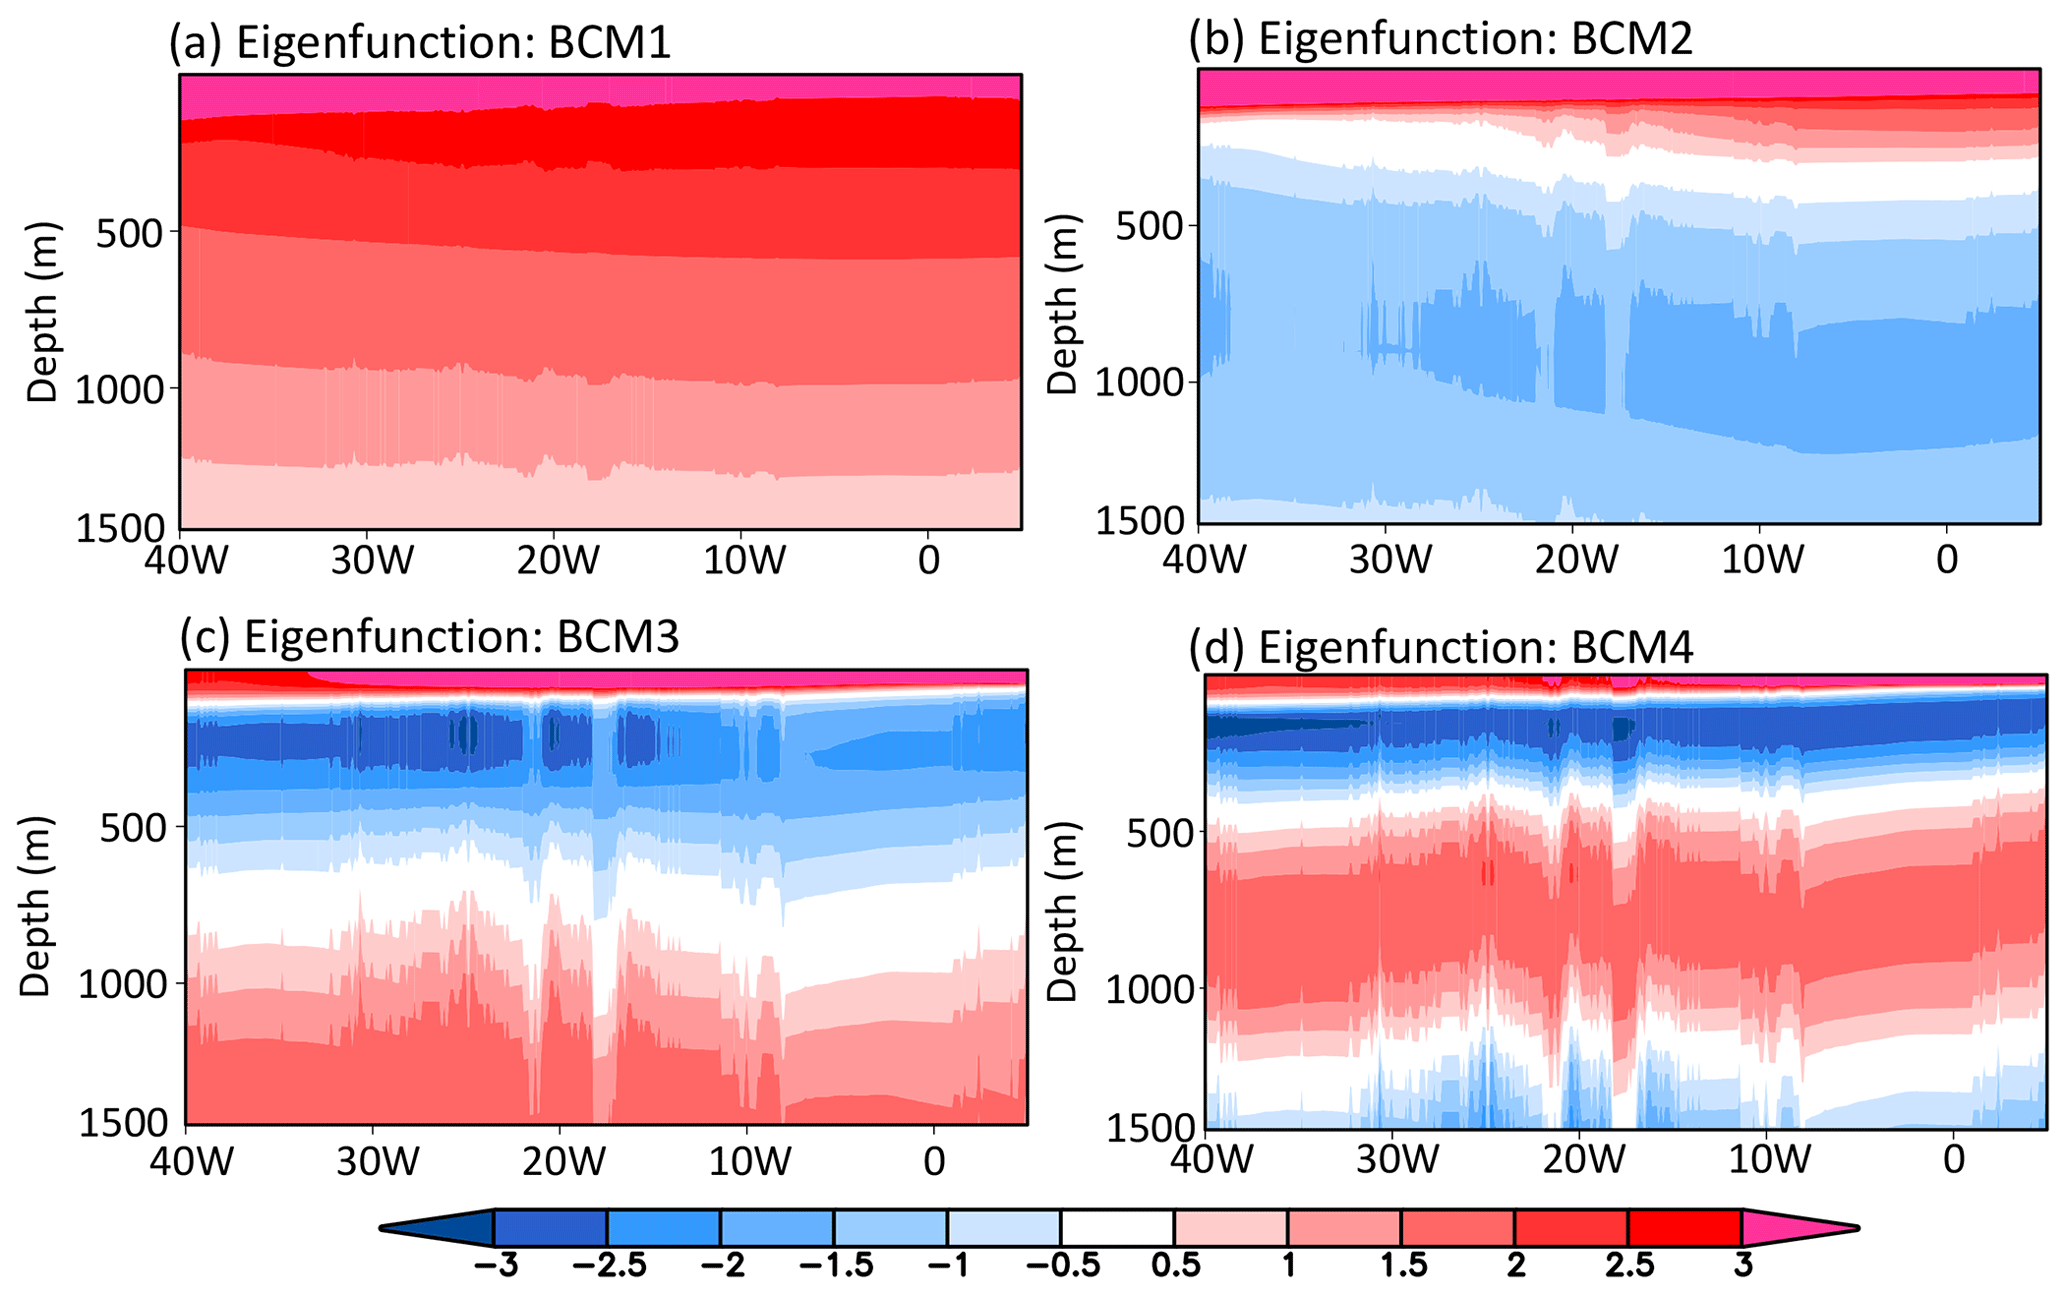
Figure 2Eigenfunctions at the Equator for the (a) first, (b) second, (c) third and (d) fourth baroclinic mode (BCM). The eigenfunction is also solved by Eq. (1) with the mean vertical profile of salinity and temperature from the GLORYS12V1 product from 1993 to 2020, which corresponds to the gravity wave speed (eigenvalue) in Fig. 1.
Equatorial waves are subject to linear shallow water equation (Matsuno, 1966), which are mainly forced by atmospheric forcing and some baroclinic instability. Due to the resonance mechanism, we can expect that waves will be more easily generated by forcing with the period that is close to the basin-mode period (defined as 4 times the period it takes for KWs to travel through the whole equatorial basin) (Cane and Moore, 1981; Brandt et al., 2016). Here we will focus on the first four gravest baroclinic modes, whose basin-mode periods (based on the average gravity wave speed) are no longer than 1.5 years, to analyse the wave-induced anomaly in the event year 2019. It should be pointed out here that, as waves in each baroclinic mode are already decoupled by Eq. (4), the selection of modes for the decomposition will not affect the decomposition result.
3.1 Wave-induced variability
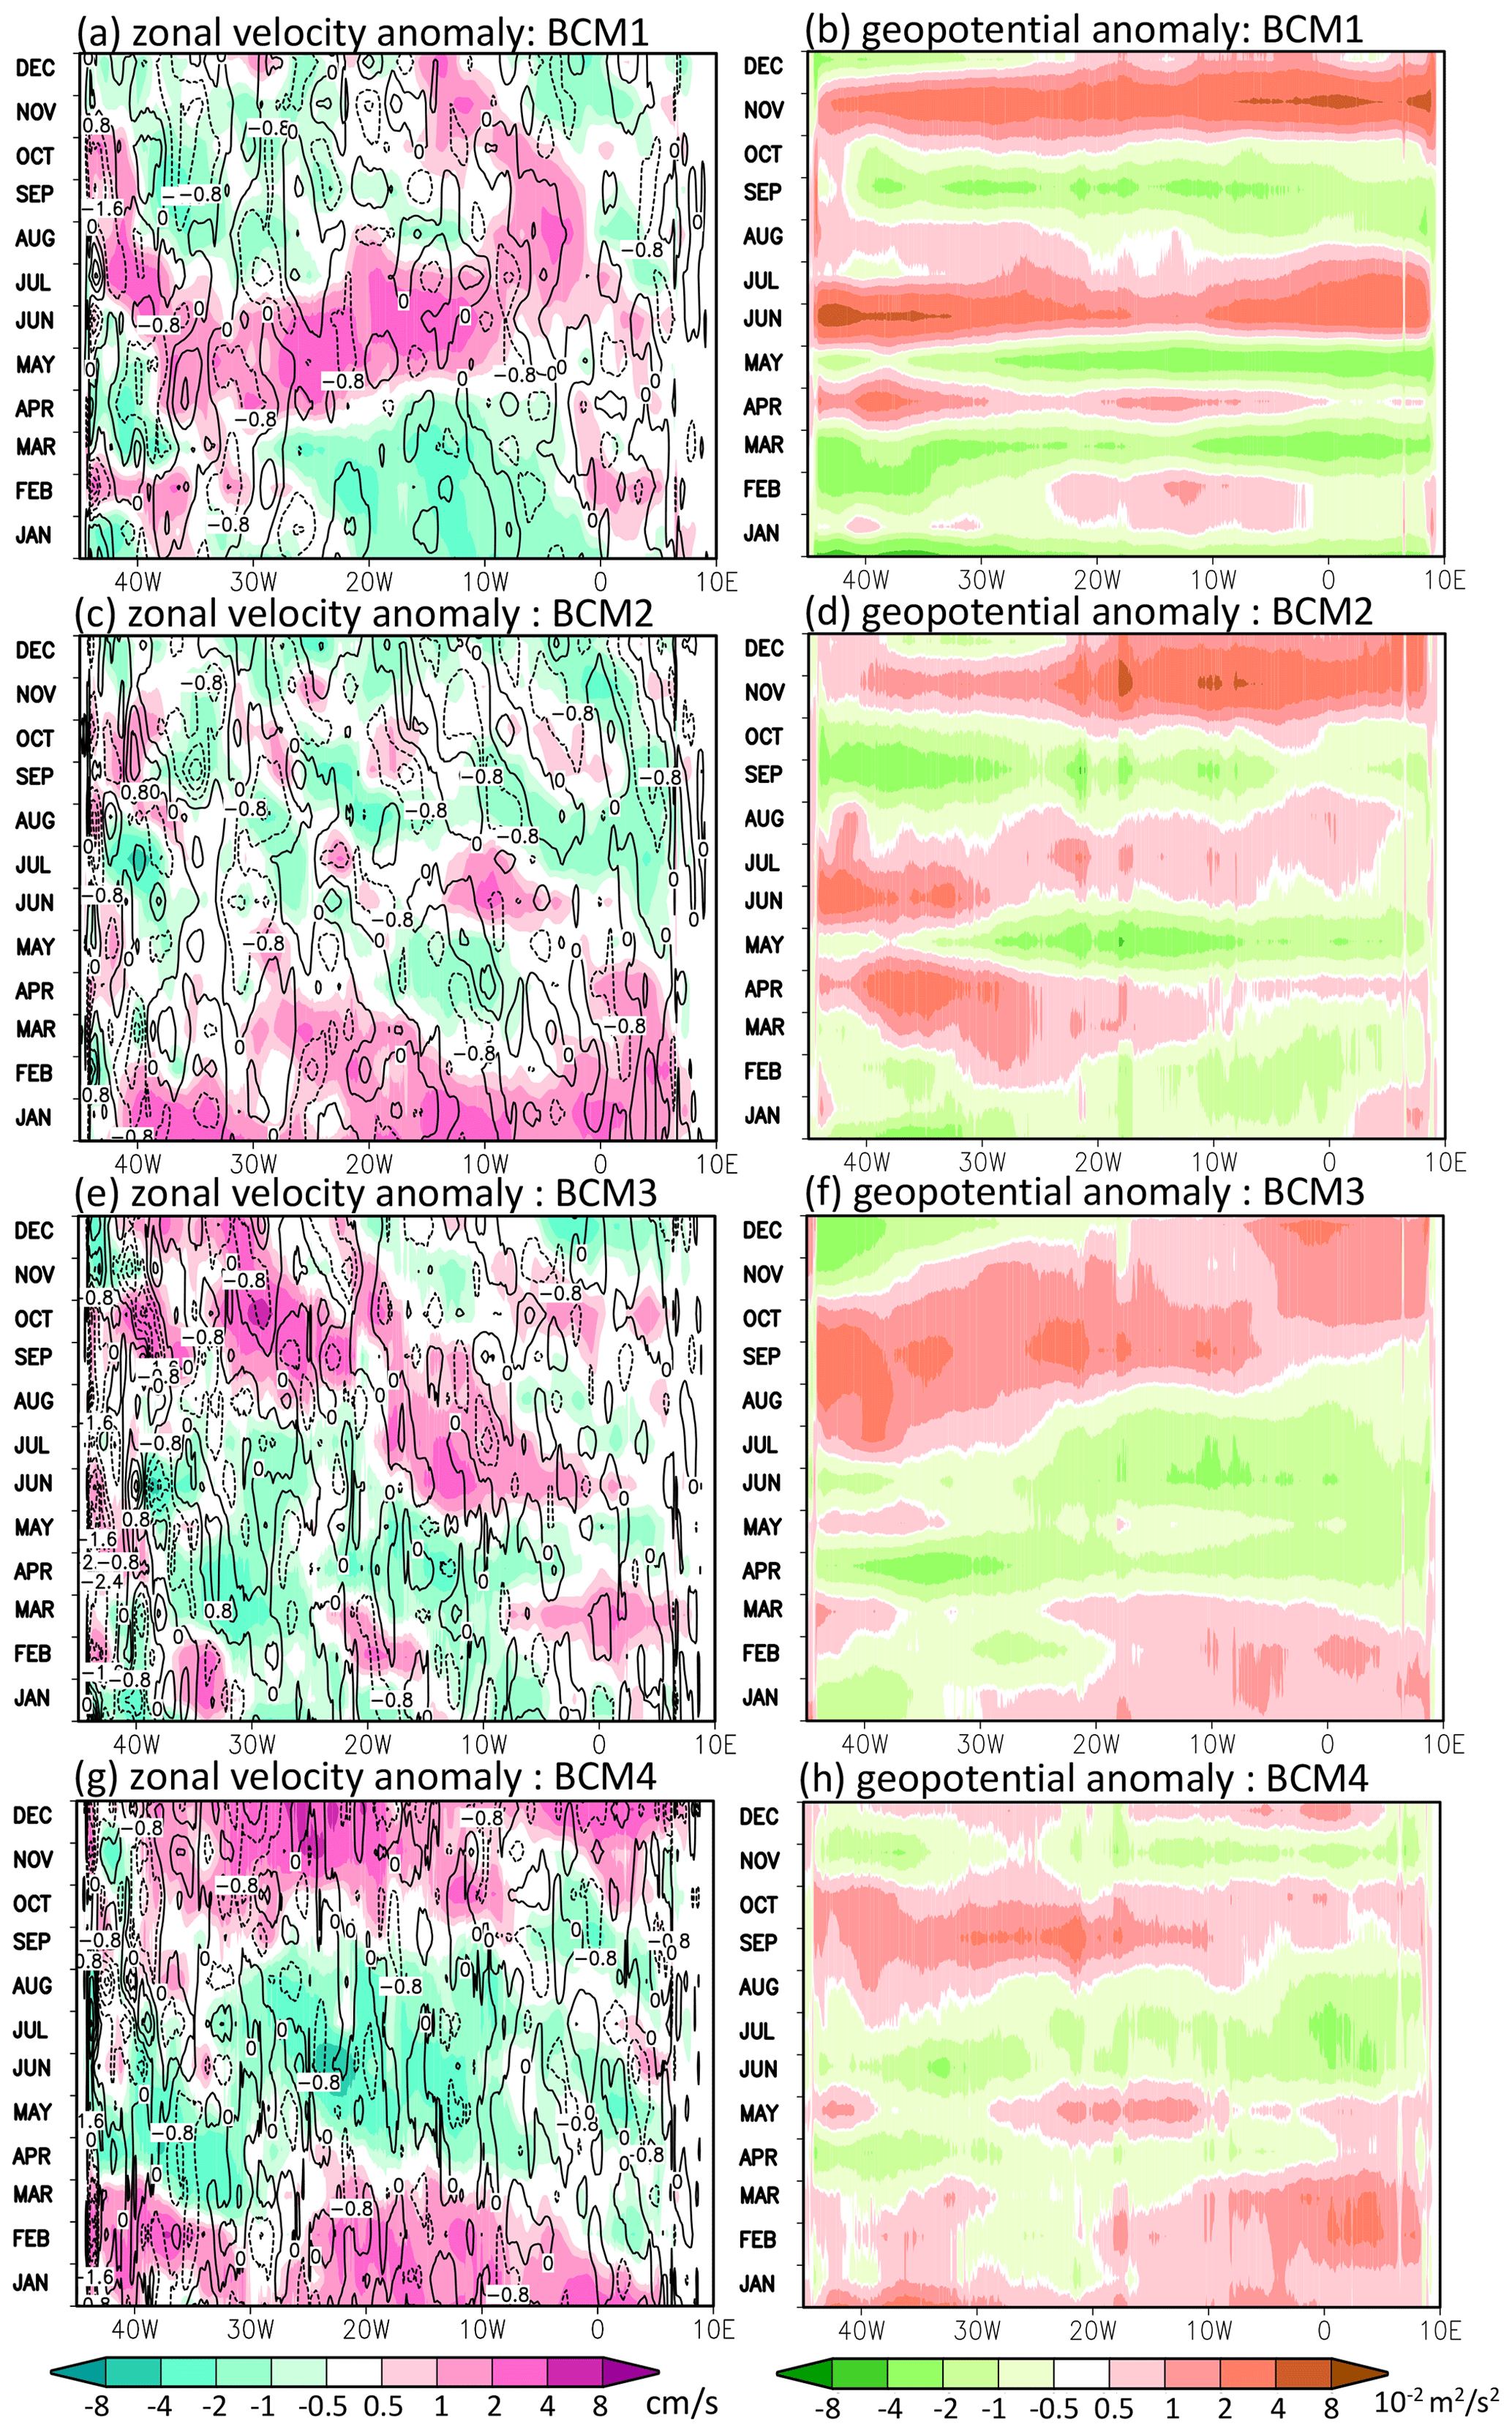
The extracted wave signal from the climatological data agrees well with previous results from linear models that are driven by climatological forcing (Song and Aiki, 2020). The obtained variability in u(n) and p(n) at the Equator is revealed largely in annual and semi-annual periods (see Fig. 3). In the western basin, annual signals of both zonal velocity and geopotential are notable for the four modes. Positive zonal velocity anomalies appear in boreal spring and change to negative in the autumn; correspondingly geopotential anomalies vary from negative to positive. However, from around 15∘ W, the signals become nearly semi-annual (see Fig. 3). In the central and eastern basin, for the second and third mode, the zonal velocity anomaly changes to negative from the summer rather than the autumn and back to positive in the winter (see Fig. 3c and e); the geopotential anomaly appears to be positive in the spring and then oscillates in a period of around 0.7 years (see Fig. 3d and f). The disagreement between the western and eastern basin should be owing to the mixture of two waveguides: one originating from the central basin in May and the other from the western basin in September (Song and Aiki, 2020; Ding et al., 2009). The magnitude of wave signals in each mode is also significantly influenced by the basin-mode period. Specifically, the annual or semi-annual variability in both geopotential and zonal velocity becomes stronger when the period calculated by the averaged wave speed is closer to 1 or 0.5 years (Song and Aiki, 2020; Claus et al., 2016). Thus the zonal velocity and geopotential anomalies in the second, third and fourth mode are all found prominently in Fig. 3. However, the first-mode geopotential anomaly is unexpectedly prominent (Fig. 3b), which should be owing to the presence of thermally induced seasonal variability in sea temperature and salinity.
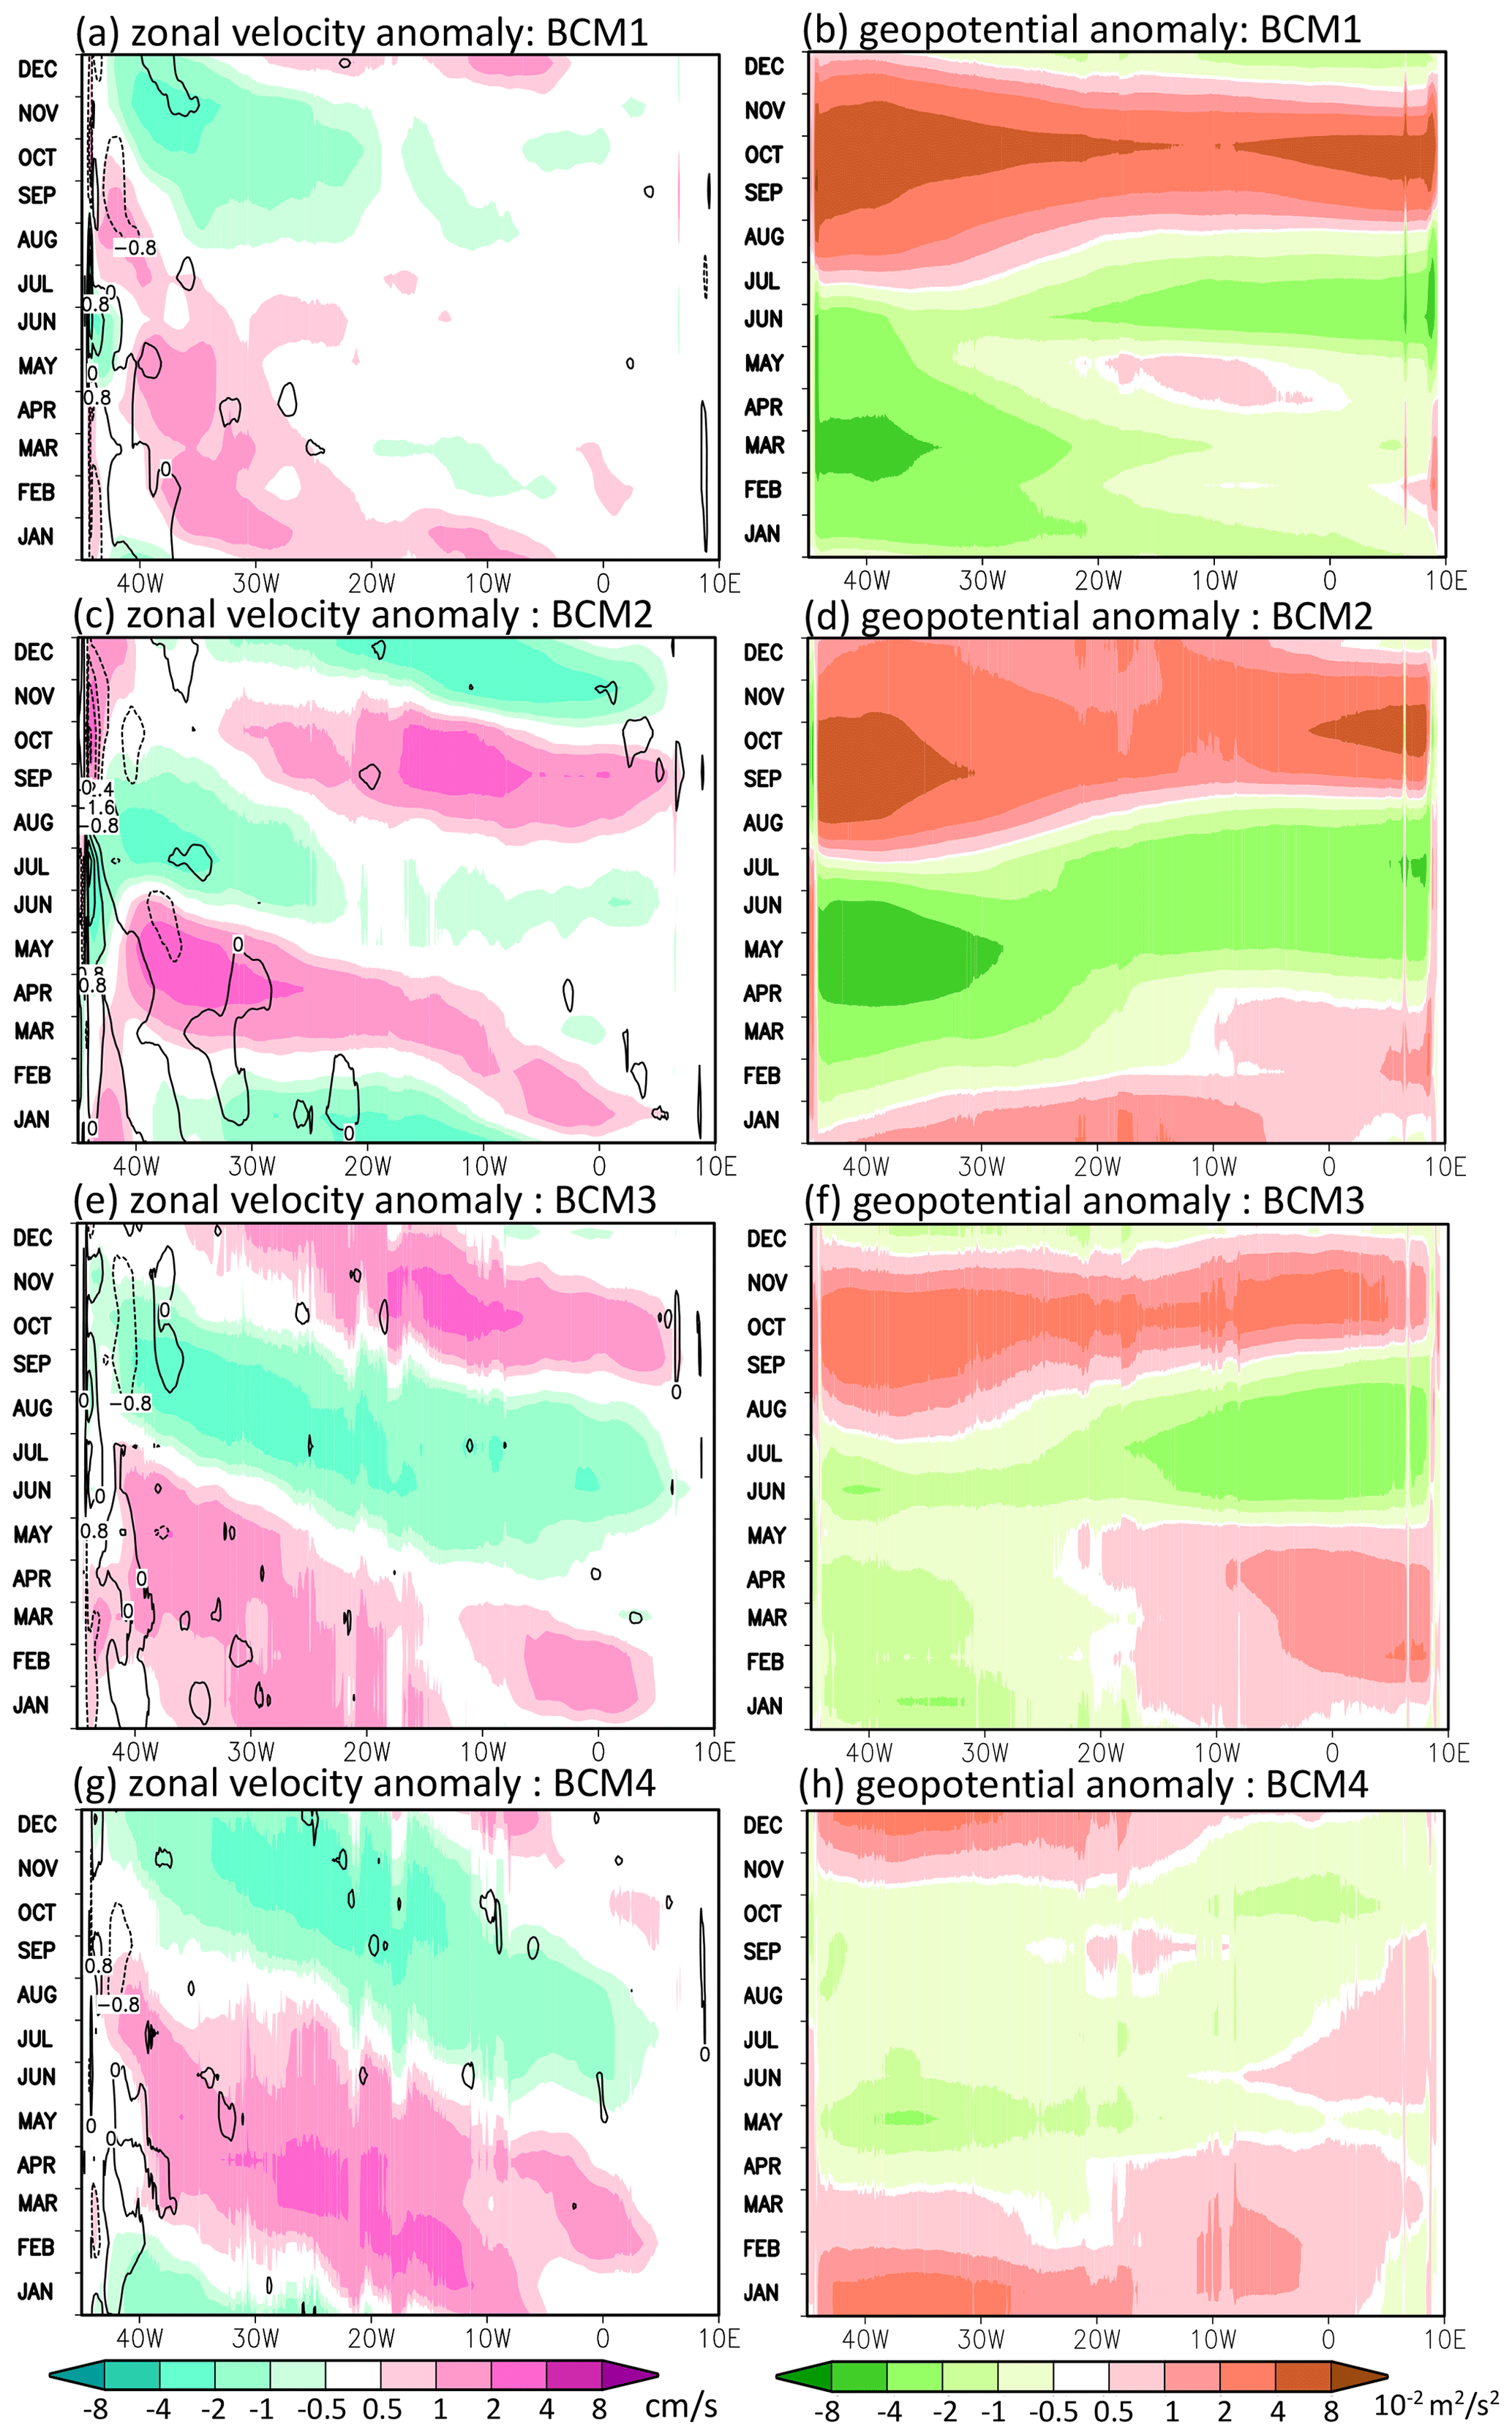
Figure 3Hovmöller diagram for the climatology of velocity (a, c, e, g) and geopotential (b, d, f, h) at the Equator decomposed from the daily GLORYS12V1 product in the first (a, b), second (c, d), third (e, f) and fourth (g, h) baroclinic mode (BCM). Colour shading in the left panels is zonal velocity u(n); contours in the left panels are meridional velocity v(n) with the interval of 0.8 cm s−1. Colour shading in the right panels is geopotential p(n).
We further investigate the wave-induced anomaly in 2019 to determine the wave signal and its propagation during the event. Figure 4 confirms that, after removing the climatological values, the decomposed geopotential anomalies for the first four modes are able to reproduce the thermocline deepening for the 2019 winter event, which is around 1 month ahead of the SST rising. The extracted waves in 2019 have demonstrated prominent variability in meridional velocity in all the presented modes with sign-alternating distributions along the Equator (see Fig. 5). This may suggest that mixed RWs featured by the cross-equatorial meridional velocity are excited by subseasonal forcing. The subseasonal forcing can also excite KWs or gravity waves to enhance the variability in zonal velocity, especially in the first mode due to its faster gravity wave speed (see Fig. 5a). As a result, the travelling signals of zonal velocity (see Fig. 5) are prominent in all four modes but the second and the fourth modes do not have propagation patterns that are as notable as the climatological scenario. Correspondingly, Fig. 5b, d, f and h suggest that from the autumn of 2019, there are positive geopotential anomalies in all four modes that jointly cause the deepening of the thermocline. Those facts may indicate the additional KW trains induced by the subseasonal forcing that causes the negative displacement of thermocline, thereby triggering the Atlantic Niño in 2019.
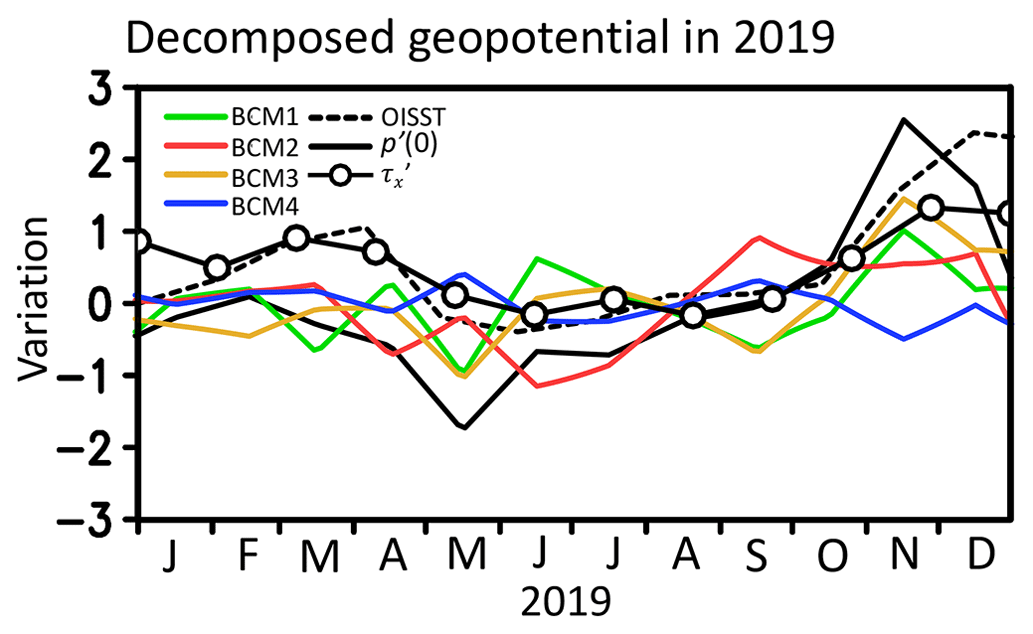
Figure 4Time series of the geopotential anomaly at the sea surface p′(0) (solid black line), SST anomaly (dashed black line) from OISST (Optimum Interpolation Sea Surface Temperature) dataset; zonal wind stress anomaly (circle-marked line) from the ERA5 (European Centre for Medium-Range Weather Forecasts Reanalysis v5) dataset; and the decomposed geopotential for the first (BCM1, solid green line), second (BCM2, solid red line), third (BCM3, solid yellow line) and fourth (BCM4, solid blue line) baroclinic mode in 2019. p′(0) is calculated following Eq. (4) with the decomposed geopotential p(n)ψ(n)(0). The anomalies of SST and geopotential are averaged over the Atlantic-3 region (ATL3; 3∘ S–3∘ N, 20∘ W–0∘); the wind stress anomaly is averaged over the western Atlantic basin (3∘ S–3∘ N, 40∘ W–20∘). The anomalies are normalized by the variance of SST, zonal wind stress and p′(0) from 1992 to 2019 respectively.
3.2 Horizontal wave energy flux
As the group velocity can be used to identify KWs and RWs, we first investigate the horizontal distribution of the annual mean zonal wave flux (Figs. 6 and 7), which can effectively indicate the dominant location and type of waves in each baroclinic mode. In the climatological scenario (Fig. 6), the AGC level-2 scheme manifests clear equatorial KW trains that originated from the western Atlantic basin, transporting the energy to the eastern boundary where it excites the reflected RWs that bring the energy back to the west. With the decrease in Rossby deformation radius, wave energy in high baroclinic modes tends to be limited to a narrow latitudinal range. Thus we found a broader latitude coverage of westward energy flux in lower modes, which may suggest the possible off-equatorial RWs (e.g. the westward energy flux within 15∘ in the north for the first mode and within 10∘ for the second mode). There is eastward energy flux that originates from the western boundary almost passing through the whole basin in the first mode (see Fig. 6a). This eastward energy flux in the eastern basin and its connection with the flux along the western boundary have not been seen in the research by Song and Aiki (2020) with linear ocean models. From Fig. 6a, the flux is likely due to the along-shore waves off the western boundary that bring the energy to the equatorial Atlantic from the extra-tropical region. Indeed, the planetary basin mode leads to the wave cycle that the coastally trapped KWs from high latitudes will travel back to the equatorial region (Yang and Liu, 2003). Nevertheless this coastally trapped KWs along the western boundary can not be well reproduced in linear models because they usually apply radiant boundaries in both the north and the south rather than using enclosed basins as the real Atlantic Ocean (Matsuno, 1966; Song and Aiki, 2020). In the event year 2019, the annual mean wave flux for the subseasonal waves at the Equator to transport the energy eastward is also prominent. In the second and third baroclinic modes, both the westward wave flux in the off-equatorial region and the eastward wave flux in the western basin exhibit greater strength than the climatological values in Fig. 6. This result may suggest that the onset of the Atlantic Niño is associated with strong downwelling KWs induced by both subseasonal local forcing and off-equatorial energy.
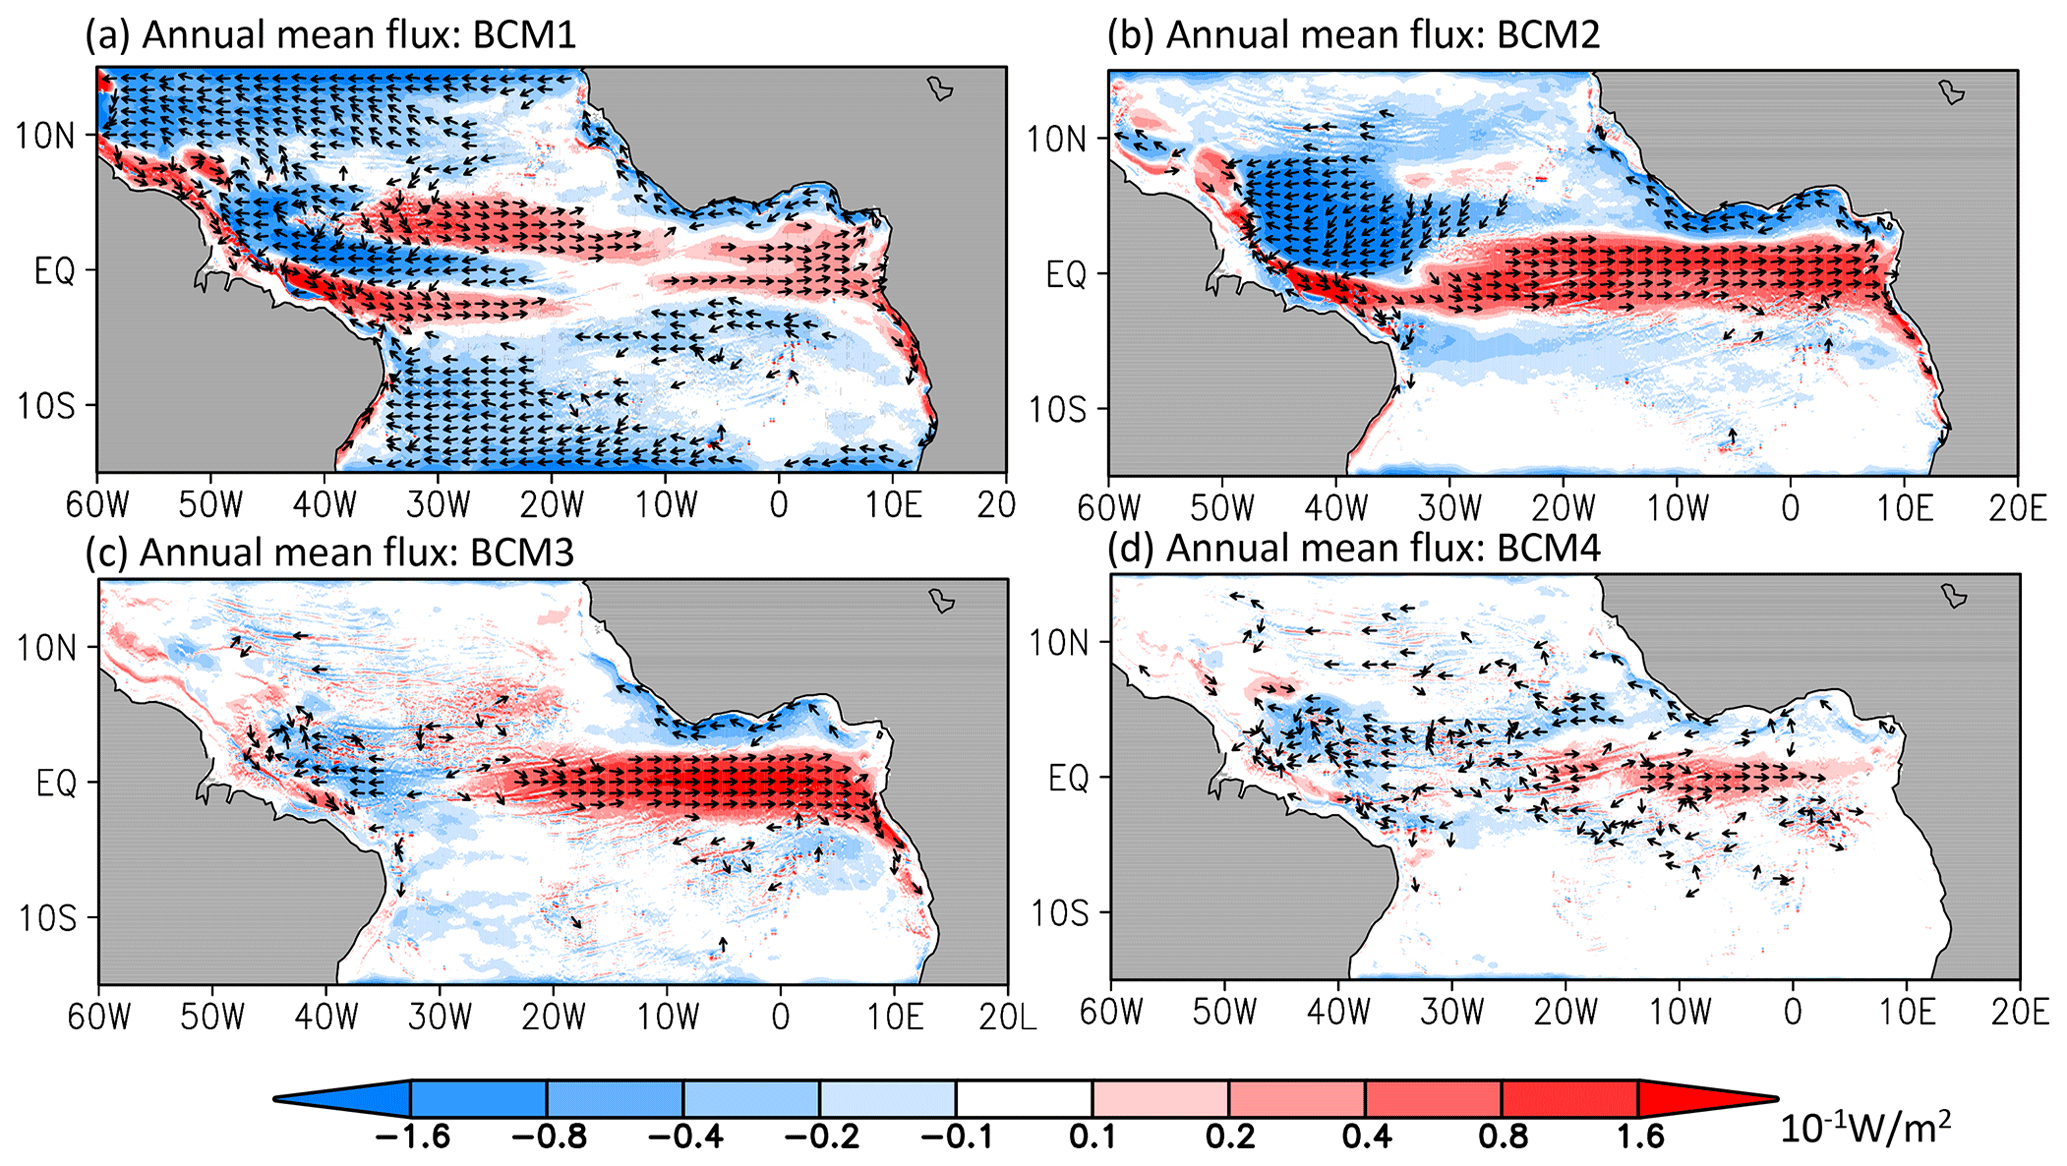
Figure 6Annual mean climatological AGC flux for the (a) first, (b) second, (c) third and (d) fourth baroclinic mode (BCM). Colour shading is the zonal component of the AGC flux; arrows with a constant length indicate directions of flux vectors.
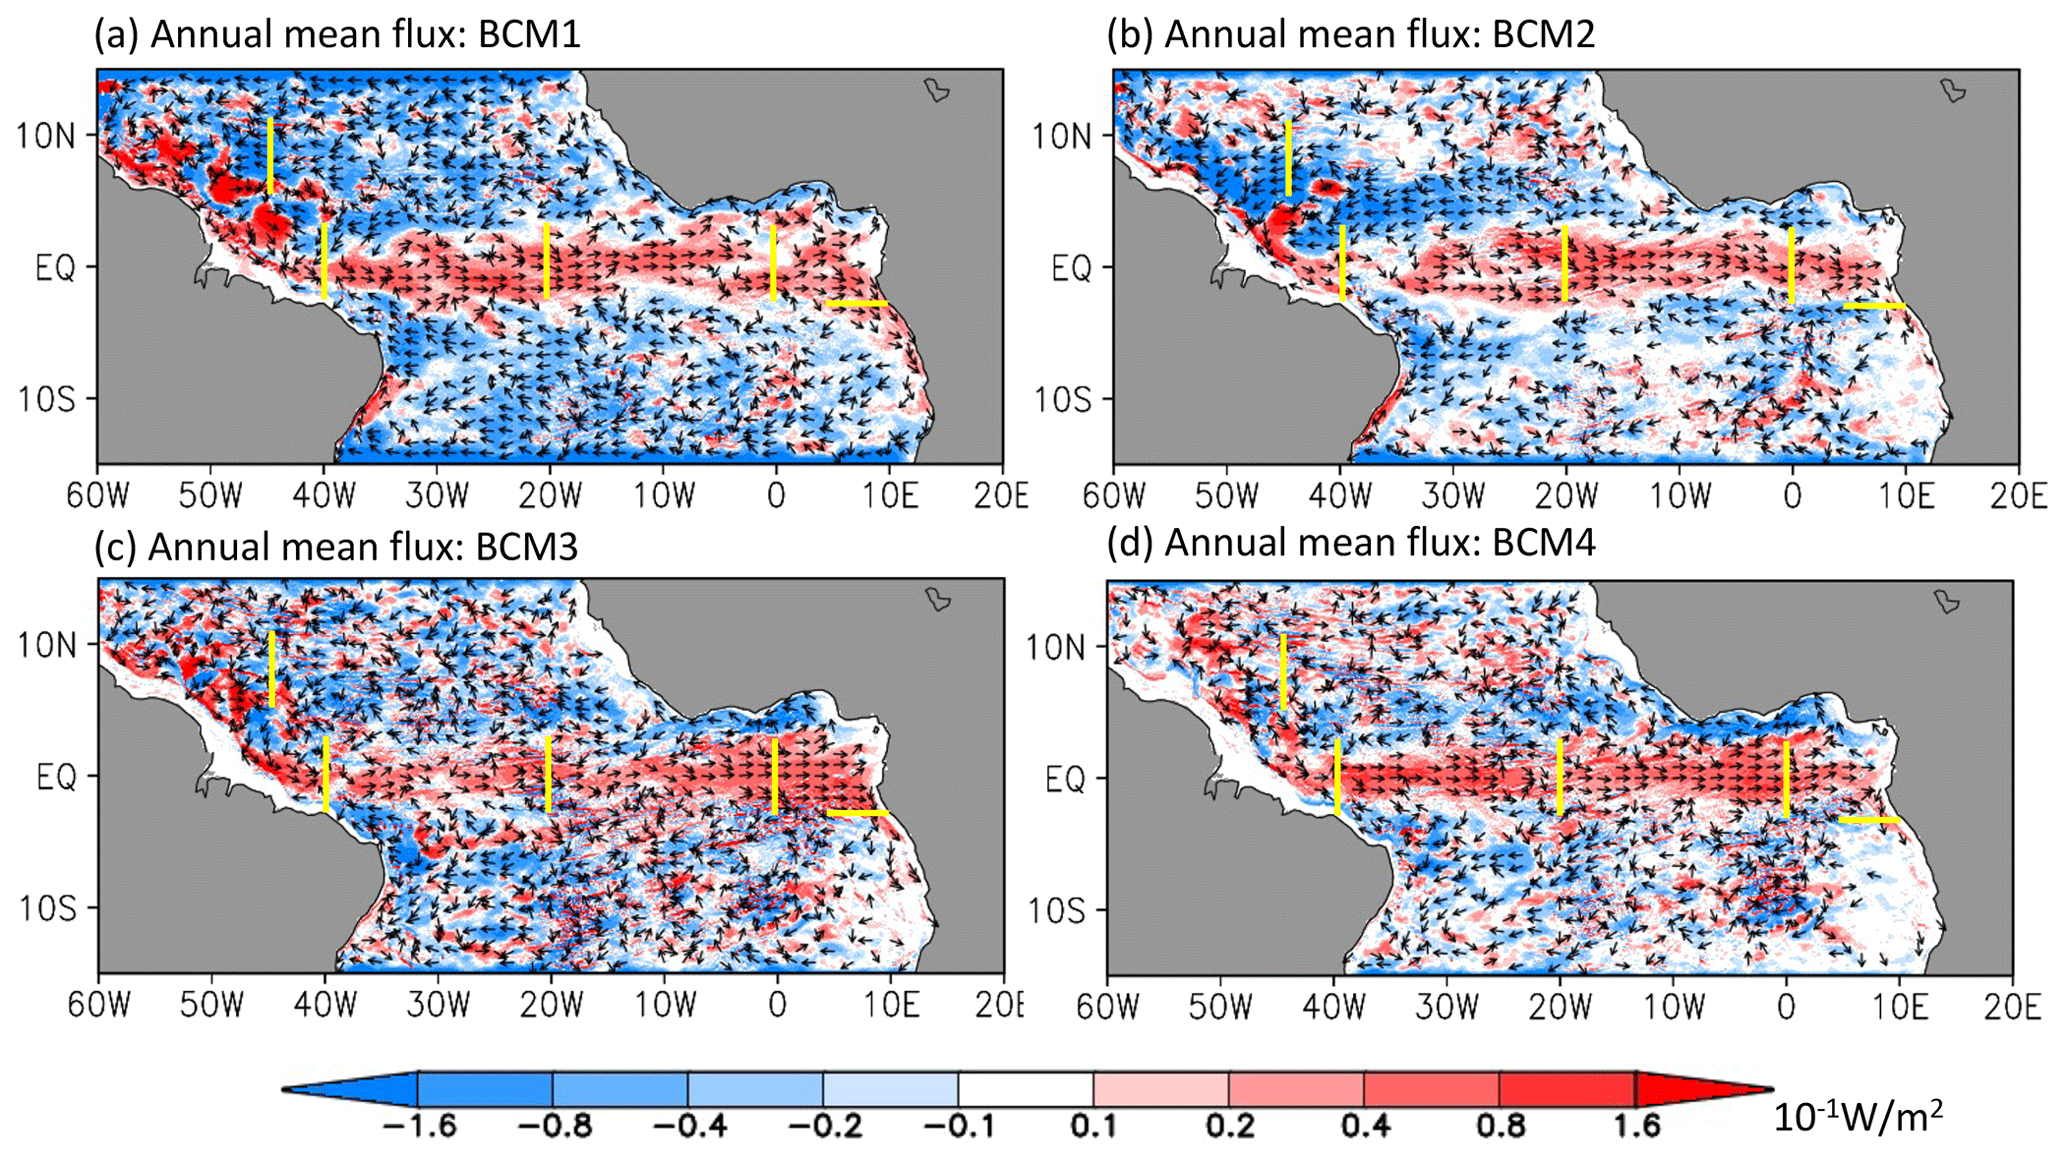
Figure 7Same as Fig. 6 but for the anomaly in 2019. Solid yellow lines indicate four meridional transects and one zonal transect: S1 (4–10∘ N, 45∘ W), S2 (3∘ S–3∘ N, 40∘ W), S3 (3∘ S–3∘ N, 20∘ W,), S4 (3∘ S–3∘ N, 0∘) and S5 (3∘ S, 5–10∘ E).
We then investigate the evolution of wave energy flux at the Equator in 2019. In Fig. 8, by comparing the theoretical group velocity of KWs and RWs (solid red and blue) in corresponding modes, subseasonal waveguides can be detected. There are multiple KW trains passing through the basin in 2019. For all four modes, strong KWs are excited in spring (from around April) and autumn (from around September), transferring the energy for several months. Most of those KWs originate from the western basin, but some of them are notably strengthened in the central and eastern basin (e.g. in around December for the first mode as in Fig. 8a and for the third mode as in Fig. 8c). However, KW trains do not guarantee the deepening of the thermocline; the superposition of out-of-phase geopotential by waves in multiple modes may eliminate the displacement (Song et al., 2023a). In the autumn and winter, we do find the positive geopotential anomaly (representing the deepening of the thermocline to induce the positive SST anomaly) in the first three modes (see Fig. 5). In the spring and summer, nevertheless, the second and fourth modes are dominated by the negative geopotential anomaly, which likely eliminates the positive anomaly in the first and third modes so as to prevent the occurrence of the event in this season (see Fig. 5). Also, by comparing the zonal wind stress anomaly (contours in Fig. 8) with the waveguide, although most KWs have shown strong associations with the westerly wind anomaly, there are still several mismatches between the local wind and the KWs. For example, when the summer KW train in the second mode is excited, the western equatorial Atlantic is dominated by the easterly wind anomaly. This may suggest that the KWs in the four modes with different phases of the geopotential anomaly are not all excited by the local wind. Other energy sources should be taken into account; e.g. the westward energy flux in Fig. 7 indicates the possibility of reflected KWs being excited by RWs. Multiple energy sources may cause the diversity of the geopotential phase. However, in Fig. 8, the RW waveguide is difficult to identify. Low-frequency RWs (normally annual or interannual) are likely to be obscured by subseasonal KW trains, since the local wave energy flux is calculated by combining the passing waves. Indeed, in the climatological scenario, RW trains are also prominent and can be easily detected (not shown).
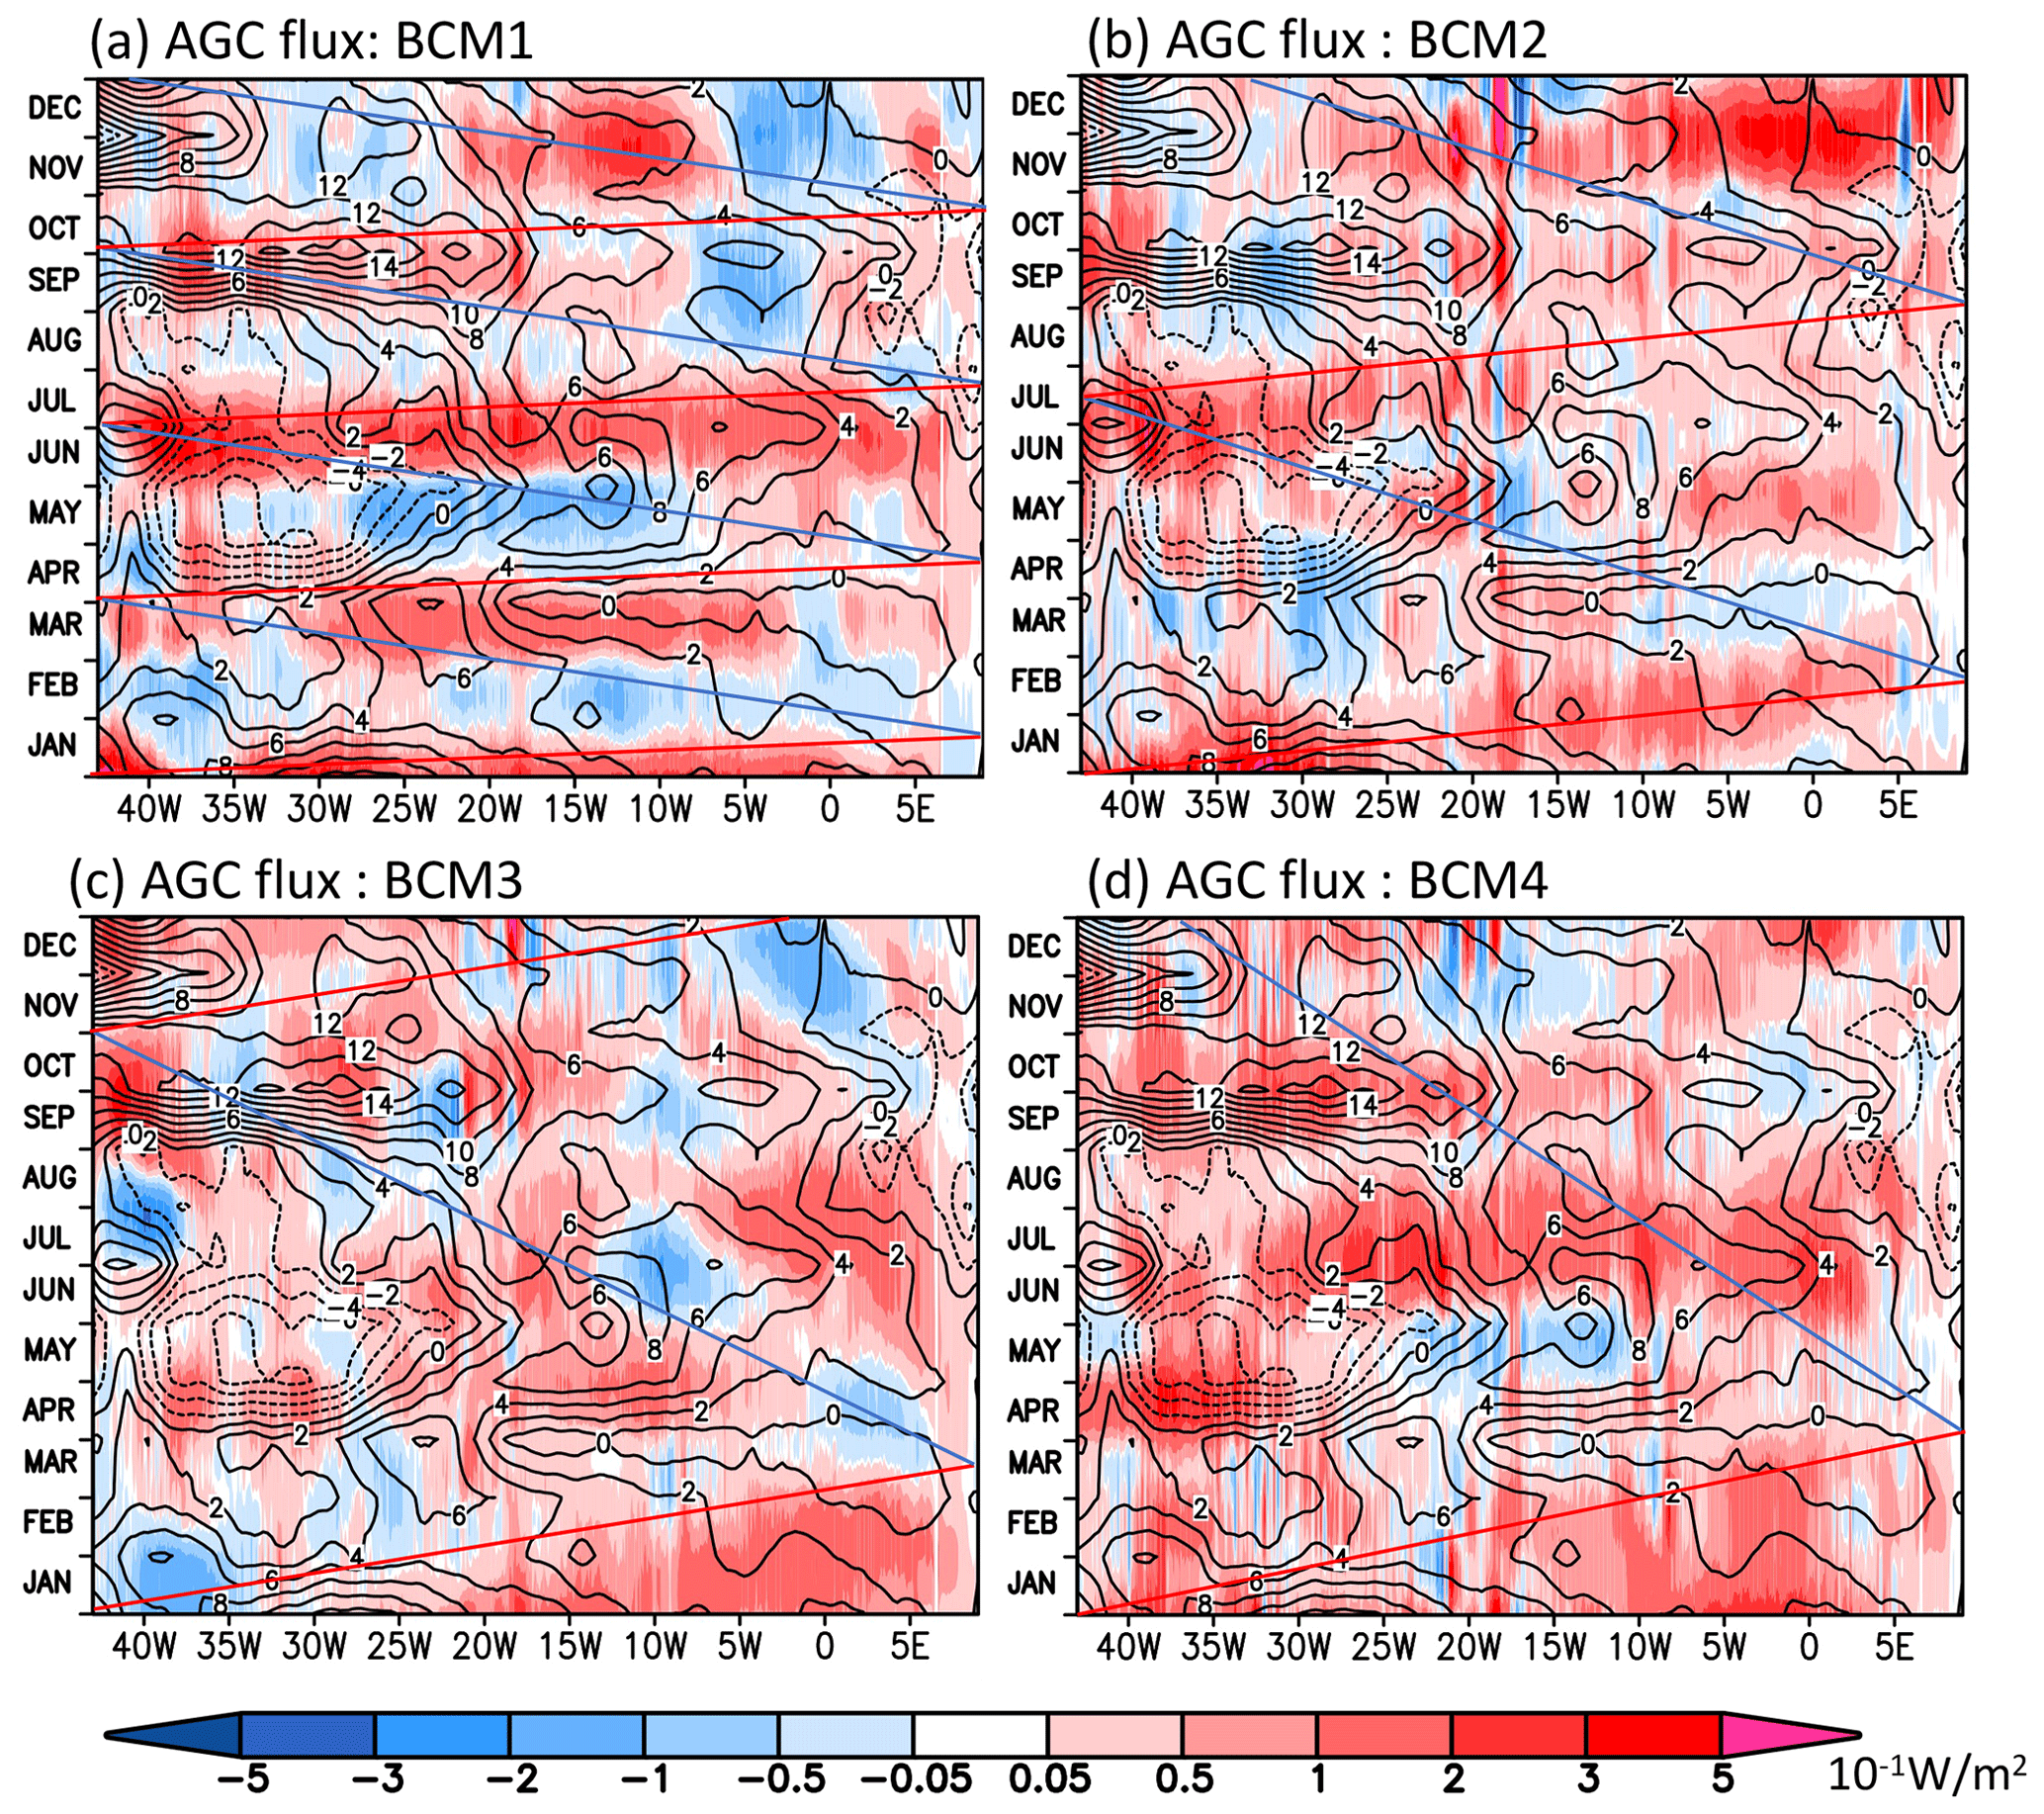
Figure 8Hovmöller diagram for the AGC flux in 2019 at the Equator in the (a) first, (b) second, (c) third and (d) fourth baroclinic mode (BCM). Colour shading is the zonal AGC flux at the Equator; contours are the anomaly of zonal wind stress with the interval of N m−2. The solid red (blue) line represents averaged group velocity for the KWs (RWs) of around 2.9 m s−1 (1.0 m s−1) in BCM1, of around 1.4 m s−1 (0.5 m s−1) in BCM2, of around 0.9 m s−1 (0.3 m s−1) in BCM3 and of around 0.7 m s−1 (0.2 m s−1) in BCM4 at the Equator (see Fig. 8).
3.3 Wave energy transfer process
In this section, we integrate the energy flux over several transects to further investigate the wave energy transfer process in 2019. As shown by the solid yellow lines in Fig. 7, we have selected three sections (S2–S4) in the equatorial region with the length of 6∘ (3∘ S–3∘ N) to match the recognized boundary of the western Atlantic basin (40–20∘ W) and ATL3 (20∘ W–0∘), an off-equatorial section (S1) ( 4–10∘ N, 45∘ W) to capture the westward energy flux (see Fig. 7) that may approach the western boundary and transfer energy back to the equatorial region, and a meridional section (S5) to check the down-wave influence on the region off the African coastline (see Fig. 7).
The variances of the wave energy flux passing through the four selected transects in 2019 are presented in Fig. 9. Although the prominence of the eastward wave energy flux has been illustrated in all four baroclinic modes at the onset stage of the SST event from around October (see Fig. 9), it is noteworthy that there is diversity among modes in transects with the largest passing energy flux. The third and fourth modes are both found to have the largest eastward energy flux to pass S4, but the energy fluxes passing S1, S2 and S3 are all weak. This may suggest that the waves in the two modes are locally forced in the ATL3 region. The energy source is located between S3 and S4 to excite the KWs transferring the energy east through S4 (see solid red line in Fig. 9c and d). Meanwhile, it may also excite RWs transferring the energy west through S3 (see solid blue line in Fig. 9c). Correspondingly, the eastward energy flux passing S3 for both the first and the second modes is found to be strong, which shows that KWs are forced to the west of ATL3. Moreover, in the second mode, the eastward energy flux peaks in around October at S2 just after strong westward energy flux passes the off-equatorial transect S1 from June to October, which may suggest a wave energy transfer route that sequentially passes S1, S2 and S3 to influence the ATL3 region. This hence illustrates the influence of the wave energy from off-equatorial regions on the Atlantic Niño in 2019 to some extent. Additionally, we have only found prominent meridional fluxes in the first and third modes to pass S5. The peaks of meridional fluxes passing S5 occur almost simultaneously with the peaks of zonal fluxes passing S4, suggesting that the possible energy transferring from the equatorial region to the coastal region may mainly originate from the wind forcing in the eastern basin. Hence on the one hand, the wave exciting the coastally trapped KWs is not remotely forced; on the other hand, the third-mode wave that carries the highest energy to the coastal region (Fig. 9c) will dissipate rapidly when travelling off the Equator due to its short Rossby deformation radius. The results therefore provide evidence that the anomalous SST event of the Angola–Benguela area in 2019 is mainly triggered by local forcing (Koungue et al., 2021).
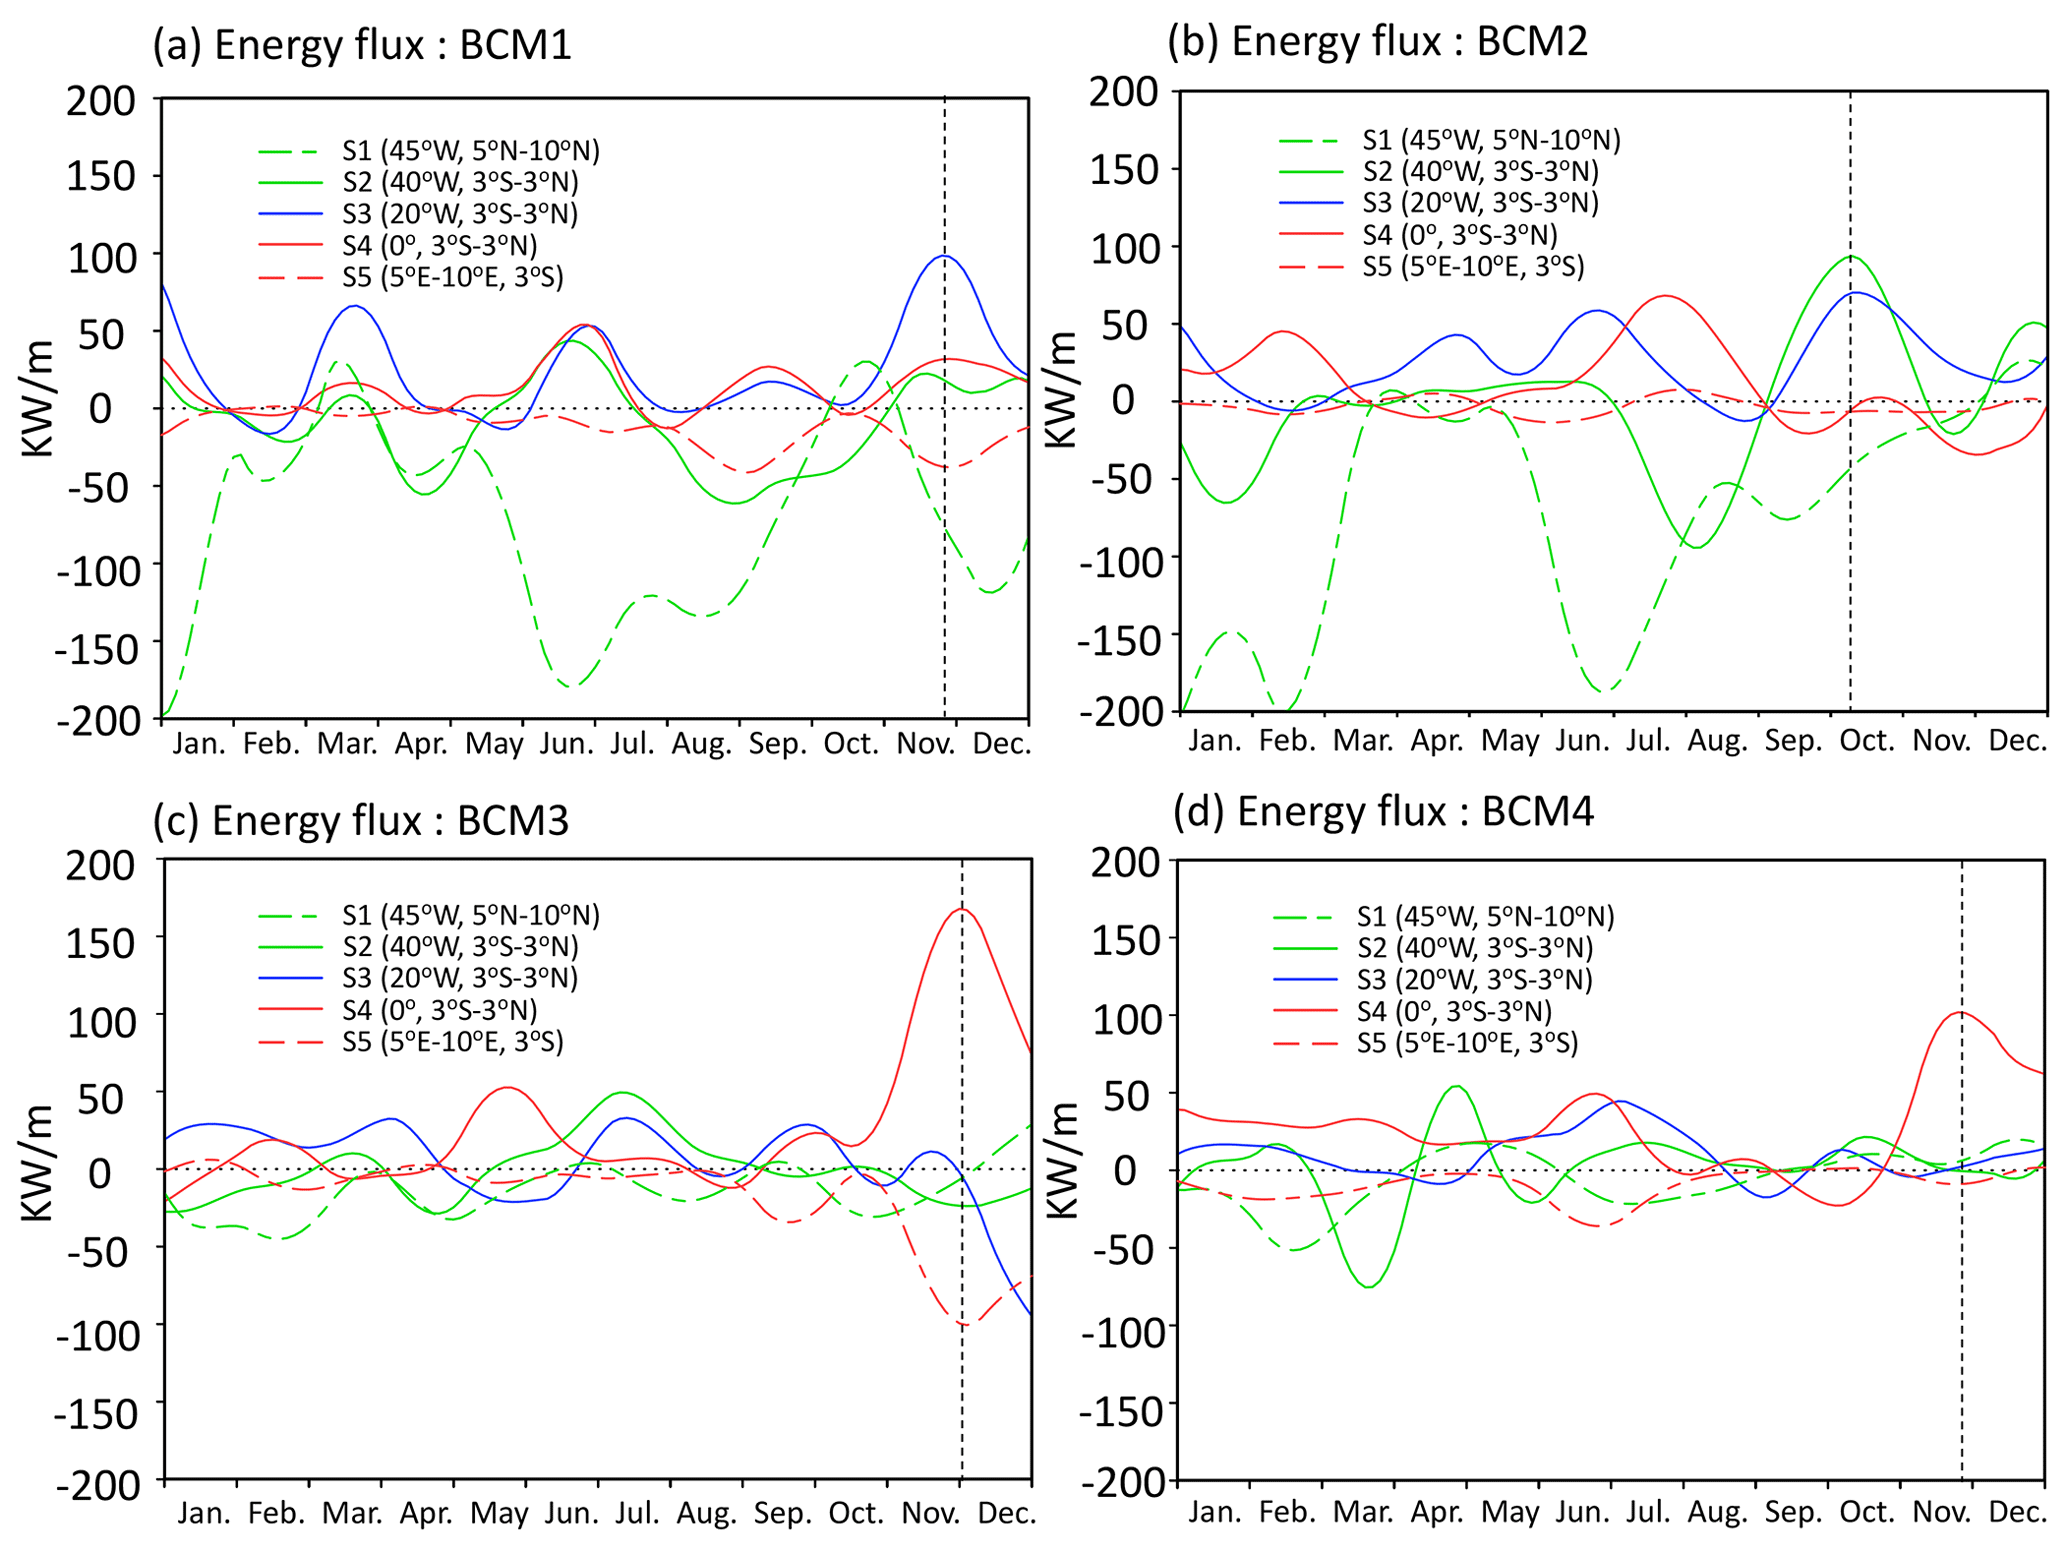
Figure 9Time series of AGC flux in 2019 for the (a) first, (b) second, (c) third and (d) fourth baroclinic mode (BCM) passing the zonal transect S1 (dashed green line), S2 (solid green line), S3 (solid blue line) and S4 (solid red line) and the meridional section S5 (dashed red line). Dashed black lines indicate the peaks of the positive flux passing the sections in 2019.
We then investigate the spatial distribution of the mean wind stress anomaly and wave energy flux in September, October and November shown in Fig. 10. The figure suggests that the peak of the westerly wind anomaly during this event season is located at around 20∘ W (see contours in Fig. 10). The waveguide is revealed to have diverse origins in each mode (see colour shading in Fig. 10). The seasonal mean wave energy fluxes in the second and third modes (Fig. 10b and c) have shown their discrepancies compared to the annual mean in Fig. 7b and c. In the second mode, the eastward energy flux originates from the western boundary, so the associated KWs may not be excited by the local wind in this season (Fig. 10b). Additionally, westward energy flux by reflected RWs is found in the eastern basin, suggesting that a strong KW is excited in summer for this mode (in agreement with Fig. 9b). For the third mode, however, it is revealed that the KW waveguide originates from the central basin (around 15∘ W, close to the wind anomaly peak) and dominates the eastern basin (Fig. 10c), which is in agreement with Fig. 9c, confirming the high association between the third-mode KWs with local forcing.
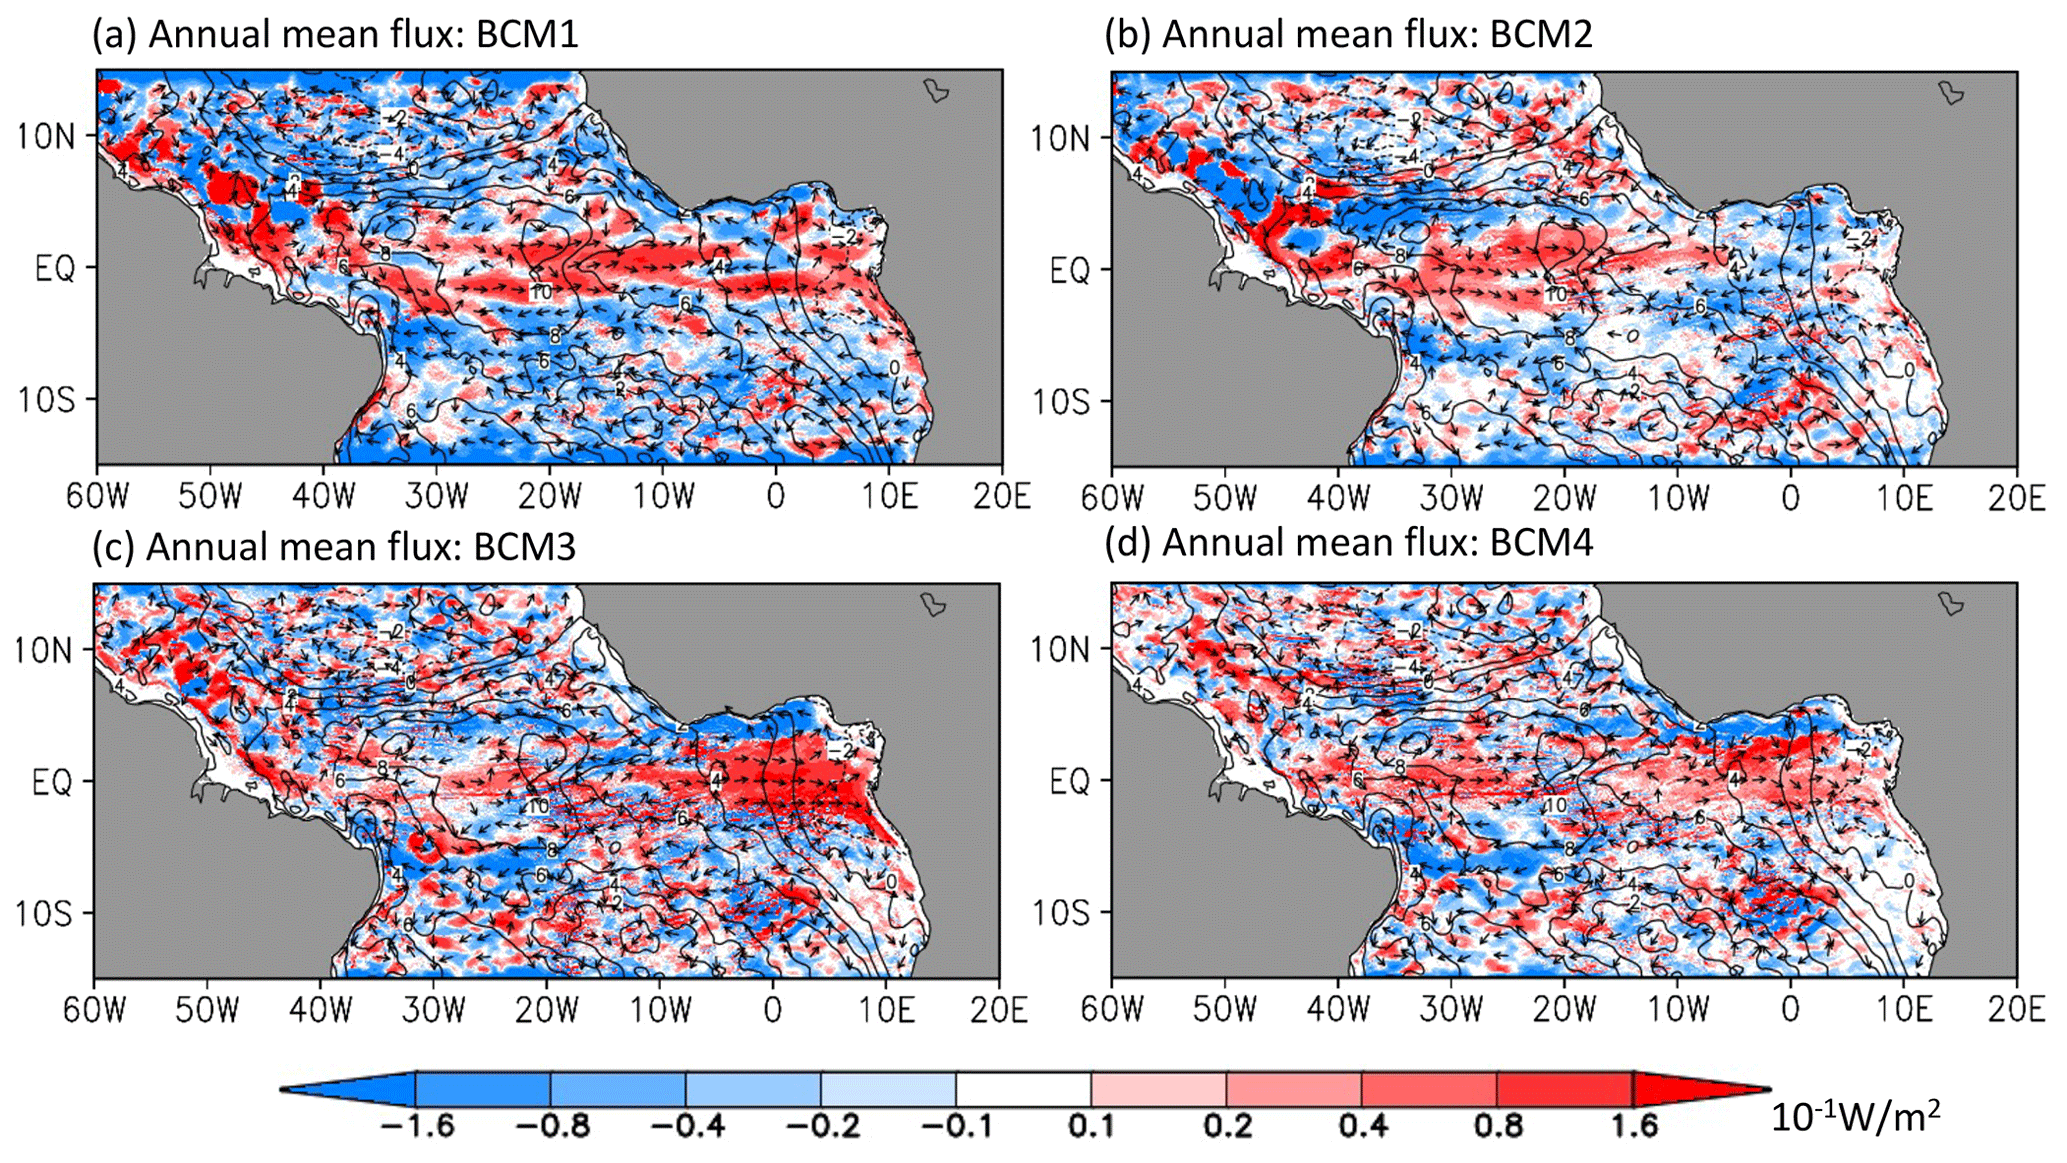
Figure 10Seasonal mean AGC flux for the (a) first, (b) second, (c) third and (d) fourth baroclinic mode (BCM) over September, October and November. Colour shading is the zonal component of the AGC flux; contours are the anomaly of zonal wind stress with the interval of N m−2 averaged over the same season; arrows with a constant length indicate the directions of the flux vector.
This study decomposed the wave signal from an ocean reanalysis dataset and further diagnosed equatorial waves in the tropical Atlantic by applying a recently developed wave energy flux scheme. The equatorial waves for both climatological values and anomalies in 2019 are detected. Strong subseasonal equatorial KW trains were revealed in 2019, which we believe were associated with the onset of the SST event. All the first four modes provide non-negligible contributions to the KW, but only the waves in the first three modes cause prominent displacement of the thermocline (see Fig. 4). The discrepancy of energy transfer processes among the modes is notable. The third and fourth modes are mainly excited locally in the ATL3 region during the event, while the wave energy of the first and second modes comes from the west, likely to be affected by RWs through reflections. The source and contribution of the second-mode wave agree with the result by Richter et al. (2022). In their analysis, the sea level anomaly (SLA) as well as the wind curl in the north tropical Atlantic has been diagnosed to reveal the propagation of RWs. Here, by wave energy flux, this study provides evidence for possible off-equatorial RWs and their influence on the Atlantic Niño event in 2019. Furthermore, in terms of wave propagation, owing to the relatively slow group velocity, the wave flux of the higher modes (the third and fourth modes) is found to peak in late November and early December, holding the SST anomaly until the next January.
The extracted equatorial waves from both the climatological and the 2019 reanalysis data are demonstrating strong westward energy flux in the off-equatorial region, especially in the first and second modes (see Figs. 9a and b and 6a and b) due to their relatively large Rossby deformation radius, which leads the wave energy to approach the western boundary for causing reflected KWs and eventually back to the equatorial region directly or along the coastline. Ray tracing by the Wentzel–Kramers–Brillouin (WKB) approximation revealed that reflected RWs will transport their energy back to the equatorial region in a beta plane (Philander, 1978; Schopf et al., 1981; Claus et al., 2014). By means of a linear ocean model with the real coastline of the Atlantic basin, it has been demonstrated that the RWs can be affected by the irregular African coastline so as to transport the energy back to the eastern Atlantic basin. However those models often missed the along-shore energy fluxes off the western boundary that also goes back to the equatorial region (Kopte et al., 2017; Song and Aiki, 2020; Kopte et al., 2018). Although previous research based on reanalysis datasets or ocean general circulation models (OGCMs) can find general links between off-equatorial RWs and equatorial KWs by the propagation of the SLA or the advection of SST (Richter et al., 2022; Foltz and McPhaden, 2010), still no concrete evidence has been found for the baroclinic waves and their connections. This study, nevertheless, diagnosed the wave energy transfer route with reanalysis data so as to avoid the information loss with simple linear models and to illustrate the wave energy transfer process in each baroclinic mode between the equatorial and off-equatorial regions.
In the proposal to use wave propagation to predict anomalous SST events in the equatorial Atlantic or the down-wave African coastal regions (Imbol Koungue et al., 2017, 2019; Koungue et al., 2021; Bachèlery et al., 2020), the diagnosis of equatorial waves in each mode is definitely an essential technique. However, the SLA might be the only accessible observation with broad coverage for detecting wave signals, and it is unable to illustrate the wave propagation in multiple vertical modes. The implementation of ocean linear models and the AGC wave energy flux scheme can yield group-velocity-based waveguides in each mode separately and better illustrate the dynamic feature of waves (Song and Aiki, 2020, 2021; Song et al., 2023a), but its deficiency is also obvious: only constant wave speed is allowed in the linear ocean model and the results crucially depend on the projection of the wind anomaly onto the corresponding mode (Claus et al., 2014; Brandt et al., 2011). This study attempted to employ the reanalysis dataset in the AGC scheme and hence contributes to freeing the diagnosis of waveguides from ocean linear models and promotes waveguide-based warning systems for Niño events. Still the presented diagnosis scheme has drawbacks in its utilization of assumed orthogonality for linear waves in cases where nonlinearity is relatively important. As a result, the decomposed variability can not correctly represent the contributions of each baroclinic mode. Indeed other attempts to decompose wave-induced variability, e.g. by projecting the velocity and geopotential to eigenfunctions by means of the least-squares method applied by Tuchen et al. (2018), may also have similar problems. Nevertheless, it is expected that the error due to nonlinearity should be controllable in the linear-dominated equatorial basins. Certainly, the reliability of the reanalysis dataset also limits the scheme usage. For instance, Tuchen et al. (2022) presented a multidecadal intensification in intraseasonal variability in velocity that is underestimated by altimetry data in the equatorial Atlantic. This underestimation may increase the unreliability of using reanalysis data to extract correct wave signals, as most reanalysis datasets rely on correction by those satellite observations. However, as equatorial waves have been revealed to have potential in the prediction of Atlantic Niño events as well as of Benguela Niño events in the down-wave region (Imbol Koungue et al., 2017; Bachèlery et al., 2020; Richter et al., 2022; Song et al., 2023b), we expect that rapid wave diagnosis using reanalysis data can provide a useful tool in the associated community.
The temperature, salinity and velocity data of the GLORYS12V1 product (E.U. Copernicus Marine Service Information, 2023) are from https://data.marine.copernicus.eu/product/GLOBAL_MULTIYEAR_PHY_001_030/services. The OISST data (Richard et al., 2008) used to validate the model are available via http://apdrc.soest.hawaii.edu:80/dods/public_data/NOAA_SST/OISST/monthly. The wind data of ERA5 (Copernicus Climate Change Service, 2023) can be accessed via http://apdrc.soest.hawaii.edu:80/dods/public_data/Reanalysis_Data/ERA5/monthly_2d/Surface.
QS and HA conceived the study. QS processed the reanalysis data and performed the wave energy analysis with the scientific insight of HA. The paper was written by QS with contributions from the co-author.
The contact author has declared that neither of the authors has any competing interests.
Publisher's note: Copernicus Publications remains neutral with regard to jurisdictional claims made in the text, published maps, institutional affiliations, or any other geographical representation in this paper. While Copernicus Publications makes every effort to include appropriate place names, the final responsibility lies with the authors.
The authors gratefully acknowledge the financial support from the Young Scientists Fund of the National Natural Science Foundation of China (grant no. 42206008) and the China Postdoctoral Science Foundation (grant no. 2021M701040).
This research has been supported by the Young Scientists Fund of the National Natural Science Foundation of China (grant no. 42206008) and the China Postdoctoral Science Foundation (grant no. 2021M701040).
This paper was edited by Katsuro Katsumata and reviewed by Ingo Richter and one anonymous referee.
Aiki, H., Greatbatch, R. J., and Claus, M.: Towards a seamlessly diagnosable expression for the energy flux associated with both equatorial and mid-latitude waves, Prog. Earth Planet. Sc., 4, 11, https://doi.org/10.1186/s40645-017-0121-1, 2017. a, b, c
Bachèlery, M.-L., Illig, S., and Rouault, M.: Interannual coastal trapped waves in the Angola-Benguela upwelling system and Benguela Niño and Niña events, J. Marine Syst., 203, 103262, https://doi.org/10.1016/j.jmarsys.2019.103262, 2020. a, b
Bourlès, B., Araujo, M., McPhaden, M. J., Brandt, P., Foltz, G. R., Lumpkin, R., Giordani, H., Hernandez, F., Lefèvre, N., Nobre, P., Campos, E., Saravanan, R., Trotte-Duhà, J., Dengler, M., Hahn, J., Hummels, R., Lübbecke, J. F., Rouault, M., Cotrim, L., Sutton, A., Jochum, M., and Perez, R. C.: PIRATA: A sustained observing system for tropical Atlantic climate research and forecasting, Earth Space Sci., 6, 577–616, 2019. a
Brandt, P., Funk, A., Hormann, V., Dengler, M., Greatbatch, R. J., and Toole, J. M.: Interannual atmospheric variability forced by the deep equatorial Atlantic Ocean, Nature, 473, 497, https://doi.org/10.1038/nature10013, 2011. a
Brandt, P., Claus, M., Greatbatch, R. J., Kopte, R., Toole, J. M., Johns, W. E., and Böning, C. W.: Annual and semiannual cycle of equatorial Atlantic circulation associated with basin-mode resonance, J. Phys. Oceanogr., 46, 3011–3029, 2016. a
Cane, M. A. and Moore, D. W.: A note on low-frequency equatorial basin modes, J. Phys. Oceanogr., 11, 1578–1584, 1981. a
Carton, J. A., Cao, X., Giese, B. S., and Da Silva, A. M.: Decadal and interannual SST variability in the tropical Atlantic Ocean, J. Phys. Oceanogr., 26, 1165–1175, 1996. a
Claus, M., Greatbatch, R. J., and Brandt, P.: Influence of the barotropic mean flow on the width and the structure of the Atlantic equatorial deep jets, J. Phys. Oceanogr., 44, 2485–2497, 2014. a, b
Claus, M., Greatbatch, R. J., Brandt, P., and Toole, J. M.: Forcing of the Atlantic equatorial deep jets derived from observations, J. Phys. Oceanogr., 46, 3549–3562, 2016. a
Copernicus Climate Change Service (C3S) (2017): ERA5: Fifth generation of ECMWF atmospheric reanalyses of the global climate, Copernicus Climate Change Service Climate Data Store (CDS) [data set], http://apdrc.soest.hawaii.edu:80/dods/public_data/Reanalysis_Data/ERA5/monthly_2d/Surface (last access: 7 January 2023), 2023. a
Crespo, L. R., Prigent, A., Keenlyside, N., Koseki, S., Svendsen, L., Richter, I., and Sánchez-Gómez, E.: Weakening of the Atlantic Niño variability under global warming, Nat. Clim. Change, 12, 822–827, 2022. a, b
Ding, H., Keenlyside, N. S., and Latif, M.: Seasonal cycle in the upper equatorial Atlantic Ocean, J. Geophys. Res.-Oceans, 114, 1–16, https://doi.org/10.1029/2009JC005418, 2009. a
E.U. Copernicus Marine Service Information (CMEMS): The eddy-resolving () Global Ocean Physics Reanalysis (GLORYS12V1): GLOBAL_MULTIYEAR_PHY_001_030. Marine Data Store (MDS) [data set], https://data.marine.copernicus.eu/product/GLOBAL_MULTIYEAR_PHY_001_030/services, https://doi.org/10.48670/moi-00021, 2023 a
Foltz, G. R. and McPhaden, M. J.: Interaction between the Atlantic meridional and Niño modes, Geophys. Res. Lett., 37, https://doi.org/10.1029/2010GL044001, 2010. a, b
Foltz, G. R., Brandt, P., Richter, I., et al.: The tropical Atlantic observing system, Frontiers in Marine Science, 6, 206, https://doi.org/10.3389/fmars.2019.00206, 2019. a
Giannini, A., Saravanan, R., and Chang, P.: Oceanic forcing of Sahel rainfall on interannual to interdecadal time scales, Science, 302, 1027–1030, 2003. a
Illig, S. and Bachèlery, M.-L.: Propagation of subseasonal equatorially-forced coastal trapped waves down to the benguela upwelling system, Sci. Rep.-UK, 9, 1–10, 2019. a
Imbol Koungue, R. A., Illig, S., and Rouault, M.: Role of interannual Kelvin wave propagations in the equatorial Atlantic on the Angola Benguela Current system, J. Geophys. Res.-Oceans, 122, 4685–4703, 2017. a, b, c, d
Imbol Koungue, R. A., Rouault, M., Illig, S., Brandt, P., and Jouanno, J.: Benguela Niños and Benguela Niñas in forced ocean simulation from 1958 to 2015, J. Geophys. Res.-Oceans, 124, 5923–5951, 2019. a, b, c
Jean-Michel, L., Eric, G., Romain, B.-B., Gilles, G., Angélique, M., Marie, D., Clement, B., Mathieu, H., Olivier, L. G., Charly, R., C. Tony, Testut, C.-E., Gasparin, F., Ruggiero, G., Benkiran, M., Drillet, Y., and Le Traon, P.-Y.: The Copernicus global oceanic and sea ice GLORYS12 reanalysis, Front. Earth Sci., 9, 698876, https://doi.org/10.3389/feart.2021.698876, 2021. a, b
Kopte, R., Brandt, P., Dengler, M., Tchipalanga, P., Macuéria, M., and Ostrowski, M.: The Angola Current: Flow and hydrographic characteristics as observed at 11 S, J. Geophys. Res.-Oceans, 122, 1177–1189, 2017. a
Kopte, R., Brandt, P., Claus, M., Greatbatch, R. J., and Dengler, M.: Role of Equatorial Basin-mode resonance for the seasonal variability of the Angola current at 11 S, J. Phys. Oceanogr., 48, 261–281, 2018. a
Koungue, I., Rodrigue, A., Brandt, P., Lübbecke, J., Prigent, A., Martins, M., and Rodrigues, R. R.: The 2019 Benguela Niño, Frontiers in Marine Science, 8, https://doi.org/10.3389/fmars.2021.800103, 2021. a, b
Latif, M. and Keenlyside, N. S.: El Niño/Southern Oscillation response to global warming, P. Natl. Acad. Sci. USA, 106, 20578–20583, 2009. a
Lübbecke, J. F. and McPhaden, M. J.: On the inconsistent relationship between Pacific and Atlantic Niños, J. Climate, 25, 4294–4303, 2012. a
Marie, D., Jean-Michel, L., Charly, R., Gilles, G., Clément, B., Olga, H., and Romain, B.-B.: Quality information document for Global Ocean Reanalysis Products GLOBAL_REANALYSIS_PHY_001_030, Copernicus Marine Service Information, CMEMS-GLO-QUID-001-030, 2022. a, b
Matsuno, T.: Quasi-geostrophic motions in the equatorial area, J. Meteorol. Soc. Jpn. Ser. II, 44, 25–43, 1966. a, b
Nnamchi, H. C., Li, J., Kucharski, F., Kang, I.-S., Keenlyside, N. S., Chang, P., and Farneti, R.: Thermodynamic controls of the Atlantic Niño, Nat. Commun., 6, 1–10, 2015. a
Okumura, Y. and Xie, S.-P.: Interaction of the Atlantic equatorial cold tongue and the African monsoon, J. Climate, 17, 3589–3602, 2004. a
Philander, S.: Forced oceanic waves, Rev. Geophys., 16, 15–46, 1978. a, b
Prigent, A., Lübbecke, J. F., Bayr, T., Latif, M., and Wengel, C.: Weakened SST variability in the tropical Atlantic Ocean since 2000, Clim. Dynam., 54, 2731–2744, 2020. a
Richard, W. R., Banzon, F. V., and NOAA CDR Program: NOAA Optimum Interpolation 1/4 Degree Daily Sea Surface Temperature (OISST) Analysis, Version 2. NOAA National Centers for Environmental Information [data set], https://doi.org/10.7289/V5SQ8XB5, 2008. a
Richter, I., Tokinaga, H., and Okumura, Y. M.: The extraordinary equatorial Atlantic warming in late 2019, Geophys. Res. Lett., 49, e2021GL095918, https://doi.org/10.1029/2021GL095918, 2022. a, b, c, d
Rodríguez-Fonseca, B., Polo, I., García-Serrano, J., Losada, T., Mohino, E., Mechoso, C. R., and Kucharski, F.: Are Atlantic Niños enhancing Pacific ENSO events in recent decades?, Geophys. Res. Lett., 36, https://doi.org/10.1029/2009GL040048, 2009. a
Rossby, C.-G.: On the propagation of frequencies and energy in certain types of oceanic and atmospheric waves, J. Meteorol., 2, 187–204, 1945. a
Schiller, A., Wijffels, S., Sprintall, J., Molcard, R., and Oke, P. R.: Pathways of intraseasonal variability in the Indonesian Throughflow region, Dynam. Atmos. Oceans, 50, 174–200, 2010. a
Schopf, P. S., Anderson, D. L., and Smith, R.: Beta-dispersion of low-frequency Rossby waves, Dynam. Atmos. Oceans, 5, 187–214, 1981. a, b
Song, Q. and Aiki, H.: The Climatological Horizontal Pattern of Energy Flux in the Tropical Atlantic as Identified by a Unified Diagnosis for Rossby and Kelvin Waves, J. Geophys. Res.-Oceans, 125, e2019JC015407, https://doi.org/10.1029/2019JC015407, 2020. a, b, c, d, e, f, g, h, i
Song, Q. and Aiki, H.: Horizontal energy flux of wind-driven intraseasonal waves in the tropical Atlantic by a unified diagnosis, J. Phys. Oceanogr., 51, 3037–3050, 2021. a, b
Song, Q., Aiki, H., and Tang, Y.: The role of equatorially forced waves in triggering Benguela Niño/Niña as investigated by an energy flux diagnosis, J. Geophys. Res.-Oceans, e2022JC019272, https://doi.org/10.1029/2022JC019272, 2023a. a, b, c
Song, Q., Tang, Y., and Aiki, H.: Dual Wave Energy Sources for the Atlantic Niño Events Identified by Wave Energy Flux in Case Studies, J. Geophys. Res.-Oceans, 128, e2023JC019972, https://doi.org/10.1029/2023JC019972, 2023b. a
Tokinaga, H. and Xie, S.-P.: Weakening of the equatorial Atlantic cold tongue over the past six decades, Nat. Geosci., 4, 222–226, 2011. a
Toyoda, T., Nakano, H., Aiki, H., Ogata, T., Fukutomi, Y., Kanno, Y., Urakawa, L. S., Sakamoto, K., Yamanaka, G., and Nagura, M.: Energy flow diagnosis of ENSO from an ocean reanalysis, J. Climate, 34, 4023–4042, 2021. a
Tuchen, F. P., Brandt, P., Claus, M., and Hummels, R.: Deep intraseasonal Variability in the central equatorial Atlantic, J. Phys. Oceanogr., 48, 2851–2865, 2018. a
Tuchen, F. P., Perez, R. C., Foltz, G. R., Brandt, P., and Lumpkin, R.: Multidecadal intensification of Atlantic tropical instability waves, Geophys. Res. Lett., 49, e2022GL101073, https://doi.org/10.1029/2022GL101073, 2022. a
Yang, H. and Liu, Z.: Basin modes in a tropical–extratropical basin, J. Phys. Oceanogr., 33, 2751–2763, 2003. a