the Creative Commons Attribution 4.0 License.
the Creative Commons Attribution 4.0 License.
 | 02 May 2022
Weakening and warming of the European Slope Current since the late 1990s attributed to basin-scale density changes
Robert Marsh
James Harle
Oceanic influences on shelf seas are mediated by flow along and across continental slopes, with consequences for regional hydrography and ecosystems. Here we present evidence for the variable North Atlantic influence on European shelf seas over the last 4 decades using ocean analysis and reanalysis products, as well as an eddy-resolving ocean model hindcast. To first order, flows oriented along isobaths at the continental slope are related to the poleward increase in density in the adjacent deep ocean that supports a geostrophic inflow towards the slope. In the North Atlantic, this density gradient and associated inflow have undergone substantial, sometimes abrupt, changes in recent decades. Inflow in the range 10–15 Sv is identified with eastward transport in temperature classes at 30∘ W in the latitude range 45–60∘ N. Associated with major subpolar warming around 1997, a cool and fresh branch of the Atlantic inflow was substantially reduced, while a warm and more saline inflow branch strengthened, with respective changes of the order of 5 Sv. Total inflow fell from ∼ 15 Sv pre-1997 to ∼ 10 Sv post-1997. In the model hindcast, particle tracking is used to trace the origins of poleward flows along the continental slope to the west of Ireland and Scotland before and after 1997. Backtracking particles up to 4 years, a range of subtropical and subpolar pathways is identified from a statistical perspective. In broad terms, cold, fresh waters of subpolar provenance were replaced by warm, saline waters of subtropical provenance. These changes have major implications for the downstream shelf regions that are strongly influenced by Atlantic inflow, in particular the northern North Sea, where “subtropicalization” of ecosystems has already been observed since the late 1990s.
- Article
(8931 KB) - Full-text XML
- BibTeX
- EndNote


Over recent decades, the European shelf seas have undergone profound changes in hydrography, biogeochemistry, and ecosystems. Major ecosystem changes are most notable in the North Sea. Continuous Plankton Recorder (CPR) data indicate that North Sea ecosystems underwent a regime shift over 1982–1988 from a “cold dynamic equilibrium” of 1962–1983 to a “warm dynamic equilibrium” of 1984–1999 (Beaugrand, 2004). At species level, impacts have been profound: northward shifts in copepod populations (Beaugrand, 2004), a steady increase in squid catch since 1980 (van der Kooij et al., 2016), “subtropicalization” of pelagic fish communities (Montero-Serra et al., 2015), and evidence that cod recruitment and herring spawning stocks are highly responsive to temperature in the northern North Sea (Akimova et al., 2016).
While these poleward range shifts have been directly attributed to local warming (Beaugrand, 2004), a natural conduit for range expansion is the European Slope Current (henceforth, Slope Current), conveying warm-affinity species from equatorward latitudes to the North Sea. Furthermore, Slope Current water and flow are highly variable. Observations at the Extended Ellett Line (EEL) repeat hydrographic section off western Scotland indicate background warming and declining nutrient concentrations in upstream flows from 1996 to the mid-2000s (Johnson et al., 2013). Meanwhile, peak inflows of warm, salty Atlantic Water coincide with chlorophyll a increases, despite declines in nutrient concentration (McQuatters-Gollop et al., 2007). CPR data indicate that periodic changes in zooplankton in the North Sea are directly related to variations of Atlantic inflow (Reid et al., 2001, 2003). In conclusion, local warming alone may not explain the rapid, sometimes abrupt, and ongoing changes in community structure and ecosystem functioning in the North Sea. It is likely that the Slope Current provides the connectivity necessary for bottom-up (food supply) and/or top-down (predator) drivers of change.
Variability of the Slope Current related to ecosystem change (Reid et al., 2001, 2003) may be related to basin-scale events (Marsh et al., 2017). The North Atlantic is a highly dynamic ocean basin dominated by two gyre systems: the Subpolar Gyre (SPG) and the Subtropical Gyre (STG). The Gulf Stream flows between these two and eventually becomes the North Atlantic Current (NAC), also referred to as the North Atlantic Drift. The NAC brings warmer Atlantic waters from the subtropics across to the eastern boundary and continues northeastwards, taking a multi-route path including branches flowing through the Rockall Trough (Holliday et al., 2018). The NAC eventually flows beyond the UK and into the Norwegian Sea. Here, the water cools and sinks, forming the cold, deep return flow which completes the Atlantic Meridional Overturning Circulation (AMOC). However, not all of the water follows this pathway. Some of the NAC, which has multiple branches, is entrained into the European Slope Current, which flows around the European Shelf (Marsh et al., 2017). Flowing northward along the shelf break and through the Rockall Trough, the current at times is deflected onto the shelf (Porter et al., 2018). However, the majority continues past the north of Scotland. Some of this water follows the path of the Norwegian Current, but some follows the northeastern Scottish coastline onto the shelf and into the North Sea. Some of the Slope Current water that travels further north is eventually deflected into the northern North Sea via East Shetland Inflow and Norwegian Trench Inflow (Holliday and Reid, 2001). Previous estimates suggest that up to 40 % of Slope Current water ends up in the North Sea (Marsh et al., 2017).
Gradients of sea surface height are also a factor in toward-shelf and along-shelf transport. Empirical orthogonal function analysis of sea surface height variability across the North Atlantic subpolar gyre has previously been used as a proxy for a “subpolar gyre index” (Hátún et al., 2005; Hátún and Chafik, 2018). Changes to the subpolar gyre index correlate strongly with pulses of salinity observed in the northern North Sea (Pätsch et al., 2020). Satellite altimetry data have been used to produce a gyre index, which is significantly correlated with the North Atlantic Oscillation (NAO) index (Pingree, 2002). Extremely low winter NAO index conditions (weaker than usual air pressure differences between Iceland and the Azores) are found to enhance poleward flow along the European shelf edge (Pingree, 2002). The NAO has also been shown to affect surface temperatures along the eastern boundary: strong negative NAO in the months leading to January has been shown to enhance shelf-edge winter warming and current strength along the Iberian Poleward Current, also called the “Navidad years” (Garcia-Soto et al., 2002).
The Slope Current is a narrow bathymetry-constrained, northward-flowing shelf-edge current. It is primarily driven by geostrophic inflow in proportion to the poleward density gradient in the North Atlantic basin (Marsh et al., 2017). It is therefore likely that changes to the density distribution of the North Atlantic could have profound effects on the Slope Current transport and composition, as well as the wider shelf-edge and shelf-sea environment. The Slope Current is also partially driven by onshore Ekman flow associated with poleward winds parallel to the coastline and shelf edge (Xu et al., 2015). Associated vertical mixing and flow instabilities at the shelf break provide an important mechanism for drawing essential nutrients to the shelf seas (Holt et al., 2009; Huthnance et al., 2009; Mathis et al., 2019). The Slope Current is often characterized in the literature as having a high salinity and velocity core at approximately 200–300 m above the 600 m bathymetry contour (Porter et al., 2018). The subpolar North Atlantic underwent extensive warming in the second half of the 1990s (Marsh et al., 2008), which was sustained well into the 2010s. Superimposed on this warming has been more recent short-term (interannual) variability: temperatures of up to 2 ∘C less than the mean were observed in the SPG from 2013, peaking in 2015 (Duchez et al., 2016; Josey et al., 2018). Coupled with this cooling was a sharp and record-breaking decline in salinity of the subpolar North Atlantic and shelf edge after 2015, associated with a strong positive NAO index over the SPG (Holliday et al., 2020). The NAC is influential in conveying material such as pollutants, nutrients, and organisms including their larvae into changing shelf-sea environments (Huthnance et al., 2009; Reid et al., 2003), which are becoming more or less conducive to any given species and potentially more conducive (and more favourable) to invasive species (Holt et al., 2018; Porter et al., 2018). The SPG and NAC are also known to have significant effects on the geographical shifts of plankton, fish, and whales in the ocean basin and shelf seas. Stronger phases of the SPG have been shown to reduce the amount of plankton and fish observed at the shelf edge and in the Rockall–Hatton Plateau (Hátún et al., 2009). Changes to certain seabird populations such as kittiwakes, terns, and auks have been strongly correlated with the SPG index: more specifically, high breeding success coincided with an expanded SPG, increasing zooplankton availability for the fish they feed on (Hátún et al., 2017). Conversely, a reduction of the AMOC and contraction of the SPG have previously been suggested in coupled climate–ecosystem models as mechanisms for a suppressed ecosystem in the North Atlantic (Schmittner, 2005). In summary, the Atlantic influence on European shelf seas is spatially and temporally variable. The strongest and most variable influence of Atlantic Water is felt along the shelf break and in the northern North Sea (Koul et al., 2019). The Slope Current is a major pathway for bringing waters of subpolar and subtropical origin to the shelf edge and shelf seas. Warmer water arriving from the North Atlantic into the European shelf seas has already been attributed to changes in the ecology and nutrients of UK waters (Holliday and Reid, 2001; Stebbing et al., 2002; Reid et al., 2003; Mathis et al., 2019). Given these changes, it is therefore timely to determine the effects of the changing North Atlantic on Slope Current provenance.
This study has been split into three main aims: (1) to identify the geostrophic inflow to the Slope Current, (2) to examine and where possible quantify the effects of changes in this inflow on the Slope Current, and (3) to assess and quantify the changing provenance of the Slope Current waters. The rest of the paper is outlined as follows. In Sect. 2, we outline datasets and diagnostics. In Sect. 3, we first examine subsurface hydrographic variability across the mid-latitudes of the North Atlantic along the eastern shelf break over 1980–2019, followed by analysis of zonal transport variability across mid-latitudes; we then focus on shelf-edge transport and establish Lagrangian evidence for the changing provenance of Slope Current water before and after 1997. In Sect. 4, we synthesize these findings in the context of previous studies of large-scale and regional change in the northeastern Atlantic and shelf seas.
We use several data sources and resources: an ocean reanalysis product and an eddy-resolving global ocean model hindcast. Lagrangian computational particle tracking experiments have been conducted to determine the provenance of shelf-edge and Slope Current waters. These datasets and diagnostics are outlined in the following subsections. The code used for the data analysis mentioned below and plotting is available separately via Zenodo (Clark et al., 2022).
2.1 Gridded reanalysis datasets
For a consistent physical and dynamical description of the North Atlantic, the NOAA gridded dataset known as GODAS (Global Ocean Data Assimilation System) (NOAA, 2019; Nishida et al., 2011) has been used here. The dataset provides monthly values of temperature, salinity, and zonal and meridional components of velocity for 1980–2019 inclusive. The dataset assimilates measurements from a suite of observational tools, including expendable bathythermographs (XBTs), Argo floats, moorings, and satellite altimeters (Nishida et al., 2011). Resolution for all parameters is ∘ latitude by 1∘ longitude at 40 depth levels. We acknowledge that, because of the small scale of the Slope Current, the current itself is not resolved in this dataset. However, it does provide data in sufficient resolution to assess the state and changes in the North Atlantic basin, particularly the changes within the subpolar gyre. As an assimilated and gridded dataset, GODAS uses a 3D-Var assimilation scheme to plug gaps in the data, especially at depth (NOAA, 2019). GODAS salinity is mostly “synthetic”: it uses a computed salinity profile using the annual T−S relationship of a region (NOAA, 2019; Behringer and Xue, 2004). Despite the fact that GODAS “seriously underestimates salinity variability” (NOAA, 2019), since the density and hence the geostrophic velocity are mainly influenced by temperature variability in the North Atlantic region (based on the analysis presented in the results), it is appropriate for looking at longer-term (decadal scale) North Atlantic variability, where density anomalies are predominantly associated with temperature variability. The eastward and northward velocity field is also included in the analysis. For this work, we created a climatology of mean monthly temperature, salinity, and density at each chosen depth level for the entire time series.
Using the calculated climatologies, we have produced anomaly maps (for any selected depth) and meridional profiles, in the form of Hovmöller diagrams, along the shelf edge to capture the greatest density gradient of temperature and salinity. The shelf edge was defined as the first grid cell, reading from east to west, containing data at a grid depth of at least 600 m.
2.2 Transport calculations and metrics
Using the Python “Gibbs Sea Water” package, hosting the full equation of state of seawater TEOS10 (IOC et al., 2015), density was calculated from the temperature and salinity. The density was then used to calculate the geostrophic eastward volume transport of water through sections using the (eastward) thermal wind equation (Eq. 1):
where is eastward velocity change over depth, g is gravitational acceleration, ρ0 is reference density, f is the Coriolis parameter, and is the change in density over latitude.
Integrating within the upper 1000 m of water between 45 and 60∘ N to obtain geostrophic volume transport (Ugeo) through the section results in
where Δz is the depth step, Δy is the change in latitude, and dividing by 1 × 10⁶ provides the transport in Sverdrups (Sv, where Sv = 1 × 10⁶ m3 s−1).
We further use the eastward component of currents (part of the absolute velocity) in the GODAS dataset to calculate Utot, the total transport in the upper 1000 m. We also calculate two other different transport types to help determine the changing provenance of Slope Current waters: large-scale Sverdrup transport, calculated from NCEP wind field (gridded atmospheric wind on a 2.5∘ regular latitude–longitude grid, updated to 2020; Kalnay et al., 1996), which is used as a proxy for subpolar gyre circulation, and Ekman transport at the shelf edge (15∘ W, 50–58∘ N) based on the GODAS wind stresses. Please note that transport in our results and discussion is assumed to be volumetric water transport unless otherwise stated.
Sverdrup balance is
where β is the meridional derivative of the Coriolis parameter (units m2 s−1), V is meridional transport, ρ is mean density (1025 kg m−3), and τsy and τsx are surface wind stress in the northward and eastward directions, respectively. For a given latitude, we integrate V westward to obtain the total northward Sverdrup transport (m3 s−1) and select the maximum value in the subpolar range of latitudes as an index of the wind-driven subpolar gyre.
Ekman volume transport (eastward) is calculated as
where τys is northward wind stress, ρ is mean density (1025 kg m−3), and f is the local Coriolis parameter.
We also calculate monthly sea surface height (SSH) gradients (from GODAS sea surface height relative to the geoid – SSHG – data) along the same meridional transect (30∘ W, 45–60∘ N) to provide a proxy for SSH-gradient-associated eastward barotropic transport.
2.3 Eddy-resolving model output analysis
The GODAS assimilated values have been compared against and complemented with a ∘ resolution eddy-resolving global ocean model: ORCA12, part of the NEMO family of models (Madec, 2015). In previous studies, the model has been confirmed to be a good representation of North Atlantic subpolar circulation (Marzocchi et al., 2015). Quiver plots of velocity (Fig. 1) have been produced for the ORCA12 250 m depth level to visually represent the currents at the shelf edge. This provided the evidence showing that shelf-edge flows, including the Slope Current, are resolved in this model. The northward velocity component of the model output has been integrated to produce an estimate of total northward volume transport at the shelf edge. A similar calculation was used to calculate eastward transports in the subpolar North Atlantic. The transport calculation was limited to the upper 1000 m of the water column. This acts as an indicator for Slope Current transport.
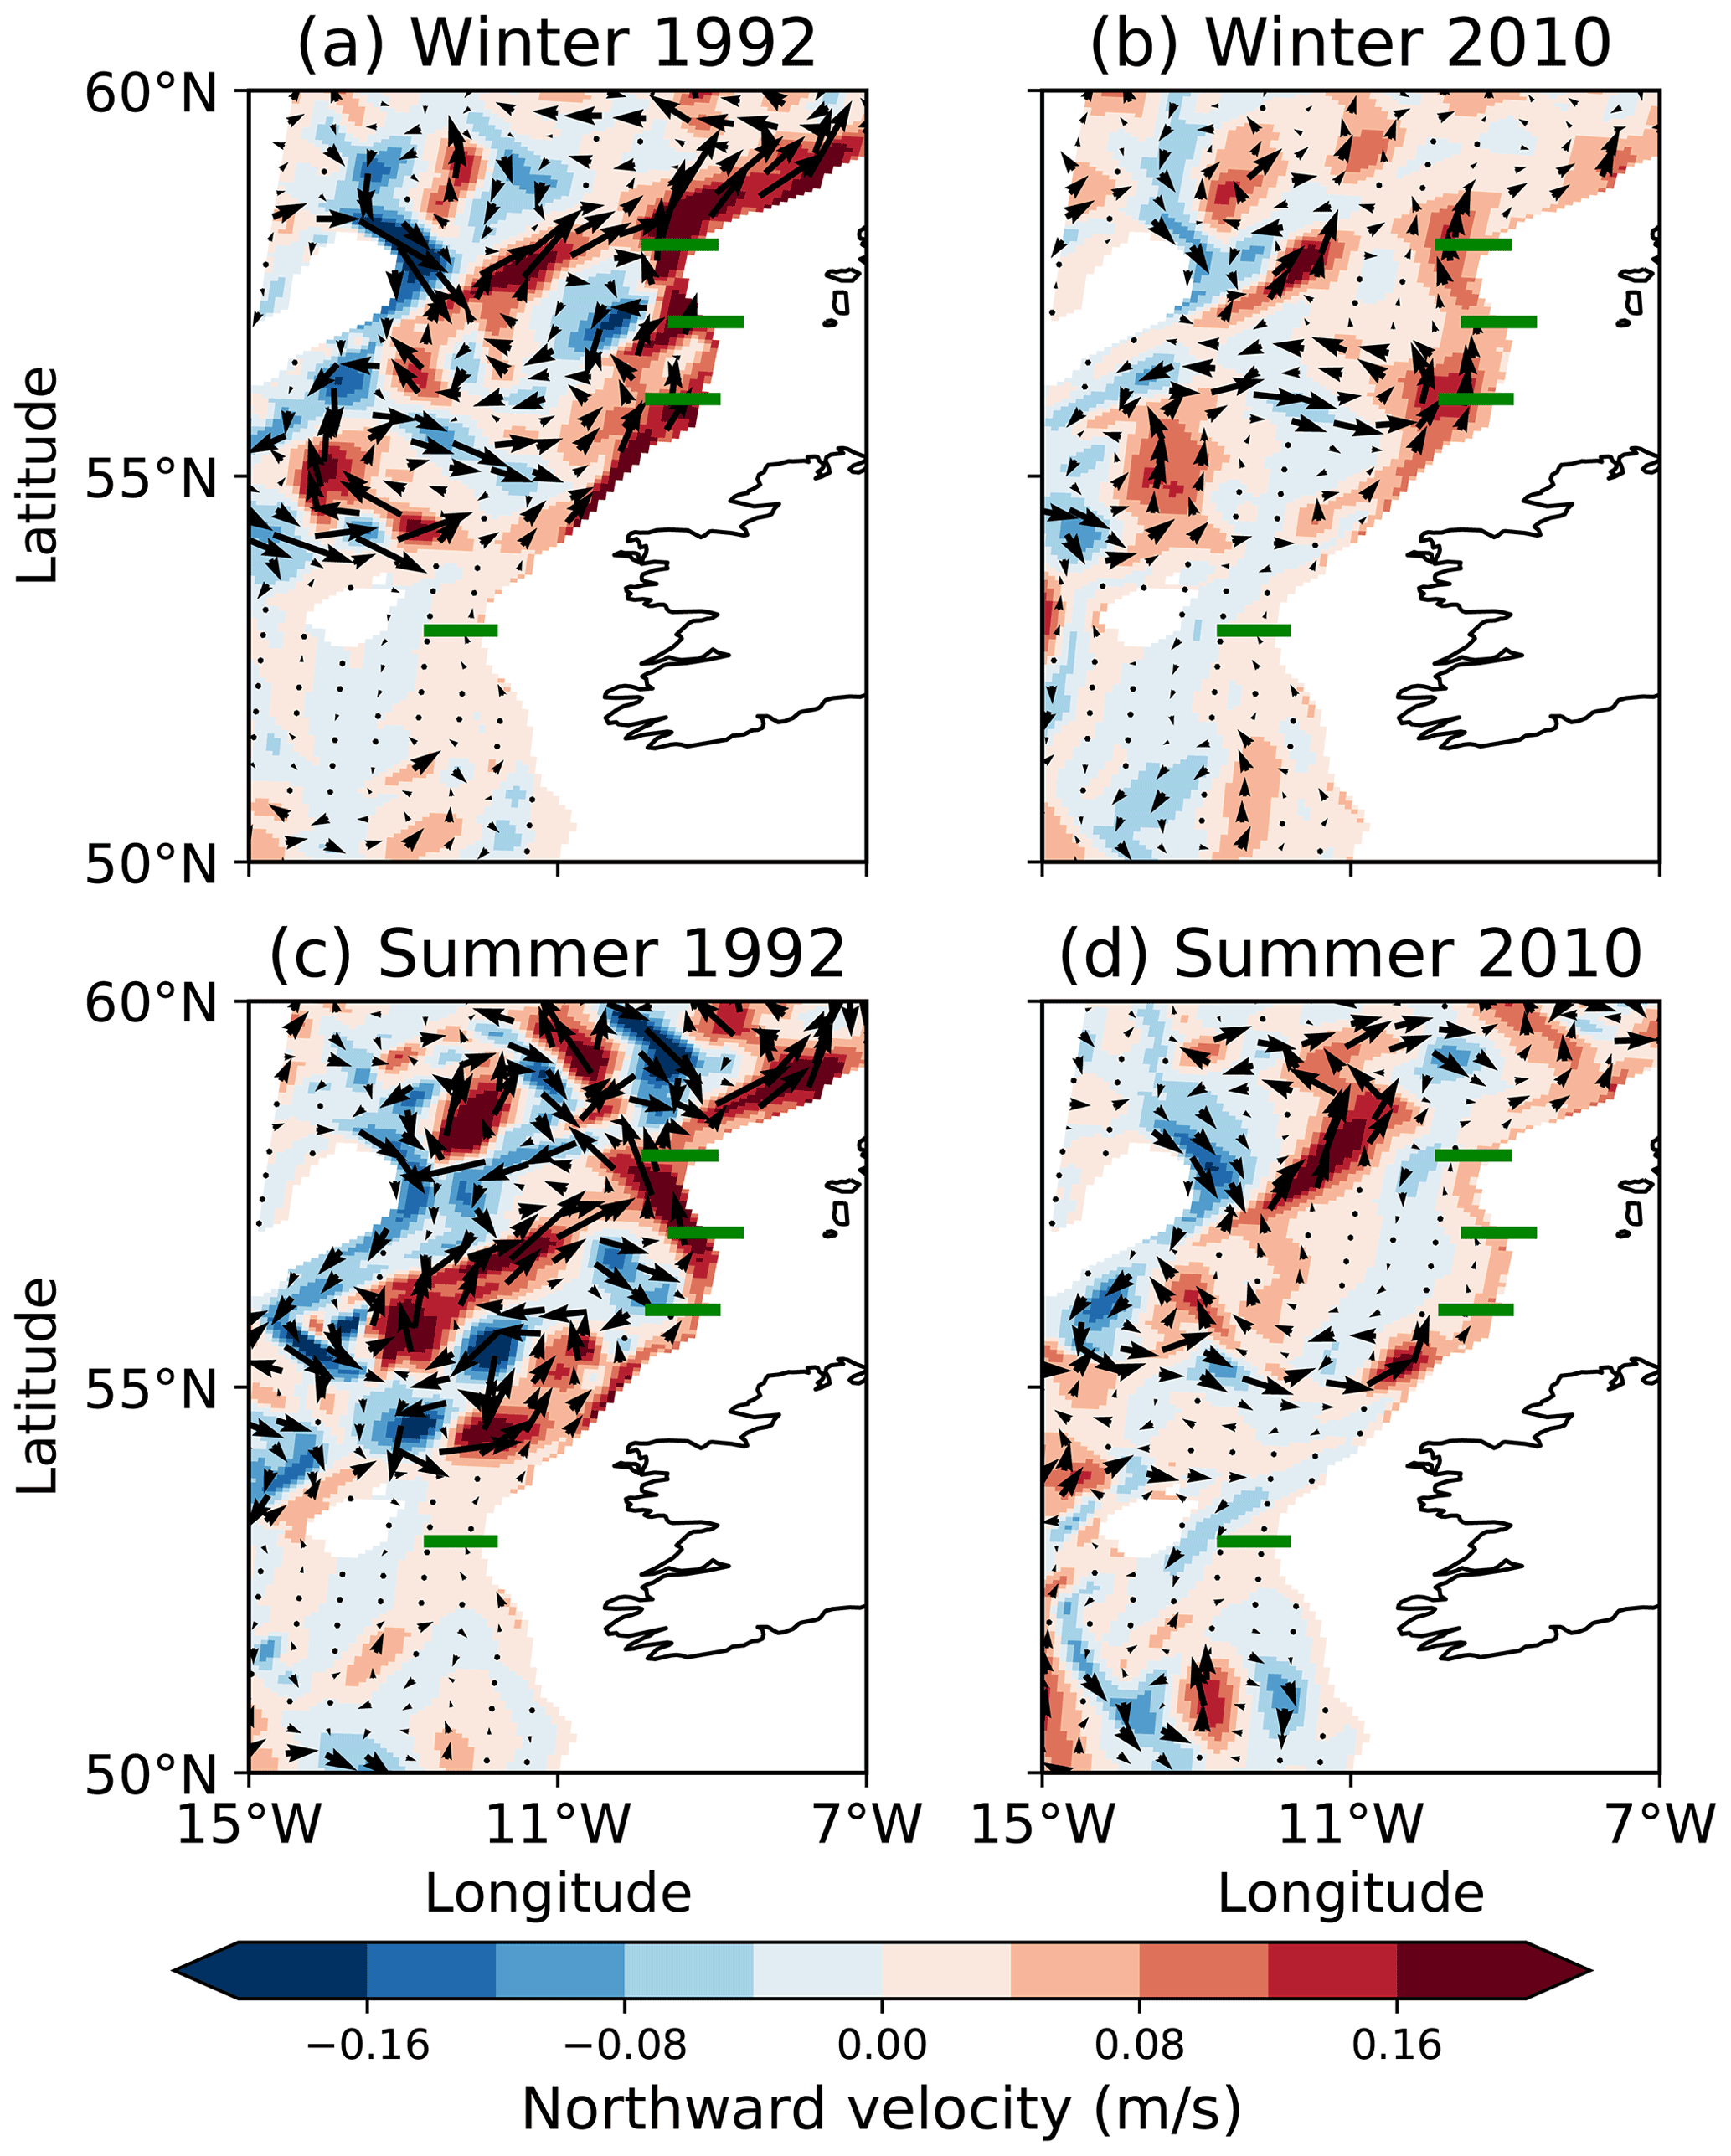
Figure 1Quiver plot using ORCA12 data, indicating subsurface (245 m) velocity magnitude and direction of the water, comparing winter (January) and summer (July) releases: (a) winter 1992; (b) winter 2010; (c) summer 1992; (d) summer 2010. Background colour highlights the magnitude of the v component of velocity, which is positive northwards. Green lines indicate the zonal transects used for Fig. 8.
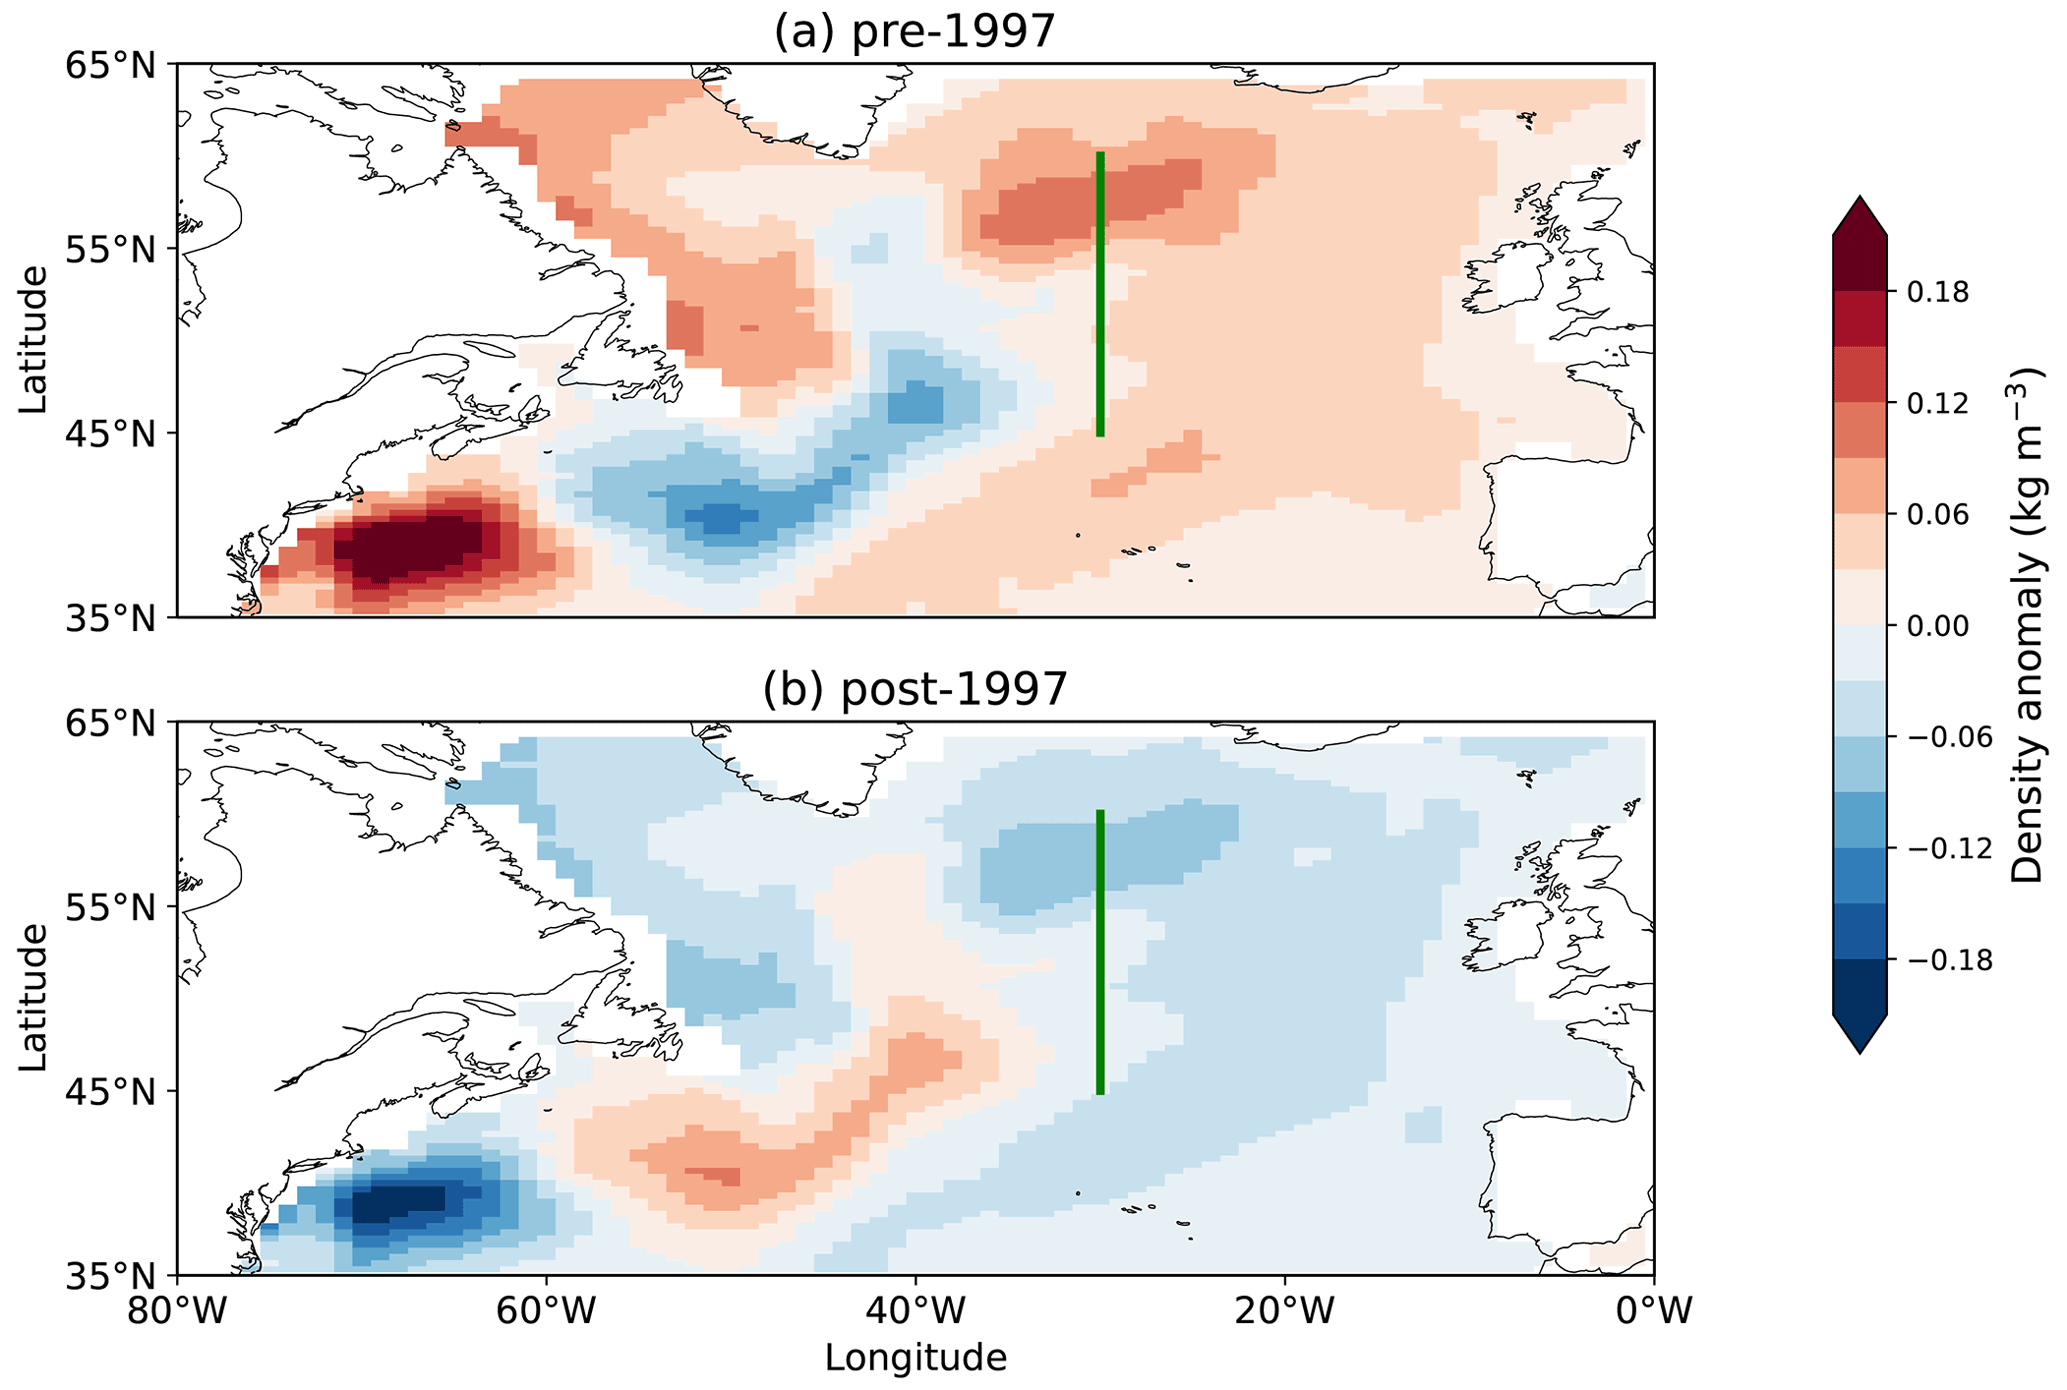
Figure 2Mean anomaly maps of density at 205 m below the surface: (a) pre-1997; (b) post-1997. Data from GODAS. Anomalies calculated with respect to the 1980–2020 climatology. The green line at 30∘ W shows the meridional profile used for eastward transport calculations between 45 and 60∘ N.
2.4 Particle trajectory calculations
We use virtual particles to represent water parcels recruited to the Slope Current. To examine the origin of Slope Current waters, two particle tracking simulations were performed using ARIANE particle modelling software (Blanke and Raynaud, 1997), calculating trajectories backwards through time in the “qualitative mode” of ARIANE. The ORCA12 model 5 d means (Madec, 2015) were used to provide the state of the ocean for the simulated years in a sub-domain of the global ocean (constrained by computational demands) with a southern limit at 34.5∘ N and a northern limit ranging – due to the tripolar mesh of ORCA12 – from 64∘ N (around 85∘ W) to 72.5∘ N (around 30∘ W). A number of particles were backtracked in proportion to the northwards transport at the NW European shelf edge between 54.2 and 58.4∘ N, a latitude range over which the Slope Current recruits Atlantic inflow; as such, the number of backtracked particles varied with each experiment. Releases were designed to target the “core” of the Slope Current: ORCA12 grid cells in the upper 300 m were defined as a release location if there was northward transport present within 50 km of the 300 m isobath. The model coordinates of these grid cells provide the initial positions for particles, which were distributed evenly across the vertical dimension of each grid cell, in proportion to the northward component of flow, with one particle allocated per 5 cm s−1. As such, our 1992 ARIANE hindcast had 16 470 releases, and our 2010 hindcast had 3626 releases, reflecting the reduction of northward transport within the stated latitude, longitude, and depth limits.
Particles were released monthly at the start of each month for each chosen release year, and back-trajectories were calculated for a maximum of 4 years from the time of release; many particles reached the domain limit within 4 years, in which case their trajectories were terminated. The calculations provided daily particle location (latitude, longitude, and depth) as well as in situ temperature, salinity, and potential density (relative to the surface). Subsequent to these calculations, particle data are statistically analysed at selected locations on a grid of resolution 0.5∘ × 0.5∘ for the fractional presence of particles, particle mean age (days adrift prior to arrival in the Slope Current), depth, and potential temperature. We further record particles crossing 30∘ W in the latitude range 40–60∘ N binned per 0.5∘ of latitude to obtain the corresponding percentages, along with mean age (days before arrival in the Slope Current), temperature, and depth. Back-trajectories and associated statistics were thus calculated for the periods 1992–1988 and 2010–2006, addressing changes observed in the earlier dataset analysis, in particular the shift to a warmer subpolar North Atlantic.
In the following section, we first examine subsurface hydrographic variability in the northern subtropical and subpolar North Atlantic, as well as along the eastern shelf break, from the GODAS dataset. We then examine the variability of zonal transport across mid-latitudes. Finally, we examine shelf-edge meridional transport and present Lagrangian evidence for changing provenance of the Slope Current over the last 40 years.
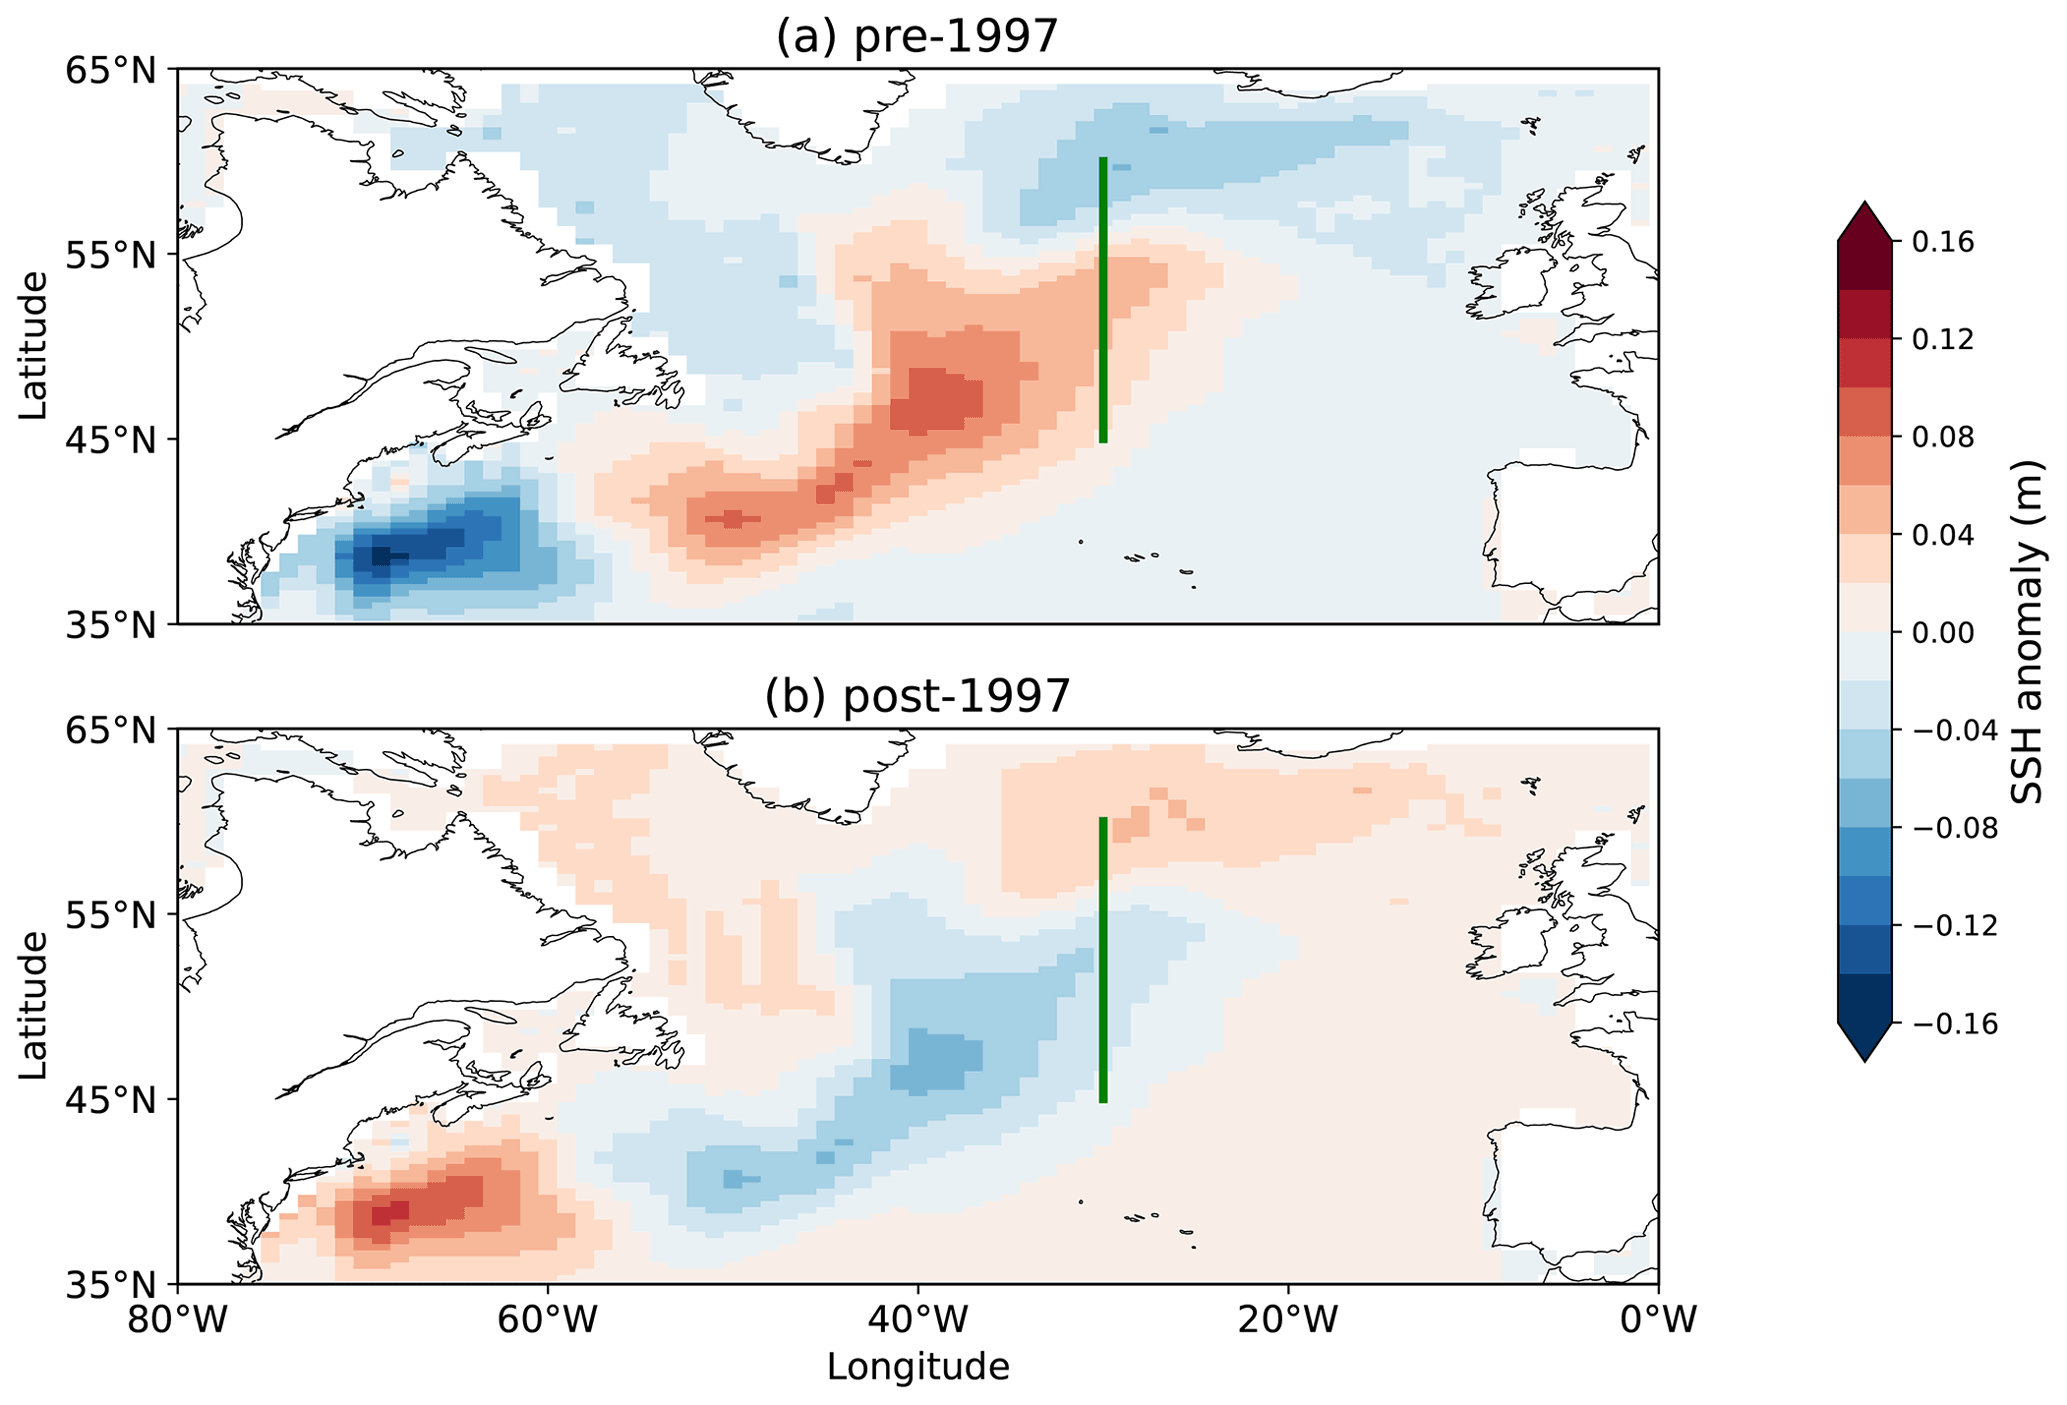
Figure 3Mean anomaly maps of sea surface height (SSH): (a) pre-1997; (b) post-1997. Data from GODAS. Anomalies calculated with respect to the 1980–2020 climatology. The green line at 30∘ W shows the meridional profile used for eastward transport calculations between 45 and 60∘ N.
3.1 Subsurface hydrographic variability across the mid-latitude North Atlantic and along the eastern shelf break over 1980–2019
Since the Slope Current is defined as being a subsurface feature with a core of 200–300 m (Porter et al., 2018), we focus on changes to the mean decadal density (Fig. 2) anomalies at the GODAS depth layer of 205 m, calculated from the temperature and salinity data using the equation of state for seawater (Sect. 2.1). Other depth levels were tested (not shown) but 205 m gave the strongest gradients in density at a depth likely to influence the Slope Current. Salinity and temperature are closely related throughout the subsurface North Atlantic Ocean. Where temperature is higher (lower) than the decadal mean, the water is typically more saline (fresher). This pattern is observed in all decades (not presented here). The trend in temperature anomaly is from a cool subpolar gyre to a warm subpolar gyre, although periods of intense (2 ∘C) cold temperature anomalies were observed in the subpolar region, particularly around 2011–2015. Density shows an inverse relationship with temperature and the patterns of variability match almost exactly. This is not always true when we compare the salinity to the density anomalies, especially nearer the Labrador Sea, where salinity anomalies are particularly large. Over the study period, there were notable “regime shifts” in temperature and density (and to a lesser extent, salinity) of the North Atlantic. The patterns of temperature and density anomalies have changed considerably over time, to the point at which the 2010s patterns are an approximate inverse of the 1980s patterns. Figure 2 compares the mean density anomaly (with respect to the 1980–2020 climatology) pre- and post-1997 to assess the impact of the warming of the subpolar North Atlantic on density patterns in the region. The subpolar region transitioned from a positive density anomaly of approximately 0.13 kg m−3 to a negative anomaly of approximately 0.11 kg m−3. The subtropical regions, especially just south of Cape Hatteras, showed an even larger swing of density anomaly exceeding ± 0.18 kg m−3. These changes will have profoundly affected the density gradients. SSH anomalies (Fig. 3) show large changes too. Where positive density anomalies are present, there are negative SSH anomalies (and vice versa), with an overall anomaly switch of ± 0.11 m from pre- to post-1997, in the subpolar gyre region, with anomalies of ± 5 cm along 30∘ W; in particular, the gradient of SSH (down-slope) from the central northern subtropical gyre to the eastern subpolar gyre is reduced by ∼ 20 cm from pre-1997 to post-1997, primarily associated with subpolar warming and reduced densities.
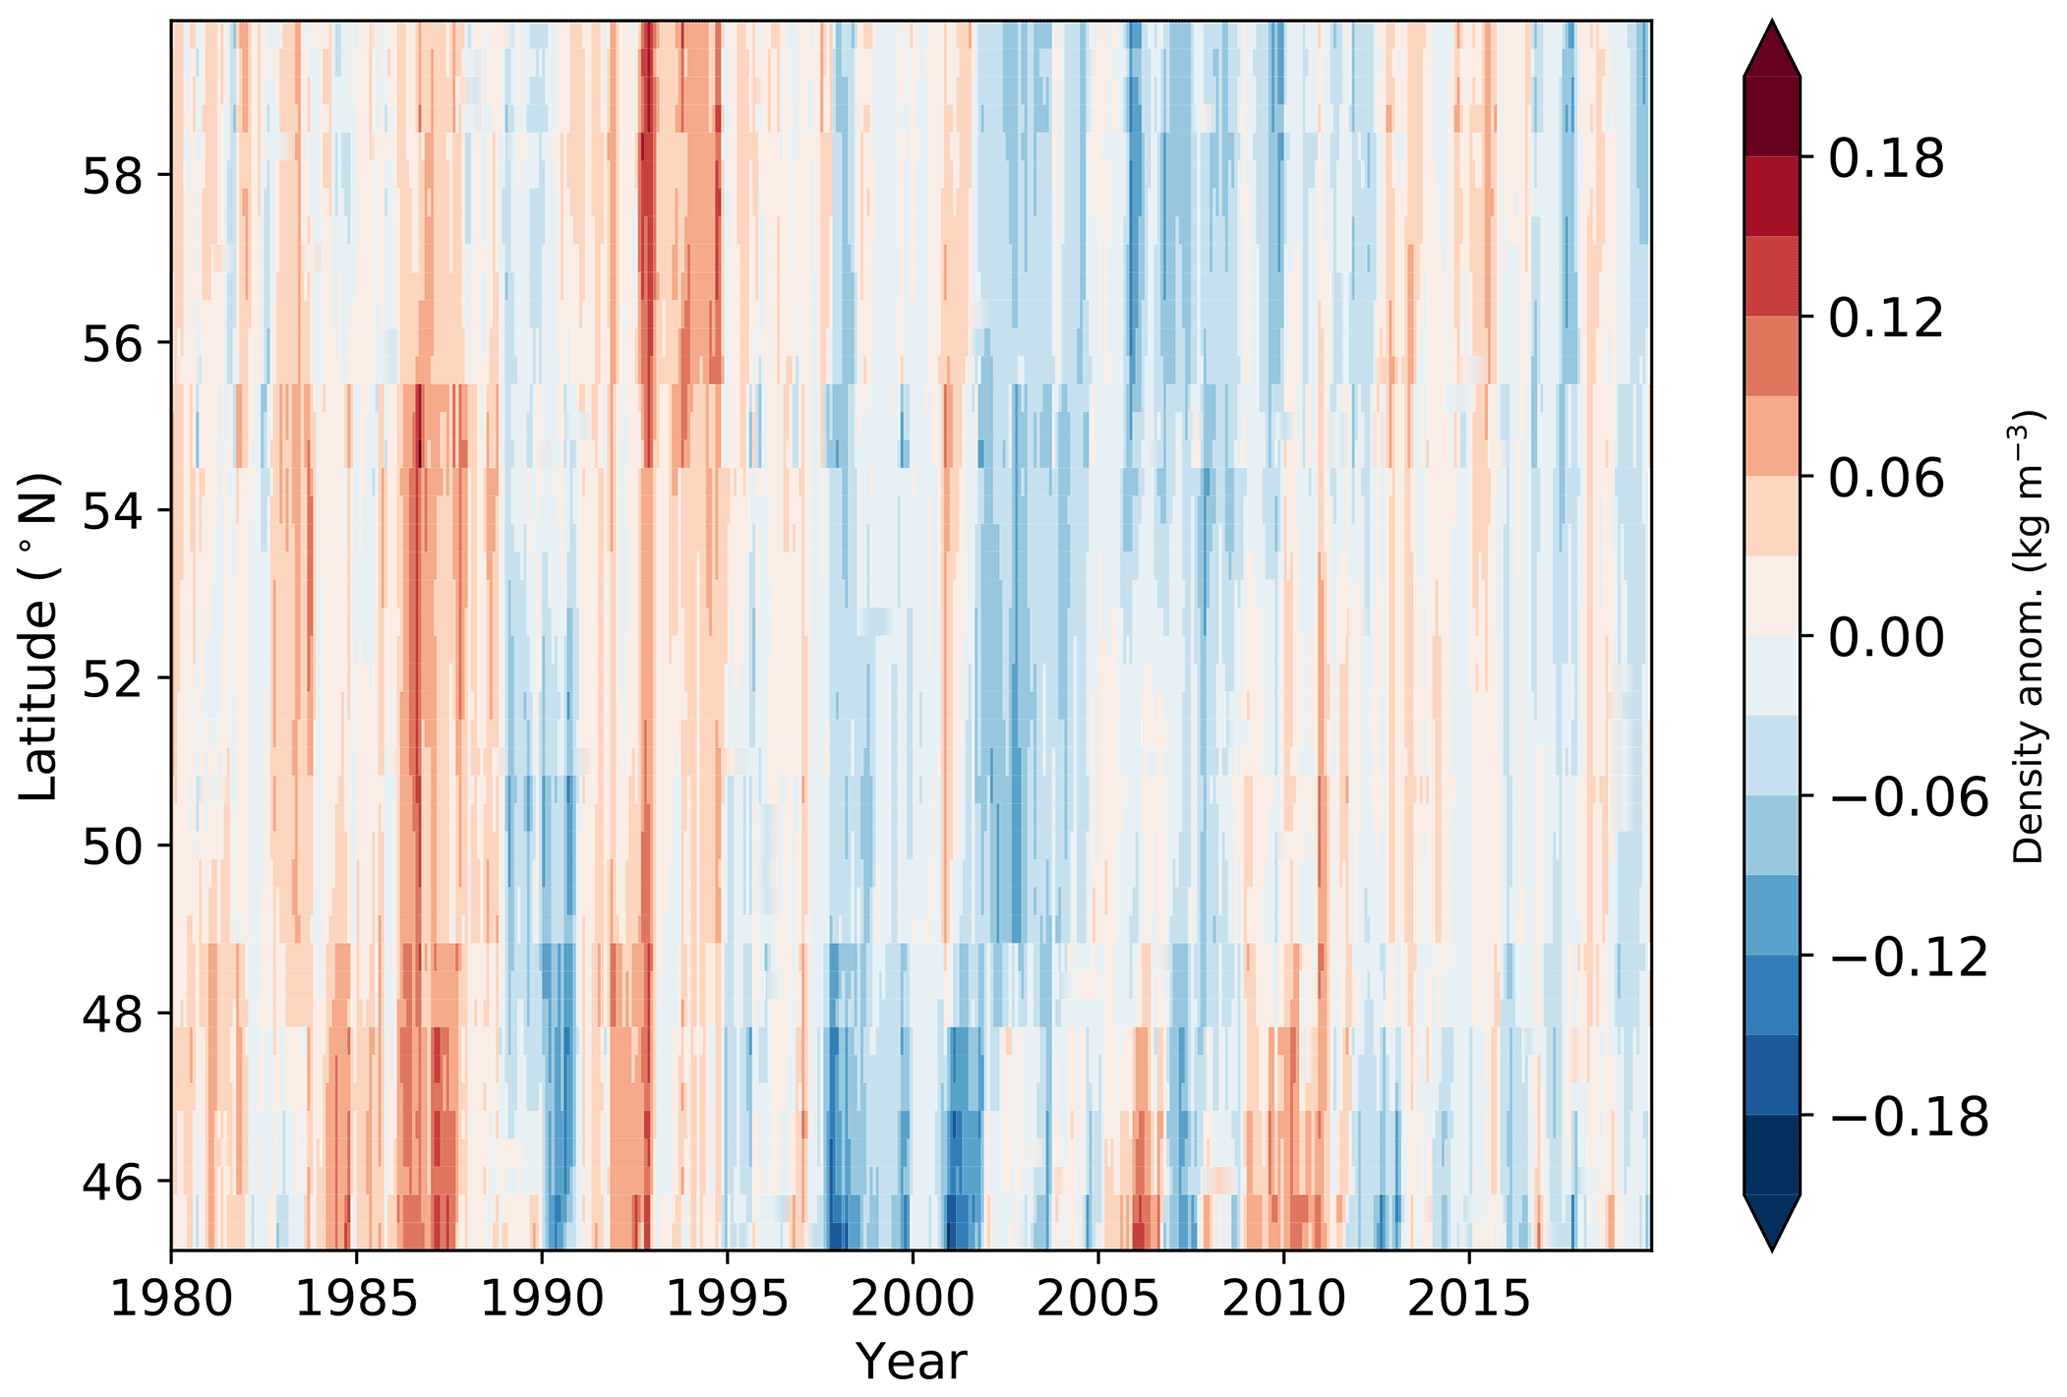
Figure 4Time series Hovmöller plot of GODAS mean density anomaly, averaged over depth levels 0–600 m, at the shelf edge between 45 and 60∘ N.
When examining temperature and salinity as meridional profile time series along-slope, the same strong temperature–density relationship is observed. Hence, depth-averaged (0 to the nearest 600 m depth bin) along-slope density anomalies for GODAS (Fig. 4) have been plotted. The horizontal bands seen at 48–49 and 55∘ N in Fig. 4 are an artefact of jumping between grid cells to trace the shelf edge. From 1980 to 1987, the GODAS time series is dominated by a positive density anomaly. A short-lived switch to a negative anomaly is observed at 1990 before a more sustained positive density anomaly to 1997. From 1997 onwards, the profile is dominated by negative anomalies, peaking just after the year 2000 at lower latitudes (< 48∘ N). This negative density anomaly persists at most of the shelf edge until 2010. From 2010 onwards, anomalies vary between positive and negative values. The density anomalies in Fig. 4, dominated by temperature anomalies, are indicative of variable properties of water circulating in the Slope Current system, which are in turn related to changing provenance – a theme we return to in Sect. 3.3.
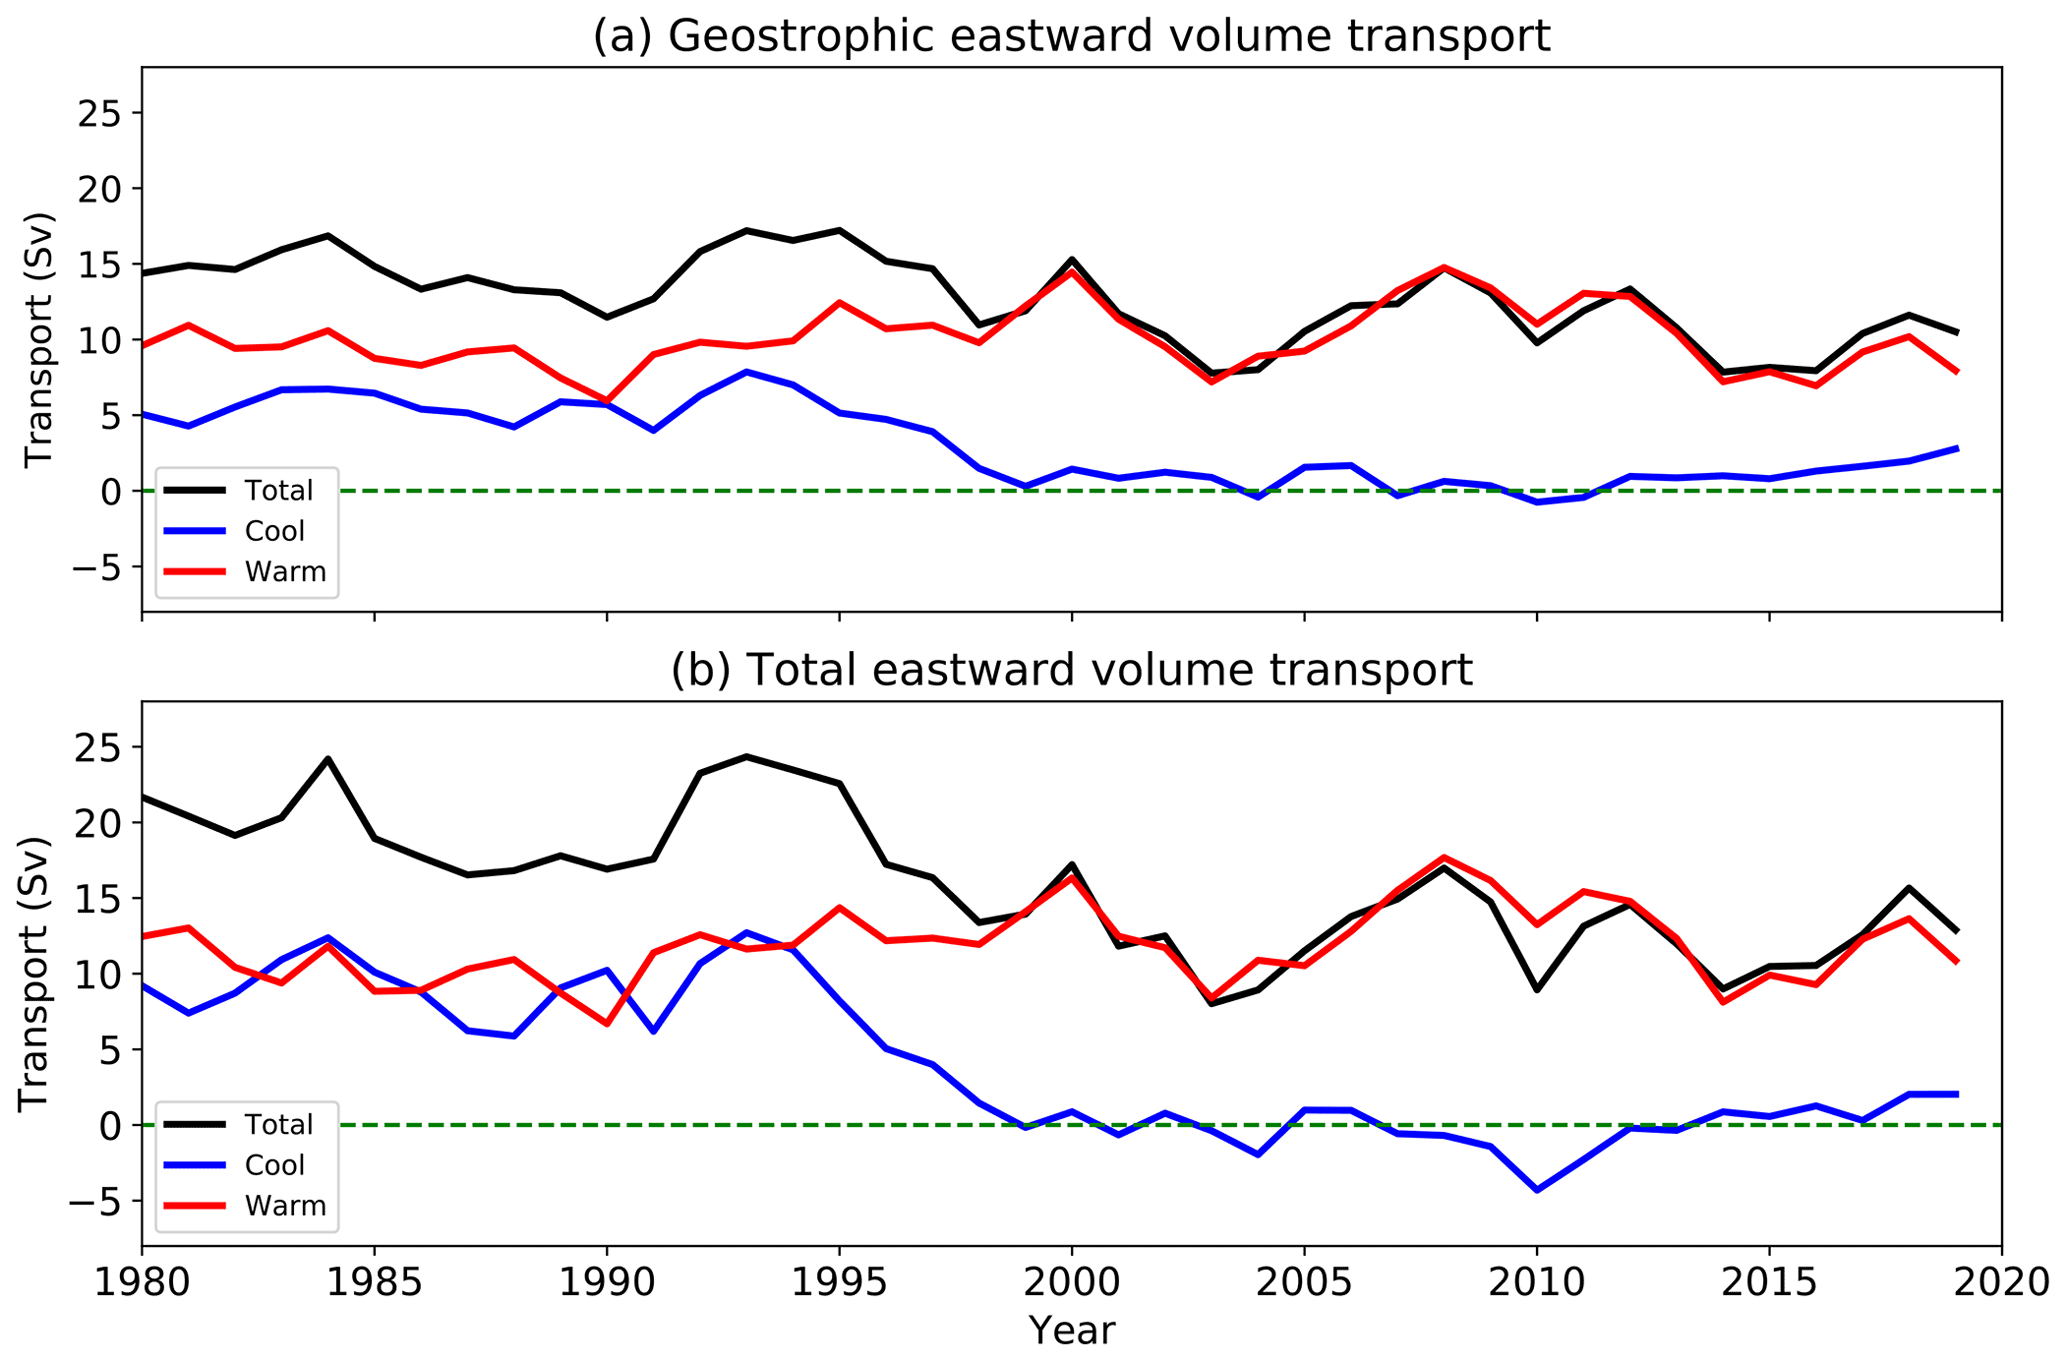
Figure 5Eastward volume transport time series (annual means) from the GODAS dataset: (a) geostrophic and (b) total at 30∘ W , between 45.2 and 60.2∘ N, and in the upper 1000 m. “Cool” is defined here as temperatures < 11 ∘C, and “warm” is ≥ 11 ∘C.
3.2 Zonal transport variability across North Atlantic mid-latitudes over 1980–2019
Geostrophic eastward volume transport (Fig. 5a), calculated via the “thermal wind” equation as detailed in Sect. 2.1, and absolute eastward volume transport (Fig. 5b) have been calculated at 30∘ W between 45 and 60∘ N. Transport was calculated monthly and then annual means taken to remove the large seasonal variability (not shown). A “temperature separation” threshold of 11 ∘C was determined as appropriate by testing different temperatures in the range 10–12 ∘C based on the mean decadal temperature anomalies in the subpolar North Atlantic (subpolar gyre region, not shown).
From 1995, the transport begins to switch to a warmer regime (≥11 ∘C). By 1999, the cool geostrophic transport decreased to between 0 and 1 Sv, with some very brief periods of negative (westward) transport of magnitude < 1 Sv. In both the geostrophic transport and the total transport (Fig. 5), the cold pathway does begin to grow once again from 2012. However, total transport does not show any sign of increasing to pre-1997 levels.
The GODAS geostrophic component (Fig. 5a) of transport strongly relates to the peaks shown in the total transport time series in Fig. 5b. Total absolute velocity through the same section also shows the same general trends and peaks, but the magnitude of the transports is approximately 5 to 6 Sv more. The total transport decrease after the 1995–97 regime shift is evident in both the geostrophic and total eastward transport estimates, with an observed decrease of approximately 10 Sv. The geostrophic transport estimates equate to the baroclinic, temperature, and density-driven part of transport, which is slowly changing in relation to the changing density distribution as shown in Figs. 2 and 4. The total transport therefore includes additional contributions from transport below 1000 m, including any deep flows that may be identified with barotropic transport.
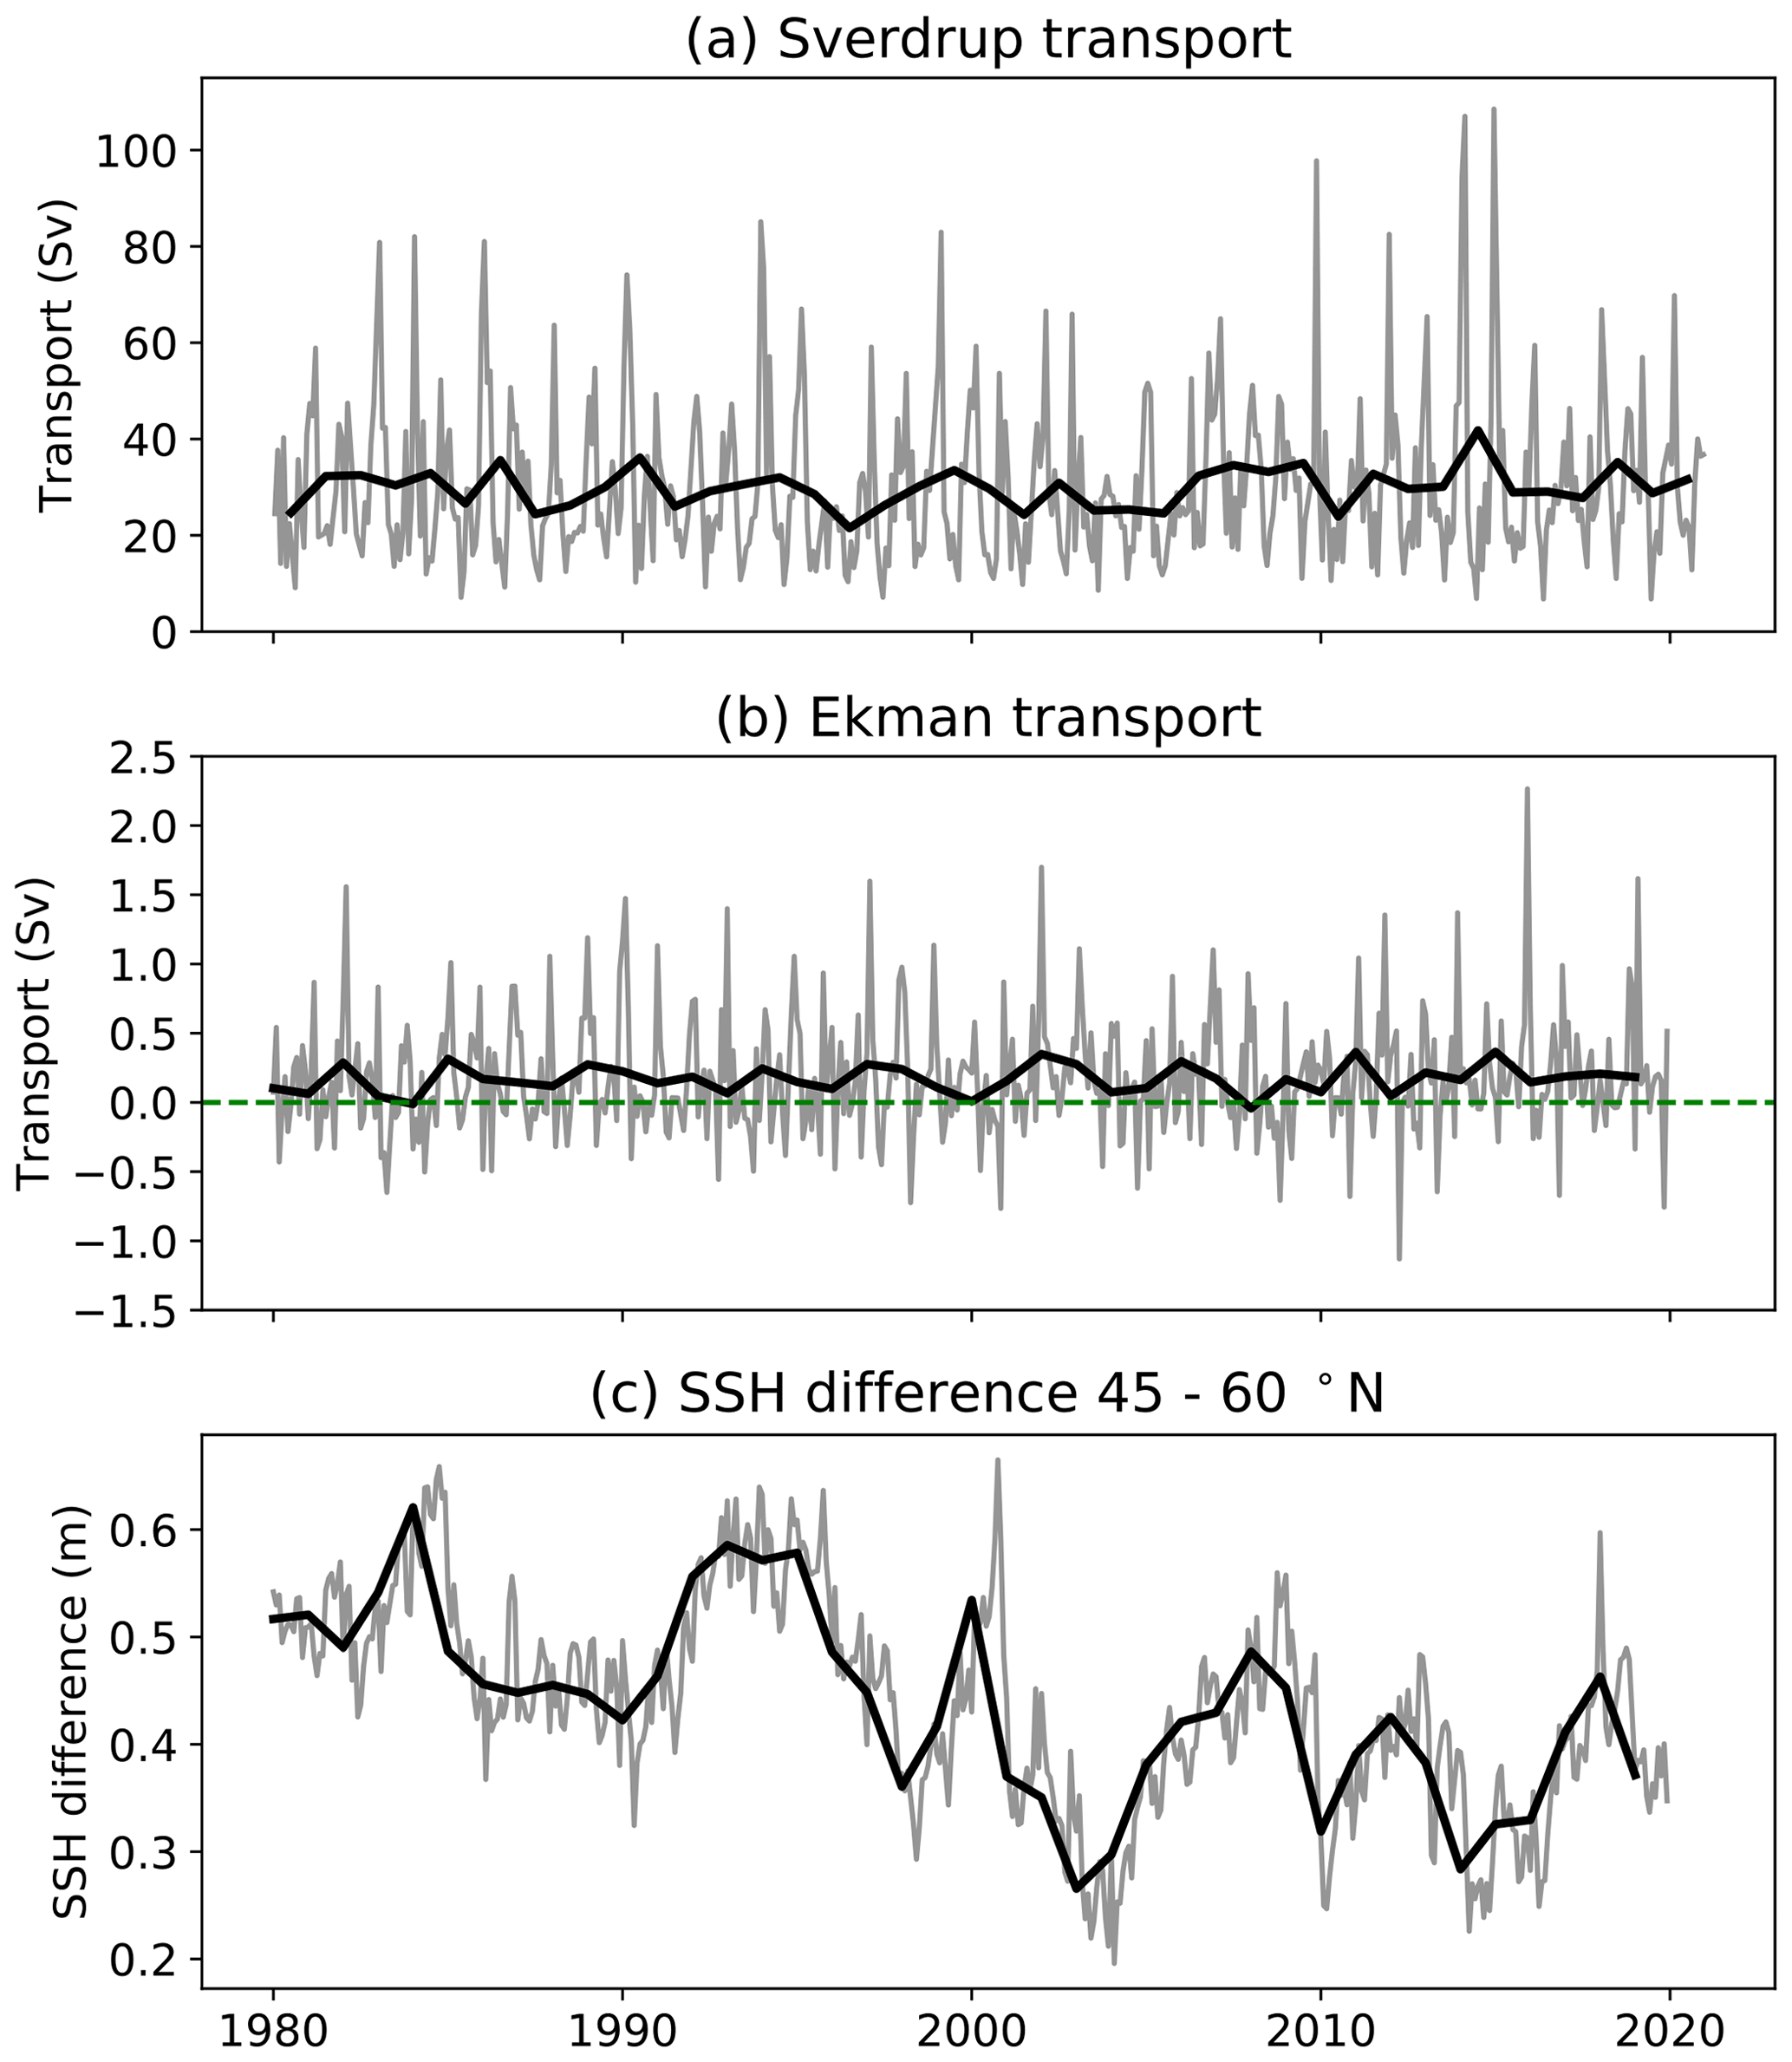
Figure 6Annual and monthly mean eastward volume transport time series: (a) Sverdrup transport calculated from NCEP winds; (b) Ekman transport calculated from GODAS northward momentum (wind) flux for the shelf-edge region (15∘ W, 50–58∘ N); (c) SSH difference between 45 and 60∘ N at 30∘ W.
To provide further metrics of the regional and boundary circulation, we calculate the basin-scale Sverdrup transport (Fig. 6a), wind-driven Ekman eastward transport in the vicinity of the Slope Current (Fig. 6b), and a mid-basin sea level slope anomaly as an index of geostrophic surface flow (Fig. 6c). All three indices reveal a range of monthly and interannual variability. The annual amplitude of Sverdrup transport is on the order of 60 Sv, although annual mean transport in the approximate range 25–35 Sv is much more stable. Ekman transport can vary annually by up to ∼ 2 Sv. There is no observed trend in Sverdrup or Ekman transports. As considered in previous studies (e.g. Marsh et al., 2017), eastward Ekman transport at the shelf break makes only a minor contribution to Slope Current transport, being most substantial during strong southwesterlies in winter. The sea surface slope, indicative of surface geostrophic flow at 30∘ W (Fig. 6c), varies in synchrony with the geostrophic and total transport (Fig. 5), dominated by decadal variability superimposed on long-term decline.
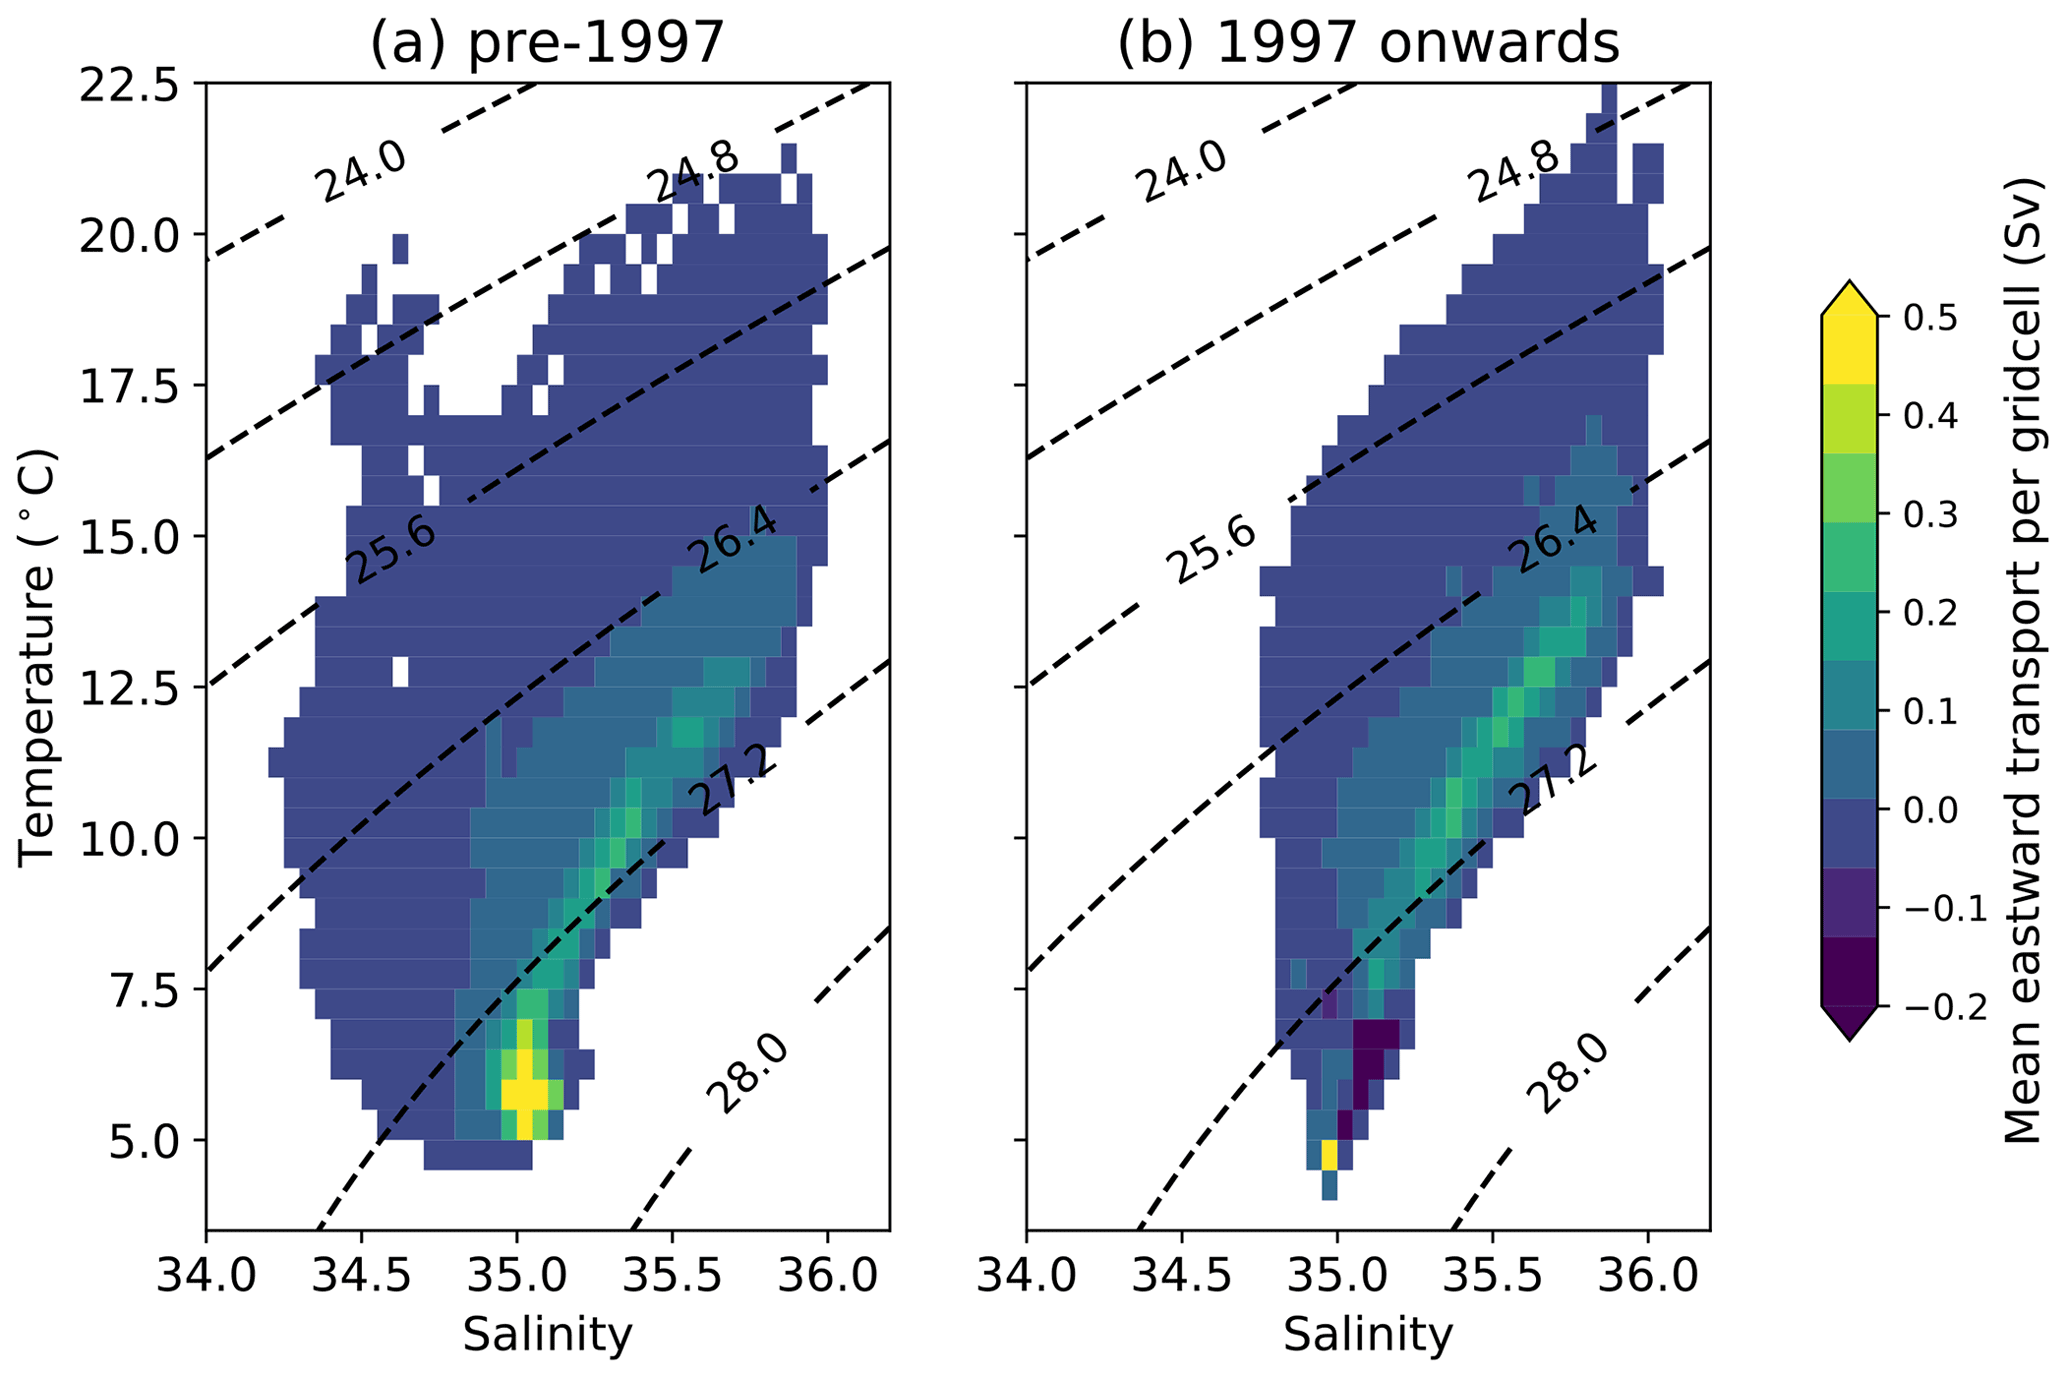
Figure 7GODAS temperature–salinity binned eastward transport at 30∘ W between 45.2 and 60.2∘ N in the upper 1000 m for (a) pre-1997 and (b) 1997 onwards. Dashed lines are isopycnals. The sum of the grid cells in (a) is 17.2 Sv and (b) 11.1 Sv.
Figure 7 shows the same GODAS absolute transports respectively binned in temperature and salinity space (in intervals of 0.5 ∘C and 0.05, respectively) on a temperature–salinity (T−S) diagram in Fig. 7a for pre-1997 and Fig. 7b for 1997 onwards to further understand the observed shift to warmer transport from a water mass perspective. Transport is spread across temperatures in the range 5–22 ∘C and salinities in the range 34.25–36 pre-1997 (Fig. 7a). Post-1997 (Fig. 7b) shows a similar temperature distribution but is more constrained in salinity, with a range of 34.7–36.2. The corresponding potential density range is 26.8–27.0 kg m−3, with higher values corresponding to Subpolar Mode Water (McCartney and Talley, 1982). A small amount of negative (westward) transport is observed at temperatures below 7.5 ∘C in both analyses. The strongest transports occur at temperatures of 7.5–10 ∘C and 35.25–35.50: this T−S class transport strengthens by at least 0.02 Sv, but overall transport determined by the sum of the grid cells has decreased. Differences in pre-1997 and post-1997 transport distributions in T−S space are consistent with the declining total transport and increase in the significance of the warmer flow observed in Fig. 5. An overall regime shift of higher salinities and temperatures is observed in the post-1997 period, with a decrease in total transport. Once again, this is consistent with the time series shown previously. There is a greater spread of temperature from 1997; however, a narrower salinity range is apparent.

Figure 8Northward total transport at the shelf edge from the ORCA12 hindcast across zonal transects at (a) 58∘ N, (b) 57∘ N, (c) 56∘ N, and (d) 53∘ N (see Fig. 1). Transects are the following length, as constrained by the bathymetry: 53∘ N is 53.7 km; 56∘ N is 51.0 km; 57∘ N is 50.2 km; 58∘ N is 49.5 km. Total transport is indicated with black lines. Transport at temperatures above and below 11 ∘C is indicated with red and blue lines, respectively. Thin lines show 5 d means. Thick lines and stars indicate the annual mean. Note that y-axis scales in (d) are different from (a–c).
3.3 Shelf-edge transport and Lagrangian evidence for changing provenance of Slope Current water
Shelf-edge current velocity from the ORCA12 model hindcast was plotted in Fig. 1, with quivers showing the magnitude and direction and the background colour indicating the northward velocity component. 245 m was the chosen model depth level to target the high-velocity Slope Current core and negate the effects of large flows at the sea surface caused by surface heating and winds. This depth level also resides within the accepted range of the Slope Current core (Porter et al., 2018). Northward velocity has clearly decreased between 1992 (Fig. 1a, winter; and Fig. 1c, summer) and 2010 (Fig. 1b, winter; and Fig. 1d, summer). Winter flows appear stronger in both years. To examine how eastward transport in the SPG region of the North Atlantic translates to northward volume transport at the shelf edge (unresolved in GODAS), four approximately cross-slope (zonal) transects were identified in the ORCA12 hindcast at 53, 56, 57, and 58∘ N (Fig. 8, with the transects annotated on Fig. 1). At each transect, transport was calculated from 5 d averages of the northward component of velocity in 0.5 ∘C temperature bins. As for the zonal transports at 30∘ W presented earlier, we partition shelf-edge meridional transports above and below 11 ∘C. These transports and corresponding annual means are presented in Fig. 8. Transports across 56–58∘ N (Fig. 8a–c) are up to 5 times greater than the transports at 53∘ N (Fig. 8d), consistent with recruitment of zonal inflow to the Slope Current along the Hebridean shelf (Porter et al., 2018). Given considerable shelf-edge exchange poleward of 56∘ N and the choice of transects that may more or less capture the Slope Current flow, transports across 56–58∘ N are consistent with progressive inflow from the west: the shelf-edge transport time series show similar variability, peaks, and troughs as the GODAS-derived geostrophic and total eastward transports in Fig. 5. Considerable variability is notable in these time series on timescales from synoptic to decadal. In particular, transport at 56–58∘ N declines from the mid-1990s onwards, contemporaneous with the declines in zonal transport evident in Fig. 5. Prior to 1997, annual mean transports at 56–58∘ N remain above 3 Sv. Post-2001, annual mean transport at 58∘ N does not exceed 2 Sv and falls below 1.5 Sv at 56–58∘ N during most years over 2007–2010. Transports across 53∘ N reveal a more distinct seasonal cycle, with peak transport each winter, but little of the long-term decline seen further to the north.
The temperature partitioning emphasizes a sharp contrast between 53 and 56∘ N. Almost all transport at 53∘ N is in temperature classes exceeding 11 ∘C at all times of the year, interrupted by occasional cold pulses. Transports across 56–58∘ N are dominated by temperature classes below 11 ∘C, with transports of water warmer than 11 ∘C restricted to late summer and early autumn in most years, when this water can briefly account for the majority of transport. On the longer timescale, this fractional contribution of warm water to Slope Current transport across 56–58∘ N is relatively steady, in spite of the decline in total transport. We can therefore deduce that the weaker transport in later years is warmer. This is the same as we observed in the eastward transports from the subpolar North Atlantic in Fig. 5.
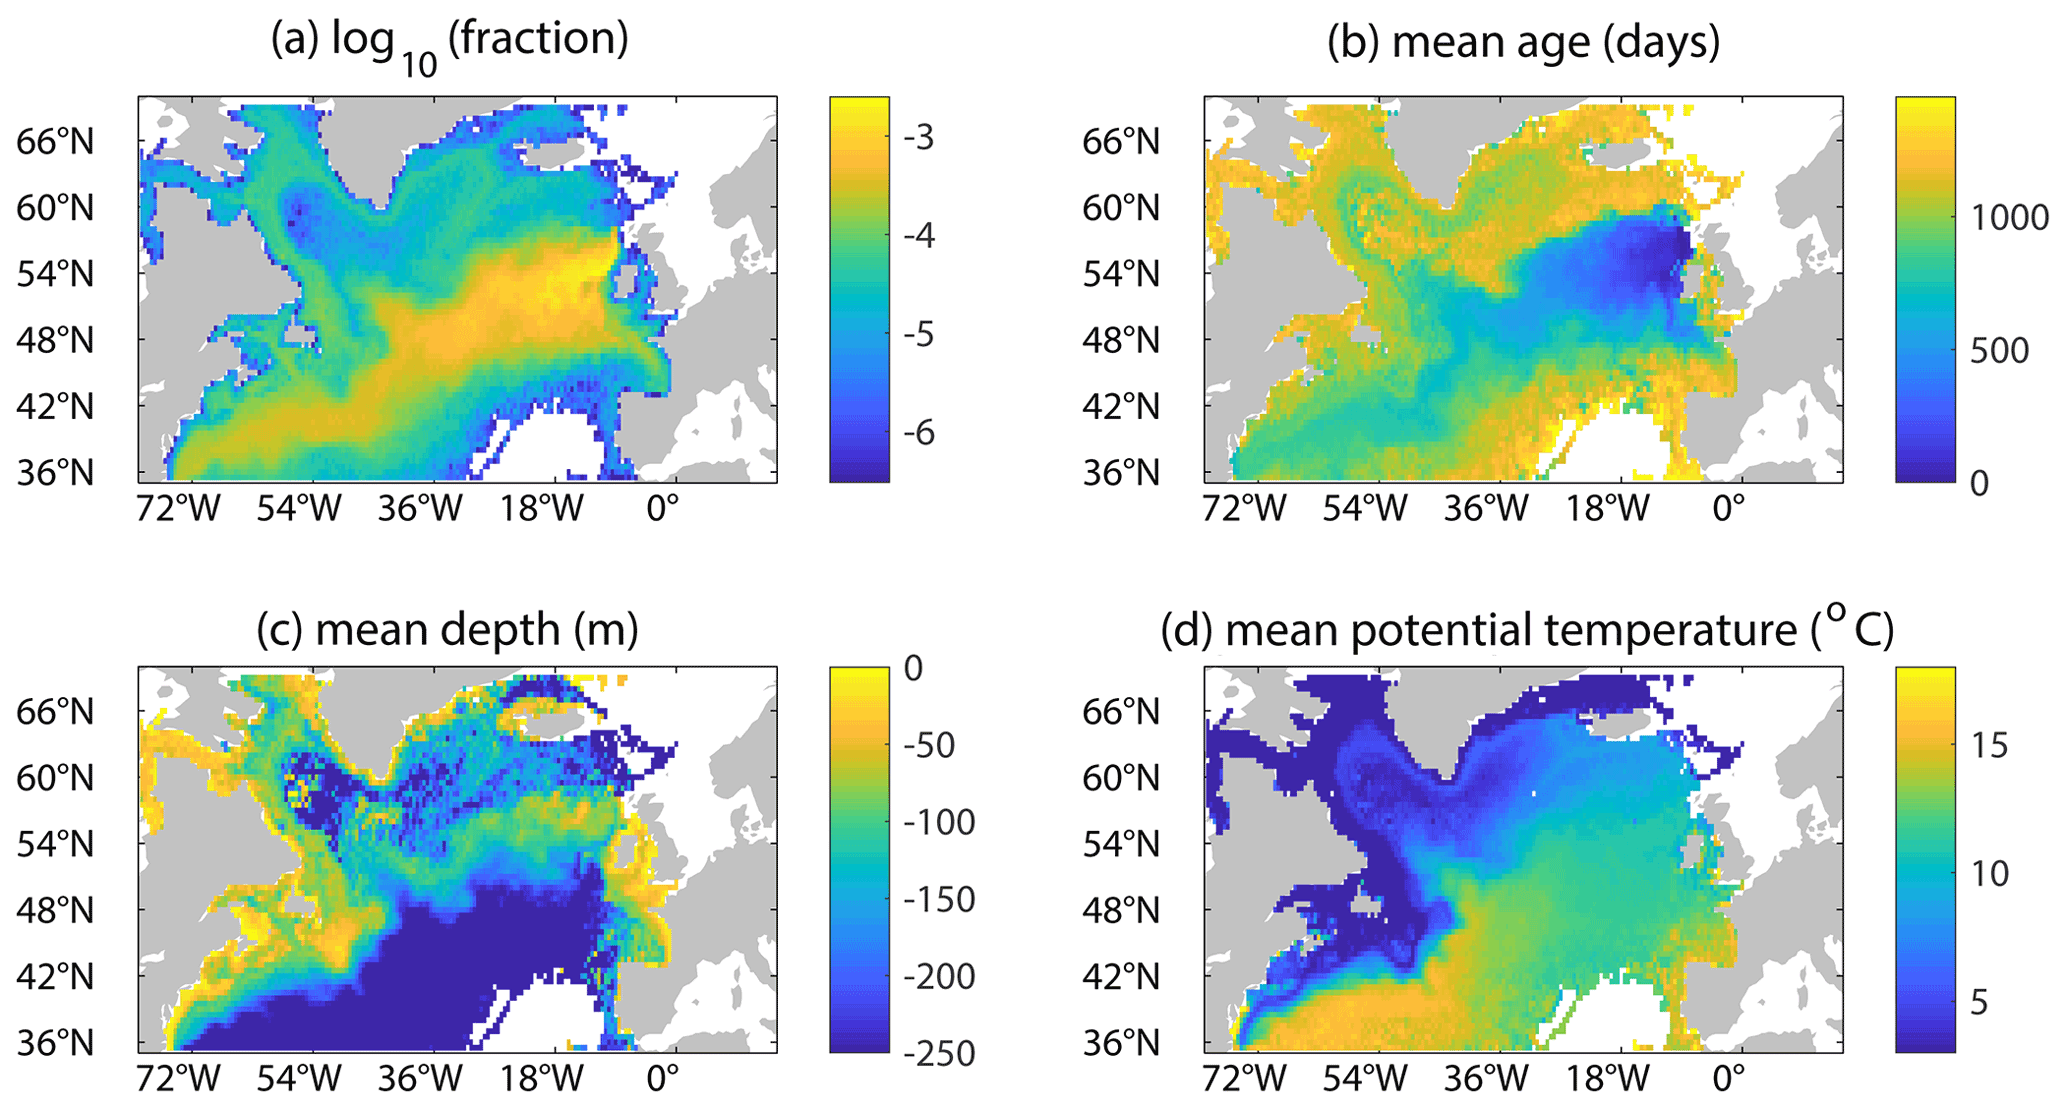
Figure 9Ensemble mean particle statistics for the 1992–88 ARIANE hindcast: (a) log 10 fraction of total particles; (b) mean age in days; (c) mean depth in metres; (d) mean potential temperature in ∘C.
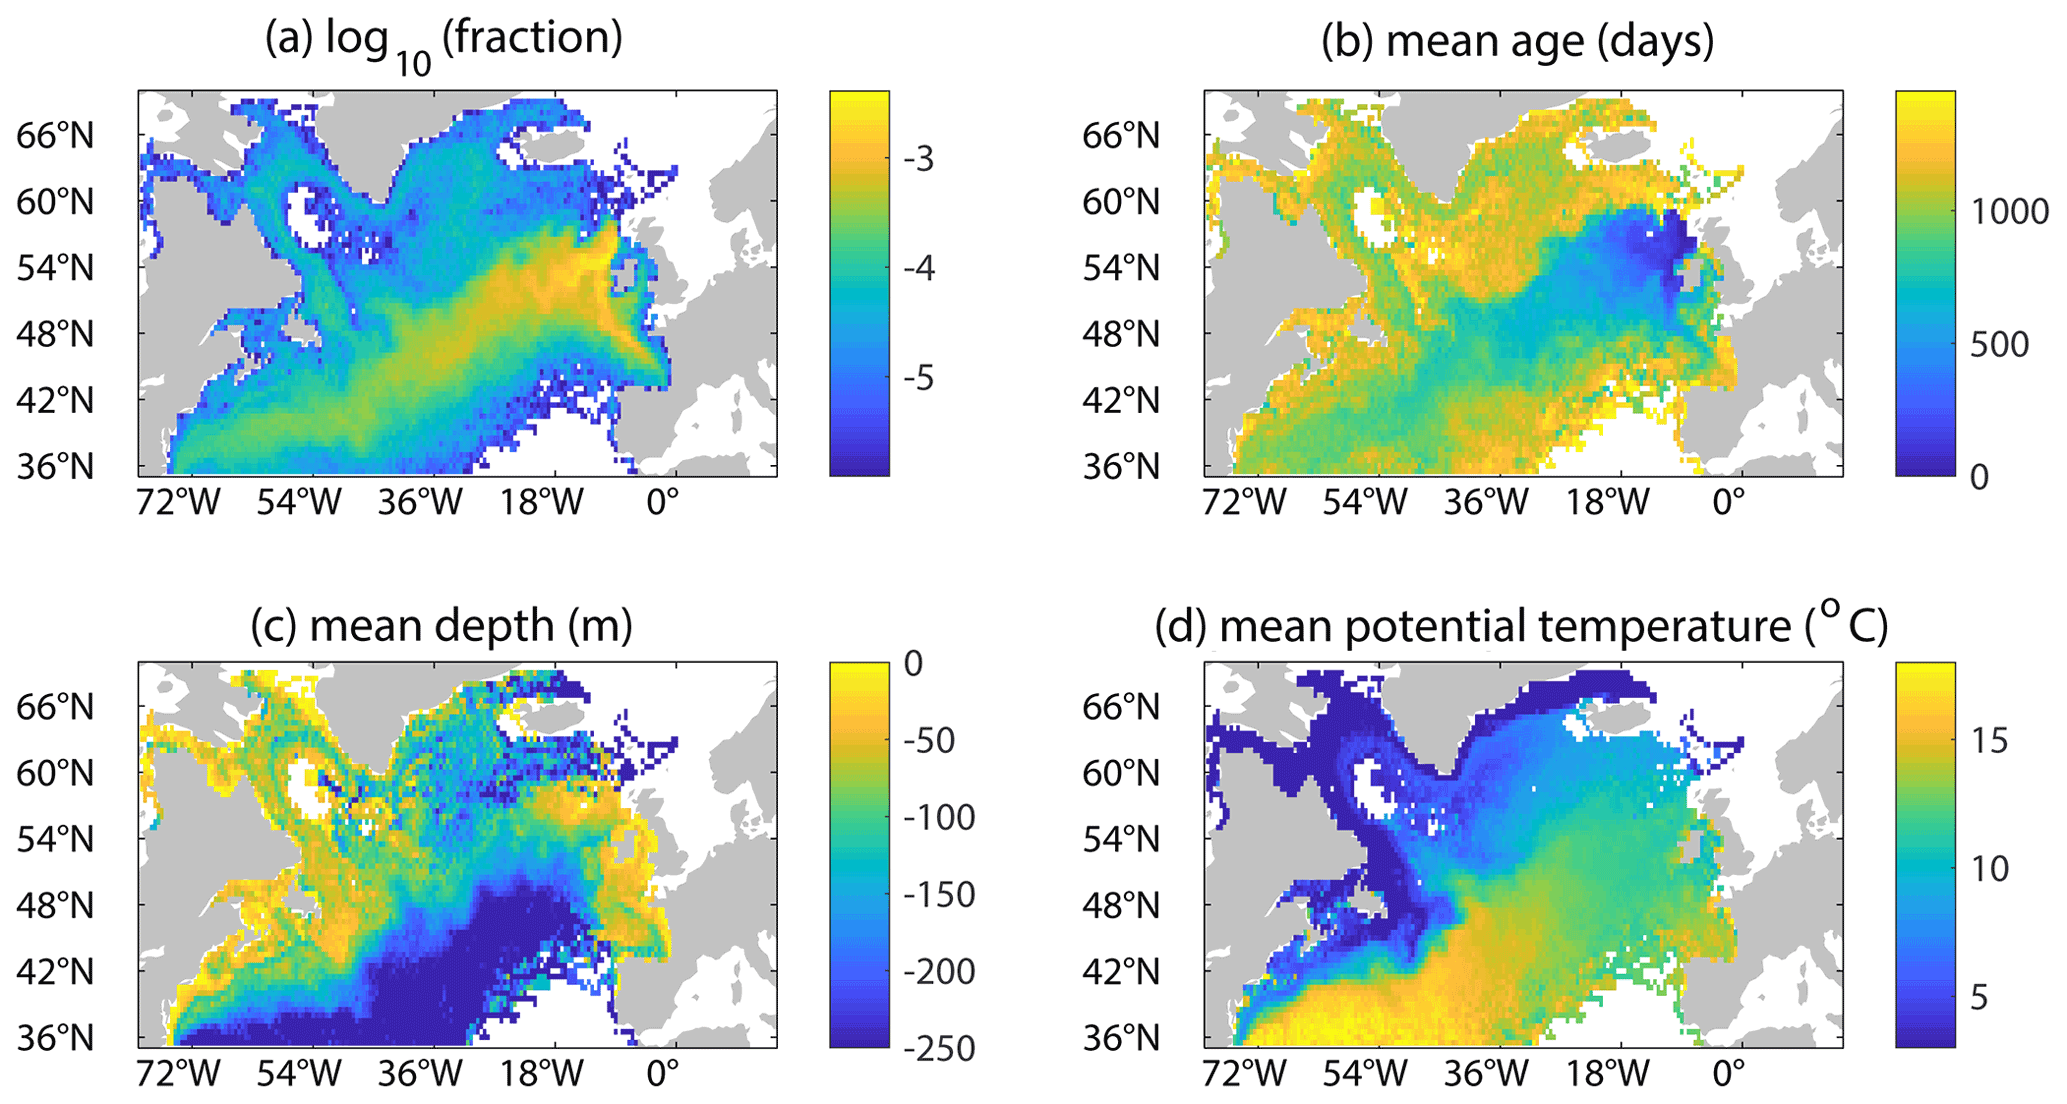
Figure 10Ensemble mean particle statistics for the 2010–06 ARIANE hindcast: (a) log 10 fraction of total particles; (b) mean age in days; (c) mean depth in metres; (d) mean potential temperature in ∘C.
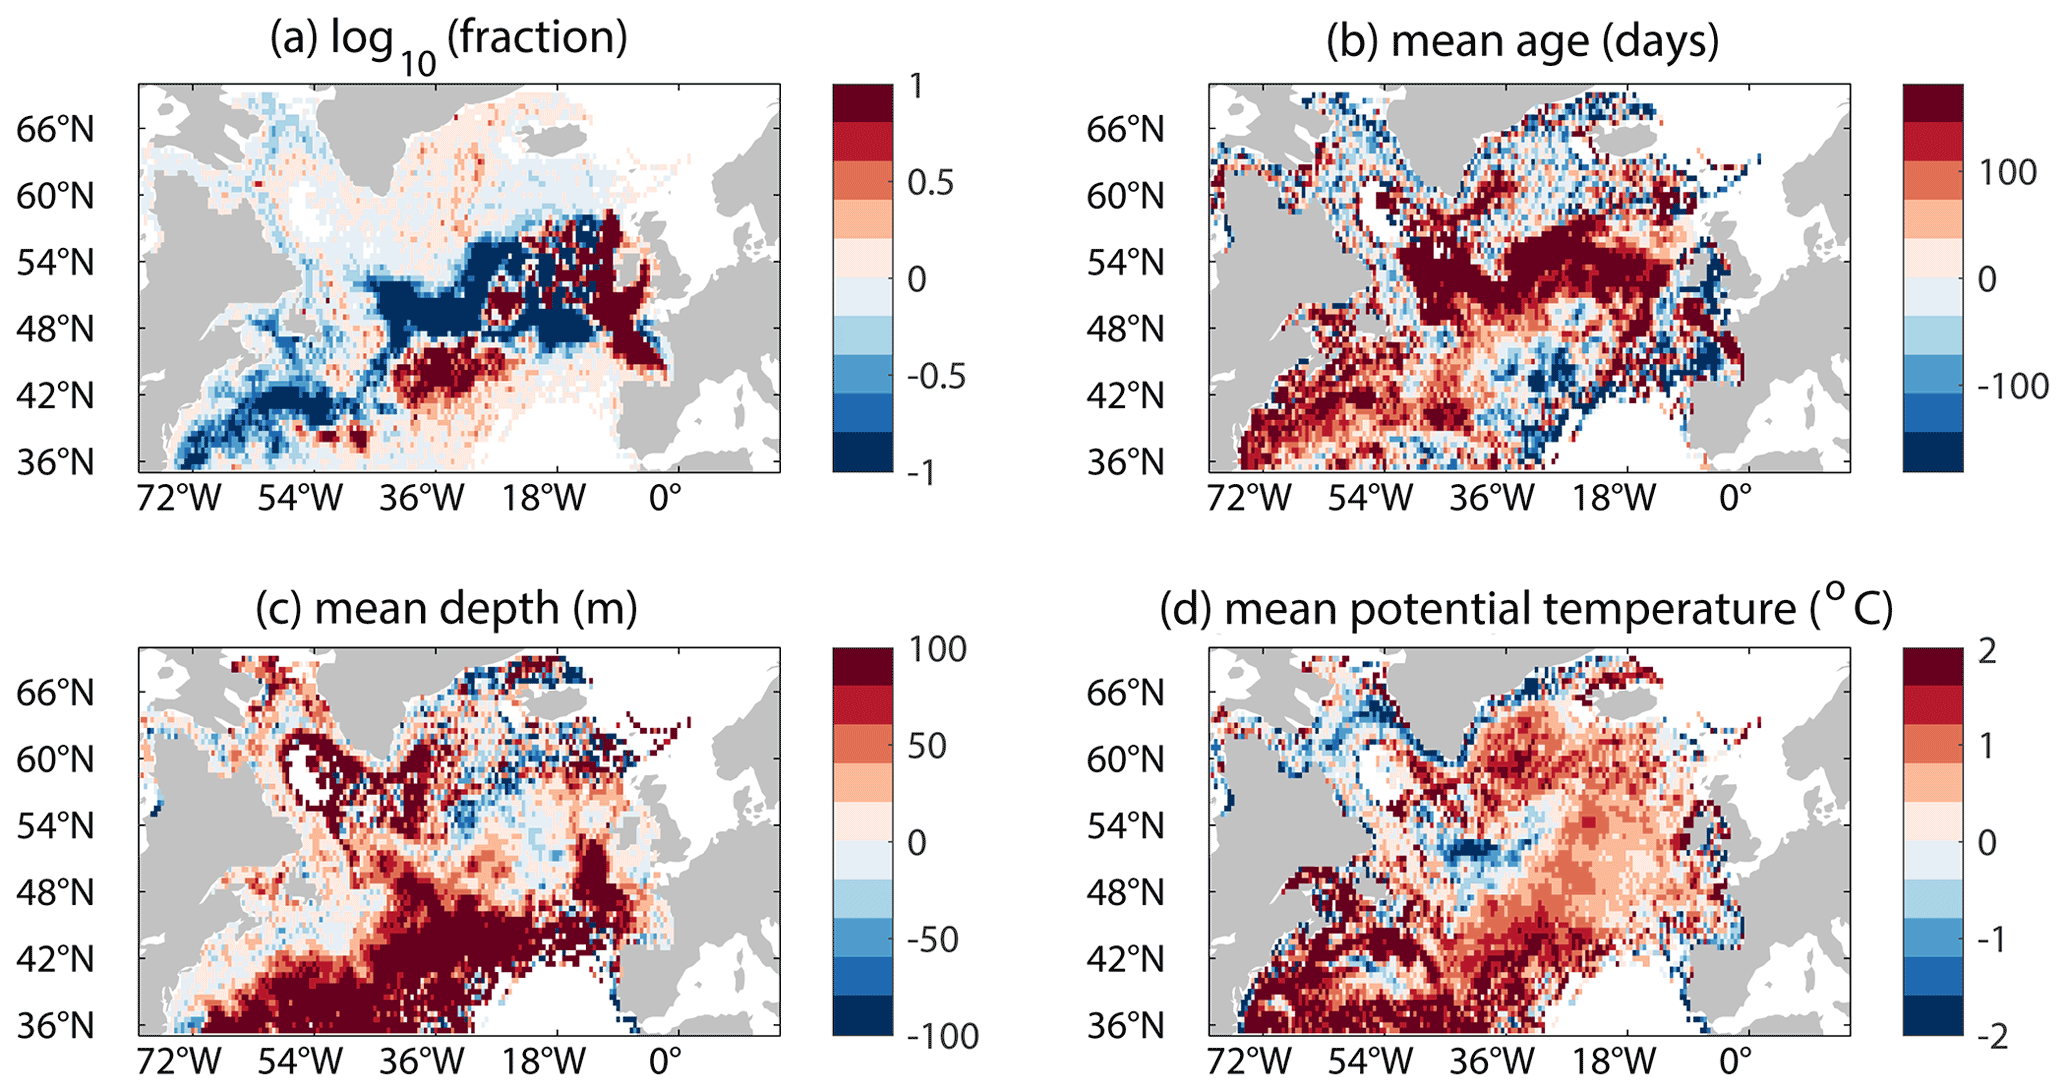
Figure 11Difference between the ensemble mean statistical analyses of the ARIANE 4-year hindcasts: (a) 2010 mean – 1992 mean log 10 fraction of total particles; (b) 2010 mean – 1992 mean age in days; (c) 2010 mean – 1992 mean depth in metres (positive indicates shallower); (d) 2010 mean – 1992 mean potential temperature in ∘C.
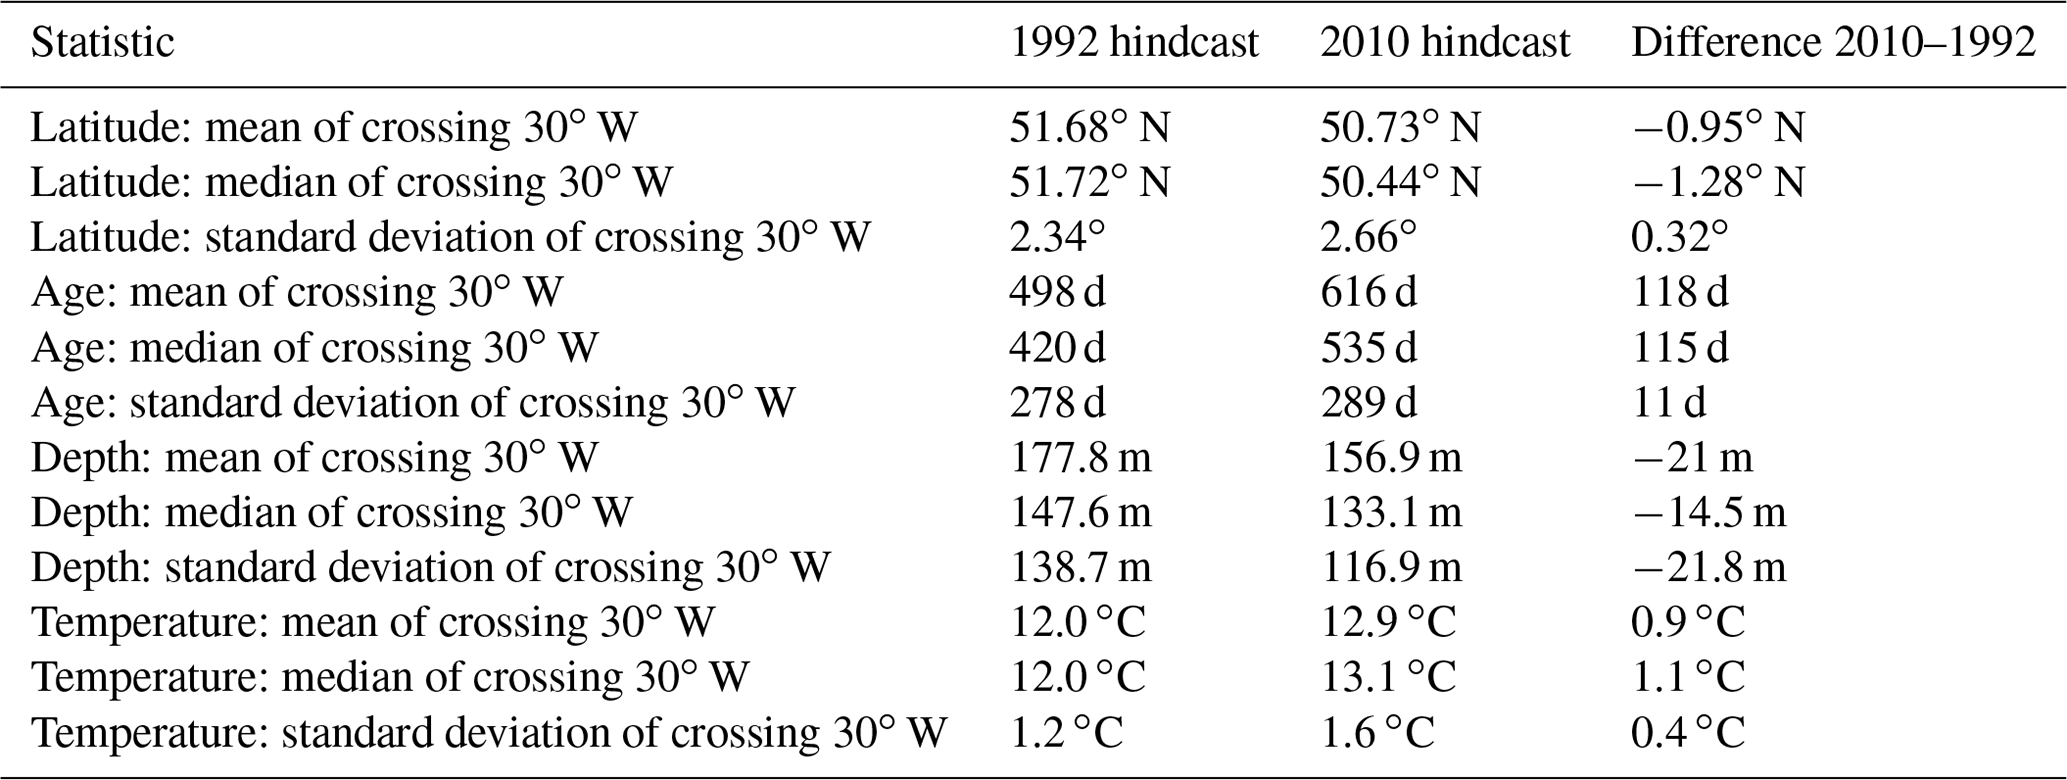
Table 1Simple statistics to assess the spread of and difference between the two ARIANE hindcasts.
To trace inflows to the Slope Current, Lagrangian 4-year hindcast experiments were run: releasing virtual water “particles” in 1992 and 2010 at the core of the Slope Current (see Sect. 2.4 for details). These dates were chosen to obtain the flow pathway of water towards the shelf edge before and after the 1997 regime shift as observed in the analysis of the GODAS data (as shown in Sect. 3.2) and noting the model trends in shelf-edge transport that were previously highlighted. Figure 11 shows the differences between the two ARIANE particle tracking 4-year hindcast experiments (Figs. 9 and 10): the ensemble mean output for 1992 was subtracted from the 2010 ensemble means. The output, specifically the fractional presence of particles (panel a in Figs. 9–11), shows a shift – comparing later to earlier backtracking – to a more southwesterly origin of particles ending up at the shelf edge. The vast majority of particles originate off the eastern coast of the United States, with the most followed pathway corresponding to the Gulf Stream and North Atlantic Current. This is also the fastest pathway, with particles off the US eastern seaboard having a mean age of ∼ 600 d (Table 1). A smaller fraction of particles can be traced back to the subpolar gyre. The later experiment also shows more influence of water traced to the Bay of Biscay. The mean particle depth subplots (Figs. 9c, 10c, and 11c) indicate that most particles originate from depths of approximately 100–150 m. Only outside the NAC and SPG pathway are particles traced to greater depths. The difference plot shows that overall, the 2010 hindcast saw particles become deeper by up to 100 m (Fig. 11c), particularly the particles of subtropical origin. Flows were slower by approximately 100 d, mainly when following the NAC pathway. Comparing 2010 to 1992, there has also been a considerable increase in upstream temperature (ranging from 1–2 ∘C) of particles arriving at the shelf edge. This is confirmed in the T−S analysis (Fig. 7) and in the summary statistics presented in Table 1.

Figure 12Histograms from the 1992 and 2010 hindcast showing the latitude and age of unique particles crossing 30∘ W for the first time (any further crossings are ignored): (a) 1992 particle latitude; (b) 1992 particle age; (c) 2010 particle latitude; (d) 2010 particle age; (e) latitude difference; (f) age difference. Positive difference means more particles in 2010. Data binned by 1∘ latitude and 30 d.
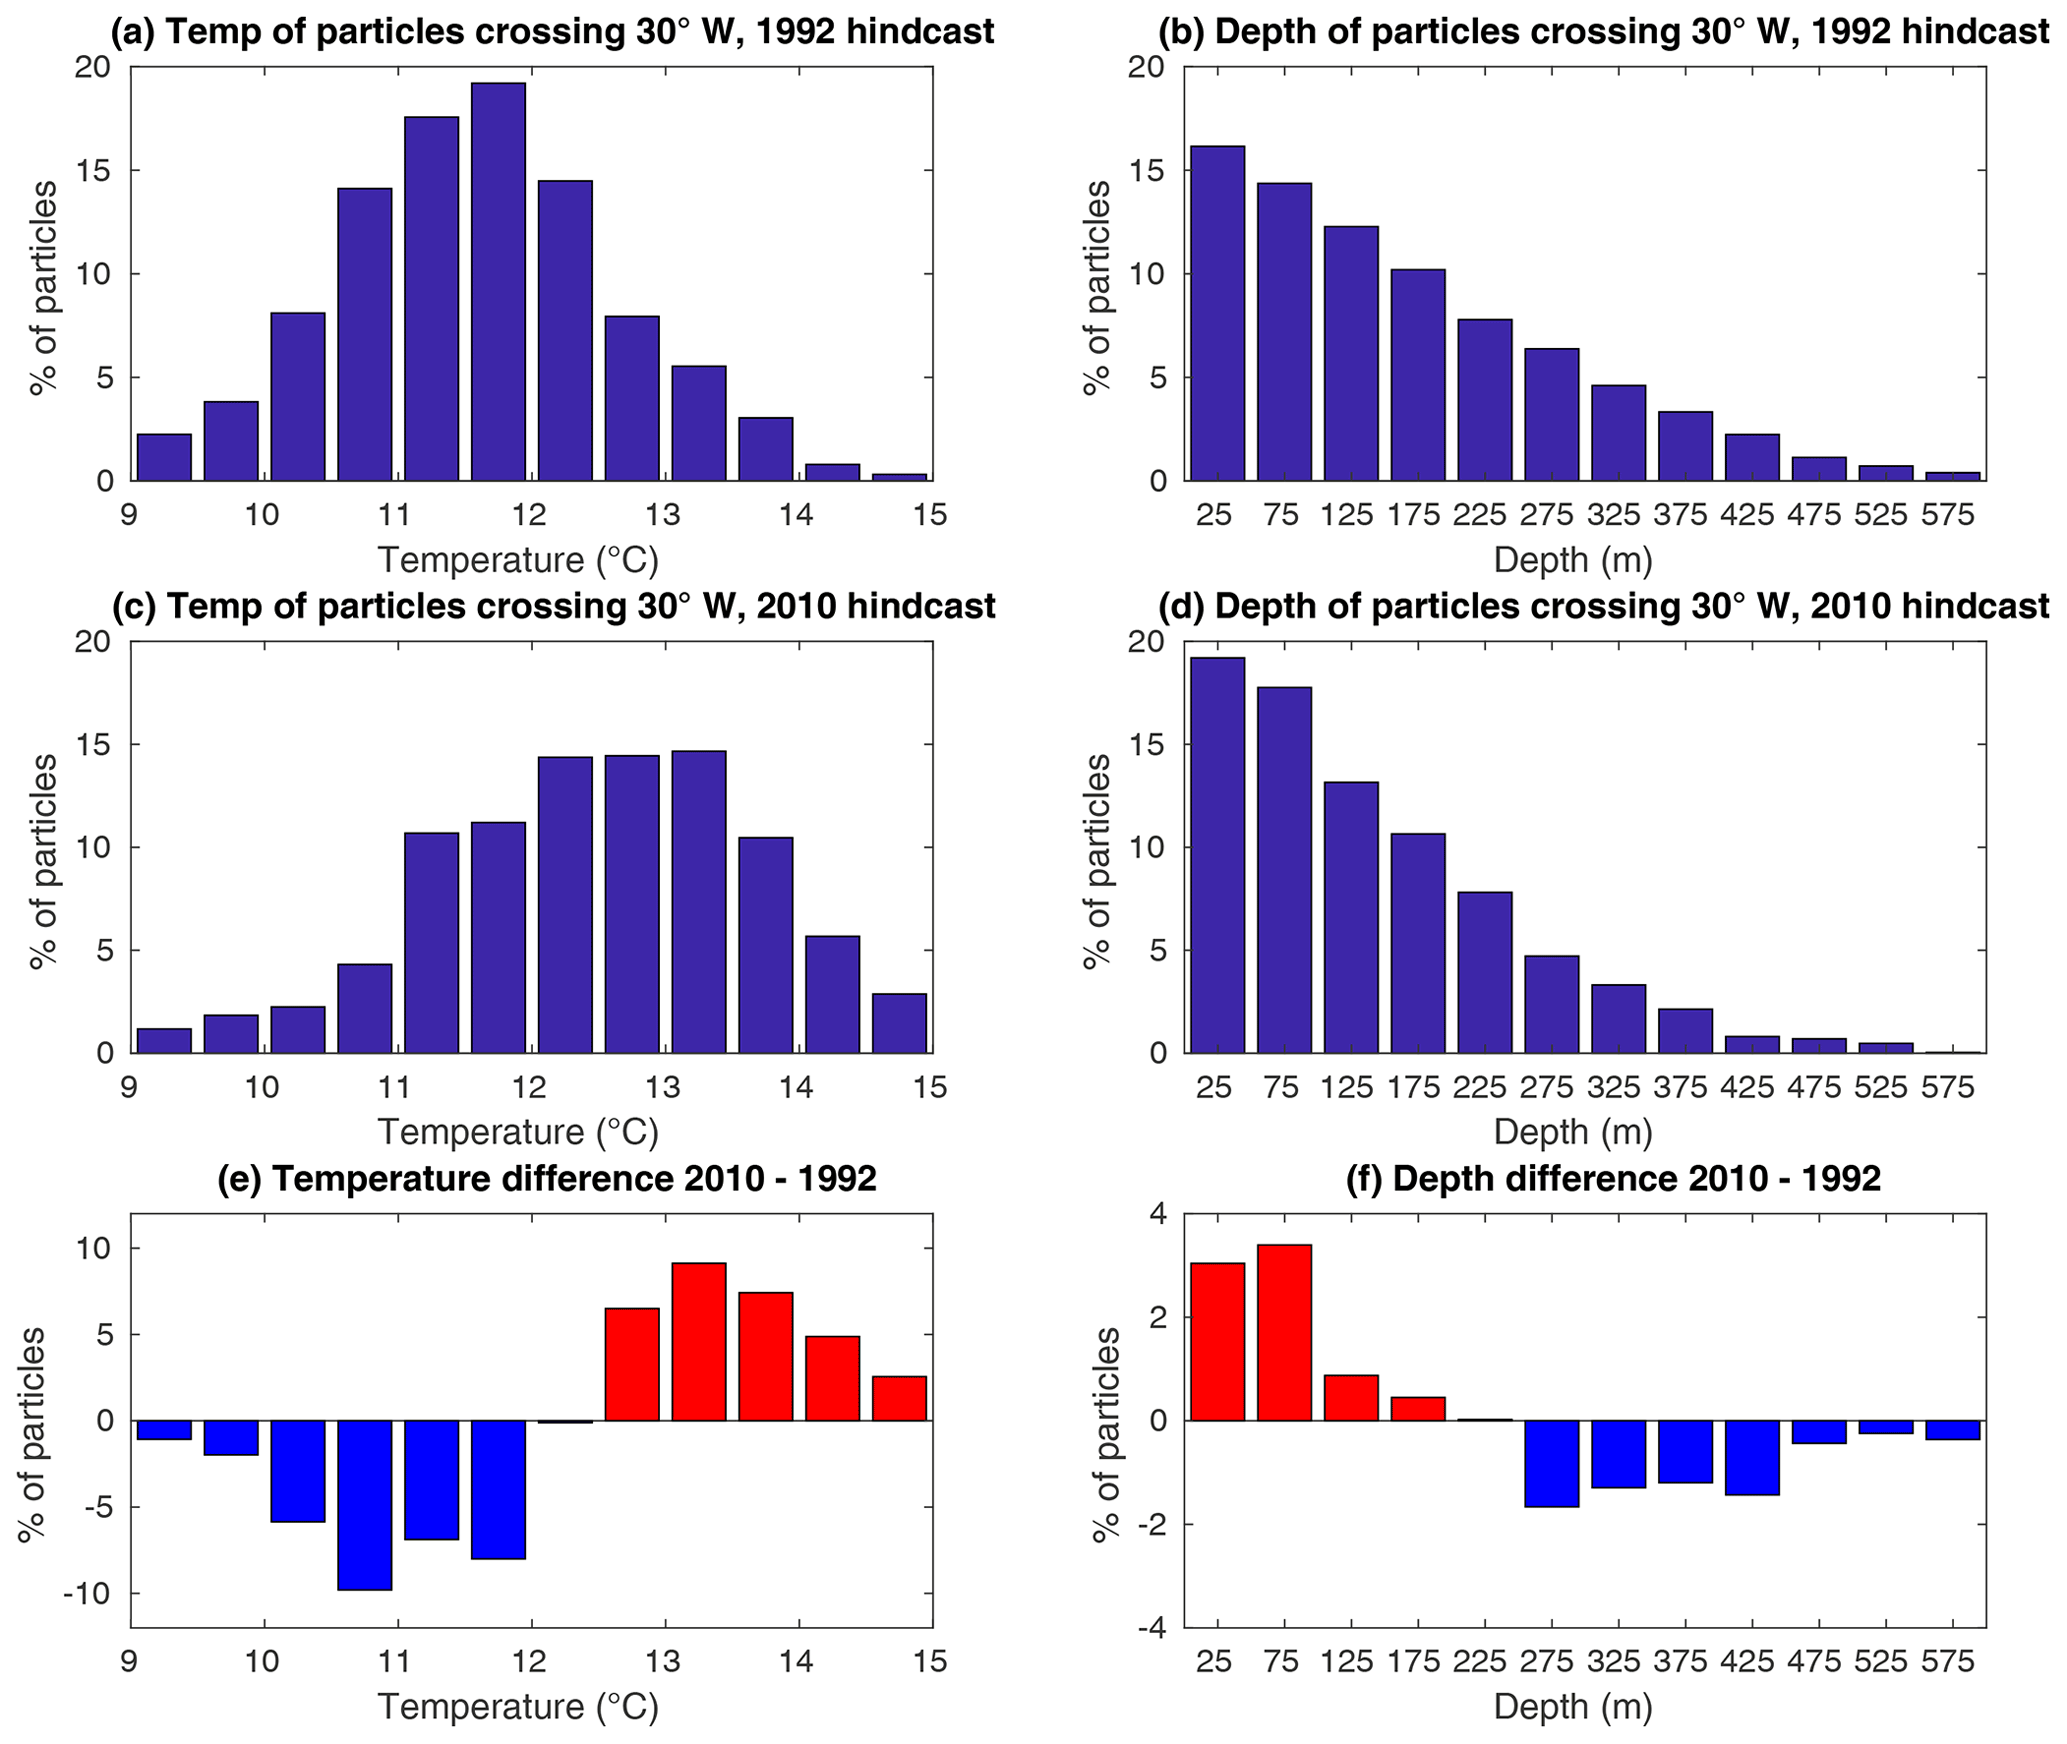
Figure 13Histograms from the 1992 and 2010 hindcast showing the temperature and depth of unique particles crossing 30∘ W for the first time (any further crossings are ignored): (a) 1992 particle temperature; (b) 1992 particle depth; (c) 2010 particle temperature; (d) 2010 particle depth; (e) temperature difference; (f) depth difference. Positive difference means more particles in 2010. Data binned by 0.5 ∘C temperature and 50 m depth.
We can track particles passing a selected meridian: 30∘ W is again chosen due to the high prevalence of particles crossing that longitude in both hindcasts. Figures 12 and 13 show histograms of the two hindcasts (1992 and 2010), where particles are tracked passing 30∘ W in the latitude range 40–60∘ N. Figure 12 shows the latitude (Fig. 12a for 1992, Fig. 12c for 2010) and time (particle age, Fig. 12b for 1992, Fig. 12d for 2010) at which they crossed. Figure 13 shows the temperature (Fig. 13a for 1992, Fig. 13c for 2010) at which they crossed, as well as the depth of crossing (Fig. 13b for 1992, Fig. 13d for 2010). Only the first crossing (since release of the hindcast) of 30∘ W is recorded in both figures. The latitude at which the particle first passes 30∘ W has shifted south overall, as shown in Fig. 12e. The statistics shown in Table 1 confirm this visual analysis, with the median shifting southward by 1.2∘. These observations are consistent with the long-term transport changes, both geostrophic and absolute (Fig. 5). Even more striking is the change in particle age (Fig. 12f). The 2010 hindcast shows a median slowdown of 115 d. This confirms the general pattern evident in the ensemble mean difference plot (Fig. 11). The latitude of its first crossing of 30∘ W shows a normal distribution in both hindcasts. However, the spread of the latitude at which the particles crossed increased by 0.32∘, as measured by standard deviation (Table 1). The spread of particle temperatures (Fig. 12e) and particle age (Fig. 12f) has also increased in the 2010 hindcast.
As determined in a wide range of previous studies, our results have confirmed that the North Atlantic is warming and transport is changing over a decadal timescale, despite being highly variable interannually and spatially. We first discuss the evidence for physical and dynamical changes in the North Atlantic and associated changes in the Slope Current, followed by consideration of the potential implications of these changes.
4.1 Variable hydrography and transport
A total of 4 decades of GODAS data have shown that the hydrography of the North Atlantic has changed considerably. Variation in density anomaly appears to be influenced more by temperature change than salinity due to the close inverse relationship between temperature and density anomalies (not shown). Until recently, the subpolar gyre was subject to long-term warming that began around 1997. In the mid-2010s, the re-establishment of positive density anomalies was associated with dramatic cooling in the SPG region, with the core centred at 40∘ W, 47∘ N. This is largely associated with extensive cooling of the SPG from 2013–2015, which saw anomalies of up to −2.5 ∘C extending to at least 600 m (Josey et al., 2018). This was then termed the “Big Blue Blob” (or “Cold Blob”) by some within the field and indeed the media (Mooney, 2015; Josey et al., 2018).
Associated with basin-scale changes in hydrography are anomalies at the eastern boundary, expressed in density along the continental slope. Plotting density anomalies in time and latitude (Fig. 4), there is meridional coherence of anomalies consistent with conveyance along the Slope Current pathway, although pulses of positive or negative anomaly appear to originate from the south and weaken poleward in some years. The early 2000s show a shift from an overall negative temperature anomaly to a positive anomaly (not shown), consistent with the decadal mean anomaly maps in Fig. 2. Emphasizing the subtropical gyre as a driver of interannual variability, although restricted to analysis over 1992–2002, Pingree (2002) finds that poleward flow at the eastern boundary is enhanced following winters when the NAO index was negative. In contrast, we find here that Slope Current variability on a longer timescale is attributed to changes in the subpolar gyre that drive variations in mid-latitude flows towards the eastern boundary.
Examining large-scale inflow towards the eastern boundary, geostrophic and total eastward transport estimates obtained with GODAS (Fig. 5) show an overall decline in transport of approximately 5 Sv throughout the time series. This variability is clearly associated with changes in density and cannot be directly attributed to wind forcing (from Sverdrup balance). Partitioning water warmer or cooler than 11 ∘C, we identify an increase in warm-water (southern) inputs to the Slope Current since the late 1990s. This has been observed in the transport calculations as well as the ARIANE particle tracking (Figs. 9–11). The particle tracking calculations provide evidence of a southward shift of water feeding into the Slope Current over the past 3 decades by nearly 1∘ of latitude (Fig. 11). This is consistent with the observed southward transport shifts seen in the SPG region (Figs. 5 and 6). Pulses of water near the shelf edge have been observed before: transport anomalies of +4 Sv were observed through the Rockall Trough, corresponding to periods of increasing Atlantic input to the North Sea (Holliday and Reid, 2001). Plotting GODAS transports in T–S space (Fig. 7) confirms the shift towards warmer (and more saline) transports. A warming and more saline trend has previously been observed for shelf-edge flows (Berx et al., 2013), although at the time the authors did not determine any trends in volume transport.
Our results have shown that density-gradient-driven transport (Fig. 5a) correlates strongly with northward transport at the shelf edge, and we conclude that this is the main driver of variability in Slope Current flows. Whilst wind stress and associated Ekman transport are significant in forcing local short-term shelf-edge and North Sea transport (Pätsch et al., 2020), there is no evidence for a long-term trend in either Sverdrup or Ekman transport. That SSH gradient anomalies closely resemble those in eastward transport time series is consistent with the steric effect of density anomalies. Principal component analysis of SSH has accordingly been used as an index of the subpolar gyre strength (Hátún and Chafik, 2018).
4.2 Implications of the observed changes on the Slope Current and European shelf seas
Changes in the meridional density gradient across the mid-latitude North Atlantic drive changes in geostrophic eastward transport that subsequently feeds the shelf-edge northward flow (Marsh et al., 2017). Corresponding changes in the strength and properties of the Slope Current are likely to reverberate downstream. Expansion and contraction of the subpolar gyre have already been shown to be correlated with salinity variations on an interannual and decadal timescale in the northern North Sea, strongly linked to pulses in nutrient availability, with a lag of approximately 2 years (Pätsch et al., 2020; Hátún et al., 2021, 2017; Jacobsen et al., 2019). Nitrate and phosphate fluxes in the North Sea have been linked to the local and regional wind fluxes (Pätsch et al., 2020). The SPG has been proposed as a regulator of silicate concentrations on the central Faroe shelf (Pätsch et al., 2020). In support of this, we emphasize the strong link established here between eastward transport indices in the subpolar North Atlantic (Figs. 5 and 6) and northward transport at the shelf edge (Fig. 8).
The Slope Current acts to convey water with distinct Atlantic temperature and salinity, as well as nutrients from the northeastern Atlantic along the shelf edge and eventually into the North Sea (Reid et al., 2003; Porter et al., 2018). Water from the Slope Current is also upwelled to the surface and transferred to the shelf seas in the Whittard Canyon southwest of Ireland (Porter et al., 2016). The amount of cross-shelf exchange varies seasonally and interannually and can switch to a downwelling mode depending on the strength and direction of Slope Current flow (Porter et al., 2016). This provides an important mechanism for drawing nutrients such as nitrate, phosphate, and silicate from deeper flows onto the shelf (Porter et al., 2016), making them available for biological consumption. Changes in the Slope Current may consequently impact downstream ecosystems through a number of mechanisms. There is growing evidence that recent warming trends have impacted shelf-sea species distributions, leading to subtropicalization of the North Sea: warmer-water species of zooplankton and fish species have been observed (and in some cases, now breeding) in UK coastal waters (Montero-Serra et al., 2015; Beaugrand et al., 2009; Beare et al., 2004). Not only is the species distribution being altered, but the warmer water is also physically affecting fish such as cod with “heat-induced hyperglycaemia”, and water oxygen saturation is decreased with the warming water (Beaugrand et al., 2008). With up to 40 % of Slope Current flow destined for the North Sea (Marsh et al., 2017), changes to the provenance and properties of the current could have profound effects on the state of the northern North Sea in particular and may provide the conduit for the observed subtropicalization. Whilst the species shift has not been explored in this study, it clearly warrants further work to assess the significance for Slope Current variability on North Sea inputs and ecology.
We have shown that broad warming of the subpolar North Atlantic Ocean, with a mean of around 1 ∘C between our two study hindcasts (1992 and 2010), has acted to decrease the meridional density gradient of the region, leading to a general reduction and slowdown in geostrophic transport (by up to 10 Sv) feeding the Slope Current. More recent extreme cooling events of up to 2 ∘C have also been a major feature, but these have been relatively short-lived. Transport towards the shelf edge has been decreasing since 1995–1997, although some evidence exists of a slight recovery post-2015. It remains too early to tell if this recovery will persist. Shelf-edge northward transport, incorporating the Slope Current, shows a similar pattern of reduction but with a smaller magnitude of 2 Sv north of the Rockall Trough. This relationship supports the theory that a major input to the Slope Current is subpolar gyre water. There has been a gradual, sustained southward shift (of approximately 1∘ of latitude) in the water flowing to the shelf edge and being incorporated in the Slope Current. Backtracked from 1992 and 2010, transport times towards the shelf edge from 30∘ W have increased by an average of 118 d based on comparison between our two particle back-trajectory ensembles. The spreads (standard deviation) of particle latitudes, temperatures, ages, and depths at the time of crossing 30∘ W have all increased, which is associated with the weakening eastward flow from the subpolar North Atlantic.
There are yet unquantified implications of these changes, with particular focus on subtropicalization and nutrient inputs to the North Sea and the rest of the UK–European shelf. Quantifying the effects of the changing Atlantic inputs to the Slope Current and surrounding shelf seas will be examined in further work.
GODAS and NCEP data provided by the NOAA/OAR/ESRL PSD, Boulder, Colorado, USA, are freely available from their website at https://www.esrl.noaa.gov/psd/data/gridded/data.godas.html (NOAA, 2019). ARIANE Lagrangian particle tracking software was freely provided by Bruno Blanke and Nicolas Grima, Laboratoire de Physique des Océans, France. ORCA12 data are provided on request to the National Oceanography Centre, UK. Code used for data analysis and plotting in this project is available via the public repository service Zenodo at https://doi.org/10.5281/zenodo.6415360 (Clark et al., 2022). Data analysis and plotting of Figs. 1–8 were performed using Python 2.7 in a Spyder environment (environment file is provided in the Zenodo repository). Figures 9–13 use MATLAB script coded in MATLAB 2017a.
MC performed the bulk of the data analysis, including running of the ARIANE Lagrangian particle tracking hindcast experiments. MC also wrote this paper. RM provided Fortran code to compile an “initial positions” file to seed particles at the shelf edge proportional to the northward transport, as described in the “Dataset and methods” section. RM also provided the Fortran code for calculation of Sverdrup monthly and annual transport. JH provided assistance with Python coding issues, particularly in the analysis of ORCA12 and ARIANE output. Both RM and JH provided editorial assistance in the writing and peer review of this work.
The contact author has declared that neither they nor their co-authors have any competing interests.
Publisher's note: Copernicus Publications remains neutral with regard to jurisdictional claims in published maps and institutional affiliations.
We would like to thank the National Oceanography Centre for the use of their computer systems and allowing access to the ORCA12 model outputs. Thanks also to the Science and Technology Facilities Council (STFC) and the Centre for Environmental Data Analysis (CEDA) for allowing access to the JASMIN computer systems. Finally, we wish to thank our reviewers, Hjálmar Hátún and an anonymous second reviewer, for their constructive comments on our paper.
This research has been supported by the UK Research and Innovation, Natural Environment Research Council (grant no. NE/L002531/1).
This paper was edited by Matthew Hecht and reviewed by Hjálmar Hátún and one anonymous referee.
Akimova, A., Núñez-Riboni, I., Kempf, A., and Taylor, M. H.: Spatially-Resolved Influence of Temperature and Salinity on Stock and Recruitment Variability of Commercially Important Fishes in the North Sea, PLOS ONE, 11, e0161917, https://doi.org/10.1371/journal.pone.0161917, 2016.
Beare, D. J., Burns, F., Greig, A., Jones, E. G., Peach, K., Kienzle, M., McKenzie, E., and Reid, D. G.: Long-term increases in prevalence of North Sea fishes having southern biogeographic affinities, Mar. Ecol.-Prog. Ser., 284, 269–278, https://doi.org/10.3354/meps284269, 2004.
Beaugrand, G.: The North Sea regime shift: evidence, causes, mechanisms and consequences, Prog. Oceanogr., 60, 245–262, https://doi.org/10.1016/j.pocean.2004.02.018, 2004.
Beaugrand, G., Edwards, M., Brander, K., Luczak, C., and Ibanez, F.: Causes and projections of abrupt climate-driven ecosystem shifts in the North Atlantic, Ecol. Lett., 11, 1157–1168, https://doi.org/10.1111/j.1461-0248.2008.01218.x, 2008.
Beaugrand, G., Luczak, C., and Edwards, M.: Rapid biogeographical plankton shifts in the North Atlantic Ocean, Glob. Change Biol., 15, 1790–1803, https://doi.org/10.1111/j.1365-2486.2009.01848.x, 2009.
Behringer, D. and Xue, Y.: Evaluation of the global ocean data assimilation system at NCEP: The Pacific Ocean, Eighth Symposium on Integrated Observing and Assimilation Systems for Atmosphere, Oceans and Land Surface, 1–6, AMS 84th Annual Meeting, Washington State Convention and Trade Center, 11–15 January 2004, Seattle, Washington, 2004.
Berx, B., Hansen, B., Østerhus, S., Larsen, K. M., Sherwin, T., and Jochumsen, K.: Combining in situ measurements and altimetry to estimate volume, heat and salt transport variability through the Faroe–Shetland Channel, Ocean Sci., 9, 639–654, https://doi.org/10.5194/os-9-639-2013, 2013.
Blanke, B. and Raynaud, S.: Kinematics of the Pacific Equatorial Undercurrent: An Eulerian and Lagrangian approach from GCM results, J. Phys. Oceanogr., 27, 1038–1053, https://doi.org/10.1175/1520-0485(1997)027<1038:Kotpeu>2.0.Co;2, 1997.
Clark, M., Marsh, R., and Harle, J.: Code for “Weakening and warming of the European Slope Current since the late 1990s attributed to basin-scale density changes”, v2.0.0, Zenodo [code], https://doi.org/10.5281/zenodo.6415360, 2022.
Duchez, A., Frajka-Williams, E., Josey, S. A., Evans, D. G., Grist, J. P., Marsh, R., McCarthy, G. D., Sinha, B., Berry, D. I., and Hirschi, J. J.-M.: Drivers of exceptionally cold North Atlantic Ocean temperatures and their link to the 2015 European heat wave, Environ. Res. Lett., 11, 1–19, https://doi.org/10.1088/1748-9326/11/7/074004, 2016.
Garcia-Soto, C., Pingree, R. D., and Valdes, L.: Navidad development in the southern Bay of Biscay: Climate change and swoddy structure from remote sensing and in situ measurements, J. Geophys. Res.-Oceans, 107, 3118, https://doi.org/10.1029/2001jc001012, 2002.
Hátún, H. and Chafik, L.: On the Recent Ambiguity of the North Atlantic Subpolar Gyre Index, J. Geophys. Res.-Oceans, 123, 5072–5076, https://doi.org/10.1029/2018jc014101, 2018.
Hátún, H., Sandø, A. B., Drange, H., Hansen, B., and Valdimarsson, H.: Influence of the Atlantic Subpolar Gyre on the Thermohaline Circulation, Science, 309, 1841–1844, https://doi.org/10.1126/science.1114777, 2005.
Hátún, H., Payne, M. R., Beaugrand, G., Reid, P. C., Sando, A. B., Drange, H., Hansen, B., Jacobsen, J. A., and Bloch, D.: Large bio-geographical shifts in the north-eastern Atlantic Ocean: From the subpolar gyre, via plankton, to blue whiting and pilot whales, Prog. Oceanogr., 80, 149–162, https://doi.org/10.1016/j.pocean.2009.03.001, 2009.
Hátún, H., Olsen, B., and Pacariz, S.: The Dynamics of the North Atlantic Subpolar Gyre Introduces Predictability to the Breeding Success of Kittiwakes, Frontiers in Marine Science, 4, 123, https://doi.org/10.3389/fmars.2017.00123, 2017.
Hátún, H., Larsen, K. M. H., Eliasen, S. K., and Mathis, M.: Major Nutrient Fronts in the Northeastern Atlantic: From the Subpolar Gyre to Adjacent Shelves, in: The Handbook of Environmental Chemistry, Springer Berlin Heidelberg, Berlin, Heidelberg, 1–45, https://doi.org/10.1007/698_2021_794 2021.
Holliday, N. P. and Reid, P. C.: Is there a connection between high transport of water through the Rockall Trough and ecological changes in the North Sea?, ICES J. Mar. Sci., 58, 270–274, https://doi.org/10.1006/jmsc.2000.1008, 2001.
Holliday, N. P., Bacon, S., Cunningham, S. A., Gary, S. F., Karstensen, J., King, B. A., Li, F., and Mcdonagh, E. L.: Subpolar North Atlantic Overturning and Gyre-Scale Circulation in the Summers of 2014 and 2016, J. Geophys. Res.-Oceans, 123, 4538–4559, https://doi.org/10.1029/2018jc013841, 2018.
Holliday, N. P., Bersch, M., Berx, B., Chafik, L., Cunningham, S., Florindo-López, C., Hátún, H., Johns, W., Josey, S. A., Larsen, K. M. H., Mulet, S., Oltmanns, M., Reverdin, G., Rossby, T., Thierry, V., Valdimarsson, H., and Yashayaev, I.: Ocean circulation causes the largest freshening event for 120 years in eastern subpolar North Atlantic, Nature Commun., 11, 585, https://doi.org/10.1038/s41467-020-14474-y, 2020.
Holt, J., Wakelin, S., and Huthnance, J.: Down-welling circulation of the northwest European continental shelf: A driving mechanism for the continental shelf carbon pump, Geophys. Res. Lett., 36, L14602, https://doi.org/10.1029/2009GL038997, 2009.
Holt, J., Polton, J., Huthnance, J., Wakelin, S., O'Dea, E., Harle, J., Yool, A., Artioli, Y., Blackford, J., Siddorn, J., and Inall, M.: Climate-Driven Change in the North Atlantic and Arctic Oceans Can Greatly Reduce the Circulation of the North Sea, Geophys. Res. Lett., 45, 11827–11836, https://doi.org/10.1029/2018gl078878, 2018.
Huthnance, J. M., Holt, J. T., and Wakelin, S. L.: Deep ocean exchange with west-European shelf seas, Ocean Sci., 5, 621–634, https://doi.org/10.5194/os-5-621-2009, 2009.
IOC, SCOR, and IAPSO (Intergovernmental Oceanographic Commission; Scientific Committee on Oceanic Research; International Association for the Physical Sciences of the Oceans): The International thermodynamic equation of seawater – 2010: calculation and use of thermodynamic properties [includes corrections up to 31st October 2015], Paris, France, UNESCO, 196 pp., Intergovernmental Oceanographic Commission Manuals and Guides, 56, https://doi.org/10.25607/OBP-1338, 2015.
Jacobsen, S., Gaard, E., Hátún, H., Steingrund, P., Larsen, K. M. H., Reinert, J., Ólafsdóttir, S. R., Poulsen, M., and Vang, H. B. M.: Environmentally Driven Ecological Fluctuations on the Faroe Shelf Revealed by Fish Juvenile Surveys, Frontiers in Marine Science, 6, 559, https://doi.org/10.3389/fmars.2019.00559, 2019.
Johnson, C., Inall, M., and Hakkinen, S.: Declining nutrient concentrations in the northeast Atlantic as a result of a weakening Subpolar Gyre, Deep-Sea Res. Pt. I, 82, 95–107, https://doi.org/10.1016/j.dsr.2013.08.007, 2013.
Josey, S. A., Hirschi, J. J. M., Sinha, B., Duchez, A., Grist, J. P., and Marsh, R.: The Recent Atlantic Cold Anomaly: Causes, Consequences, and Related Phenomena, Annu. Rev. Mar. Sci., 10, 475–501, https://doi.org/10.1146/annurev-marine-121916-063102, 2018.
Kalnay, E., Kanamitsu, M., Kistler, R., Collins, W., Deaven, D., Gandin, L., Iredell, M., Saha, S., White, G., Woollen, J., Zhu, Y., Chelliah, M., Ebisuzaki, W., Higgins, W., Janowiak, J., Mo, K. C., Ropelewski, C., Wang, J., Leetmaa, A., Reynolds, R., Jenne, R., and Joseph, D.: The NCEP/NCAR 40-Year Reanalysis Project, B. Am. Meteorol. Soc., 77, 437–472, https://doi.org/10.1175/1520-0477(1996)077<0437:Tnyrp>2.0.Co;2, 1996.
Koul, V., Schrum, C., Düsterhus, A., and Baehr, J.: Atlantic Inflow to the North Sea Modulated by the Subpolar Gyre in a Historical Simulation With MPI-ESM, J. Geophys. Res.-Oceans, 124, 1–20, https://doi.org/10.1029/2018JC014738, 2019.
Madec, G.: NEMO ocean engine, Note du Pole de modélisation, Institut Pierre-Simon Laplace (IPSL), Tech. Rep., France, 2015.
Marsh, R., Josey, S. A., de Cuevas, B. A., Redbourn, L. J., and Quartly, G. D.: Mechanisms for recent warming of the North Atlantic: Insights gained with an eddy-permitting model, J. Geophys. Res.-Oceans, 113, C04031, https://doi.org/10.1029/2007JC004096, 2008.
Marsh, R., Haigh, I. D., Cunningham, S. A., Inall, M. E., Porter, M., and Moat, B. I.: Large-scale forcing of the European Slope Current and associated inflows to the North Sea, Ocean Sci., 13, 315–335, https://doi.org/10.5194/os-13-315-2017, 2017.
Marzocchi, A., Hirschi, J. J.-M., Holliday, N. P., Cunningham, S. A., Blaker, A. T., and Coward, A. C.: The North Atlantic subpolar circulation in an eddy-resolving global ocean model, J. Marine Syst., 142, 126–143, https://doi.org/10.1016/j.jmarsys.2014.10.007, 2015.
Mathis, M., Elizalde, A., and Mikolajewicz, U.: The future regime of Atlantic nutrient supply to the Northwest European Shelf, J. Marine Syst., 189, 98–115, https://doi.org/10.1016/j.jmarsys.2018.10.002, 2019.
McCartney, M. S. and Talley, L. D.: The Subpolar Mode Water of the North Atlantic Ocean, J. Phys. Oceanogr., 12, 1169–1188, https://doi.org/10.1175/1520-0485(1982)012<1169:Tsmwot>2.0.Co;2, 1982.
McQuatters-Gollop, A., Raitsos, D. E., Edwards, M., Pradhan, Y., Mee, L. D., Lavender, S. J., and Attrill, M. J.: A long-term chlorophyll dataset reveals regime shift in North Sea phytoplankton biomass unconnected to nutrient levels, Limnol. Oceanogr., 52, 635–648, https://doi.org/10.4319/lo.2007.52.2.0635, 2007.
Montero-Serra, I., Edwards, M., and Genner, M. J.: Warming shelf seas drive the subtropicalization of European pelagic fish communities, Glob. Change Biol., 21, 144–153, https://doi.org/10.1111/gcb.12747, 2015.
Mooney, C.: Why some scientists are worried about a surprisingly cold `blob' in the North Atlantic Ocean, Washington Post, https://www.washingtonpost.com/news/energy-environment/wp/2015/09/24/why-some-scientists-are-worried-about-a-cold-blob-in-the-north-atlantic-ocean/, (last access: 1 March 2022), 2015.
Nishida, T., Kitakado, T., Matsuura, H., and Wang, S.-P.: Validation of the Global Ocean Data Assimilation System (GODAS) data in the NOAA National Centre for Environmental System (NCEP) by theory, comparative studies, applications and sea truth, IOTC 9th WPB meeting, Victoria, Seychelles, IOTC-2011-WPTT13-INF05, 1–18, 2011.
NOAA, E.S.R.L.: NCEP Global Ocean Data Assimilation System (GODAS) at NOAA ESRL/PSD, https://www.esrl.noaa.gov/psd/data/gridded/data.godas.html, last access: January 2019.
Pätsch, J., Gouretski, V., Hinrichs, I., and Koul, V.: Distinct Mechanisms Underlying Interannual to Decadal Variability of Observed Salinity and Nutrient Concentration in the Northern North Sea, J. Geophys. Res.-Oceans, 125, e2019JC015825, https://doi.org/10.1029/2019JC015825, 2020.
Pingree, R.: Ocean structure and climate (Eastern North Atlantic): in situ measurement and remote sensing (altimeter), J. Mar. Biol. Assoc. UK, 82, 681–707, https://doi.org/10.1017/S0025315402006082, 2002.
Porter, M., Inall, M. E., Hopkins, J., Palmer, M. R., Dale, A. C., Aleynik, D., Barth, J. A., Mahaffey, C., and Smeed, D. A.: Glider observations of enhanced deep water upwelling at a shelf break canyon: A mechanism for cross-slope carbon and nutrient exchange, J. Geophys. Res.-Oceans, 121, 7575–7588, https://doi.org/10.1002/2016JC012087, 2016.
Porter, M., Dale, A. C., Jones, S., Siemering, B., and Inall, M. E.: Cross-slope flow in the Atlantic Inflow Current driven by the on-shelf deflection of a slope current, Deep-Sea Res. Pt. I, 140, 173–185, https://doi.org/10.1016/j.dsr.2018.09.002, 2018.
Reid, P. C., Holliday, N. P., and Smyth, T. J.: Pulses in the eastern margin current and warmer water off the north west European shelf linked to North Sea ecosystem changes, Mar. Ecol. Prog. Ser., 215, 283–287, https://doi.org/10.3354/meps215283, 2001.
Reid, P. C., Edwards, M., Beaugrand, G., Skogen, M., and Stevens, D.: Periodic changes in the zooplankton of the North Sea during the twentieth century linked to oceanic inflow, Fish. Oceanogr., 12, 260–269, https://doi.org/10.1046/j.1365-2419.2003.00252.x, 2003.
Schmittner, A.: Decline of the marine ecosystem caused by a reduction in the Atlantic overturning circulation, Nature, 434, 628–633, https://doi.org/10.1038/nature03476, 2005.
Stebbing, A. R. D., Turk, S. M. D., Wheeler, A., and Clarke, K. R.: Immigration of southern fish species to south-west England linked to warming of the North Atlantic (1960-2001), J. Mar. Biol. Assoc. UK, 82, 177–180, https://doi.org/10.1017/S0025315402005325, 2002.
van der Kooij, J., Engelhard, G. H., and Righton, D. A.: Climate change and squid range expansion in the North Sea, J. Biogeogr., 43, 2285–2298, https://doi.org/10.1111/jbi.12847, 2016.
Xu, W. D., Miller, P. I., Quartly, G. D., and Pingree, R. D.: Seasonality and interannual variability of the European Slope Current from 20 years of altimeter data compared with in situ measurements, Remote Sens. Environ., 162, 196–207, https://doi.org/10.1016/j.rse.2015.02.008, 2015.