the Creative Commons Attribution 4.0 License.
the Creative Commons Attribution 4.0 License.
 | 28 May 2021
Modelling of discharges from Baltic Sea shipping
Jukka-Pekka Jalkanen
Lasse Johansson
Magda Wilewska-Bien
Lena Granhag
Erik Ytreberg
K. Martin Eriksson
Daniel Yngsell
Ida-Maja Hassellöv
Kerstin Magnusson
Urmas Raudsepp
Ilja Maljutenko
Hulda Winnes
Jana Moldanova
This paper describes the new developments of the Ship Traffic Emission Assessment Model (STEAM) which enable the modelling of pollutant discharges to water from ships. These include nutrients from black/grey water discharges as well as from food waste. Further, the modelling of contaminants in ballast, black, grey and scrubber water, bilge discharges, and stern tube oil leaks are also described as well as releases of contaminants from antifouling paints. Each of the discharges is regulated by different sections of the IMO MARPOL convention, and emission patterns of different pollution releases vary significantly. The discharge patterns and total amounts for the year 2012 in the Baltic Sea area are reported and open-loop SOx scrubbing effluent was found to be the second-largest pollutant stream by volume. The scrubber discharges have increased significantly in recent years, and their environmental impacts need to be investigated in detail.
- Article
(14539 KB) - Full-text XML
-
Supplement
(5594 KB) - BibTeX
- EndNote


Ship operations produce waste streams related to propulsion and engine operations as well as crew and passenger activities (Fig 1). The waste streams related to propulsion and engine operations include bilge water from the machinery spaces, stern tube oil from the lubrication of the propeller shaft, scrubber wash water from exhaust gas cleaning systems (EGCSs) for the reduction of emissions of sulfur oxides into the atmosphere, ballast water from maintaining ship stability, biocides used in antifouling paints to prevent hull growth, cooling water and tank cleaning residuals. Waste streams related to humans on board include food waste, black water (sewage), and water from galleys and showers (grey water) as well as other solid waste. Operational emissions and discharges from ships are regulated through international conventions, primarily the IMO MARPOL (The International Convention for the Prevention of Pollution from Ships of the International Maritime Organization) with its six annexes, the Ballast Water Management Convention (BWMC; IMO, 2018) and the Antifouling Systems Convention (IMO, 2001). These conventions regulate one “subsystem” at a time, such as bilge water production or scrubber wash water, but to assess the total impact from shipping on the marine environment it is essential to address the entire load of different stressors originating from different subsystem waste streams along with an assessment of the load of species reaching the marine environment through atmospheric deposition of the shipping air pollutants. In addition to the regulation of different subsystems, some sea areas are acknowledged as “special areas” in which, for recognised technical reasons in relation to their oceanographical and ecological condition and to their ship traffic, special rules are applied to prevent sea and air pollution. In general, the scientifically published data on the waste streams from ships are scarce, both in terms of production rates and constituents; most available data come from different types of reports (e.g. from classification societies: ABS, 2018; Furstenberg et al., 2009; national authorities: IMO, 2008a; intergovernmental organisations: HELCOM, 2014b, 2018a), which calls for a thorough discussion on data quality. In this paper available data on bilge water, stern tube oil, scrubber water, ballast water, antifouling paints, food waste, black water and grey water are collected and used to assess the input of different stressors from ships to the marine environment.
1.1 Discharge inventories
In order to proceed from an assessment of discharges from an individual ship to an assessment of the total discharge from shipping in a geographical area, it is necessary to combine the discharge factors with the activity patterns. This has previously been done for emissions to the atmosphere and underwater noise using automatic identification systems (AISs) with vessel technical details of the Baltic Sea fleet using the Ship Traffic Emission Assessment Model (STEAM3; Jalkanen et al., 2009, 2012, 2018; Johansson et al., 2013, 2017) and using alternative methods for various discharges in other sea areas (Ivče et al., 2020; Seebens et al., 2013). The use of observed vessel traffic through AISs allows a realistic description of vessel movements and facilitates studies of vessel-specific emissions which are modelled according to individual vessel features and operation. Previously, atmospheric emissions and underwater noise have been included in STEAM, but the current work extends the model capabilities to include discharges to water.
The international conventions that regulate the waste streams into water are also important for ship emission modelling work, which also needs to follow the requirements of the conventions in order to reflect real-world shipping as closely as possible. However, a strict application of international conventions in modelling work assumes that everyone follows the conventions, which may not always be the case (Beecken et al., 2014, 2015; Burgard and Bria, 2016; HELCOM, 2018b; Kattner et al., 2015). In contrast to air emissions, discharges do not necessarily occur at the same locations where they are generated because their release to the sea are governed by several rules and regulations. Further, some discharges are completely random and occur whenever various holding tanks on board are full, which makes modelling work challenging.
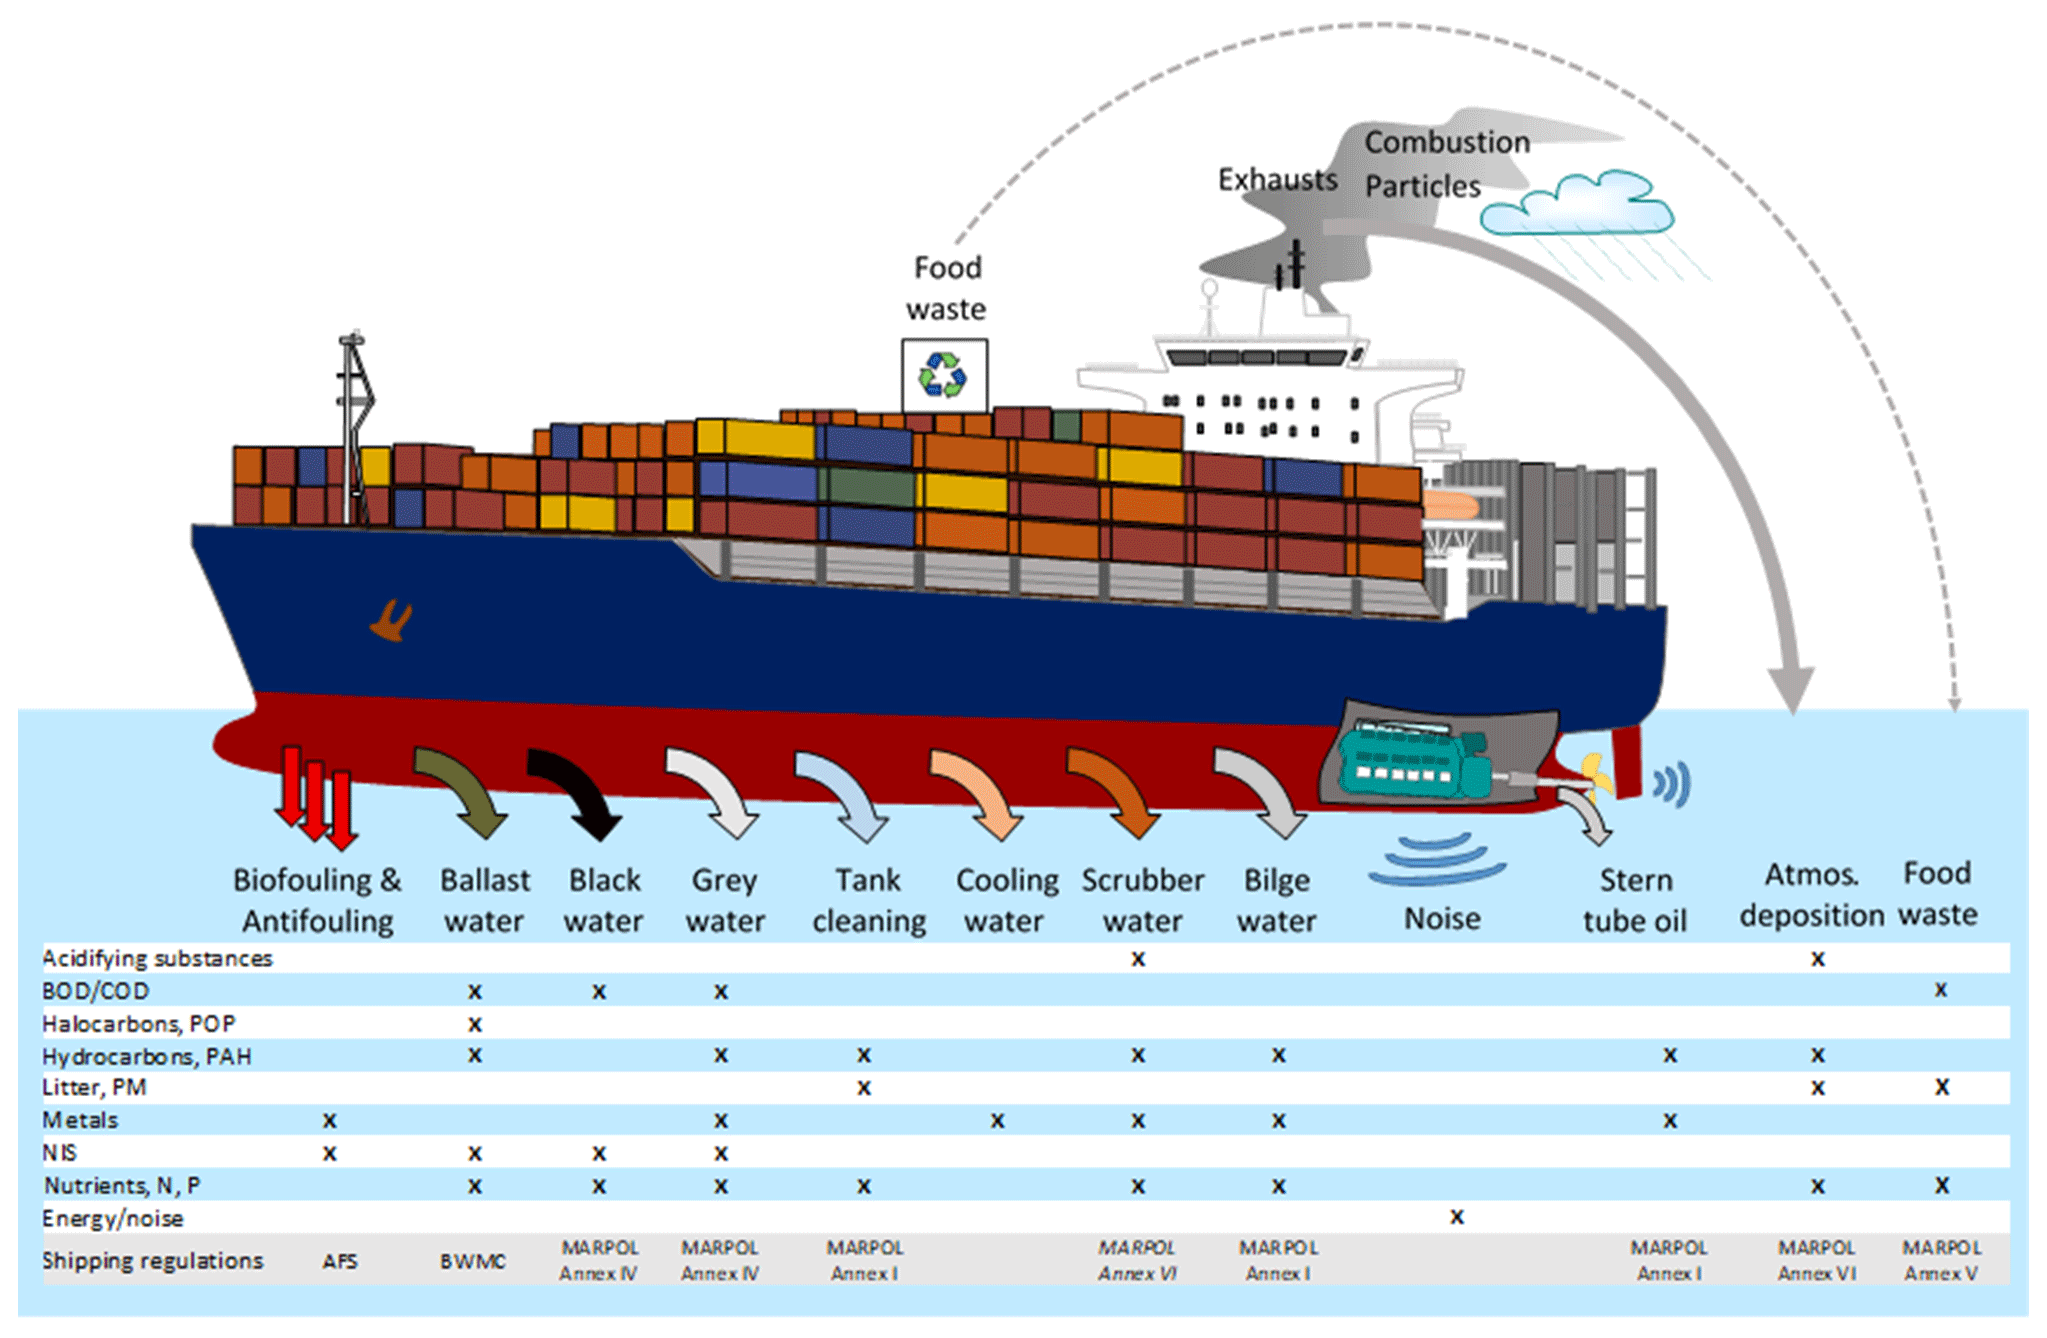
Figure 1Waste streams from ships and the constituents in terms of stressors on the marine environment. These releases are regulated through several international conventions, like the IMO MARPOL, Antifouling (AFS) and Ballast Water Management conventions (BWMC). Releases of excess energy (noise, heat, light) to the sea are not currently regulated.
Figure 1 contains an overview of various pollutant streams from ships as well as the regulatory references which are used to mitigate the environmental impacts of shipping. Various annexes of the IMO MARPOL convention deal with air and water pollution, but separate conventions exist for antifouling paints and ballast water. There are also unregulated environmental pressures. These include, e.g., various energy releases (noise, light, heat). Many of the existing regulations have been significantly tightened during the last decade when the shipping contribution to pollution has been quantified in detail. In the following sections, an overview of the contribution of various discharge streams is presented and relevant regulatory texts are introduced.
1.2 Bilge water
Bilge water accumulates in the lowest part of the ship. It has been referred to as “the mixture of water, oily fluids, lubricants and grease, cleaning fluids, and other waste that accumulate in the lowest part of a vessel from a variety of sources including engines (and other parts of the propulsion system), piping, and other mechanical and operational sources found throughout the machinery spaces of a vessel” (Albert and Danesi, 2011). The compounds in bilge water that are of primary concern are diesel fuel, glycol-based coolants, and engine, transmission and hydraulic oils. However, trace amounts of almost everything used on board ships can be found in bilge water (Stamper and Montgomery, 2008). Onboard treatment of bilge water is focused on the oil content, where the maximum allowed concentration to discharge according to MARPOL Annex I, is equal to 15 ppm. The release of bilge water to the sea is generally allowed everywhere if the IMO criterion is met, but some exceptions exist, like the Antarctic and coastal areas of Finland where any oily release to the sea is forbidden.
1.3 Stern tube oil
Another source of oil pollution from ships is the stern tube oil. The propeller shaft connects the main engine and the propeller through the stern tube which goes through the ship hull. The stern tube contains bearings, sealing and a lubrication system. Although there are water-lubricated propeller shafts on the market, the most commonly used (∼ 90 % of the market, Sengottuvel et al., 2017) lubrication is still oil-based and usually contains a large number of additives (Habereder et al., 2009) and seal-improving agents like teflon and bentonite. Modern large propellers can weigh over 100 t and push the propeller shaft downwards, leading to imperfect sealing and lubricant leakage, especially if propellers or shafts experience any damage from, e.g., metal fatigue, tangled fishing nets or ice. In December 2013, environmentally acceptable lubricants (EALs) became mandatory for large ships sailing near the American coastline, but compelling regulation of this kind is not currently applied to ships sailing the Baltic Sea. The main component of EALs is a biodegradable base, which is often vegetable oil, synthetic ester or polyalkylene glycol (US EPA, 2011a).
1.4 Scrubber wash water
Oil residues may also be present in scrubber wash water. Scrubbers are a type of EGCS used as an alternative to low-sulfur fuel to reduce ships' emissions of sulfur oxides (SOx) to the atmosphere, according to MARPOL Annex VI. Emissions of (SOx), nitrogen oxides (NOx), volatile organic compounds (VOCs) and particulate matter (PM) into the atmosphere from shipping are substantial on local, regional and global scales and are associated with large societal costs in terms of affected human health as well as environmental impact (Barregard et al., 2019; Brandt et al., 2013; Corbett et al., 2007; Endres et al., 2018; Hassellöv et al., 2013; Jonson et al., 2015; Liu et al., 2016; Sofiev et al., 2018). Since the late 1990s cost–benefit analyses of SOx emissions from shipping has motivated the establishment of SOx Emission Control Areas (SECAs), and in January 2020 new stricter global limits came into effect (IMO, 2016). The regulations limit the maximum allowed fuel sulfur content (0.1 % in SECA, 0.5 % elsewhere). As an alternative to meeting the stricter regulations, ships can install EGCSs (often referred to as wet SOx scrubbers) that clean the exhausts with a fine spray of seawater that is discharged back into the sea (open-loop scrubber) or a spray of recirculated freshwater with an added base (closed-loop scrubber). Wet hybrid scrubber systems also exist, which can alternate between open-loop and closed-loop modes. There are also some experimental setups of dry scrubbers, which use a granulated substrate to adsorb sulfur oxides. Wet scrubber installations are efficient in respect of the removal of SOx from the exhausts, but to some extent they also wash out other substances, like NOx, PM, polyaromatic hydrocarbons (PAHs) and metals (Turner et al., 2017; Winnes et al., 2020; Ytreberg et al., 2019). The long-term risks for the marine environment following large-scale use of wet scrubbers are not well understood today (Koski et al., 2017), yet there are an increasing number of reports arguing that scrubbers are moving an environmental impact from the atmosphere to the marine environment (IMO, 2019).
1.5 Ballast water
Ballast water on board ships is used to ensure vessel stability, a proper immersion of the propeller and optimal vessel trim. Very large quantities of ballast water can be transferred between different marine regions by dry- and liquid-cargo ships, which take in ballast water upon cargo discharge and empty their ballast tanks when cargo is loaded to the ship. Ballast water can also be exchanged during vessel transit to reduce the risk of introducing alien species with the vessel ballast from one area to another. Since shipping is present in all sea areas non-indigenous species (NISs) are transferred between ports regardless of differences in environmental conditions. Spreading of non-indigenous species is ranked as one of the worst threats to the marine environment by the IMO, yet it took 13 years to get the Ballast Water Management Convention (IMO, 2018) in place. The BWMC entered into force in September 2017 and requires ships to use approved ballast water treatment systems that neutralises the organisms in the ballast water tanks, ensuring that viable harmful NISs are not transferred between ports with the ballast water. The ballast water treatment systems use either physical measures, such as ultrasound or UV-light, or addition of chemicals to disinfect the water. The disinfection may also cause the formation of unintentionally produced by-products such as bromate (Werschkun et al., 2012).
1.6 Antifouling paints
The ballast water and vessel hull are the two main vectors for introducing NISs by ships. Submerged structures offer substrate for various sessile organisms such as algae, hydroids, barnacles and mussels that attach and grow on the surfaces, thereby increasing the roughness of the hull surface. Such increased roughness in turn increases drag and significantly affects the fuel consumption (Schultz, 2007) and may also affect the manoeuvring capability of a ship. To reduce this fuel penalty, secure manoeuvring capability and prevent spreading of NISs, the hull is coated with antifouling coatings that contain and release toxic compounds (biocides). Modern coatings use several techniques of self-polishing polymers, contact leaching systems and controlled depletion polymers. The antifouling substance that currently dominates the market is copper oxide (Amara et al., 2018). However, other substances are also used and in some coatings they are used as so-called booster biocides together with copper oxide (Yebra et al., 2004). Until 2007 it was allowed to use the toxic organometallic compound tributyltin (TBT) on ships, but following the adoption of the Antifouling Systems Convention, it was banned in 2008 (Champ, 2003). The first alarming reports regarding large-scale negative effects from TBT came from the seafood industry as French oyster farmers lost their harvests (Alzieu, 1991; Alzieu et al., 1986). TBT is especially harmful for molluscs, inducing pseudo-hermaphroditism and reproduction failure, and crustaceans, where TBT accumulates in fatty tissues.
1.7 Food waste and black and grey water
Discharge of food waste may cause an increased biological or chemical oxygen demand as the organic matter is degraded in the marine environment. It may also contribute to eutrophication through its nutrient content. According to IMO MARPOL Annex V (IMO, 2013), food waste can be released to the sea if the ship is outside a 12 nautical mile distance from the shore or if the waste is comminuted and passes through a 25 mm mesh and is released outside 3 nautical miles from the shore. In designated special areas, such as the Baltic Sea, all food waste must be comminuted or ground before discharge, including outside the 12 nautical mile range from the shore. Similarly, untreated sewage, or black water, produced on ships is only allowed to be discharged outside 12 nautical miles from the nearest land. Treated (disinfected) black water can be discharged outside 3 nautical miles, when the ship is en route at a speed of 4 knots or greater. Inefficient wastewater treatment may lead to bacterial and viral contamination of fisheries and a public health risk (Copeland, 2008)
In the Baltic Sea, currently the only special designated area for sewage, all discharge of sewage from passenger ships will require onboard treatment and disinfection prior to discharge. The regulations apply to newly built passenger ships as of 2019 and will apply to all passenger ships as of 2021. For direct passages between St. Petersburg (Russia) and the North Sea there is an extension until 1 June 2023. Grey water consists of drainage from dishwater, showers, laundry, baths and washbasins and is not yet regulated through the IMO. However, sometimes black and grey water waste streams are mixed in the same tank and then the regulations for black water apply. The release of garbage, which contributes to plastic pollution of the seas, is prohibited but is not included in the current work yet.
1.8 Aim
The aims of this study are to (a) expand the existing STEAM to include a description of environmental stressors of shipping discharges to the marine environment. This makes it possible to (b) construct inventories for ship discharges using the Baltic Sea as a case study area (Fig. 2).
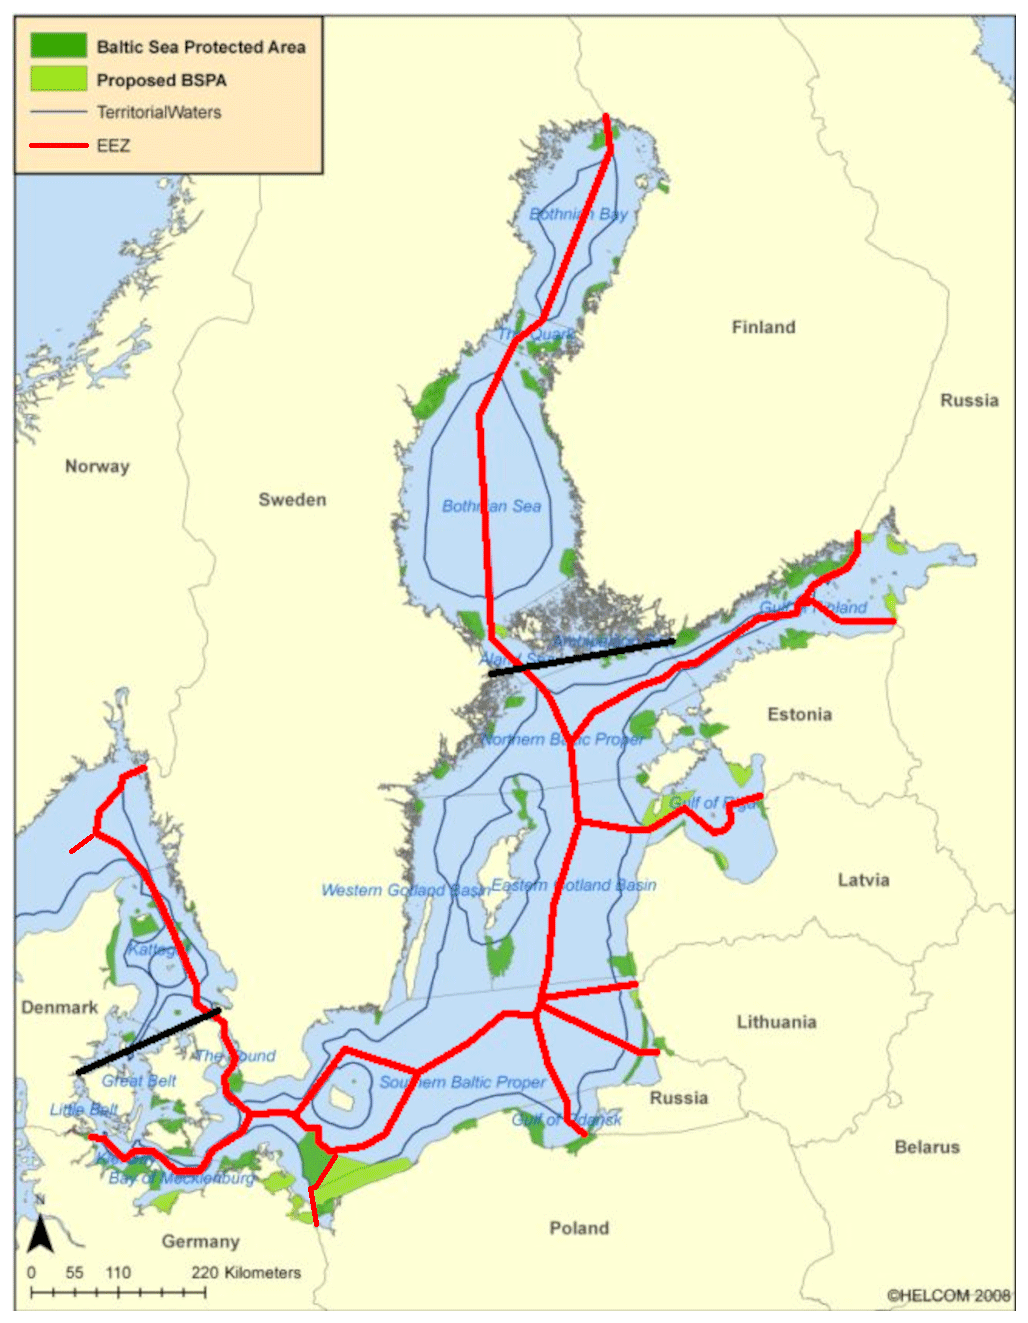
Figure 2The Baltic Sea and location of its sub-basins. The blue line shows the border of territorial waters (12 nautical miles) and the purple lines indicate the exclusive economic zones. Black thick lines show the boundaries between different areas used to define antifouling classes in Table 3. Green colour indicate existing (dark green) and proposed (light green) protected areas. Image from HELCOM, Baltic Sea protected areas map, 2008.
Currently, scattered studies exist for various discharges (Ivče et al., 2020; Seebens et al., 2013), but data which could be used to assess the environmental impact of shipping are scarce. The methodology introduced in this paper includes description of several key pollutant streams from ships. The long-term goal of this work is to (c) facilitate consecutive studies concerning air and water pollution, contaminants, and nutrients from ships to understand the contribution of ships in relation to other environmental stressors. Some of the recent work is already available for air and noise emissions (Jalkanen et al., 2018; Karasalo et al., 2017; Karl et al., 2019a; Raudsepp et al., 2019; Wilewska-bien et al., 2019), and regular annual reporting of discharges has been started together with the Baltic Sea countries. These efforts aim to (d) provide scientific background for future regulation or significant change in the existing conventions concerning shipping in the Baltic Sea region.
Total discharges of water pollutants from ships in the Baltic Sea area for the year 2012 were modelled using the Ship Traffic Emission Assessment Model (STEAM3; Jalkanen et al., 2009, 2012, 2018; Johansson et al., 2013, 2017). In the cases of bilge, stern tube oils and scrubber, ballast, black and grey water, the discharge or leakage volume was predicted by STEAM. In order to obtain the mass of a specific pollutant from these waste streams, a multiplication with pollutant water concentration is required. These can be obtained from laboratory analyses of water samples from ships; the values used in this work are given in the Supplement. Modelling the volumetric release of water from various sources facilitates the inclusion of many pollutants when used in conjunction with pollutant concentration data from water analysis. A literature review (see the Supplement) was conducted to characterise the concentrations of chemicals and nutrients in the different ship waste streams. The literature review included both scientific reports and reports from various other sources, e.g. EPA reports and IMO documents. When a specific compound was reported as “not detected” in the reports, 50 % of the limit of detection (LOD) or 50 % the limit of quantification (LOQ) was used as the default value as recommended by the US EPA (US EPA, 2000). In the case where neither LOD nor LOQ were reported, a value of zero was used for a compound not detected.
2.1 STEAM v3.2
The STEAM3 software predicts instantaneous vessel power consumption based on water resistance calculations and reflects the variability of ship operation based on information reported in AISs. With a detailed vessel description, it is possible to produce estimates of instantaneous power, fuel consumption and emissions. In contrast to emissions of atmospheric pollutants, the water discharges may not directly depend on vessel operation speed, but on other features like the number of people carried on board, the wet surface area of ships' hull and cargo capacity. For this purpose, the IHS (IHS_Global, 2016) SeaWeb vessel database was used to extract significant data to support discharge modelling of water pollutants. Vessel activity recorded by the AIS network of the Baltic sea countries was used in this work. The data consisted of position reports from the year 2012 (275 million records) which describe vessel locations every 5–6 min. The data were obtained from the Baltic Marine Environment Protection Committee (HELCOM) AIS data archive. The changes listed in this paper bring STEAM to v3.2, which facilitates discharge modelling using the methodology described in this paper.
It should be noted that the outputs of STEAM v3.2 describe water volumes for ballast, bilge, grey, black and scrubber wash water, and further multiplication with pollutant concentrations in these discharge waters is needed to generate inventories which, for example, describe the copper content of scrubber wash water released to the sea. The variability of pollutant concentrations in the discharge waters may be significant, which will inevitably be reflected in the final data. The inclusion of hundreds of chemical species in various discharges was not feasible in STEAM, which necessitated the modelling of water volumes instead of reporting pollutant mass flux directly. However, we acknowledge this and produce water volume data to facilitate further use in water research. Calculation examples and a review of existing pollutant concentration in various discharge streams are provided in the Supplement.
2.2 Bilge water
Bilge water is a chemical mixture, consisting of oil residues, cleaning agents and condensed water from machinery spaces. Estimating the volume of bilge water produced is challenging as it is not solely related to vessel activity but may depend on random occurrences of crew activities and machinery incidents, which cannot be predicted reliably. It should be noted that a stationary vessel also produces bilge water in our approach because leaks from pipes and condensation of water on metal surfaces may also occur regardless of vessel movement. The IMO MARPOL Annex I regulates when and where bilge water can be released to the sea, and it is challenging to describe this in emission models. In this work, each vessel has a simulated bilge tank and bilge water accumulated in this tank with the daily rate defined by Eq. (1a).
The daily bilge water production [L d−1] is calculated as a function of p, the installed main engine power. The equation for bpas is used for passenger ships (RoPax, passenger ships and cruisers) and bother is used for all other vessel categories. According to Det Norske Veritas (DNV) (Furstenberg et al., 2009), 75 % of the produced bilge water is discharged overboard and the remaining share (25 %) is left in port reception facilities. In the current study, this is taken into consideration by multiplying the estimated bilge water production of each ship with 0.75.
This bilge tank continuously releases bilge water to the sea in areas where this is allowed by IMO MARPOL Annex I or national legislation (Finnish Marine Environment Protection Act 29 December 2009/1672). In reality, the bilge tank is emptied more or less at random intervals, but realistic description of a random release is difficult to include, and we have chosen to implement a continuous bilge water release in this work. Based on a report by DNV (Furstenberg et al., 2009) and a study by Magnusson et al. (2018a) for 30 vessels in total, several attempts were made to correlate daily bilge water production of different kinds of vessels to build year, vessel type, size and installed main engine power. The highest score was obtained with a simple linear model as a function of main engine power defined separately for two vessel categories since passenger vessels clearly produce more bilge water than other vessel types.
Currently, STEAM produces bilge water volumes as output and does not indicate the amount of oil or other contaminants released to the sea because there are significant variations in pollutant concentrations of bilge water samples. In order to generate an inventory for oily releases, water volumes need to be multiplied with measured bilge water pollutant concentrations. Besides oil residues, bilge water can contain metals and other organic compounds. A literature search found three scientific articles (McLaughlin et al., 2014; Penny and Suominen-Yeh, 2008; Tiselius and Magnusson, 2017) and a US EPA report (Albert and Danesi, 2011) where bilge water on board ships was sampled and analysed for oil residues, metals and other organic compounds.
2.3 Stern tube oil
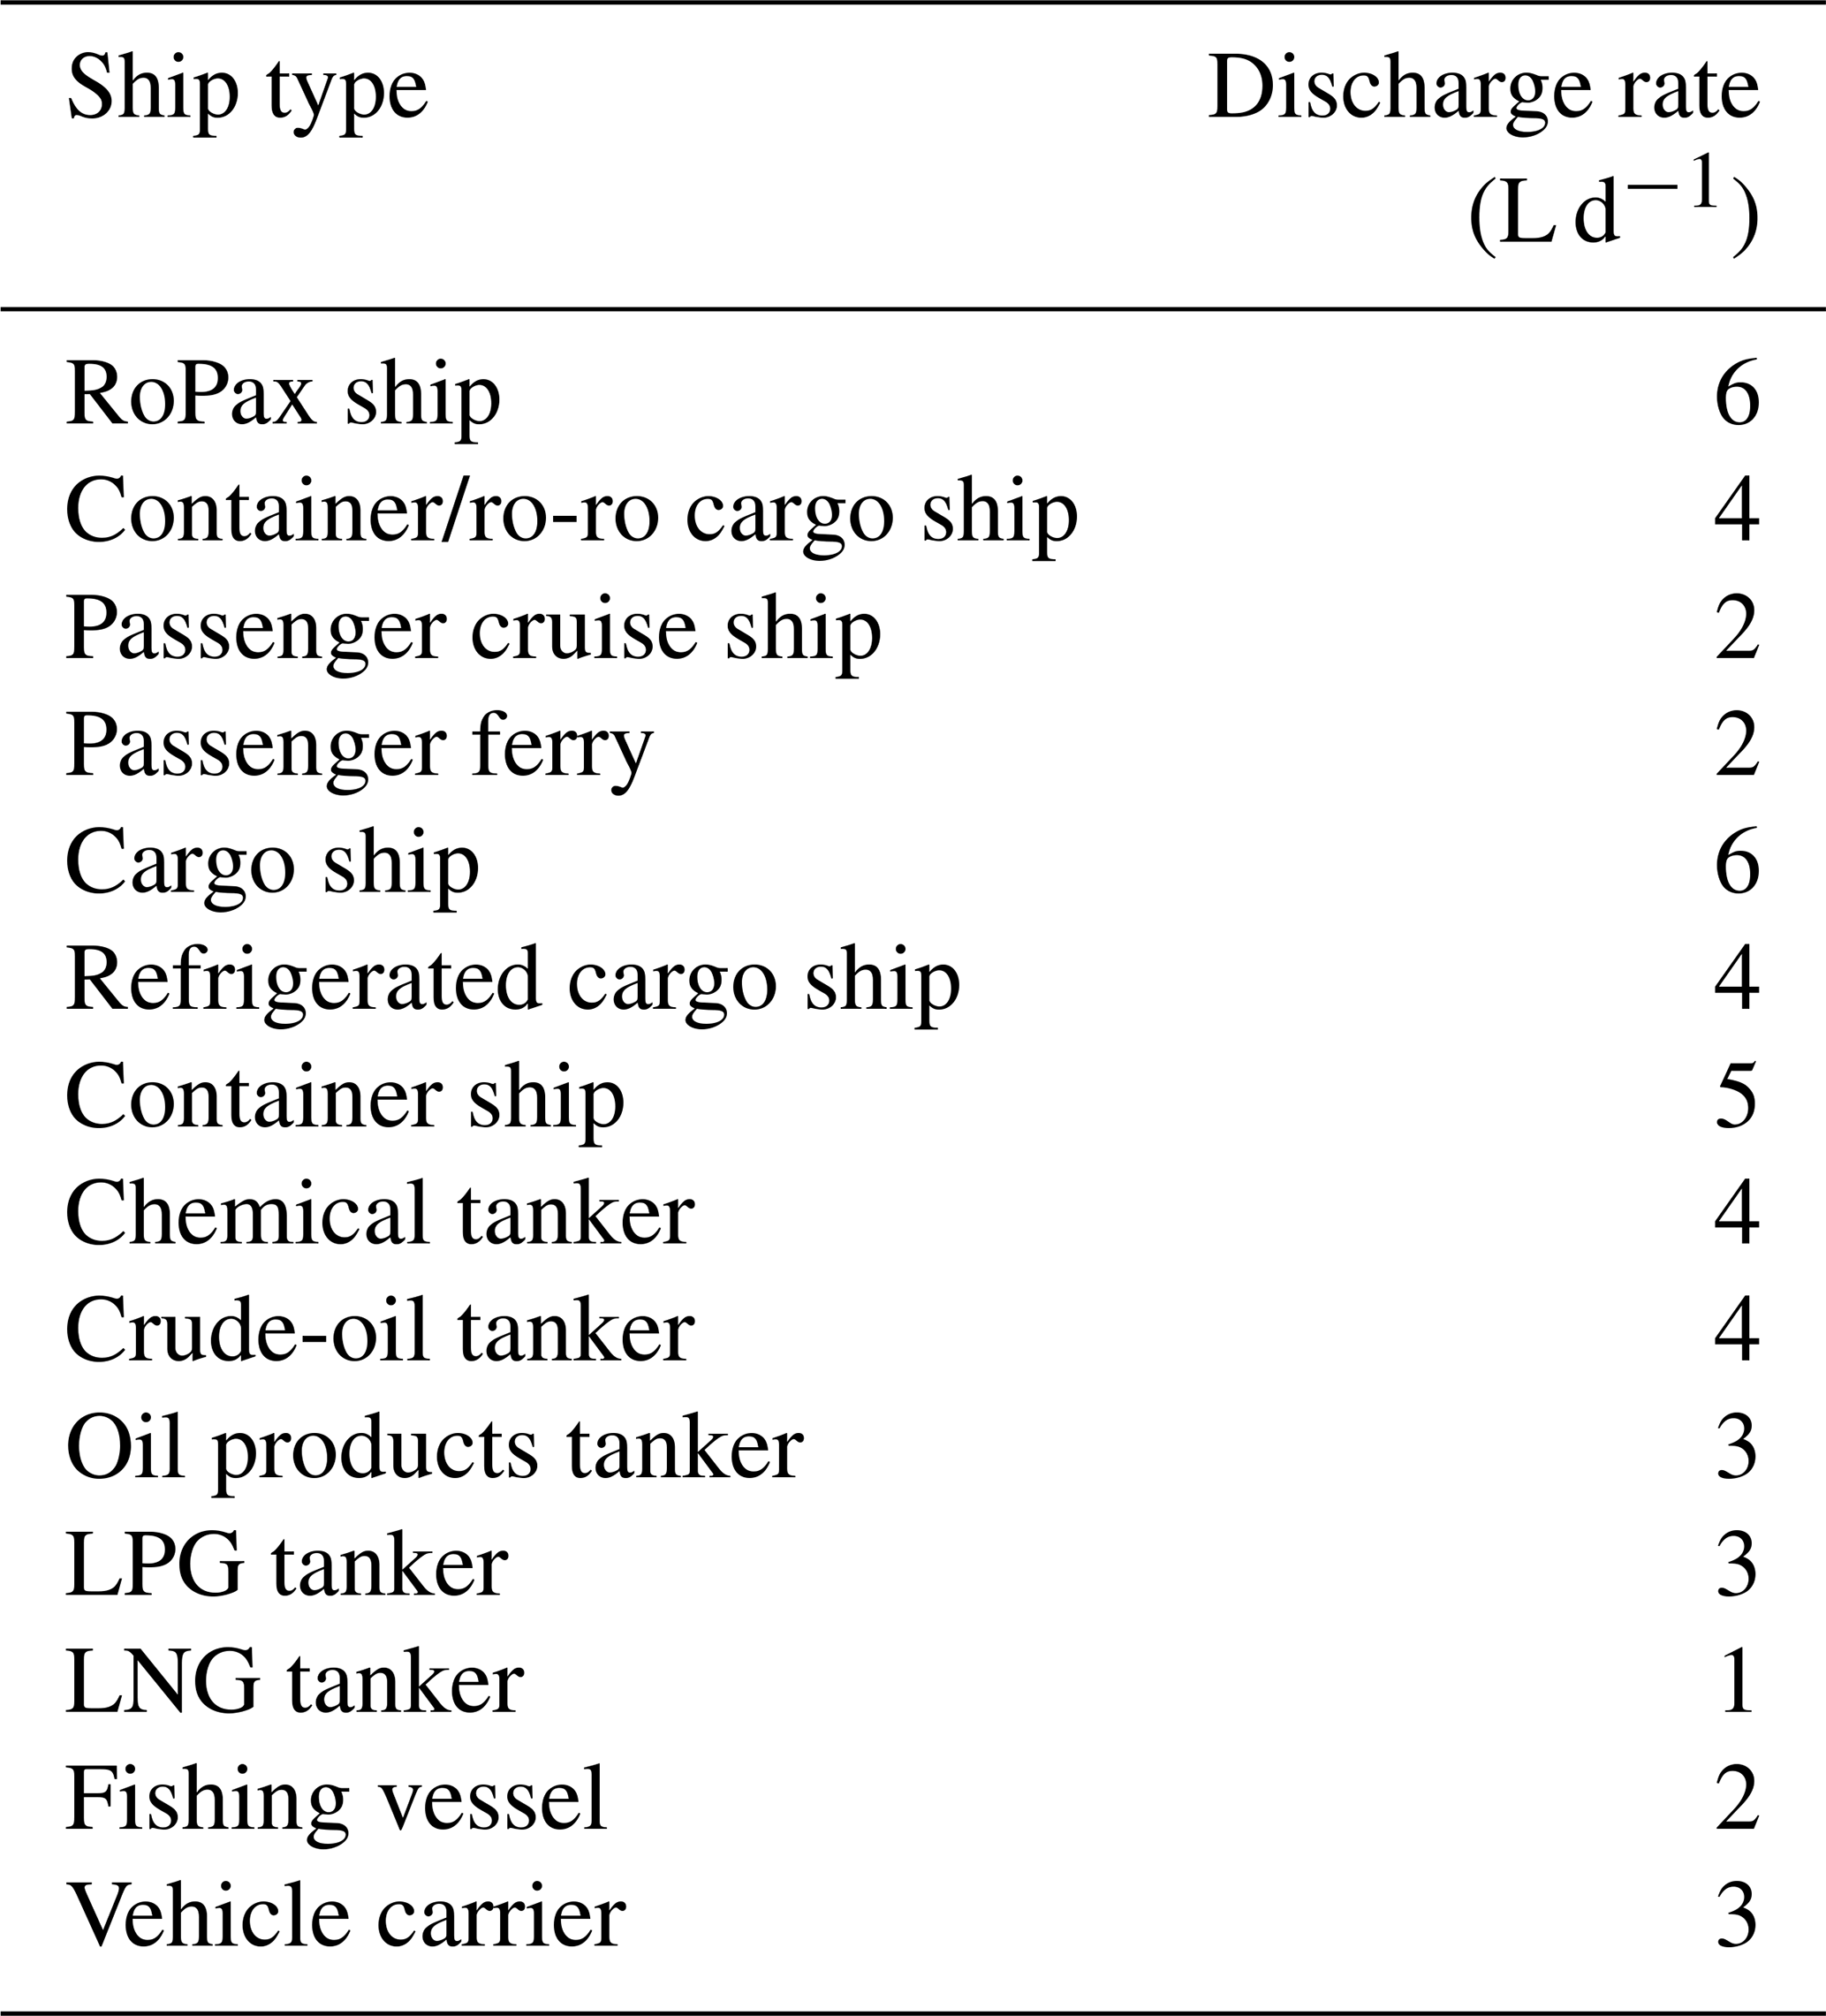
Oil leaking from ships' stern tubes was modelled as volumes of oil released per day from different ship types (Table 1). This value was different for cargo and passenger vessels, but scant experimental evidence of actual oil release through stern tube sealing exists. Continuous oil release is assumed as a function of time, regardless of vessel activity. Although, the current analyses, based on Etkin (2010), are more sophisticated than the leakage of over 80 ×106 L estimated for Canada (IMO, 2008b), more experimental work is needed to determine accurate stern tube oil emission levels for ships. The approach in this study was limited because no consideration was taken of the number of stern tubes in each vessel, the age of the vessel or the type of sealing or the lubricant used, but instead the values from Etkin (2010) were used. A global STEAM run for 2019 leads to stern tube oil leakage of 76.6 ×10⁶ L (in 2019) from the IMO registered fleet, which is similar to 80 ×106 t reported earlier (IMO, 2008b).
Table 1Leakage rates of stern tube oil for different ship types. The data was gathered from Etkin (2010).
2.4 Scrubbers
In 2019, there were over 1600 ships operating worldwide, and over 2000 vessels were equipped with open, closed or hybrid EGCSs. With STEAM3, EGCS wash water volumes for each individual ship equipped with a scrubber can be calculated. The type of equipment installed (open, closed, hybrid system) and installation date can be used as input to the model. The total load of, e.g., metals emitted is dependent on the type of scrubber system used, the engine power and wash water volume. The wash water analysis data for both open-loop and closed-loop systems is limited. Characterisation data (concentrations of contaminants and nutrients) of scrubber wash water during open- and closed-loop operations was obtained from six reports (Hufnagl et al., 2005; IMO, 2018b, 2019; Kjølholt et al., 2012; US EPA, 2011b) and one scientific article (Turner et al., 2017).
2.4.1 Scrubber operation mode
For the hybrid scrubber case, it is not known if the ship operates in open or closed mode unless the vessel travels in an area where wash water release from open-loop scrubbing is not allowed (inland waters or ports in countries like Belgium, France and Germany). However, since the water consumption will increase dramatically in low-alkalinity waters, we assume that the open-loop operation will be insignificant in the Gulf of Bothnia. In the Baltic proper we assume that the hybrid scrubber operating in open-loop mode switches to closed mode upon entering the Bothnian Bay, where water alkalinity is low because of river runoff (Beldowski et al., 2010). Different scrubber operating modes produce very different effluent flows per power unit. Scrubber effluent releases were determined by STEAM based on instantaneous power needed to propel the vessel at a speed indicated by AISs.
Some countries, like Germany, do not allow the use of open-loop scrubbers in their ports. This feature has been included in the modelling by allowing the use of closed-loop scrubbers, but the use of low-sulfur fuel is required from vessels equipped with open-loop scrubbers when operating in German waters.
2.4.2 Scrubber utilisation and discharge rates
In Johansson et al. (2017) it has been described how the instantaneous fuel sulfur content (SFuel) has been modelled based on the local regulations and vessel technical limitations. Our key assumption in the modelling of SFuel is that the ship owners aim to minimise costs while complying with regulations. For the case of scrubbers, this means that the utilisation level of scrubbers must depend on both the SFuel used on board and the maximum allowed SAllowed. As an example, in an area for which 1.5 % SFuel is required one should not assume the same level of utilisation for the scrubber as in an area in which 0.1 % is required for compliance. To take this into account in the model we define the scrubber utilisation level, given by (Eq. 2):
In Eq. (2), the global average (SGlobal) of 2.7 % fuel sulfur content was assumed. For open-loop scrubbers the discharge rate has been set to equal 45, and for closed-loop scrubbers it is set to 0.3 m3 MWh−1 (Lloyds Register, 2012; Wärtsilä Corp., 2017). In the model we compute the instantaneous discharges based on the current engine power and the scrubber discharge rate, multiplied with the scrubber utilisation rate. It should be noted that the use of scrubbers also affects the engine power predictions of STEAM3. The additional power required by scrubber pumps is modelled, and vessel propulsion fuel consumption is increased by up to 2 % (ABS, 2018), as a function of the utilisation rate.
2.5 Ballast water
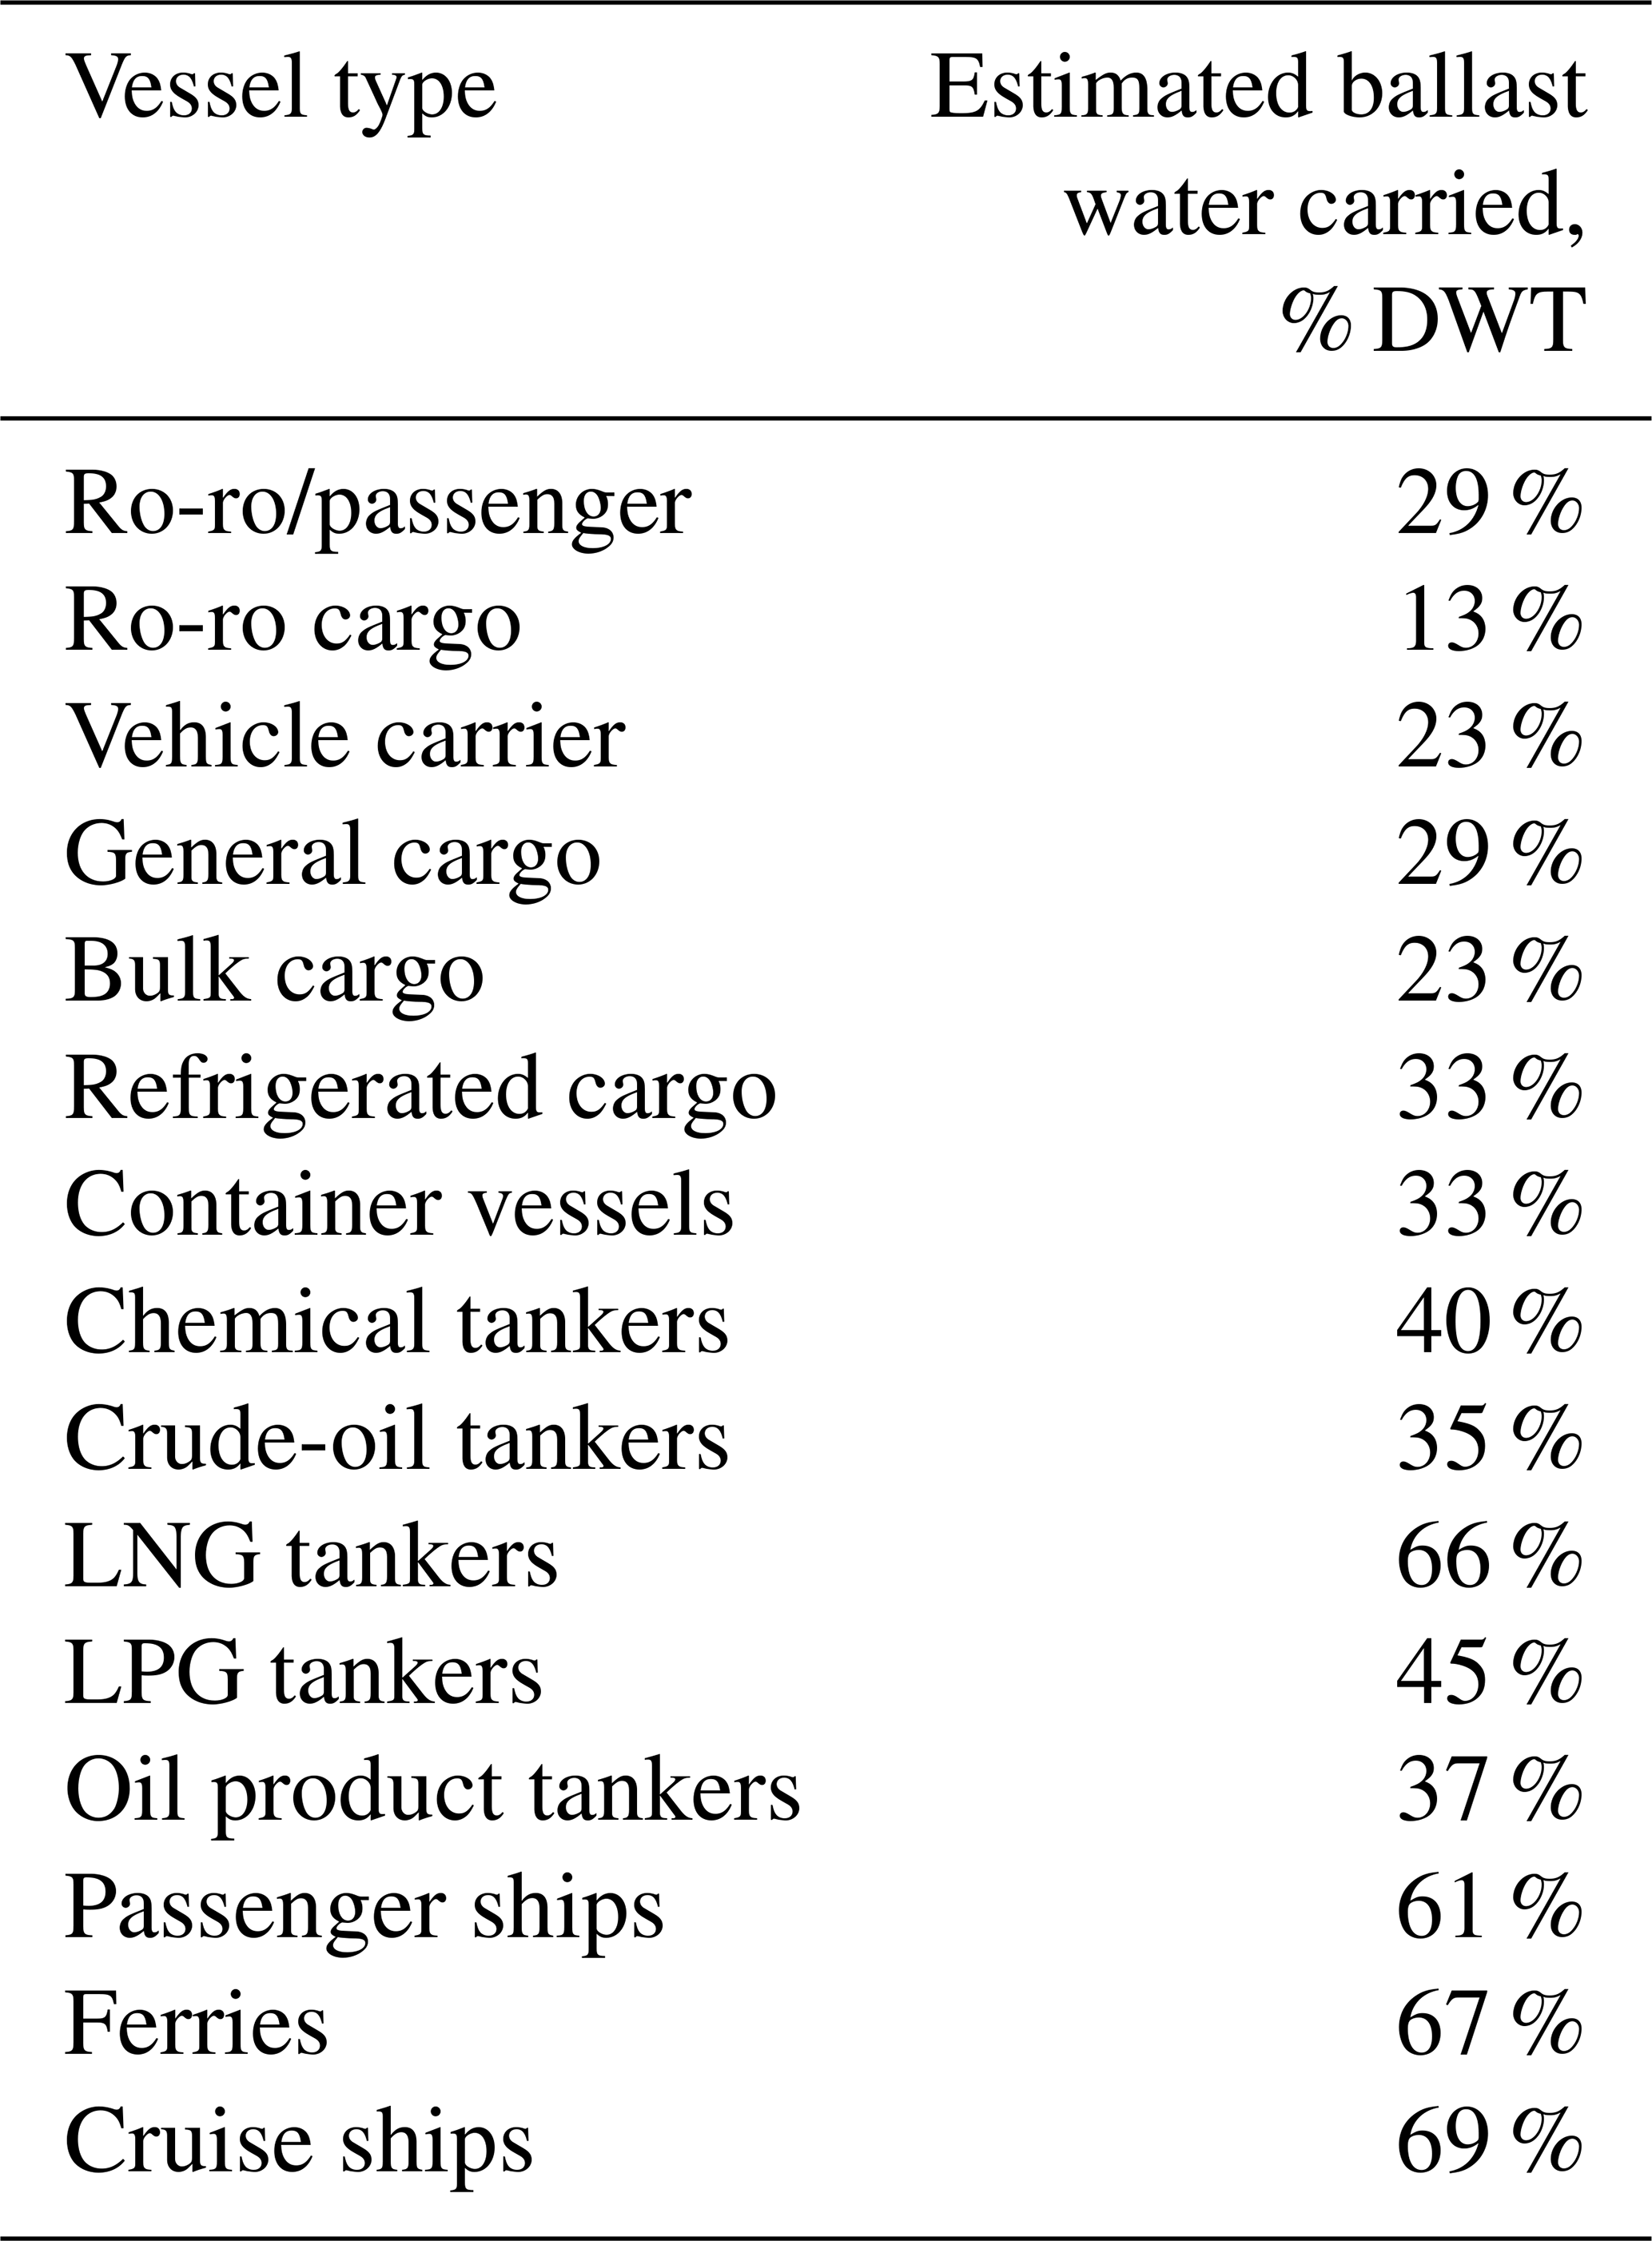
According to David and Gollasch (David, 2015), cargo ships carry ballast water amounts which correspond to 26 %–60 % of their deadweight (DWT). Largest amounts can be found in bulk cargo carriers and tankers. The most reported values for the ballast water capacities range between 30 %–40 % of DWT. However, modern cargo ships may visit several ports and unload only part of their cargo in any port and ballast water may be taken in or discharged during each visit. It is unlikely that all of the ballast water is loaded or unloaded during each of the port calls, and this in particular makes the modelling of ballast water discharges challenging. For ballast water capacities for ships we have used ship-type-dependent fractions as a function of vessel DWT. These fractions have been presented in Table 2.
Table 2Estimated volume of ballast water carried by different types of vessels, indicated with a fraction of vessel deadweight (DWT).
Ballast water management systems (BWMSs) are used to kill or remove organisms within ballast water. Biocides are used during the process, but other chemicals associated with the system either intentionally or resulting from the treatment of ballast water can also be discharged to the marine environment. Before the BWMSs can be put out on the market, they must pass an environmental risk assessment where the discharge of biocides and other chemicals to the marine environment is assessed. The risk assessment and authorisation are handled by the Marine Environmental Protection Committee (MEPC), a branch of the IMO. Analytical data of biocides and other chemicals present in treated ballast water from 40 different BWMS applications were reviewed based on measurement reports submitted to the IMO by member states during 2006–2015. These data can be found in the Supplement.
The modelling of ballast water discharges is challenging, and a number of safety measures are used to avoid situations where the discharge is modelled but does not occur in reality. Instead of aiming for accurate timing for ballast water intake and discharges with realistic release rates, the focus on the modelling is to obtain realistic amounts and geographical distribution for discharges. First, STEAM3.2 uses a global mapping of port areas (National Geospatial Intelligence Agency, 2014) which define the areas where ballast water discharge is allowed to occur in the model. To further avoid the modelling of ballast water discharge that does not occur in reality, the modelled discharge is allowed to happen for vessels that are berthing, and the berthing duration must exceed 2 h. Any vessel that has not been travelling in cruising mode between port visits is unable to discharge ballast water in the model. Considering these mentioned modelling rules affecting the ballast water discharges, the actual timing and rate of discharge cannot be estimated without additional information. Due to this we model an almost instantaneous (approx. 1 h) discharge for ballast water when all the above-mentioned conditions are met. This is, of course, not physically realistic but will prevent a partial, incomplete discharge to occur in the modelling.
2.6 Modelling of antifouling paint release
The modelling approach for biocides released from antifouling paints is a combination of vessel activity, paint type, vessel characteristics and biocide release rate. A ship's wet hull surface area is calculated with STEAM3.2 as part of the Hollenbach resistance calculations (Hollenbach, 1998). This allows for the calculation of a ship's underwater surface area (in m2) based on vessel physical dimensions and hull shape. It also facilitates further development because the method applied is linked to hull wet surface area, but the model can also estimate the friction terms involved in the hull–water interface as a function of vessel speed. Once the surface area is determined for a specific vessel, release rates for the mass of substances per area and time (g m−2 s−1) are applied. Release rates are based on a compiled dataset of 184 antifouling paint products (Gutierrez, 2015; New Zealand EPA, 2013; Ytreberg et al., 2010) and calculated in this work using the mass-balance calculation method (ISO 10890). The following biocides were used: copper (inorganic species that release Cu2+), zinc oxide (released as Zn2+), and the co-biocides copper pyrithione (CuPyr), zinc pyrithione, 4,5-dichloro-2-octyl-3-isothiazolone (DCOIT) and zineb.
Different countries have their own regulations for antifouling paint use; varying release rates were applied for the ships depending on which geographical area the ships were operating in according to four classes: International, Kattegat, Baltic proper and Gulf of Bothnia (Fig. 2). For the class International, applied to all ships that also operate outside the Baltic Sea and the Kattegat, all 184 antifouling paints were used to derive average release rates of biocides. The class Kattegat is applied to all ships operating in both the Kattegat and the Baltic Sea, and release rates for antifouling paints approved for the Swedish west coast, Finnish, Polish and German markets were used. For the class Baltic proper, applied to ships operating in both the Baltic proper and the Gulf of Bothnia, antifouling paints approved for the Swedish Baltic Sea, Finnish, Polish and German markets were included. For the class Gulf of Bothnia, applied for ships operating in the Gulf of Finland only, coatings approved for the Swedish Baltic Sea and Finnish markets were used.
Not all vessels use biocidal eroding or self-polishing antifouling paints because the paint can wear off as a result of abrasion against sea ice. Vessel hulls can be kept smooth with periodic cleaning using divers and brushes. We assume that all ships operating outside the Baltic Sea area carry antifouling paints, since there are no national regulations for international routes, and the fouling pressure in fully marine waters is more severe compared to the brackish waters in the Baltic Sea. The same assumption is made for ships operating outside the Baltic and the Kattegat regions (Fig. 2).
It has been estimated that the percentage of ships carrying antifouling paints in the Baltic proper is 50 % (Ambrosson, 2008), and in the Bothnian Bay it is 20 % (Koivisto, 2003). Hence, for the antifouling paint class Baltic proper and the Gulf of Bothnia, an application factor of 50 % and 20 %, respectively, were used. Not all paints contain all six contaminants. Hence a second application factor, which estimates the fraction of antifouling paints containing a specific biocide or booster biocide, is needed. The inorganic copper compounds and ZnO have an application factor of 100 % estimating all antifouling paints to contain inorganic copper and ZnO. The booster biocides have an application factor of 0.2, assuming only 20 % of all paints to contain one of the four different booster biocides. This implies that 20 % of the coatings do not contain any booster biocide.
In the present work, we do not know if a specific vessel is using a biocidal coating or a biocide free icebreaker coating. Therefore, we multiplied the regionally specific application factors with the regionally specific leaching rate to derive a generic leaching rate for the region-specific vessels. As a consequence of the low application factor for ships operating in the Bothnian Bay only (20 % of the vessels are assumed to be coated with antifouling paints), the generic average leaching rate of copper is significantly lower in the this region (3.1 µg cm−2 d−1) as compared to the International region (24.5 µg cm−2 d−1), where 100 % of the vessels are assumed to be coated with antifouling paint (Table 3).
Table 3Antifouling paint leaching rates by sea area. All values given in µg cm−2 d−1. Note that ZnO and Cu(I)oxide are reported as mass of Zn and Cu, which is in contrast to CuPyr, DCOIT and zineb where the total mass or organometallic molecule is considered.
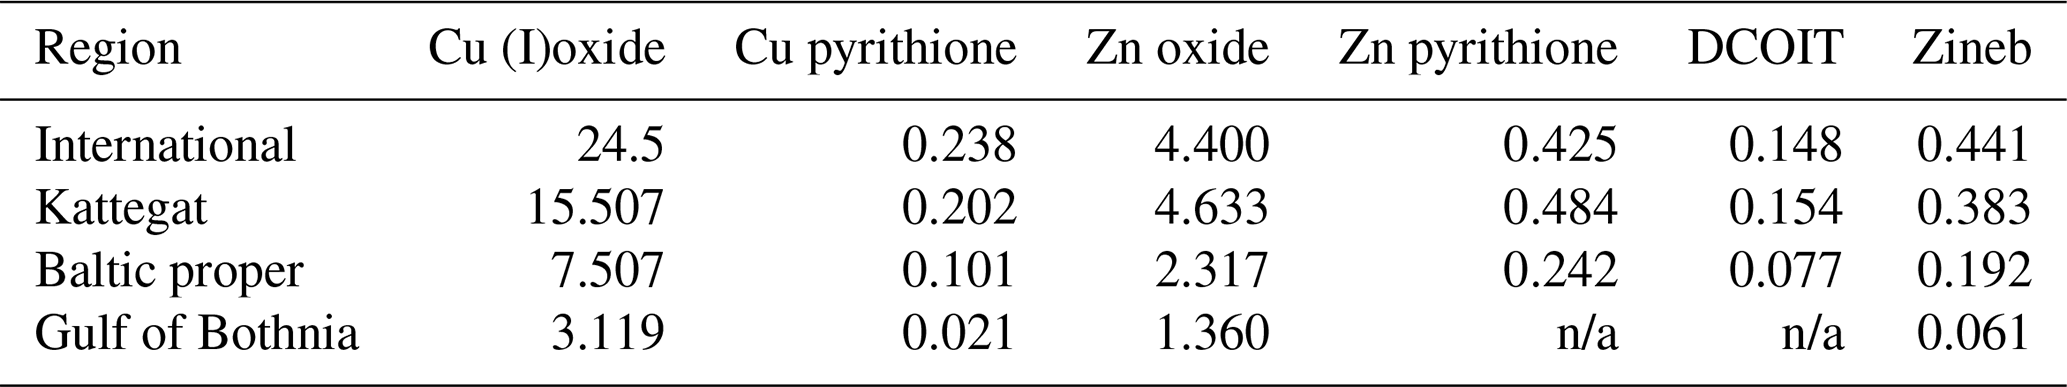
n/a” not applicable.
A more detailed review of daily release rates for various antifouling compounds can be found in the Supplement.
In STEAM3, the chosen approach requires two analysis rounds over the AIS data. In the first round, areas of operation are defined for each ship. During the second calculation round, the highest leaching rate of all the vessel operational areas is applied. The release rate will be multiplied with hull wet area and time to generate a map which describes the paint residue releases. The temporal variation in antifouling release is retained, and the maps can be used as input for ecosystem modelling.
2.7 Food waste and black and grey water
To assess the waste streams caused by people on board, i.e. the amount of food waste and volumes of black and grey water produced on board ships, naturally depends on the number of persons on board, which also includes the crew size. STEAM3 uses the IHS database of vessel characteristics, and the passenger capacity is one of the available information fields. For most vessels this field has not been specified. In such cases the number of passengers and crew size needs to be estimated.
2.7.1 Passenger and crew capacity estimation
Maximum passenger capacity values for more than 500 ships was collected using Significant ships (RINA, 2010) journals. This publication series contains a comprehensive view on ship construction each year, including also the size of the crew on board. Based on the collected data, statistical models were assessed to predict the listed passenger capacities and crew size as a function of basic vessel properties. In particular, the vessel length overall (LOA) was seen to correlate strongly with the passenger capacity. The calculation methodology for passenger capacity of different types of passenger vessels is presented in Table 4.
Table 4Estimation rules used for maximum passenger capacity for different vessel categories. The function shows the computation used for passenger capacity based on LOA (Length overall). The “minimum” states the minimum value for the estimation in case the number of cabins has been specified for the vessel.
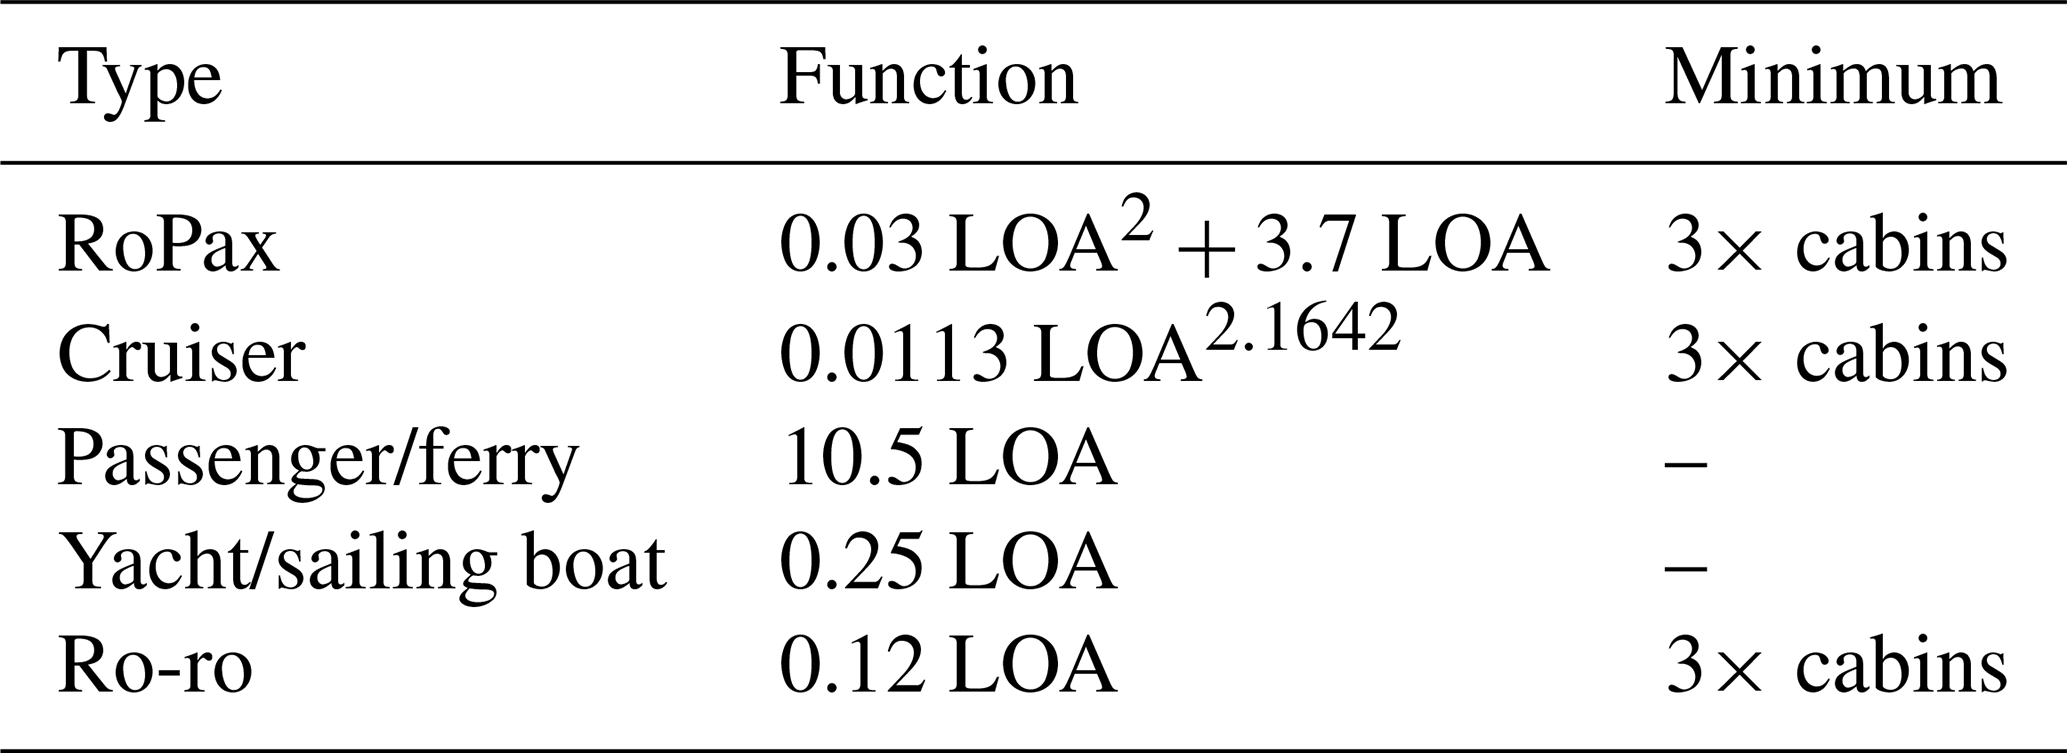
The size of crew on board is estimated to be LOA 10+1, however, for RoPax and cruisers the large number of passengers introduce additional work force on the vessel; based on the vessel data we increase the crew size by 0.2 times the passenger capacity.
2.7.2 Passenger count on board
For the modelling of waste discharges such as food waste and black water the maximum passenger capacity estimate needs to be converted into passenger count estimate. There are significant differences in passenger capacity utilisation between seasons and only part of the total capacity may be in use. HELCOM reports passenger capacity utilisation of 90 % for cruise ships (HELCOM, 2014a). Typically, summer and end-of-the-year holidays define peak seasons of the number of passengers carried on regular routes. This applies especially to RoPax ferries travelling in the Baltic Sea area. Average capacity utilisation was estimated by the number of passengers carried by each route for two major shipping companies which concentrate on the passenger traffic in the Baltic Sea area. The routes selected were Helsinki–Tallinn, Helsinki–Stockholm, Turku–Stockholm, Stockholm–Tallinn and Stockholm–Riga. For these routes and companies operating the vessels, quarterly reported passenger counts were available for the year 2014.
Vessels used on each route were identified and the number of ship crossings were determined from AIS data. This analysis revealed that, on an annual average, the passenger capacity utilisation rate of regular traffic is about 50 % for the vessels included in the analysis. During the summer season and Christmas capacity utilisation is close to 100 % but significantly less than that outside the peak seasons. Due to the small sample size for passenger counts throughout the season, the modelling of passenger counts is based on a static 50 % estimate for the capacity utilisation.
2.7.3 Food waste, black and grey water volumes, and nutrient content
The generation of grey water and black water per person and per day by different ship types was obtained from DNV (Furstenberg et al., 2009) and is presented in Table 5.
Table 5Volumes of grey water (GW) and black water (BW) generated by different ship types.
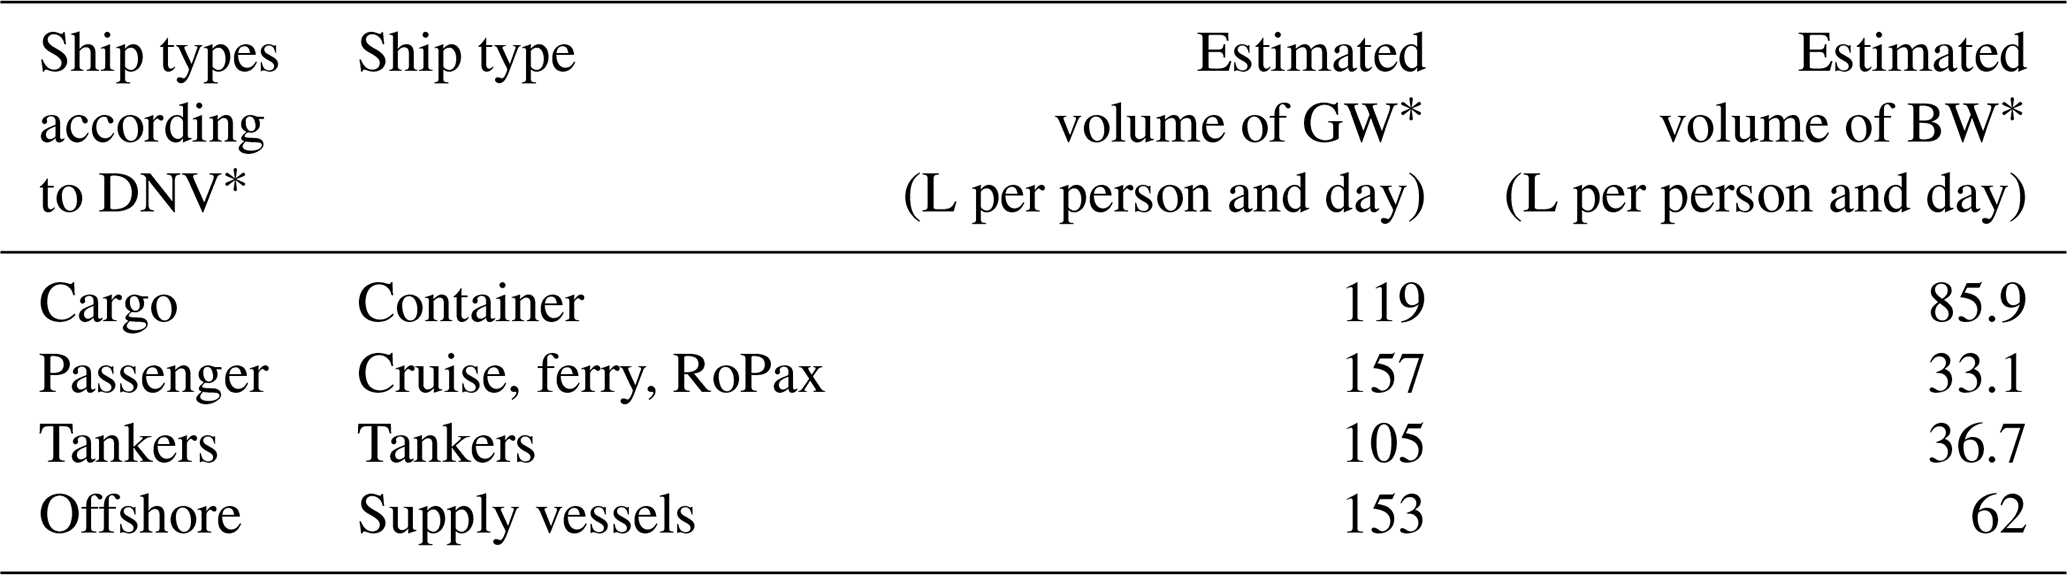
* Furstenberg et al. (2009).
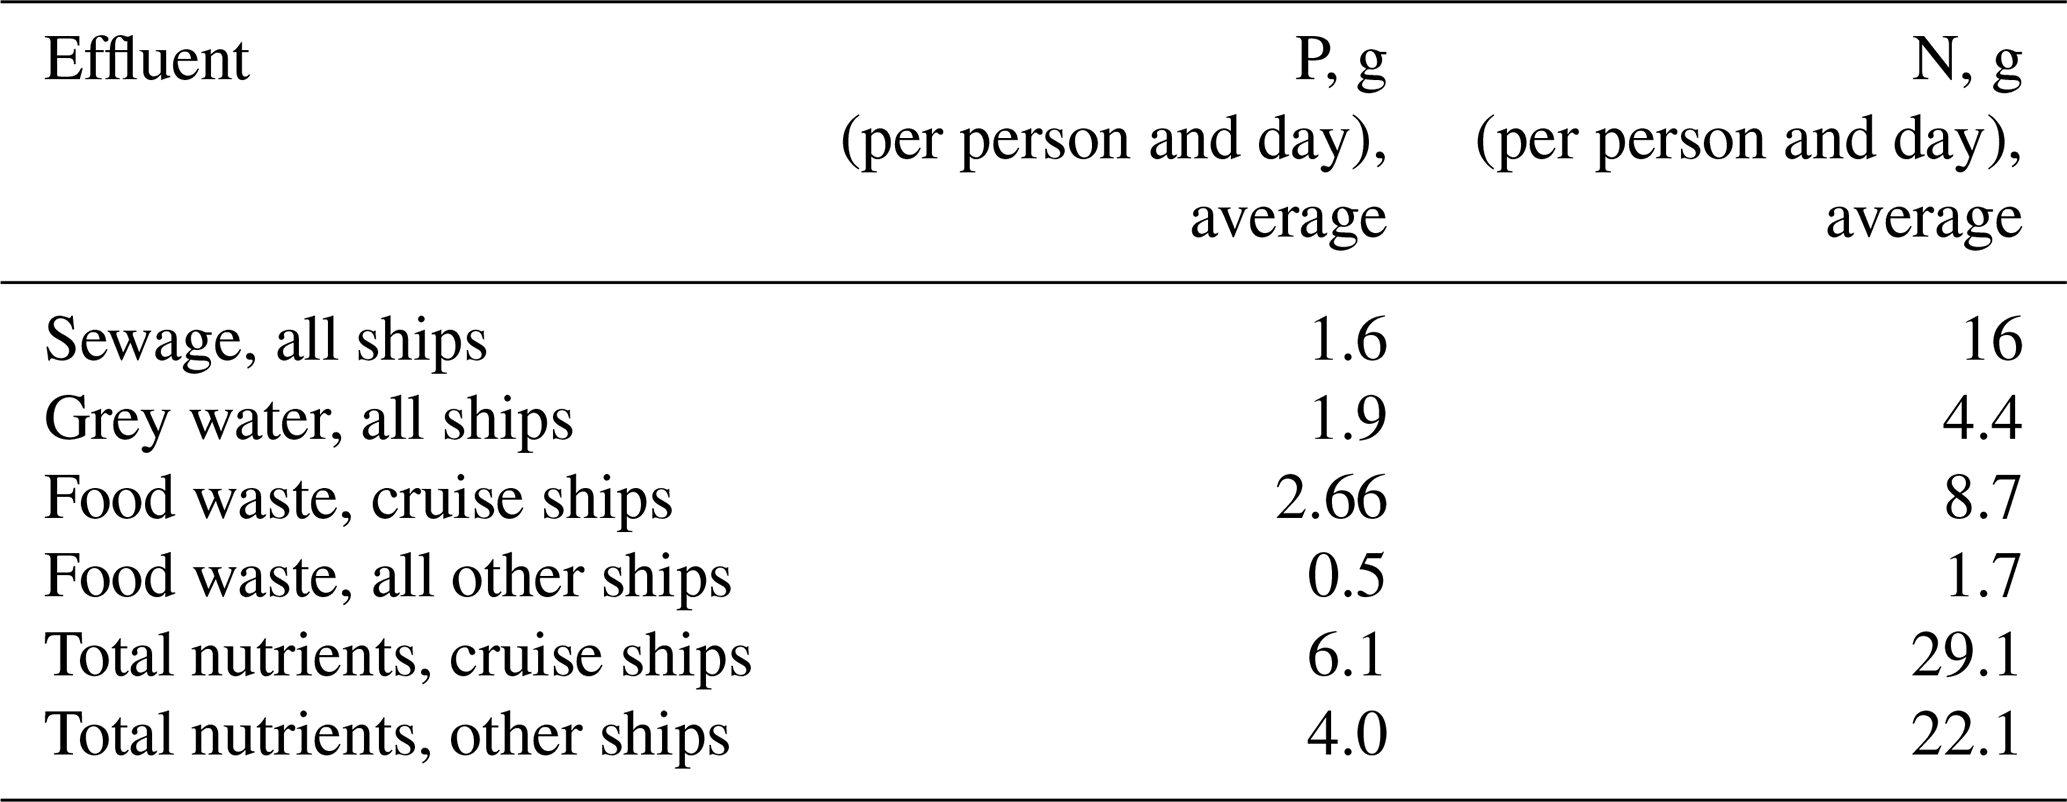
Concentrations of nitrogen and phosphorus in grey water were provided by leading providers of marine equipment (Jussi Ylimäki (EVAC), personal communication, 2 December 2015; Asgeir Wien (Scanship), personal communication, 2 March 2016) (Table 6). The concentration of nitrogen and phosphorus in the black water could not be used directly since it was referring to the vacuum toilets. Therefore, a fixed emission factor of 16 g N and 1.6 g P per person and day was used for black water (average estimates from the providers of marine equipment and previous work of Huhta et al., 2007). This fixed emission factor is comparable to land-based estimates of 12.5 g N and 1.4 g P per person and day found in the literature (Jönsson et al., 2005).
In addition to the nutrients listed in Table 6, black and grey water discharges may also contain various contaminants, which are released from ships to the sea. The estimated quantities of various contaminants in black water were based on the onboard sampling and laboratory testing of cruise and passenger ship wastewater effluent in Alaska (ADEC, 2000, 2004, 2005, 2006, 2007, 2008, 2011a, b, 2013; US EPA, 2008) and from passenger ships in the Baltic Sea (Madjidian and Rantanen, 2011).
Table 7Volume discharges from STEAM for Baltic Sea shipping in 2012 (in tonnes), Cu concentration in discharge samples (micrograms per litre) and calculated total discharged mass of Cu (in tonnes) into the Baltic Sea.
* Converted from 3 050 000 L using density of 0.915 kg L−1 (ExxonMobil_Marine, 2003).
2.7.4 Discharge of food waste and black and grey water
Today, the Baltic Sea is the only designated special area under IMO MARPOL Annex IV with respect to black water discharge. In this area, passenger ships must treat their sewage prior to discharge to the sea or the sewage must be left in port reception facilities. The regulations apply to new built passenger ships as from 2019 and will apply to all passenger ships as from 2021. For direct passages between St. Petersburg (Russia) and the North Sea there is an extension until 1 June 2023. In the modelling of black water for this paper, which is conducted for the year 2012, the rules did not apply, and hence a worst-case scenario was used where all the generated sewage on board ships was discharged to the Baltic Sea. The MARPOL regulation in Annex IV does however state that no untreated sewage can be discharged when ships operates at a distance of less than 12 nautical miles from the nearest land. As many ships also mix the grey water and sewage prior to discharge, the assumption in the modelling presented in this paper is that neither grey water nor sewage are discharged if the ship is closer than 12 nautical miles from the nearest land. The same assumption was used for food waste, which according to MARPOL Annex V must be ground and can only be discharged when the ship is further than 12 nautical miles from the nearest land.
In STEAM3.2, waste accumulates into a virtual tank at a constant rate, which is a function of people on board, regardless of ship operation. When a vessel travels at slow speed or it travels near the coastline, no release is allowed, and the water goes to a modelled tank instead. According to IMO MARPOL Annex IV, the speed limit for discharging sewage is 4 knots. Still, the speed limit of 5 knots was chosen since this is the lowest speed in cruise mode in our AIS data setup, which was used as a trigger for these discharges. When the IMO requirements for release are met, the tank is drained continuously to the sea at a rate that is significantly larger than the generation rate (50 times the generation rate). The IMO has defined (IMO, 2006) the maximum rate for the discharges. However, the discharges are characterised as infrequent events rather than continuous streams. Due to this the produced temporal and spatial distributions for food waste and grey and black water can be crude approximations.
To visualise the output of the STEAM3.2, the gridded datasets and maps of the annual volumes from different ship waste streams discharged into the Baltic Sea were produced. The maps are complemented by statistics on the monthly variation in discharge volumes, the shares of the total volumes discharged from the respective ship categories and the volumes discharged to the different basins in the Baltic Sea (Sect. 3.2–3.7). The total mass of pollutants discharged to the water depends on the volume of discharge and the pollutant concentrations in the waste streams. Generating dedicated inventories for hundreds of contaminants is not feasible, but the approach to produce waste stream discharge volumes as output in STEAM3.2 (Table 7) enables easier assessment of additional contaminants, as new or updated data on pollutant concentrations become available.
There are large variations in the literature data of the waste streams; both with respect to volumes and concentrations. For example a large variation can occur in generated bilge water volumes and composition, even in samples of the same vessel (Magnusson et al., 2018a), and similarly large variations in, e.g., metal content in scrubber wash water are reported (Turner et al., 2017). Clearly, ballast water discharges are the largest by volume (Table 7); however, in ballast water the concentration of many contaminants is significantly lower than, e.g., in EGCS effluent. There are also large differences in temporal variation in discharges, especially concerning those which are strongly connected to passenger traffic and the number of people carried on board. This particularly concerns the black and grey water discharges as well as food waste.
Some contaminants are present in several discharge streams, for example copper (in Table 7). The different waste streams have different shares of the total copper discharged from shipping the Baltic Sea. Here, it should be noted that the spatial distribution of the discharges can vary significantly. For example, ballast water discharges are concentrated near the port areas, whereas the scrubber effluent discharges occur mostly along the ship lanes. The spatial features of each of the discharges are described in more detail in the following sections and a detailed breakdown of various discharges for different ship types is provided in Appendix A and the Supplement.
3.1 Bilge water
According to the IMO, discharges of bilge water are allowed if the oil content of the discharge is below 15 ppm. However, national environmental legislation in Finland prohibits the release of oily waters within 4 nautical miles from the coastline. This feature is included in the discharge modelling (Fig. 3).
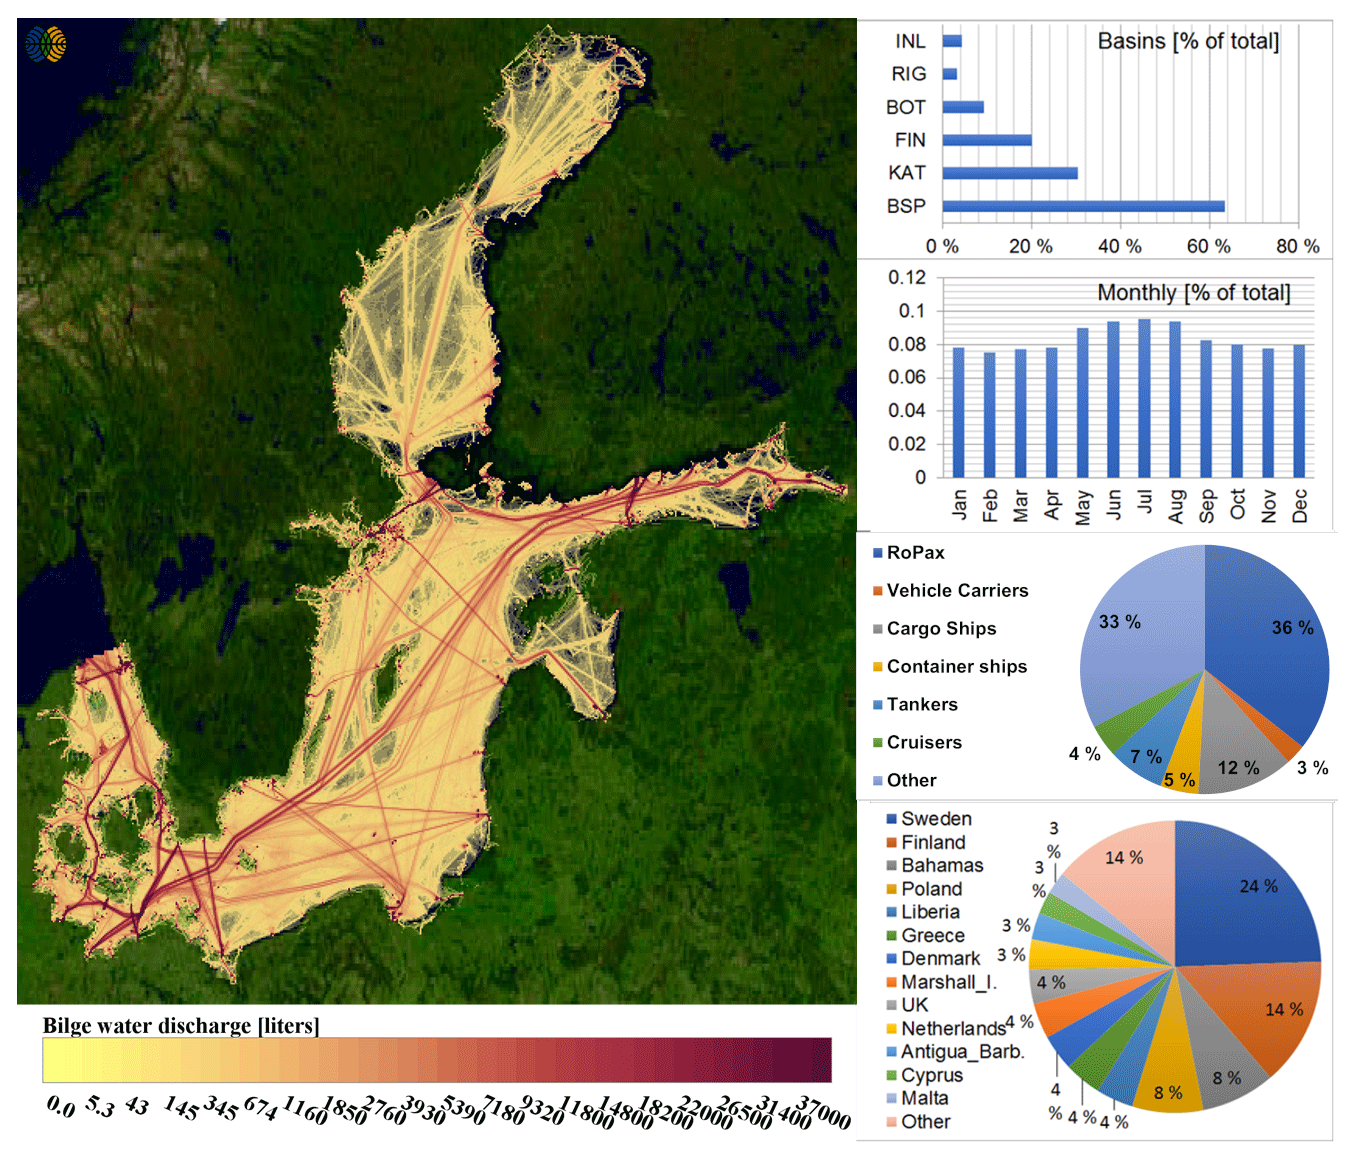
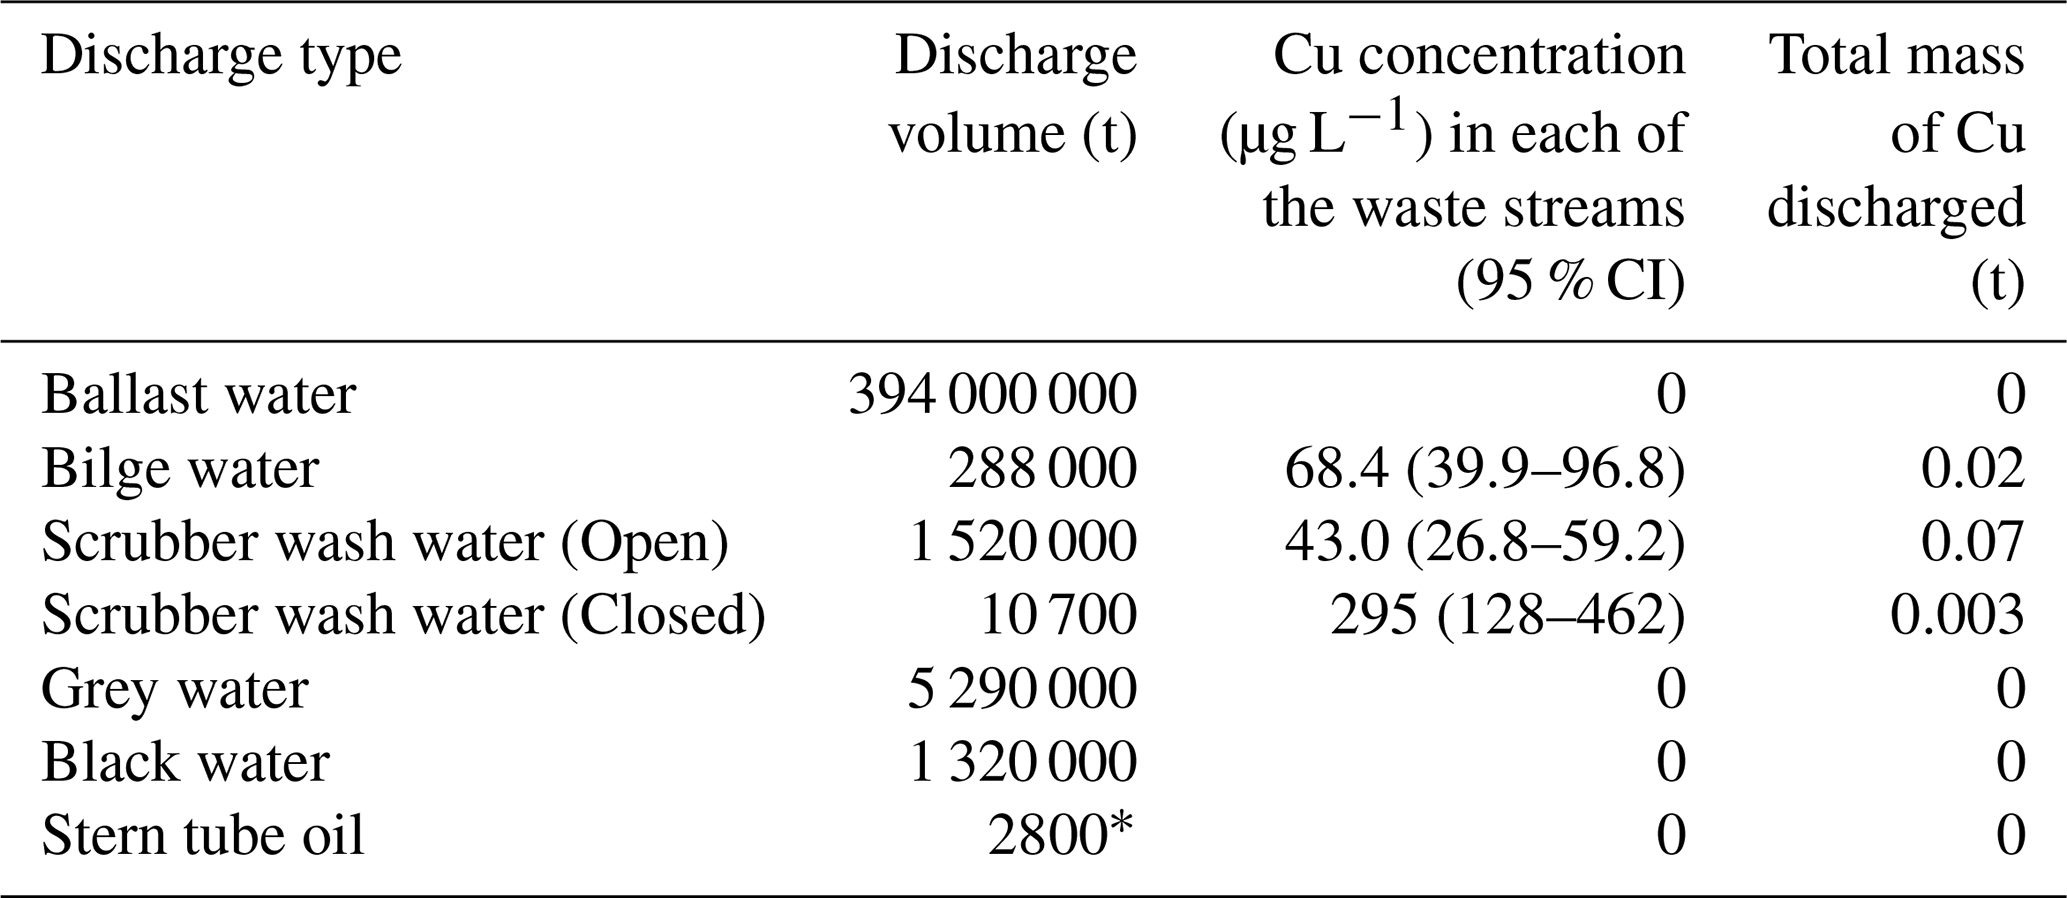
Figure 3Distribution of the annual bilge water releases for the year 2012 from the Baltic Sea shipping. Discharge volumes are indicated per map grid area of 5 km2. Note that release of bilge water is prohibited within 4 nm from the Finnish coastline. Top right: share of bilge water released in various sub-basins of the Baltic Sea (INL: inland areas; RIG: Gulf of Riga; BOT: Bothnian Bay and Bothnian Sea; FIN: Gulf of Finland; KAT: Kattegat; BSP: Baltic Sea proper). The lower bar chart depicts the monthly variation in bilge water discharges. The upper pie chart summarises the contribution of various ship types to bilge water releases and the lower pie chart the flag state shares of bilge water releases. Map: background Landsat-8 image courtesy of the U.S. Geological Survey.
The total volume of bilge water during the year 2012 was 288 000 t, of which 36 % was from the RoPax class of vessels. According to 56 analyses of bilge water identified in the literature (Albert and Danesi, 2011; McLaughlin et al., 2014; Penny and Suominen-Yeh, 2008; Tiselius and Magnusson, 2017) (see Appendix Table A1), the average effluent oil concentration was 3.2 ppm (95 % CI [0.5, 6.1]), which implies that 0.9 t of oil (95 % CI [0.2, 2.0]) is being discharged annually to the Baltic Sea via bilge water. Apart from oil, bilge water also contains various organic compounds and metals, and the average concentrations of 16 different PAHs, 6 other organic compounds, 16 different metals and 3 detergents are presented in Appendix Table A1.
Modelling of bilge water discharge as a continuous release may underestimate the temporary local peaks in bilge water contaminant concentrations in the Baltic Sea area, making this discharge more diffuse than in reality. This approach does not cover the illegal discharges of untreated oily water, which were detected by aerial surveillance of the HELCOM member states (HELCOM, 2018a).
3.2 Stern tube oil
The annual discharge of stern tube oil to the Baltic Sea was calculated as 2800 t (Table 7), which occurs during the normal operation of vessels. It should be noted that significant uncertainties may be involved. Etkin (2010) pointed out that ageing may deteriorate the stern tube sealing, which would necessitate the inclusion of vessel or sealant age as a relevant modelling parameter. Nonetheless, the load of oil to the Baltic Sea is more than 3 orders of magnitude higher than what was calculated to be discharged from bilge water (0.9 t). Excluding the accidental releases of oil to the sea, a similar conclusion was reached for the Mediterranean Sea in the EU Joint Research Centre study (Pavlakis et al., 2001). The approach taken in our study may be refined in the future, for example considering the age, number of stern tubes, type of sealing and lubricant used which are not currently considered. Figure 4 indicates the geographical distribution of predicted stern tube oil release in the Baltic Sea area during 2012.
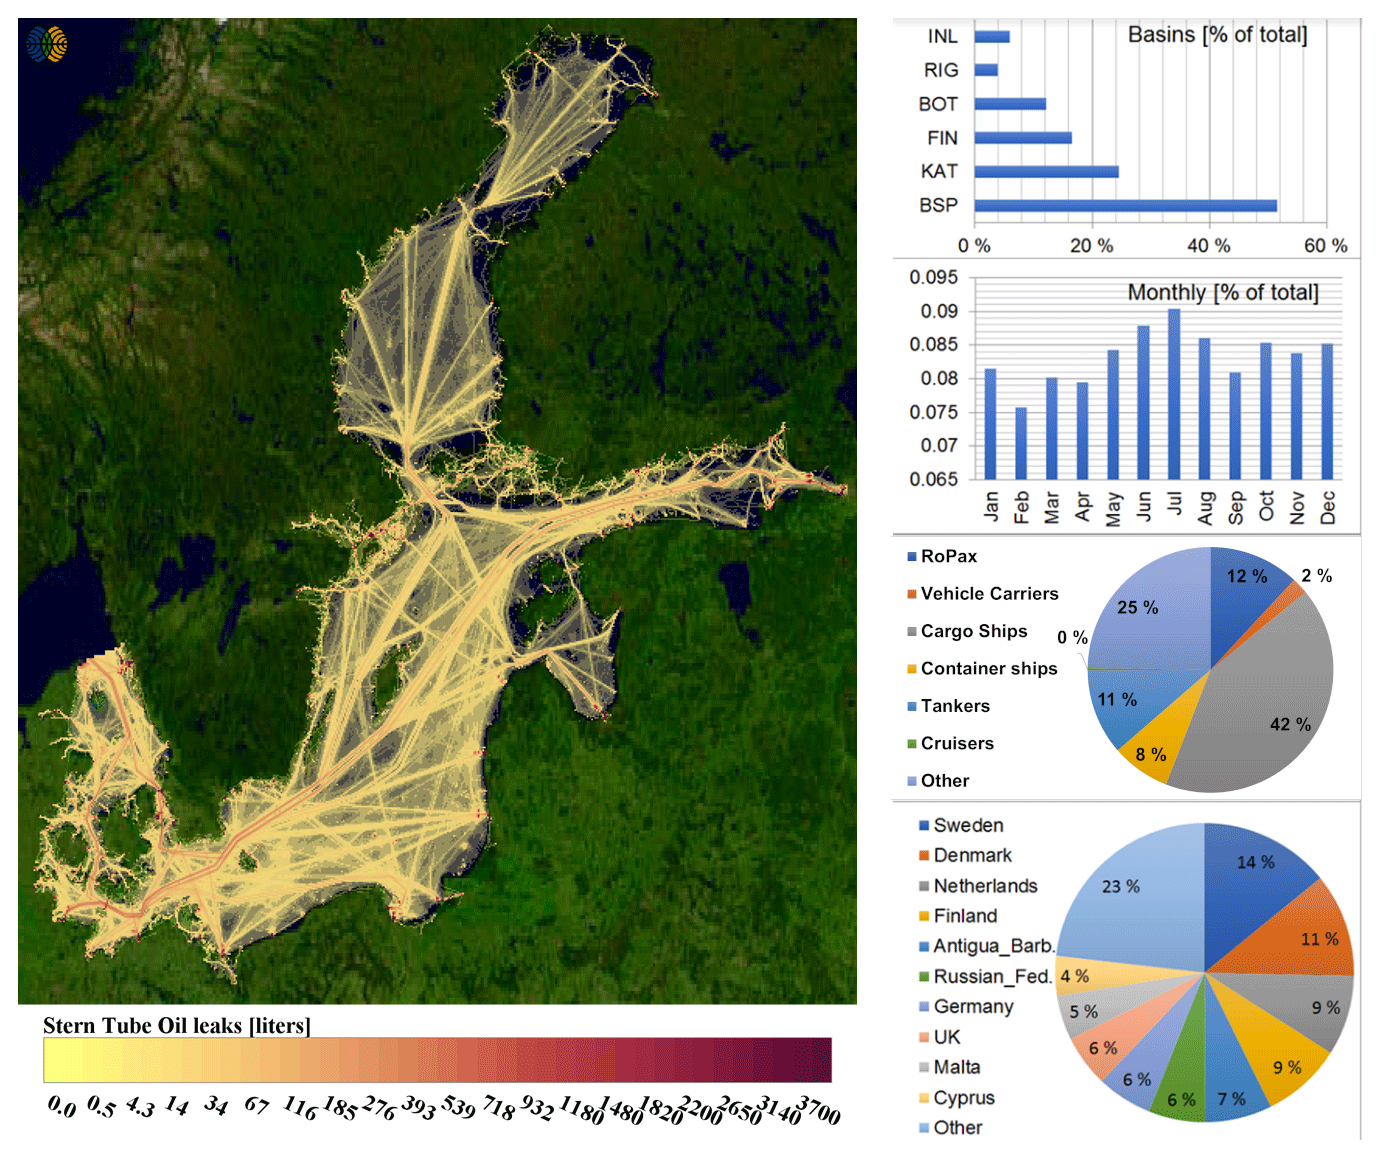
Figure 4Distribution of the annual stern tube oil releases for the year 2012 from the Baltic Sea shipping. Discharge volumes are indicated in litres per map grid area of 5 km2. Top right: share of stern tube oil released in various sub-basins of the Baltic Sea (INL: inland areas; RIG: Gulf of Riga; BOT: Bothnian Bay and Bothnian Sea; FIN: Gulf of Finland; KAT: Kattegat; BSP: Baltic Sea proper). The lower bar chart depicts the monthly variation in stern tube oil discharges. The upper pie chart summarises the contribution of various ship types to stern tube oil releases and the lower pie chart the flag state shares of stern tube oil releases. Map: background Landsat-8 image courtesy of the US Geological Survey.
The geographical distribution of the stern tube oil is similar to the vessels' activity pattern. Time integration of activity will highlight areas, like ports, where ships spend a significant amount of time. There exist several alternatives to stern tube oil, such as water lubrication (IMO, 2008b), environmentally acceptable lubricants or air guard sealing systems to eliminate the discharge of oil to the marine environment, but as long as mineral oil lubricants are allowed to be used it will continue to be a source of oil pollution to the Baltic Sea. Most of the stern tube oil leaks occur in the Baltic Sea proper and there is a maximum during the summer months. Dry-cargo ships are the largest source, over 3 times larger than the contribution from any other ship type.
3.3 Scrubber effluent
Introduction of scrubbers on ships has attracted a lot of attention among the ship owners as an economic way of coping to the strict sulfur rules of the SECAs. Vessels equipped with EGCS equipment were rare until the introduction of a strict 0.1 % sulfur limit in 2015. In 2012, there were only five vessels with an EGCS installed: three with open-loop and two with closed-loop systems. In 2012, these five vessels were responsible for 1.5 ×106 cm3 of wash water discharge, of which > 99 % came from open-loop systems (Figs. 5 and 6). A large increase in discharged water from EGCSs is anticipated at a global level in 2020 when the new global sulfur cap of 0.5 % is in force. Already in the Baltic Sea area, scrubber discharges have increased significantly; the 2018 estimates of scrubber discharges were estimated as 77 ×106 t from open-loop and 0.1 ×10⁶ t from the closed-loop systems, installed in 99 vessels (Jalkanen and Johansson, 2019).
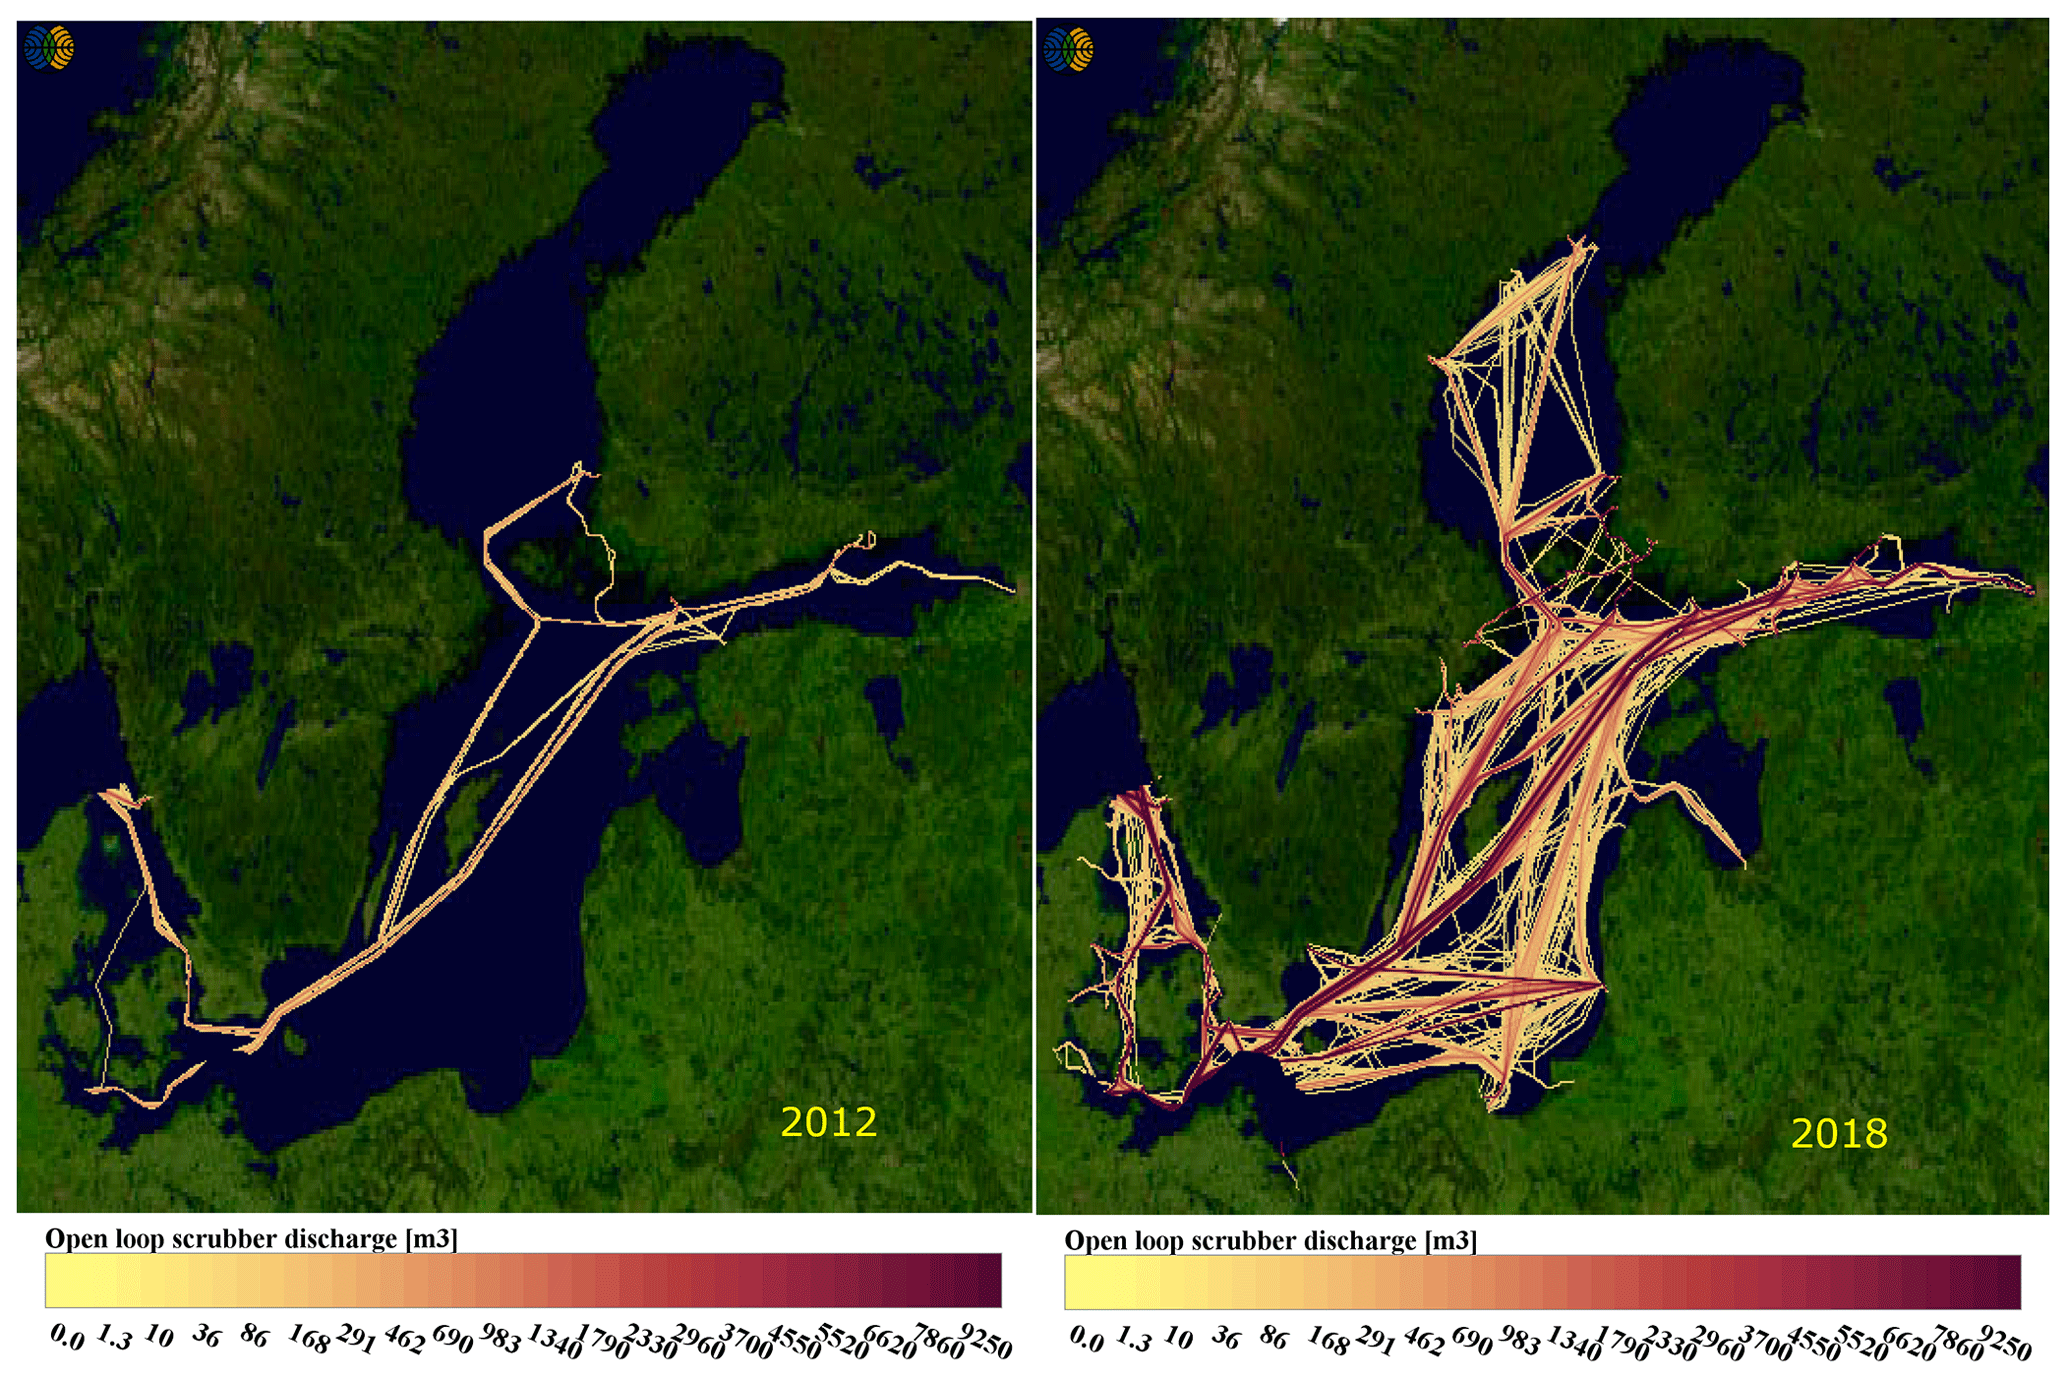
Figure 5Annual discharge of effluent from open-loop scrubbers during 2012 (left) and 2018 (right). Both images describe the discharge in units of cubic metres per map grid cell of 5 km2. A significant increase in open-loop scrubber effluent release was predicted based on the activity of scrubber-enabled vessels. Map: background Landsat-8 image courtesy of the US Geological Survey.

Figure 6Discharge of scrubber effluent from closed-loop systems during 2012 (left) and 2018 (right). The values for discharges are reported in units of cubic metres for each map grid cell of 5 km2. Map: background Landsat-8 image courtesy of the US Geological Survey.
This is already about 25 % of the ballast water discharge of 314 ×106 t in 2018 (Jalkanen and Johansson, 2019). Discharge from open-loop systems has raised concerns of water quality and has led to regional restrictions for operating open-loop scrubbers. For example, German ports have prohibited the release of scrubber water and vessels should switch to low-sulfur fuel instead. Similar bans have been introduced in other parts of the world (e.g. China, Singapore, Malaysia), whereas some others (Japan, South Africa) have specifically allowed scrubber discharges from open-loop systems.
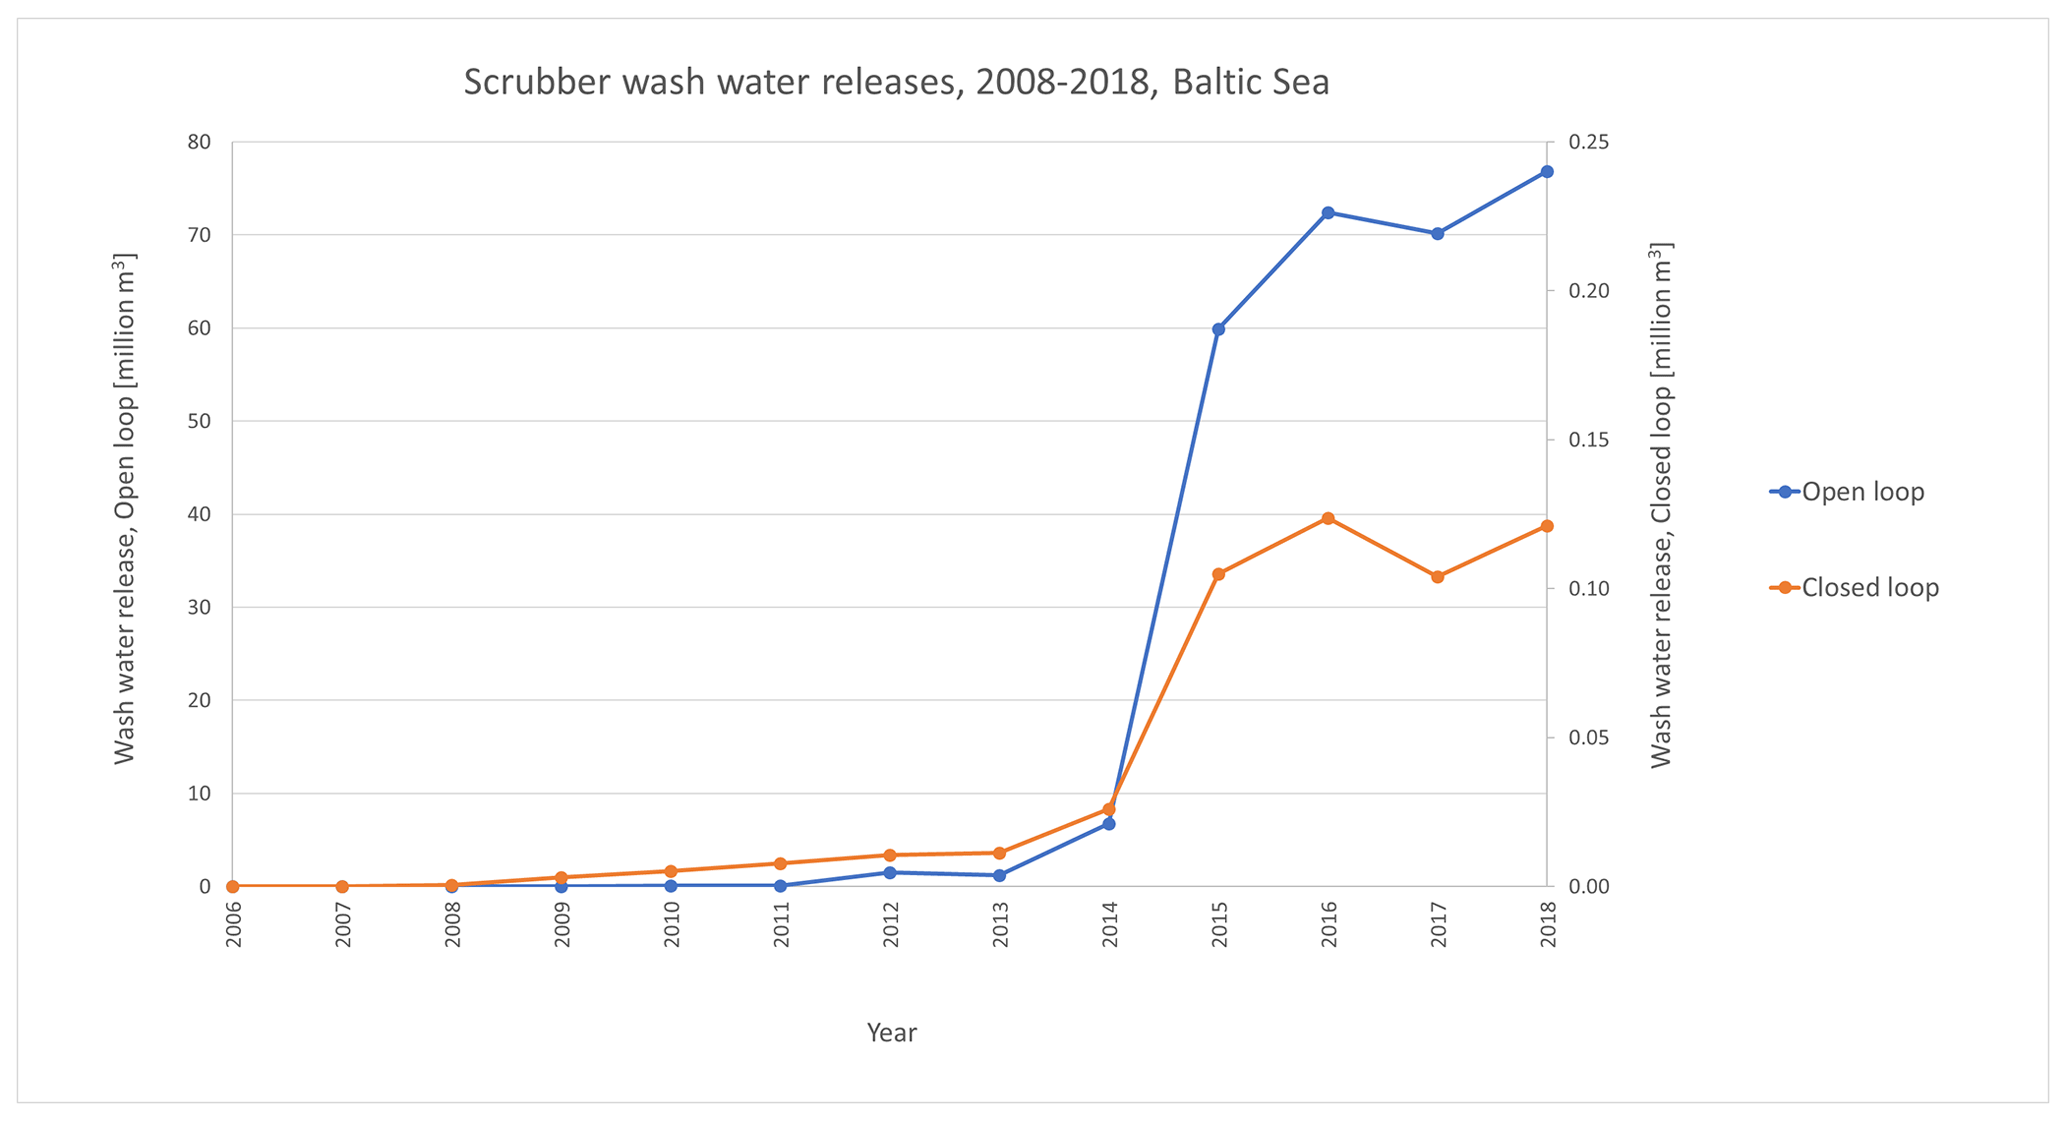
Figure 7Scrubber effluent discharge from the Baltic Sea fleet during 2006–2018. Image taken from HELCOM discharge report (Maritime19/13-4.INF).
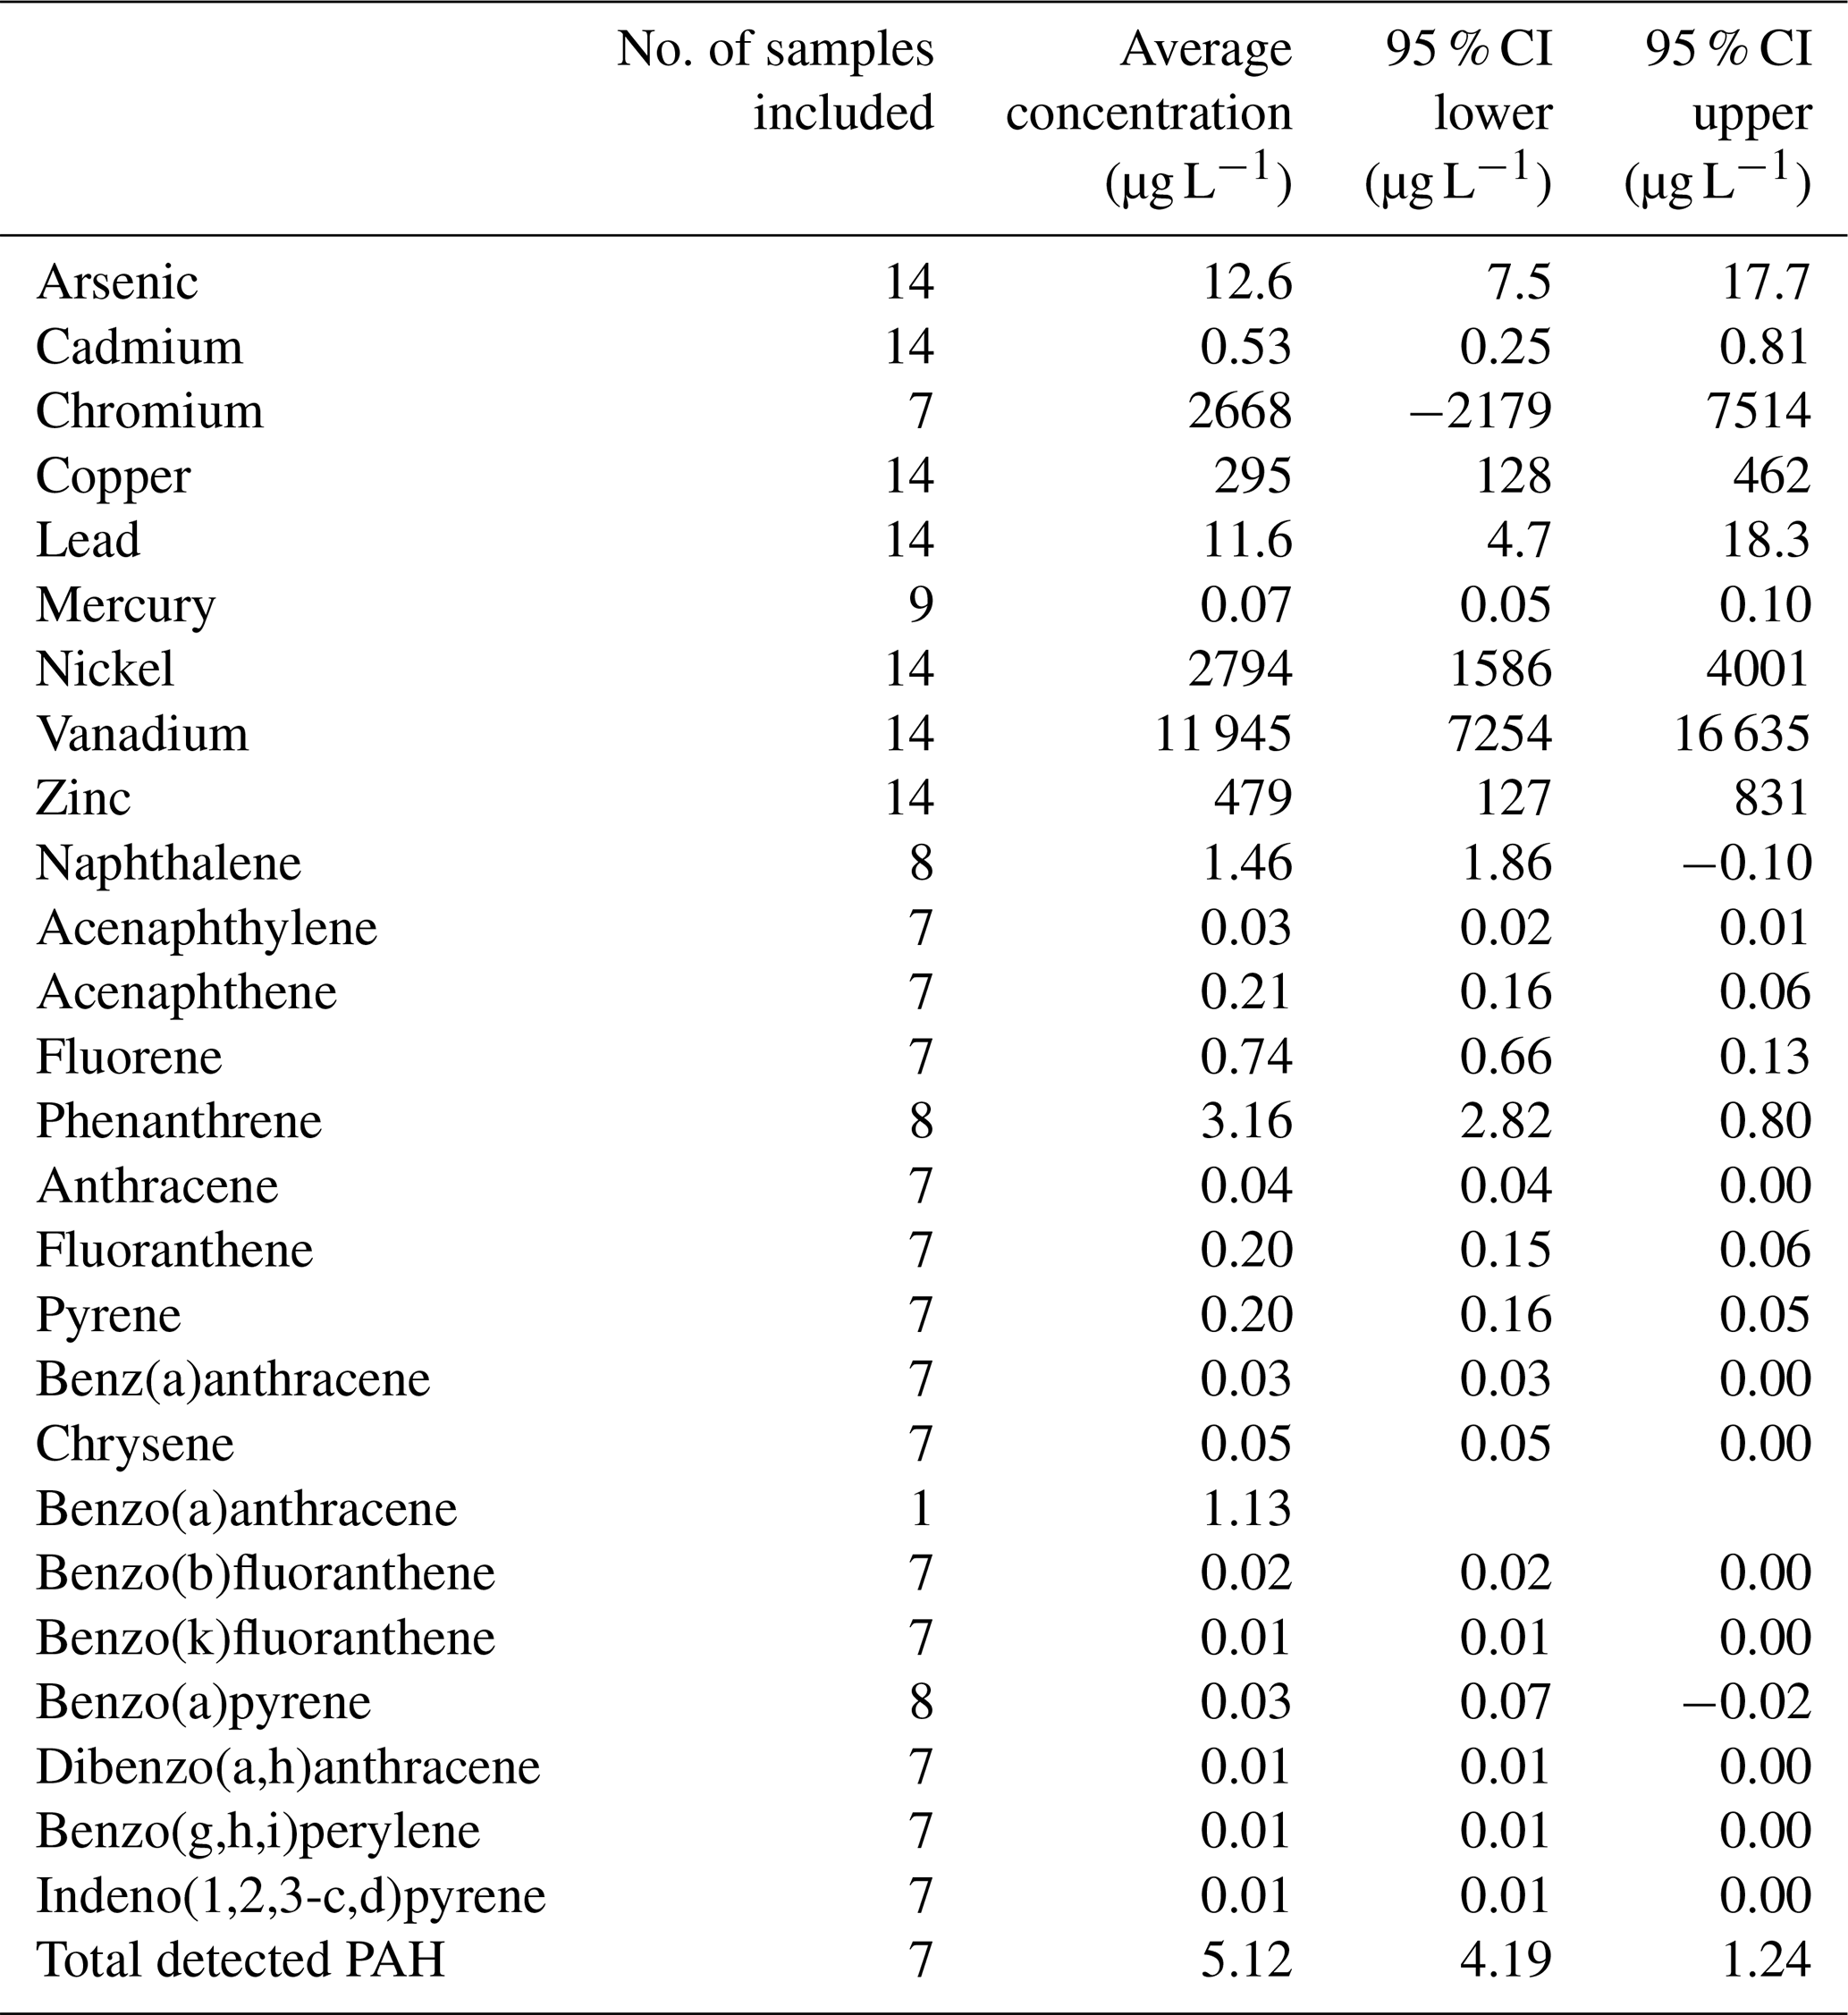
Regional rules for the Baltic Sea open-loop scrubbing are included for German waters, which are visible in Fig. 5. In these areas, vessels equipped with hybrid scrubbers are operated in closed-loop mode and ships with open-loop systems switch to low-sulfur fuels. It should also be noted that open-loop scrubbing becomes more difficult in the northern part of the Baltic Sea because of the decreasing alkalinity of brackish water. Currently, low alkalinity of seawater is only considered in the scrubber effluent modelling for the Baltic Sea, but with proper oceanographic datasets this feature could also be implemented globally. The literature review conducted in this paper found 56 measurements of scrubber wash water when the scrubber was operating in open-loop mode and 14 measurements in closed-loop mode (Hufnagl et al., 2005; IMO, 2018a; Kjølholt et al., 2012; Turner et al., 2017; US EPA, 2011b) (Appendix Tables A2 and A3). The data indicated a higher concentration of most contaminants in wash water from closed-loop systems. For example, copper concentration was on average 295 µg L−1 (95 % CI [128, 462]) as compared to 43.0 µg L−1 (95 % CI [26.8, 59.2]) in wash water in open-loop mode (Table 7). However, assuming a discharge rate of 45 m3 MWh−1 for open-loop wash water and 0.3 m3 MWh−1, the load of copper per MWh is significantly higher when the ship operated in open-loop mode (1.9 g MWh−1) as compared to closed-loop mode (0.06 g MWh−1). Figure 7 illustrates the development of scrubber effluent discharge from ships during the time period 2006–2018 (Jalkanen and Johansson, 2019). It should be noted that the scrubber discharge volumes have been increased by almost 2 orders of magnitude, which makes them currently the second-largest volumetric discharge from ships.
In December 2019, over 2000 vessels were included in the list of scrubber installations (IHS_Global, 2016). If a significant part of this group of vessels operates in enclosed areas, it may create problems for some marine species (Magnusson et al., 2018b). The rapid adoption of scrubbers was predicted after the IMO decision on global ship sulfur fuel reduction starting in 1 January 2020 (Faber et al., 2016).
3.4 Ballast water
The total annual load of ballast water to the Baltic Sea was modelled as 394 ×106 t in 2012. Tankers discharge the largest volume of ballast water (146 ×106 t) followed by dry-cargo ships (103 ×106 t). Discharge pattern of ballast water is very different from other discharges (Fig. 8) because ballast water operations occur mostly during cargo operations, which indicates significant discharge volumes near port areas. Water is taken in as ballast during cargo discharge to maintain vessel stability and proper immersion of the propeller and to be discharged when cargo is loaded to the vessel.
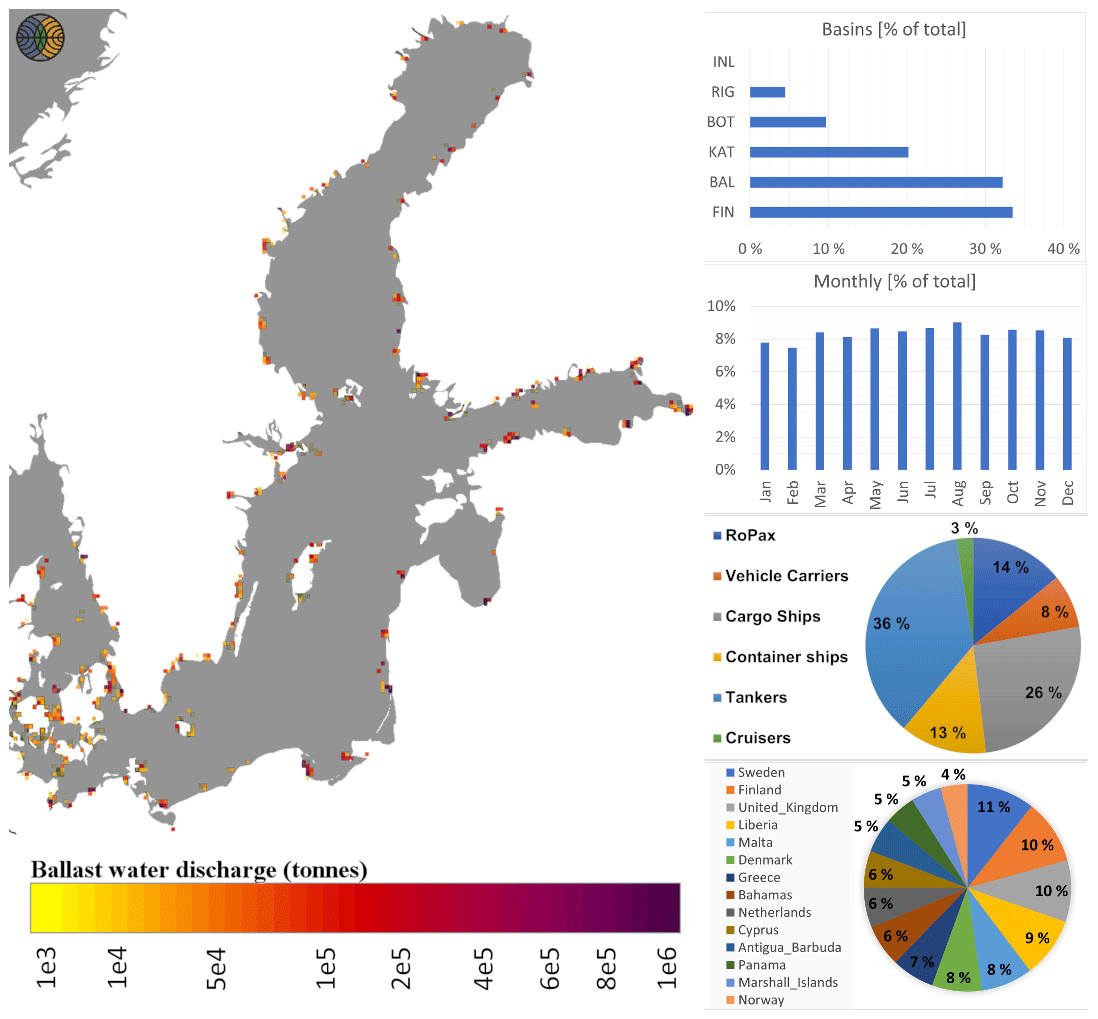
Figure 8Distribution of the annual ballast water releases for the year 2012 from the Baltic Sea shipping. Discharge volumes are indicated in tonnes per map grid area of 40 km2. Note the change in map resolution to highlight ballast water discharge locations on this map. Top right: share of ballast water released in various sub-basins of the Baltic Sea (INL: inland areas; RIG: Gulf of Riga; BOT: Bothnian Bay and Bothnian Sea; FIN: Gulf of Finland; KAT: Kattegat; BSP: Baltic Sea proper). The lower bar chart depicts the monthly variation in ballast water discharges. The upper pie chart summarises the contribution of various ship types to ballast water releases and the lower pie chart the flag state shares of ballast water releases. Map: background Landsat-8 image courtesy of the US Geological Survey.
Table 8Emission totals for antifouling paints in the Baltic Sea area during 2012. These numbers contain the contribution from the commercial fleet. The Chemical Abstracts Service (CAS) number is provided for each compound.

* Inorganic CuO and ZnO are reported as mass of Cu and Zn, not their oxides. For CuPyr, DCOIT and zineb molecular masses are used in mass reporting.
In this work, a description of ballast water discharge volume and pattern were identified, to facilitate future work on alien invasive species. However, this would require the identification of the location where ships have filled their ballast tanks, which was not included in this work. Regardless, our results can be used to assess the risk of alien species transfer if suitable water analysis is available. Previous estimates of 250 ×106 t of ballast water discharge have been reported based on earlier traffic estimates during the year 2011 (HELCOM, 2014b), whereas our modelling estimate is 1.6 times that volume. There can be several contributing factors to this discrepancy. Currently, our discharge estimate has not established the link with cargo flow recorded at ports by customs authorities but is instead based on vessel capacity instead. Further, the modelling assumes a complete discharge of all ballast water during port visits, which will lead to an estimate which is larger than in reality. Vessels may discharge part of their ballast water if only part of the cargo is left at port. Our current estimates of ballast water discharge may thus lead to a slightly higher risk of introducing alien species to the Baltic Sea area than in reality.
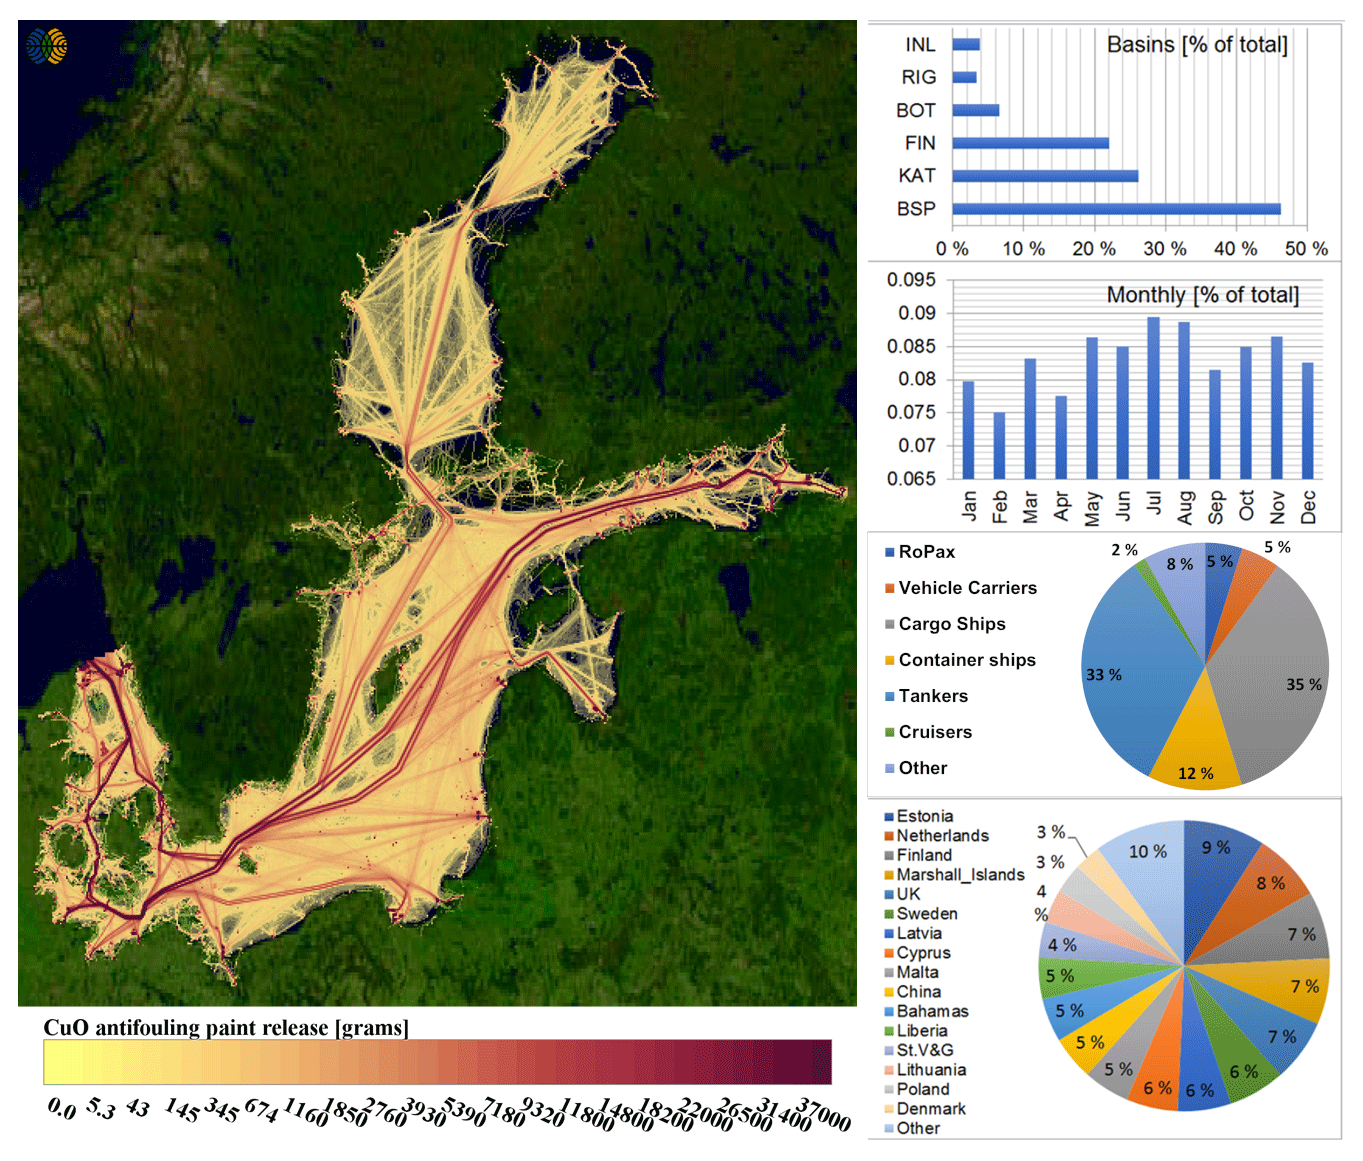
Figure 9Geographical distribution of the emissions of Cu(I)O from ship hull antifouling paints. The values reported by the colour scale indicate CuO releases in units of grams per map grid cell of 5 km2. Top right bar chart indicates the share of Cu(I)O releases by sea area (INL: inland areas; RIG: Gulf of Riga; BOT: Bothnian Sea and Bothnian Bay; FIN: Gulf of Finland; KAT: Kattegat; BSP: Baltic proper). The lower bar chart describes the monthly variation in CuO releases. The upper pie chart illustrates the estimated share of various ship types and the lower pie chart the flag state contributions to CuO releases. Map: background Landsat-8 image courtesy of the US Geological Survey.
To minimise the risk of spreading alien species via ballast water emissions, the IMO adopted the Ballast Water Management Convention (BWMC) in 2004, which entered into force in September 2017 and requires ships to manage their ballast water in such manner that aquatic organisms are removed or killed prior to discharge. The installation of the Ballast Water Management Systems (BWMSs) depends on when the ship is scheduled for IOPPC (International Oil Pollution Prevention Certificate) renewal, but all ships must have an approved BWMC installed by 2024 at the latest. The BWMS usually relies on filtration followed by UV radiation, biocidal treatment, deoxygenation and electro-chlorination (King et al., 2012). Given that 394 ×106 t of ballast water is being discharged into the Baltic Sea annually (in 2012), the requirement to treat ballast water is a new waste stream of contaminants to the Baltic Sea. In this work, the concentration of contaminants in 40 different BWMSs was compiled and is presented in the Supplement with references to the original data.
The spatial distribution of ballast water discharge indicates that these operations occur in ports. In reality, ballast water can also be exchanged during transit and should be done in quantities which are 3 times the required volumes to ensure proper tank flushing (IMO, 2018). However, the BWMC requires that water exchange is to be done in locations where the distance to the nearest land is at least 200 nautical miles and the depth of the sea is more than 200 m. These requirements are impossible to meet in the Baltic Sea area and the current HELCOM recommendation is to conduct ballast operations in ports.
3.5 Antifouling paint releases
Over 280 t Cu is being released to the Baltic Sea from ships coated with antifouling paints annually (Table 8). According to HELCOM, the waterborne input of copper is 890 t annually and comprises both natural and anthropogenic sources (antifouling paints excluded) (HELCOM, 2011). Monitoring data in Swedish coastal waters have shown 20 out of 36 assessed water bodies to have copper concentrations that exceed the Swedish water quality criteria used for Cu in the Baltic Sea (SWAM, 2018). Hence, the load of copper from ships coated with antifouling paint is significant.
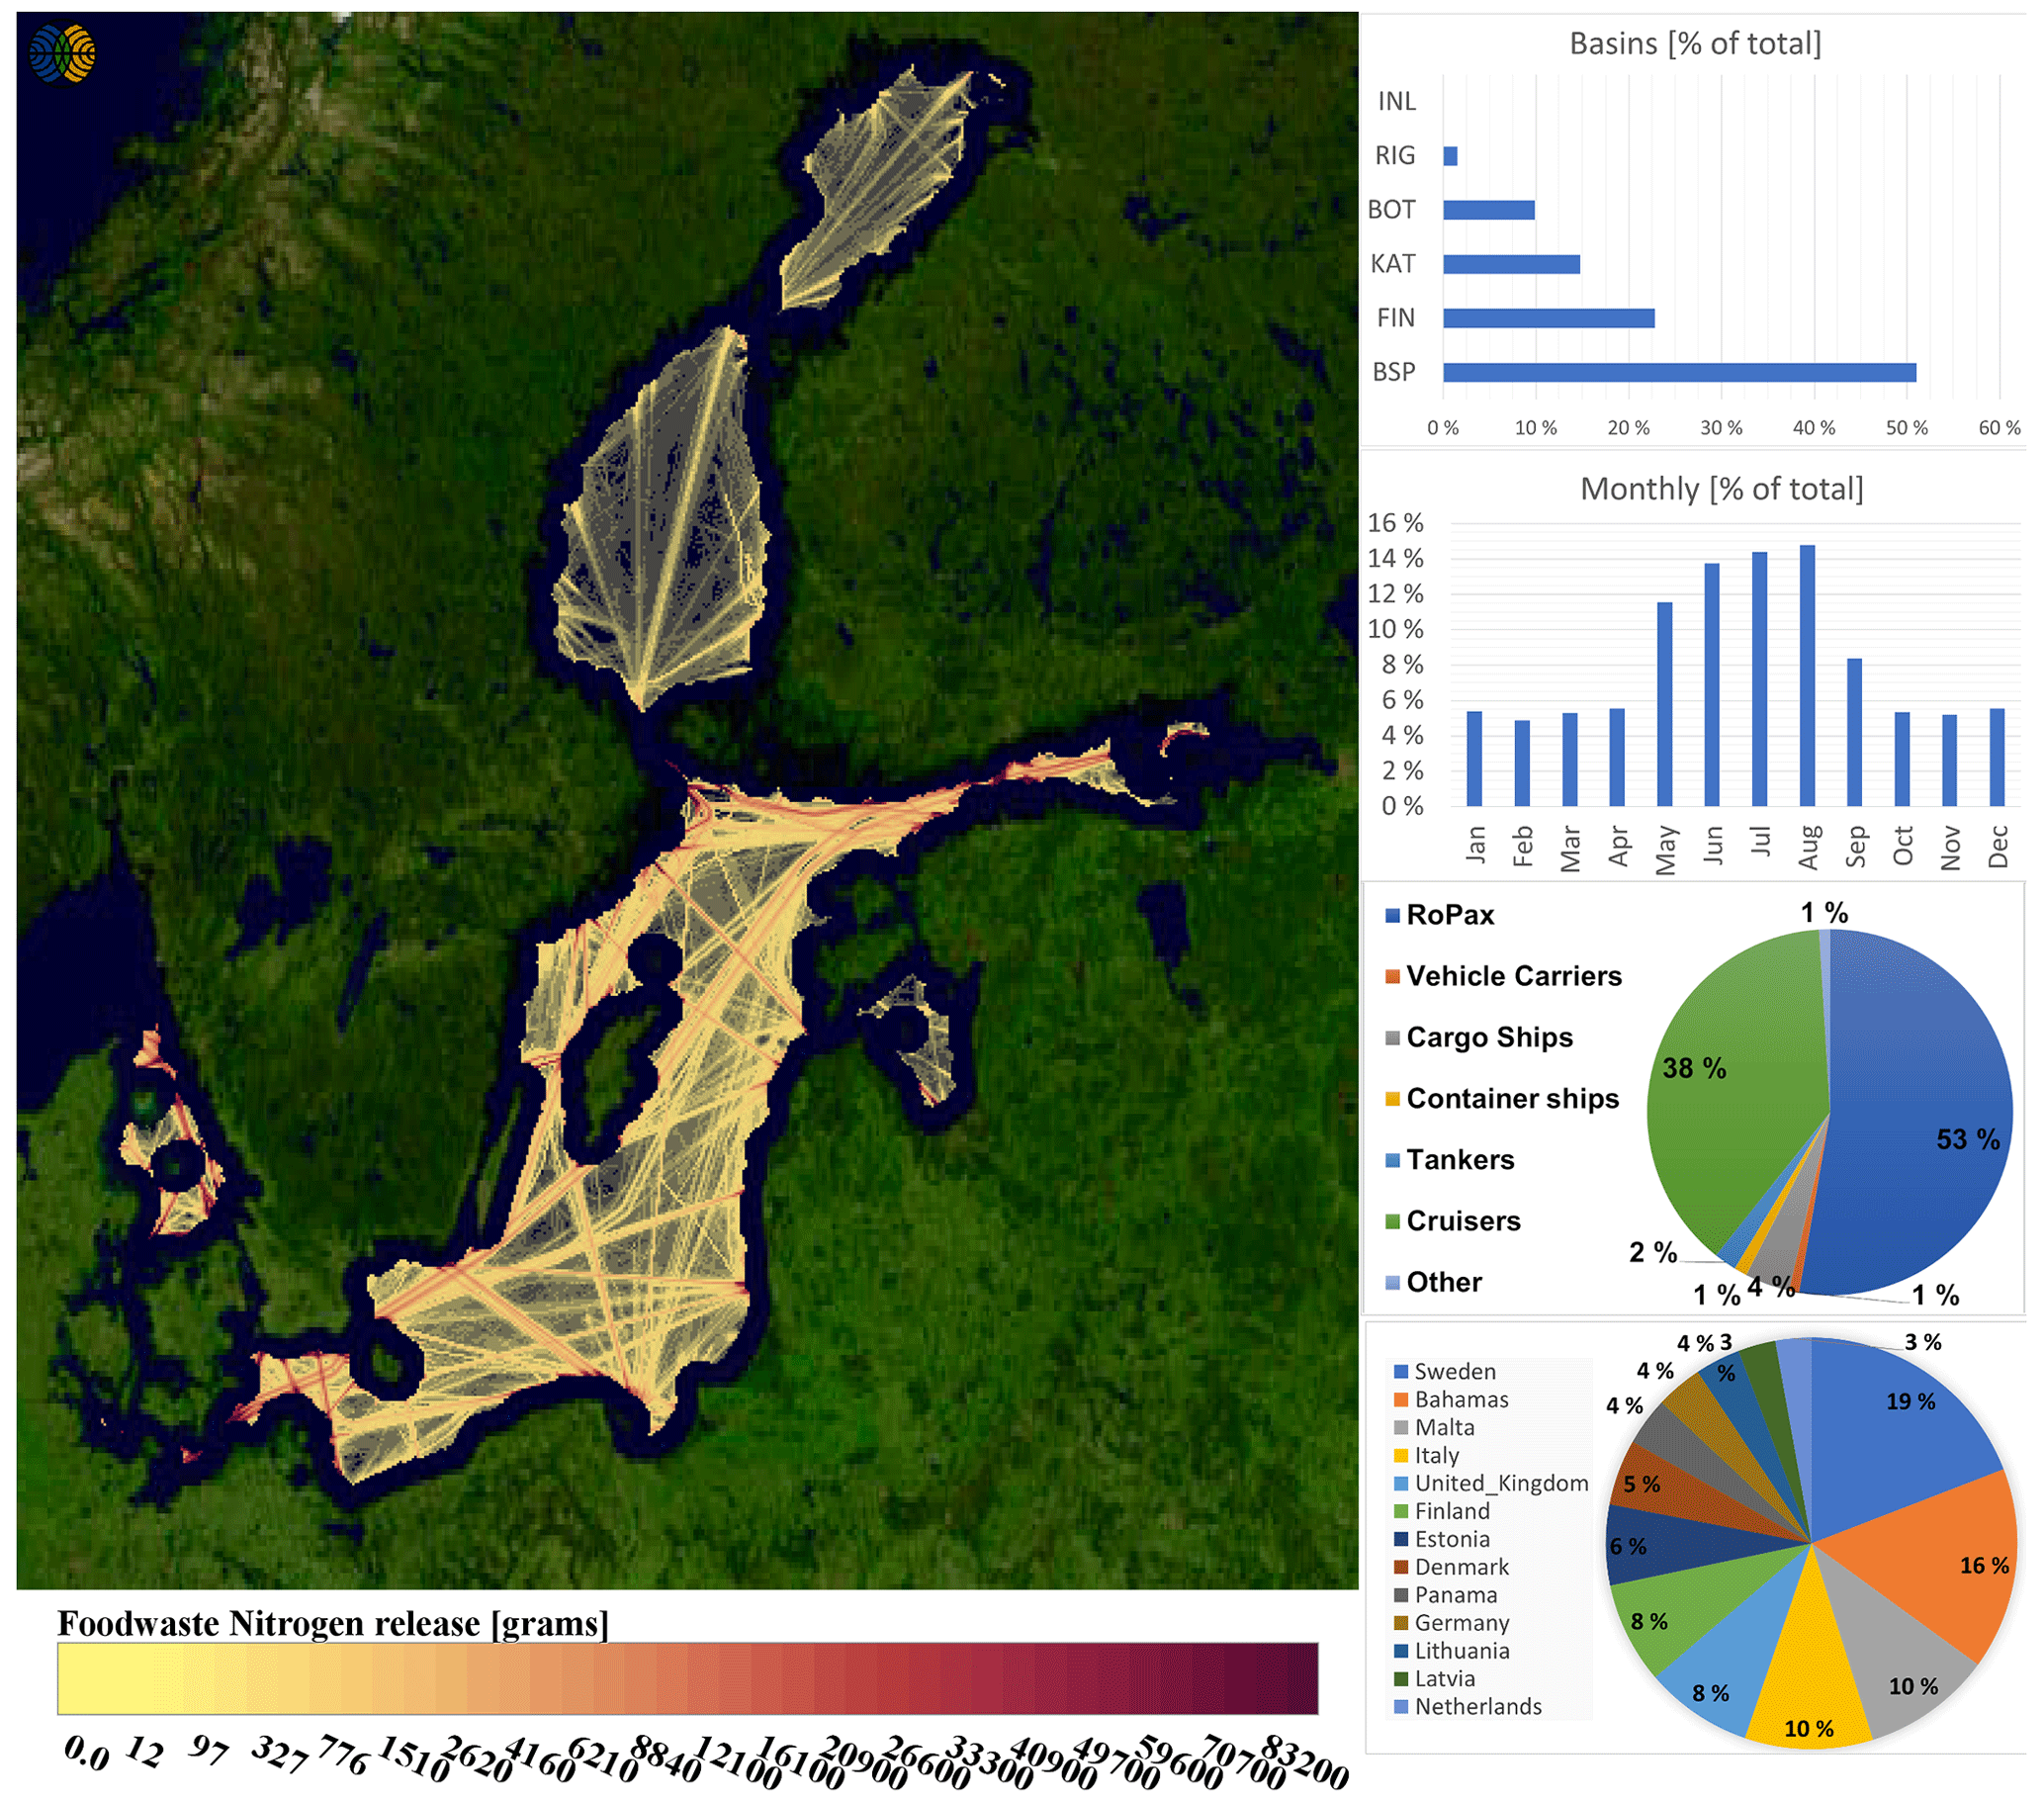
Figure 10Food waste nitrogen discharges from ships during 2012 in units of grams per map grid cell area of 5 km2. According to IMO rules, no discharge is allowed closer than 12 nm distance from the coastline. The upper bar chart describes the contributions by sub-basin and the lower bar chart the monthly variation. The upper pie chart depicts the ship type and the lower pie chart the flag state contributions to food waste nitrogen releases. Map: background Landsat-8 image courtesy of the US Geological Survey.
Another large source of copper to the Baltic Sea is the antifouling contribution from leisure boats, which are not reported in this work but were recently reported elsewhere (Johansson et al., 2020). The wet surface area of the Baltic Sea commercial ship fleet is about 44 ×106 m2, while the corresponding area for boats is about 7 ×10⁶ m2. Although, the wet surface area of a small boat is significantly smaller than that of a ship, there exist about 60 times more boats than ships in the Baltic Sea area. Small boats are primarily used during summer and are taken out of the water and stored for winter months, whereas the ship fleet operates throughout the year. Further, the activity patterns of small boats and commercially operated ships are different; small boats tend to move close to the shoreline, whereas big ships follow the shipping lanes (Fig. 9).
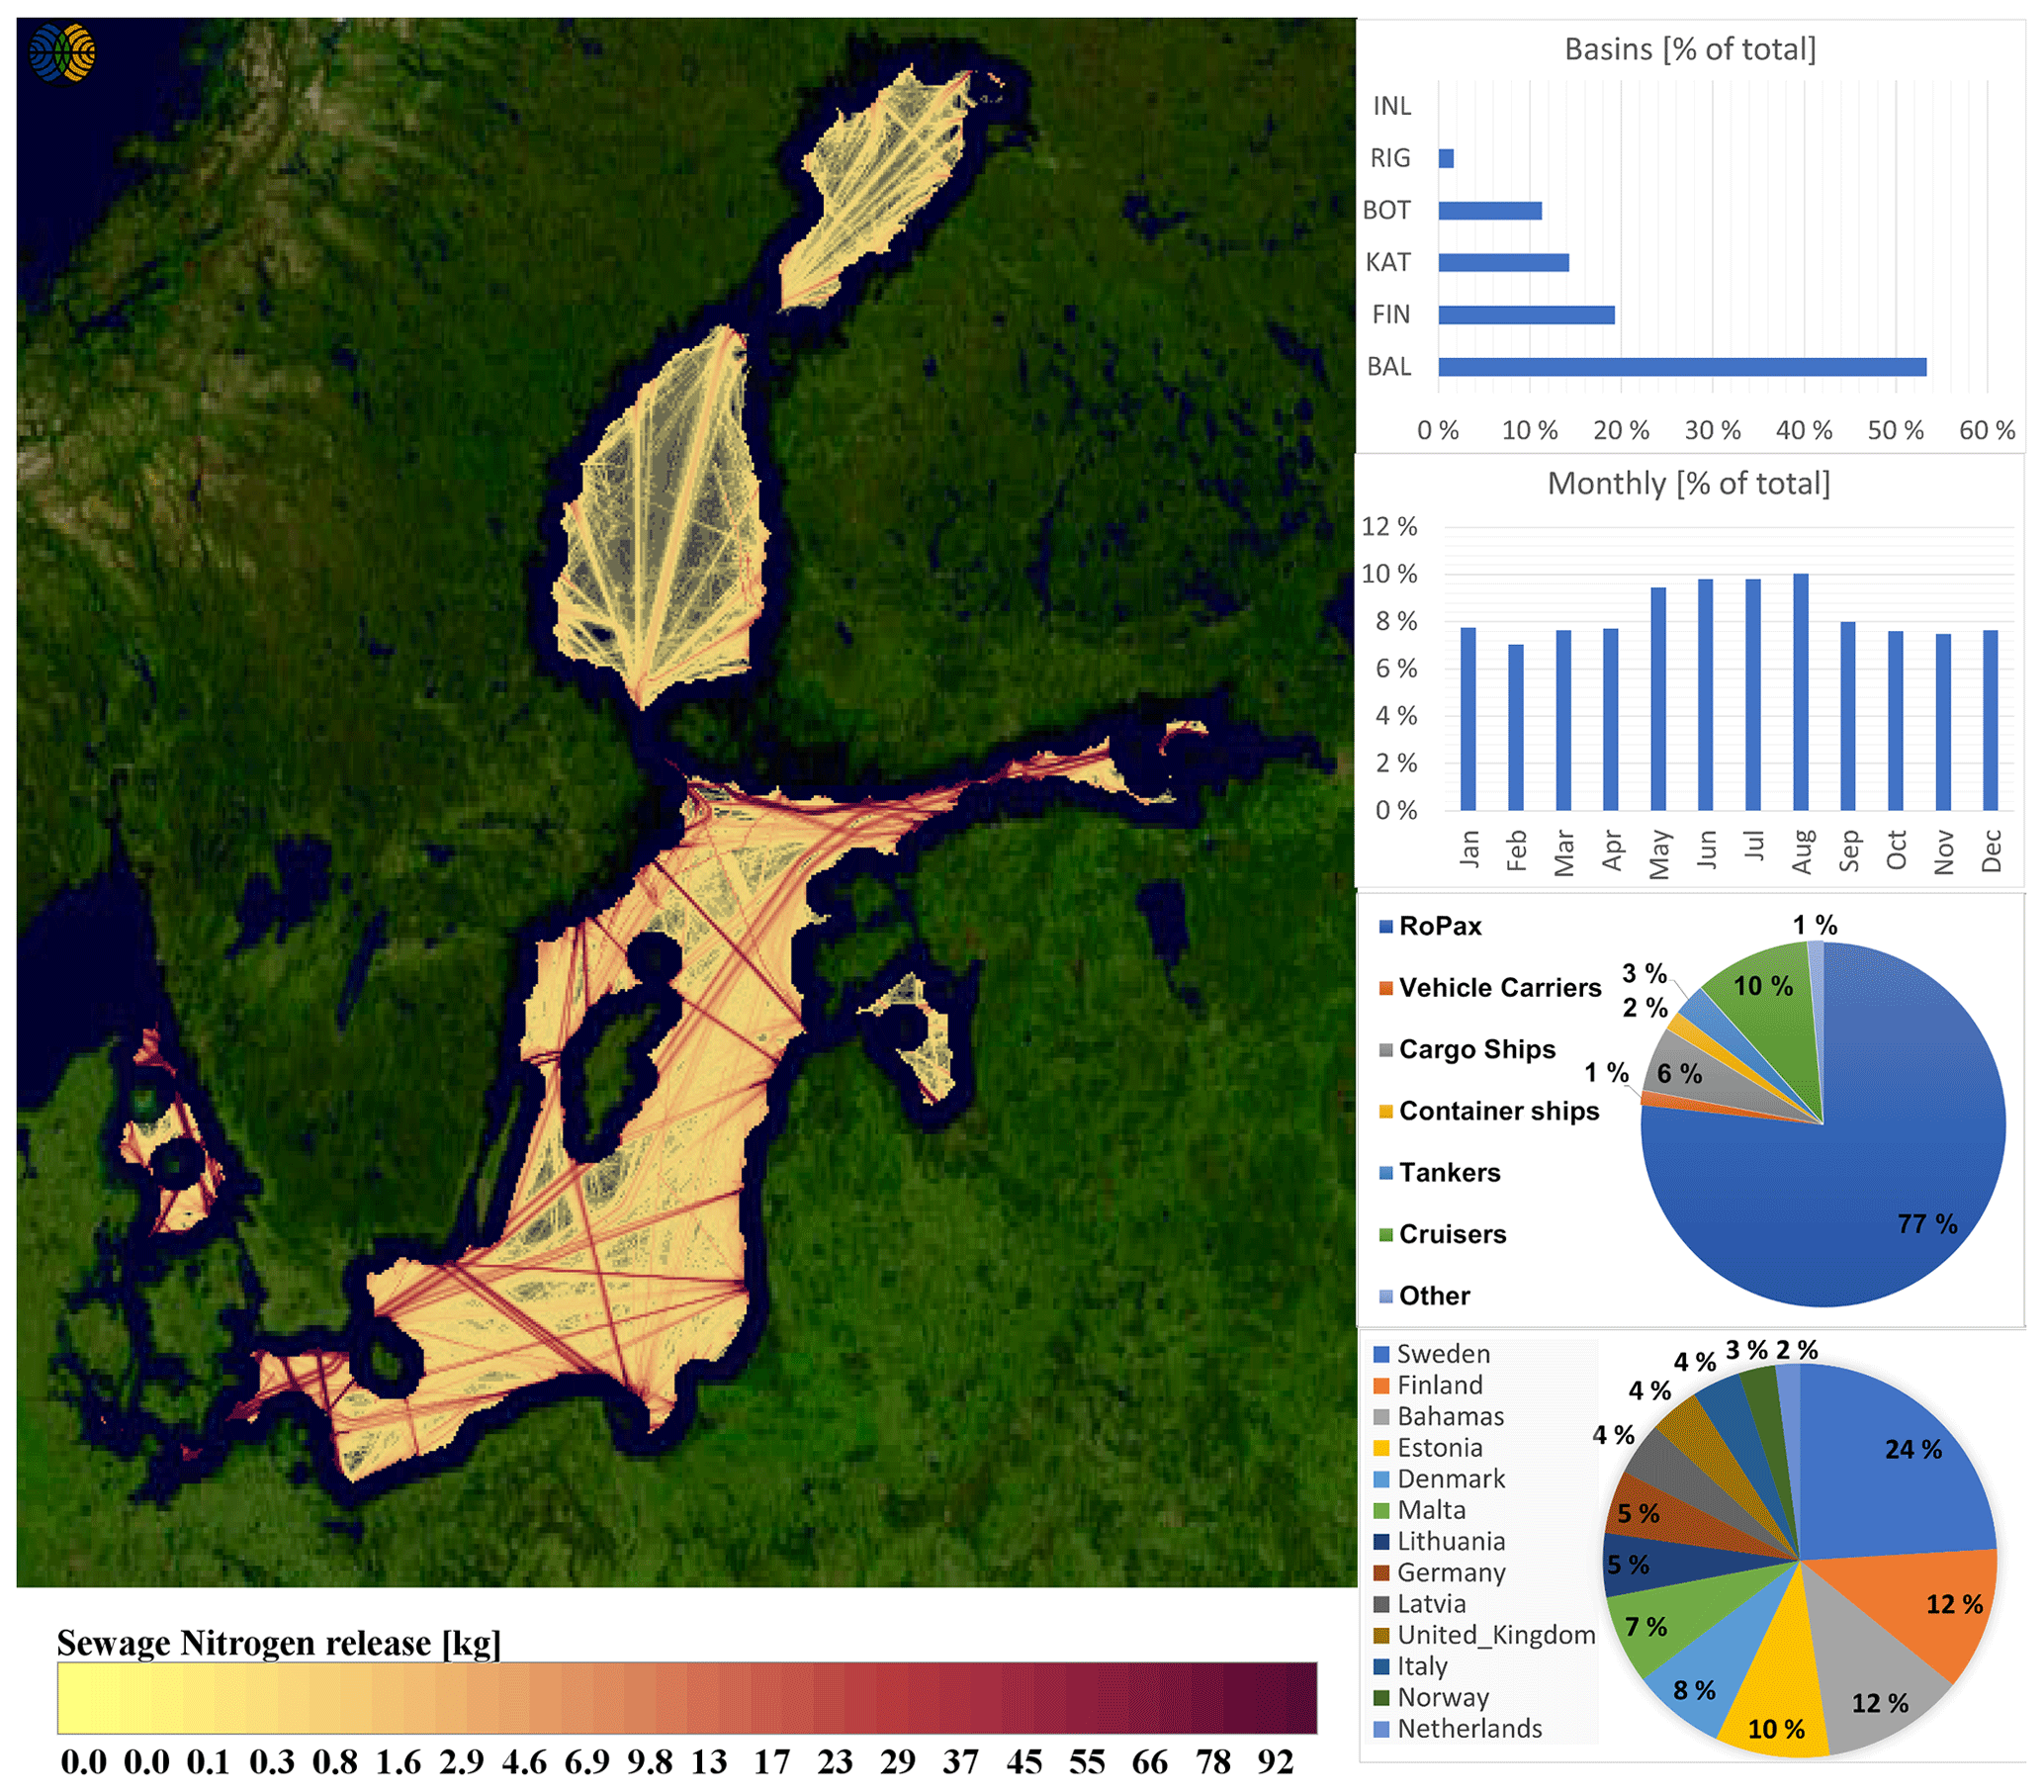
Figure 11Sewage nitrogen discharges from ships during 2012 in units of kilograms per map grid cell area of 5 km2. According to IMO rules, no discharge is allowed closer than 12 nm distance from the coastline. the upper bar chart describes the contributions by sub-basin and the lower bar chart the monthly variation. The upper pie chart depicts the ship type and the lower pie chart the flag state contributions to sewage nitrogen releases. Map: background Landsat-8 image courtesy of the US Geological Survey.
The spatial copper (CuO) release distribution from antifouling paints characterises general shipping activity across the Baltic Sea. The emission increases gradually toward the southern Baltic proper as shipping traffic from different ports merges into the main shipping lanes. The annual leeching of AFP along at the shipping lanes ranges from 3.2 kg km−2 in the Northern Quark strait (separates the Bothnian Bay from the Bothnian Sea; see Fig. 2) up to 70 kg km−2 in the Øresund Strait. There are distinctive hotspots in and near the port areas where annual AFP releases can be an order of magnitude higher than at shipping lanes.
The AFP emission totals reported in this paper reflect the values obtained for the commercial fleet only, and it has been assumed that the leaching rate of the hull paint remains constant regardless of the movement of the vessel. Strictly speaking, this may underestimate the paint release rate, especially in cases where recently painted hull surface is exposed to water (Kojima et al., 2016). However, the leaching rates for surfaces which have been exposed to sea water stabilise over time and leaching rates of surfaces with paint layers older than 1 month still show some dependency on speed, but the differences are much smaller than in cases of fresh paints. Recent studies conducted in the Baltic Sea and the more saline Swedish west coast have also observed that leaching rates of copper increase with increasing salinity (Lagerström et al., 2018, 2020; Ytreberg et al., 2017). Temperature is another parameter known to control the leaching of copper as well as the presence of biofilm on the coating (Valkirs et al., 2003). The approach taken in this paper (and STEAM) allows future work with primarily speed-, salinity- and temperature-dependent antifouling paint releases. Maps for other antifouling paint residues can be found in the Supplement. It should be noted, that this work does not evaluate the use of galvanic corrosion protection, which is also a source of copper and zinc to the marine environment (Rousseau et al., 2009).
3.6 Food waste, black water and grey water
The spatial distribution (Fig. 10) of food waste discharge is concentrated on areas outside the 12 nautical mile distance from the shore. Over 90 % of the nitrogen in food waste comes from passenger ships, which carry many people on board. Most of the food waste release happens during the summer, when the cruise vessel traffic activity is high. The summer period also exhibits a maximum of the air emissions from ships, and part of the nutrients enter the Baltic Sea through the air. Air emissions from Baltic Sea ships have been discussed in Karl et al. (2019a, b) and are therefore not discussed here.
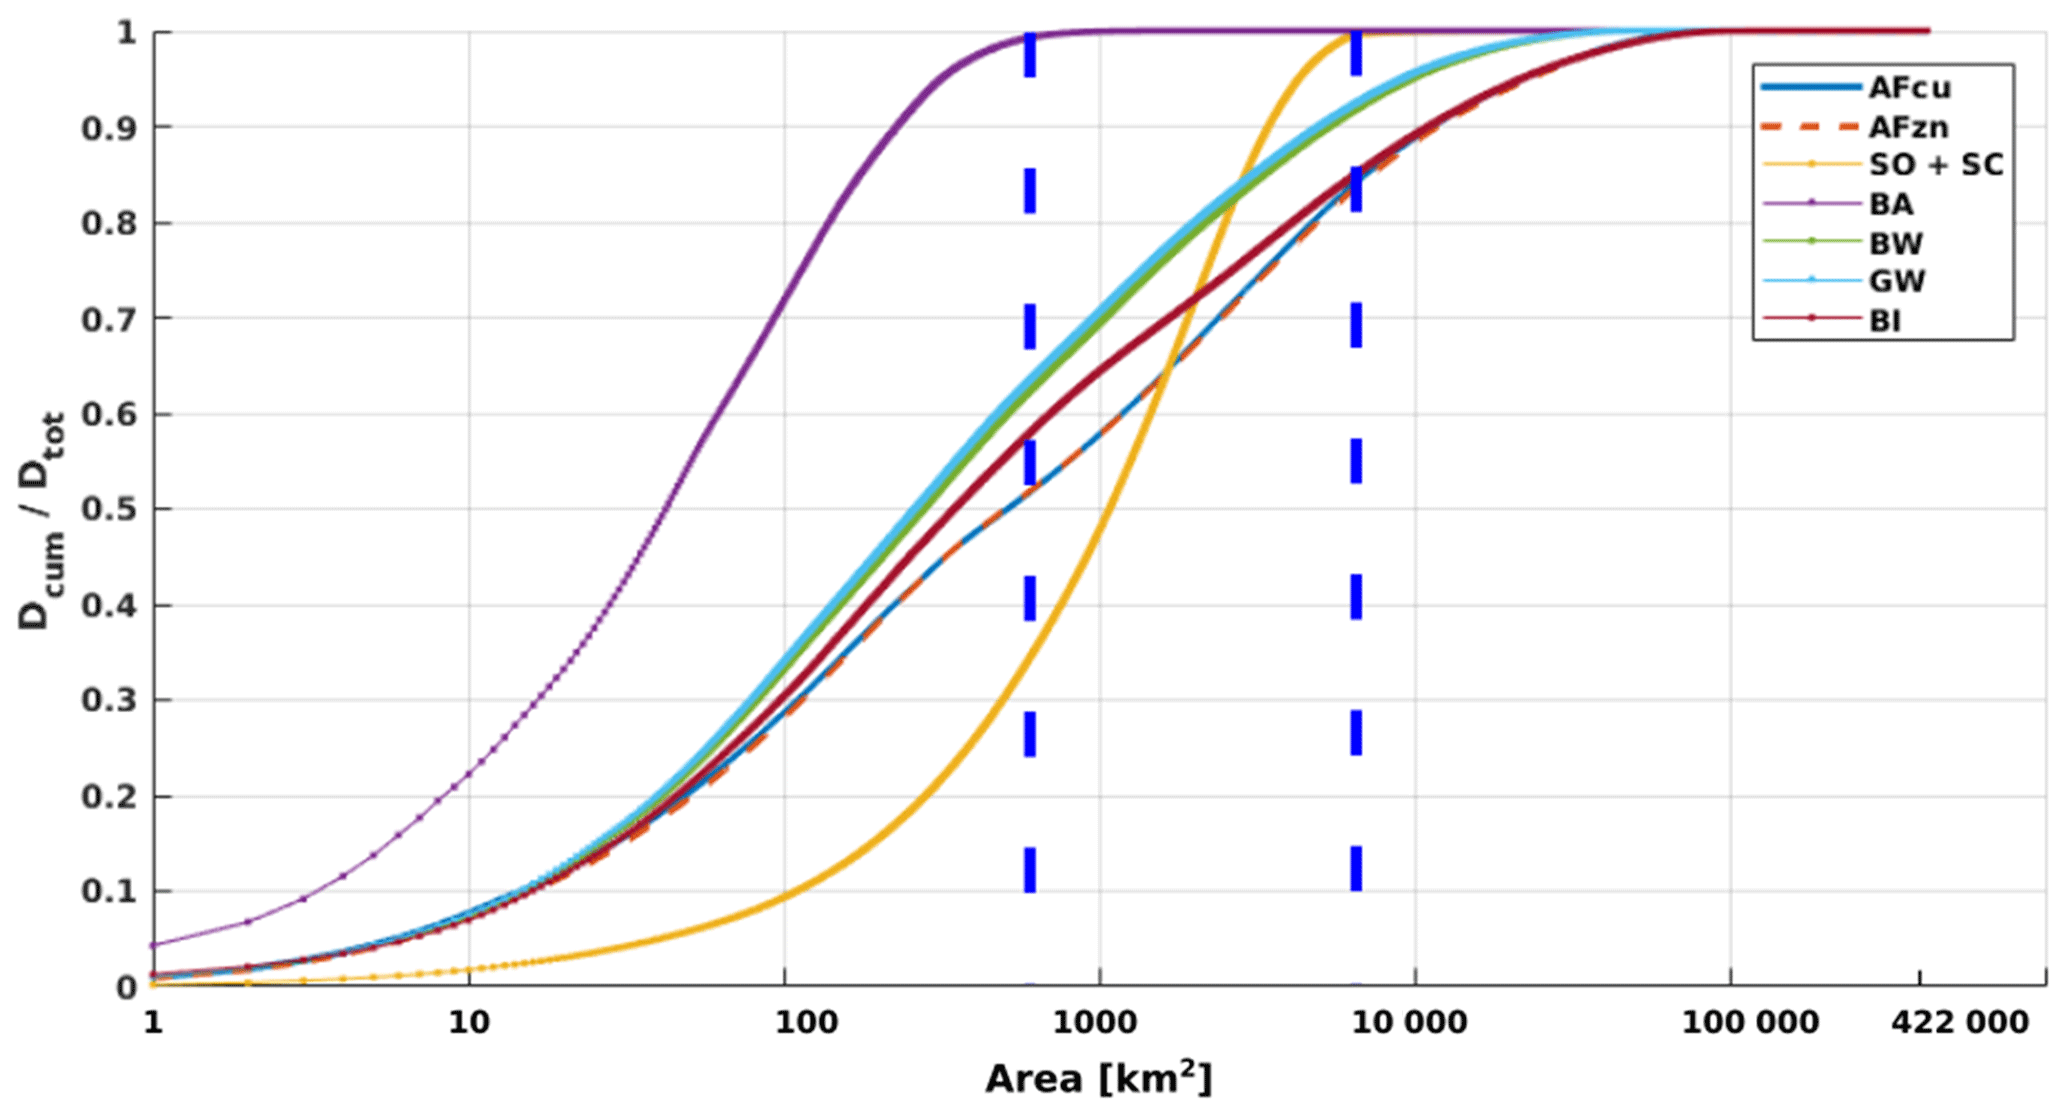
Figure 12The cumulative discharges over the area of the Baltic Sea divided by the total discharges for the year 2012. Vertical blue dashed lines correspond to the areas of total load of the ballast water and scrubber water discharges. AFCu: antifouling paint release CuO; AFzn: antifouling paint release ZnO; SO + SC: scrubber effluent release both from open- and closed-loop systems; BA: ballast water discharge; BW: sewage release; GW: grey water discharge; BI: bilge water release.
In reality, many vessels pump their wastewater to port reception facilities, but there also exist a few of those which pump everything into the sea. Our modelling approach is likely to result in an overestimation of nutrient release to some regions of the sea because of this feature. However, we have reduced the overall release rate according to the fraction of ships which leave their waste in ports during harbour stays. This will spread the sewage releases throughout the whole area where discharge is allowed, but it may lead to a more realistic description of discharge totals than the assumption where everything is released into the sea and nothing is left in port reception facilities (Fig. 11). In reality, there exist vessel routes where all waste is left in port, but our current knowledge of vessel operations does not allow the inclusion of this feature. From 2021 onwards, all passenger vessels must leave their sewage in port reception facilities (HELCOM, 2014a), whereas for cargo ships waste release is still allowed according to the IMO regulations.
The estimated total reduced nitrogen (M=14 g mol−1) input to the sea from black water and food waste was 556 and 82 t in 2012, respectively. From these totals, 487 and 76 t were from passenger vessels. In the case of phosphorus, food waste, sewage and grey water contributions were estimated as 24, 42 and 40 t for the whole Baltic Sea fleet as reported earlier (Wilewska-bien et al., 2019).
From 2021 onwards, most of the passenger ship fleet operating in the Baltic Sea area will not be able to release their sewage to the sea, but there exists an extension until the year 2023 for vessels operating between the North Sea and St. Petersburg, Russia. All sewage must be discharged to the port reception facilities from that date on, but this requirement only applies to passenger vessels, but passenger vessels are responsible for 88 % of the nitrogen in sewage and over 90 % of the nitrogen in food waste releases to the sea. This decision alone will reduce the nitrogen release from 556 to 69 t (reduced nitrogen) and increase the wastewater reception of ports by 1 ×10⁶ t. According to MARPOL Annex IV, a similar requirement does not apply to food waste release from ships, which would further reduce the annual nitrogen load by 76 t. Currently, there is no viable enforcement practice in place to control whether these rules are followed.
The normalised cumulative distribution of annual discharges from different waste streams as the function of Baltic Sea surface area summarises the spatial distribution of the sources (Fig. 12). Ballast water is discharged as point sources with the highest load at a single location accounting for about 4 % of the total load. The total area of ballast water discharges is less than 500 km2, which accounts for less than 0.12 % of the total area of the Baltic Sea. Scrubber wash water is discharged along the main shipping lanes without significant hotspots. This is represented by a slow increase in the cumulative distribution curve at small area values. A rapid increase in the cumulative load between 500 and 6300 km2 accounts for major shipping lane discharges. Antifouling paint contaminants and bilge, grey water and sewage discharges consist of point sources, ship lanes and low-traffic area distributions covering a large part of the Baltic Sea. In the case of mixed loading, approximately 50 %–60 % of antifouling and bilge, black water and grey water discharge can be related to hotspots, ∼ 25 % to the major shipping lanes and the remaining 10 %–15 % to the low-traffic areas. Grey water and black water have similar spatial discharge patterns represented by overlapping curves. A similar spatial distribution holds for Cu and Zn antifoulants as all ships leach both contaminants simultaneously. Black water and grey water point sources represent large discharges when the ships have passed the 12 nm restriction zone.
In this paper, we have reported the methodology which was used to add a new capability to the existing ship emission model STEAM: discharges of waste streams and the release of antifouling paints to the marine environment. These enable new studies on discharges to the sea from ships, based on the realistic vessel activity and technical description. In contrast to the atmospheric exhaust emissions, water discharges are released directly to the sea and contain various contaminants and nutrients. Also, atmospheric emissions occur at places where fuel combustion occurs, which is different from discharges. There exists a large group of regulations which define which releases are allowed in various areas. This complicates the modelling work.
The modelling of water pollutants from ships requires an analysis of maritime environmental law in various countries because several exceptions exist to the IMO requirements. The work reported here covers most of the annexes of the IMO MARPOL convention, includes antifouling and ballast water management convention rules, and enables us to extend the evaluation of environmental impact of shipping beyond atmospheric studies. Some of these exemptions concern specific areas or countries (bilge water releases) or address specific technologies (open-loop scrubbers) or other regional rules (sewage release restrictions for passenger vessels). We have attempted to include these requirements in this work as much as possible, but the current approach assumes that all ships comply with every rule, which may not always be the case. For example, the compliance rate for the sulfur rules is high but not necessarily 100 % (European Commission, 2018; Kattner et al., 2015).
A strong increase in scrubber effluent releases was to be expected after the sulfur rule change in SECAs from 2015 onwards. This will probably happen also on a global scale after the global 0.5 % sulfur regulation starts. A significant increase in scrubber effluent release underlines the need to conduct a thorough impact assessment of this new pollution source to the marine environment. For this purpose, ecotoxicological studies are urgently needed to get a holistic view and assess whether changes to sulfur reduction methods are necessary. Antifouling paints were identified as a major source of copper from ships. Since the ban of TBT in hull paints, other organometallic compounds have been developed to replace tin, but further work is needed to learn how big a problem high copper releases are in the marine environment.
This work fills some of the gaps in knowledge of the quantities of ship-generated water pollutants as we have taken first steps in this direction. This paper lists discharges from the Baltic Sea ship fleet during the calendar year 2012. It also identifies several research topics which need further attention in the future in order to reduce the uncertainties involved in emission modelling. Some of these contributions will be reported in following papers, like small-boat emission modelling, water and air dispersion studies, but others require further experimental work to reduce the uncertainties involved in the modelling work.
To obtain the mass of contaminants and nutrients, the water volumes from STEAM3.2 need to be multiplied with the results of the water analysis (mass-to-volume ratio). The concentration values used in this work are given in the tables below.
Table A1Concentration of contaminants and nutrients in bilge water. The complete dataset and references are presented in the Supplement.
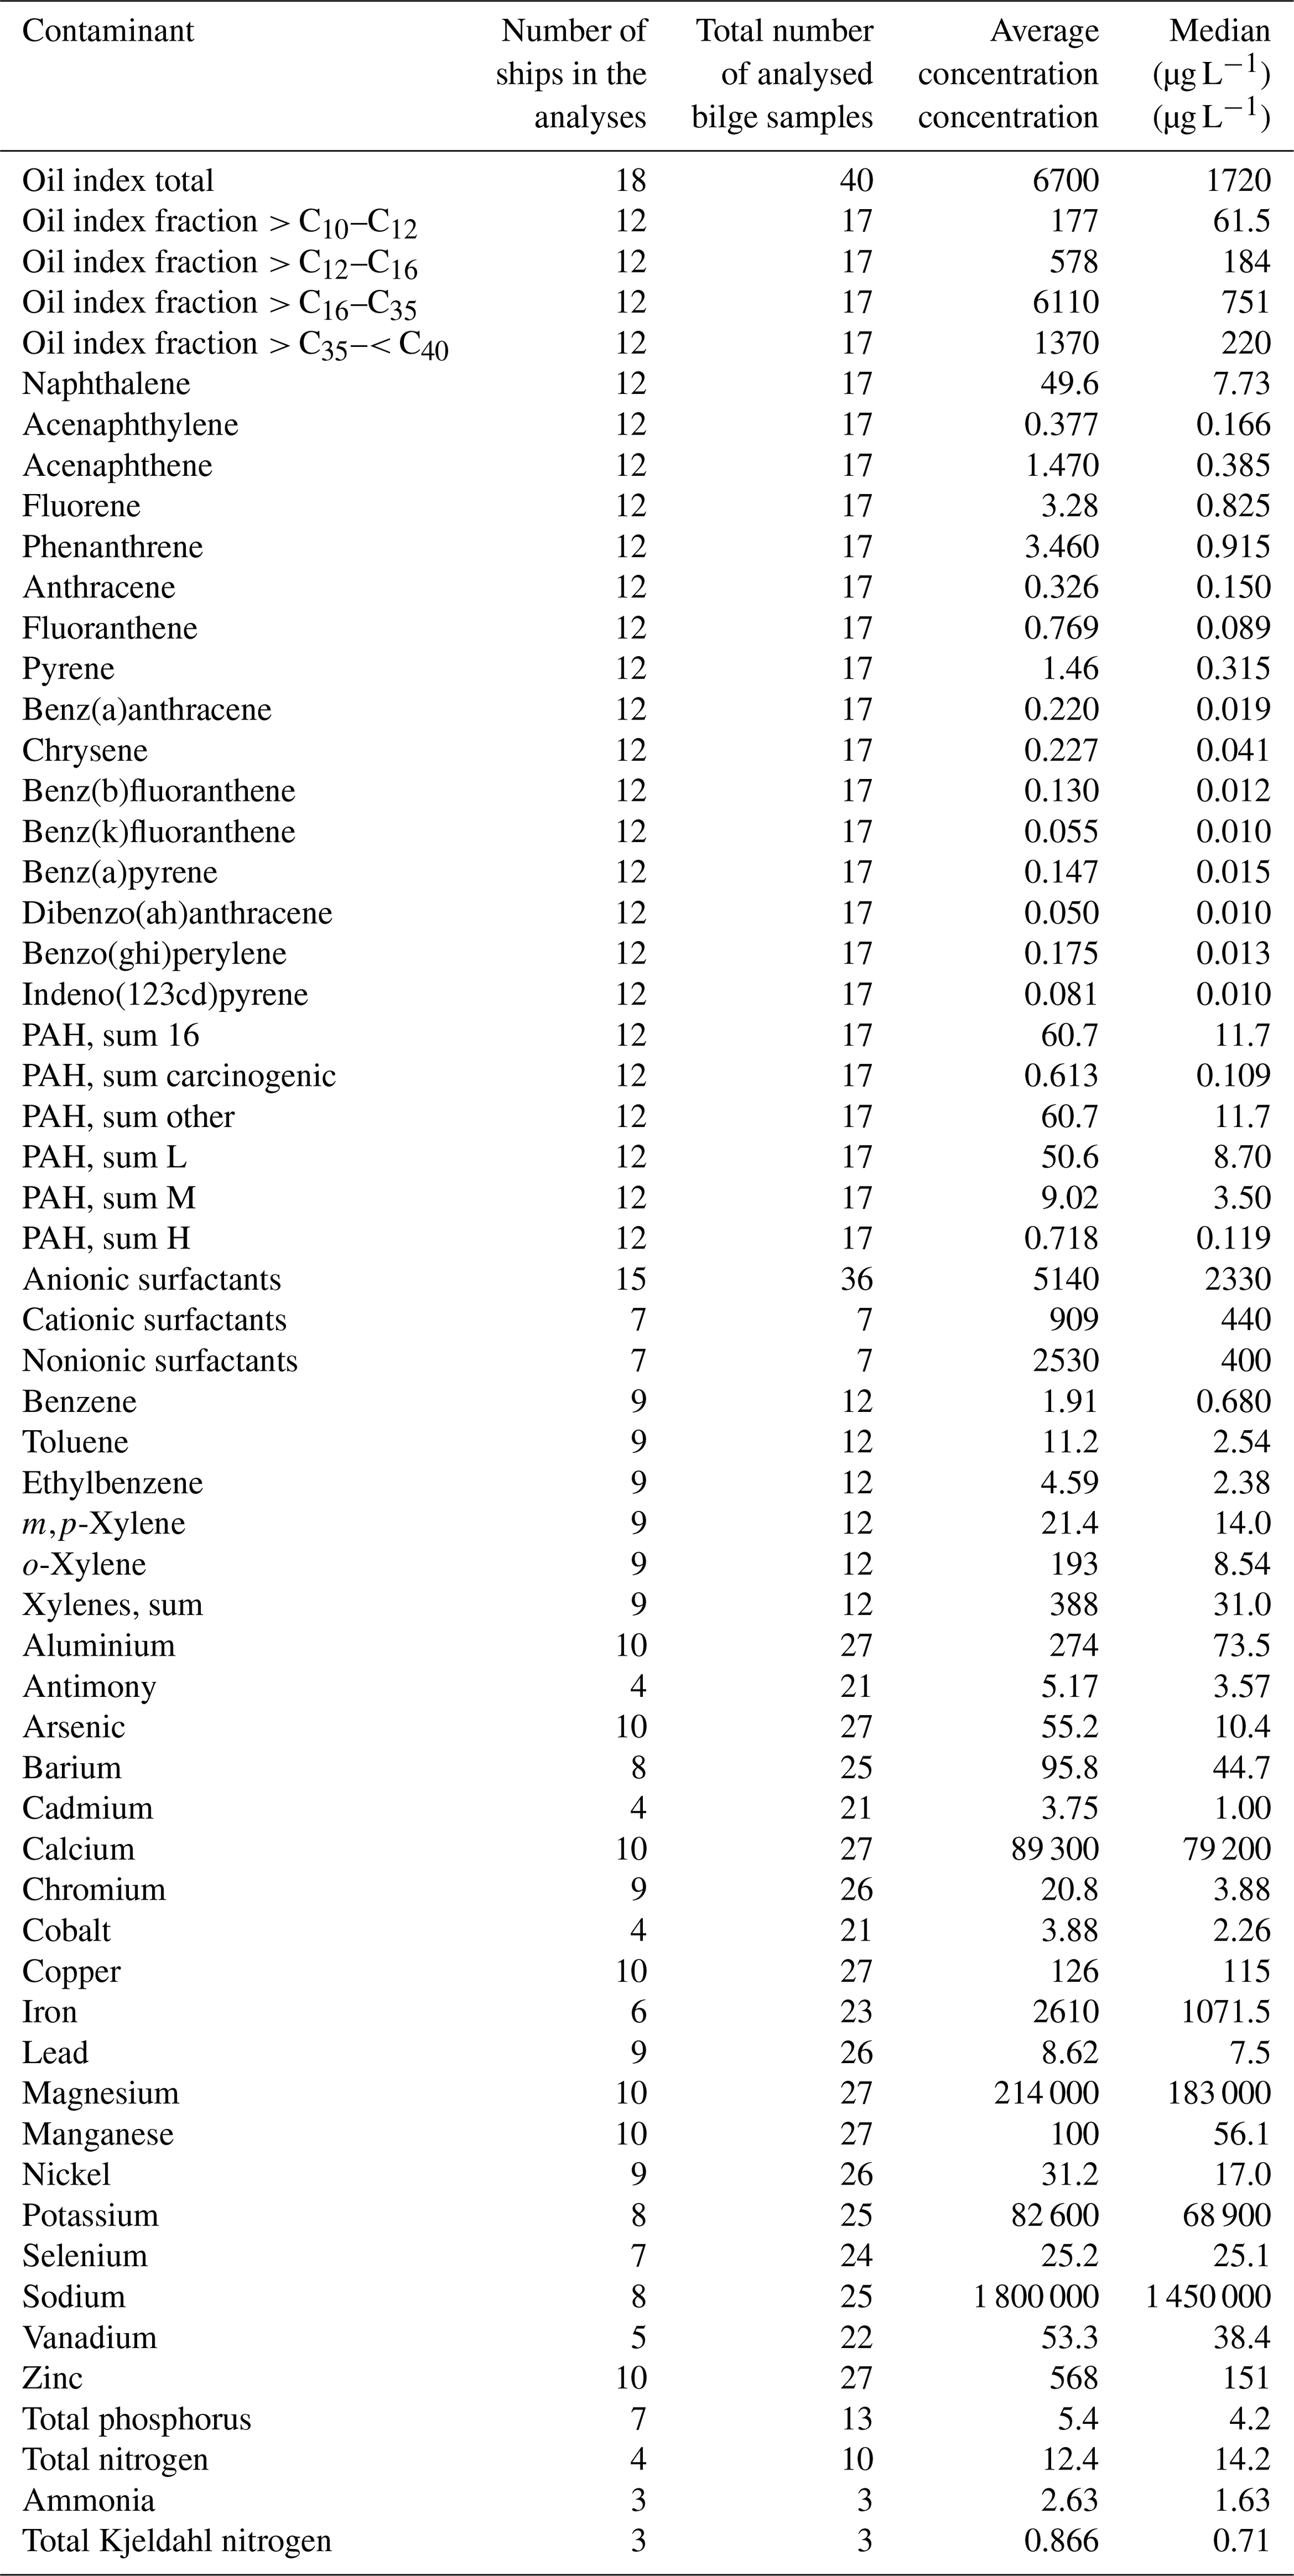
Table A2Concentration of contaminants and nutrients in open-loop scrubber wash water. Note that full references to sample analysis reports are given in the Supplement.
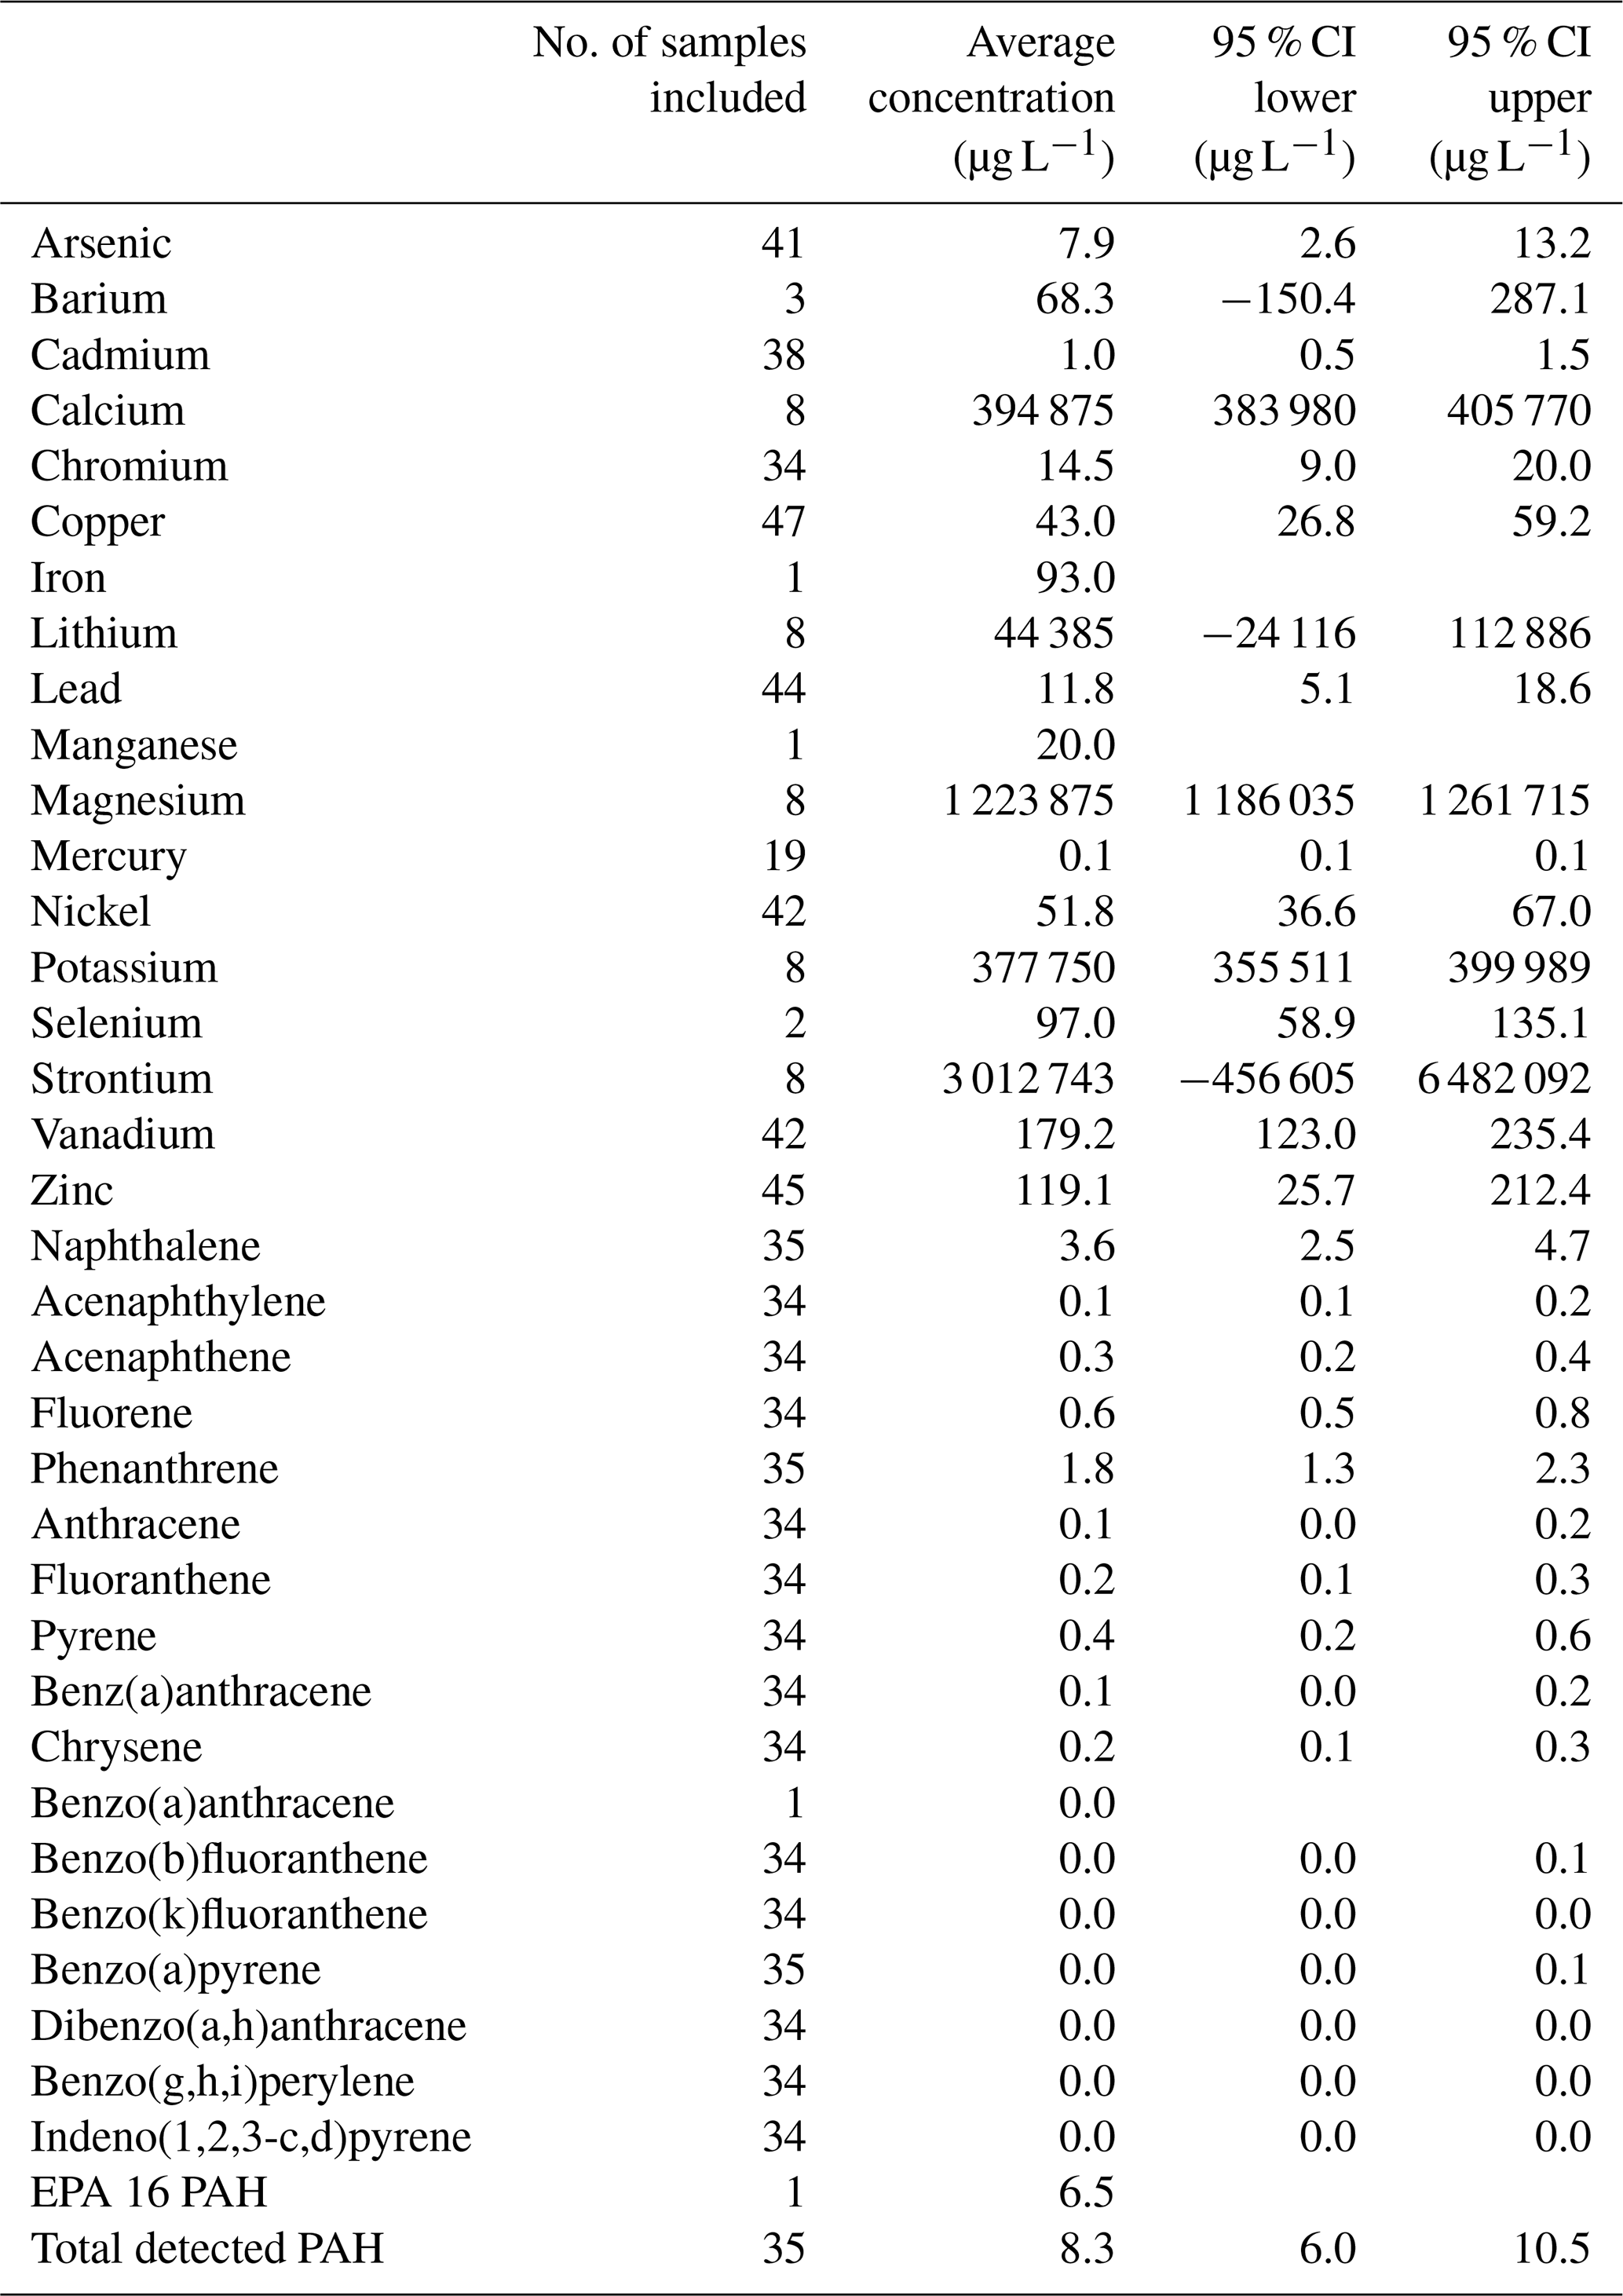
Table A3Concentration of contaminants and nutrients in closed-loop scrubber wash water. Note that full references to sample analysis reports are given in the Supplement.
B1 Calculation example for nutrients in sewage, grey water and food waste
-
RoPax with 100 crew members and 1900 passenger capacity
-
Average utilisation of passenger capacity: 50 %
-
Daily production of phosphorus in sewage, per person: 1.6 g
-
Daily production of nitrogen in sewage, per person: 16 g
-
Daily production of phosphorus in grey water, per person: 1.9 g
-
Daily production of nitrogen in grey water, per person: 4.4 g
-
Daily production of phosphorus in food waste, per person: 0.5 g
-
Daily production of nitrogen in food waste, per person: 1.7 g
-
Duration of one trip: 2 h
-
Number of trips each day: 6
-
Daily travel time: 6×2 h = 12 h
-
Daily production of P: 100 crew × 24/24 h crew presence each day × (1.6 + 1.9 + 0.5) g of P per each crew day + 1900 passengers × 0.5 passenger capacity utilisation × 12/24 passenger presence each day × (1.6 + 1.9 + 0.5) g of P per each crew day = 400 + 1900 g d−1 = 2300 g d−1
-
Annual production of P: 2300 g d−1 × 365 d = 840 kg yr−1 ( and 4640 kg of N per year)
B2 Calculation example for antifouling paint residue release
A calculation example for a vessel which operates in multiple sea areas is illustrated below. Only Cu(I)oxide releases are included in this example.
-
Oil tanker (length overall 228 m, breadth 32.2 m, draught 14.3 m) coming from outside the Baltic Sea to Primorsk, Russia; trip length, 800 nautical miles; speed, 15 knots; trip duration, 53 h; wet surface area, 9921 m2 (wet surface calculated as described in Schneekluth and Bertram, Ship Design for Efficiency and Economy, Schneekluth and Bertram, 1998); the highest leaching rate of all the areas travelled is applied.
-
Leaching rate of Cu(I)pyrithione: 24.491 µg/(cm2 d), 2.834 µg/(m2 s)
-
Paint application factor, international value: 1
-
Biocide application factor, international values: 1 (Cu(I)oxide )
-
During the trip, antifouling releases are leaching rate × wet surface area × trip duration × paint application factor × biocide application factor m (Cu(I)oxide) = 9921 m2 × 53 h × 3600 h−1 × 2.834 µg/(m2 s) × 1 × 1 = 5.36 kg
B3 Calculation examples for a bilge water release from passenger and a cargo vessel
Passenger ships
-
Installed main engine power: 32 580 kw
-
Bilge water production, L d−1:
0.131284 L kW−1 × 32 580 kw + 373.416 L
= 4651 L d−1 -
Oil: 4650 L d−1 × 3228 µg L−1/
1 000 000 µg g−1 = 15.012 g d−1 -
PAH16: 4650 L d−1 × 58 µg L−1/
1 000 000 µg g−1 = 0.270 g d−1 -
Surfactants: 4650 L d−1 × 9 µg L−1/
1 000 000 micrograms g−1 = 0.042 g d−1 -
Metals: 4650 L d−1 × 545 µg L−1/
1 000 000 µg g−1 = 2.535 g d−1
Cargo ships
-
Installed main engine power: 10 519 kw
-
Bilge water production, L d−1:
0.024696 L kW−1 × 10 519 kw
+ 154.4874 L = 414 L d−1 -
Oil: 414 L d−1 × 3228 µg L−1/
1 000 000 µg g−1 = 1.337 g d−1 -
PAH16: 414 L d−1 × 58 µg L−1/
1 000 000 µg g−1 = 0.024 g d−1 -
Surfactants: 414 L d−1 × 9 µg L−1/
1 000 000 µg g−1 = 0.004 g d−1 -
Metals: 414 L d−1 × 545 µg L−1/
1 000 000 µg g−1 = 0.226 g d−1
The data described in this paper are available for further research. These consist of gridded binary data describing all generated daily discharge quantities. These datasets are available from Zenodo, https://doi.org/10.5281/zenodo.4063643 (Jalkanen et al., 2020). STEAM and its source code are property of the Finnish Meteorological Institute and are not available. The AIS data and technical description of the world fleet used as input to STEAM are governed by contracts with third parties and cannot be shared.
Additional maps, a review of water analysis results for various discharge streams and a spreadsheet summary of discharge totals by sea area are presented as supplements to the paper. The supplement related to this article is available online at: https://doi.org/10.5194/os-17-699-2021-supplement.
JPJ was in charge of the paper writing and contributed to the STEAM discharge modelling algorithm development as well as data analysis. LJ was responsible for STEAM development and programming. LG contributed to ballast water modelling definitions. EY was responsible for antifouling modelling work and data analysis. KME, IMH, DY, KM and MWB contributed to the bilge, black and grey water data analysis. KM, HW and JM provided expertise and data for the scrubber wash water modelling. UR and IM were responsible interfacing STEAM with a water dispersion model, analysis of geographical distribution of pollutants and background data analysis. All authors contributed to paper writing.
The authors declare that they have no conflict of interest.
This article is part of the special issue “Shipping and the Environment – From Regional to Global Perspectives (ACP/OS inter-journal SI)”. It is not associated with a conference.
This work reflects only the authors' view, and INEA is not responsible for any use that may be made of the information it contains.
We are grateful to the HELCOM member states for allowing the use of HELCOM AIS data in this research.
This research has been supported by the BONUS SHEBA project, and it was supported by BONUS (Art 185), funded jointly by the EU, the Academy of Finland, the Estonian Research Council, the Swedish Agency for Marine and Water Management, the Swedish Environmental Protection Agency, and FORMAS. The support from the EU H2020 project EMERGE is appreciated, which has received funding from the European Union's Horizon 2020 research and innovation programme under grant agreement no. 874990 (EMERGE project).
This paper was edited by John M. Huthnance and reviewed by Burkard Watermann and Daniel Heydebreck.
ABS: ABS Advisory on Exhaust Gas Scrubber Systems, available at: https://ww2.eagle.org/content/dam/eagle/advisories-and-debriefs/exhaust-gas-scrubber-systems-advisory.pdf (last access: 10 May 2021), 2018.
ADEC: Alaska Department of Cruise Ship Initiative Part 2 Report, Juneau, AK, USA, available at: https://dec.alaska.gov/media/18375/acsireport2.pdf (last access: 10 May 2021), 2000.
ADEC: Assessment of cruise ship and ferry wastewater impacts in Alaska, available at: https://dec.alaska.gov/media/10148/cpvec-assesment2004.pdf (last access: 10 May 2021), 2004.
ADEC: 2005 Small Ship Wastewater Sampling Results, Juneau, AK, USA, available at: https://dec.alaska.gov/media/18190/2005-smallship-wwsampling-final.pdf (last access: 10 May 2021), 2005.
ADEC: 2006 Small Ship Wastewater Sampling Results, available at: https://dec.alaska.gov/media/18387/2006-smallship-ww.pdf (last access: 10 May 2021), 2006.
ADEC: 2007 Small Ship Wastewater Sampling Results, Juneau, AK, USA, available at: https://dec.alaska.gov/media/18358/2007-small-ship-ww.pdf (last access: 10 May 2021), 2007.
ADEC: 2008 Small Passenger Vessel Wastewater Sampling Results, available at: https://dec.alaska.gov/media/18360/2008-smallship-ww-sampling.pdf (last access: 10 May 2021), 2010.
ADEC: 2009 Small Commercial Passenger Vessel and Ferry Wastewater Sampling Results, available at: https://dec.alaska.gov/media/18203/2009-small-ship-ww.pdf (last access: 10 May 2021), 2011a.
ADEC: Large Cruise Ship 2010 Wastewater Sampling Results, available at: https://dec.alaska.gov/media/18212/2010-large-ship-wwsampling-report.pdf (last access: 10 May 2021), 2011b.
ADEC: Alaska DEC 2011 Small Commercial Passenger Vessel and Ferry Wastewater Sampling Results, Juneau, AK, USA, available at: https://dec.alaska.gov/media/18389/2010-small-ship-ww.pdf (last access: 10 May 2021), 2013.
Albert, R. and Danesi, R.: Oily Bilgewater Separators, US EPA reports EPA 800-R-11-007, Washington DC, USA, available at: https://www3.epa.gov/npdes/pubs/vgp_bilge.pdf (last access: 10 May 2021), 2011.
Alzieu, C.: Environmental problems caused by TBT in France: Assessment, regulations, prospects, Mar. Environ. Res., 32, 7–17, https://doi.org/10.1016/0141-1136(91)90029-8, 1991.
Alzieu, C., Sanjuan, J., Deltreil, J. P., and Borel, M.: Tin conatamination in Arcachon Bay: Effects on oyster shell anomalies, Mar. Pollut. Bull., 17, 494–498, 1986.
Ambrosson, J.: MAM-PEC-scenarier för Sveriges östkust och västkust, Swedish Chemical Agency Report #240-832-08, Sundbyberg, Sweden, 2008.
Barregard, L., Moln, P., Jonson, J. E., and Stockfelt, L.: Impact on Population Health of Baltic Shipping Emissions, Int. J. Environ. Res. Public Health, 16, 1–11, https://doi.org/10.3390/ijerph16111954, 2019.
Beecken, J., Mellqvist, J., Salo, K., Ekholm, J., and Jalkanen, J.-P.: Airborne emission measurements of SO2, NOx and particles from individual ships using a sniffer technique, Atmos. Meas. Tech., 7, 1957–1968, https://doi.org/10.5194/amt-7-1957-2014, 2014.
Beecken, J., Mellqvist, J., Salo, K., Ekholm, J., Jalkanen, J.-P., Johansson, L., Litvinenko, V., Volodin, K., and Frank-Kamenetsky, D. A.: Emission factors of SO2, NOx and particles from ships in Neva Bay from ground-based and helicopter-borne measurements and AIS-based modeling, Atmos. Chem. Phys., 15, 5229–5241, https://doi.org/10.5194/acp-15-5229-2015, 2015.
Beldowski, J., Löffler, A., Schneider, B., and Joensuu, L.: Distribution and biogeochemical control of total CO2 and total alkalinity in the Baltic Sea, J. Mar. Syst., 81, 252–259, https://doi.org/10.1016/j.jmarsys.2009.12.020, 2010.
Amara, I., Miled, W., Ben Slama, R., and Ladhari, N.: Antifouling processes and toxicity effects of antifouling paints on marine environment, A review, Environ. Toxicol. Pharmacol., 57, 115–130, https://doi.org/10.1016/j.etap.2017.12.001, 2018.
Brandt, J., Silver, J. D., Christensen, J. H., Andersen, M. S., Bønløkke, J. H., Sigsgaard, T., Geels, C., Gross, A., Hansen, A. B., Hansen, K. M., Hedegaard, G. B., Kaas, E., and Frohn, L. M.: Assessment of past, present and future health-cost externalities of air pollution in Europe and the contribution from international ship traffic using the EVA model system, Atmos. Chem. Phys., 13, 7747–7764, https://doi.org/10.5194/acp-13-7747-2013, 2013.
Burgard, D. A. and Bria, C. R. M.: Bridge-based sensing of NOx and SO2 emissions from ocean-going ships, Atmos. Environ., 136, 54–60, https://doi.org/10.1016/j.atmosenv.2016.04.014, 2016.
Champ, M. A.: Economic and environmental impacts on ports and harbors from the convention to ban harmful marine anti-fouling systems, Mar. Pollut. Bull., 46, 935–940, 2003.
Copeland, C.: Cruise ship pollution: Background, laws and regulations, and key issues, Congressional Research Service, available at: https://www.everycrsreport.com/files/20081117_RL32450_f22a255394f5f11031cc49692c9f4bf8aeba72f0.pdf (last access: 10 May 2021), 2008.
Corbett, J. J., Winebrake, J. J., Green, E. H., Kasibhatla, P., Eyring, V., and Lauer, A.: Mortality from ship emissions: A global assessment, Environ. Sci. Technol., 41, 8512–8518, https://doi.org/10.1021/es071686z, 2007.
David, M. and Gollasch, S.: Global Maritime Transport and Ballast Water Management – Issues and Solutions, Springer Science + Business Media, Dordrecht, Germany, 2015, ISBN 978-94-017-9366-7, 2015.
Endres, S., Maes, F., Hopkins, F., Houghton, K., Mårtensson, E. M., Oeffner, J., Quack, B., Singh, P., and Turner, D.: A New Perspective at the Ship-Air-Sea-Interface: The Environmental Impacts of Exhaust Gas Scrubber Discharge, Front. Mar. Sci., 5, 139, https://doi.org/10.3389/fmars.2018.00139, 2018.
Etkin, D. S.: Worldwide analysis of in-port vessel operational lubricant discharges and leakages, Proc. 33rd AMOP Tech. Semin. Environ. Contam. Response, 1, 529–553, 2010.
European Commission: Report on implementation and compliance with the sulphur standards for marine fuels set out in Directive (EU) 2016/802 relating to a reduction in the sulphur content of certain liquid fuels, 17, available at: https://eur-lex.europa.eu/legal-content/EN/TXT/PDF/?uri=CELEX:52018DC0188&from=en (last access: 10 May 2021), 2018.
Faber, J., Singh, A., Ahdour, S., 't Hoen, M., Nelissen, D., Steiner, P., Rivera, S., Raucci, C., Smith, T. W. P., Muraoka, E., Ruderman, Y., Khomutov, I., and Hanayama, S.: Assessment of Fuel Oil Availability, available at: https://cedelft.eu/wp-content/uploads/ (last access: 10 May 2021), 2016.
Furstenberg, S., Mohn, H., and Sverud, T.: Study on discharge factors for legal operational discharges to sea from vessels in Norwegian waters, DNV report NO. 2009-0284, Hovik, Norway, 2009.
Gutierrez, C.: List of copper-based antifoulant paints by leach rate category, Sacramento, California, available at: https://www.waterboards.ca.gov/sandiego/ (last access: 10 May 2021), 2015.
Habereder, T., Moore, D., and Lang, M.: Lubricant Additives Chemistry and Applications, edited by: Rudnick, L. R., Taylor and Francis, Boca Raton, FL, USA, 2009.
Hassellöv, I. M., Turner, D. R., Lauer, A., and Corbett, J. J.: Shipping contributes to ocean acidification, Geophys. Res. Lett., 40, 2731–2736, https://doi.org/10.1002/grl.50521, 2013.
HELCOM: Fifth Baltic Sea Pollution Load Compilation (PLC-5) - Balt. Sea Environ. Proc. No. 128, edited by: Knuuttila, S., Scendsen, L., Staaf, H., Kotilainen, P., Boutrup, S., Pyhälä, M., and Duekin, M. Baltic Marine Environment Protection Commission (Helsinki Commission), available at: https://helcom.fi/wp-content/uploads/2019/08/BSEP128.pdf (last access: 10 May 2021), 2011.
HELCOM: Baltic Sea Sewage Port Reception Facilities, revised 2nd edition, edited by: Backer, H., Frias, M., and Nicolas, F., Baltic Marine Environment Protection Commission (Helsinki Commission), available at: https://helcom.fi/wp-content/uploads/ (last access: 10 May 2021), 2014a.
HELCOM: HELCOM Guide to Alien Species and Ballast Water Management in the Baltic Sea, Helsinki, available at: https://helcom.fi/wp-content/uploads/ (last access: 10 May 2021), 2014b.
HELCOM: HELCOM Annual report on discharges observed during aerial surveillance in the Baltic Sea, 2017, Helsinki, available at: https://helcom.fi/wp-content/uploads/2020/01/HELCOM-Aerial-Surveillance-Report-2018.pdf (last access: 10 May 2021), 2018a.
HELCOM: HELCOM Assessment on maritime activities in the Baltic Sea 2018, Helsinki, available at: http://www.helcom.fi/Lists/Publications/BSEP152.pdf (last access: 10 May 2021), 2018b.
Hollenbach, K. U.: Estimating resistance and propulsion for singlescrew and twin screw ships, Sh. Technol. Res., 45, 72–76, 1998.
Hufnagl, M., Liebezeit, G., and Behrends, B.: Effects of Sea Water Scrubbing Final report, Wilhelmshaven, Germany, available at: https://www.egcsa.com/wp-content/uploads/BP_Final_Report_rev.pdf (last access: 10 May 2021), 2005.
Huhta, H. K., Rytkönen, J., and Sassi, J.: Estimated nutrient load from waste waters originating from ships in the Baltic Sea area, VTT Research notes 2370, Technical Research Centre of Finland, Espoo, Finland 2007, ISBN 978-951-38-6899-4, available at: https://www.vttresearch.com/sites/default/files/pdf/tiedotteet/2007/T2370.pdf (last access: 10 May 2021), 2007.
IHS_Global: SeaWeb database of the global ship fleet, IHS Markit Global Headquarters, London, United Kingdom, 2016.
IMO: AFS 2001 – (A-2) – Final Act Of The International Conference On The Control Of Harmful Anti-Fouling System For Ships, International Maritime Organisation, London, UK, 2001.
IMO: INTERNATIONAL CONVENTION FOR THE CONTROL AND MANAGEMENT OF SHIPS' BALLAST WATER AND SEDIMENTS, 2004. Consolidated text of the International Convention for the Control and Management of Ships’ Ballast Water and Sediments, 2004 and the 2018 amendments adopted by the Marine Environment Protection Committee through resolutions MEPC.296(72), MEPC.297(72) and MEPC.299(72)), International Maritime Organization, 2018.
IMO: Recommendations on Standards for the Discharge of Sewage from Ships, available at: https://wwwcdn.imo.org/localresources/en/ (last access: 10 May 2021), 2006.
IMO: Use of seawater lubricated tube bearings to eliminate stern tube oil pollution from ships, IMO, Canada, 2008a.
IMO: Use of seawater lubricated tube bearings to eliminate stern tube oil pollution from ships, MEPC58/INF.22, Canada, 2008b.
IMO: Simplified overview of the discharge provisions of the revised MARPOL Annex V which entered into force on 1 January 2013, 201, available at: https://wwwcdn.imo.org/localresources/en/OurWork/ (last access: 10 May 2021), 2013.
IMO: Effective date of implementation of the fuel oil standard in regulation 14.1.3 of MARPOL Annex VI, IMO MEPC70, UK, 2016.
IMO: Additional information on environmental concentrations observed worldwide and scientific evidence for the adverse effects of cybutryne to the marine environment and to human health, MEPC 73/INF.10, 1–14, 2018a.
IMO: Review of the 2015 guidelines for exhaust gas cleaning systems, 2018b.
IMO: Scrubber Environmental Impact Literature Review Submitted by Panama, MEPC 74/INF.10, 1–21 February, available at: https://wwf.ca/wp-content/uploads/2019/ (last access: 10 May 2021), 2019.
Ivče, R., Bakota, M., Kos, S., and Brčić, D.: Advanced numerical method for determining the wetted area of container ships for increased estimation accuracy of copper biocide emissions, J. Mar. Sci. Eng., 8, 1–18, https://doi.org/10.3390/jmse8110848, 2020.
Jalkanen, J.-P. and Johansson, L.: Discharges to the sea from Baltic Sea shipping in 2006–2018, available at: https://portal.helcom.fi/meetings/MARITIME_19-2019-582/ (last access: 10 May 2021), 2019.
Jalkanen, J.-P., Brink, A., Kalli, J., Pettersson, H., Kukkonen, J., and Stipa, T.: A modelling system for the exhaust emissions of marine traffic and its application in the Baltic Sea area, Atmos. Chem. Phys., 9, 9209–9223, https://doi.org/10.5194/acp-9-9209-2009, 2009.
Jalkanen, J. P., Johansson, L., Kukkonen, J., Brink, A., Kalli, J., and Stipa, T.: Extension of an assessment model of ship traffic exhaust emissions for particulate matter and carbon monoxide, Atmos. Chem. Phys., 12, 2641–2659, https://doi.org/10.5194/acp-12-2641-2012, 2012.
Jalkanen, J. P., Johansson, L., Liefvendahl, M., Bensow, R., Sigray, P., Östberg, M., Karasalo, I., Andersson, M., Peltonen, H., and Pajala, J.: Modelling of ships as a source of underwater noise, Ocean Sci., 14, 1373–1383, https://doi.org/10.5194/os-14-1373-2018, 2018.
Jalkanen, J.-P., Johansson, L., Wilewska-Bien, M., Granhag, L., Ytreberg, E., Eriksson, K. M., and Yngsell, D., Hassellöv, I.-M., Magnusson, K., Raudsepp, U., Maljutenko, I., Winnes, H., and Moldanova, J.: Modeling of discharges from Baltic Sea shipping, Zenodo [Dataset], https://doi.org/10.5281/zenodo.4063643, 2020.
Johansson, L., Jalkanen, J.-P., Kalli, J., and Kukkonen, J.: The evolution of shipping emissions and the costs of regulation changes in the northern EU area, Atmos. Chem. Phys., 13, 11375–11389, https://doi.org/10.5194/acp-13-11375-2013, 2013.
Johansson, L., Jalkanen, J.-P., and Kukkonen, J.: Global assessment of shipping emissions in 2015 on a high spatial and temporal resolution, Atmos. Environ., 167, 403–415, https://doi.org/10.1016/j.atmosenv.2017.08.042, 2017.
Johansson, L., Ytreberg, E., Jalkanen, J.-P., Fridell, E., Eriksson, K. M., Lagerström, M., Maljutenko, I., Raudsepp, U., Fischer, V., and Roth, E.: Model for leisure boat activities and emissions – implementation for the Baltic Sea, Ocean Sci., 16, 1143–1163, https://doi.org/10.5194/os-16-1143-2020, 2020.
Jonson, J. E., Jalkanen, J. P., Johansson, L., Gauss, M., and Denier van der Gon, H. A. C.: Model calculations of the effects of present and future emissions of air pollutants from shipping in the Baltic Sea and the North Sea, Atmos. Chem. Phys., 15, 783–798, https://doi.org/10.5194/acp-15-783-2015, 2015.
Jönsson, H., Baky, A., Jeppsson, U., Hellström, D., and Kärrman, E.: Composition of Urine, Feaces, Greywater and Biowaste for Utilisation in the URWARE Model, available at: https://www.iea.lth.se/publications/Reports/LTH-IEA-7222.pdf (last access: 10 May 2021), 2005.
Karasalo, I., Östberg, M., Sigray, P., Jalkanen, J.-P., Johansson, L., Liefvendahl, M., and Bensow, R.: Estimates of source spectra of ships from long term recordings in the Baltic sea, Front. Mar. Sci., 4, 164, https://doi.org/10.3389/fmars.2017.00164, 2017.
Karl, M., Jonson, J. E., Uppstu, A., Aulinger, A., Prank, M., Sofiev, M., Jalkanen, J.-P., Johansson, L., Quante, M., and Matthias, V.: Effects of ship emissions on air quality in the Baltic Sea region simulated with three different chemistry transport models, Atmos. Chem. Phys., 19, 7019–7053, https://doi.org/10.5194/acp-19-7019-2019, 2019a.
Karl, M., Bieser, J., Geyer, B., Matthias, V., Jalkanen, J.-P., Johansson, L., and Fridell, E.: Impact of a nitrogen emission control area (NECA) on the future air quality and nitrogen deposition to seawater in the Baltic Sea region, Atmos. Chem. Phys., 19, 1721–1752, https://doi.org/10.5194/acp-19-1721-2019, 2019b.
Kattner, L., Mathieu-Üffing, B., Burrows, J. P., Richter, A., Schmolke, S., Seyler, A., and Wittrock, F.: Monitoring compliance with sulfur content regulations of shipping fuel by in situ measurements of ship emissions, Atmos. Chem. Phys., 15, 10087–10092, https://doi.org/10.5194/acp-15-10087-2015, 2015.
King, D., Hagan, P., Riggio, M., and Wright, D.: Preview of global ballast water treatment markets, J. Mar. Eng. Technol., 11, 3–15, 2012.
Kjølholt, J., Aakre, S., Jürgensen, C., and Lauridsen, J.: Assessment of possible impacts of scrubber water discharges on the marine environment, Copenhagen, Denmark, available at: https://www2.mst.dk/Udgiv/publications/2012/06/978-87-92903-30-3.pdf (last access: 10 May 2021), 2012.
Koivisto, S.: Finnish exposure scenarios for antifouling products – Reports of the Finnish Environment Institute, Helsinki, Finland, 2003.
Kojima, R., Shibata, T., and Ueda, K.: Leaching Phenomena of Antifouling Agents from Ships' Hull Paints, J. Shipp. Ocean Eng., 6, 269–278, https://doi.org/10.17265/2159-5879/2016.05.002, 2016.
Koski, M., Stedmon, C., and Trapp, S.: Ecological effects of scrubber water discharge on coastal plankton: Potential synergistic effects of contaminants reduce survival and feeding of the copepod Acartia tonsa, Mar. Environ. Res., 129, 374–385, https://doi.org/10.1016/j.marenvres.2017.06.006, 2017.
Lagerström, M., Lindgren, J. F., Holmqvist, A., Dahlström, M., and Ytreberg, E.: In situ release rates of Cu and Zn from commercial antifouling paints at different salinities, Mar. Pollut. Bull., 127, 289–296, https://doi.org/10.1016/j.marpolbul.2017.12.027, 2018.
Lagerström, M., Ytreberg, E., Wiklund, A. K. E., and Granhag, L.: Antifouling paints leach copper in excess – study of metal release rates and efficacy along a salinity gradient, Water Res., 186, 116383, https://doi.org/10.1016/j.watres.2020.116383, 2020.
Liu, H., Fu, M., Jin, X., Shang, Y., Shindell, D., Faluvegi, G., Shindell, C., and He, K.: Health and climate impacts of ocean-going vessels in East Asia, Nat. Clim. Change, 6, 1037–1041, https://doi.org/10.1038/nclimate3083, 2016.
Lloyds Register: Understanding Exhaust Gas Treatment Systems – Guidance for shipowners and operators, London, available at: https://www.rtu.lv/writable/public_files/RTU_understanding_exhaust_gas_treatment_systems.pdf (last access: 10 May 2021), 2012.
Madjidian, J. and Rantanen, A.: CLEANSHIP Task 4.5 Port Reception Facilities for Ship-generated Sewage, available at: https://silo.tips/download/port-of-trelleborg-port-of-helsinki (last access: 10 May 2021), 2011.
Magnusson, K., Jalkanen, J. P., Johansson, L., Smailys, V., Telemo, P., and Winnes, H.: Risk assessment of bilge water discharges in two Baltic shipping lanes, Mar. Pollut. Bull., 126, 575–584, https://doi.org/10.1016/j.marpolbul.2017.09.035, 2018a.
Magnusson, K., Thor, P., Granberg, M., Magnusson, A. K., Thor, P., and Granberg, M.: Scrubbers: Closing the loop Activity 3: Task 2 Risk Assessment of marine exhaust gas scrubber water, Swedish Environment Institute IVL, Stockholm, 2018b.
McLaughlin, C., Falatko, D., Danesi, R., and Albert, R.: Characterizing shipboard bilgewater effluent before and after treatment, Environ. Sci. Pollut. Res. Int., 21, 5637–5652, https://doi.org/10.1007/s11356-013-2443-x, 2014.
National Geospatial Intelligence Agency: World Port Index, available at: http://msi.nga.mil/NGAPortal/MSI.portal_nfpb=true&_pageLabel=msi_portal_page_62&pubCode=0015 (last access: 10 May 2021), 2014.
New Zealand: Application for the Reassessment of a Group of Hazardous Substances under Section 63 of the Hazardous Substances and New Organisms Act 1996, New Zealand Environmental Protection Agency, available at: https://www.epa.govt.nz/assets/FileAPI/, (last access: 10 May 2021), 2013.
Pavlakis, P., Tarchi, D., Seiber, A. J., Ferraro, G., and Vincent, G.: On the monitoring of illicit vessel discharges. A reconnaissance study in the Mediterranean Sea, 20 pp., available at: https://ec.europa.eu/echo/files/ (last access: 10 May 2021), 2001.
Penny, R. and Suominen-Yeh, M.: Biological Bilge Water Treatment System, Nav. Eng. J., 118, 45–50, https://doi.org/10.1111/j.1559-3584.2006.tb00462.x, 2008.
Raudsepp, U., Maljutenko, I., Kõuts, M., Granhag, L., Wilewska-Bien, M., Hassellöv, I. M., Eriksson, K. M., Johansson, L., Jalkanen, J. P., Karl, M., Matthias, V., and Moldanova, J.: Shipborne nutrient dynamics and impact on the eutrophication in the Baltic Sea, Sci. Total Environ., 671, 189–207, https://doi.org/10.1016/j.scitotenv.2019.03.264, 2019.
RINA: Significant ships, edited by: Halfhide, R., RINA, London, UK, 2010.
Rousseau, C., Baraud, F., Leleyter, L., and Gil, O.: Cathodic protection by zinc sacrificial anodes: Impact on marine sediment metallic contamination, J. Hazard. Mater., 167, 953–958, https://doi.org/10.1016/j.jhazmat.2009.01.083, 2009.
Schneekluth, H. and Bertram, V.: Ship Design for Efficiency and Economy, Butterworth-Heineman, Oxford, UK, ISBN 9780750641333, 1998.
Schultz, M. P.: Effects of coating roughness and biofouling on ship resistance and powering, Biofouling, 23, 331–341, https://doi.org/10.1080/08927010701461974, 2007.
Seebens, H., Gastner, M. T., and Blasius, B.: The risk of marine bioinvasion caused by global shipping, Ecol. Lett., 16, 782–790, https://doi.org/10.1111/ele.12111, 2013.
Sengottuvel, P. and Jagdale, K.: Review on the propeller shaft composite bearings used to reduce the stern tube oil pollution in ocean, Int. J. Pure Appl. Math., 116, 471–477, 2017.
Sofiev, M., Winebrake, J. J., Johansson, L., Carr, E. W., Prank, M., Soares, J., Vira, J., Kouznetsov, R., Jalkanen, J.-P., and Corbett, J. J.: Cleaner fuels for ships provide public health benefits with climate tradeoffs, Nat. Commun., 9, 406, https://doi.org/10.1038/s41467-017-02774-9, 2018.
Stamper, D. M. and Montgomery, M. T.: Biological treatment and toxicity of low concentrations of oily wastewater (bilgewater), Can. J. Microbiol., 54, 687–693, https://doi.org/10.1139/W08-053, 2008.
SWAM: Water Information System Sweden, available at: https://viss.lansstyrelsen.se/Maps.aspx (last access: 30 September 2020), 2018.
Tiselius, P. and Magnusson, K.: Toxicity of treated bilge water: The need for revised regulatory control, Mar. Pollut. Bull., 114, 860–866, https://doi.org/10.1016/j.marpolbul.2016.11.010, 2017.
Turner, D. R., Hassellöv, I. M., Ytreberg, E., and Rutgersson, A.: Shipping and the environment: Smokestack emissions, scrubbers and unregulated oceanic consequences, Elem. Sci. Anthr., 5, 1–10, https://doi.org/10.1525/elementa.167, 2017.
US EPA: Assigning values to non-detected/non-quantified pesticide residues in human health food exposure assessments, 6047, 1–25, available at: https://archive.epa.gov/pesticides/trac/web/pdf/trac3b012.pdf (last access: 10 May 2021), 2000.
US EPA: Cruise Ship Discharge Assessment Report, 2008.
US EPA: Environmentally Acceptable Lubricants. Report EPA 800-R-11-002, available at: https://www3.epa.gov/npdes/pubs/vgp_environmentally_acceptable_lubricants.pdf (last access: 10 May 2021), 2011a.
US EPA: Exhaust Gas Scrubber. Washwater Effluent, Report EPA-800-R-11-006, (November), 46, available at: https://www3.epa.gov/npdes/pubs/vgp_exhaust_gas_scrubber.pdf (last access: 10 May 2021), 2011b.
Valkirs, A. O., Seligman, P. F., Haslbeck, E., and Caso, J. S.: Measurement of copper release rates from antifouling paint under laboratory and in situ conditions: implications for loading estimation to marine water bodies, Mar. Pollut. Bull., 46, 763–779, https://doi.org/10.1016/S0025-326X (03)00044-4, 2003.
Wärtsilä Corp.: Wartsila Environmental Product Guide, available at: https://cdn.wartsila.com/docs/default-source/product-files/egc/product-guide-o-env-environmental-solutions.pdf (last access: 10 May 2021), 2017.
Werschkun, B., Sommer, Y., and Banerji, S.: Disinfection by-products in ballast water treatment: An evaluation of regulatory data, Water Res., 46, 4884–4901, https://doi.org/10.1016/j.watres.2012.05.034, 2012.
Wilewska-bien, M., Granhag, L., and Jalkanen, J.: Phosphorus flows on ships: Case study from the Baltic Sea, Inst. Mech. Eng. J. Eng. Marit. Environ., 233, 528–539, https://doi.org/10.1177/1475090218761761, 2019.
Winnes, H., Fridell, E., and Moldanová, J.: Effects of marine exhaust gas scrubbers on gas and particle emissions, J. Mar. Sci. Eng., 8, 299, https://doi.org/10.3390/JMSE8040299, 2020.
Yebra, D. M., Kiil, S., and Dam-Johansen, K.: Antifouling technology – Past, present and future steps towards efficient and environmentally friendly antifouling coatings, Prog. Org. Coat., 50, 75–104, https://doi.org/10.1016/j.porgcoat.2003.06.001, 2004.
Ytreberg, E., Karlsson, J., and Eklund, B.: Comparison of toxicity and release rates of Cu and Zn from anti-fouling paints leached in natural and artificial brackish seawater, Sci. Total Environ., 408, 2459–2466, https://doi.org/10.1016/j.scitotenv.2010.02.036, 2010.
Ytreberg, E., Lagerström, M., Holmqvist, A., Eklund, B., Elwing, H., Dahlström, M., Dahl, P., and Dahlström, M.: A novel XRF method to measure environmental release of copper and zinc from antifouling paints, Environ. Pollut., 225, 490–496, https://doi.org/10.1016/j.envpol.2017.03.014, 2017.
Ytreberg, E., Hassellöv, I. M., Nylund, A. T., Hedblom, M., Al-Handal, A. Y., and Wulff, A.: Effects of scrubber washwater discharge on microplankton in the Baltic Sea, Mar. Pollut. Bull., 145, 316–324, https://doi.org/10.1016/j.marpolbul.2019.05.023, 2019.
- Abstract
- Introduction
- Material and methods
- Results and discussion
- Summary
- Appendix A
- Appendix B: Calculation examples for various discharges
- Code and data availability
- Author contributions
- Competing interests
- Special issue statement
- Disclaimer
- Acknowledgements
- Financial support
- Review statement
- References
- Supplement