the Creative Commons Attribution 4.0 License.
the Creative Commons Attribution 4.0 License.
 | 09 May 2019
Cold vs. warm water route – sources for the upper limb of the Atlantic Meridional Overturning Circulation revisited in a high-resolution ocean model
Franziska U. Schwarzkopf
Sabrina Speich
Arne Biastoch
The northward flow of the upper limb of the Atlantic Meridional Overturning Circulation (AMOC) is fed by waters entering the South Atlantic from the Indian Ocean mainly via the Agulhas Current (AC) system and by waters entering from the Pacific through Drake Passage (DP), commonly referred to as the “warm” and “cold” water routes, respectively. However, there is no final consensus on the relative importance of these two routes for the upper limb's volume transport and thermohaline properties. In this study we revisited the AC and DP contributions by performing Lagrangian analyses between the two source regions and the North Brazil Current (NBC) at 6∘ S in a realistically forced high-resolution (1∕20∘) ocean model.
Our results agree with the prevailing conception that the AC contribution is the major source for the upper limb transport of the AMOC in the tropical South Atlantic. However, they also suggest a non-negligible DP contribution of around 40 %, which is substantially higher than estimates from previous Lagrangian studies with coarser-resolution models but now better matches estimates from Lagrangian observations. Moreover, idealized analyses of decadal changes in the DP and AC contributions indicate that the ongoing increase in Agulhas leakage indeed may have induced an increase in the AC contribution to the upper limb of the AMOC in the tropics, while the DP contribution decreased. In terms of thermohaline properties, our study highlights the fact that the AC and DP contributions cannot be unambiguously distinguished by their temperature, as the commonly adopted terminology may imply, but rather by their salinity when entering the South Atlantic. During their transit towards the NBC the bulk of DP waters experiences a net density loss through a net warming, whereas the bulk of AC waters experiences a slight net density gain through a net increase in salinity. Notably, these density changes are nearly completely captured by Lagrangian particle trajectories that reach the surface mixed layer at least once during their transit, which amount to 66 % and 49 % for DP and AC waters, respectively. This implies that more than half of the water masses supplying the upper limb of the AMOC are actually formed within the South Atlantic and do not get their characteristic properties in the Pacific and Indian Oceans.
Please read the corrigendum first before continuing.
-
Notice on corrigendum
The requested paper has a corresponding corrigendum published. Please read the corrigendum first before downloading the article.
-
Article
(7341 KB)
-
The requested paper has a corresponding corrigendum published. Please read the corrigendum first before downloading the article.
- Article
(7341 KB) - Full-text XML
- Corrigendum
- BibTeX
- EndNote


Within the framework of the global overturning circulation, the South Atlantic is depicted as a conduit exporting cold, dense waters produced in the North Atlantic into the Indian and Pacific basins and enabling the return flow of warmer, lighter waters back into the North Atlantic, which in turn feed the deepwater formation (Broecker, 1991; Richardson, 2008). The resulting net equatorward heat transport within the South Atlantic and thus northward heat transport across the whole Atlantic (see Kelly et al., 2014) is unique among all ocean basins and has been long recognized for its importance in modulating European (e.g., Palter, 2015; Moffa-Sánchez and Hall, 2017) and global (e.g., Srokosz et al., 2012; Buckley and Marshall, 2016; Lynch-Stieglitz, 2017) climate.
Even though variability in the overall overturning strength and associated heat transport has been mostly related to variability in deepwater formation (e.g., Biastoch et al., 2008a; Yeager and Danabasoglu, 2014), the involved convection process is highly sensitive to the local stratification and is thus additionally impacted by the thermohaline properties of the northward upper-layer return flow, that is, the upper limb of the Atlantic Meridional Overturning Circulation (AMOC) (Haarsma et al., 2011; Garzoli and Matano, 2011; Cimatoribus et al., 2012; Garzoli et al., 2013). In particular, it has been suggested that a net southward freshwater transport related to the northward advection of relatively high-saline waters along the AMOC's upper limb in the South Atlantic introduces a positive feedback (e.g., Stommel, 1961; Rahmstorf, 1996; Drijfhout et al., 2011): a weakening (strengthening) of the AMOC results in reduced (enhanced) northward salt transport and corresponding freshening (salinification) of the North Atlantic, with further weakening (strengthening) of the overturning. This salt–advection feedback constitutes the basis for the theory of rapid climate shifts associated with a bistability of the AMOC with either vigorous overturning (“on” state) or weak or reversed overturning (“off” state) (e.g., Rahmstorf, 2002; Deshayes et al., 2013).
The upper limb of the AMOC is mainly supplied by waters entering the South Atlantic south of America through Drake Passage (Pacific–Atlantic route) and south of Africa via the Agulhas Current system (Indo-Atlantic route). The Pacific–Atlantic route is characterized by cold and fresh waters (Rintoul, 1991) flowing from the Antarctic Circumpolar Current (ACC) directly into the South Atlantic subtropical gyre without any intermediate recirculation in other basins. Within the literature it has been also referred to as the direct “cold water route” (Speich et al., 2001). The Indo-Atlantic route injects comparatively warm and salty waters into the South Atlantic (Gordon, 1986; Richardson, 2007) in the form of large anticyclonic eddies (Agulhas rings), smaller cyclonic eddies, and filaments shed at the retroflection of the Agulhas Current, comprehensively termed Agulhas leakage (de Ruijter et al., 1999; Lutjeharms, 2006). It has been commonly referred to as the “warm water route” (Gordon, 1986; Speich et al., 2001).
Due to their remarkably different water properties the ratio of the inflow through the Pacific–Atlantic and Indo-Atlantic routes impacts the thermohaline characteristics of South Atlantic water masses and may alter the strength and stability of the AMOC (e.g., Weijer et al., 2001). Yet, there is no final consensus on the relative contributions of the two routes to the thermohaline properties and the northward transport of the upper limb of the AMOC (Garzoli and Matano, 2011; Dong et al., 2011). Gordon (1986) postulated the Indo-Atlantic route to be the major source for the upper limb of the AMOC (warm water route hypothesis), while Rintoul (1991) found only a minor importance of the Indo-Atlantic route and suggested the Pacific–Atlantic route to be the dominant one (cold water route hypothesis). Since then, both hypotheses have been controversially discussed. For instance, Schmitz (1995), Macdonald (1998), and Sloyan and Rintoul (2001) supported the cold water route hypothesis, whereas Speich et al. (2001, 2007), Holfort and Siedler (2001), Donners and Drijfhout (2004), Rodrigues et al. (2010), Dong et al. (2011), and Cessi and Jones (2017) favored the warm water route hypothesis.
The conflicting views on the relative importance of the Indo-Atlantic and Pacific–Atlantic routes for thermohaline properties and the northward transport of the upper limb of the AMOC have been partially attributed to conceptual (such as diverging definitions of the cold and warm water routes) and methodological differences (such as the usage of Eulerian vs. Lagrangian approaches to estimate interbasin exchanges). Speich et al. (2001, 2002, 2007) emphasized that the warm and cold water route debate is more complex than previously stated due to the impact of the Southern Hemisphere “supergyre” spanning all three basins. They show that the warm water route, which was traditionally assumed to consist of Indian Ocean waters originating from the Indonesian throughflow (Gordon, 1986; Le Bars et al., 2013), also contains waters entering the Indian Ocean through Tasman leakage south of Australia (Speich et al., 2001, 2002) and waters originating indirectly from Drake Passage through a connection via the Antarctic Circumpolar Current (ACC) and subsequent circulation in the Indian Ocean part of the supergyre (note that some studies also refer to the indirect Drake Passage contribution as the “indirect cold water route”). Moreover, Donners and Drijfhout (2004) refuted the majority of studies in support of the cold water hypothesis by arguing that their common choice of using inverse box model calculations based on distinct hydrographic sections is generally not suited to estimate the highly variable and intermittent interbasin exchange south of Africa via Agulhas leakage. Since then, Lagrangian (model) analyses have become the preferential tool to estimate Agulhas leakage (e.g., Richardson, 2007; Biastoch et al., 2008c; van Sebille et al., 2010; Durgadoo et al., 2013), and the warm water route hypothesis has been prevailing. Recently, further theoretical support for it was provided by Cessi and Jones (2017), who studied the upper limb of the AMOC in an idealized model configuration with simplified atmospheric forcing and geometry (one wide and one narrow basin, representing the Indo-Pacific and Atlantic Oceans, separated by a long and a short continent, representing America and Eurasia–Africa, and connected in the south through a reentrant channel representing the ACC). They showed that the latitude of zero Ekman pumping relative to the southern extent of the short continent determines the route of the upper limb's interbasin exchange and that under the current geographical settings, which allow for a Southern Hemisphere supergyre, the exchange occurs exclusively south of the short continent, that is, via the warm water route.
Still, studies supporting the warm water route hypothesis remain inconclusive. On the one hand, the idealized model configuration of Cessi and Jones (2017) leads to an artificial separation of warm and cold water route scenarios, whereby realistic wind stress forcing and geometry indeed may allow for mixed exchange routes as stated by the authors themselves. On the other hand, Cessi and Jones (2017) and most other studies in support of the warm water route hypothesis were based on the evaluation of relatively coarse-resolution non-eddying or eddy-permitting ocean model simulations (Speich et al., 2001; Donners and Drijfhout, 2004; Speich et al., 2007), and various studies (e.g., Biastoch et al., 2008c; Durgadoo et al., 2013) have demonstrated that coarse non-eddying ocean models overestimate the strength of Agulhas leakage. Thus, there is the need for a confirmation or revision of the warm water route hypothesis by means of Lagrangian analysis with higher-resolution eddy-rich flow fields from ocean model simulations with realistic forcing and geometry.
Furthermore, despite a general agreement that knowledge of the characteristic thermohaline properties of the waters supplying the upper limb of the AMOC and their potential modification during their transit through the South Atlantic is of fundamental importance, including the individual roles played by upper and intermediate waters, thorough analyses within the Lagrangian framework have been scarce (Speich et al., 2001, 2007; Rimaud et al., 2012).
Finally, over the last decades, research on (potential) changes in the Agulhas region have become prominent, since (i) it has been shown that changes in the Agulhas region have the potential to influence the strength of the AMOC through different processes on various timescales (Weijer et al., 2002; Knorr and Lohmann, 2003; Biastoch et al., 2008b; Beal et al., 2011), and (ii) simulations with ocean and coupled ocean–atmosphere models indicate a strengthening of Agulhas leakage since the 1960s (Biastoch et al., 2009; Cheng, 2018). A conclusive observational corroboration of this long-term increase, however, is still lacking (Backeberg et al., 2012; Le Bars et al., 2014), which may be due to decadal leakage variability related to the Southern Annular Mode (Biastoch et al., 2009) that tends to mask its long-term trend. The increase in Agulhas leakage has been attributed to an increase in the Southern Hemisphere westerlies (Durgadoo et al., 2013; Biastoch et al., 2015) and is expected to continue under global warming conditions (Biastoch and Böning, 2013). A potential related increase in salt input into the South Atlantic and its northward advection could oppose the anticipated weakening of the AMOC due to increasing freshwater input in the North Atlantic (Beal et al., 2011). These notional causalities motivated several Lagrangian studies on the pathways and associated advective timescales of Agulhas waters into the North Atlantic (van Sebille et al., 2011; Rühs et al., 2013). However, none of these studies directly investigated potential changes in the advective pathways, thermohaline properties, and transports of the upper limb of the AMOC associated with changes in Agulhas leakage or tried to also relate those to changes in the Pacific–Atlantic contribution.
In this study we address the gaps outlined above and revisit the relative importance of the Indo-Atlantic and Pacific–Atlantic routes for the AMOC upper limb volume transport and water mass characteristics by means of Lagrangian connectivity analyses between the North Brazil Current (NBC) at 6∘ S and the two source regions in a realistic setup of a high-resolution (1∕20∘) ocean model. In addition, for the first time, idealized analyses of decadal changes in the individual contributions are presented. The NBC is chosen as a reference region, since it merges all upper and intermediate northward flow of the tropical South Atlantic and thus channels the upper limb of the AMOC in the tropics. It has further been shown that its transport variability captures decadal AMOC changes and may be used as an index for the AMOC strength (Rühs et al., 2015). Thus, choosing the NBC as a reference region also allows for the investigation of potential decadal changes in the ratio of the two contributions.
The bases for this study are offline Lagrangian analyses of simulated three-dimensional time-varying eddy-rich velocity fields. The underlying model simulation and its performance are described in Sect. 2.1, whereas in Sect. 2.2 the Lagrangian experiment setup is specified.
2.1 Hindcast simulation with eddy-rich ocean model configuration INALT20
The analyzed model output stems from a hindcast experiment (1958–2009) performed with the global nested eddy-permitting to eddy-rich ocean–sea-ice model configuration INALT20 (Schwarzkopf et al., 2019), which is a successor of the well-established INALT01 (Durgadoo et al., 2013) with higher resolution and a southward extended nest.
INALT20 was developed within the DRAKKAR framework (Barnier et al., 2014) and consists of an ocean model formulated with the Nucleus for European Modelling of the Ocean (NEMO version 3.6; Madec and NEMO-team, 2016) coupled to the LIM2-VP sea-ice model (Fichefet and Maqueda, 1997). The ocean is therein described by the primitive equations, which are the Navier–Stokes equations along with a nonlinear equation of state, with commonly adopted approximations resulting from scale considerations including the Boussinesq approximation that effectively reduces mass conservation to volume conservation. It is implemented on a horizontal tripolar Arakawa C grid (Mesinger and Arakawa, 1976), which is Mercator-type south of 20∘ N. It has a global horizontal resolution of 1∕4∘ but is regionally refined between 63∘ S–10∘ N and 70∘ W–70∘ E via two-way nesting with adaptive grid refinement in Fortran (AGRIF) (Debreu and Blayo, 2008) to its nominal resolution of 1∕20∘. This yields an effective resolution of 5.6–27.8 km in the global base and 2.5–5.6 km in the nest, which allows us to fully resolve mesoscale processes (see Hallberg, 2013). In the vertical it is composed of 46 z levels, with grid spacing increasing from 6 m at the surface to a maximum 250 m at depth. Bottom cells can be partially filled, thus allowing for an adjustment to a more realistic topography, which has been obtained from the bathymetry developed by the DRAKKAR community (Barnier et al., 2006) and from interpolating ETOPO1 data (Amante and Eakins, 2009) for the 1∕4∘ and the 1∕20∘ grid, respectively.
For the employed hindcast (experiment identifier KFS044) the model was initialized with temperature and salinity fields from Polar science center Hydrographic Climatology (PHC, version 2.1; updated from Steele et al., 2001), spun up from rest for 30 years, and subsequently run with forcing from the atmospheric fields of the Coordinated Ocean–Ice Reference Experiments data set version 2 (CORE; Large and Yeager, 2009; Griffies et al., 2009) for the period 1958–2009. Turbulent air–sea fluxes were calculated during the model integration through bulk formula using the prescribed atmospheric state, as well as the simulated sea surface temperatures and relative winds. The momentum equations were discretized using the energy- and enstrophy-conserving (EEN; Arakawa and Hsu, 1990) advection scheme with Hollingsworth correction (Hollingsworth et al., 1983; Bell et al., 2017) and a bi-Laplacian lateral diffusion operator. The evolution of tracers was simulated using the total variance dissipation (TVD; Zalesak, 1979) advection scheme and a Laplacian isoneutral diffusion operator. Viscosity and diffusivity coefficients vary horizontally according to the local grid size and are specified via their maximum values Ahm0 and Aht0, set to () m4s−1 and 60 (300) m2s−1 in the nest (base), respectively. Vertical sub-grid-scale physics have been parameterized using a closure scheme dependent on turbulent kinetic energy (TKE; Gaspar et al., 1990; Madec et al., 1998). For more details on the experimental setup and a general model validation please refer to Schwarzkopf et al. (2019).
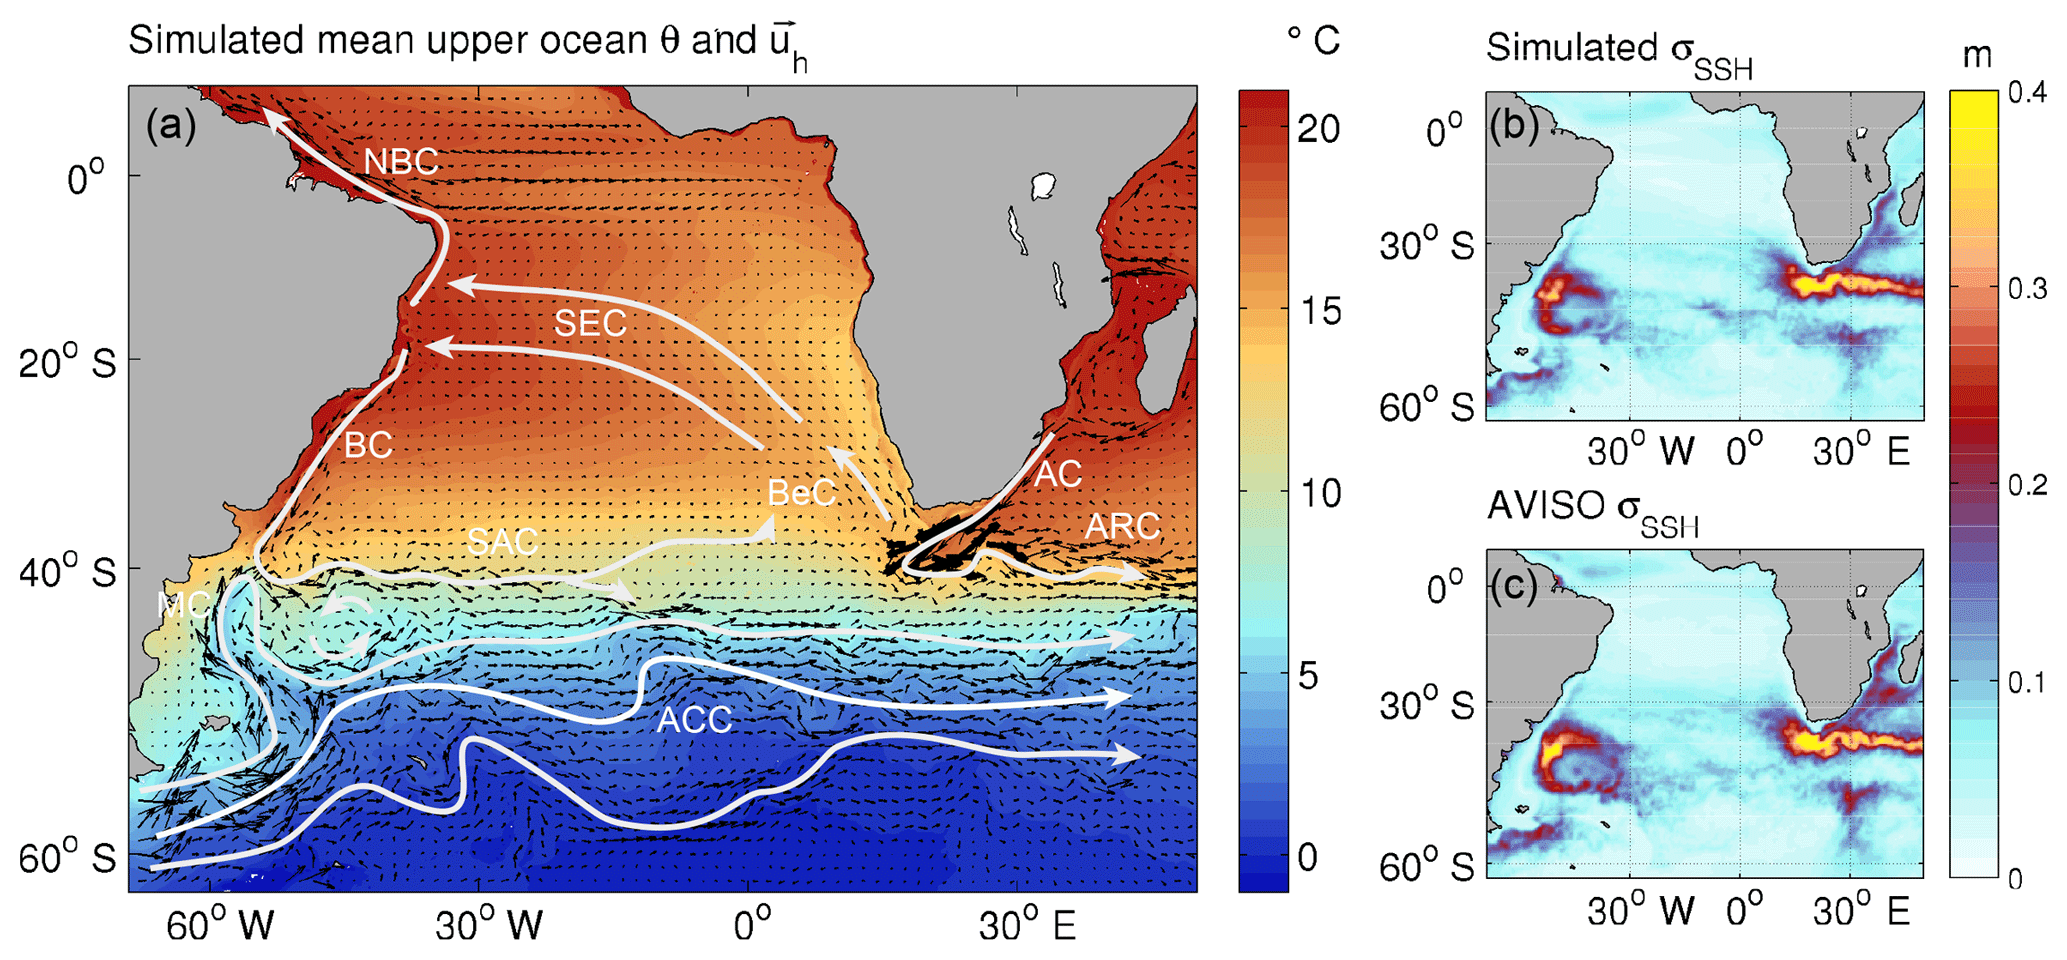
Figure 1South Atlantic circulation pattern. (a) Simulated mean (2000–2009) upper ocean (averaged over upper 750 m of depth) potential temperature θ (color shading) and horizontal velocity uh (vectors); velocity components have been averaged onto a grid for plotting purposes; white arrows highlight major currents of interest for this study: Agulhas Current (AC), Agulhas Return Current (ARC), Benguela Current (BeC), Antarctic Circumpolar Current (ACC), Malvinas Current (MC), South Atlantic Current (SAC), South Equatorial Current (SEC), North Brazil Current (NBC), and Brazil Current (BC). (b–c) Mean standard deviation of sea surface height σSSH from simulations and AVISO based on 5 d means in 2000–2009.
In this study we used the simulated 5 d mean velocity and tracer fields from the nested domain, which show a realistic representation of the mean flow pattern and mesoscale eddy activity in the South Atlantic and adjacent Southern Ocean sector (Fig. 1).
Most importantly for this study, they adequately represent the major current systems providing the Pacific–Atlantic and Indo-Atlantic inflow of upper limb waters, which are the ACC and Agulhas Current systems. The mean (2000–2009) transport of the ACC through Drake Passage amounts to 116.2±7.5 Sv (1 Sv: =106 m3s−1; uncertainties are given in terms of 1 standard deviation). This value is not too far from the ACC transport of 134±11.2 Sv reported by Cunningham et al. (2003), given that they estimated the error of this average transport to be between 15 and 27 Sv. Notably, the model features a distinct South Atlantic Current (SAC) north of the ACC and captures the anticyclonic circulation of the Zapiola Gyre (Fig. 1a), while coarser-resolution models generally failed to separate the SAC from the ACC and did not resolve the Zapiola Anticyclone (see Stramma and England, 1999). In an accompanying study Schwarzkopf et al. (2019) show that the total simulated Agulhas Current transport compares reasonably well with available observational estimates from the ACE (at 32∘ S; Bryden et al., 2005) and ACT (at 34∘ S; Beal et al., 2015) arrays. Moreover, the simulated standard deviation of sea surface height (σSSH), which is a measure of surface geostrophic eddy variability, agrees well with the observed pattern and magnitude of σSSH derived from the Archiving, Validation, and Interpretation of Satellite Oceanographic (AVISO) data product (Fig. 1b–c). In particular, it features the characteristic pattern of high σSSH at the Brazil–Malvinas confluence zone, as well as in the extended Agulhas Current system.
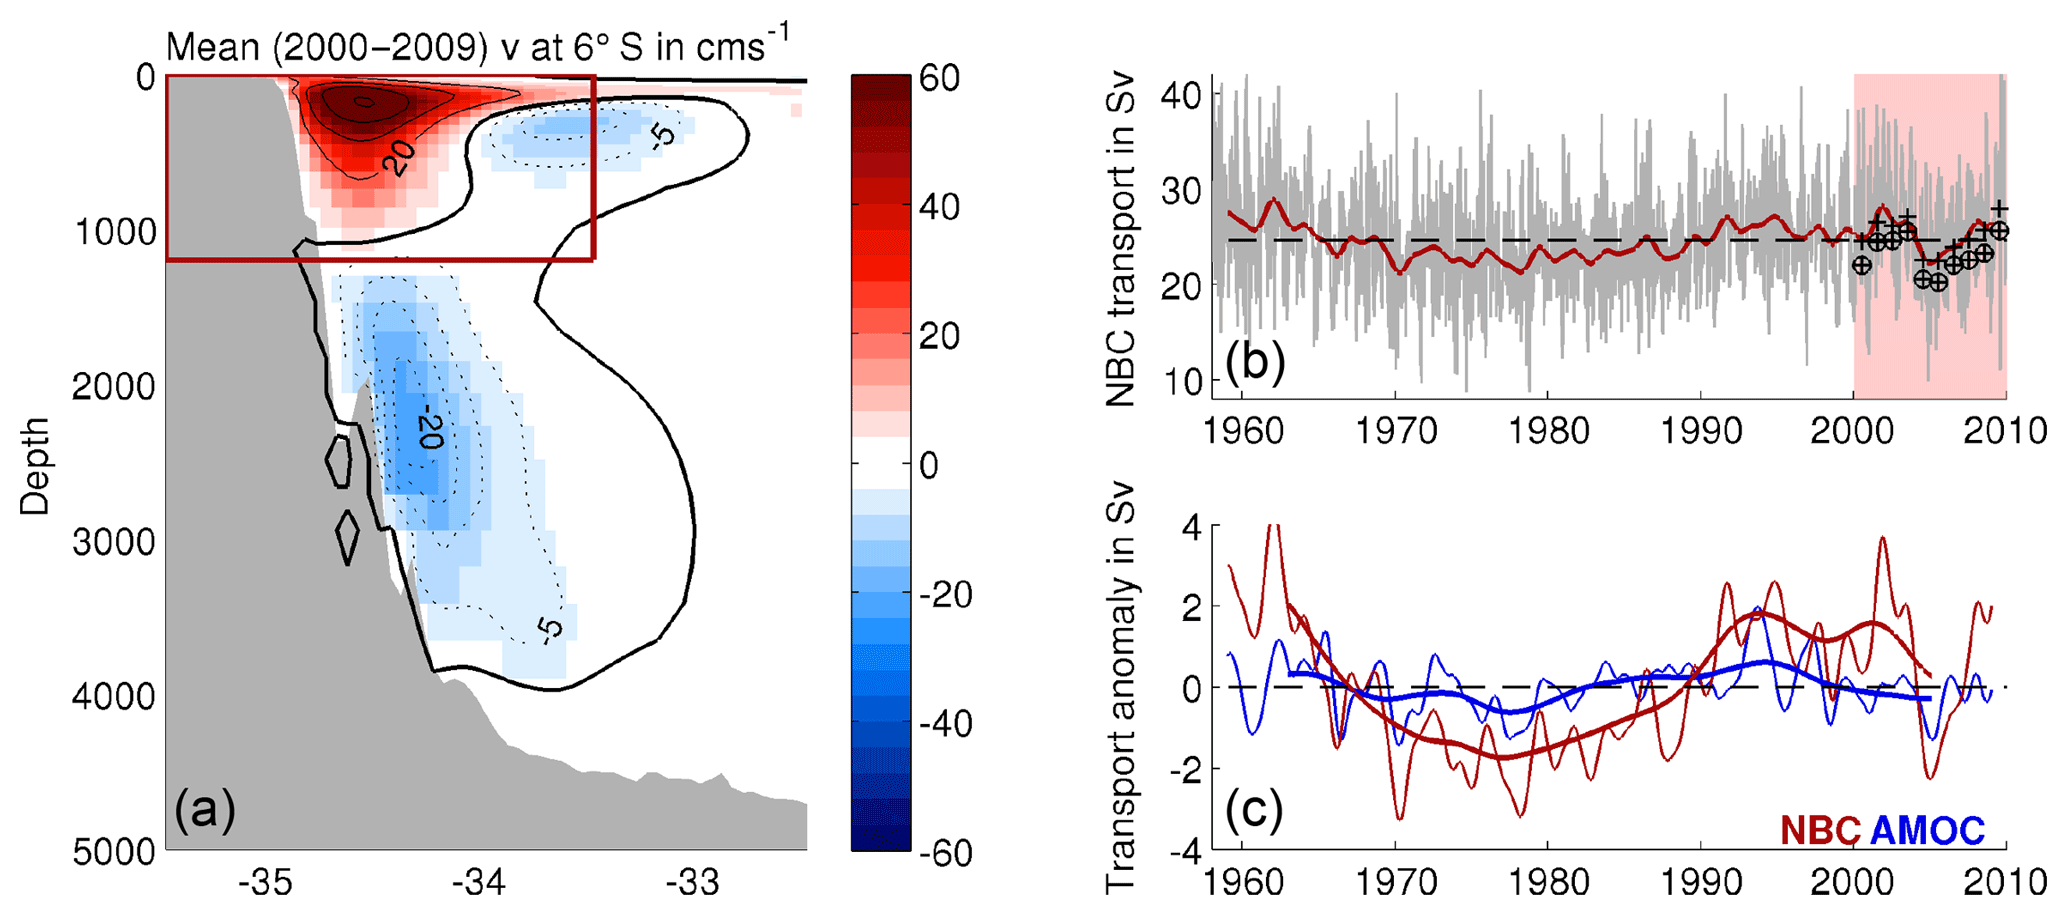
Figure 2Simulated NBC and AMOC at 6∘ S. (a) Mean (2000–2009) meridional velocity v in the western tropical Atlantic; the NBC transport is defined by the integrated positive meridional (northward) velocities between the coast and 33.5∘ W and between 0 and 1200 m of depth (red box). (b) 5 d mean (grey) and interannually low-pass-filtered (red) NBC transport time series; the release period for the Lagrangian REF experiments is highlighted in light red, and annual mean Lagrangian transport estimates without (crosses) and with (crosses in circles) correction for meanders are marked. (c) Interannual (thin) and decadal (thick) NBC (red) and AMOC (blue) transport anomalies (long-term mean subtracted).
Within the simulated 5 d mean velocity fields, the strength and variability of NBC and AMOC are also well represented. Figure 2a and b shows a meridional velocity section at 6∘ S, as well as the derived time series of the simulated NBC transport, obtained from the integration of the northward velocities between 0 and 1200 m of depth and from the coast to 33.5∘ W (see Hummels et al., 2015; Rühs et al., 2015, and references therein for a justification of the adopted NBC definition). One can identify the northward-directed NBC with a subsurface maximum, its southward recirculation to the east, and the southward-flowing Deep Western Boundary Current underneath. The mean (2000–2009) NBC transport of 25.5±5.0 Sv falls well into the observed range of 26.5±3.7 Sv reported by Schott et al. (2005) based on repeated shipboard sections at 6∘ S (nine-section ensemble with individual measurements between 1990 and 2004). The simulated mean (2000–2009) AMOC strength, defined at each latitude as the maximum of the meridional overturning stream function, yields 14.8±6.3 Sv at 6∘ S. Unfortunately, the lack of observational AMOC estimates hampers model verifications at this latitude. Yet, first results of the SAMBA array (Meinen et al., 2013) allow for some useful quantitative assessments at 34.5∘ S. Here, the simulated mean (2000–2009) AMOC transport of 13.6±5.0 Sv fits well with the recently published observational estimates of 14.7±8.3 Sv (Meinen et al., 2018, based on daily data over the 2009–2017 period, with a ∼3-year gap from December 2010 to September 2013). The decadal variability of NBC and AMOC (Fig. 2c) at 6∘ S features the characteristics already presented in Rühs et al. (2015): the NBC and AMOC transports vary roughly in phase with overall decreasing transports in the 1960s and 1970s and a recovery in the 1980s and the early 1990s, whereby the decadal NBC variability is more than twice as large in magnitude. This suggests that the conclusions of Rühs et al. (2015) also hold for this model simulation, i.e., that the basin-scale decadal variability of the AMOC is indeed captured in the NBC but is additionally superimposed (and thus masked) by wind-driven gyre variability.
2.2 Offline Lagrangian analysis of AMOC upper limb pathways with ARIANE
We used the ARIANE tool (version 2.2.6; Blanke and Raynaud, 1997; Blanke et al., 1999) to perform three sets of offline Lagrangian experiments, one reference set (hereafter REF), and two sensitivity sets corresponding to a weak and a strong phase of Agulhas leakage (hereafter lowAL and highAL).
ARIANE is a freely available Fortran software that infers Lagrangian particle trajectories from simulated three-dimensional volume-conserving velocity fields saved on a C grid by offline advecting virtual fluid particles along analytically computed streamlines. No additional sub-grid-scale Lagrangian diffusion parameterization was implemented. The obtained trajectories thus represent volume transport pathways, which may experience along-track tracer and density changes that reflect the sub-grid-scale parameterizations of the underlying ocean general circulation model (OGCM), including vertical tracer mixing in the mixed layer. For a detailed discussion of this concept please refer to van Sebille et al. (2018).
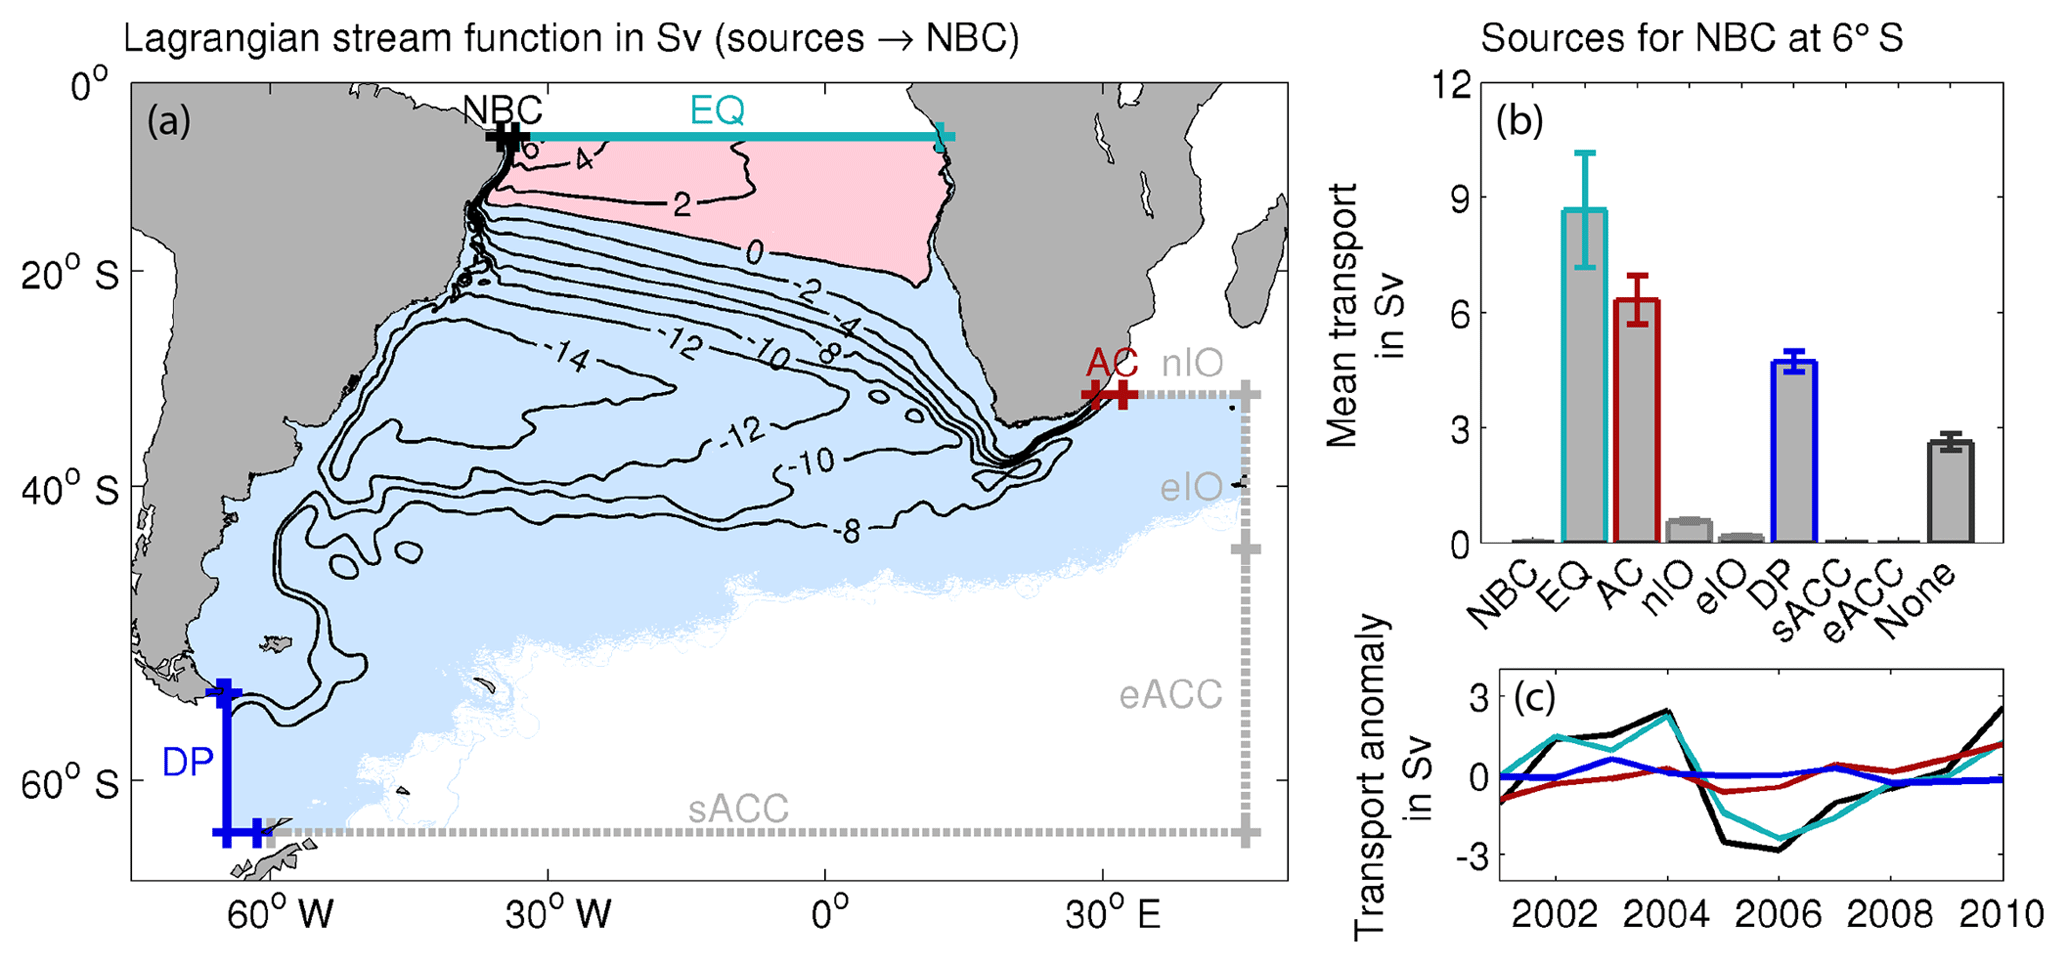
Figure 3Sources for NBC transport inferred from the REF set of 10 Lagrangian experiments for which particles were released in the NBC at 6∘ S every 5 d for years 2000 to 2009 and then traced backwards in time towards the indicated source sections for a maximum of 40 years. (a) Mean Lagrangian stream function representing volume transport pathways from all source sections towards the NBC. (b) Mean volumetric contributions of the individual sources to the NBC; whiskers indicate the range of transport estimates. (c) Time series of interannual variability of the total NBC transport (black line) and its individual contributions, which are volumetric contribution of each Lagrangian experiment plotted against the respective release year (colored lines).
For REF we released virtual fluid particles every 5 d for the years 2000–2009 over the full depth of the northward-flowing NBC (0–1200 m of depth, coast to 33.5∘ W) at 6∘ S, yielding a set of 10 1-year release experiments with a total of O(106) particles. The number of particles seeded at each time step was proportional to the current NBC transport. Following Blanke et al. (1999) each particle was tacked with a partial volume transport (max. 0.01 Sv) so that the cumulative transport of all particles released at each time step reflects the current total NBC transport. Subsequently, the particles were advected backwards in time until the point at which they entered the study domain through one of the predefined source sections displayed in Fig. 3, but at maximum for 40 years. During the trajectory integration the potential temperature and salinity fields were linearly interpolated onto the particle positions.
For the Lagrangian sensitivity experiments we followed the same procedure as for REF but used only velocity fields from preselected periods of weak (1960–1969) and strong (2000–2009) Agulhas leakage (based on the Agulhas leakage transport time series inferred from a complementary set of offline Lagrangian experiments following Durgadoo et al. (2013); see also Appendix A). That is, we released particles in the NBC at 6∘ S for years 1960–1969 (lowAL) and 2000–2009 (highAL) and then traced them backwards towards the predefined source sections by looping through the velocity data of each period for a maximum of 40 years (instead of making use of the whole simulation period 1958–2009). Even though this looping technique has already been employed by various authors (e.g., Döös et al., 2008; Rühs et al., 2013; Thomas et al., 2015; Berglund et al., 2017; Drake et al., 2018; Durgadoo et al., 2017), the obtained results have to be interpreted with caution. Looping may introduce unphysical jumps in the velocity and tracer fields and, consequently, also in the volume transport pathways and along-track tracer changes. Döös et al. (2008) and Thomas et al. (2015) showed that the errors in the pathways introduced by looping can be negligible if a sufficiently high number of virtual fluid particles is considered and the (model) drift in the velocity fields is not too large. We are accounting for that by continuously seeding particles over 10 years and looping over a period of only 10 years. However, the analysis of along-track thermohaline property modifications makes little sense for timescales exceeding the period of available data. Therefore, in this study, we employ the looping technique only for estimating sensitivities of the derived volumetric connectivity measures to different idealized states of the South Atlantic circulation pattern, but not for assessing along-track property modifications.
To quantitatively evaluate the major pathways of the large set of individual trajectories we followed Blanke et al. (1999) and calculated Lagrangian transport stream functions (Fig. 3a). These represent time-integrated mean volume transport pathways derived from all trajectories entering and leaving the domain – particles still in the domain were not considered (including them would have violated the constraint of volume conservation). Negative and positive values represent anticyclonic and cyclonic circulation patterns, respectively. A bundling of streamlines highlights the most prominent pathways, and closed streamlines indicate recirculation patterns. To visualize the distribution of AC or DP waters along distinct sections we inferred binned transport-weighted particle frequencies by dividing the cumulative transport of particles occupying a certain bin by the cumulative transport of the whole set of particles. Transport-weighted particle distributions are preferred over simple particle frequency distributions since they take into account the fact that each particle can be associated with a slightly different transport.
Note that even though trajectory integrations were performed backwards in time to identify the sources for the upper limb of the AMOC, in the following the resulting Lagrangian connectivity measures will be described in the more intuitive forward sense: that is, in the flow direction.
This section starts with a thorough assessment of the Lagrangian trajectory set REF – representing the mean AMOC upper limb connectivity between the Indian–Pacific Ocean and the NBC over the last decades – in terms of a volumetric decomposition (Sect. 3.1), transit times (Sect. 3.2), volume transport pathways (Sect. 3.3), and along-track thermohaline property modifications (Sect. 3.4). It closes with a short discussion of potential decadal changes in the derived connectivity measures associated with an increase in Agulhas leakage by a joint evaluation of the two trajectory sets lowAL and highAL (Sect. 3.5).
3.1 Volumetric decomposition of NBC and AMOC upper limb transport at 6∘ S
From the Eulerian mean (2000–2009) NBC transport of 25.5 Sv, 2.4 Sv was identified as representing meanders within the framework of the Lagrangian analysis. Meanders consists of particle trajectories that enter and also leave through the NBC section. Subtracting the meander-associated transport yielded a new corrected Lagrangian mean (2000–2009) NBC transport estimate of 23.1 Sv (see Fig. 2b), from which 8.7 Sv (38 %) stems from the equatorial Atlantic (EQ), 6.3 Sv (27 %) from the Agulhas Current (AC), and 4.7 Sv (20 %) from Drake Passage (DP) (Fig. 3b). Other inflow sections from the Indian Ocean (nIO and eIO) constitute only a minor source of 0.8 Sv. On average 2.6 Sv could not be unequivocally attributed to one of the predefined sources, since the associated particles did not leave the study domain within the 40 years of integration (see the discussion below).
If one examines the individual Lagrangian experiments of REF with 10 different release years, one detects a large interannual variability of the total NBC transport as well as in the individual volumetric contributions of the different sources, which necessitates the adopted strategy of multiple Lagrangian experiments with different release periods (Fig. 3c). Most interannual volume transport variability in the NBC is related to variability in the EQ contribution, whereas interannual variability in the AC and DP contributions is less pronounced. Even though the order of the individual sources according to their total volume transport contribution does remain constant in all experiments and the EQ contribution is always the largest, the relative EQ contribution indeed varies between 31 % and 43 %. Interestingly, the relative AC contribution nearly constantly increases from 25 % in 2000 to 29 % in 2009 (not shown). This increase in the AC contribution could be regarded as an indication that the increase in Agulhas leakage is indeed projected onto the NBC and upper limb of the AMOC in the tropical Atlantic. However, the Lagrangian analyses discussed here are not sufficient to unequivocally determine a link between Agulhas leakage strength and the AC contribution to the NBC transport. In principle, a larger Agulhas contribution could stem from a preceding increase in Agulhas leakage and/or from a higher percentage of Agulhas leakage waters reaching the NBC due to changes in the subtropical gyre circulation – even if Agulhas leakage itself stays constant or decreases (see Tim et al., 2018). In Sect. 3.5, we discuss the possible impact of an ongoing increase in Agulhas leakage on the NBC and upper limb of the AMOC in more detail by making use of lowAL and highAL.
Some uncertainty in our analysis arises from the fact that on average 2.6 Sv of NBC waters could not be sampled at one of the source sections after 40 years of trajectory integration since the corresponding particles remained inside the predefined domain. At the end of the integration period most of these particles could be located within the interior of the tropical and subtropical gyres (not shown), indicating that (multiple) recirculations prevented them from leaving through one of the source sections. To obtain a first estimate of where these waters may stem from, we extended the integration period for the respective particles to 80 years by cycling through the available velocity data for the period 1958–2009 (similar procedure as for the Lagrangian sensitivity experiments lowAL and highAL described in Sect. 2.2, but by making use of the whole velocity data set instead of restricted time periods). In the additional 40 years of integration, out of the 2.6 Sv, 0.8 Sv could be sampled at the DP, 0.4 Sv each at the AC and EQ, and 0.1 Sv at the nIO and eIO sections; 0.8 Sv still did not reach any section. This suggests that our analysis of the REF experiments with 40 years integration most likely slightly underestimates the AC, EQ, and in particular the DP contribution (further support for this assumption follows below in Sect. 3.2).
Of particular interest for this study are sources contributing to the northward flow of the upper limb of the AMOC, which are the AC, DP, and IO contributions that amount to 11.8 Sv when averaged over all Lagrangian experiments in REF. The EQ contribution is not considered part of the net northward upper limb flow at 6∘ S, since the southward inflow happens across the same zonal section and in the same depth range as the northward NBC outflow. We attribute this contribution to the more local tropical circulation, acknowledging that the NBC is not only part of the basin-scale AMOC but also of the wind-driven horizontal gyre circulation and the shallow overturning of subtropical–tropical cells (Rühs et al., 2015). Adding the 1.3 Sv that, according to the extended experiments with 80 years of integration, most likely also stems from AC, DP, and IO yields an estimate for the Lagrangian mean upper limb transport at 6∘ S of 13.1 Sv. This number compares well with the simulated mean (2000–2009) Eulerian AMOC strength at 6∘ S of 14.8±6.3 Sv, which gives us confidence in the validity of our Lagrangian decomposition of the AMOC's upper limb with the NBC at 6∘ S as a reference point. The remaining discrepancy between the Lagrangian and Eulerian estimate of the AMOC strength can be attributed to (i) particles that did not cross any sampling section but remained in the domain even after 80 years integration, in total amounting to 0.8 Sv, (ii) a minor upper limb contribution flowing northward in the interior tropical Atlantic (additional Lagrangian experiments backwards in time from the EQ instead of the NBC section yield quantitative estimates for that contribution of 1.0 and 1.2 Sv after 40 and 80 years of integration, respectively), and (iii) differences in Lagrangian and Eulerian averaging.
Our results – with and without the second integration cycle – seem to generally agree with the prevailing conception that the warm water route is the major source for the return flow. The respective AC and minor IO contribution to the AMOC's upper limb transport at 6∘ S amounts to 60 % (7.1 from 11.8 Sv) in REF and to 58 % (7.6 from 13.1 Sv) in the extended experiment. Nonetheless, we also obtained a DP contribution of 40 % (4.7 from 11.8 Sv) and 42 % (5.5 from 13.1 Sv), respectively, which, to our knowledge, is substantially higher than those inferred from all previous Lagrangian model studies but now better matches those derived from observations. For instance, with regard to Lagrangian model studies, Speich et al. (2001), Donners and Drijfhout (2004), and Speich et al. (2007) only estimated a direct cold water route contribution of 13 % (2.3 from 17.8 Sv at 20∘ N), 6 % (1.0 from 16.2 Sv at 0∘ N), and <6 % (<1.0 from 17.4 Sv at 44∘ N), respectively. All these studies employed the same analytical trajectory integration method, so differences in the derived volumetric contributions to the upper limb of the AMOC can be mainly related to differences in the analyzed OGCM output (even though the different reference sections for the Lagrangian decomposition do not allow for a detailed one-to-one comparison). A possible reason for our remarkably different rating of the relative importance of the direct DP contribution could be the increased horizontal (and temporal) resolution of the underlying model data of this study compared to those of previous ones. On the one hand, an increased resolution leads to a way more realistic representation of the current structure in the southern South Atlantic. Despite generally enhanced eddy-driven cross-frontal transports, it allows for the separation of the SAC from the ACC as described in Sect. 2.1 and a more detailed representation of the intricate flow pattern in the Brazil–Malvinas confluence zone. All these features potentially influence the existence and strength of the direct DP contribution (see Sect. 3.3). On the other hand, coarser-resolution models are likely to overestimate the AC contribution due to unrealistically high Agulhas leakage (see Sect. 1), thereby reducing the relative importance of the DP contribution. It must be underlined however, that Speich et al. (2001) and Speich et al. (2007) used an OGCM in a robust diagnostic mode. Therefore, the analyzed fields have to be interpreted rather as a dynamical interpolation of observations than as a prognostic model output. Hence, more dedicated studies are needed to test the sensitivity of the relative DP and AC contributions to the model resolution, as well as to the potential impact of other details in the model configuration and forcing. In terms of observations, estimates of corresponding mean absolute transports were not available until Rodrigues et al. (2010) addressed this issue. They used the hydrographic and subsurface float data from the World Ocean Circulation Experiment (WOCE) to estimate total transports for key regions in the South Atlantic, yielding a cold water contribution of 36 % (4.7 from 13.2 Sv at 32∘ S). Hence, these observation-based estimates support the findings of our new model-based analysis.
Due to the reasoning outlined in Sect. 2.2, for the rest of these study results are based on the REF experiments without cycling of the velocity fields (except for Sect. 3.5, where lowAL and highAL are analyzed). Since the majority of DP and AC particles do reach the NBC within the REF integration period of 40 years (see Sect. 3.2), we are convinced that the general scientific interpretation will not change with increasing integration time, even though absolute numbers may (as demonstrated above).
3.2 Transit times towards NBC at 6∘ S
The transit times of waters from the different sources to reach the NBC are crucial for understanding how these source waters and potential changes therein are transported downstream and impact the mean characteristics and variability of NBC waters as well as the upper limb of the AMOC. Here we infer advective timescales from the simulated volume transport trajectories. Note that timescales inferred from trajectories accounting for the effect of sub-grid-scale physics, e.g., representing advective–diffusive tracer spreading, could lead to modified, e.g., broadened, transit time distributions.

Figure 4Transit times from the (a) EQ, (b) AC, and (c) DP source region towards the NBC at 6∘ S; bars and solid colored lines represent mean transport-weighted transit time distributions, and dashed colored lines indicate the range of the 10 REF experiments (displayed as thin grey solid lines).
Figure 4 shows the transport-weighted distributions of the advective transit times through the South Atlantic from the EQ, AC, and DP sections, respectively: from the EQ section the NBC is reached by the majority of particles (>50 %) in less than 3 years, with 1 year being the most frequent transit time (modal value of the transit time distribution), which results from short pathways on which changes can be relatively fast and directly transmitted. This is one reason why interannual variability in the NBC mostly corresponds to variability of the EQ contribution, which is most probably a response to local variability in the wind forcing (see Rühs et al., 2015). From the AC and particularly DP the majority of particles (>50 %) reach the NBC in 9 and 18 years, and the most frequent transit times are 7 and 12 years, respectively; hence, they need considerably more time. In addition to the shift to longer timescales, the transit time distributions are broadening, in particular for waters with DP origin, representing longer and more diverse connecting pathways. The interannual variability of the volumetric AC and DP contributions thus constitute the accumulation of past changes at the source and potential additional circulation changes along the way. This may impede a direct imprint of variability at the DP and AC sources on the NBC.
The derived transit time distributions for the AC contribution closely match those derived by Rühs et al. (2013) based on output from the ocean model configuration INALT01, the precursor of the configuration INALT20 employed here. As already stated in Rühs et al. (2013), the transit times appear slightly longer than those estimated by van Sebille et al. (2011), even though a detailed comparison is inhibited by differences in the applied methodologies and emphases of the studies.
Our derived transit times from the DP into the equatorial Atlantic can be compared to the transit times from DP towards 20∘ N estimated by Speich et al. (2001). Most notably, Speich et al. (2001) arrived at a multi-modal distribution and interpreted peaks at 19 and 29 years as the representative time periods needed for DP waters to reach the North Atlantic on a relatively direct path and with one recirculation in the South Atlantic, respectively. The 19 years for the direct path is comparable to our 12 years if following Rühs et al. (2013) and assuming the transit from 6∘ S to 20∘ N to account for another ∼6 years. However, our analysis does not show a second peak. This may be due to differences in the horizontal and temporal resolution of the employed ocean models. Our analysis is based on a high-resolution fully eddying configuration, whereas Speich et al. (2001) used a coarse, non-eddying one. Moreover, we used 5 d mean velocity fields of a hindcast experiment, whereas Speich et al. (2001) used monthly means from a climatological experiment. The increase in resolution and allowance for interannual variability most likely lead to more diverse recirculation pathways and associated transit times, thereby disintegrating the second peak in the transit time distribution.
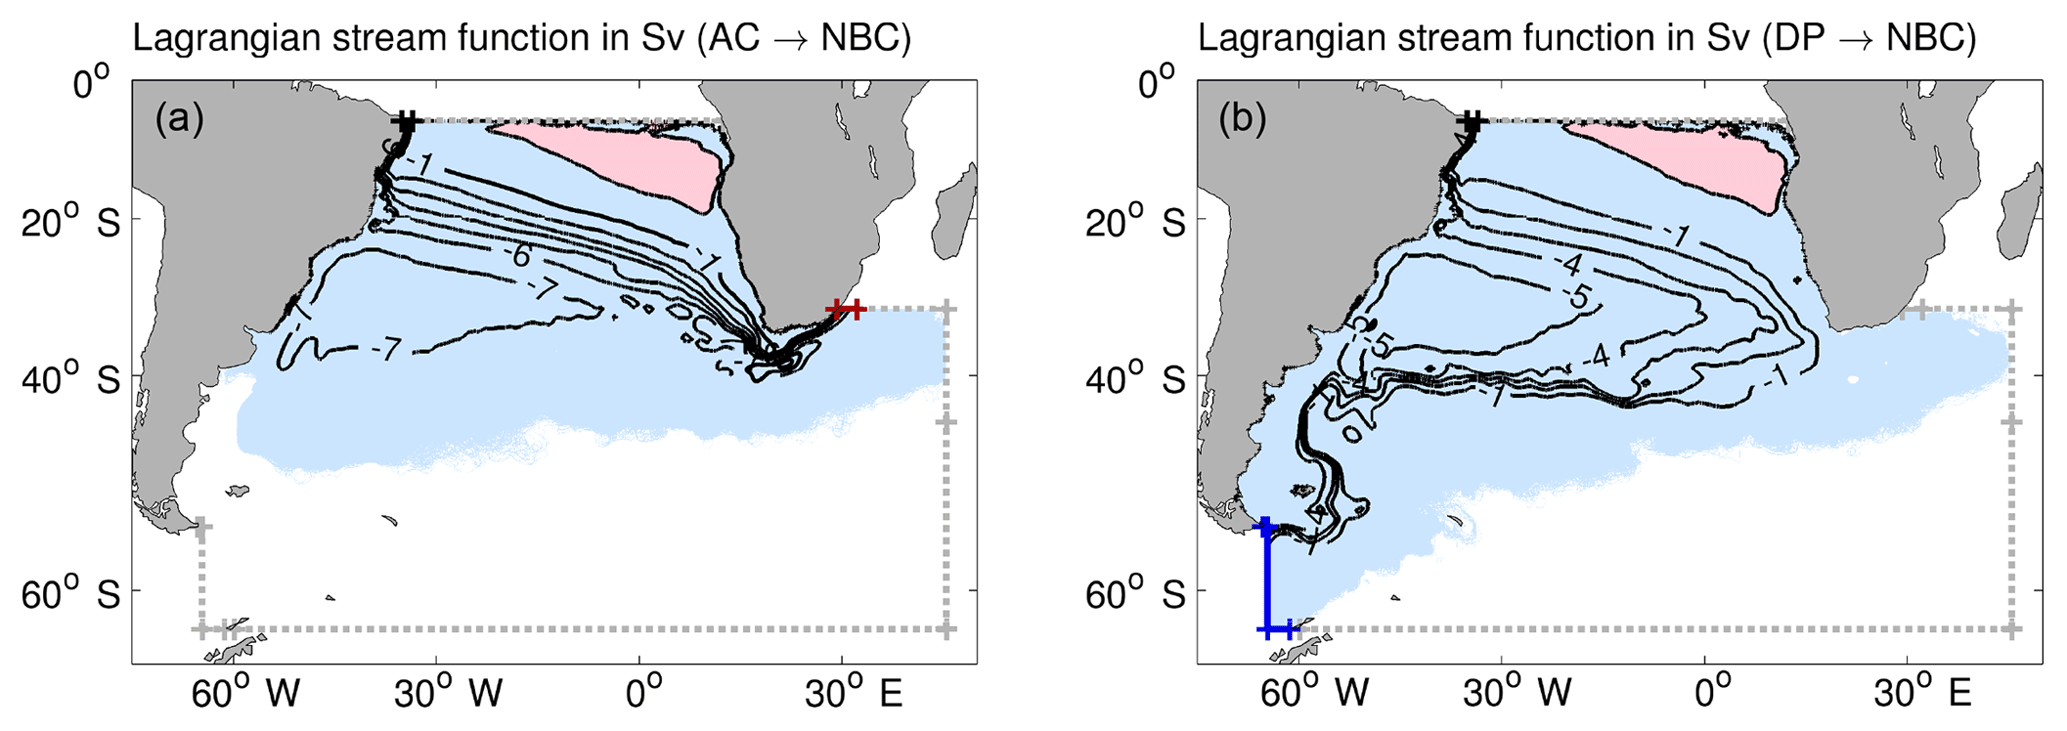
Figure 5Mean Lagrangian stream function from all 10 REF experiments representing net volume transport pathways between (a) AC or (b) DP and the NBC; contour intervals of 1 Sv.
Further note that the shape of the transit time distribution for the DP contribution shows a less distinct modal value and a broader tail than those for the AC and EQ distributions. This supports our assumption (see Sect. 3.1) that a large part of the particles that remained in the domain after 40 years of integration could probably be attributed to the DP source, which reinforces the importance of the DP as a contributor to the upper limb of the AMOC.
3.3 AMOC upper limb pathways in the South Atlantic
In this section we have a closer look at the mean AMOC upper limb pathways in the South Atlantic by investigating the connection from the two major individual sources, which are the AC and DP regions, towards the NBC. This is done by using conditional Lagrangian stream functions, which were calculated considering only the respective subsets of trajectories and represent the associated net advective volume transport pathways (Fig. 5).
From the Indian Ocean the dominant volume transport pathways towards the NBC are via the narrow Agulhas Current, Agulhas leakage (in the form of Agulhas rings or within the Benguela Current), and the broad South Equatorial Current (Fig. 5a), as already described in previous studies (e.g., van Sebille et al., 2011; Rühs et al., 2013). Some recirculation may occur in the subtropical gyre (∼1 Sv) and in the Agulhas basin itself (∼3 Sv). AC waters contributing to the NBC enter as surface and intermediate waters over the whole longitudinal and depth range of the Agulhas Current and later occupy the whole longitudinal and depth range of the NBC (Fig. 6a, c).
From the Pacific, the majority of fluid particles later reaching the NBC through a relatively direct path (without a detour through the Indian and eventually also the Pacific Ocean within the Southern Hemisphere supergyre) enter the Atlantic through the northern part of Drake Passage (∼3 Sv) and follow a narrow path through the Malvinas Current and the South Atlantic Current before entering the South Equatorial Current over a broad longitudinal range in the eastern part of the basin (Fig. 5b), as roughly described in Speich et al. (2001). However, as already indicated by the relatively broad transit time distribution, there are many different pathways for DP waters towards the NBC with different side tracks: some particles amounting to ∼1 Sv follow the ACC into the eastern part of the basin, eventually make a little detour into the Agulhas basin, and finally enter the South Equatorial Current via the Benguela Current system. Approximately 1 Sv of DP waters is recirculated in the South Atlantic subtropical gyre at least once before finally entering the NBC.

Figure 6Depth distribution for (a) AC waters at source, (b) DP waters at source, (c) AC waters in NBC, and (d) DP waters in NBC as inferred from all 10 REF experiments: relative transport-weighted particle frequency per m bin in percent (color shading); overlaid mean (2000–2009) Eulerian cross section velocities in meters per second (light grey contours; note the different contour intervals); and mean cumulative Lagrangian volume transport per 100 m depth bin in Sverdrups (bar graphs).
A comparison of the DP particle distributions at the NBC section with the local Eulerian mean cross section velocities shows that DP particles can be found over the whole depth range and zonal extent of the NBC roughly proportional to the local current strength (Fig. 6d). The DP particle distribution at the source section, however, does not directly reflect the Eulerian cross section flow through Drake Passage (Fig. 6b). The eastward ACC transport through Drake Passage is known to occur mainly within two jets corresponding to the Subantarctic Front and the Polar Front (Cunningham et al., 2003; Firing et al., 2011). These two maxima are captured in the model simulation, but only from the northern one may virtual fluid particles directly enter the subtropical gyre and contribute to the South Atlantic branch of the AMOC's upper limb. Particles that follow the ACC south of 53∘ S eastward beyond 35∘ W have zero chance to enter the subtropical gyre before leaving the Atlantic sector of the Southern Ocean south of Africa towards the Indian Ocean sector (at least in this model study). These imaginary borders also define the separation between the direct and indirect cold water route, which in our study is located more eastern than reported by Speich et al. (2001), who identified it at about 50∘ S and 50∘ W. This difference is most probably again related to more diverse pathways in our higher-resolution model simulation.
When comparing the Lagrangian stream functions and depth distributions from the AC and DP contributions, it becomes apparent that the dominant spreading pathways of both contributions coincide in the horizontal as well as in the vertical plane within the subtropical gyre. However, the spreading of AC waters is concentrated in slightly more northern and shallower branches of the SEC than the spreading of DP waters. Consequently, within the NBC, AC waters dominate in the upper 400 m and DP waters below. The coinciding pathways indicate that both contributions potentially mix along their transit through the South Atlantic and may experience thermohaline property changes.
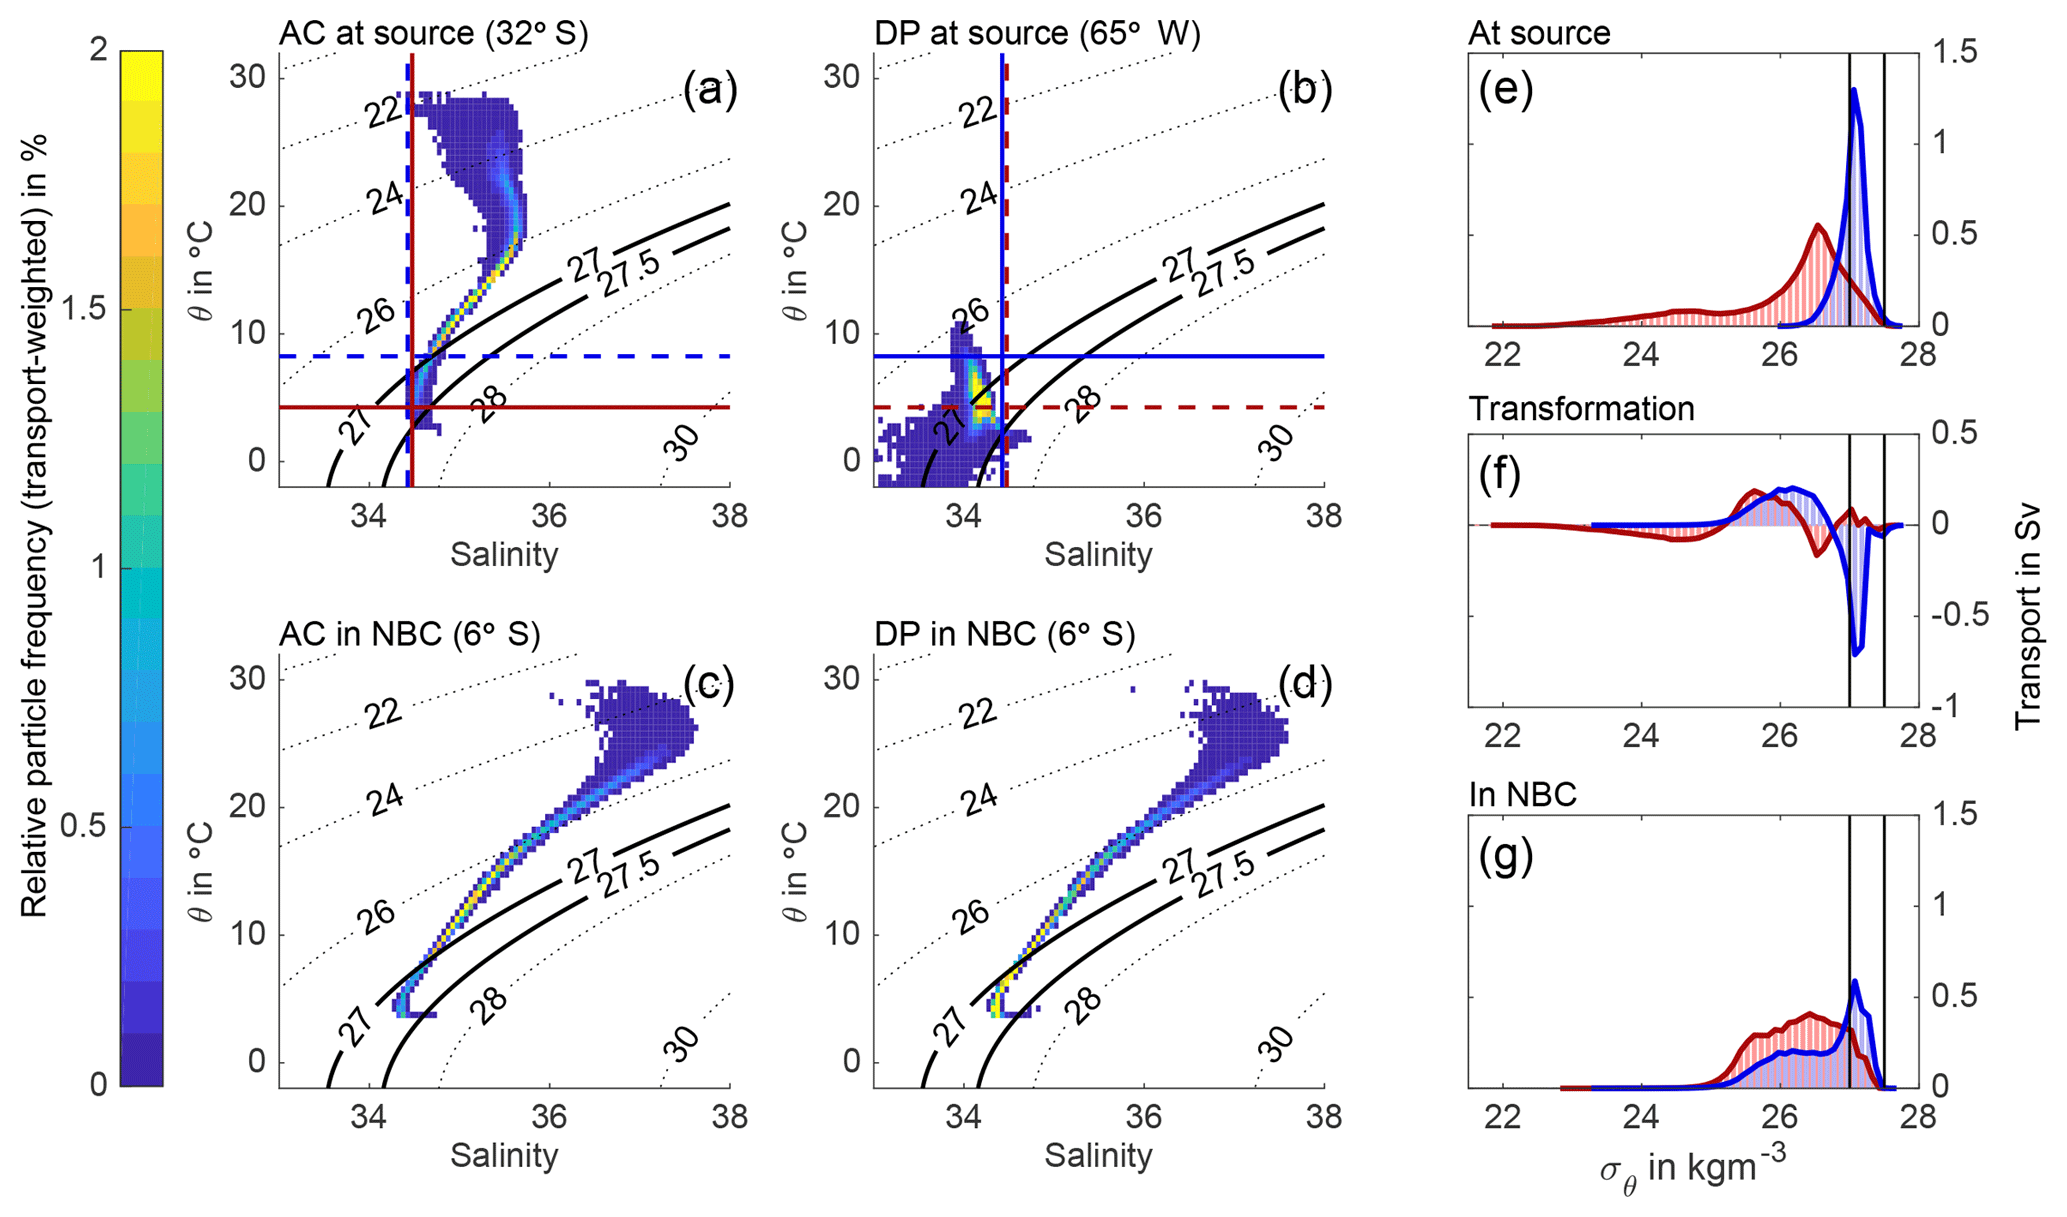
Figure 7Thermohaline properties of waters with AC and DP origin inferred from all 10 REF experiments. (a–d) Mean potential temperature (θ) and salinity (S) characteristics of AC and DP waters at their source and within the NBC: relative transport-weighted particle frequency per 0.5 ∘C × 0.1 psu bin in percent (color shading); initially, 99 % of the DP (AC) water volume can be found at temperatures colder (warmer) than 8.5 ∘C (4.0 ∘C) and at salinities lower (greater) than 34.45, as indicated by blue (red) lines. (e–g) Mean volume transport per density class (in 0.1 kg m−3 bins) of AC (red) and DP (blue) waters at their source and within the NBC, as well as associated transformation in density space (bar graphs); potential density levels used to separate upper, intermediate, and deep waters are highlighted by solid black lines.
3.4 AMOC upper limb thermohaline property modification within the South Atlantic
Figure 7a–d visualize the mean potential temperature (θ) and salinity (S) characteristics of DP and AC waters at their respective source and within the NBC by means of histograms of relative transport-weighted particle frequency in θ–S space (0.5 ∘C ×0.05 bins). In its source regions, the DP contribution is relatively fresh (32.25 to 34.75) and cold (−2 to 11.0 ∘C) with potential density anomalies ( kgm−3; in the following units are dropped for better readability) between 25.9 and 27.8, whereas the AC contribution is more salty (34.30 to 35.75) and spans a broader temperature range (2.5 to 29.0 ∘C) with σθ between 21.7 and 27.7. Note that there is no clear separation of the two sources in temperature as the terminology cold and warm water routes may imply, since the AC contribution not only consists of warm surface waters, but also of colder central and intermediate waters (Beal et al., 2006; Speich et al., 2007; Biastoch and Böning, 2013). In our Lagrangian model analysis 99 % of the DP (AC) contribution originally has temperatures colder (warmer) than 8.5 ∘C (4.0 ∘C), and 75 % (11 %) of DP (AC) waters can be found in the respective shared temperature range from 4.0 to 8.5 ∘C. However, the AC and DP water contributions can be distinguished well by the salinity in their source regions: 99 % of the DP (AC) contribution originally has salinities lower (greater) than 34.45. Hence, we may consider fresh and salty routes as an alternative and more precise terminology, which also accounts for the relative role of the two sources with respect to the salt–advection feedback. Yet, dependent on the specific research question, the mean temperature difference between the two may still be of (larger) importance. Therefore, we would recommend referring directly to the geographic origin to avoid ambiguities. Upon arrival in the NBC, fluid particles with DP origin cover nearly the same θ–S spectrum as particles with AC origin: temperatures from 3.5 to 30.0 ∘C and salinities from 34.25 to 37.60 (34.25 to 37.65 for AC waters), with corresponding σθ from 22.7 to 27.6 (23.0 to 27.6 for AC waters). The comparison of the initial and final θ–S spectra shows that substantial thermohaline property modification does occur on the transit through the South Atlantic. The bulk of waters entering the South Atlantic through AC and DP that later reaches the NBC becomes more salty during the transit. Waters of DP origin additionally experience a substantial broadening of their temperature spectrum associated with a general warming.
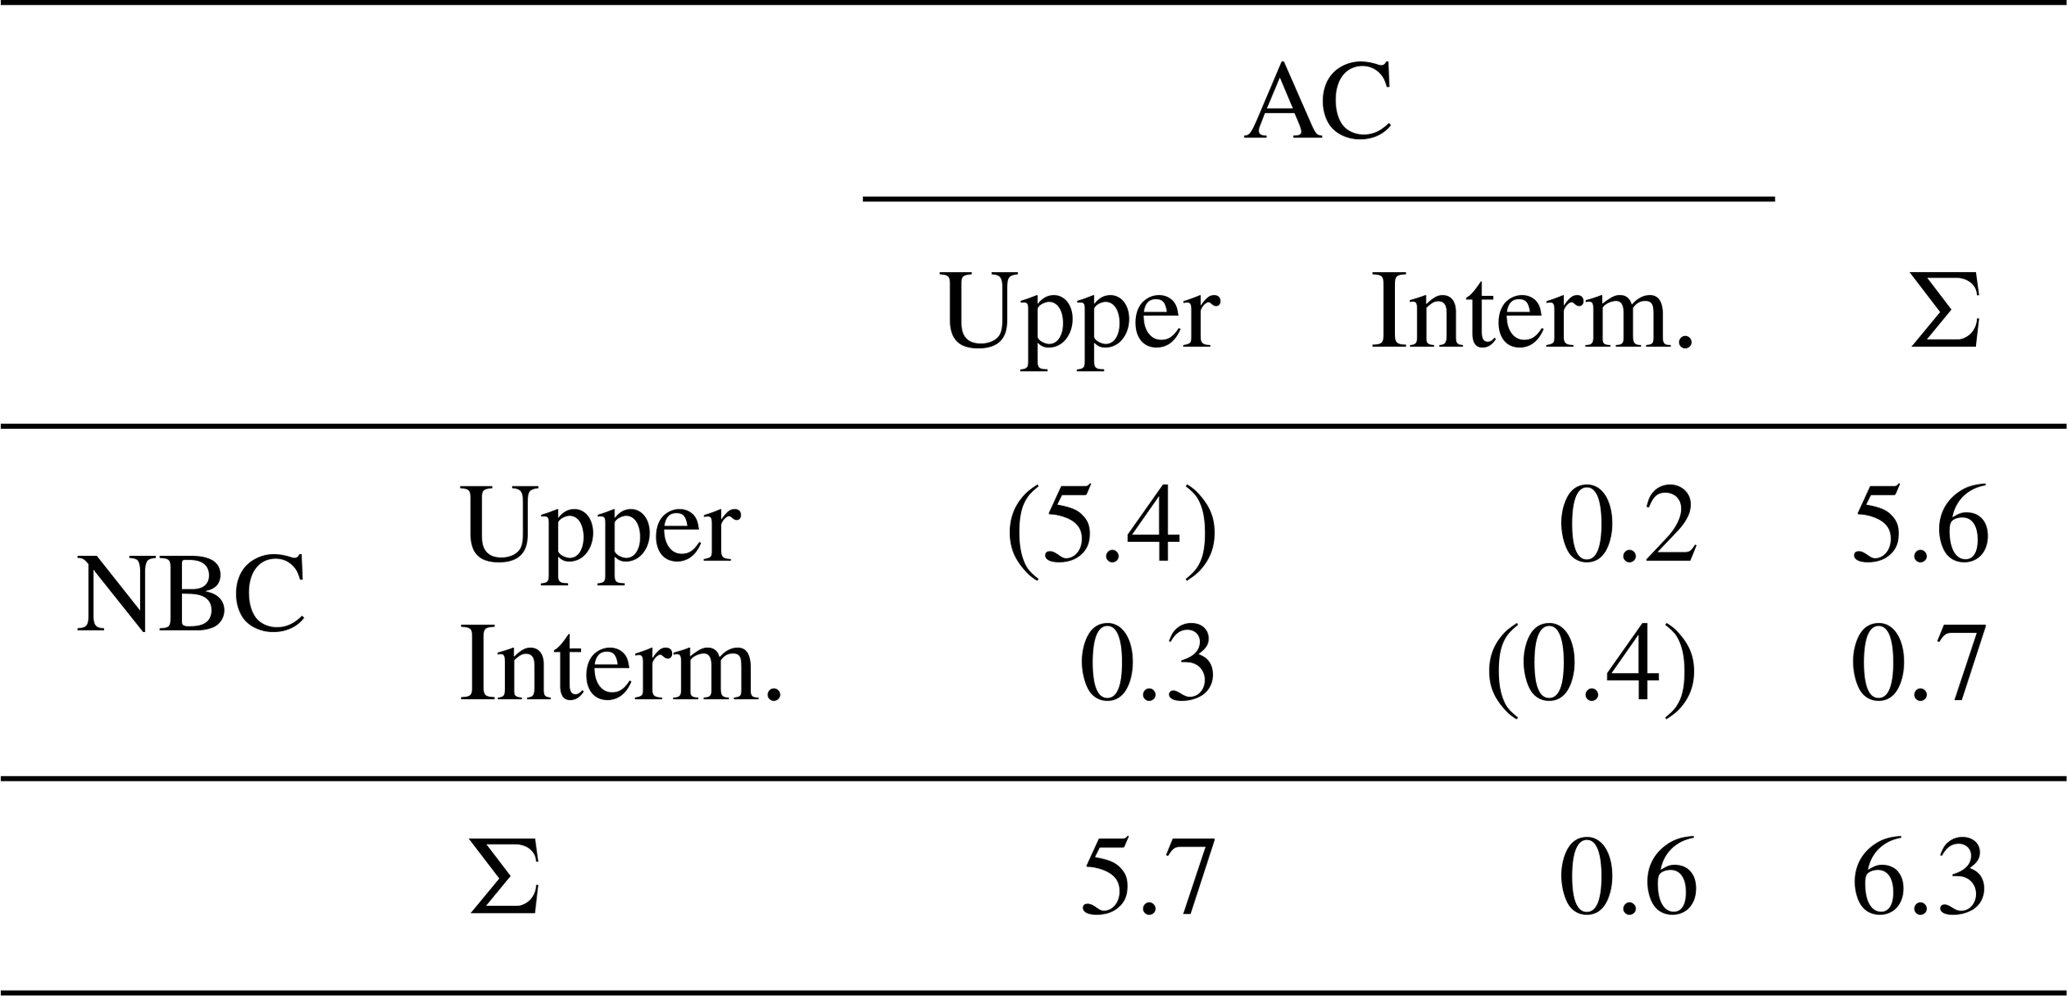
These thermohaline property modifications are also eventually associated with transformations in density space. To quantify those, we binned the partial transports of all particles according to their potential density anomaly at their origin (Fig. 7e) and upon arrival in the NBC (Fig. 7g) for each contribution separately. Then we compared the transport-weighted density distributions at the entry sections and the respective distributions in the NBC. The difference between the initial and final distributions quantifies the net transformation of the bulk of water (Fig. 7f), which may be a result of multiple modification processes. We additionally repeated this analysis for respective subsets of upper (σθ<27.0) and intermediate () waters. The exact numbers for the transformation analysis depend on the applied density criteria. Here we chose to follow Macdonald (1993) and Holfort and Siedler (2001) for the definition of the separation of upper and intermediate waters, since it fits with the simulated mean (2000–2009) thermohaline structure of the water column in the South Atlantic (Fig. 8). Other authors followed Roemmich (1983) and chose σθ=26.8, but in our simulation waters with seem to fall in the upper water range with a still relatively large vertical gradient in temperature and salinity. The general tendencies of our transformation analysis stay robust with respect to small changes in these criteria (not shown) so that the results are worth a discussion. The AC contribution to the upper limb of the AMOC originally consisted of 5.7 Sv upper and 0.6 Sv intermediate waters. These waters showed a net transformation to 5.6 Sv upper and 0.7 Sv intermediate waters upon arrival in the NBC. More specifically, 0.3 Sv of the upper waters became intermediate waters, and 0.2 Sv of the intermediate waters became upper waters (Table 1). Hence, the bulk of AC waters experiences a slight net density gain during the transit towards the NBC. The DP contribution to the upper limb of the AMOC originally consisted of 1.6 Sv upper and 3.1 Sv intermediate waters. These showed a net transformation to 3.2 Sv upper and 1.5 Sv intermediate water upon arrival in the NBC. More specifically, 0.1 Sv of upper waters became intermediate waters, and 1.7 Sv intermediate waters became upper waters (Table 2). To sum it up, in contrast to AC waters, the bulk of DP waters experiences a net density loss during the transit towards the NBC.
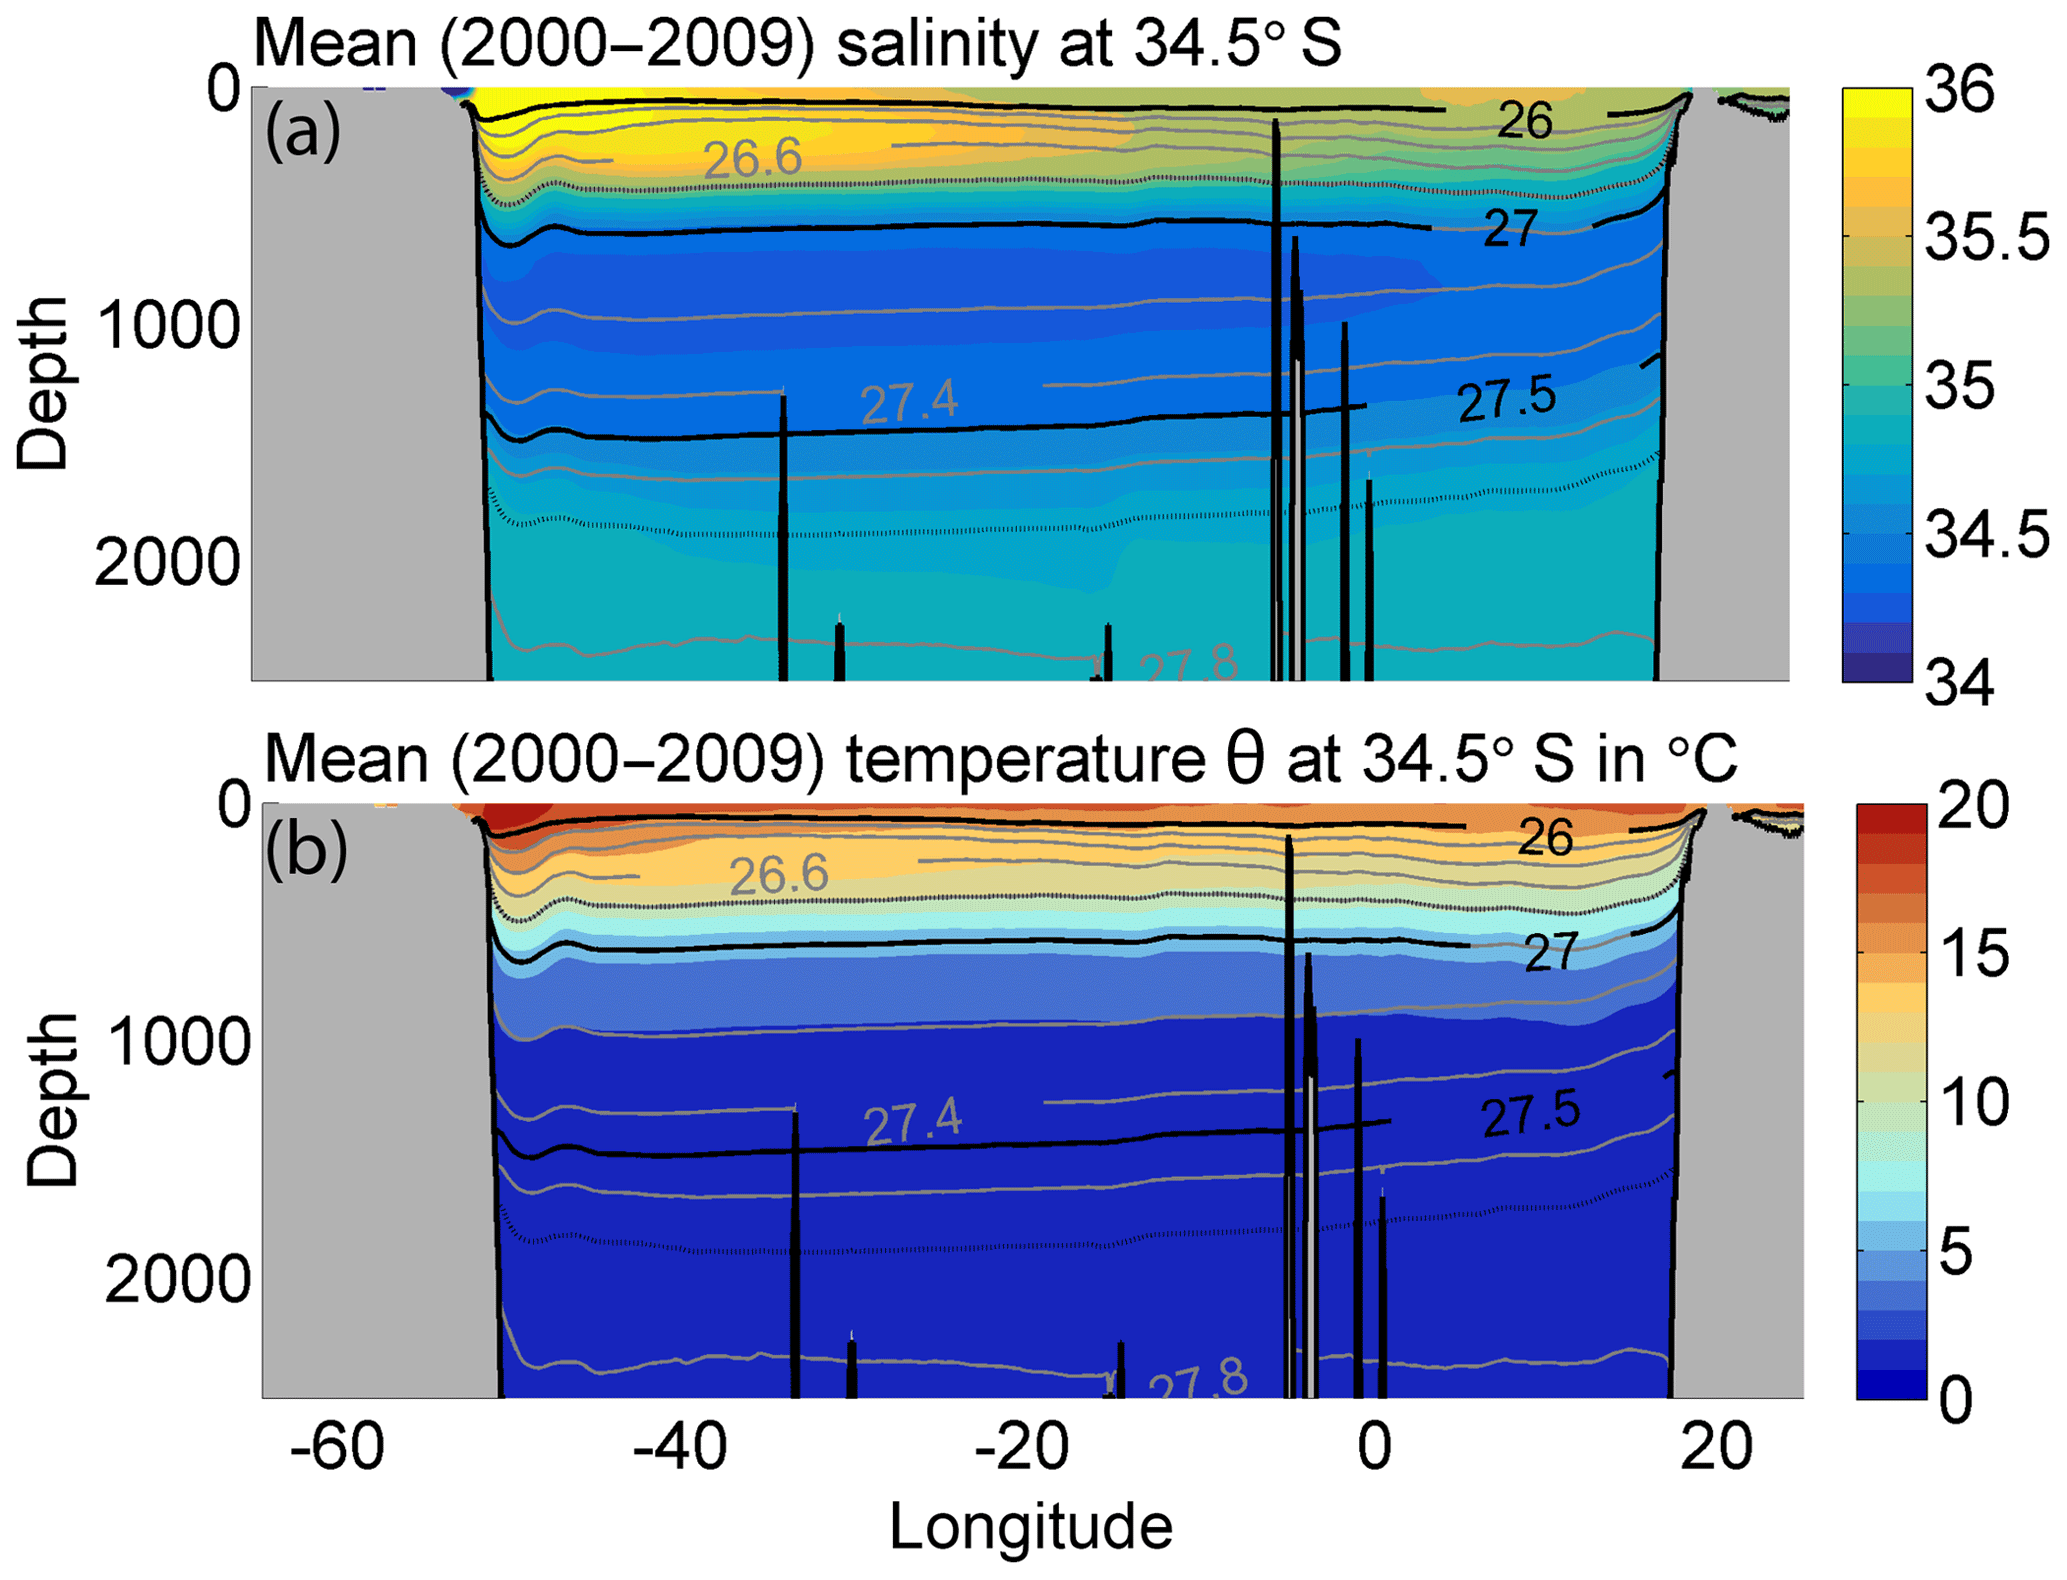
Figure 8Mean (2000–2009) simulated Eulerian (a) salinity and (b) potential temperature θ sections at 34.5∘ S (color shading); potential density anomalies are overlaid in grey contours – those used as a separation of upper, intermediate, and deep waters are in black.
Table 1Net water mass transformation of upper and intermediate waters with AC origin between their entry into the South Atlantic and arrival in the NBC in Sverdrups; water volumes without any net transformation into the other class are listed in brackets.

Changes in temperature and salinity and thus density along volume transport pathways generally correspond to the mean effect of surface fluxes, such as direct warming by solar heat flux or precipitation and evaporation processes, and mixing with ambient waters due to parameterized and spurious tracer diffusion of the OGCM. The fact that both DP and AC waters show a salinification during their transit implies that they not only mix with each other, but that mixing with other ambient waters and/or surface fluxes may also play an important role.
To further investigate the transformation in the bulk AC and DP water volumes and to determine their origin, we assessed which particles reached the mixed layer on their transit between the DP or AC and the NBC, and then analyzed the net transformation of waters with and without mixed layer contact separately. Following the criterion used during the OGCM integration and also adopted in comparable Lagrangian studies (see Blanke et al., 2002; Tim et al., 2018), we assume a particle to have reached the mixed layer if its density (that equals the ambient density) differs by less than 0.01 kgm−3 from the density at 10 m of depth. During the transit through the South Atlantic the surface mixed layer is reached at least once by 66 % (3.1 from 4.7 Sv) and 49 % (3.1 from 6.3 Sv) of DP and AC waters, respectively. That implies that these waters most likely do gain their specific characteristics within the South Atlantic and – if adopting the common definition of a water mass as a body of water with a common formation history – are strictly speaking not water masses with Indian Ocean or Pacific origin as may be suggested by their prior classification as AC or DP waters.

Figure 9Horizontal distribution of the position of the last mixed layer contact for particles on the transit between (a) AC or (b) DP and NBC inferred from all 10 REF experiments. Relative transport-weighted particle frequency per bin in percent (referring to the total number of particles that enter the mixed layer at least once during their transit; color shading); hatching highlights the most likely areas for the last mixed layer contact, encompassing 75 % of the transport associated with the respective set of particles entering the mixed layer.
Figure 9 maps the relative transport-weighted frequency of the position of the last mixed layer contact for particles on the transit between AC (left) or DP (right) and the NBC. Regions of high frequency can be interpreted as the most probable formation regions for water masses of the NBC within the South Atlantic. Those can be found in the vicinity of mode water formation regions, as depicted in Hanawa and Talley (2001, hereafter H01) and Sato and Polito (2014, hereafter S14): in the eastern and southern subtropical gyre where eastern subtropical mode water (ESTMW or SASTMW2 in H01 and S14, respectively) and southern subtropical mode water (SASTMW3 in S14) are formed, respectively, as well as east of Drake Passage where subantarctic mode water (SAMW in H01) originates. Notably, the formation region of classical western subtropical mode water (STMW or SASTMW1 in H01 and S14, respectively) located east of the western boundary current (that is, the Brazil Current) does not stand out in the frequency distribution. This suggests that western subtropical mode water is no major contributor to NBC waters in the analyzed model simulation. A possible explanation for this could be that most western subtropical mode water gets re-entrained into the mixed layer in the eastern subtropical gyre and thus becomes part of the eastern subtropical mode water. In any case, our findings match those of Tim et al. (2018), who analyzed the same model simulation and found only a minor direct South Atlantic Central Water but strong eastern South Atlantic Central Water contribution to the upwelling water masses of Benguela. Relative high frequencies of last mixed layer contacts are further located at the subduction zones along the South Equatorial Current and in particular around 15∘ S, which have been shown to be important source regions for the equatorward subsurface flow related to the shallow overturning of the subtropical cell in the South Atlantic (Zhang, 2003; Schott et al., 2004; Hazeleger and Drijfhout, 2006).
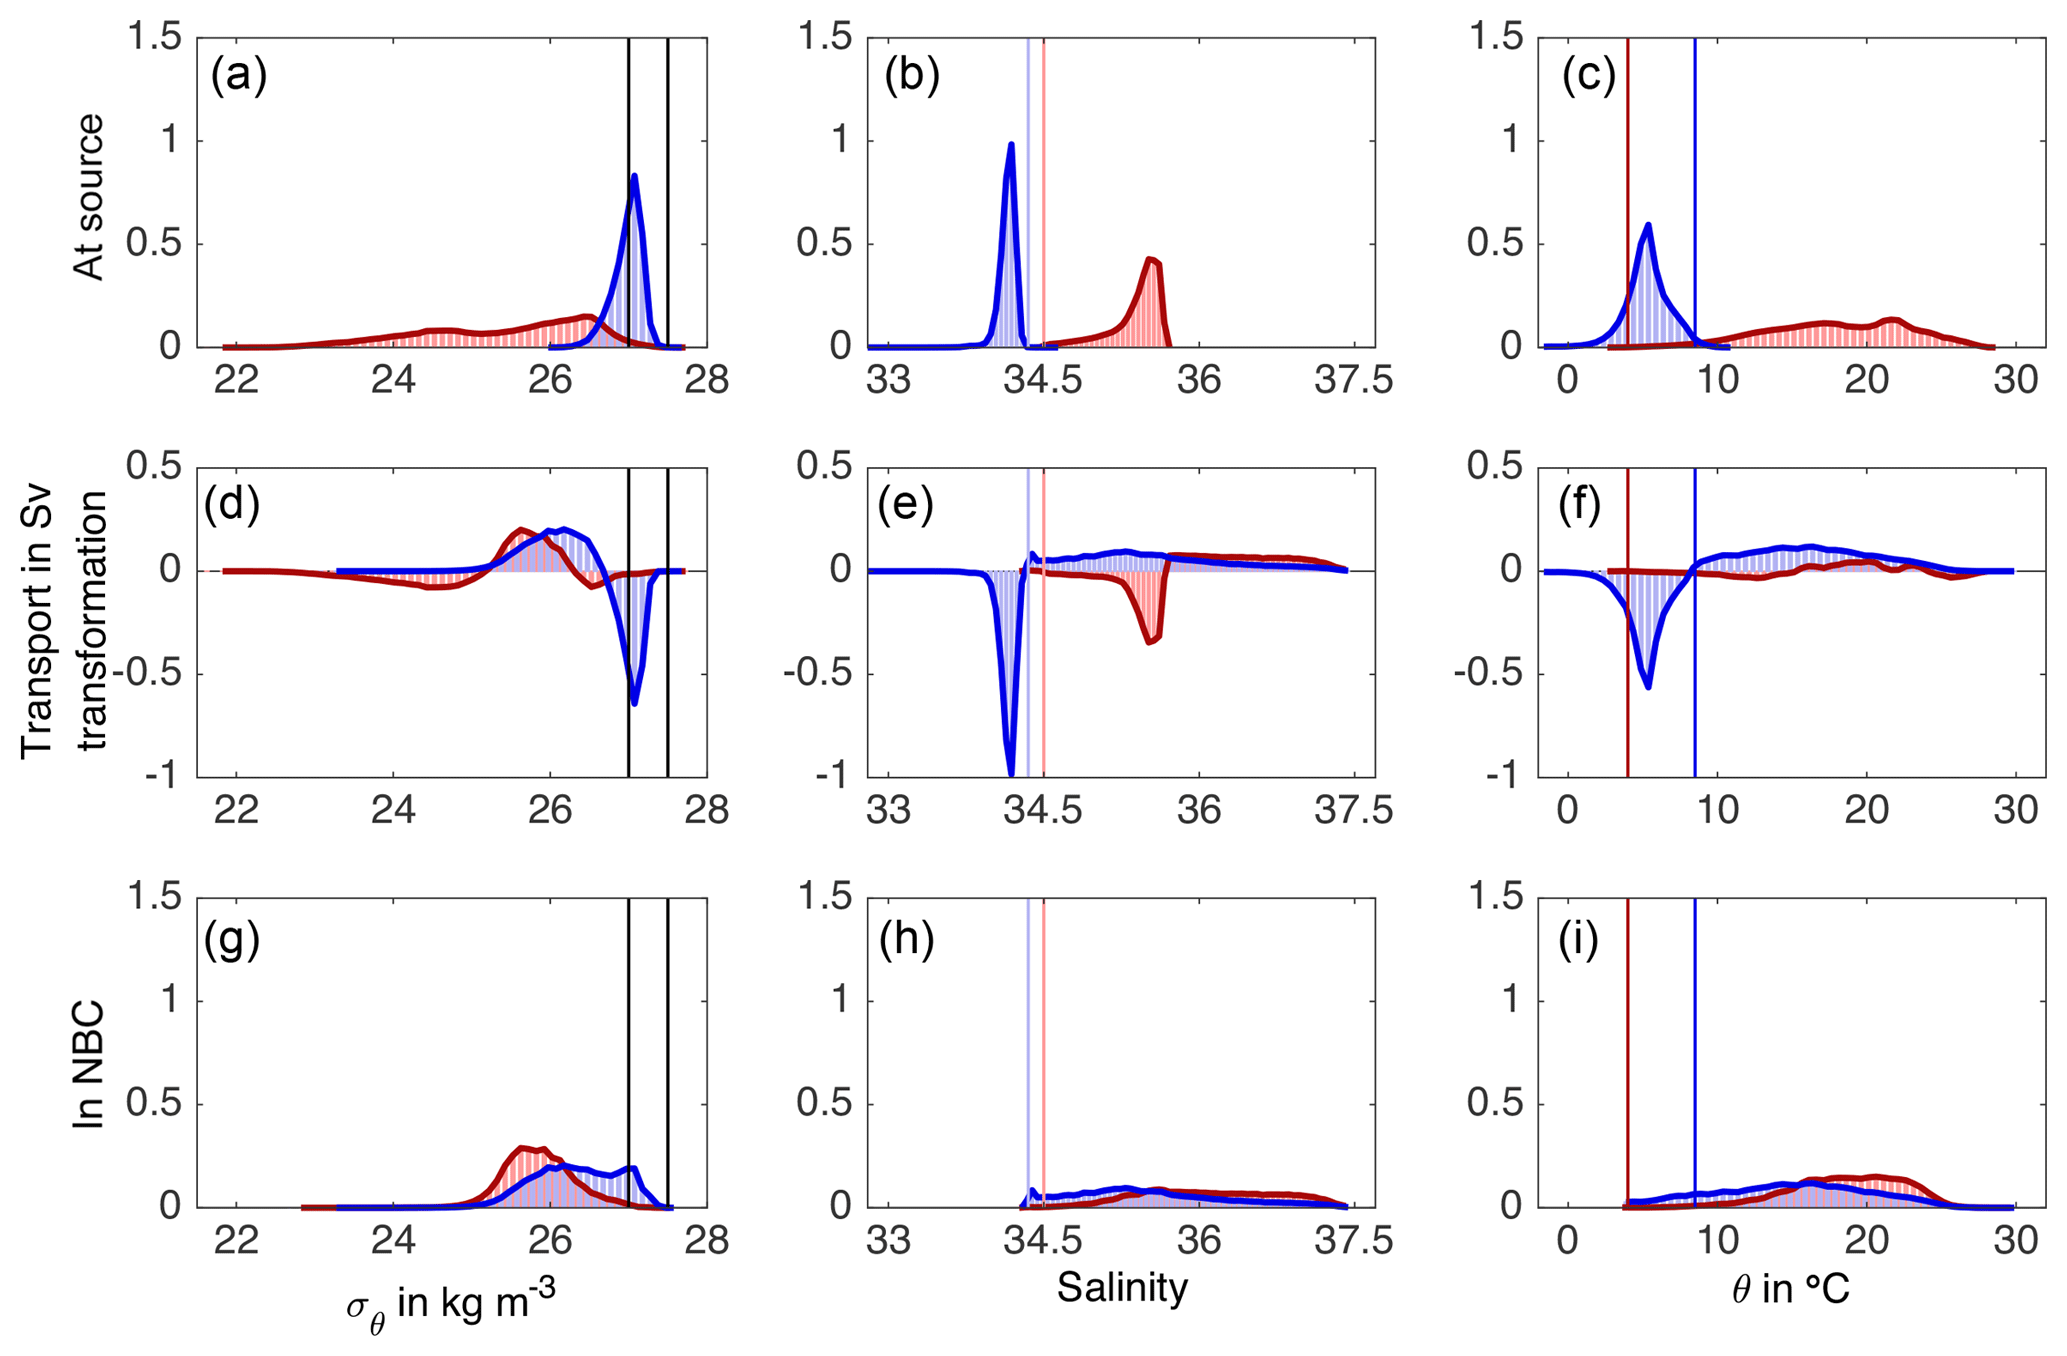
Figure 10Mean property modification of waters with AC and DP origin that enter the mixed layer at least once during their transit. Mean volume transport per density (a, d, g, 0.1 kg m−3 bins), salinity (b, e, h, 0.05 psu bins), and temperature (c, f, i, 0.5 ∘C bins) class at source region (a–c) and in NBC (g–i), as well as volumetric property transformation (d–f) for waters of AC (red bars) and DP (blue bars) origin. From all 10 REF experiments only particle trajectories with at least one mixed layer contact during their transit are considered. Potential density levels used to separate upper, intermediate, and deep waters are highlighted by solid black lines; light blue (red) lines mark S values that constitute the upper (lower) limit for 95 % of the DP (AC) waters; dark blue (red) lines mark θ values that constitute the upper (lower) limit for 99 % of the DP (AC) waters (see Fig. 7).

Figure 11Same as Fig. 10 but for waters with AC and DP origin that do not enter the mixed layer during their transit.
The mixed layer contact of virtual fluid particles on their transit between the AC or DP and the NBC greatly impacts their characteristic properties. Most notably, the net transformation in density space of DP and AC waters (Fig. 7f) is almost completely captured by particles with mixed layer contact (Fig. 10d), whereas water property modifications associated with particles without mixed layer contact are characterized by only minor changes in density space (Fig. 11d).
Nearly all DP waters entering the South Atlantic in the upper water range (1.5 Sv) and more than half of those entering the South Atlantic in the intermediate water range (1.6 from 3.1 Sv) reach the mixed layer at least once during their transit. The bulk of these DP waters with mixed layer contact experiences a substantial salinification (when entering the Atlantic 95 % of the waters have salinities <34.45, whereas upon arrival in the NBC 95 % of the waters have salinities >34.45) but even stronger warming during the transit. This results in a net decrease in density and a corresponding shift towards upper waters. From the AC contribution, 54 % (3.1 from 5.7 Sv) of waters entering the South Atlantic as upper waters reach the mixed layer during their transit (waters entering the intermediate water range do not reach the mixed layer). They enter the South Atlantic at a large range of relatively high temperatures, which hardly changes during the transit. However, like DP waters, AC waters with mixed layer contact experience a net salinification, resulting in a net increase in density. Since the coherent increase in salinity of AC and DP waters cannot be found for waters without mixed layer contact, we attribute the salinification to the impact of average net evaporative surface fluxes over the subduction zones along the South Equatorial Current, as well as to mixing with ambient subtropical upper-layer waters with high salinities.
Nearly half (1.5 from 3.1 Sv) of the DP waters that are entering the South Atlantic as intermediate waters, as well as all intermediate and 46 % (2.6 from 5.7 Sv) of the upper AC waters, do not experience any mixed layer contact during their transit towards the NBC. Interestingly, AC and DP waters without mixed layer contact show opposite transformations in temperature and salinity: DP waters are warming and becoming more saline, whereas AC waters are cooling and freshening. As a result the salinity and temperature distributions of both components show new common peaks in the temperature and salinity distributions at 3.5–4.0 ∘C and 34.35–34.40, respectively. This result fits with the idea that intermediate and central waters of western and eastern Atlantic origin mix in the eastern South Atlantic and form new varieties of central and intermediate water (water masses in the same density range but with different temperature and salinity characteristics), as specifically shown by Rusciano et al. (2012) from observations and Rimaud et al. (2012) from a regional modeling experiment for different varieties of Antarctic Intermediate Water.
3.5 Potential decadal changes in AMOC's upper limb connectivity measures
Figure 12 gives a first impression of the possible sensitivity of the volumetric NBC decomposition to the strength of Agulhas leakage. The underlying data stem from the two additional sets of Lagrangian experiments for which particles were released in the NBC at 6∘ S for years 1960 to 1969 (lowAL) and 2000 to 2009 (highAL) and then traced backwards towards the source sections (see Fig. 3) by cycling through the velocity data of each period for a maximum of 40 years (more details on the experiments can be found in Sect. 2.2).
We chose the 1960s and 2000s for our comparison, since both periods feature the same simulated Lagrangian mean NBC transport (23.1 Sv) and comparable upper limb transport (11.0 Sv in the 1960s and 12.0 Sv in the 2000s) estimates, but are associated with notably different estimated mean values of Agulhas leakage that show an increase from 8.4 Sv in the 1960s to around 14.6 Sv in the 2000s (note that the mean Agulhas leakage transport for the 2000s has been calculated based only on the annual mean values from 2000 to 2005, since the applied methodology of Agulhas leakage estimation required a potential particle tracking towards the Good Hope section for at least 4 years, and the employed model simulation only provided velocity output until 2009; see also Appendix A). The fundamental question is whether this increase in Agulhas leakage induced a corresponding increase in the AC contribution to the upper limb of the AMOC in the tropics (and further north).
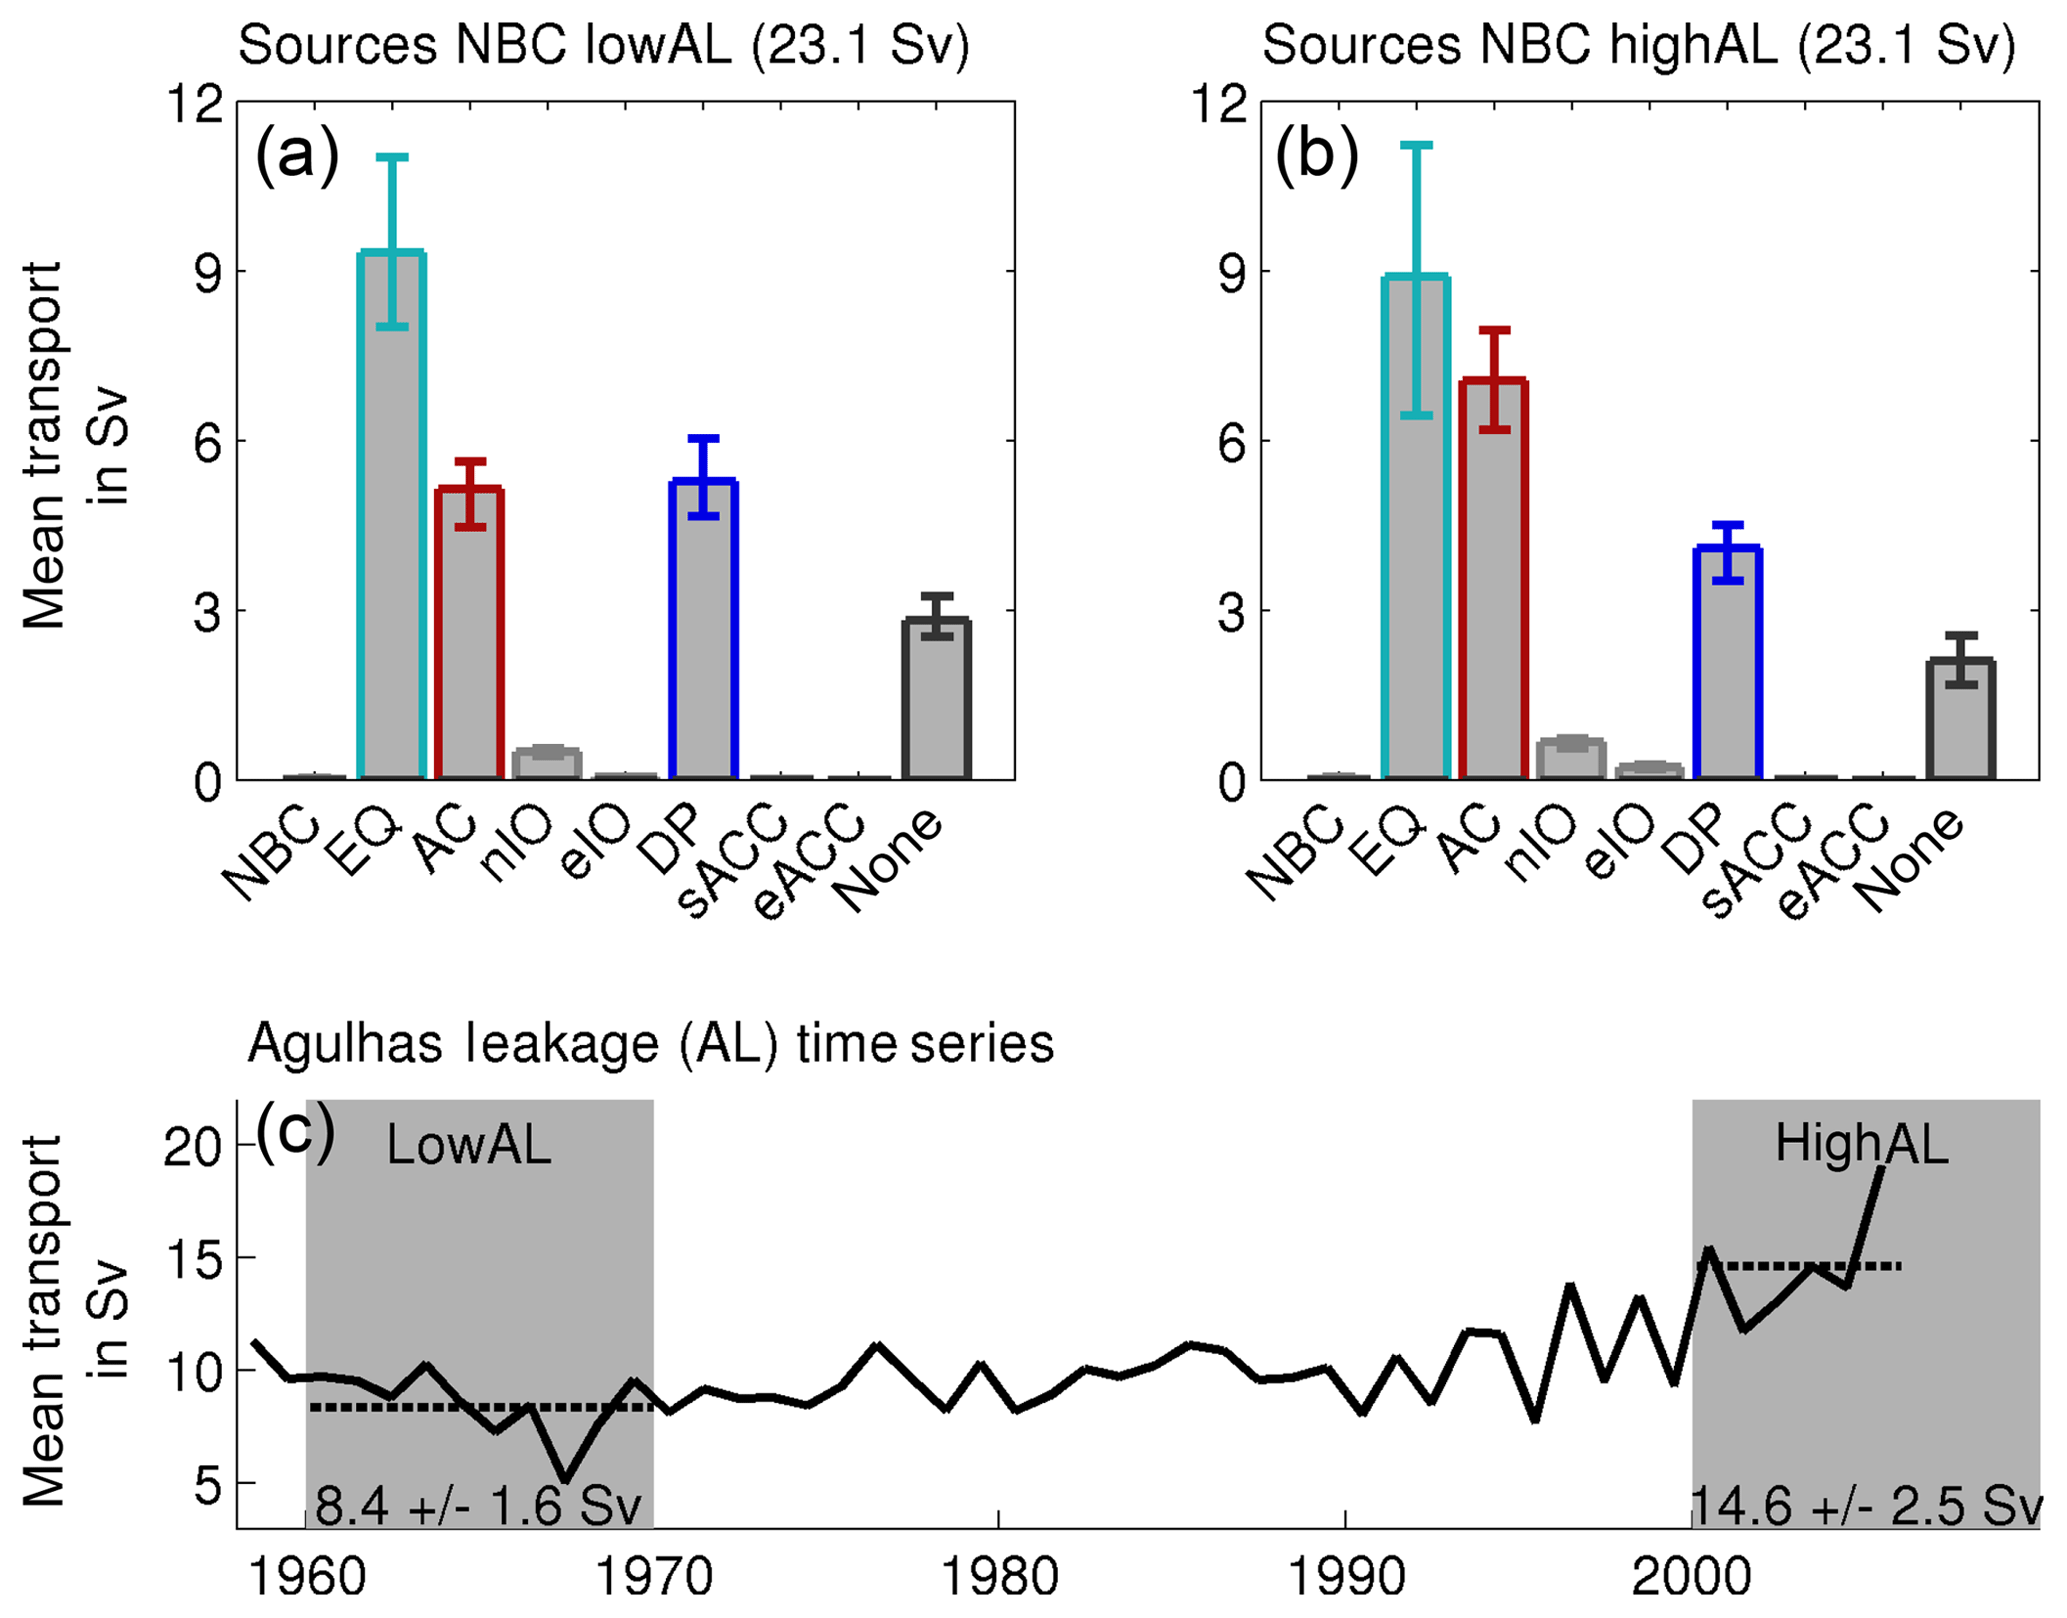
Figure 12Sensitivity of NBC sources to the strength of Agulhas leakage (AL): mean volumetric contributions of the individual sources to the NBC inferred from (a) lowAL and (b) highAL (see Fig. 3); (c) interannual variability of AL transport as derived by Schwarzkopf et al. (2019, see Appendix A).
In highAL the AC contribution amounts to 7.0 Sv, which constitutes 30 % of the total NBC transport and 58 % of the AMOC upper limb transport at 6∘ S, whereas the DP only contributes 4.1 Sv, which constitutes 18 % and 34 % of the NBC and upper limb transports, respectively. In contrast, in lowAL the DP contribution slightly exceeds the AC contribution. The AC contribution only amounts to 5.1 Sv, which is 22 % of the total NBC transport and 46 % of the AMOC upper limb transport at 6∘ S, whereas the DP contribution provides 5.3 Sv, which constitutes 23 % and 48 % of the NBC and upper limb transports, respectively. In highAL and lowAL on average 2.1 and 2.8 Sv remained in the domain after 40 years of integration, respectively, a large part of which would probably additionally add to the DP contribution under longer integration times (see Sect. 3.1). The higher number of unsampled particles in lowAL can be related to the generally longer transit time from DP to NBC than from AC to NBC. A circulation pattern with a more pronounced DP contribution is associated with a shift of the total transit time distribution, that is, a transit time distribution inferred from particles from all sources, towards longer timescales (not shown); it consequently yields more particles still in the domain after 40 years of integration. These estimates suggest that the increase in Agulhas leakage between the 1960s and 2000s is indeed reflected in an increase in the AC contribution to the AMOC's upper limb transport and is further accompanied by a decrease in the DP contribution.
The increase in the AC contribution to the AMOC's upper limb in the tropics is, however, not directly proportional to the increase in Agulhas leakage but weaker (1.9 Sv compared to 6.2 Sv, respectively). This fits with the findings of Durgadoo (2013), who assessed the impact of Southern Hemisphere wind changes on the strength and fate of Agulhas leakage. He showed that the simulated wind-driven increase in Agulhas leakage goes along with a strengthening of the South Atlantic subtropical gyre. This strengthening leads to a favored recirculatory route at the bifurcation point of the South Equatorial Current at the coast off Brazil. Consequently, less Agulhas leakage water feeds into the NBC as part of the large-scale overturning. The strengthened recirculatory route could also be regarded as one potential reason for the simulated decrease in the DP contribution. However, due to the conceptual limitations of the idealized analysis presented here, the results are not yet conclusive and should be rather regarded as a motivation for future studies.
In this study we revisited the relative importance of (i) the relatively warm and salty waters entering the South Atlantic from the Indian Ocean mainly via the Agulhas Current (AC) system, commonly referred to as the warm water route, and (ii) the colder and fresher waters entering directly from the Pacific through Drake Passage (DP), termed the (direct) cold water route, for the northward volume transport and thermohaline properties of the upper limb of the Atlantic Meridional Overturning Circulation (AMOC) in the tropical South Atlantic.
To do so, we performed Lagrangian analyses using 5 d mean output from a hindcast experiment (1958–2009) with the high-resolution (1∕20∘) ocean general circulation model INALT20. We employed the Lagrangian tool ARIANE to calculate O(106) advective volume transport trajectories as well as along-track thermohaline property changes between the two source regions and the North Brazil Current (NBC), which channels the upper limb flow in the tropics. The main results in terms of connecting pathways, associated volume transports, and major areas of thermohaline property modifications through mixed layer contact are summarized in Fig. 13.
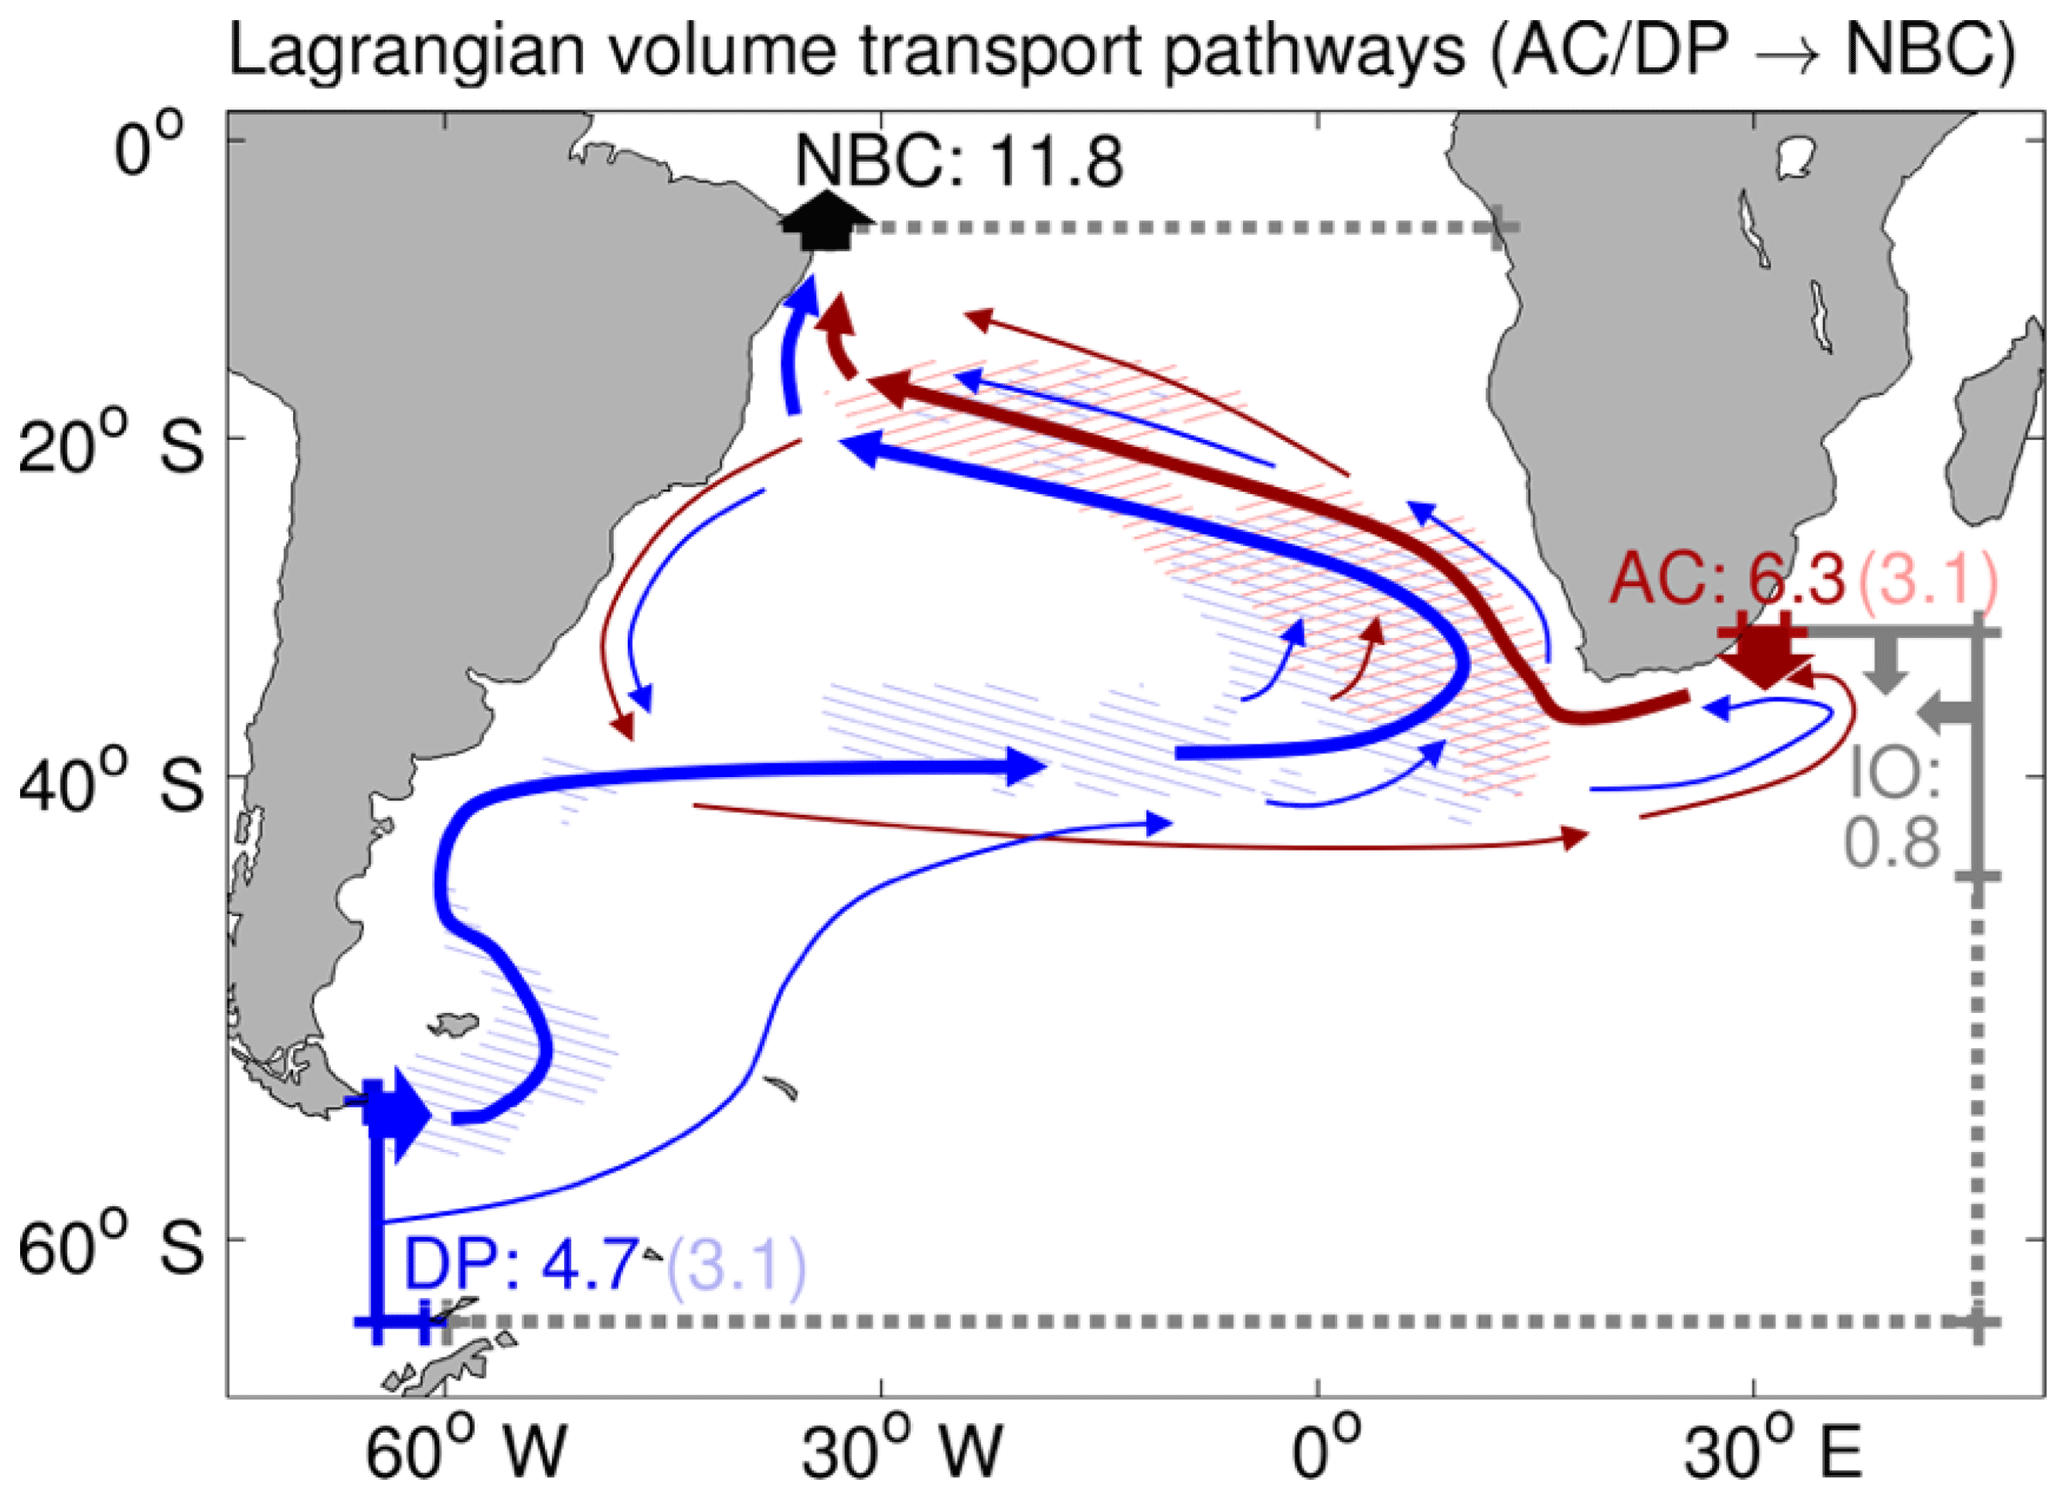
Figure 13Summary of the AMOC's upper limb “cold”(DP, blue) and “warm” (mainly AC, red) water routes inferred from O(106) simulated Lagrangian particle trajectories (REF experiments): major (thick arrows) and minor (thin arrows) advective pathways; Lagrangian mean cross section transports in Sverdrups (numbers); respective volumetric contribution of particles entering the mixed layer at least once during the transit (numbers in brackets); and most likely areas of last mixed layer contact (hatching, same as in Fig. 9).
Even though our results generally agree with the prevailing conception that the AC contribution with around 50 % is the major source for the upper limb transport of the AMOC (and yields together with other minor Indian Ocean contributions a total warm water route contribution of 60 %), they also suggest a non-negligible DP or cold water route contribution of around 40 %. That is a substantially higher value for the DP contribution than previously inferred by Lagrangian studies with coarser-resolution models (6 %–13 %; Speich et al., 2001; Donners and Drijfhout, 2004; Speich et al., 2007), but now better matches estimates from observations (36 %; Rodrigues et al., 2010). Yet, our first idealized analysis of potential decadal changes in the DP and AC contributions indicates that the ratio of the two sources is subject to temporal variability. On the one hand, there may have been phases in which DP and AC yielded comparable volumetric contributions to the upper limb of the AMOC; on the other hand, the ongoing increase in Agulhas leakage indeed could have induced an increase in the AC contribution – though this increase is weaker than the increase in leakage itself and goes along with a decrease in the DP contribution.
In terms of thermohaline properties, our study highlights the fact that waters with DP and AC origin cannot be clearly distinguished by the temperature at their source, as the commonly adopted terminology may imply, but instead by their salinity. It further reveals substantial thermohaline property modifications of AC and DP waters during their transit through the South Atlantic; upon arrival in the NBC waters of both origins can be found in the same temperature and salinity range. The bulk of DP waters experiences a net density loss through a net warming, and the bulk of AC waters a slight net density gain through a net increase in salinity. These modifications in density space are nearly completely captured by Lagrangian particle trajectories that reach the surface mixed layer at least once during their transit, which amount to 66 % and 49 % from DP and AC waters, respectively. This implies that 53 % of the water masses supplying the upper limb of the AMOC are formed within the South Atlantic, and only 14 % and 33 % get their characteristic properties in the Pacific and Indian Ocean, respectively. This stresses the point that the South Atlantic is not only a passive conduit for remotely formed water masses, but instead represents an active source and modifier of water masses contributing to the upper limb of the AMOC in the tropics (see Garzoli and Matano, 2011).
Considering the relatively high contribution of fresh DP waters to the upper limb transport of the AMOC revealed by our study, the question arises of how this fits into the context of the salt–advection feedback. In the employed hindcast simulation, the average (1958–2009) AMOC-related freshwater transport (hereafter Fov; calculated following Drijfhout et al., 2011) across the southern boundary of the Atlantic at 30∘ S amounts to −124.52 mSv, which is in line with estimates for other hindcast simulations with OGCM configurations at comparable resolution (see Deshayes et al., 2013). The negative sign implies a net AMOC-related southward transport of fresh water out of the Atlantic or, equivalently, a northward advection of salt into the Atlantic. This suggests that the freshwater input through the DP contribution is still dominated by the salt input through the AC contribution. Following the theories of the salt–advection feedback, the negative Fov has a strengthening effect on the current AMOC, but also enables a positive destabilizing feedback theoretically allowing for the “off” state. Hence, the relatively large DP contribution in our model simulation does not disagree with the theory of a potentially bistable state of the AMOC related to a negative Fov. Note, though, that the reliability of Fov as an AMOC stability criterion is currently debated (see Gent, 2018; Cheng, 2018). The results of our Lagrangian analysis also call a fundamental assumption of the salt–advection feedback into question, namely that anomalies in the freshwater transport at the southern boundary of the Atlantic are coherently advected into the North Atlantic. The substantial along-track property modifications revealed in this study challenge the use of advective volume transport pathways and timescales for assessing the pathways and timescales with which upper ocean temperature or salinity anomalies are transmitted through the Atlantic. They imply that, dependent on the amplitude and duration of the original anomaly, diffusive mixing with ambient waters and surface fluxes will strongly dampen the anomaly along the major advective pathways. Overall, this is in line with the argumentation of Lozier (2010), who stated that the view of the global meridional overturning circulation as a coherent conveyor belt transporting heat and dissolved substances through the world ocean is on its way to deconstruction. It is noteworthy, though, that the deeper parts of the upper limb, such as the intermediate waters transiting the South Atlantic without mixed layer contact, largely keep their characteristic properties along their transit, indicating some remaining spatial coherence of the AMOC. Hence, at least for these intermediate waters, simulated advective pathways and timescales remain relevant for the propagation of potential temperature and salinity anomalies. However, more work is needed to better understand how potential temporal changes in the Pacific–Atlantic and Indo-Atlantic exchange are related and eventually projected onto the return flow characteristics and, in particular, what impact water mass formation and horizontal circulation pattern within the South Atlantic have on these processes. This knowledge is crucial for a better assessment of the potential impact of the observed warming in the extended Agulhas region and the estimated increase in Agulhas leakage over the last decades not only on the strength but also on the stability of the AMOC.
Finally, even though in this study we focused on the importance of the ratio of the DP and AC contributions for the upper limb of the AMOC, the ratio of the two inflows generally impacts the thermohaline structure of the whole South Atlantic, also with consequences on a more regional scale, for instance for the Benguela upwelling region (Tim et al., 2018) or the tropical Atlantic (Lübbecke et al., 2015; Castellanos et al., 2017).
The observational-based Eulerian data sets used as OGCM input and to validate the hindcast simulation are all freely available online. The gridded ETOPO1 topography depicting the Earth's surface using the top of the Antarctic and Greenland ice sheets is provided by NOAA's National Centers for Environmental Information (NCEI; Amante and Eakins, 2009; available at: https://www.ngdc.noaa.gov/mgg/global/global.html, last access: 16 March 2016). The Polar science center Hydrographic Climatology version 2.1 is provided by the University of Washington (updated from Steele et al., 2001; available at: http://psc.apl.washington.edu/nonwp_projects/PHC/Climatology2.1.html, last access: 15 August 2006). The atmospheric forcing fields from the Coordinated Ocean-Ice Reference Experiments data set version 2 are provided by the geophysical fluid dynamics laboratory (updated from Large and Yeager, 2009; available at: https://data1.gfdl.noaa.gov/nomads/forms/core/COREv2/CIAF_v2.html, last access: 29 November 2012). The sea surface height variance from the global ocean gridded absolute dynamic topography (ADT-H) inferred from multi-satellite observations (allsat series, delayed time mode, processing level 4) was originally processed by SALTO/DUACS and provided by Archiving, Validation, and Interpretation of Satellite Oceanographic data (AVISO; https://www.aviso.altimetry.fr, last access: 28 February 2014), but it is now distributed by the Copernicus Marine and Environment Monitoring Service (CMEMS; http://marine.copernicus.eu/, last access: 20 April 2019). The Lagrangian software employed, ARIANE version 2.2.6, is available at http://www.univ-brest.fr/lpo/ariane (last access: 1 July 2010). For reproducibility of all major results of the Lagrangian analyses performed for this study, the customized code of the ARIANE software, the simulated Lagrangian trajectories (Rühs, 2019), and post-processing scripts are made available through GEOMAR (https://data.geomar.de/thredds/catalog/open_access/ruehs_et_al_2019_os/catalog.html).
The time series of Agulhas leakage has been inferred by Schwarzkopf et al. (2019) from a complementary set of offline Lagrangian experiments with ARIANE in forward mode, following Durgadoo et al. (2013): Virtual fluid particles were released in the Agulhas Current at 32∘ S every 5 d for the years 1958–2005 proportional to the current volume transport, each particle associated with a fraction of this transport. Subsequently, the particles were traced for at maximum 5 years towards predefined control sections around the extended Agulhas region. All particles leaving the domain through the so-called Good Hope section (Ansorge et al., 2005) towards the South Atlantic were marked as Agulhas leakage and their individual transports were subsequently combined to estimate a time series of Agulhas leakage referenced to the release year of the particles.
SR and AB defined the overall research problem and methodology; SS helped to refine research questions and methodology; FUS developed, ran, and validated the OGCM; SR performed and analyzed the main Lagrangian simulations; FUS performed and analyzed the additional Lagrangian experiment to determine Agulhas leakage; SR produced all figures; and SR prepared the paper with contributions from all coauthors.
The authors declare that they have no conflict of interest.
The OGCM and trajectory simulations were performed at the High Performance Computing Center in Hanover (HLRN). The project received funding from the following: Cluster of Excellence 80 “The Future Ocean” within the framework of the Excellence Initiative by the Deutsche Forschungsgemeinschaft (DFG) on behalf of the German federal and state governments (grant CP1412, SR); the German Federal Ministry of Education and Research (BMBF) for the SPACES-AGULHAS project (grant 03F0750A, AB and FUS); the European Union Horizon 2020 research and innovation program as part of the AtlantOS project (grant 633211, SS); and the SAMOC project (grant 11-ANR-56-004, SS). The authors further wish to thank Susan Lozier and Erik van Sebille for inspiring discussions that added value to this paper, Bruno Blanke and Nicolas Grima for realizing and helping to tackle the Lagrangian ARIANE software, Willi Rath for technical support, Jonathan Durgadoo for discussing Lagrangian analyses techniques, and two anonymous reviewers for their constructive criticism, in particular regarding the framing and discussion of our work.
This paper was edited by A. J. George Nurser and reviewed by two anonymous referees.
Ansorge, I. J., Speich, S., Lutjeharms, J. R., Göni, G. J., Rautenbach, C. J., Froneman, P. W., Rouault, M., and Garzoli, S.: Monitoring the oceanic flow between Africa and Antarctica: Report of the first GoodHope cruise, S. Afr. J. Sci., 101, 29–35, 2005. a
Amante, C. and Eakins, B. W.: ETOPO1 1 Arc-Minute Global Relief Model: Procedures, Data Sources and Analysis, NOAA Technical Memorandum NESDIS NGDC-24, National Geophysical Data Center, NOAA, https://doi.org/10.7289/V5C8276M, 2009. a
Arakawa, A. and Hsu, Y.-J. G.: Energy Conserving and Potential-Enstrophy Dissipating Schemes for the Shallow Water Equations, Mon. Weather Rev., 118, 1960–1969, 1990. a
Backeberg, B. C., Penven, P., and Rouault, M.: Impact of intensified Indian Ocean winds on mesoscale variability in the Agulhas system, Nat. Clim. Change, 2, 608–612, https://doi.org/10.1038/nclimate1587, 2012. a
Barnier, B., Madec, G., and Penduff, T.: Impact of partial steps and momentum advection schemes in a global ocean circulation model at eddy-permitting resolution, Ocean Dynam., 56, 543–567, https://doi.org/10.1007/s10236-006-0082-1, 2006. a
Barnier, B., Blaker, A., Biastoch, A., Böning, C., Coward, A., Deshayes, J., Hirshi, J., Le Sommer, J., Madec, G., Maze, G., Molines, J., New, A., Penduff, T., Scheinert, M., Talandier, C., and Treguier, A.-M.: DRAKKAR: developing high resolution ocean components for European Earth system models, CLIVAR Exchange no. 65, 19, 18–21, 2014. a
Beal, L. M., Chereskin, T. K., Lenn, Y. D., and Elipot, S.: The Sources and Mixing Characteristics of the Agulhas Current, J. Phys. Oceanogr., 36, 2060–2074, https://doi.org/10.1175/JPO2964.1, 2006. a
Beal, L. M., de Ruijter, W. P. M., Biastoch, A., Zahn, R., and SCOR/WCRP/IAPSO working group 136: On the role of the Agulhas system in ocean circulation and climate, Nature, 472, 429–436, https://doi.org/10.1038/nature09983, 2011. a, b
Beal, L. M., Elipot, S., Houk, A., and Leber, G. M.: Capturing the Transport Variability of a Western Boundary Jet: Results from the Agulhas Current Time-Series Experiment (ACT), J. Phys. Oceanogr., 45, 1302–1324, https://doi.org/10.1175/JPO-D-14-0119.1, 2015. a
Bell, M. J., Peixoto, P. S., and Thuburn, J.: Numerical instabilities of vector-invariant momentum equations on rectangular C-grids, Q. J. Roy. Meteor. Soc., 143, 563–581, https://doi.org/10.1002/qj.2950, 2017. a
Berglund, S., Döös, K., and Nycander, J.: Lagrangian tracing of the water-mass transformations in the Atlantic Ocean, Tellus A, 69, 1–15, https://doi.org/10.1080/16000870.2017.1306311, 2017. a
Biastoch, A. and Böning, C. W.: Anthropogenic impact on Agulhas leakage, Geophys. Res. Lett., 40, 1138–1143, https://doi.org/10.1002/grl.50243, 2013. a, b
Biastoch, A., Böning, C. W., Getzlaff, J., Molines, J.-M., and Madec, G.: Causes of Interannual-Decadal Variability in the Meridional Overturning Circulation of the Midlatitude North Atlantic Ocean, J. Climate, 21, 6599–6615, https://doi.org/10.1175/2008JCLI2404.1, 2008a. a
Biastoch, A., Böning, C. W., and Lutjeharms, J. R. E.: Agulhas leakage dynamics affects decadal variability in Atlantic overturning circulation, Nature, 456, 489–492, https://doi.org/10.1038/nature07426, 2008b. a
Biastoch, A., Lutjeharms, J. R. E., Böning, C. W., and Scheinert, M.: Mesoscale perturbations control inter-ocean exchange south of Africa, Geophys. Res. Lett., 35, L20602, https://doi.org/10.1029/2008GL035132, 2008c. a, b
Biastoch, A., Böning, C. W., Schwarzkopf, F. U., and Lutjeharms, J. R. E.: Increase in Agulhas leakage due to poleward shift of the Southern Hemisphere westerlies, Nature, 462, 495–498, https://doi.org/10.1038/nature08519, 2009. a, b
Biastoch, A., Durgadoo, J. V., Morrison, A. K., Van Sebille, E., Weijer, W., and Griffies, S. M.: Atlantic multi-decadal oscillation covaries with Agulhas leakage, Nat. Commun., 6, 10082, https://doi.org/10.1038/ncomms10082, 2015. a
Blanke, B. and Raynaud, S.: Kinematics of the Pacific Equatorial Undercurrent: An Eulerian and Lagrangian approach from GCM results, J. Phys. Oceanogr., 27, 1038–1053, https://doi.org/10.1175/1520-0485(1997)027<1038:KOTPEU>2.0.CO;2, 1997. a
Blanke, B., Arhan, M., Madec, G., and Roche, S.: Warm Water Paths in the Equatorial Atlantic as Diagnosed with a General Circulation Model, J. Phys. Oceanogr., 29, 2753–2768, 1999. a, b, c
Blanke, B., Speich, S., Madec, G., and Maugé, R.: A global diagnostic of interior ocean ventilation, Geophys. Res. Lett., 29, 1267, https://doi.org/10.1029/2001GL013727, 2002. a
Broecker, W. S.: The Great Ocean Conveyor, Oceanography, 4, 79–89, https://doi.org/10.5670/oceanog.1991.07, 1991. a
Bryden, H. L., Beal, L. M., and Duncan, L. M.: Structure and Transport of the Agulhas Current and Its Temporal Variability, J. Oceanogr., 61, 479–492, https://doi.org/10.1007/s10872-005-0057-8, 2005. a
Buckley, M. W. and Marshall, J.: Observations, inferences, and mechanisms of the Atlantic Meridional Overturning Circulation: A review, Rev. Geophys., 54, 5–63, https://doi.org/10.1002/2015RG000493., 2016. a
Castellanos, P., Campos, E. J. D., Piera, J., Sato, O. T., and Silva Dias, M. A. F.: Impacts of Agulhas leakage on the tropical Atlantic western boundary systems, J. Climate, 30, 6645–6659, https://doi.org/10.1175/JCLI-D-15-0878.1, 2017. a
Cessi, P. and Jones, C. S.: Warm-Route versus Cold-Route Interbasin Exchange in the Meridional Overturning Circulation, J. Phys. Oceanogr., 47, 1981–1997, https://doi.org/10.1175/JPO-D-16-0249.1, 2017. a, b, c, d
Cheng, Y.: Agulhas Leakage Variability and Its Climate Implications in a Coupled System, PhD thesis, University of Miami, Miami, 2018. a, b
Cimatoribus, A. A., Drijfhout, S. S., den Toom, M., and Dijkstra, H. A.: Sensitivity of the Atlantic meridional overturning circulation to South Atlantic freshwater anomalies, Clim. Dynam., 39, 2291–2306, https://doi.org/10.1007/s00382-012-1292-5, 2012. a
Cunningham, S. A., Alderson, S. G., King, B. A., and Brandon, M. A.: Transport and variability of the Antarctic Circumpolar Current in Drake Passage, J. Geophys. Res.-Oceans, 108, 8084, https://doi.org/10.1029/2001JC001147, 2003. a, b
de Ruijter, W. P. M., Biastoch, A., Drijfhout, S. S., Lutjeharms, J. R. E., Matano, R. P., Pichevin, T., van Leeuwen, P. J., and Weijer, W.: Indian-Atlantic interocean exchange: Dynamics, estimation and impact, J. Geophys. Res.-Oceans, 104, 20885–20910, https://doi.org/10.1029/1998JC900099, 1999. a
Debreu, L. and Blayo, E.: Two-way embedding algorithms: a review, Ocean Dynam., 58, 415–428, https://doi.org/10.1007/s10236-008-0150-9, 2008. a
Deshayes, J., Tréguier, A. M., Barnier, B., Lecointre, A., Sommer, J. L., Molines, J. M., Penduff, T., Bourdallé-Badie, R., Drillet, Y., Garric, G., Benshila, R., Madec, G., Biastoch, A., Böning, C. W., Scheinert, M., Coward, A. C., and Hirschi, J. J.-M.: Oceanic hindcast simulations at high resolution suggest that the Atlantic MOC is bistable, Geophys. Res. Lett., 40, 3069–3073, https://doi.org/10.1002/grl.50534, 2013. a, b
Dong, S., Garzoli, S., and Baringer, M.: The Role of Interocean Exchanges on Decadal Variations of the Meridional Heat Transport in the South Atlantic, J. Phys. Oceanogr., 41, 1498–1511, https://doi.org/10.1175/2011JPO4549.1, 2011. a, b
Donners, J. and Drijfhout, S. S.: The Lagrangian View of South Atlantic Interocean Exchange in a Global Ocean Model Compared with Inverse Model Results, J. Phys. Oceanogr., 34, 1019–1035, https://doi.org/10.1175/JPO2782.1, 2004. a, b, c, d, e
Döös, K., Nycander, J., and Coward, A. C.: Lagrangian decomposition of the Deacon Cell, J. Geophys. Res.-Oceans, 113, C07028, https://doi.org/10.1029/2007JC004351, 2008. a, b
Drake, H. F., Morrison, A. K., Griffies, S. M., Sarmiento, J. L., Weijer, W., and Gray, A. R.: Lagrangian Timescales of Southern Ocean Upwelling in a Hierarchy of Model Resolutions, Geophys. Res. Lett., 45, 891–898, https://doi.org/10.1002/2017GL076045, 2018. a
Drijfhout, S. S., Weber, S. L., and van der Swaluw, E.: The stability of the MOC as diagnosed from model projections for pre-industrial, present and future climates, Clim. Dynam., 37, 1575–1586, https://doi.org/10.1007/s00382-010-0930-z, 2011. a, b
Durgadoo, J. V.: Controls and impact of Agulhas leakage, Phd thesis, Faculty of Mathematics and Natural Sciences, Christian-Albrechts-Universität zu Kiel, Kiel, 2013. a
Durgadoo, J. V., Loveday, B. R., Reason, C. J. C., Penven, P., and Biastoch, A.: Agulhas Leakage Predominantly Responds to the Southern Hemisphere Westerlies, J. Phys. Oceanogr., 43, 2113–2131, https://doi.org/10.1175/JPO-D-13-047.1, 2013. a, b, c, d, e, f
Durgadoo, J. V., Rühs, S., Biastoch, A., and Böning, C. W.: Indian Ocean sources of Agulhas leakage, J. Geophys. Res.-Oceans, 122, 3481–3499, https://doi.org/10.1002/2016JC012676, 2017. a
Fichefet, T. and Maqueda, M. A.: Sensitivity of a global sea ice model to the treatment of ice thermodynamics and dynamics, J. Geophys. Res.-Oceans, 102, 12609–12646, https://doi.org/10.1029/97JC00480, 1997. a
Firing, Y. L., Chereskin, T. K., and Mazloff, M. R.: Vertical structure and transport of the Antarctic Circumpolar Current in Drake Passage from direct velocity observations, J. Geophys. Res.-Oceans, 116, C08015, https://doi.org/10.1029/2011JC006999, 2011. a
Garzoli, S. L. and Matano, R.: The South Atlantic and the Atlantic Meridional Overturning Circulation, Deep-Sea Res. Pt. II, 58, 1837–1847, https://doi.org/10.1016/j.dsr2.2010.10.063, 2011. a, b, c
Garzoli, S. L., Baringer, M. O., Dong, S., Perez, R. C., and Yao, Q.: South Atlantic meridional fluxes, Deep-Sea Res. Pt. I, 71, 21–32, https://doi.org/10.1016/J.DSR.2012.09.003, 2013. a
Gaspar, P., Grégoris, Y., and Lefevre, J.-M.: A simple eddy kinetic energy model for simulations of the oceanic vertical mixing: Tests at station Papa and long-term upper ocean study site, J. Geophys. Res.-Oceans, 95, 16179, https://doi.org/10.1029/JC095iC09p16179, 1990. a
Gent, P. R.: A commentary on the Atlantic meridional overturning circulation stability in climate models, Ocean Model., 122, 57–66, https://doi.org/10.1016/j.ocemod.2017.12.006, 2018. a
Gordon, A. L.: Interocean exchange of thermocline water, J. Geophys. Res.-Oceans, 91, 5037–5046, https://doi.org/10.1029/JC091iC04p05037, 1986. a, b, c, d
Griffies, S. M., Biastoch, A., Böning, C. W., Bryan, F., Danabasoglu, G., Chassignet, E., England, M., Gerdes, R., Haak, H., Hallberg, R. W., Hazeleger, W., Jungclaus, J., Large, W. G., Madec, G., Pirani, A., Samuels, B. L., Scheinert, M., Gupta, A. S., Severijns, C. A., Simons, H. L., Treguier, A. M., Winton, M., Yeager, S., and Yin, J.: Coordinated Ocean-ice Reference Experiments (COREs), Ocean Model., 26, 1–46, https://doi.org/10.1016/j.ocemod.2008.08.007, 2009. a
Haarsma, R. J., Campos, E. J. D., Drijfhout, S., Hazeleger, W., and Severijns, C.: Impacts of interruption of the Agulhas leakage on the tropical Atlantic in coupled ocean-atmosphere simulations, Clim. Dynam., 36, 989–1003, https://doi.org/10.1007/s00382-009-0692-7, 2011. a
Hallberg, R.: Using a resolution function to regulate parameterizations of oceanic mesoscale eddy effects, Ocean Model., 72, 92–103, https://doi.org/10.1016/j.ocemod.2013.08.007, 2013. a
Hanawa, K. and Talley, L. D.: Chapter 5.4 Mode waters, in: International Geophysics Series Volume 77, Ocean Circulation and Climate – Observing and Modelling the Global Ocean, edited by: Siedler, G., Church, J., and Gould, J., Academic Press, 373–386, https://doi.org/10.1016/S0074-6142(01)80129-7, 2001. a
Hazeleger, W. and Drijfhout, S.: Subtropical cells and meridional overturning circulation pathways in the tropical Atlantic, J. Geophys. Res.-Oceans, 111, C03013, https://doi.org/10.1029/2005JC002942, 2006. a
Holfort, J. and Siedler, G.: The Meridional Oceanic Transports of Heat and Nutrients in the South Atlantic, J. Phys. Oceanogr., 31, 5–29, https://doi.org/10.1175/1520-0485(2001)031<0005:TMOTOH>2.0.CO;2, 2001. a, b
Hollingsworth, A., Kallberg, P., Renner, V., and Burridge, D. M.: An internal symmetric computational instability, Q. J. Roy. Meteor. Soc., 109, 417–428, https://doi.org/10.1002/qj.49710946012, 1983. a
Hummels, R., Brandt, P., Dengler, M., Fischer, J., Araujo, M., Veleda, D., and Durgadoo, J. V.: Interannual to decadal changes in the Western Boundary Circulation in the Atlantic at 11∘ S, Geophys. Res. Lett., 42, 7615–7622, https://doi.org/10.1002/2015GL065254, 2015. a
Kelly, K. A., Thompson, L., and Lyman, J.: The Coherence and Impact of Meridional Heat Transport Anomalies in the Atlantic Ocean Inferred from Observations, J. Climate, 27, 1469–1487, https://doi.org/10.1175/JCLI-D-12-00131.1, 2014. a
Knorr, G. and Lohmann, G.: Southern Ocean origin for the resumption of Atlantic thermohaline circulation during deglaciation, Nature, 424, 532–536, https://doi.org/10.1038/nature01855, 2003. a
Large, W. G. and Yeager, S. G.: The global climatology of an interannually varying air-sea flux data set, Clim. Dynam., 33, 341–364, https://doi.org/10.1007/s00382-008-0441-3, 2009. a
Le Bars, D., Dijkstra, H. A., and De Ruijter, W. P. M.: Impact of the Indonesian Throughflow on Agulhas leakage, Ocean Sci., 9, 773–785, https://doi.org/10.5194/os-9-773-2013, 2013. a
Le Bars, D., Durgadoo, J. V., Dijkstra, H. A., Biastoch, A., and De Ruijter, W. P. M.: An observed 20-year time series of Agulhas leakage, Ocean Sci., 10, 601–609, https://doi.org/10.5194/os-10-601-2014, 2014. a
Levitus, S., Boyer, T. P., Conkright, M. E., O'Brien, T., Antonov, J., Stephens, C., Stathoplos, L., Johnson, D., and Gelfeld, R.: NOAA Atlas NESDIS 18, World Ocean Database 1998, Volume 1, Introduction, U.S. Gov. Printing Office, Washington, D.C., 1998.
Lozier, M. S.: Deconstructing the Conveyor Belt, Science, 328, 1507–1511, https://doi.org/10.1126/science.1189250, 2010. a
Lübbecke, J. F., Durgadoo, J. V., and Biastoch, A.: Contribution of Increased Agulhas Leakage to Tropical Atlantic Warming, J. Climate, 28, 9697–9706, https://doi.org/10.1175/JCLI-D-15-0258.1, 2015. a
Lutjeharms, J. R. E.: The Agulhas Current, Springer, Berlin, 2006. a
Lynch-Stieglitz, J.: The Atlantic Meridional Overturning Circulation and Abrupt Climate Change, Annu. Rev. Mar. Sci., 9, 83–104, https://doi.org/10.1146/annurev-marine-010816-060415, 2017. a
Macdonald, A. M.: Property fluxes at 30∘ S and their implications for the Pacific-Indian throughflow and the global heat budget, J. Geophys. Res.-Oceans, 98, 6851–6868, https://doi.org/10.1029/92JC02964, 1993. a
Macdonald, A. M.: The global ocean circulation: a hydrographic estimate and regional analysis, Prog. Oceanogr., 41, 281–382, https://doi.org/10.1016/S0079-6611(98)00020-2, 1998. a
Madec, G. and NEMO-team: NEMO Ocean Engine, Tech. rep., Institut Pierre-Simon Laplace (IPSL), Paris, 2016. a
Madec, G., Delecluse, P., Imbard, M., and Levy, C.: OPA 8 Ocean General Circulation Model – Reference Manual, Tech. rep., LODYC/IPSL Note 11, 1998. a
Meinen, C. S., Speich, S., Perez, R. C., Dong, S., Piola, A. R., Garzoli, S. L., Baringer, M. O., Gladyshev, S., and Campos, E. J. D.: Temporal variability of the meridional overturning circulation at 34.5∘ S: Results from two pilot boundary arrays in the South Atlantic, J. Geophys. Res.-Oceans, 118, 6461–6478, https://doi.org/10.1002/2013JC009228, 2013. a
Meinen, C. S., Speich, S., Piola, A. R., Ansorge, I., Campos, E., Kersalé, M., Terre, T., Chidichimo, M. P., Lamont, T., Sato, O. T., Perez, R. C., Valla, D., van den Berg, M., Le Hénaff, M., Dong, S., and Garzoli, S. L.: Meridional Overturning Circulation Transport Variability at 34.5∘ S During 2009–2017: Baroclinic and Barotropic Flows and the Dueling Influence of the Boundaries, Geophys. Res. Lett., 45, 4180–4188, https://doi.org/10.1029/2018GL077408, 2018. a
Mesinger, F. and Arakawa, A.: Numerical methods used in atmospheric models, Global Atmospheric Research Program World Meteorological Organization, 1, 1–66, 1976. a
Moffa-Sánchez, P. and Hall, I. R.: North Atlantic variability and its links to European climate over the last 3000 years, Nat. Commun., 8, 1726, https://doi.org/10.1038/s41467-017-01884-8, 2017. a
Palter, J. B.: The Role of the Gulf Stream in European Climate, Annu. Rev. Mar. Sci., 7, 113–137, https://doi.org/10.1146/annurev-marine-010814-015656, 2015. a
Rahmstorf, S.: On the freshwater forcing and transport of the Atlantic thermohaline circulation, Clim. Dynam., 12, 799–811, https://doi.org/10.1007/s003820050144, 1996. a
Rahmstorf, S.: Ocean circulation and climate during the past 120,000 years, Nature, 419, 207–214, https://doi.org/10.1038/nature01090, 2002. a
Richardson, P. L.: Agulhas leakage into the Atlantic estimated with subsurface floats and surface drifters, Deep-Sea Res. Pt. I, 54, 1361–1389, https://doi.org/10.1016/J.DSR.2007.04.010, 2007. a, b
Richardson, P. L.: On the history of meridional overturning circulation schematic diagrams, Prog. Oceanogr., 76, 466–486, https://doi.org/10.1016/j.pocean.2008.01.005, 2008. a
Rimaud, J., Speich, S., Blanke, B., and Grima, N.: The exchange of Intermediate Water in the southeast Atlantic: Water mass transformations diagnosed from the Lagrangian analysis of a regional ocean model, J. Geophys. Res.-Oceans, 117, C08034, https://doi.org/10.1029/2012JC008059, 2012. a, b
Rintoul, S. R.: South Atlantic Interbasin Exchange, J. Geophys. Res.-Oceans, 96, 2675–2692, https://doi.org/10.1029/90JC02422, 1991. a, b
Rodrigues, R. R., Wimbush, M., Watts, D. R., Rothstein, L. M., and Ollitrault, M.: South Atlantic mass transports obtained from subsurface float and hydrographic data, J. Mar. Res., 68, 819–850, https://doi.org/10.1357/002224010796673858, 2010. a, b, c
Roemmich, D.: The Balance of Geostrophic and Ekman Transports in the Tropical Atlantic Ocean, J. Phys. Oceanogr., 13, 1534–1539, https://doi.org/10.1175/1520-0485(1983)013<1534:TBOGAE>2.0.CO;2, 1983. a
Rühs, S: Quantitative ARIANE trajectories for the upper limb of the SAMOC calculated from 5-day mean velocities of hindcast simulation KFS044 with ocean model INALT20, available at: https://data.geomar.de/thredds/catalog/open_access/ruehs_et_al_2019_os/catalog.html, last access: 11 April 2019. a
Rühs, S., Durgadoo, J. V., Behrens, E., and Biastoch, A.: Advective timescales and pathways of Agulhas leakage, Geophys. Res. Lett., 40, 3997–4000, https://doi.org/10.1002/grl.50782, 2013. a, b, c, d, e, f
Rühs, S., Getzlaff, K., Durgadoo, J. V., Biastoch, A., and Böning, C. W.: On the suitability of North Brazil Current transport estimates for monitoring basin-scale AMOC changes, Geophys. Res. Lett., 42, 8072–8080, https://doi.org/10.1002/2015GL065695, 2015. a, b, c, d, e, f
Rusciano, E., Speich, S., and Ollitrault, M.: Interocean exchanges and the spreading of Antarctic Intermediate Water south of Africa, J. Geophys. Res.-Oceans, 117, C10010, https://doi.org/10.1029/2012JC008266, 2012. a
Sato, O. T. and Polito, P. S.: Observation of South Atlantic subtropical mode waters with Argo profiling float data, J. Geophys. Res.-Oceans, 119, 2860–2881, https://doi.org/10.1002/2013JC009438, 2014. a
Schmitz, W. J.: On the interbasin-scale thermohaline circulation, Rev. Geophys., 33, 151–173, https://doi.org/10.1029/95RG00879, 1995. a
Schott, F. A., McCreary, J. P., and Johnson, G. C.: Shallow overturning circulations of the tropical-subtropical oceans, in: Geophysical Monograph Series, 147, 261–304, American Geophysical Union (AGU), https://doi.org/10.1029/147GM15, 2004. a
Schott, F. A., Dengler, M., Zantopp, R., Stramma, L., Fischer, J., and Brandt, P.: The shallow and deep western boundary circulation of the South Atlantic at 5∘–11∘ S, J. Phys. Oceanogr., 35, 2031–2053, https://doi.org/10.1175/JPO2813.1, 2005. a
Schwarzkopf, F. U., Biastoch, A., Böning, C. W., Chanut, J., Durgadoo, J. V., Getzlaff, K., Harlaß, J., Rieck, J. K., Roth, C., Scheinert, M. M., and Schubert, R.: The INALT family – a set of high-resolution nests for the Agulhas Current system within global NEMO ocean/sea-ice configurations, Geosci. Model Dev. Discuss., https://doi.org/10.5194/gmd-2018-312, in review, 2019. a, b, c, d, e
Sloyan, B. M. and Rintoul, S. R.: Circulation, Renewal, and Modification of Antarctic Mode and Intermediate Water, J. Phys. Oceanogr., 31, 1005–1030, https://doi.org/10.1175/1520-0485(2001)031<1005:CRAMOA>2.0.CO;2, 2001. a
Speich, S., Blanke, B., and Madec, G.: Warm and cold water routes of an O.G.C.M. thermohaline conveyor belt, Geophys. Res. Lett., 28, 311–314, https://doi.org/10.1029/2000GL011748, 2001. a, b, c, d, e, f, g, h, i, j, k, l, m, n, o, p
Speich, S., Blanke, B., de Vries, P., Drijfhout, S., Döös, K., Ganachaud, A., and Marsh, R.: Tasman leakage: A new route in the global ocean conveyor belt, Geophys. Res. Lett., 29, 1416, https://doi.org/10.1029/2001GL014586, 2002. a, b
Speich, S., Blanke, B., and Cai, W.: Atlantic meridional overturning circulation and the Southern Hemisphere supergyre, Geophys. Res. Lett., 34, L23614, https://doi.org/10.1029/2007GL031583, 2007. a, b, c, d, e, f, g, h
Srokosz, M., Baringer, M., Bryden, H., Cunningham, S., Delworth, T., Lozier, S., Marotzke, J., and Sutton, R.: Past, Present, and Future Changes in the Atlantic Meridional Overturning Circulation, B. Am. Meteorol. Soc., 93, 1663–1676, https://doi.org/10.1175/BAMS-D-11-00151.1, 2012. a
Steele, M., Morley, R., and Ermold, W.: PHC: A global ocean hydrography with a high quality Arctic Ocean, J. Climate, 14, 2079–2087, https://doi.org/10.1175/1520-0442(2001)014<2079:PAGOHW>2.0.CO;2, 2001. a
Stommel, H.: Thermohaline Convection with Two Stable Regimes, Tellus, 13, 224–230, https://doi.org/10.1111/j.2153-3490.1961.tb00079.x, 1961. a
Stramma, L. and England, M.: On the water masses and mean circulation of the South Atlantic Ocean, J. Geophys. Res.-Oceans, 104, 20863–20883, https://doi.org/10.1029/1999JC900139, 1999. a
Thomas, M. D., Tréguier, A.-M., Blanke, B., Deshayes, J., and Voldoire, A.: A Lagrangian Method to Isolate the Impacts of Mixed Layer Subduction on the Meridional Overturning Circulation in a Numerical Model, J. Climate, 28, 7503–7517, https://doi.org/10.1175/JCLI-D-14-00631.1, 2015. a, b
Tim, N., Zorita, E., Schwarzkopf, F. U., Rühs, S., Emeis, K.-C., and Biastoch, A.: The impact of Agulhas leakage on the central water masses in the Benguela upwelling system from a high-resolution ocean simulation, J. Geophys. Res.-Oceans, 123, 9416–9428, https://doi.org/10.1029/2018JC014218, 2018. a, b, c, d
van Sebille, E., van Leeuwen, P. J., Biastoch, A., and de Ruijter, W. P. M.: Flux comparison of Eulerian and Lagrangian estimates of Agulhas leakage: A case study using a numerical model, Deep-Sea Res. Pt. I, 57, 319–327, https://doi.org/10.1016/J.DSR.2009.12.006, 2010. a
van Sebille, E., Beal, L. M., and Johns, W. E.: Advective Time Scales of Agulhas Leakage to the North Atlantic in Surface Drifter Observations and the 3D OFES Model, J. Phys. Oceanogr., 41, 1026–1034, https://doi.org/10.1175/2011JPO4602.1, 2011. a, b, c
van Sebille, E., Griffies, S. M., Abernathey, R., Adams, T. P., Berlof, P., Biastoc, A., Blanke, B., Chassignet, E. P., Cheng, Y., Cotter, C. J., Deleersnijder, E., Döös, K., Drake, H., Drijfhout, S., Gar, S. F., Heemink, A. W., Kjellsson, J., Koszalka, I. M., Lange, M., Lique, C., MacGilchrist, G. A., Marsh, R., Adame, G. C. M., McAdam, R., Nencioli, F., Paris, C. B., Piggott, M. D., Polton, J. A., Rühs, S., Shah, S. H., Thomas, M. D., Wang, J., Wolfram, P. J., Zanna, L., and Zika, J. D.: Lagrangian ocean analysis: fundamentals and practices, Ocean Model., 121, 49–75, https://doi.org/10.1016/j.ocemod.2017.11.008, 2018. a
Weijer, W., de Ruijter, W. P. M., and Dijkstra, H. A.: Stability of the Atlantic Overturning Circulation: Competition between Bering Strait Freshwater Flux and Agulhas Heat and Salt Sources, J. Phys. Oceanogr., 31, 2385–2402, https://doi.org/10.1175/1520-0485(2001)031<2385:sotaoc>2.0.co;2, 2001. a
Weijer, W., de Ruijter, W. P., Sterl, A., and Drijfhout, S. S.: Response of the Atlantic overturning circulation to South Atlantic sources of buoyancy, Global Planet. Change, 34, 293–311, https://doi.org/10.1016/S0921-8181(02)00121-2, 2002. a
Yeager, S. and Danabasoglu, G.: The Origins of Late-Twentieth-Century Variations in the Large-Scale North Atlantic Circulation, J. Climate, 27, 3222–3247, https://doi.org/10.1175/JCLI-D-13-00125.1, 2014. a
Zalesak, S. T.: Fully multidimensional flux-corrected transport algorithms for fluids, J. Comput. Phys., 31, 335–362, https://doi.org/10.1016/0021-9991(79)90051-2, 1979. a
Zhang, D.: Observational Evidence for Flow between the Subtropical and Tropical Atlantic: The Atlantic Subtropical Cells, J. Phys. Oceanogr., 33, 1783–1797, https://doi.org/10.1175/2408.1, 2003. a
The requested paper has a corresponding corrigendum published. Please read the corrigendum first before downloading the article.
- Article
(7341 KB) - Full-text XML