the Creative Commons Attribution 4.0 License.
the Creative Commons Attribution 4.0 License.
 | 10 Mar 2026
The role of cyclonic eddies in the detachment and separation of Loop Current eddies
Julien Jouanno
Eric P. Chassignet
Giovanni Durante
Ilkyeong Ma
Julio Sheinbaum
Lionel Renault
The Loop Current (LC) and its associated eddies, known as Loop Current Eddies (LCEs), are key oceanic features in the Gulf of Mexico. Using a statistical analysis of 29 years of satellite altimeter data (1993–2021), we show that more than half of the LCEs that detach from the LC reattach within 30 d and that only 42 % truly separate from the LC and move westward in the Gulf. Our observational analysis also shows that (i) before a detachment can occur, the LC needs to extend far enough north in the Gulf to reach the Mississippi fan (∼27.5° N); and (ii) the ratio of separations to reattachments depends on latitude, with detachments being more prone to reattach if they occur south of 25° N and to separate if they occur north of 25° N. In case (iii), cyclonic eddies are consistently present during the detachment process, with one cyclonic eddy on the eastern side of the LC if the LCE is to reattach, and one on each side if the LCE is to separate. When cyclonic eddies occur on both sides of the LC, their co-occurrence in the LC bottleneck zone forms a large cyclonic structure. This large cyclonic structure is often observed during separation events, and when it is absent, LCEs are more likely to reattach, indicating a potential role in modulating the LC extension into the Gulf of Mexico. Sometimes, it can restrict LC growth on time scales of several months. The observed associations between cyclonic eddies and LCE detachments provide a statistical framework that could help anticipate separation events.
- Article
(13739 KB) - Full-text XML
- BibTeX
- EndNote


The Gulf of Mexico (GoM) is a semi-enclosed basin whose circulation is dominated by the Loop Current (LC), an anticyclonic current fed by the northward-flowing Yucatan Current along the Caribbean margin of the Yucatan Peninsula (Sheinbaum, 2002). The LC subsequently exits the GoM through the Florida Straits and continues as the Florida Current (Larsen, 1992). Episodically, the LC sheds anticyclonic warm-core rings, known as Loop Current Eddies (LCEs), with diameters larger than 200 km (Biggs et al., 1996; Leben, 2005). Once an LCE detaches, it may reattach multiple times to the LC or separate definitively, traveling westward across the GoM. The periodicity of these separation events is highly variable, ranging from 100 o 400 d (Leben, 2005; Dukhovskoy et al., 2015; Garcia-Jove et al., 2016; Larrañaga et al., 2022). LCEs play a crucial role in the oceanic and atmospheric dynamics of the GoM. As they move westward, they transport warm water from the Caribbean Sea into the GoM (Bunge et al., 2002; Sosa-Gutiérrez et al., 2020; Hamilton et al., 2018; Meunier et al., 2018, 2020) and can contribute to the rapid intensification of hurricanes by serving as a heat reservoir (Shay et al., 2000; Molina et al., 2016; Yablonsky and Ginis, 2012). Moreover, LCEs have economic implications, particularly by disrupting oil and gas production from unanchored platforms (Kantha, 2014).
The mechanisms behind the detachment and separation of LCEs are not yet fully understood. Hurlburt and Thompson (1980) highlighted the importance of differential rotation, suggesting that the Earth's differential rotation (β>0) is essential for realistic eddy shedding. This was later confirmed by Pichevin and Nof (1997), who linked LCE detachment to the propagation of a long Rossby wave that outpaces LC growth. However, this theory assumes that the LC returns to its initial position after detachments, which is not always observed in reality (Leben, 2005). Leben (2005) and Lugo-Fernández and Leben (2010) showed that the retreat latitude of the LC after separations is inversely correlated with the time between separations, with separation periods longer than 10 months when the LC retreats south of 25° N, and around 5 months when it retreats north of this latitude. Such variability in the timing of separations may also be influenced by atmospheric forcing, as shown by Chang and Oey (2010), who found that persistent westward winds can delay the shedding of LCEs in numerical simulations.
In addition to large-scale rotational and wave dynamics, several studies have linked LCE detachments to internal instabilities and energy conversion processes. Chérubin et al. (2006) used a numerical approach to indicate that LCE detachment results from a combination of baroclinic energy conversion in the deep GoM layers and barotropic energy conversion in the upper layers. More recently, Yang et al. (2023) reported that barotropic energy conversions play a dominant role in the energy balance during detachment events. However, Morey et al. (2020) compared observational estimates of deep eddy kinetic energy from Pérez-Brunius et al. (2018) with outputs from MITgcm (Massachusetts Institute of Technology general circulation model), ROMS (Regional Ocean Modeling System), and HYCOM (Hybrid Coordinate Ocean Model) and found that all three models substantially underestimate deep eddy kinetic energy, typically by more than a factor of two. This discrepancy highlights current limitations in numerical models in reproducing deep eddy variability and raises uncertainty regarding how barotropic and baroclinic energy conversions contribute to the deep eddy kinetic energy budget. From an observational perspective, using a mooring array spanning the Campeche Bank, Mississippi Fan, and West Florida Shelf, Donohue et al. (2016) and Hamilton et al. (2016) provide direct evidence for the role of baroclinic processes in deeper waters. Their results also indicate that LCE detachments are associated with an increase in deep eddy kinetic energy due to the conversion of available potential energy, consistent with the development of large-scale meanders in the northern and eastern LC regions.
Beyond internal energetics and instabilities, it has been suggested that cyclonic eddies, which are omnipresent in the GoM, play a critical role in the LCE shedding process (Cochrane, 1972; Vukovich and Maul, 1985; Fratantoni et al., 1998; Chérubin et al., 2006; Le Hénaff et al., 2012; Le Hénaff et al., 2014; Nickerson et al., 2022). Three main types of cyclonic eddies in the Gulf have been identified: cyclonic eddies that originate in the Caribbean Sea (Candela et al., 2002; Oey et al., 2003; Athié et al., 2012; Jouanno et al., 2016); frontal eddies generated east of the Campeche Bank, which travel along the LC (Jouanno et al., 2016; Hiron et al., 2020); and persistent cyclonic eddies near the Dry Tortugas, also known as Tortugas eddies (Fratantoni et al., 1998). Several scenarios involving cyclonic eddies in LCE detachment have been proposed. One of them is that detachment can be triggered by the intensification of eddies on the eastern side of the LC (e.g. Tortugas eddy), via the merging of a train of frontal eddies propagating along the LC (Fratantoni et al., 1998; Le Hénaff et al., 2012). Another widely discussed process involves cyclonic eddies “pinching off” the LC from its eastern and western flanks, effectively cutting the LC transversely (Schmitz, 2005; Fratantoni et al., 1998; Zavala-Hidalgo et al., 2003). Yang et al. (2023b) suggest that cyclonic eddies west of the LC, which are instrumental in promoting the “pinching off” mechanism, correlate with the occurrence of strong and large cyclonic eddies east of the LC. Furthermore, LCE separations have also been shown to occur along with the arrival of Caribbean eddies into the GoM (Athié et al., 2012; Jouanno et al., 2016; Sheinbaum et al., 2016). This is in agreement with the findings of Le Hénaff et al. (2023), who identified Caribbean eddies as key factors in forecasting LCE separation. However, Garcia-Jove et al. (2016) point out that although Caribbean cyclonic eddies can modulate the occurrence of LCE separations, they are not essential for their occurrence, reflecting the complex and not yet fully resolved role of Caribbean cyclonic eddies in the shedding process.
In this paper, we systematically document the role of cyclonic structures in the detachment and separation of LCEs by analyzing 29 years of satellite altimeter data (1993–2021). We statistically show that cyclonic eddies are consistently present during the detachment process, with one cyclonic eddy on the eastern side of the LC if the LCE is to reattach, and one cyclonic eddy on each side of the LC if the LCE is to separate. In the latter case, the co-occurrence of eastern and western cyclonic eddies in the LC bottleneck zone tend to form a large cyclonic structure. This large cyclonic structure is often observed during separation events, and when it is absent, LCEs are more likely to reattach, indicating a potential role in modulating the LC extension into the Gulf of Mexico. Sometimes, it can restrict LC growth on time scales of several months. The paper is organized as follows: Sect. 2 outlines the data and methods. The following sections examine the key mechanisms driving LCE detachment and separation, as well as the role of cyclonic eddies in these processes. Results are summarized and discussed in Sect. 6.
This study analyzes gridded altimetry data from 1993 to 2021, provided by CMEMS (European Union-Copernicus Marine Service, 2015) (https://data.marine.copernicus.eu/product/SEALEVEL_GLO_PHY_L4_MY_008_047/, last access:15 October 2024). Daily maps of Absolute Dynamic Topography (ADT) with a 1/4° horizontal resolution are created by adding Sea Level Anomaly (SLA) maps to the MDT-CNES-CLS22 mean dynamic topography product from AVISO (Jousset et al., 2025). Following Leben (2005), the LC and LCE fronts are tracked using the 17 cm contour in demeaned SSH fields. Removing the basin-scale mean is necessary to eliminate a bias associated with seasonal height variations due to warming and cooling of the upper ocean (Dukhovskoy et al., 2015). Demeaned fields are calculated by subtracting the spatial mean over the area defined by the longitudes 99 to 80° W and latitudes 17 to 31° N from each daily SSH field.
Other methods exist for detecting the position of the LC, such as the approach by Laxenaire et al. (2023), which identifies the LC using a contour associated with the maximum geostrophic velocity magnitude between the Yucatan Channel and the Florida Straits. However, Laxenaire et al. (2023) showed that both methods yield similar results.
Detachment events are identified by visually inspecting the daily ADT fields and as taking place when the 17 cm contour splits into two distinct loops: one corresponding to the LC and the other to the detached LCE. A detachment event is classified as a separation if the newly formed LCE does not reattach to the LC and travels westward across the GoM. Each reattachment is treated as an independent event, regardless of whether the same LCE reattaches multiple times before its final separation. To latitudinally classify detachment, reattachments, and separation events, we compute the outermost position of the LC following a detachment. This position corresponds to the spatial coordinate of the LC that is closest to the periphery of a detached LCE. This reference point allows us to distinguish between events occurring at different latitudes.
Additional datasets are used to complement the ADT satellite measurements, including current-meter observations along the Yucatan Channel and an atlas of eddy trajectories over the GoM and Caribbean Sea. The current-meter data were obtained from a mooring array deployed by the CANEK research group at CICESE (Ensenada Center for Scientific Research and Higher Education) in the Yucatan Channel, covering the period from July 2012 to October 2020 (Sheinbaum, 2002; Durante et al., 2025; Candela et al., 2019). The Mesoscale Eddy Trajectory Atlas 3.2 (META) (Pegliasco et al., 2022) delayed-time product is from AVISO, which uses an eddy detection method based on Chelton et al. (2011) to identify and track the eddies from the CMEMS Daily ADT maps.
We begin by documenting the detachment statistics of LCEs from 29 years of altimetry data (Figs. 1 and 2). We classify them into those that reattach to the Loop Current (hereafter referred to as reattachment events) and those that completely separate and move westward in the Gulf of Mexico (hereafter referred to as separation events). Details of each detached eddy, including the date, region, and eddy name, are provided in Tables A1 and A2. In total, 92 detachment events were identified between 1993 and 2021. Of these, 53 eddies (58 %) reattached to the Loop Current, while 39 (42 %) fully separated and drifted westward into the Gulf of Mexico. These detachment statistics highlight that reattachments are relatively common (3 per year on average) and deserve to be more closely examined, given their potential role in modulating LC dynamics and eddy shedding statistics.
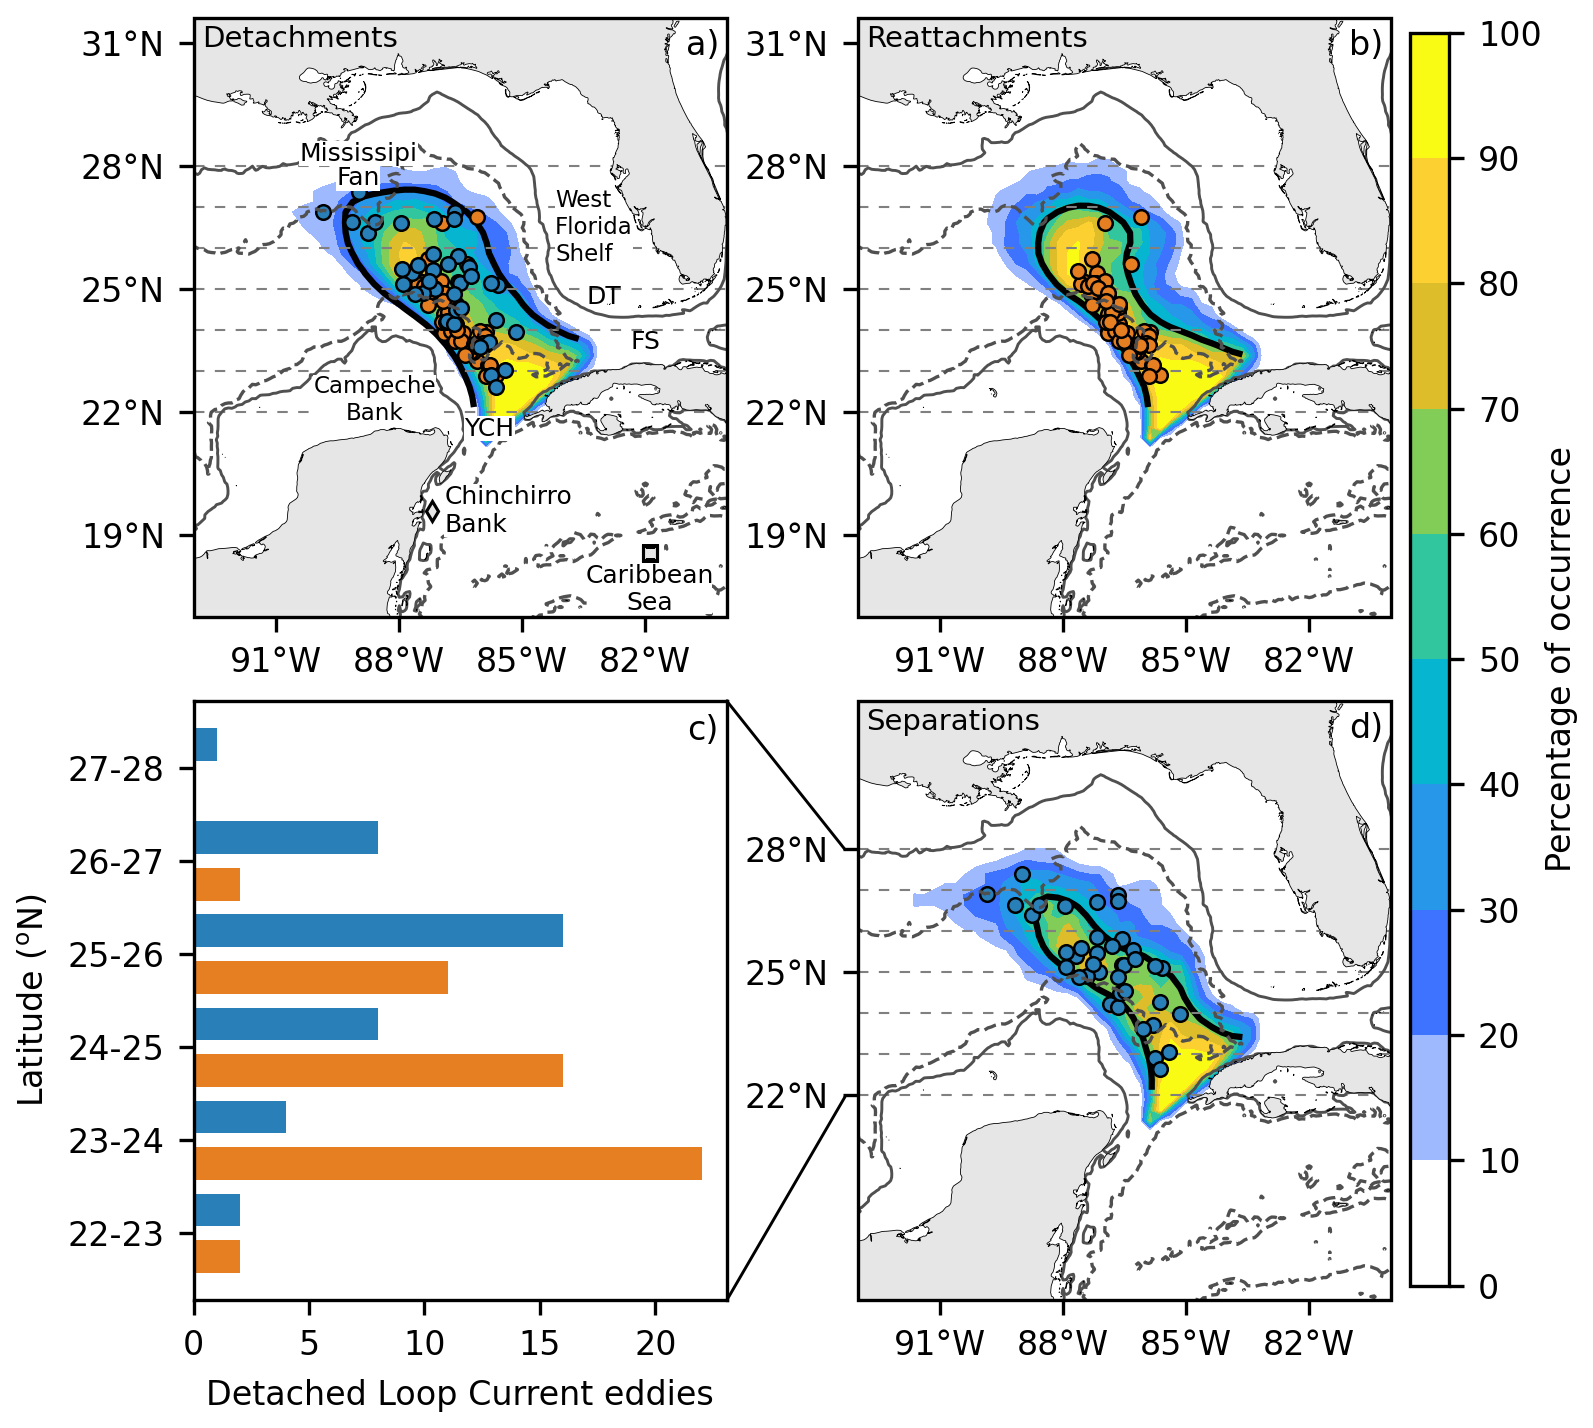
Figure 1Detachment locations (a) with subsequent reattachment (b) or separation (c). Orange circles correspond to detachment events followed by the reattachment of LCEs, whereas blue circles correspond to detachment events followed by the separation of LCEs. A probability density function of the LC spatial occurrence 1 d before the LCEs detachment is depicted by the shaded area. The averaged position of the LC 1 d before the detachment of LCEs is represented by the black contour. YCH refers to the Yucatan Channel, FS to the Florida Straits, and DT to the Dry Tortugas. The contours refer to the 200 m (continuous) and 2500 m (dashed) depths. The gray square in the Caribbean Sea represents the starting point for the transects utilized to generate the Hovmöller diagrams shown in Fig. 7, whereas the gray diamond represents the location of the Chinchorro Bank. (c) Histogram related to the number of reattachments (orange) and separations (blue) as a function of their latitude of occurrence. Horizontal segmented lines on the maps indicate the latitude limits of each histogram bin, with connecting lines linking the bins to their corresponding regions in the histogram.
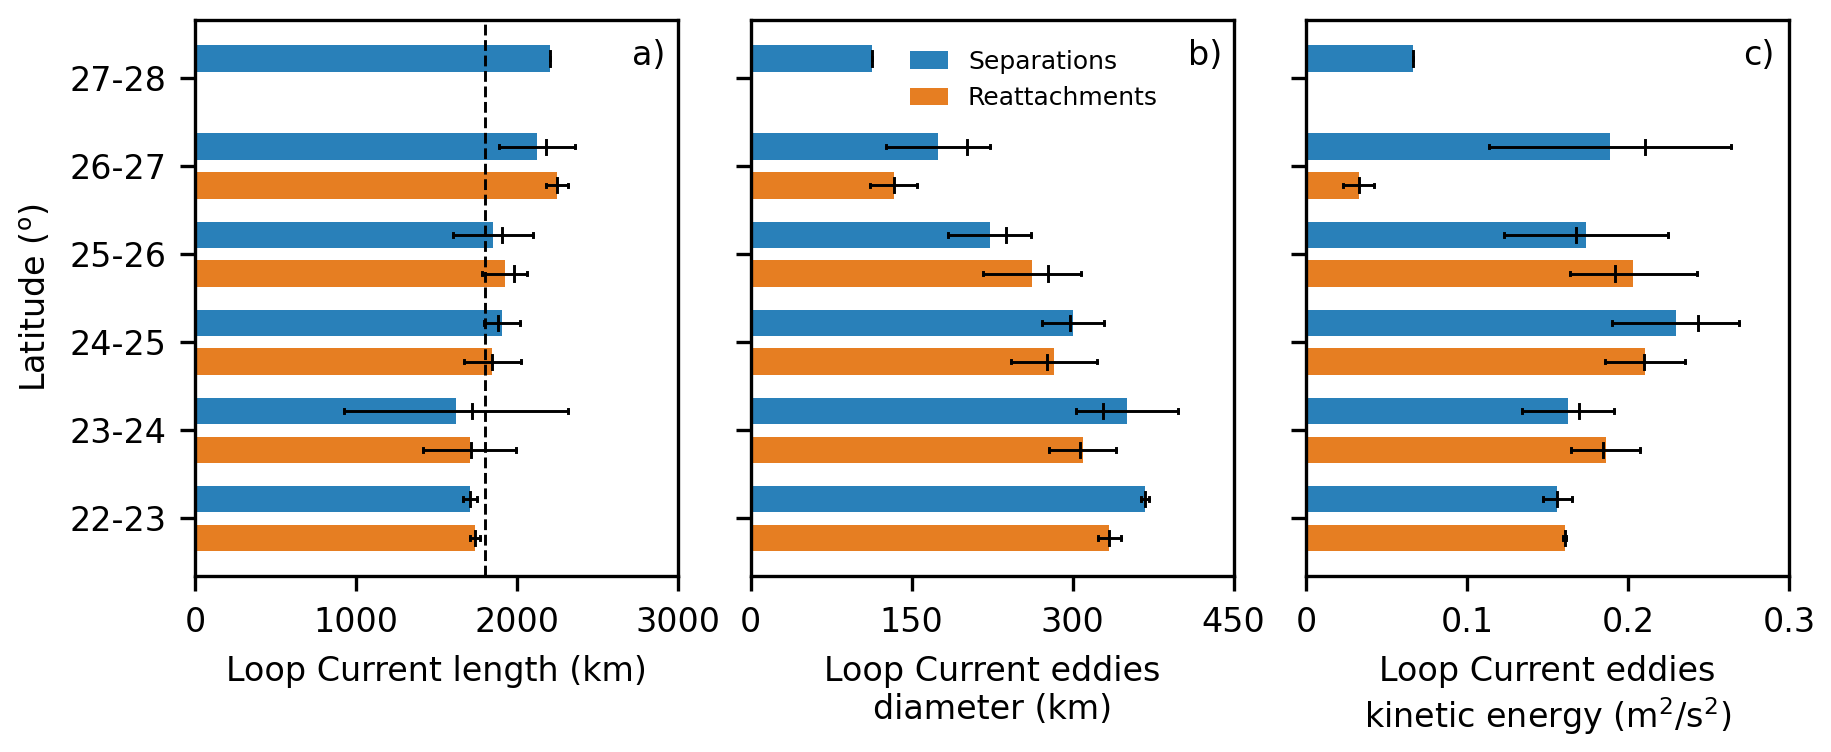
Figure 2Statistics about the LC length 1 d before an LCE detachment (a), as well as the diameter (b) and kinetic energy (c) of detached LCEs are presented for the different regions. The statistics are calculated across all cases within each latitudinal category. Separations are depicted with blue bars, whereas reattachments are depicted with orange bars. The standard deviation is represented by error bars, while the longer vertical lines indicate the median. The segmented black line in (a) represents the 1800 km LC length threshold.
The detachment statistics also show that the detachment locations, defined by the outermost position of the Loop Current following each detachment, span a broad latitudinal range, from 22 to 28° N (Fig. 1a). These events can be grouped into three distinct latitudinal clusters:
-
Detachments north of 26° N: this group includes 10 detachment events characterized by a wide zonal spread, extending from 90 to 86° W.
-
Detachments between 24 to 26° N: comprising 50 detachment events, this is the most densely populated cluster. It exhibits a narrow horizontal extent, constrained between the Campeche Bank and the West Florida Shelf.
-
Detachments south of 24° N: this cluster includes 28 events, most of which are skewed toward the Campeche Bank.
Additional insights are gained by separating the detachment locations from events when LCEs reattach to the LC (Fig. 1b) from those that fully separate and drift westward (Fig. 1c). Detachments with subsequent reattachments are predominantly concentrated south of 25° N, accounting for 75 % of such cases. In contrast, separation events display greater spatial variability in their detachment positions. There are notable differences in the mean position of the LC 1 d prior to all detachments, detachments only with subsequent reattachments, and detachments only with subsequent separations (Fig. 1a–c). The mean position of the LC 1 d prior to detachment, and detachments with subsequent reattachments or separations, is defined as the 17 cm contour extracted from the ADT field averaged across all cases. For reattachments, the LC typically displays a well-defined bulb-like structure with a pronounced eastern bottleneck, and the detachment locations are tightly grouped together west of this bottleneck. Conversely, in the separation cases, the detachment locations are more spread out latitudinally, and the average LC shape is more elongated and exhibits standing meanders on both sides of the LC. Moreover, the mean position of the LC 1 d prior to detachments unmasks a relationship between the LC extension and the occurrence of detachment events. On average, detachment events are more likely to occur when the LC reaches the Mississippi Fan, a Gulf shelf slope situated southeast of the Mississippi Delta. In fact, a probability density function representing the spatial occurrence of the LC prior to the detachments shows that between 60 % and 70 % of detachment, reattachment, and separation events occur when the LC is close to this bathymetric feature. To relate the observed detachment locations to a quantitative measure of LC extension, we define the LC length as the along-path distance of the LC, computed as the sum of distances between consecutive contour points from the Yucatan Channel to the Florida Straits. Using this metric, we examined the role of LC extension in the latitude of detachment, as well as in the diameter and kinetic energy of detached LCEs (Fig. 2).
From Figs. 1d and 2, we can make the following statements:
-
Detachments occurring south of 25° N are more likely to reattach (73 %) while those occurring north of 25° N are more prone to separate (64 %).
-
Detachments occur once the LC reaches a minimum length of approximately 1800 km (Fig. 2a), which corresponds to the LC extending to the Mississippi Fan (Fig. 1).
-
Only separations north of 26° N are associated with a larger LC extension, as these events occur when the LC extends beyond the Mississippi Fan.
-
Because the LC tends to reach the Mississippi Fan to detach an eddy, southern detachments are associated with larger LCEs. Accordingly, LCE diameters exceed 300 km south of 24° N, compared to roughly 150 km for detachments north of 26° N (Fig. 2b).
-
There is no clear relationship between the kinetic energy of the LCEs (Fig. 2c) and the detachment latitude. The most energetic LCEs (about 0.2 m2 s−2) occur between 24–25° N.
-
Lastly, similar LC lengths are observed for detachments with subsequent reattachment or separation across different detachment latitudes, suggesting that LC length is not a key factor controlling the fate of detached eddies.
The mean position of the LC 1 d prior to detachments also provides insights into possible mechanisms modulating the detachment process. Three well-defined lobules are observed in separation cases (Fig. 1c): two south of the LC, forming a bottleneck consistent with the “pinching off” mechanism driven by cyclonic eddies (Schmitz, 2005); and one northeast of the LC, corresponding to the location of intensified cyclonic eddies that have been associated with LCE shedding in this region (Le Hénaff et al., 2012). In the following sections, we quantify the role that cyclonic eddies play in LCE detachments as a function of latitude and investigate the origin of the western cyclonic structures leading to separation events.
Quantification of the dynamical differences between separation and reattachment cases can be obtained by analyzing composite SLA and Rossby number () fields at the time of detachment (Fig. 3). To illustrate the latitudinal dependence and different dynamics, we refine our previous classification by grouping detachment, separation, and reattachment over: (i) latitudes south of 24° N, (ii) latitudes between 24 and 25° N, (iii) latitudes between 25 and 26° N, (iv) latitudes north of 26° N with detachments west, and (v) latitudes north of 26° N with detachments east of the Mississippi Fan.
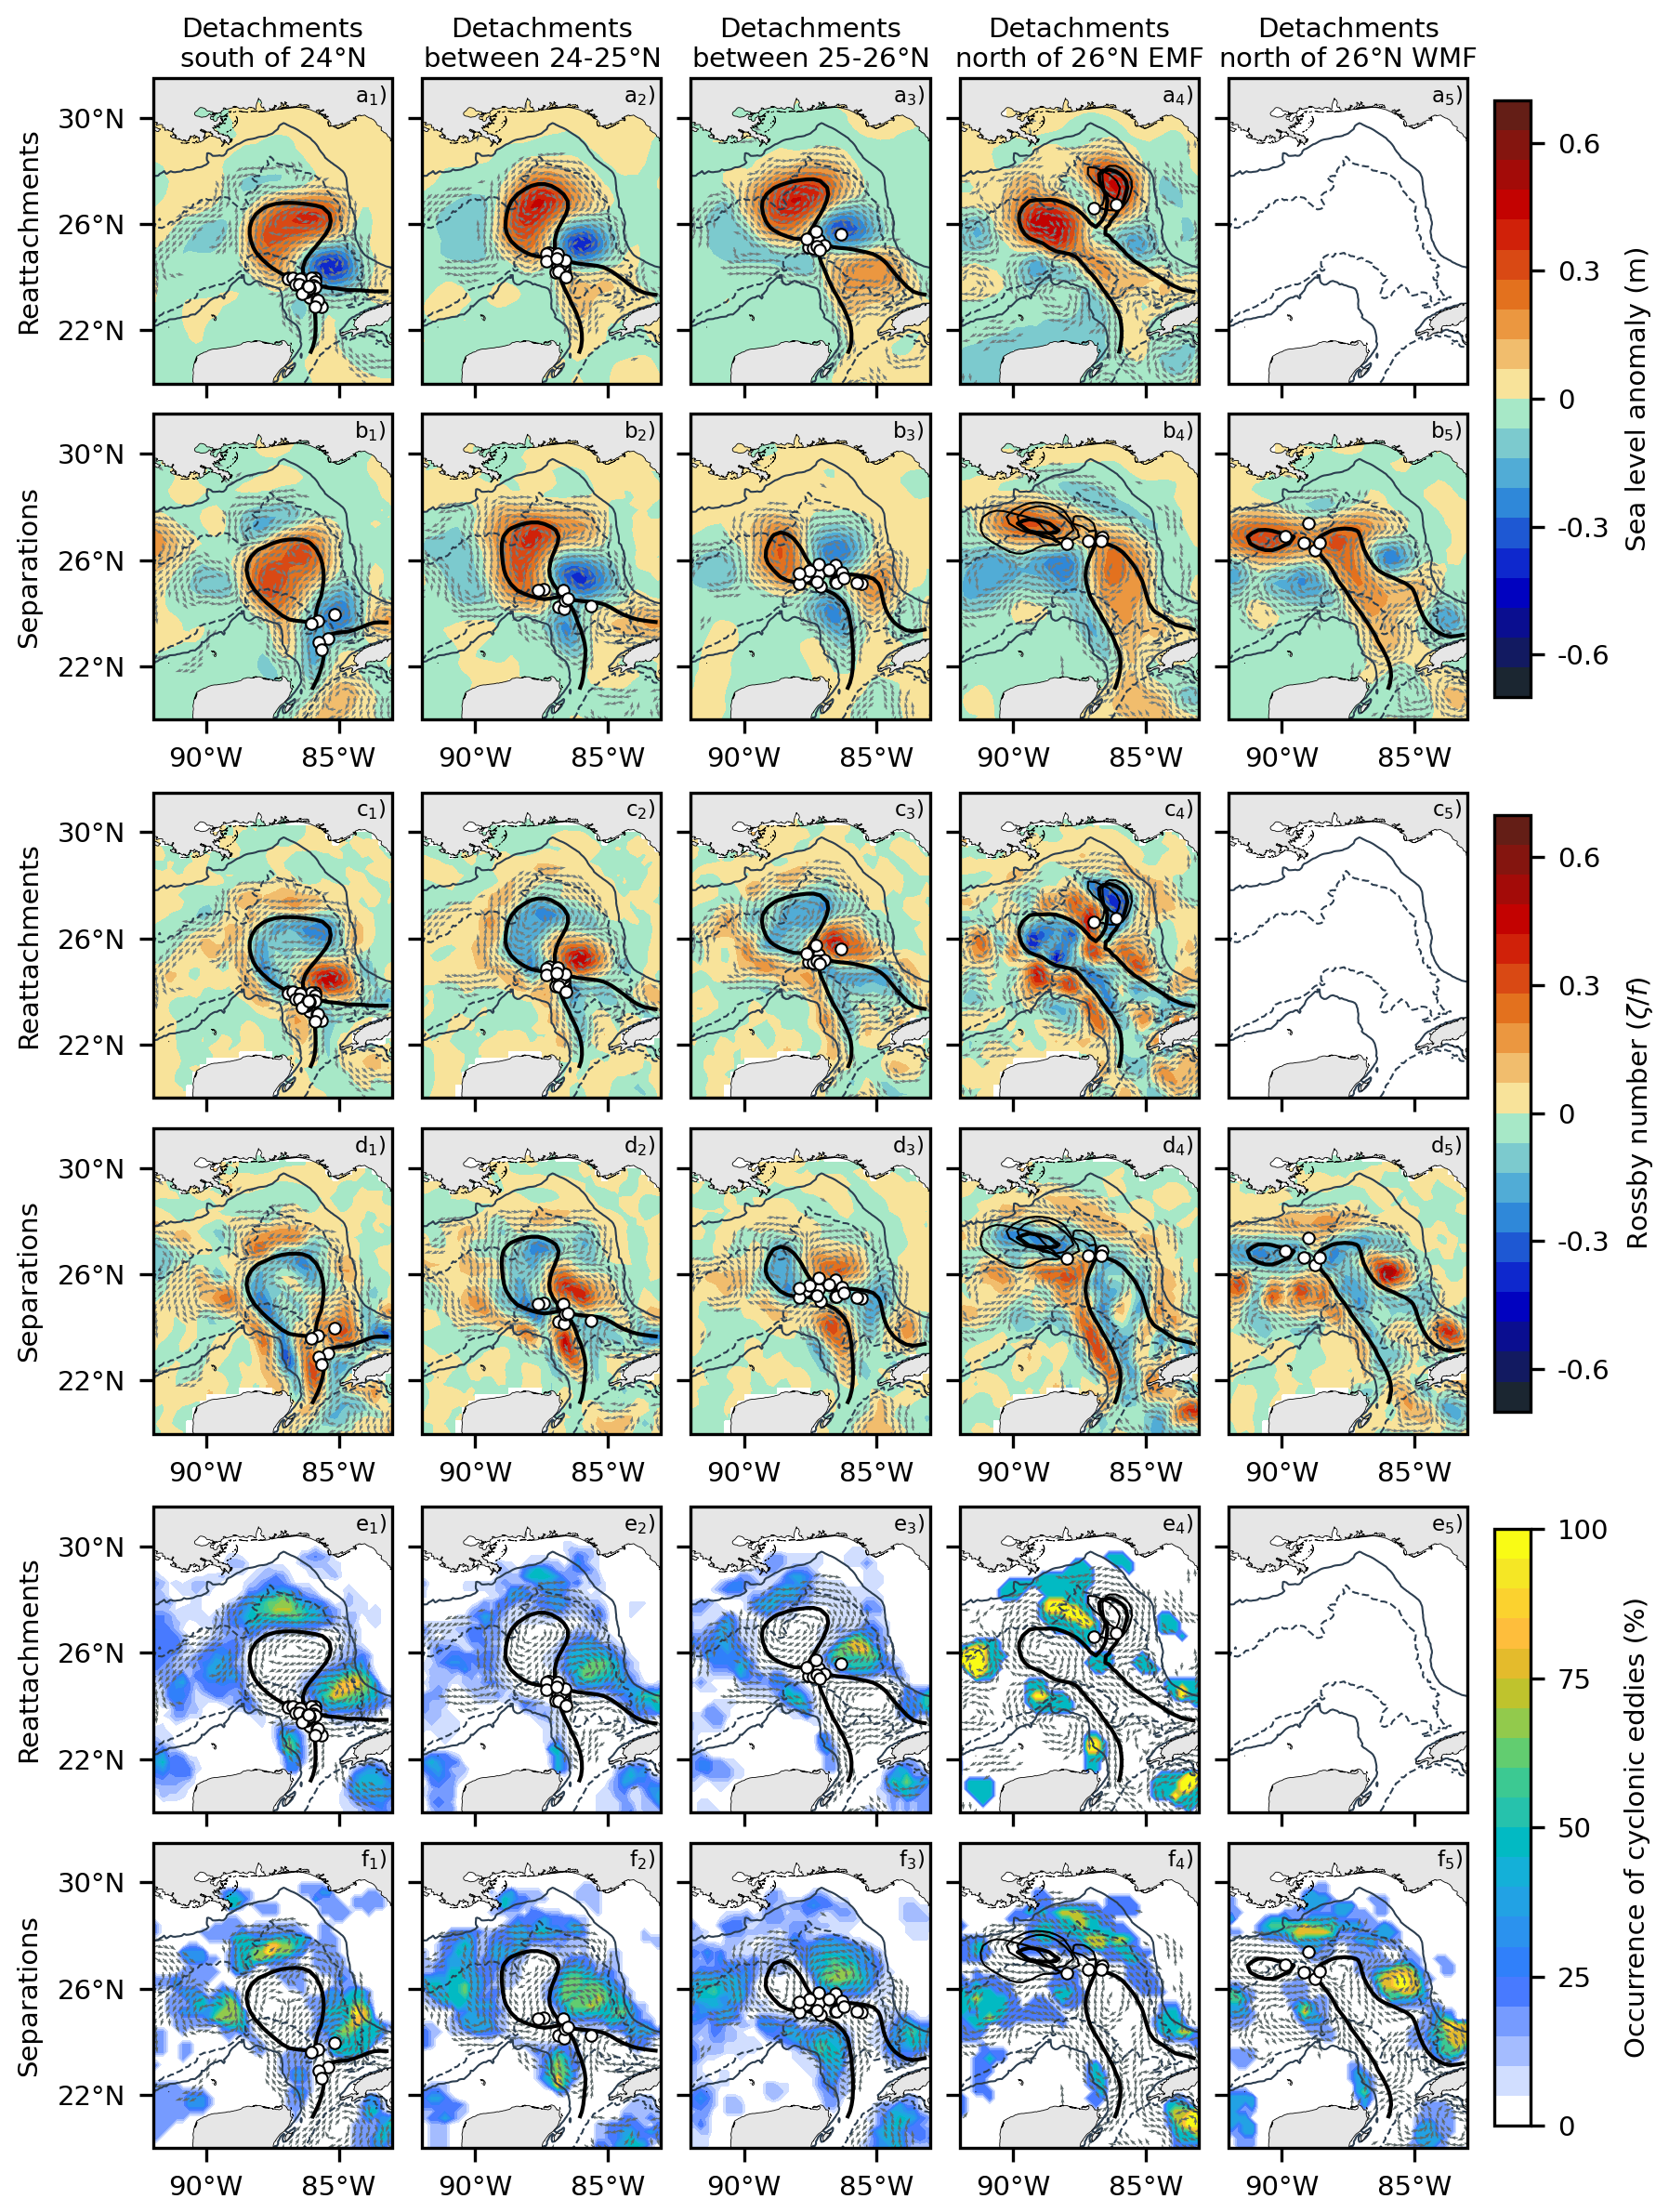
Figure 3SLA composites during LCEs detachment that ends in reattachments (a1–a5) and separation (b1–b5) for the different LC regions with eddy shedding (different columns). Thick contours represent the composite LC and detached LCEs. Rossby number composites (c1–c5 and d1–d5) and the occurrence of cyclonic eddies (e1–e5 and f1–f5) are also included. Thin contours in the last column represent the LCEs for each detachment case in the region. The gray arrows depict the direction of surface geostrophic currents with speeds stronger than 0.1 m s−1. White circles represent the LC outermost position after detachment events used for the composites. The light gray contours refer to the 200 m (continuous) and 2500 m (dashed) depths.
The composites show that LCE detachments occurring south of 26° N, regardless of whether they separate or reattach, all involve negative SLA structures on the eastern side of the LC (Fig. 3a1–a3 and b1–b3). Unlike reattachment cases (Figs. 3a1–a3), separations are also characterized by the presence of negative SLA structures to the west of the LC (Fig. 3b1–b3). The Rossby number composites of detachment events show that these negative SLA structures are associated with closed cyclonic circulation, suggesting the presence of mesoscale cyclonic features during the detachment of LCEs (Fig. 3c1–c3 and d1–d3). The latter is confirmed by independently computing the histogram of cyclonic eddy occurrences using the AVISO Mesoscale Eddy Trajectory Atlas 3.2 (META), which shows that cyclonic eddies are present in more than 70 % of detachment events (Fig. 3e1–e3 and f1–f3). Unlike detachments south of 26° N, the SLA and Rossby number composites of separation events north of 26° N, both west and east of the Mississippi Fan, show only a weak signal of cyclonic circulation northwest and southwest of the LC at the time of detachment (Fig. 3b4–b5, d4–d5 and f4–f5). North of 26° N, reattachment events are rare (only 2 events east of the Mississippi Fan over a 29-year period (Fig. 3a4–a5, c4–c5 and e4–e5), making it difficult to differentiate between conditions that are conducive to reattachment or separation.
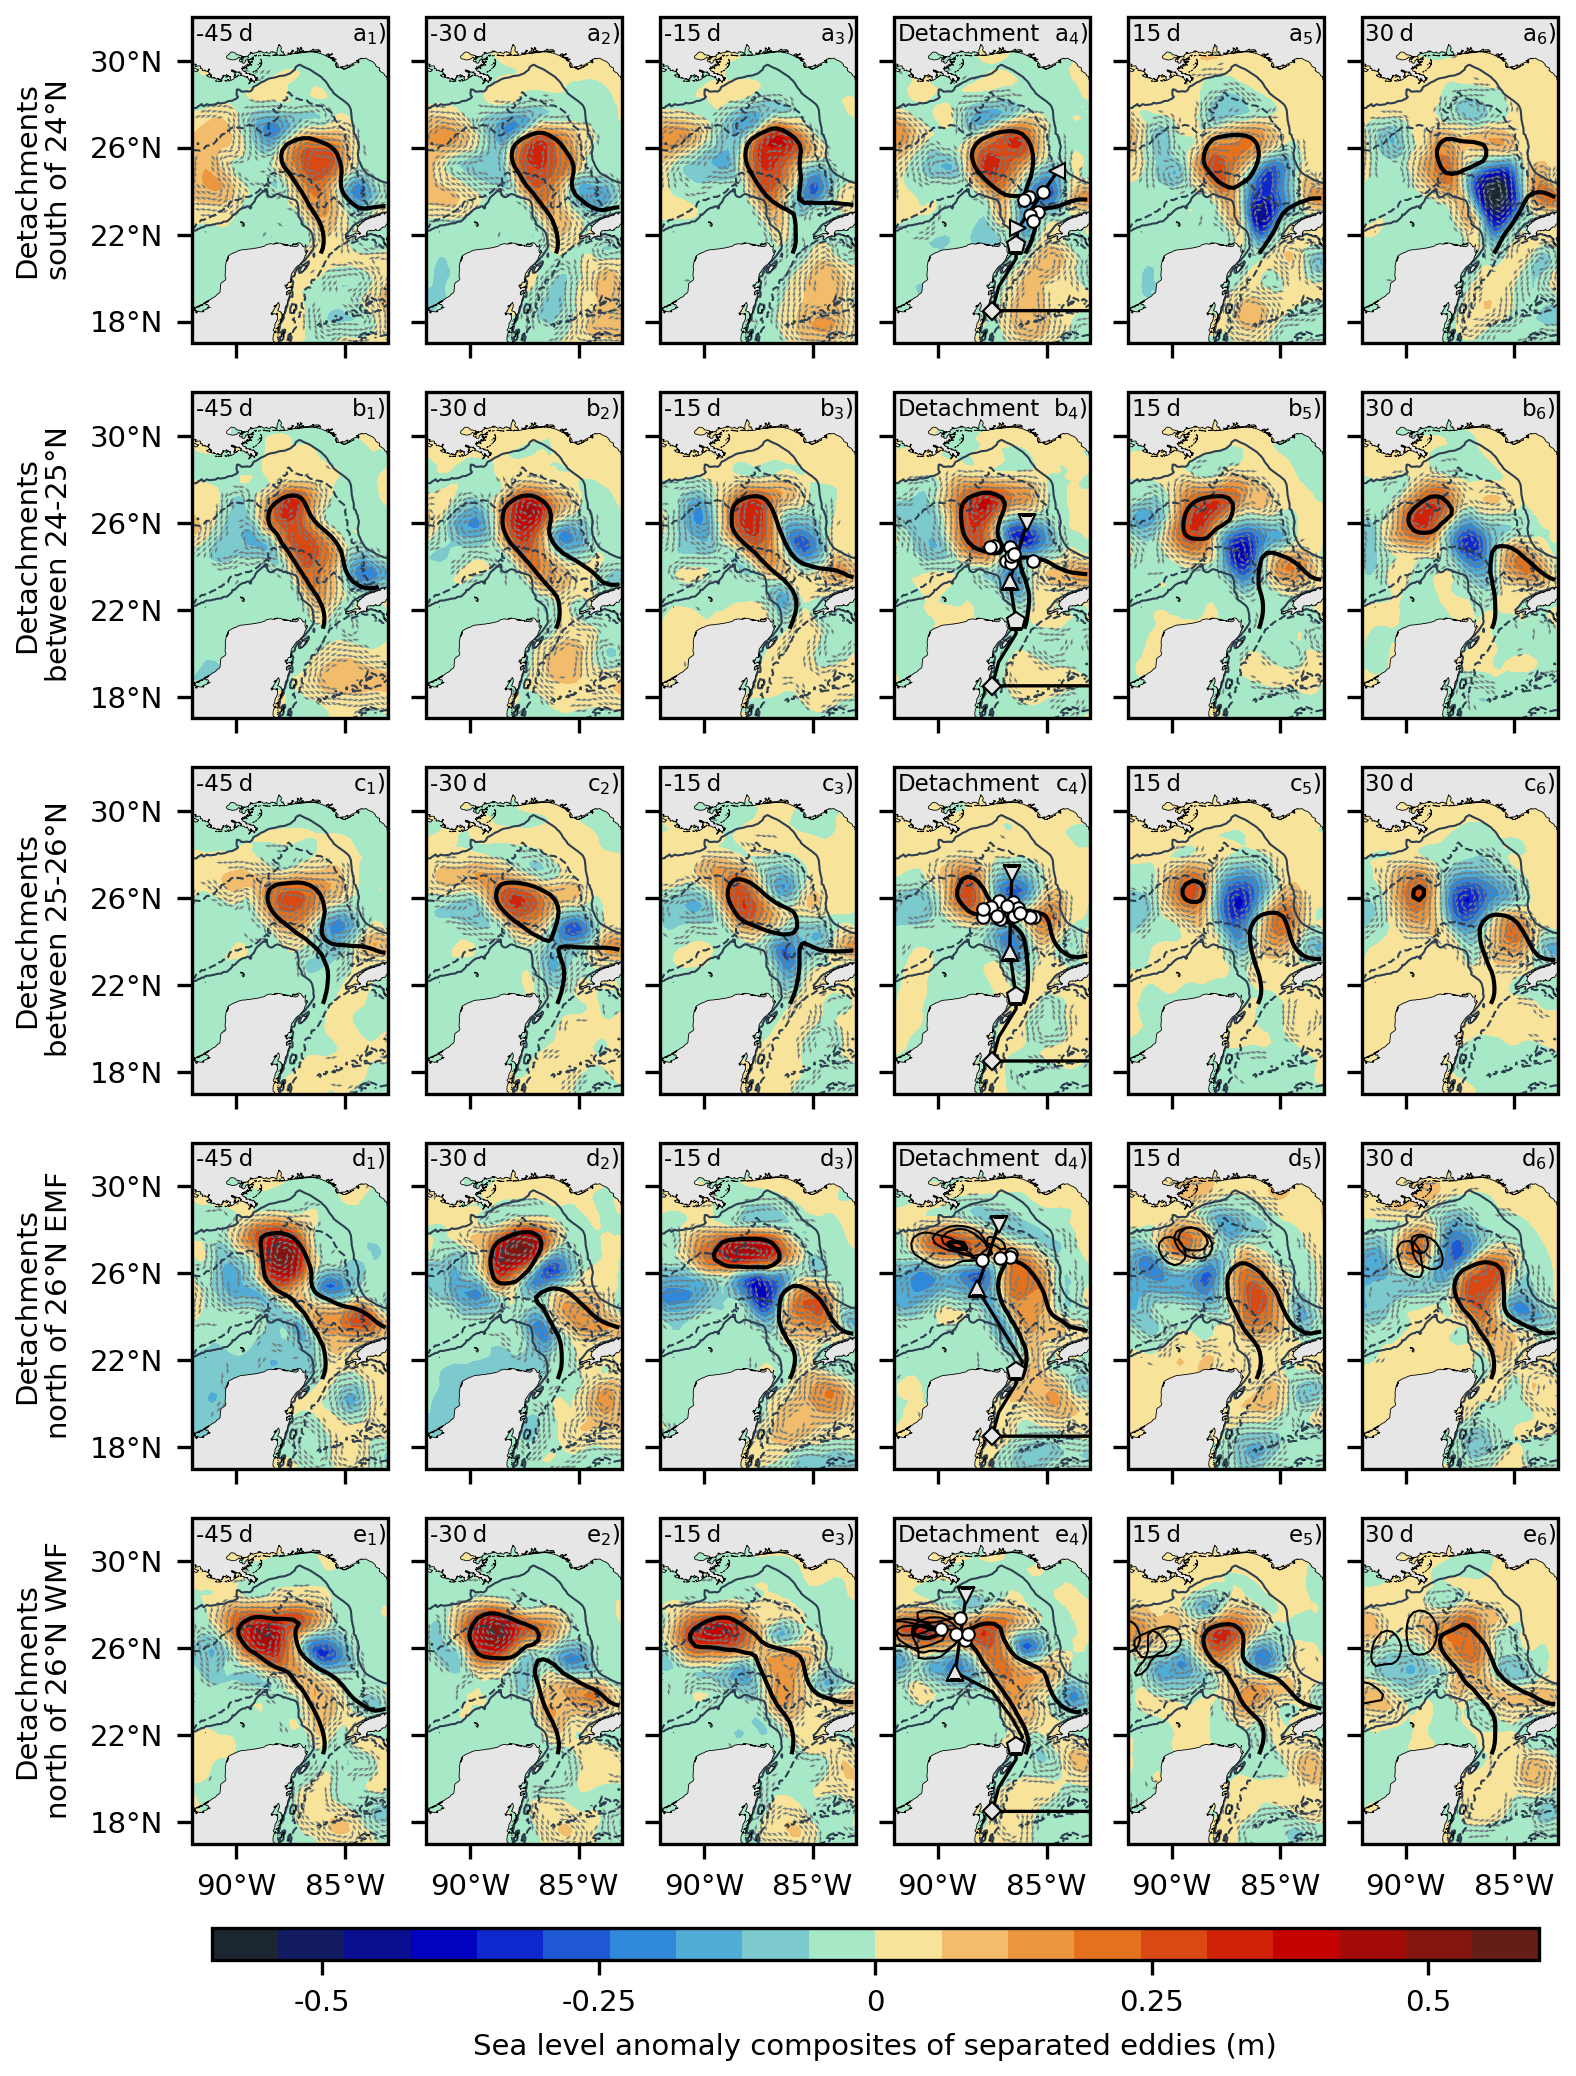
Figure 4Time evolution of SLA during LCEs separation south of 24° N (a1–a6), between 24–25° N (b1–b6), between 25–26° N (c1–c6), as well as separations north of 26 occurring west (WMF; d1–d6) and east (EMF; e1–e6) of the Mississippi Fan. Thick contours represent the composite LC and detached LCEs. Thin contours in the last three columns of separations north of 26° represent the LCEs for each detachment case in the region. The gray arrows depict the direction of surface geostrophic currents with speeds stronger than 0.1 m s−1. White circles represent the LC outermost position after detachment events used for the composites. The light gray contours refer to the 200 m (continuous) and 2500 m (dashed) depths.
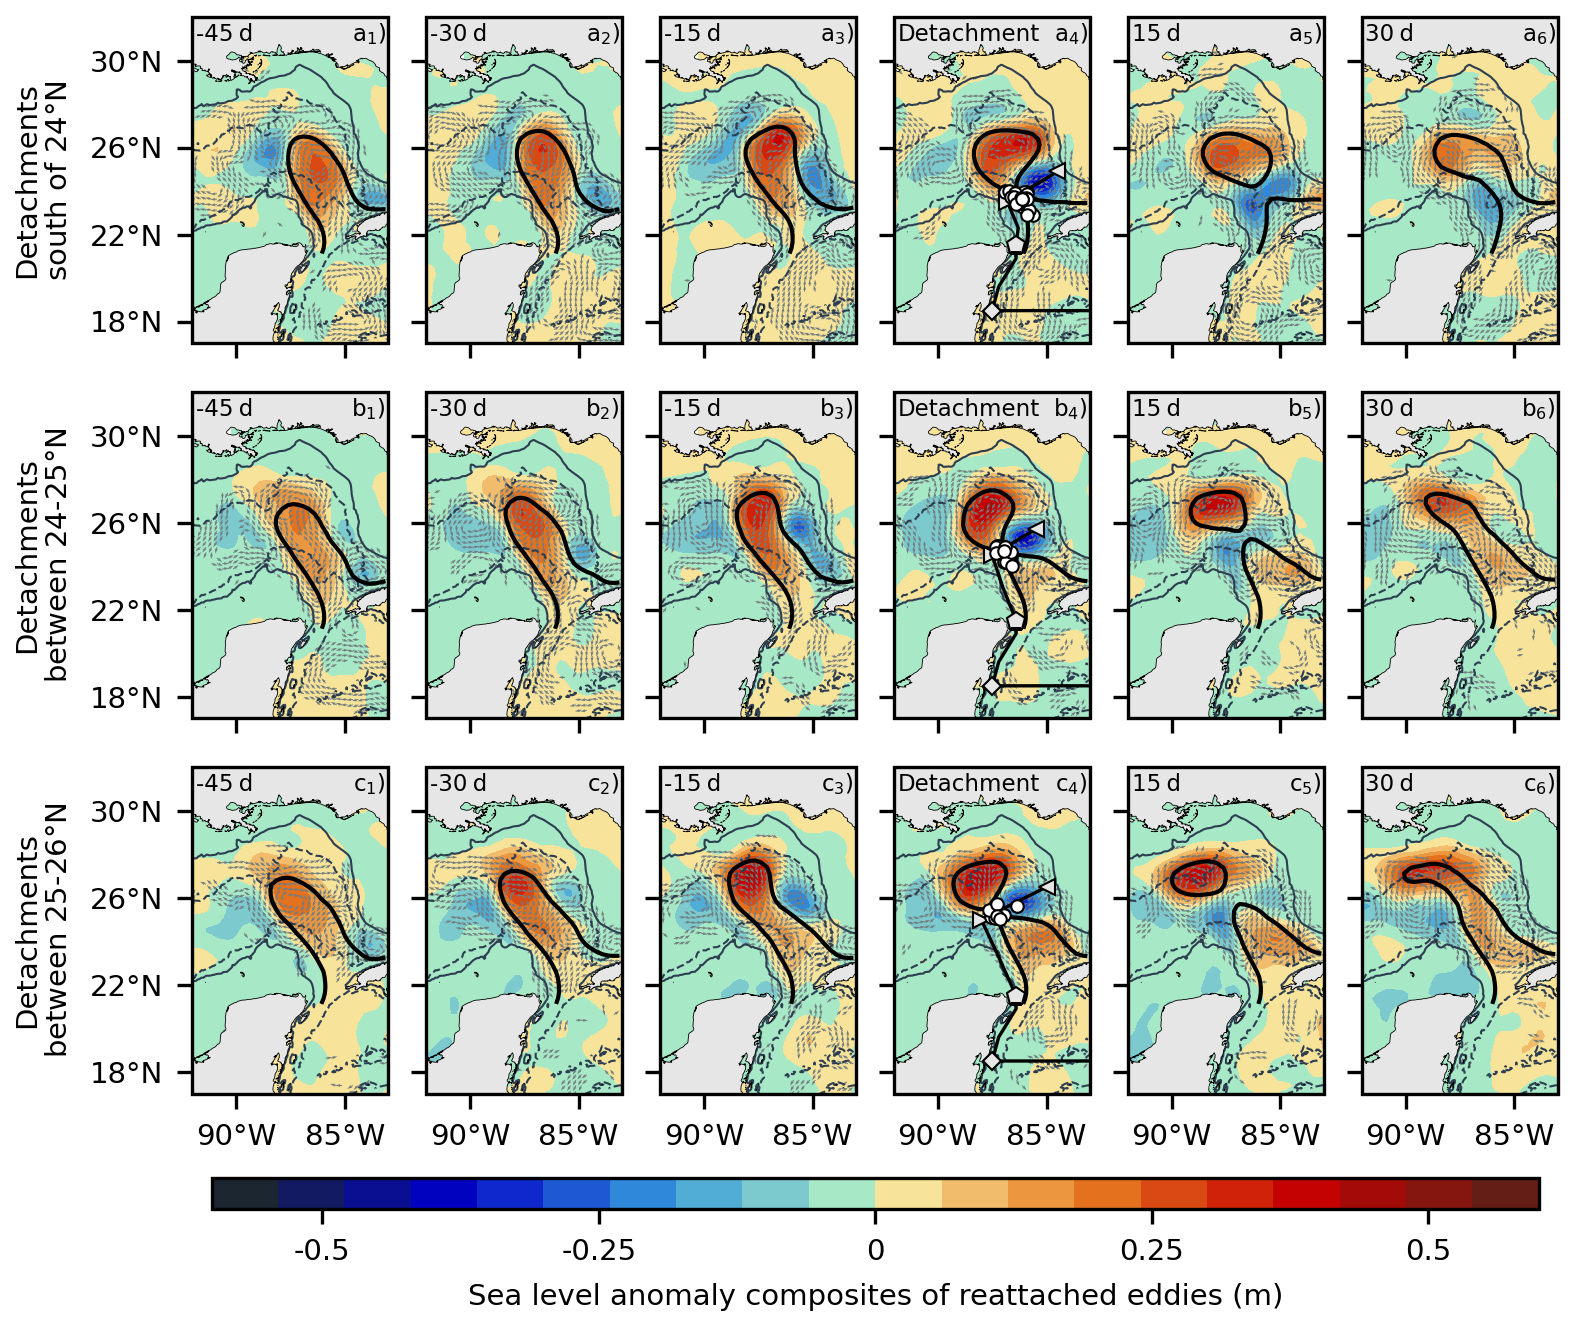
Figure 5SLA composites related to detachments occurring south of 24° N (a1–a6), between 24 and 25° N (b1–b6), and between 25 and 26° N (c1–c3), that turn into reattachment events. Continued tick black contours represent the LC composite (ADT 17 cm). White circles in the fourth column represent the LC outermost position after detachment events used for the composites. The gray arrows depict the direction of surface geostrophic currents with speeds stronger than 0.1 m s−1. The light gray contours refer to the 200 m (continuous) and 2500 m (dashed) depths.
In order to investigate in more detail the relationship between the separation of LCEs and the presence of cyclonic eddies, we compare time-evolution SLA composites of separation and reattachment events from 45 d before to 30 d after detachment (Figs. 4 and 5). Corresponding time-evolution composites related to Rossby number and the occurrence of cyclonic eddies for separation events are shown in Figs. A2 and A3, respectively. The time window in time-evolution composites was chosen since 80 % of the detached eddies are reabsorbed by the LC within 30 d (Fig. A11). South of 26° N, in the days leading up to a detachment, whether it results in reattachment or separation, cyclonic eddies east of the Florida Shelf grow in size and contribute to a narrowing of the LC neck (first three columns in Figs. 4 and 5). This pattern suggests that the intensification of a cyclonic eddy between the LC and the Florida Shelf contributes to eddy shedding events. This intensification has been linked to the merging of frontal eddies by Le Hénaff et al. (2012). In addition, during separation events, there is a second cyclonic eddy west of the LC that is present in all cases and is strongest around the time of detachment (fourth column in Fig. 4). This eddy appears ∼15 d before separation in the 24-25° N cases (Fig. 4b3) and earlier in the 25–26° N cases (from −30 to −15 d; Fig. 4c2 and c3). The development of these western cyclonic eddies alters the shape of the LC during eddy detachment and contributes to the final separation by effectively “pinching off” the LC from both sides (Schmitz, 2005). Specifically, cyclonic eddies west of the LC are associated with a westward shift of the LC away from the Campeche Bank (first fourth columns in separations south of 26° N in Fig. 4; Zavala-Hidalgo et al., 2003; Sheinbaum et al., 2016), a configuration not observed during reattachment events (first fourth columns in Fig. 5).
There is a difference in the separation processes that occur south of 25° N and between 25–26° N that we believe can be largely attributed to the position of the cyclonic eddies east and west of the LC. For separations south of 25° N, the eastern cyclonic eddy is located near the Dry Tortugas (between 22–26° N and 84–87° W; Fig. 4a3–a4 and b3–b4) and is often referred to as a Tortugas Eddy (Fratantoni et al., 1998). In these cases, the coexistence of a Tortugas Eddy east of the LC and a cyclonic eddy west of the LC promotes LCE separation through a classical pinch-off mechanism. In contrast, during separations occurring between 25–26° N, no Tortugas eddies are present east of the LC. Instead, the eastern cyclonic circulation develops northeast of the LC, between 26–28 and 85–87° N (Fig. 4c3 and c4). In these cases, the western cyclonic eddy appears to play a different role: its interaction with the LC shifts the current eastward toward the Florida Strait, partially obstructing the westward propagation of trailing cyclonic eddies. This obstruction favors the merging of frontal cyclonic eddies northeast of the LC, leading to the formation of a northeast cyclonic eddy that participates in the detachment process. The merging of frontal eddies northeast of the LC has been documented by several authors, including Zavala-Hidalgo et al. (2003), Le Hénaff et al. (2012), and Hiron et al. (2020).
For separations occurring north of 26° N, they occur mostly east or west of the Mississippi Fan (Fig. 1c), and we therefore make a geographical distinction when making the composites. In all cases, during the 45 d leading up to detachment, cyclonic eddies are observed to migrate northward between the Campeche Bank and the western edge of the LC at the same time that cyclonic eddies are present northwest of the Florida Shelf (Fig. 4d1–d3 and e1–e3). For separation events occurring east of the Mississippi Fan, composites show a recurring intensification of cyclonic eddies northwest of the Florida Shelf, which associates with detachment and reattachment events during the 30 d preceding the final detachment (Fig. 4d1–d3). During this time period, cyclonic eddies on both sides of the LC merge into a large cyclonic eddy west of the LC, near 25° N (Fig. 4d2 and d3). Final detachment of LCEs occurs when the cyclonic eddies “pinch off” the LC from both sides. The process is very similar for separations occurring west of the Mississippi Fan, but the main difference is that once an LCE is formed, it never reattaches (Fig. 4e1–e6). Reattachments can occur when the LCE is formed east of the Mississippi Fan since the separation point is east of the main axis of the LC (Fig. 1c).
The above results highlight the role of cyclonic eddies in favoring the detachment of LCEs. In order to get insights as to why LCEs detached by a single cyclonic eddy east of the LC are more likely to reattach south of 26° N, while those detached by cyclonic eddies on both sides of the LC are more likely to separate, we now analyze composites up to 30 d following a detachment (fifth and sixth columns in Figs. 4 and 5).
In the days after a separation occurring south of 26° N (final detachment), all lagged composites at days 15 and 30 show the presence of large cyclonic features acting as barriers between the LC and LCEs (Fig. 4a5–a6, b5–b6 and c5–c6). These large cyclonic features typically result from the merging of cyclonic eddies originating from both sides of the LC neck, and their presence appear to prevent the LC from reattaching to the detached eddies. These cyclonic structures (hereafter referred to as barrier eddies) have been documented in several observational studies. For instance, Zavala-Hidalgo et al. (2003, 2006) showed that they can last up to nine months and that they may play a significant role in inhibiting the LC penetration into the GoM for several months. The authors suggest that, by leaking mass and energy from the LC, barrier eddies may contribute to delay in the LC penetration into the GoM. By contrast, when there is only one cyclonic eddy east of the LC at the time of detachment, it is not strong enough to prevent the LCE from reattaching to the LC (fifth and sixth columns of Fig. 5).
To further illustrate the relationship between the occurrence of barrier eddies and the lack of LC northward penetration after separation, we analyze the barrier eddy persistence by generating a histogram of their spatial distribution and residence time between separation events (Fig. 6a–c). The analysis is limited to separation events south of 26° N. It is important to note that barrier eddies arise from the gradual merging of multiple cyclonic eddies, which do not necessarily merge simultaneously. This results in significant variability in their shape, size, and intensity during their evolution, potentially explaining why traditional eddy detection algorithms often fail to classify them as eddies, despite their persistence for more than 30 d (last two columns in Fig. 4a–c). This is the case of the Mesoscale Eddy Trajectory Atlas of AVISO (Pegliasco et al., 2022), where only a few such barrier cyclonic structures are detected 30 d after detachments between 24 and 26° N (last column in Fig. A3a–c), even though they display a strong and persistent signature in the SLA field (last column in Fig. 4a–c). To identify barrier structures more reliably, we adopt the −28 cm ADT contour method to detect cyclonic frontal eddies proposed by Hiron et al. (2020), but focusing on cyclonic features that appear after detachments, with a minimum diameter of 200 km, and a maximum distance of 85 km between the LC contour (17 cm ADT contour) and the perimeter of the cyclonic feature. It is important to note that this size constraint limits the analysis to larger structures, yet it facilitates a clear distinction between barrier structures and other frontal eddies. Both mean and median persistence times indicate that barrier eddies last up to nearly 5 months northwest of the LC after separations that occurred south of 24° N, about three months and a half after separations between 24 and 25° N, and one month after separations between 25 and 26° N (Fig. 6a–d). Furthermore, the LC does not penetrate into the GoM four months (thin dashed line) after separation events south of 24° N, three months (thin black line) after separations between 24 and 25° N, and one month (thick black line) after separation between 25 and 26° N (Fig. 6a–c). This suggests that the further south the detachment occurs, the longer the barrier eddy tends to persist, possibly preventing an LC extension into the GoM. For separations north of 26° N, the barrier eddy does not last and does not have any impact on the LC evolution. Barrier eddies may help explain why, as noted in Leben (2005) and Lugo-Fernández and Leben (2010), southern separations are typically followed by longer separation periods.
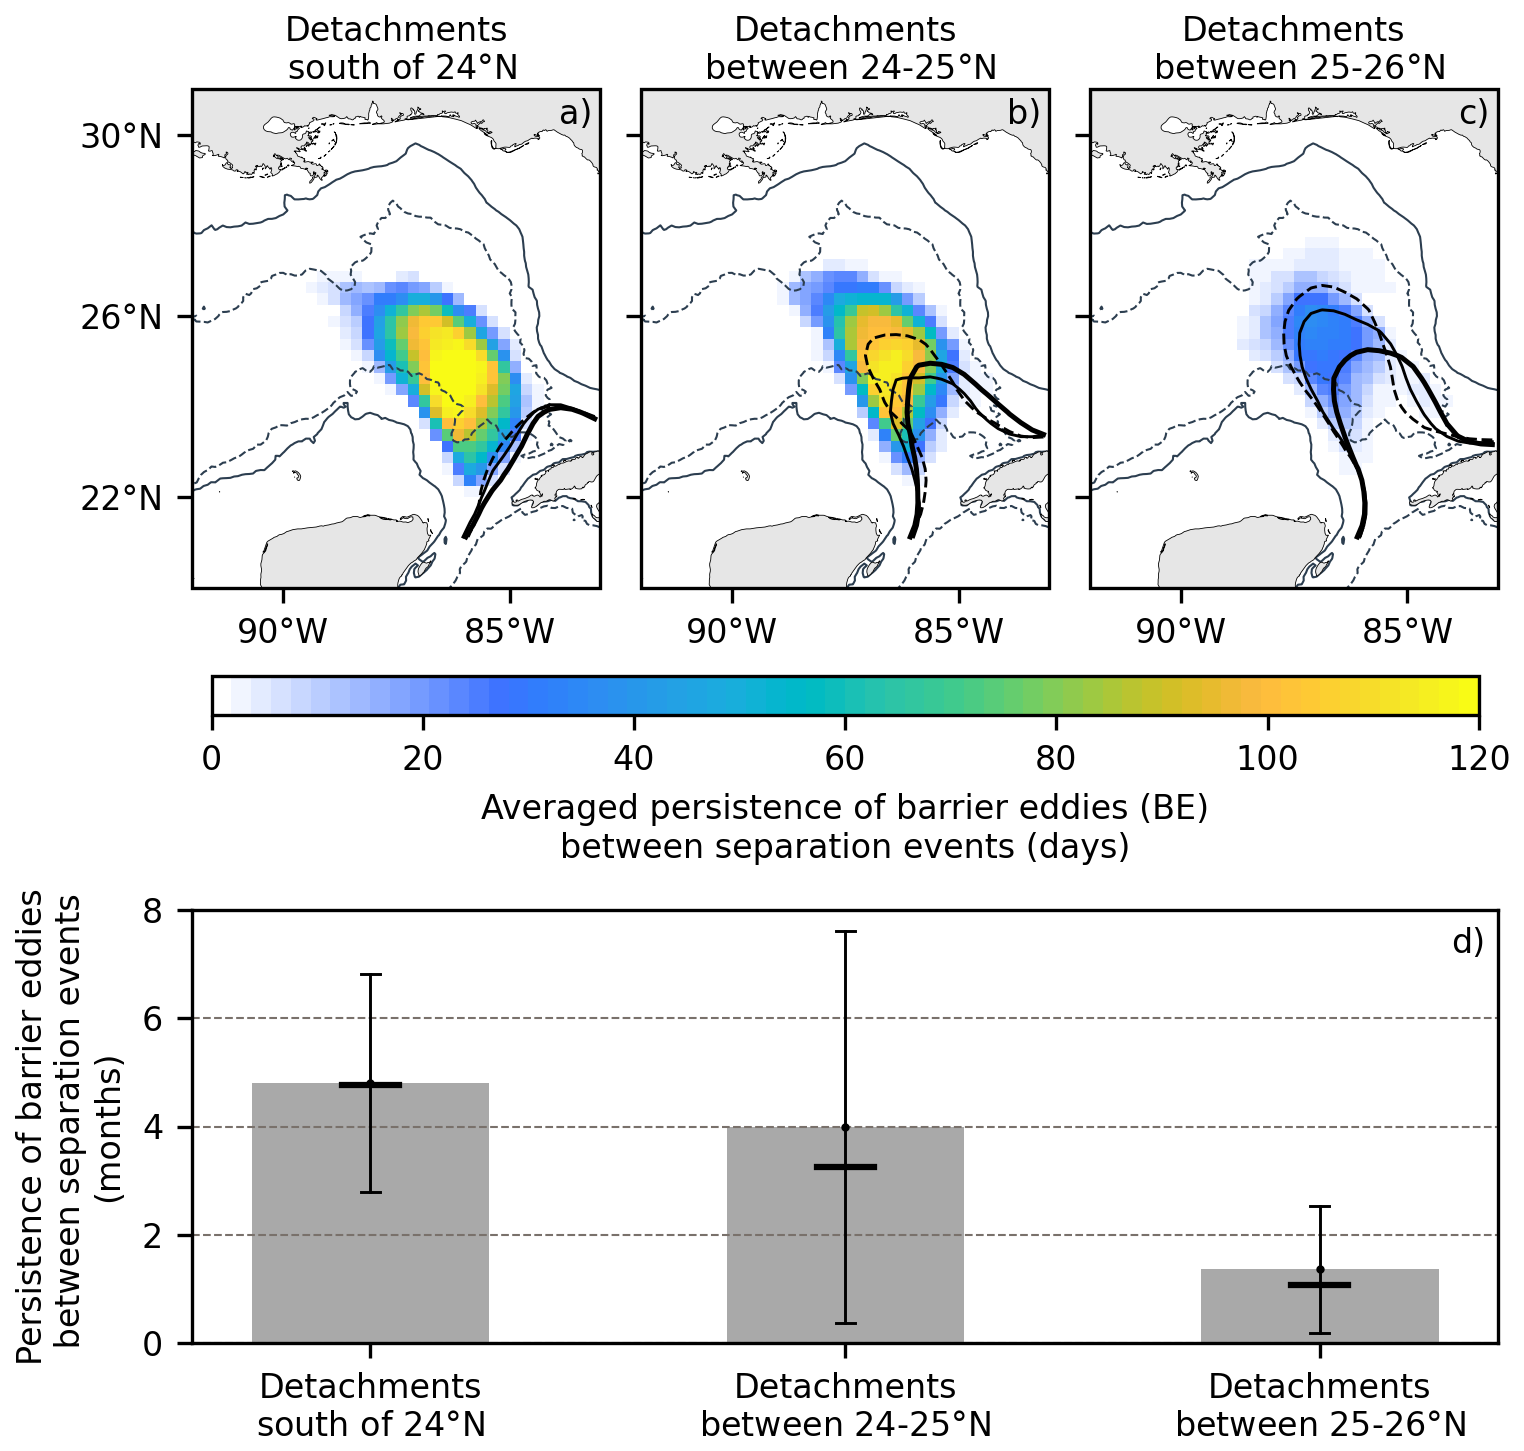
Figure 6Averaged persistence of barrier eddies between separation events occurring south of 24° N (a), between 24–26° N (b), and between 24–26° N (c). Segmented black contours indicate the composite LC position one month after LCE detachment, while thin and thick black contours represent the composite LC positions three and four months after detachment, respectively. The light gray contours refer to the 200 m (continuous) and 2500 m (dashed) depths. The mean, median, and standard deviation of the persistence of barrier eddies for each region are shown in (d).
From the analysis above, cyclonic eddies on the west side of LC potentially facilitate the final detachment of an LCE, and the question then arises as to their origin. Are they formed locally, or are they advected from the Caribbean Sea? This question has been the subject of several studies over the years. Candela et al. (2002); Athié et al. (2012), and Jouanno et al. (2016) show that several LCE separation events coincide with the propagation of Caribbean eddies into the GoM. In contrast, Yang et al. (2023b) use an ensemble of numerical simulations for the 2010 detachment of the LCE Franklin, in which different ensemble members are generated by perturbing empirical orthogonal function modes of the circulation, leading to variations in the amplitude and structure of cyclonic eddies east of the Loop Current. They find that the occurrence of strong and large cyclonic eddies east of the LC can promote the formation of a cyclonic eddy west of the LC, which significantly affects the timing and occurrence of the LCE detachments.
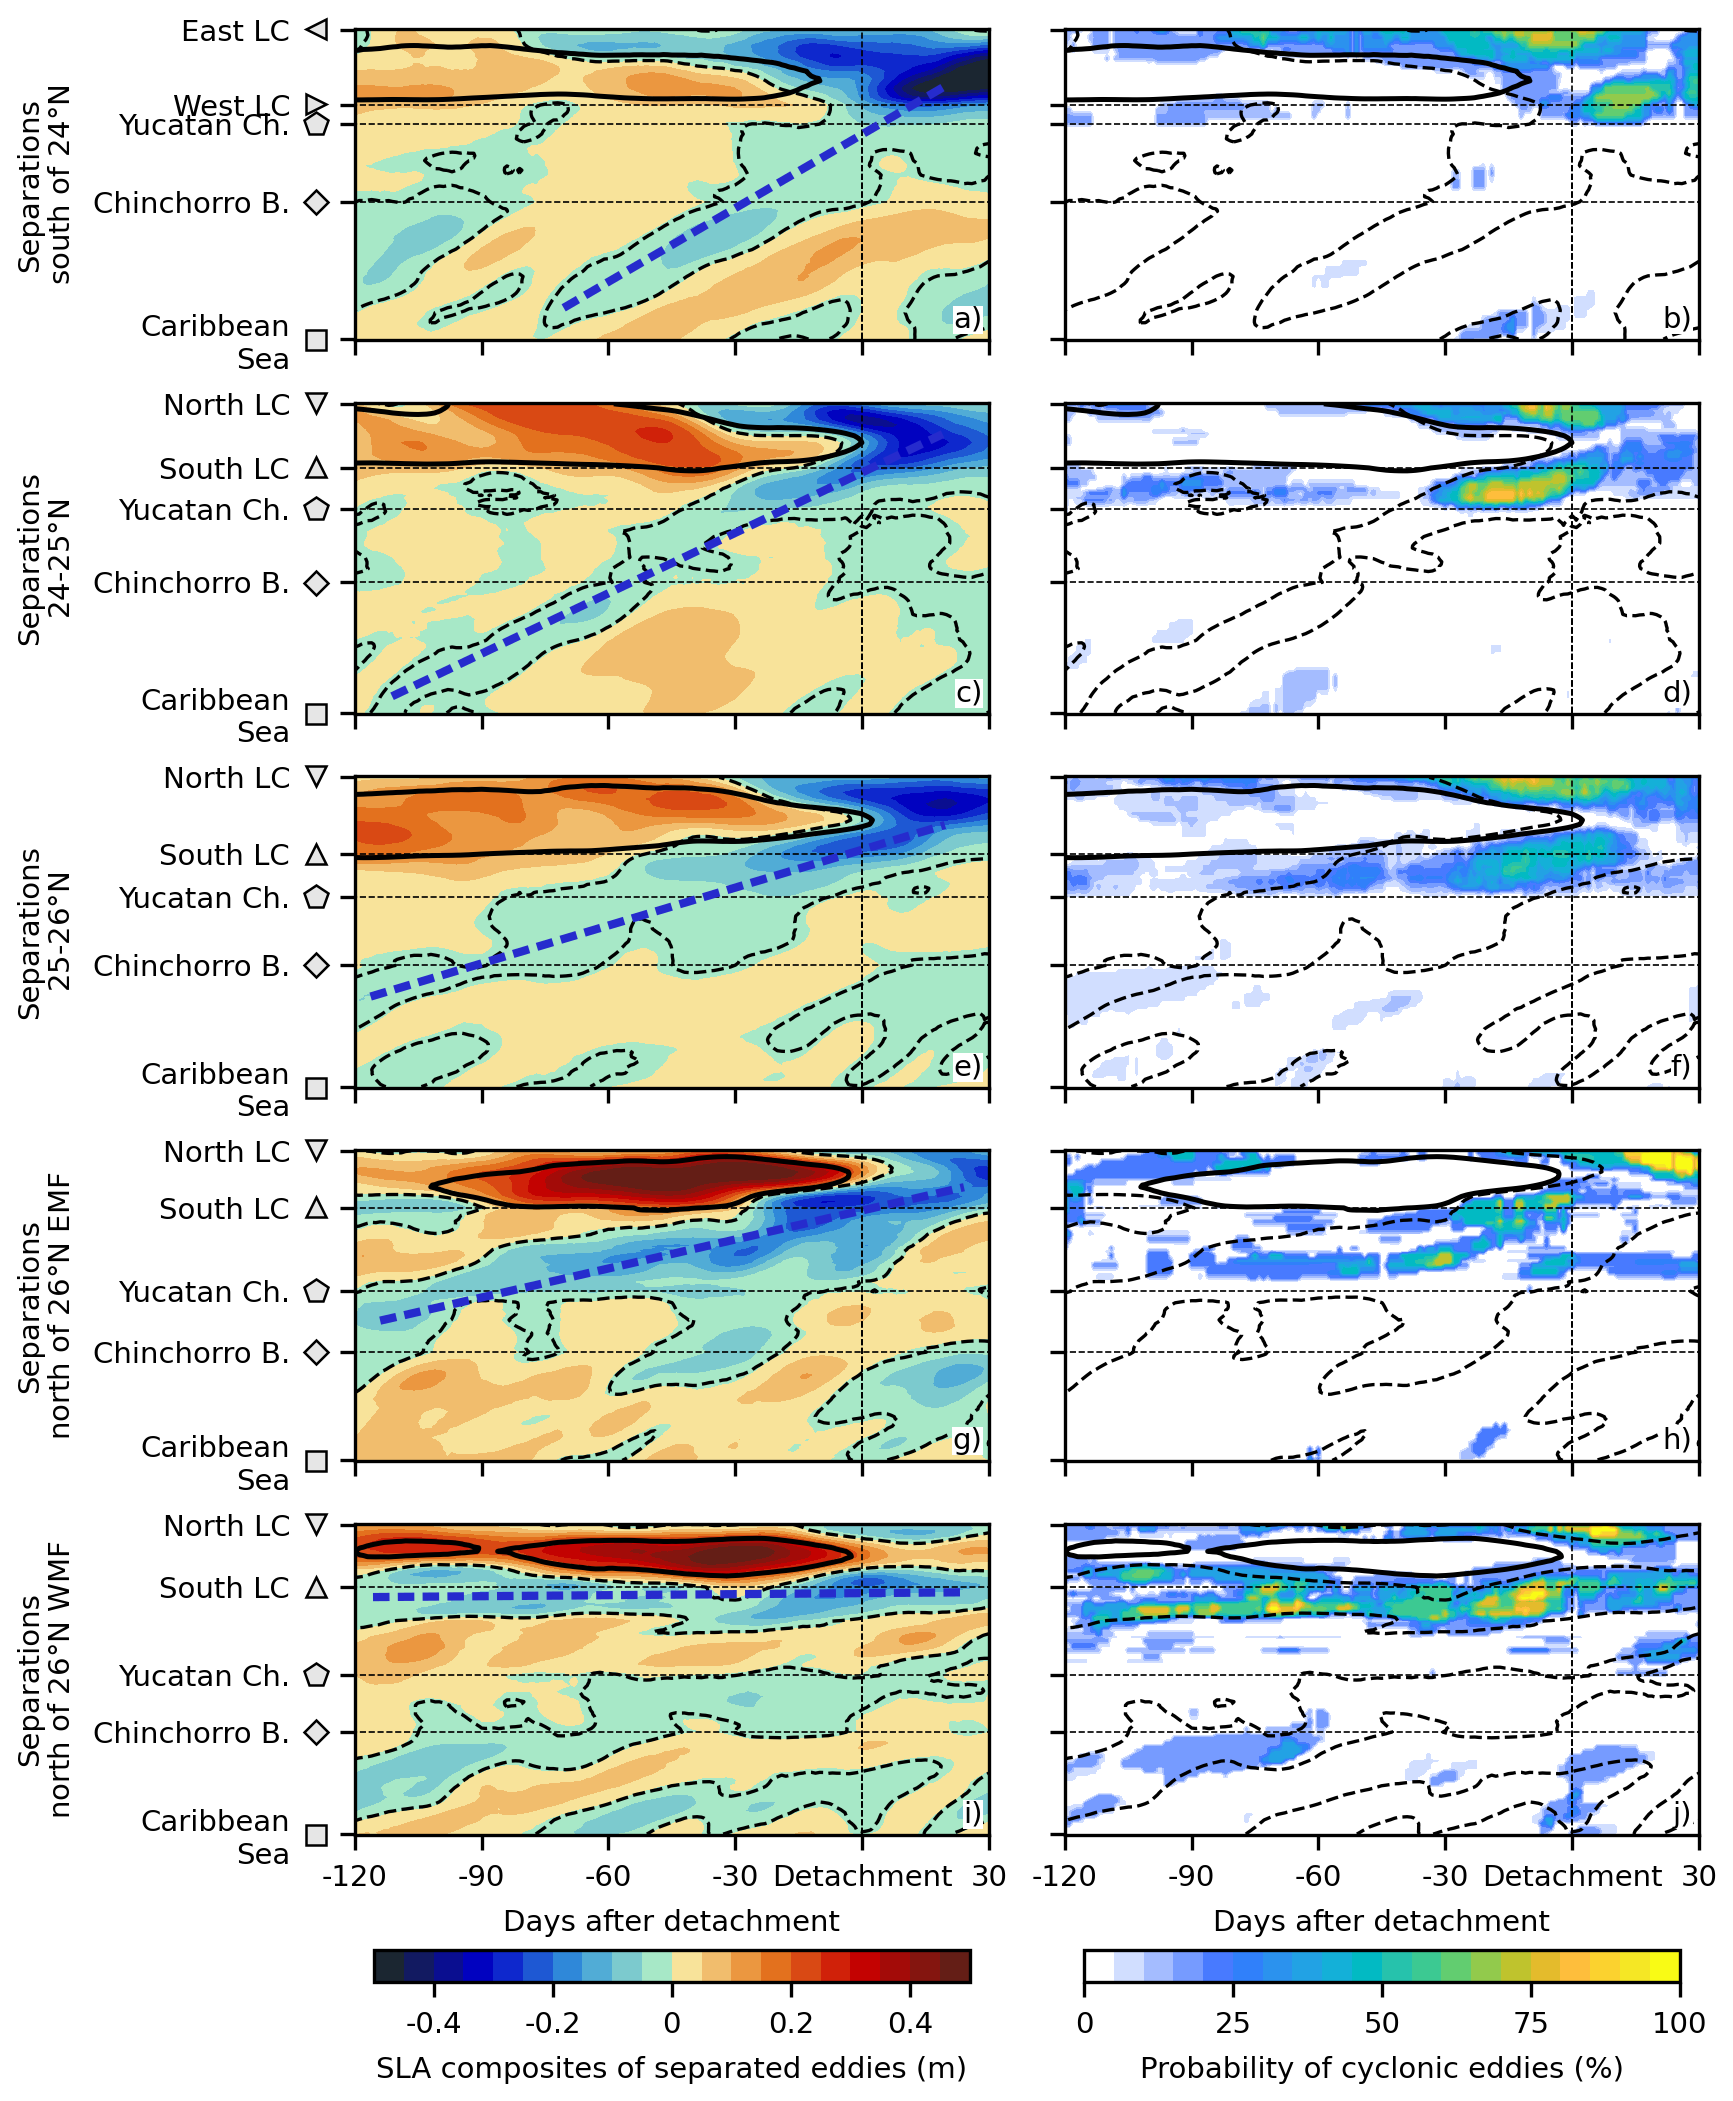
Figure 7Hovmöller composites of SLA (a, c, e, g, i) and the occurrence of cyclonic eddies from the AVISO Atlas (b, d, f, h, j) during separations occurring south of 24° N (a, b), between 24-25° N (c, d), between 25–26° N (e, f), north of 26° N and west of the Mississippi Fan (WMF) (g, h), and north of 26° N and east of the Mississippi Fan (EMF) (i, j). Thick continuous-black contours represent the composite LC (ADT 17 cm). Thick segmented-black contours depict cyclonic anomalies. Thick segmented-blue contours depict the SLAs propagating from the Caribbean Sea to the GoM. Thin vertical segmented lines exhibit the detachment of LCEs. Horizontal segmented lines indicate the location of the Chinchorro Bank, Yucatan Channel, and the southern region of the LC (western region of the LC in (a).
To provide additional insight into the origin of western cyclonic structures during LCE separations, composite Hovmöller diagrams of SLA and the spatial occurrence of cyclonic eddies from the Mesoscale Eddy AVISO Atlas (Pegliasco et al., 2022) were constructed following transects that extend from the Caribbean and Yucatan coasts, crossing the LC at the respective detachment locations, and spanning from 120 d before to 30 d after each detachment (Fig. 7). The transects are shown in the fourth column of Fig. 4. For the separations south of 26° N, the diagrams show the presence of negative SLA anomalies propagating from latitudes as far south as the Chinchoro Bank (e.g., diamond marker in the fourth column of Fig. 1). In each case, these anomalies intensify as they cross the Yucatan Channel, giving rise to cyclonic structures west of the LC. These western cyclonic features can be seen to merge with the cyclonic structures that are located to the north or east of the LC, giving rise to the barrier eddies described in the previous section. There is a striking difference in the path of the negative SLAs as a function of latitude. For southern separations, the cyclonic features can be detected as far south in the middle of the Caribbean Sea, while for northern separations, they are generated locally in the GoM, north of the Yucatan Channel (see negative SLA trajectories in Fig. 7). Furthermore, there is a huge contrast between the Hovmöller SLA diagrams for separations (Fig. 7) and reattachments (Fig. 8). The signature associated with negative SLAs propagating from the Caribbean, seen in Fig. 7 for separations, is completely absent in Fig. 8 for reattachments (as surmised from the analyses of the composites).
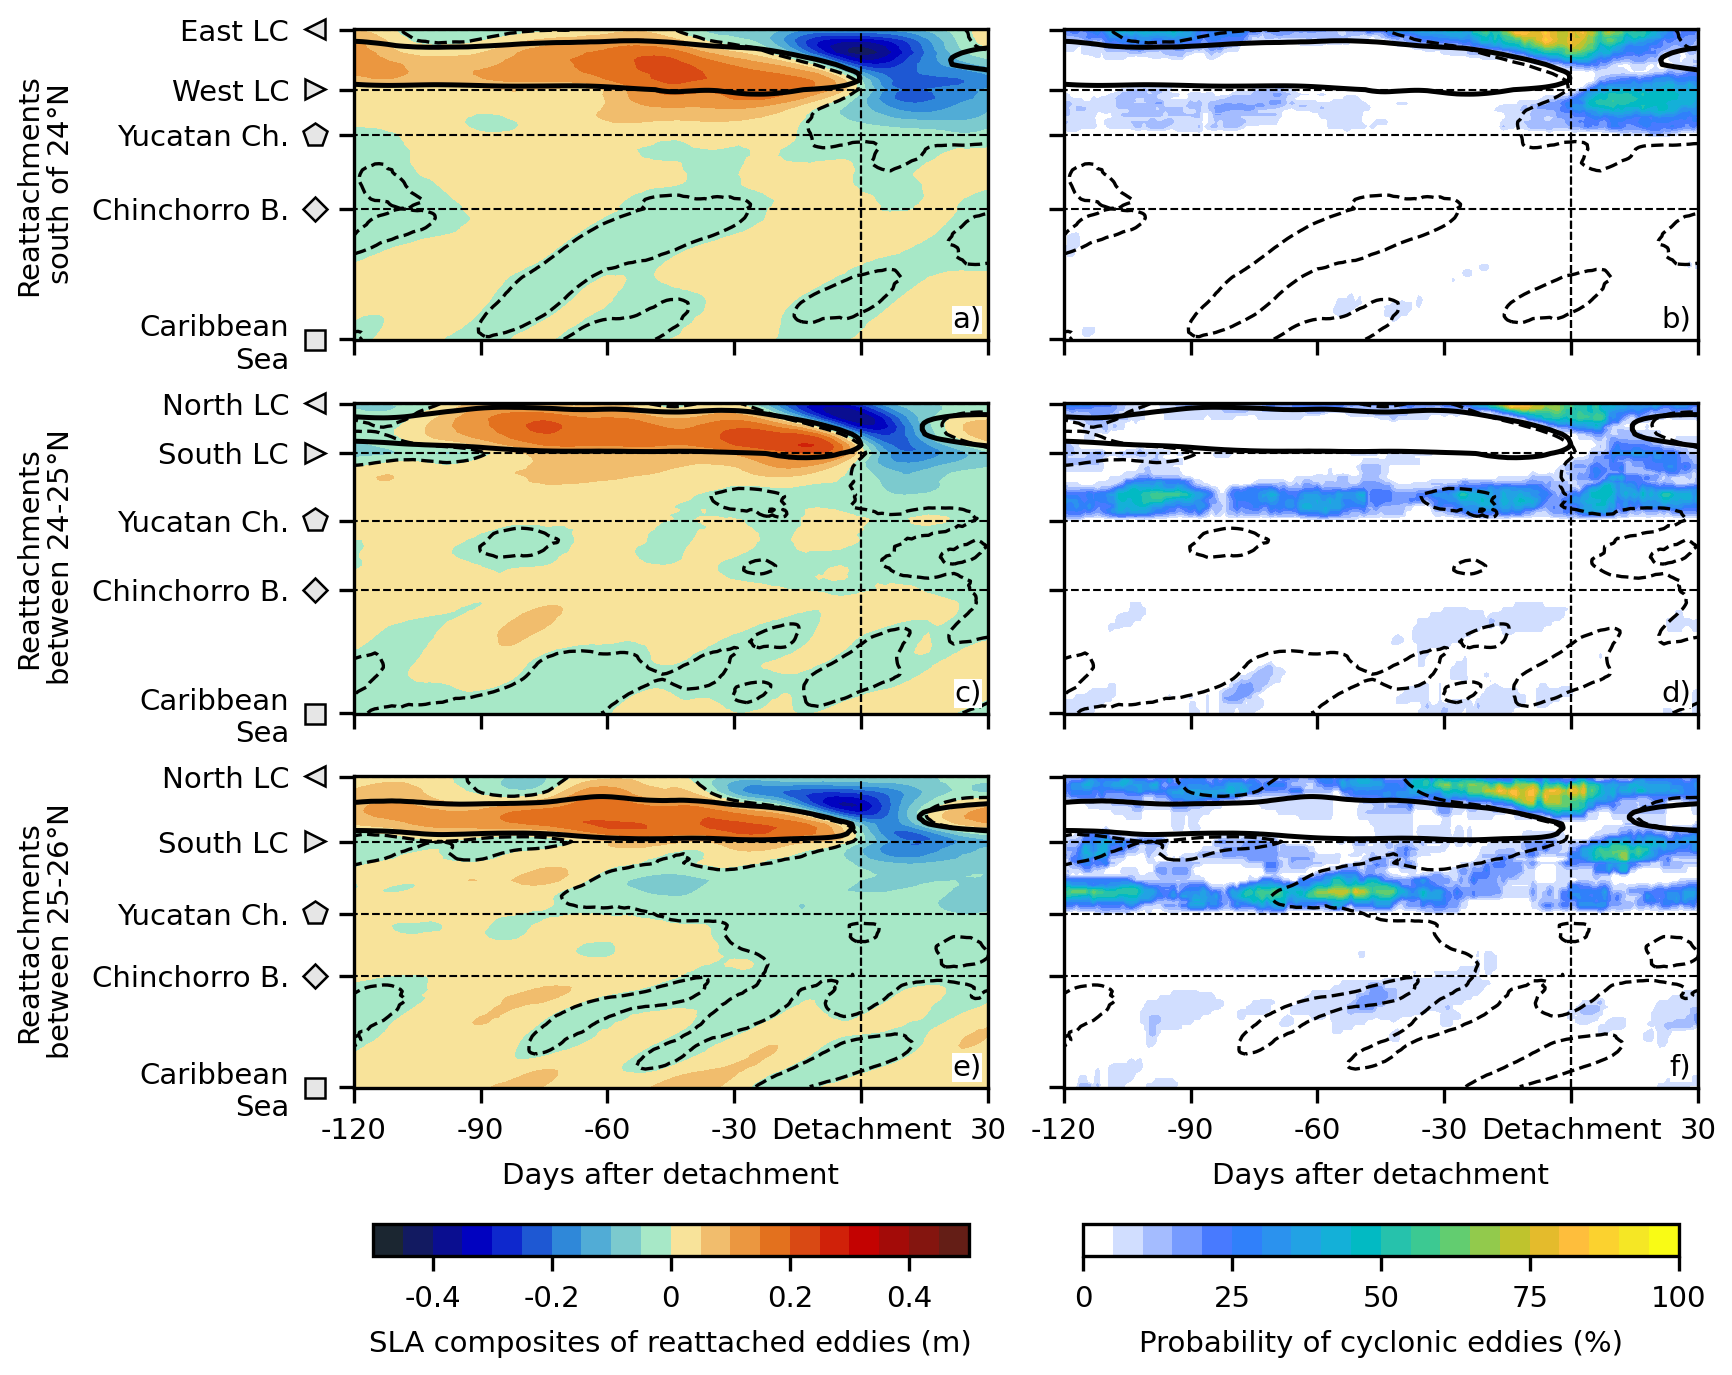
Figure 8Hovmöller composites of SLA (a, c, e) and the occurrence of cyclonic eddies from the AVISO Atlas (b, d, f) during reattachments occurring south of 24° N (a, b), between 24–55° N (c, d), and between 25–26° N (e, f). Thick continuous-black contours represent the composite LC (ADT 17 cm). Thick segmented-black contours depict cyclonic anomalies. Thin vertical segmented lines exhibit the detachment of LCEs. Horizontal segmented lines indicate the location of the Chinchorro Bank, Yucatan Channel, and the southern region of the LC (western region of the LC in (a).
The above Hovmöller composites clearly show northward propagation of negative SLAs from the Caribbean Sea, but how do we ensure that they are associated with eddies? From the Mesoscale Eddy AVISO Atlas, mesoscale eddies can be detected on the negative SLA propagation prior to the separation, but only in the GoM (right column of Fig. 7). There are well-known limitations in the construction of the gridded datasets used to track eddies from altimetry (Chelton et al., 2011; Hogg et al., 2015; Amores et al., 2018; Archer et al., 2020) and the amplitude of mesoscale eddies can be underestimated when interpolating from altimetric tracks to gridded data (Hogg et al., 2015). This is the case for Caribbean eddies, as shown by the comparison of the CMEMS SLA estimations from AVISO with those from the new satellite mission SWOT (Surface Water and Ocean Topography; Morrow et al., 2019). Negative SLA anomalies associated with Caribbean cyclonic structures are clearly identified in the SWOT data, whereas their amplitude is largely underestimated in the CMEMS data (Fig. 9). Although the SWOT mission provides a more accurate representation of the mesoscale eddies, its 120 km swath and 21 d repeat cycle result in insufficient temporal resolution for tracking the propagation of Caribbean cyclonic eddies. Inclusion of the SWOT data in the CMEMS gridded altimetry products is under development and should lead to an improved eddy atlas. While the SWOT data provides anecdotal evidence that strong cyclonic structures are present in the Caribbean Sea and near the Yucatan Channel (Fig. 9), they do not demonstrate northward propagation. However, in agreement with Sheinbaum et al. (2016) and Athié et al. (2012), Hovmöller diagrams of SLAs in the Yucatan Channel do show significant east-west displacements associated with separations (see 17 cm contour in Fig. 10a–e), which could be signatures of northward propagation of cyclonic features. These displacements are also found by constructing the Hovmöller diagrams of zonal velocities derived from 10 years of current-meter observations from the CANEK program, spanning July 2012 to October 2020 (Sheinbaum, 2002; Athié et al., 2012, 2015; Sheinbaum et al., 2016; Candela et al., 2019; Athié et al., 2020). Although the number of events captured by the in-situ CANEK observations is limited compared to the altimeter record, the time-evolving composites of the current velocities do show an eastward displacement of the LC (Fig. 10f–h) prior to separations with negative velocities west of the main axis of the Yucatan Current, indicative of cyclonic structures. This eastward shift is particularly evident in detachments occurring south of 24° N and between 25 and 26° N. In both cases, negative velocities are observed west of the LC, extending down to depths of 300 m (Fig. 10k–m).
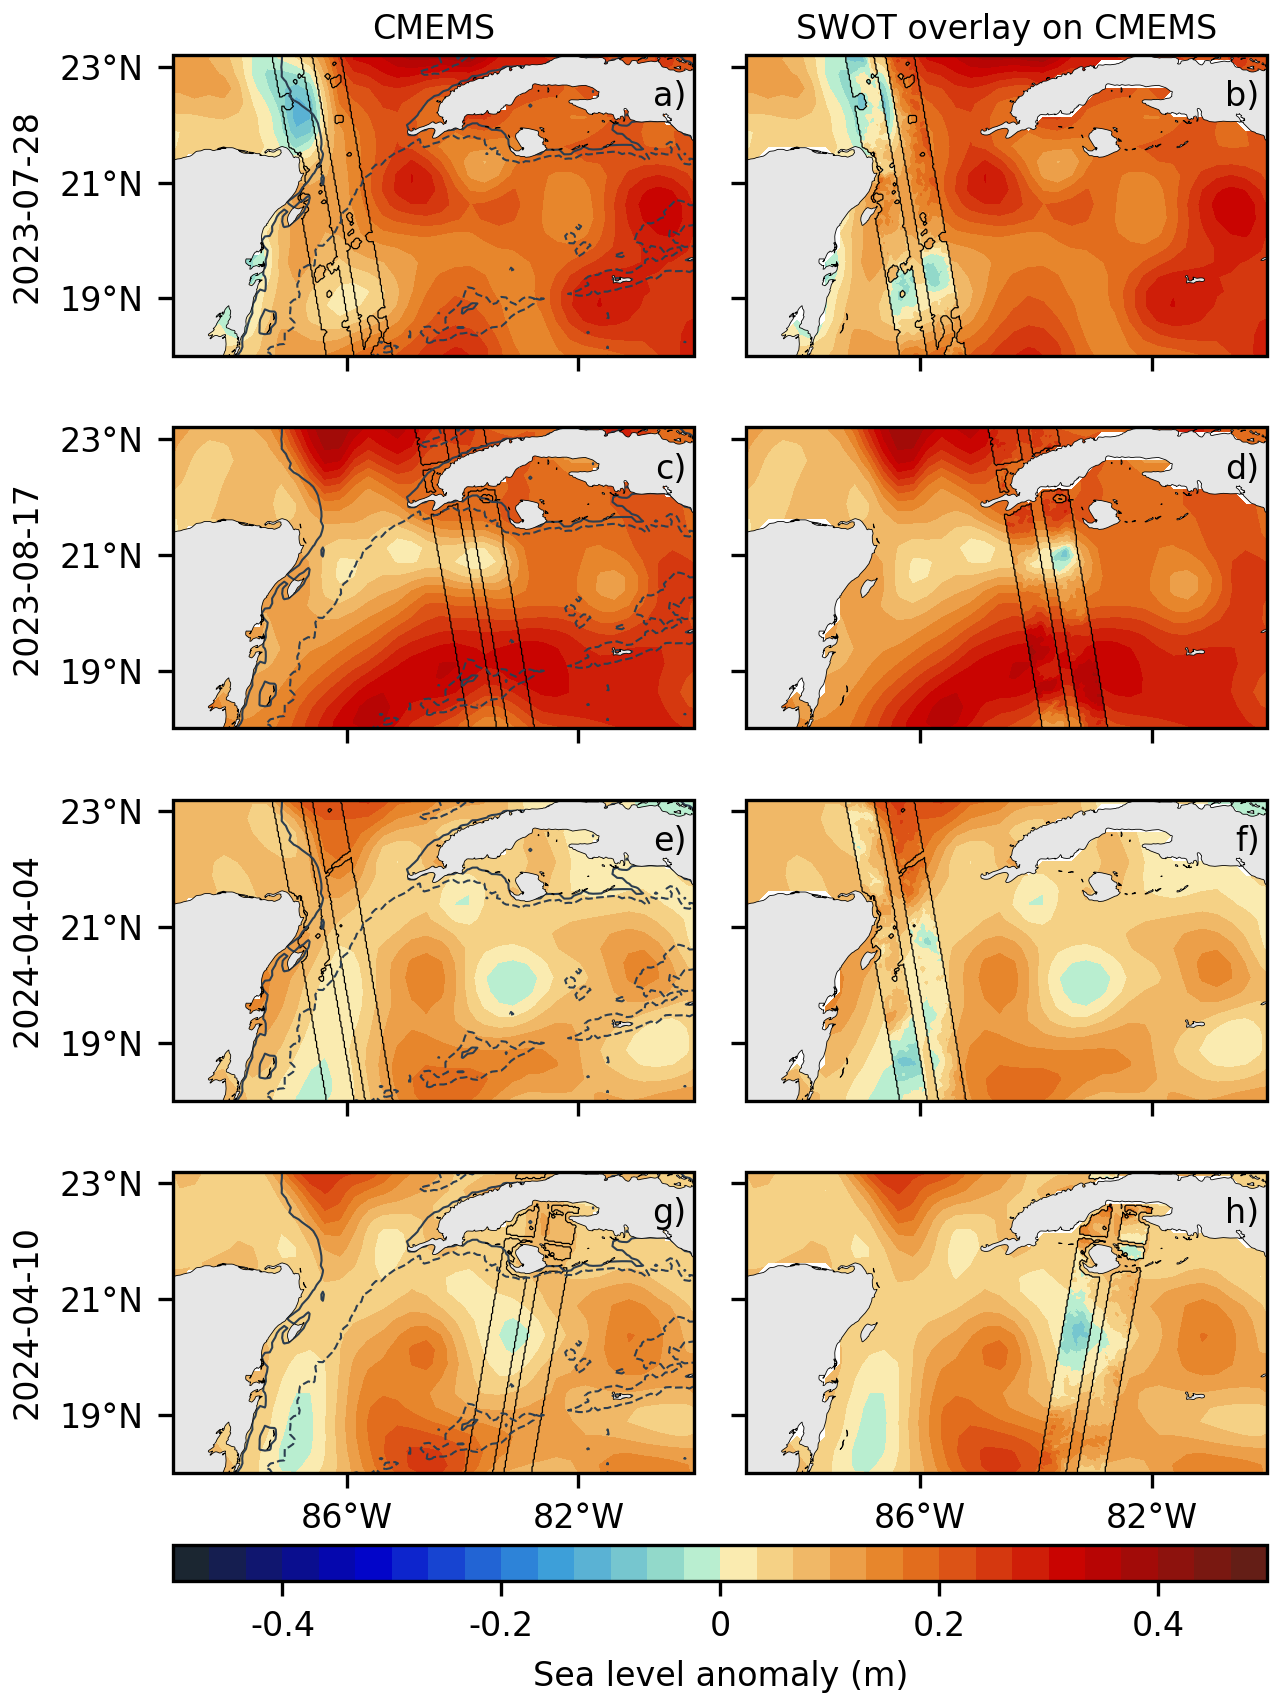
Figure 9Examples of a comparison between SLA estimations between altimetric gridded maps from CMEMS (a, c, e, g) and along-track observations from SWOT (b, d, f, h). Both the first and second columns show CMEMS SLA fields and the spatial extent of the SWOT swath. In the second column, SWOT along-track measurements are additionally overlaid on the CMEMS fields within the swath. Each row refers to a different date. Continuous black contours show the 200 m depth contour, whereas dashed black contours show the 2500 m depth contour. The following describes the differences between the two products. (a, b) Cyclonic structure around 86° W, 19° N that is not visible in CMEMS but is visible in SWOT. (c, d) Cyclonic structure around 84° W, 21° N that is not visible in CMEMS but is visible in SWOT. (e, f) Cyclonic structure around 87° W, 19° N that is not visible in CMEMS but is visible in SWOT. (g, h) Cyclonic structure around 83° W, 21° N with a weak signature in CMEMS but clearly visible in SWOT.
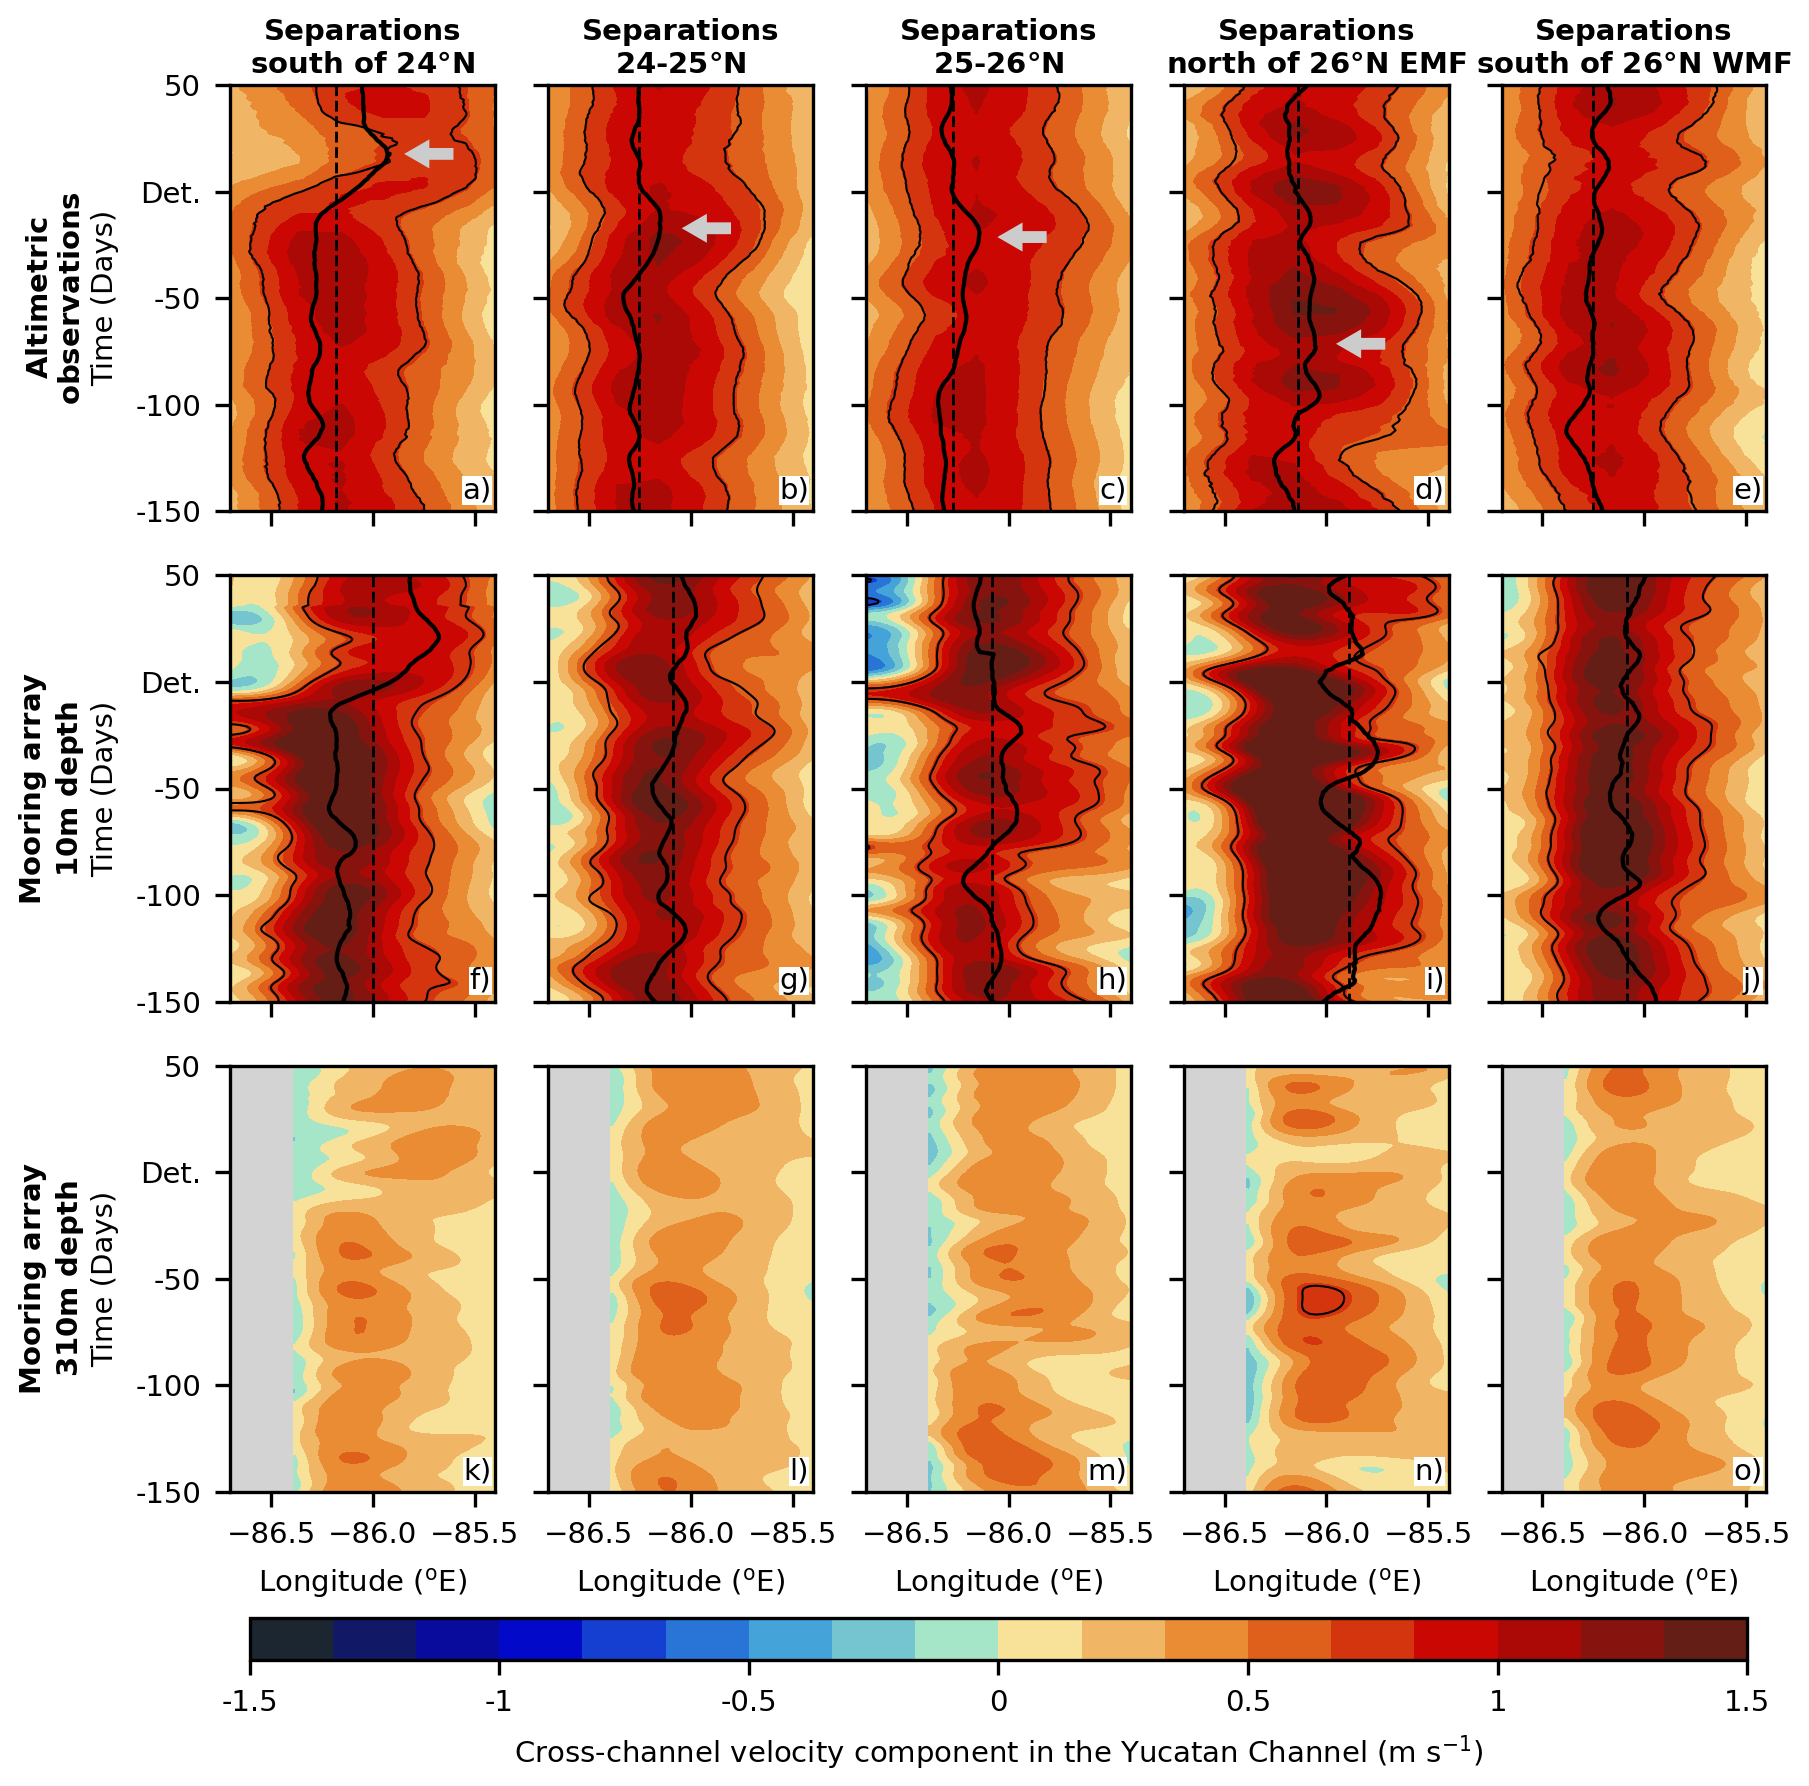
Figure 10Hovmöller composites of the along-channel current velocity component in the Yucatan Channel from CMEMS (a–e) and the CANEK mooring array (10 m depth in f–j and 310 m depth in k–o) during separation events. The columns correspond to separation events occurring south of 24° N (a, f, k), between 24–25° N (b, g, l), between 25–26° N (c, h, m), and north of 26° N but east (EMF; d, i, n) and west (WMF; e, j, o) of the Mississippi Fan. Positive values (red) show northward velocities, whereas negative values (blue) show southward velocities. Thin black curves correspond to the 0.25 m2 s−2 kinetic energy contour corresponding to the cross-channel current velocity, an arbitrary value that helps us to represent the composite LC. Thick black curves correspond to the 17 cm ADT contour from altimetric observations, often used to identify the LC. The thin black segmented line corresponds to the longitude resulting from the time-averaged 17 cm ADT contour between 150 d before and 150 d after the detachment. ADT contours in altimetric observation composites are computed from all separation events between 1993 and 2021 within the respective latitude ranges, whereas in the CANEK composites, the contours are computed from separation events between July 2012 and October 2020. The number of separation events considered to construct the composites from the mooring array data south of 24° N corresponds to 2, between 24–25° N to 3, between 25–26° N to 2, in EMF to 1, and in WMF to 2. Gray arrows depict the occurrence of eastward displacements of the LC.
The mechanisms behind LCE detachment and the fate of the LCEs, including whether they reattach or separate, have been a subject of studies long before altimeter data became available (Elliott, 1982). We now have an unprecedented record of 29 years of altimetry measurements, and its analysis shows that, over that time period, we have 92 LCE detachments, of which 53 (58 %) reattach to the LC and 39 (42 %) truly separate from the LC. Our analysis provides evidence that cyclonic structures are fundamental for the detachment of LC eddies, by pointing out that an LCE detachment will be more likely not to reattach to the LC when cyclonic structures are present on both sides of the LC and “pinch off” an eddy. The main reason for this final detachment and separation is the formation of a large cyclonic structure, which we define as barrier eddy, that results from the merging of the cyclonic features on both sides of the LC. This barrier eddy physically separates the LC from the freshly separated LCE and allows the latter to move westward. Furthermore, this barrier eddy may hinder the LC penetration into the GoM. Barrier eddies can persist after separation for up to several months northwest of the LC, depending on the separation latitude, longest for southern separations and shortest for northern separations. By contrast, LCE detachments associated with intensified cyclonic structures occurring only east of the LC are more likely to reattach since there are no barrier eddies to isolate the freshly separated eddy from the LC. These statistical associations between cyclonic eddies and LCE detachments provide a framework to anticipate future separation events based on the evolving mesoscale circulation, and can guide targeted numerical simulations to explore, for example, the dynamical mechanisms by which barrier eddies limit LC penetration into the GoM.
A key outcome of our analysis is the classification of detachment events as a function of latitude. This basic clustering highlights important differences in the dynamics of LCE separation depending on the latitude at which detachment occurs. Specifically, we find that (i) a minimum length of ∼1800 km for the LC is required before a detachment can occur. This distance corresponds to the LC reaching the Mississippi Fan, a Gulf shelf slope situated southeast of the Mississippi Delta; (ii) South of 26° N, the length of the LC has no influence on the latitude at which detachments occur; and (iii) detached LCEs are much larger when detachments occur in the southern part of the domain, with eddies exceeding 300 km in diameter when detached south of 24° N, compared to around 150 km when detachment locations occur north of 26° N. This is not too surprising since the LC is limited in its northward extent.
We assess that cyclonic anomalies propagating from the Caribbean appear to play a key role in the separation process, and there is a striking difference as a function of latitude in the path of the western cyclonic eddies that lead to separation. For southern separations, the cyclonic features can be detected as far south in the middle of the Caribbean Sea, while for northern separations, they are generated locally in the GoM north of the Yucatan Channel. The passage of those cyclonic features can be documented through an eastward displacement of the LC observed in altimetry data and by the occurrence of negative velocities west of the LC in the CANEK mooring array, both coinciding with the passage of cyclonic anomalies through the Yucatan Channel in our Hovmöller composites. There are no cyclonic features propagating north from the Caribbean in reattachments. However, questions remain regarding the nature of the cyclonic features west of the LC: Are they simply vorticity anomalies associated with the boundary current, or do they represent coherent cyclonic eddies? It is noteworthy that negative SLA signals propagating from the Caribbean to the Gulf of Mexico during separations south of 26° are not detected by traditional eddy detection methods, since the amplitude of these features is often underestimated due to the interpolation of altimeter track data into gridded fields (Chelton et al., 2011; Hogg et al., 2015; Amores et al., 2018; Archer et al., 2020). This underestimation is especially pronounced for cyclonic structures in the Caribbean Sea when comparing SLA from gridded altimeter and SWOT observations. However, the comparison between SLA maps and in-situ CANEK measurements suggests that, despite the challenges of detecting cyclonic eddies in this region using standard altimetry products, there is clear evidence that cyclonic structures are being advected within the Yucatan Current. While the SWOT mission provides a more accurate representation of the mesoscale eddies, its 120 km swath and 21 d repeat cycle result in insufficient temporal resolution for tracking the propagation of Caribbean cyclonic eddies. Nevertheless, the combination of altimeter constellations and SWOT could improve the detection of Caribbean cyclonic eddies. Additionally, future satellite missions such as ODYSEA, the Ocean DYnamics and Surface Exchange with the Atmosphere mission (Rodríguez et al., 2019; Wineteer et al., 2020; Torres et al., 2023; Larrañaga et al., 2025), are expected to address these limitations by measuring total sea surface currents with a 5 km resolution, 1700 km swath, and 4 d repeat cycle. This improved spatial and time resolution could enable a more accurate representation of the Caribbean cyclonic eddies and their propagation into the GoM.
In this context, our results contribute to the ongoing discussion on the origin of cyclonic structures west of the LC during separation events. For separations south of 26° N, our observations show that cyclonic anomalies propagate from the Caribbean through the Yucatan Channel and contribute to the formation of western cyclonic structures and barrier eddies in the Gulf of Mexico. This interpretation is consistent with numerical studies showing that reducing Caribbean mesoscale variability leads to increased mean LC penetration into the GoM (Le Hénaff et al., 2012; Garcia-Jove et al., 2016). This behavior can be understood as a consequence of fewer Caribbean cyclonic anomalies reaching the Gulf, resulting in fewer barrier eddies and a Loop Current that spends more time in an extended state. From a complementary perspective, Yang et al. (2023b) use an EOF-based ensemble approach to mainly perturb the properties of cyclonic eddies east of the LC and suggest that strong and large eastern cyclones can induce the local formation of western cyclones. It is plausible that both mechanisms act together: eastern cyclones trigger the formation of western cyclones, while Caribbean cyclonic eddies reinforce them, enabling the “pinch-off” of LCEs and the formation of barrier eddies. However, it is also possible that EOF-based perturbations not only directly influence cyclonic eddies east of the LC but also indirectly alter the Caribbean circulation near the Yucatan Channel, potentially limiting the propagation of cyclonic anomalies from the Caribbean into the GoM.
Taken together, these observations and sensitivity studies highlight remaining uncertainties regarding the relative roles of locally generated versus Caribbean-advected cyclonic eddies in LCE separation events. These questions could be addressed through process-oriented numerical experiments in which Caribbean eddies are explicitly included or excluded at the boundaries, allowing a direct assessment of their impact on western cyclones, barrier eddies, and Loop Current behavior. Such experiments would help assess the relative importance of locally generated cyclonic eddies to those coming from outside the GoM in the separation events. Similarly, one could easily investigate the role of the barrier eddies in modulating the northward extension of the LC by performing numerical experiments with and without a barrier eddy in front of the LC for different LC extensions. Overall, advancing our understanding of LCE detachment will benefit from combining altimetric observations with targeted numerical experiments. This approach would help bridge observational gaps and provide a more complete picture of the processes controlling Loop Current evolution and eddy separation.
Finally, our results about the role of cyclonic eddies in the detachment of LCEs also agree with the findings of Chérubin et al. (2006) and Yang et al. (2023) regarding the occurrence of strong barotropic energy conversions during detachment events. The coexistence of strong LC and cyclonic eddy vorticity during the shedding process is consistent with enhanced horizontal shear, potentially favoring barotropic energy conversions. At the same time, observational analyses (Donohue et al., 2016; Hamilton et al., 2016) suggest that baroclinic energy conversions associated with the formation of large-scale meanders may contribute to the development of cyclonic eddies that participate in detachment events. Our new findings provide a statistical and dynamical framework to investigate these relationships in numerical simulations, resolving the full vertical structure of the LC and cyclonic eddies. Such simulations would allow the quantification of barotropic and baroclinic energy conversions throughout the water column, directly linking surface cyclonic configurations to deeper dynamical processes involved in separation events. However, robust estimates of these energy conversions require numerical models that realistically reproduce eddy kinetic energy at all depths, particularly in deeper regions.
Table A1Separated Loop Current eddies. The name of the eddies was obtained from the site https://www.horizonmarine.com (last access: 15 October 2024).
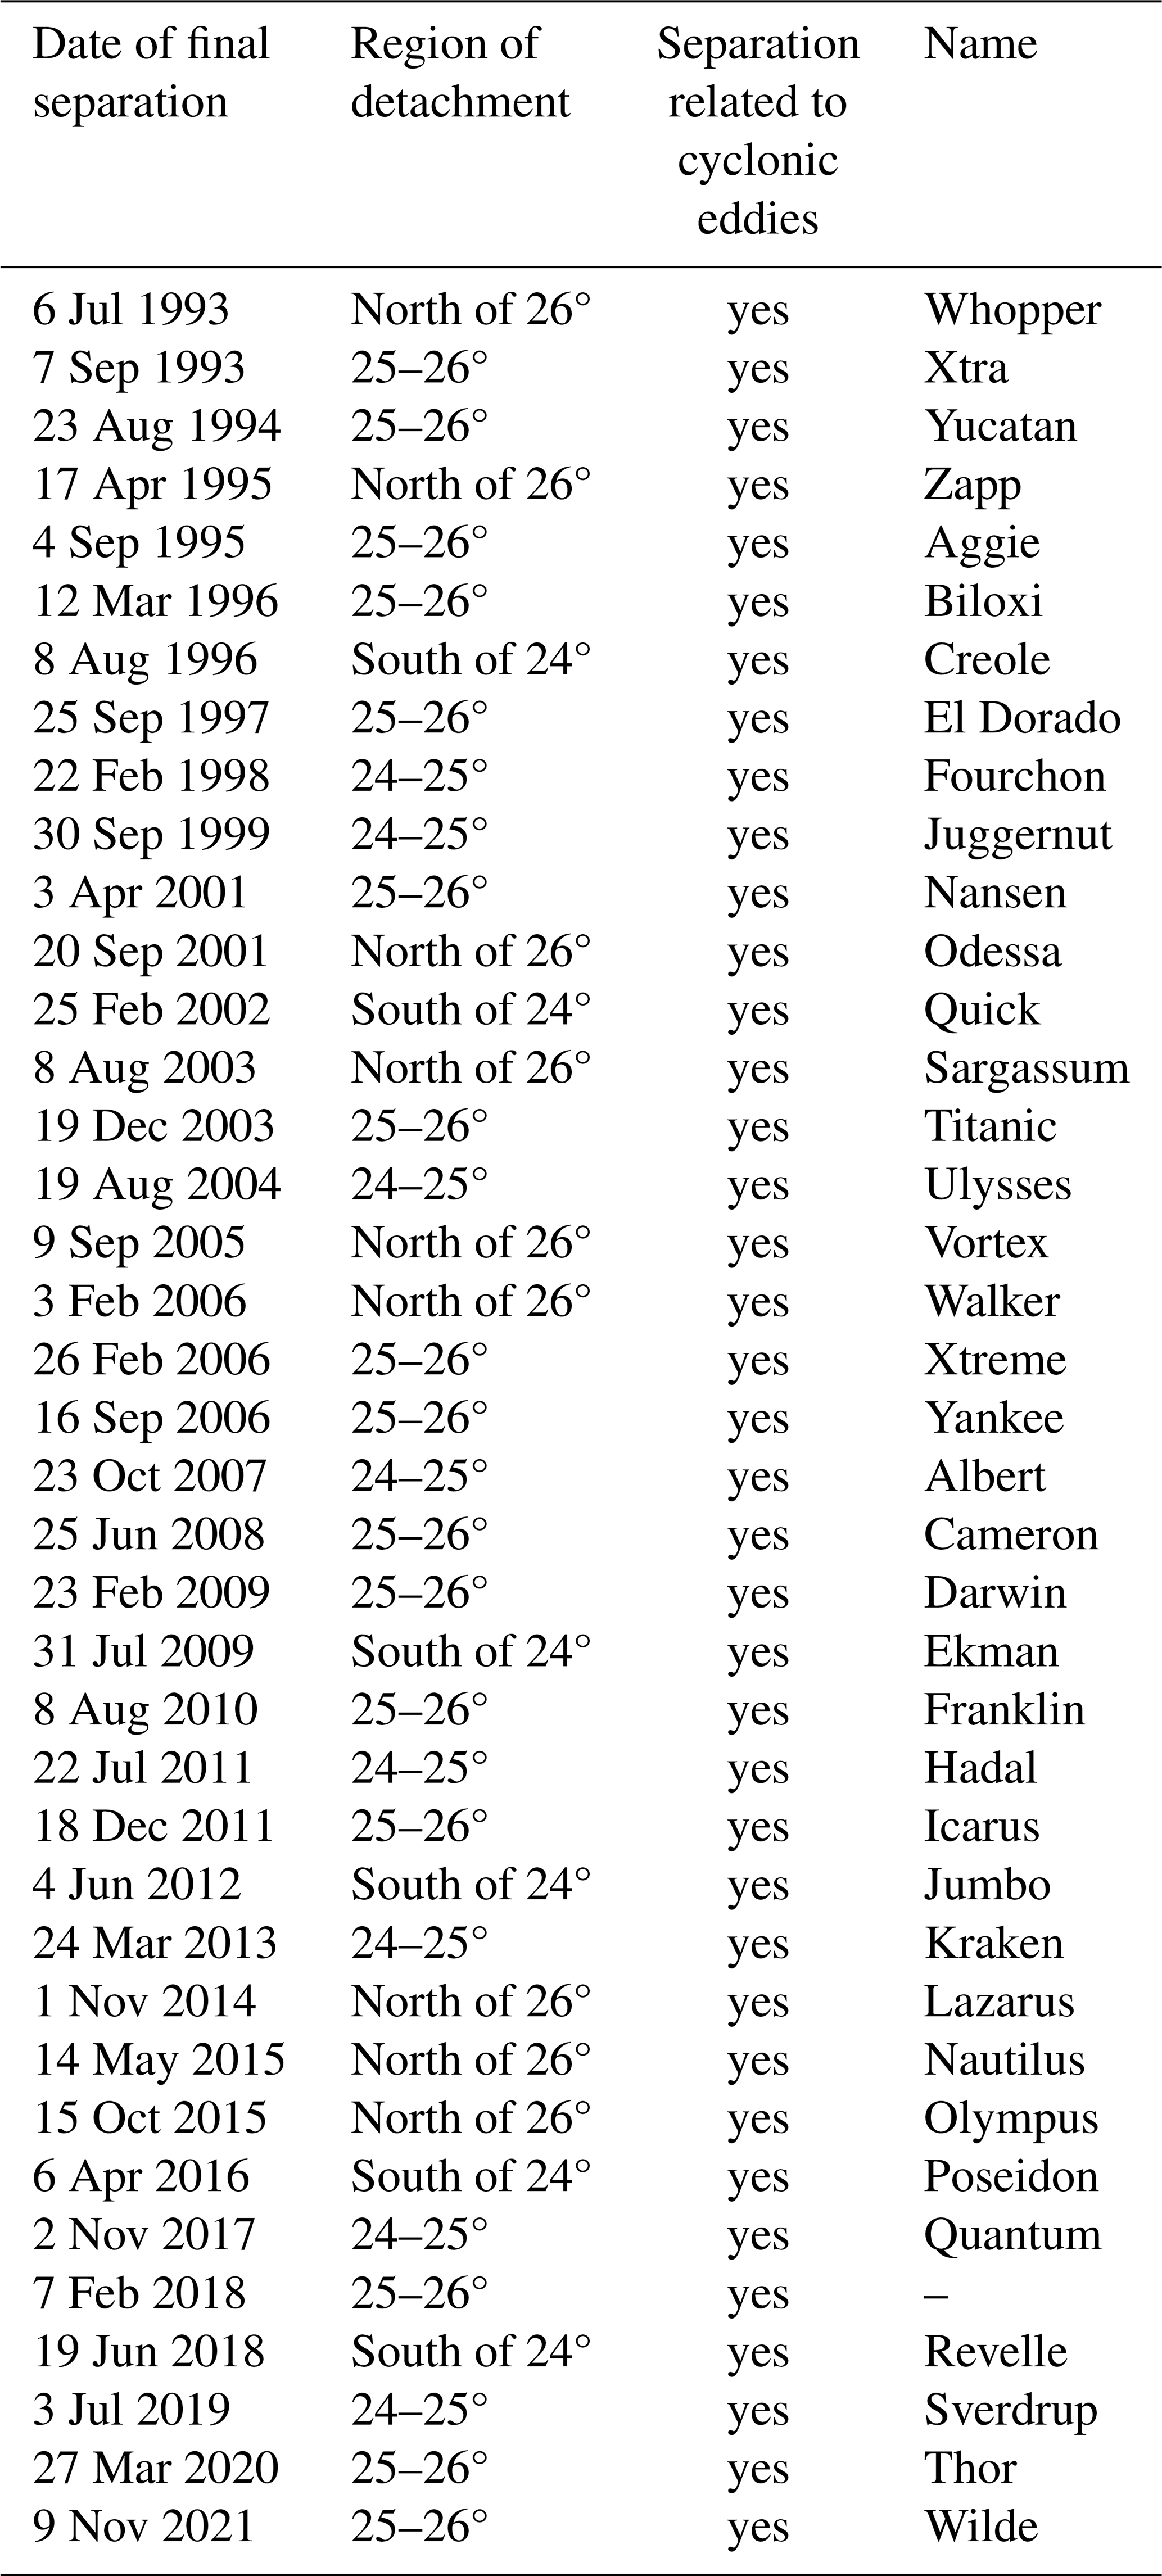
Table A2Reattached Loop Current eddies. The days between detachments and reattachments were obtained from the site https://www.horizonmarine.com (last access: 15 October 2024).
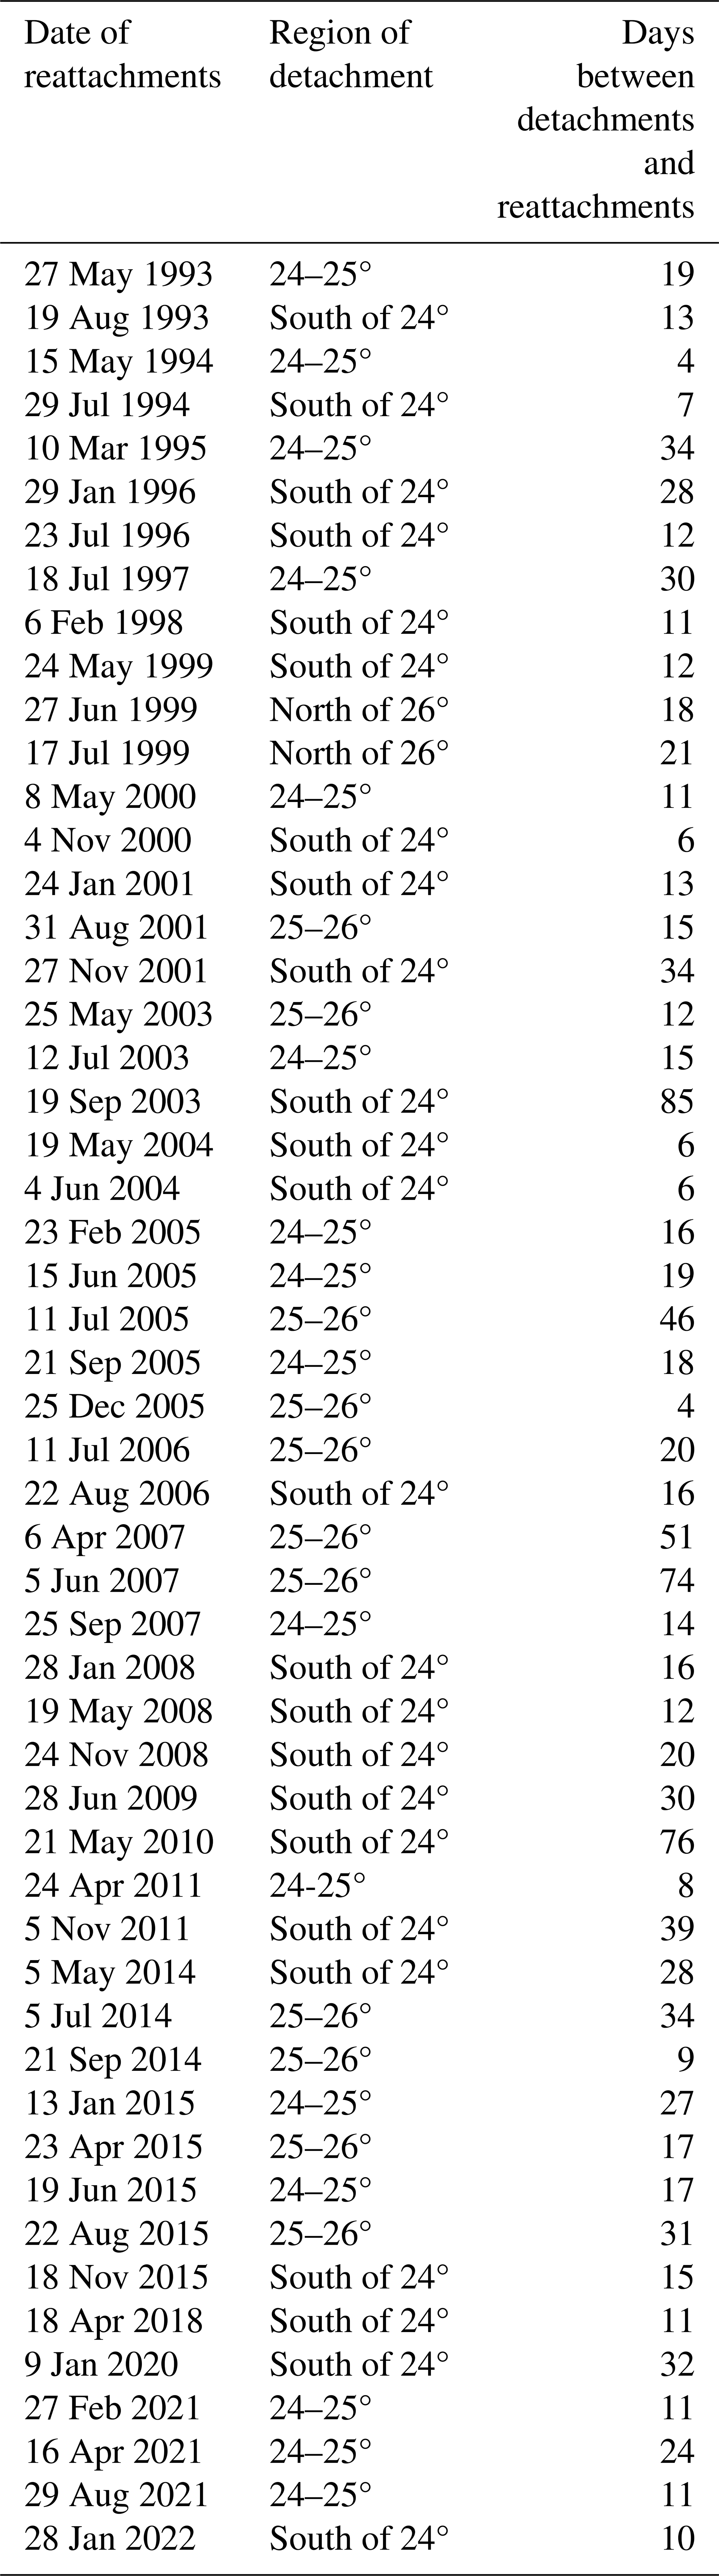
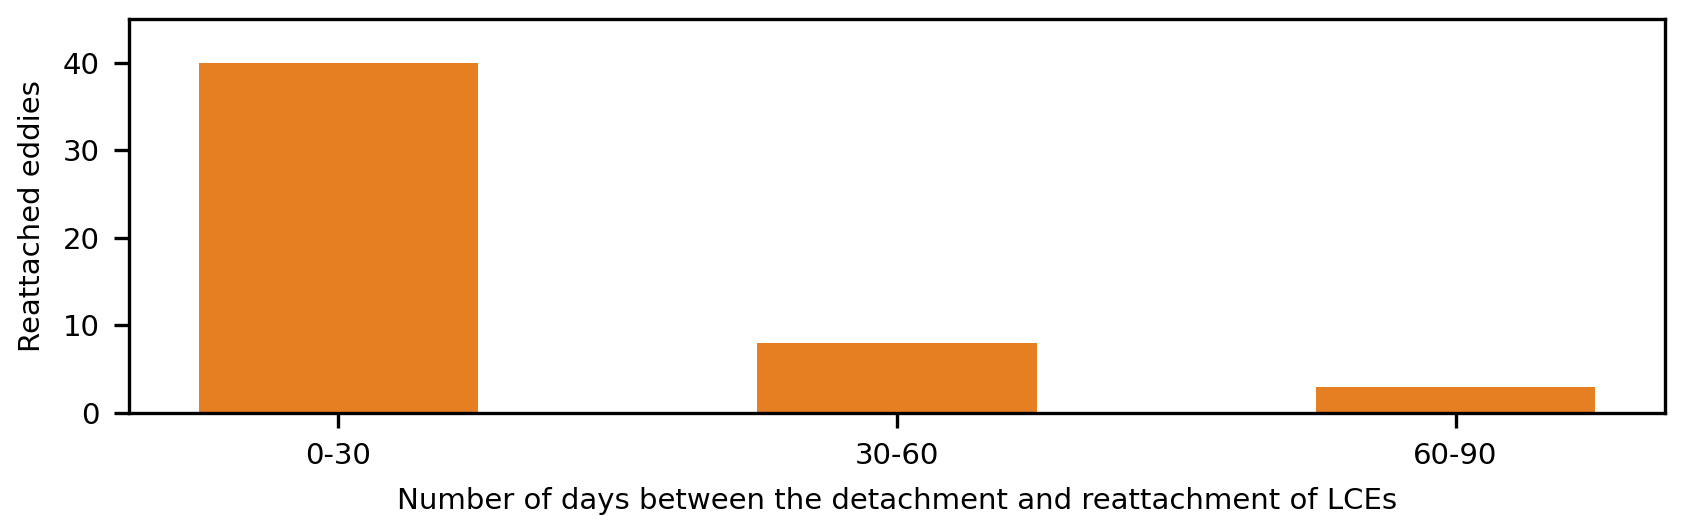
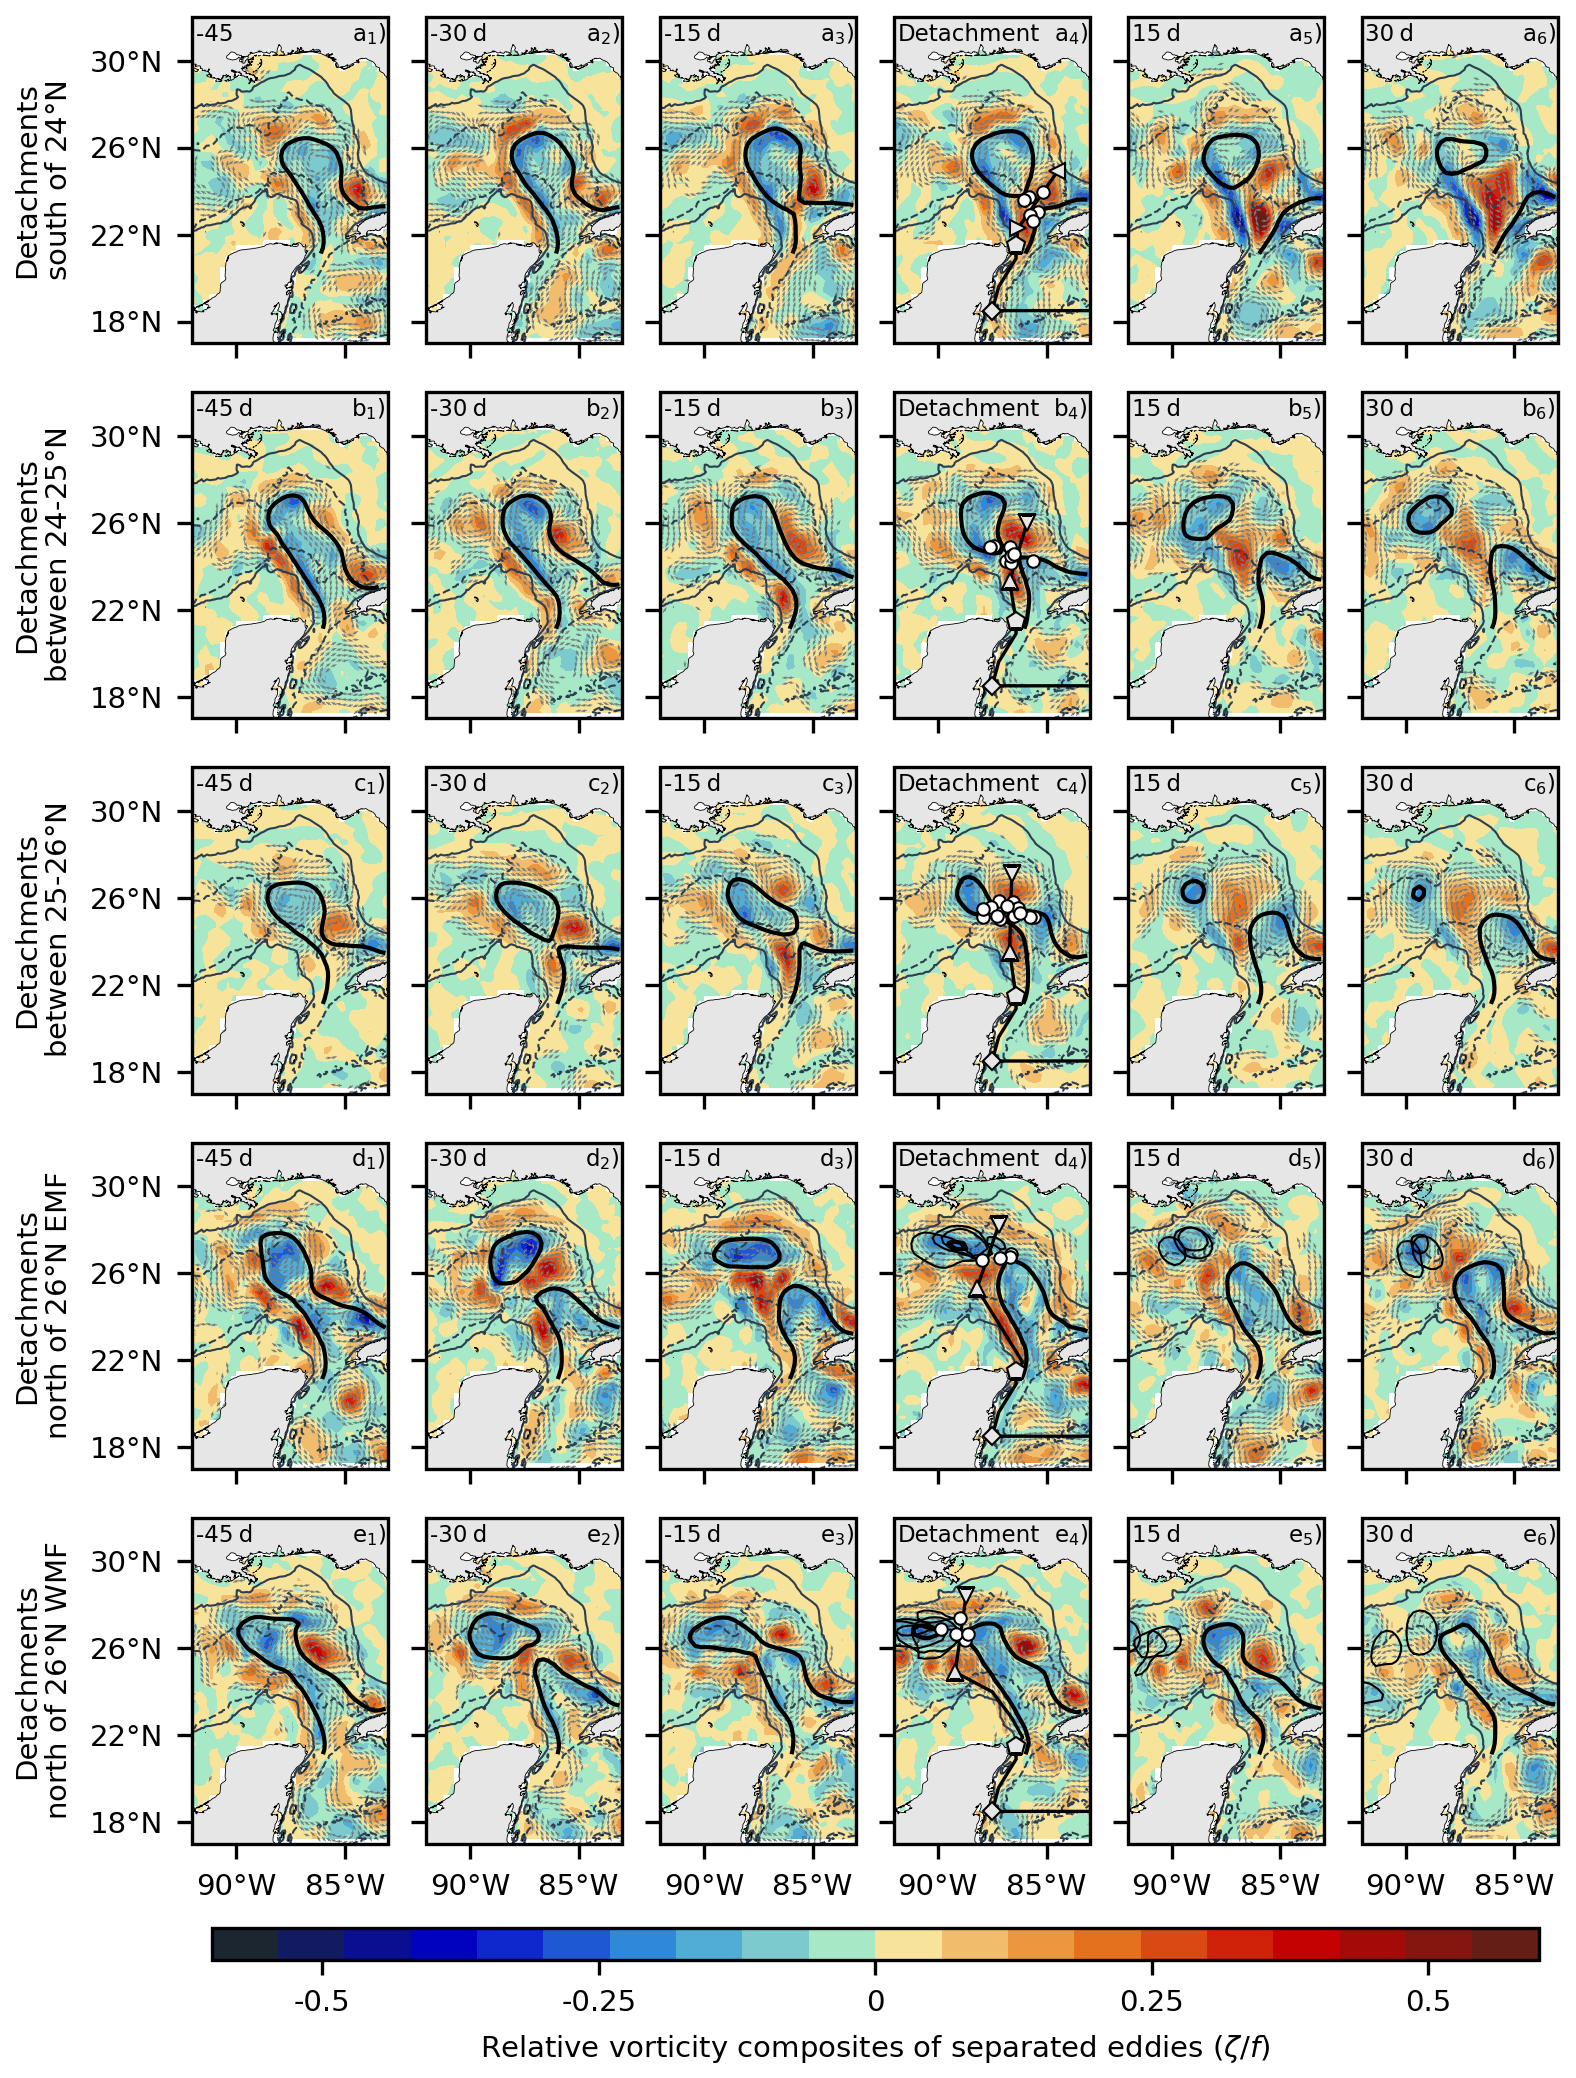
Figure A2Time evolution of Rossby number during LCEs separation south of 24° N (a–a6), between 24–25° N (b1–b6), between 25–26° N (c1–c6), as well as separations north of 26 occurring east (EMF; d1–d6) and west (WMF; e1–e6) of the Mississippi Fan. Thick contours represent the composite LC and detached LCEs. Thin contours in the last three columns of separations north of 26° N represent the LCEs for each detachment case in the region. The gray arrows depict the direction of surface geostrophic currents with speeds stronger than 0.1 m s−1. White circles represent the LC outermost position after detachment events used for the composites. The light gray contours refer to the 200 m (continuous) and 2500 m (dashed) depths.
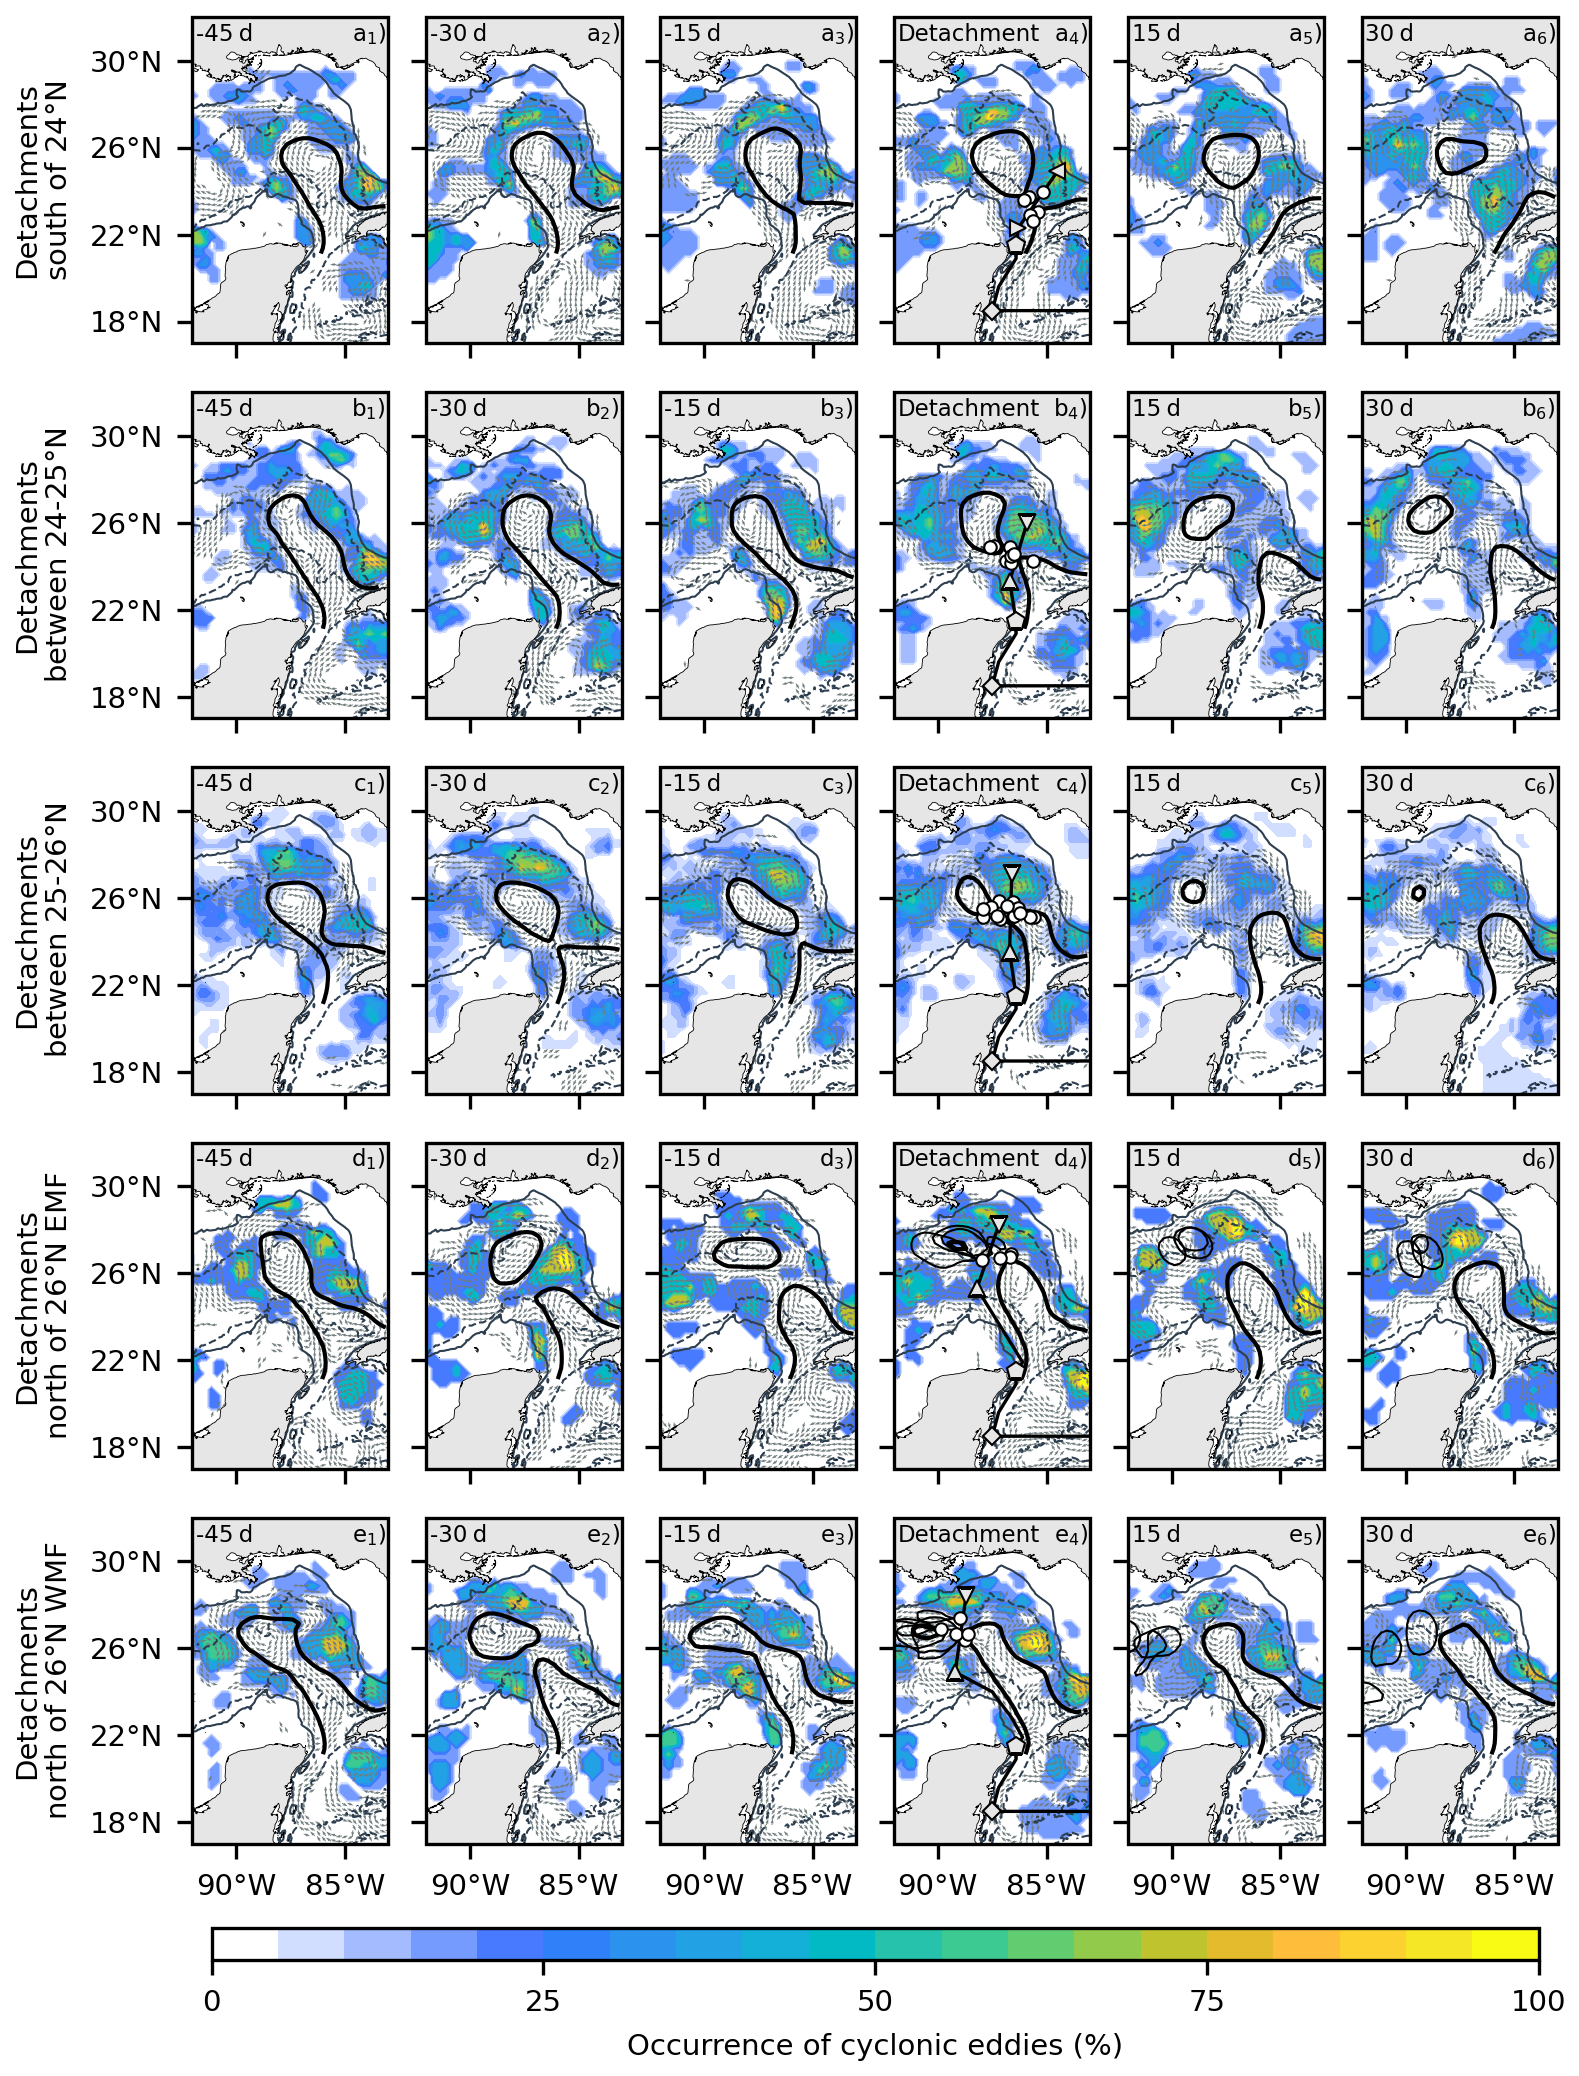
Figure A3Occurrence of cyclonic eddies during the evolution of LCEs separation events south of 24° N (a1–a6), between 24–25° N (b1–b6), between 25–26° N (c1–c6), as well as separations north of 26 occurring east (EMF; d1–d6) and west (WMF; e1–e6) of the Mississippi Fan. Thick contours represent the composite LC and detached LCEs. Thin contours in the last three columns of separations north of 26° N represent the LCEs for each detachment case in the region. The gray arrows depict the direction of surface geostrophic currents with speeds stronger than 0.1 m s−1. White circles represent the LC outermost position after detachment events used for the composites. The light gray contours refer to the 200 m (continuous) and 2500 m (dashed) depths.
The daily gridded altimetry data used in this study, including Absolute Dynamic Topography, Sea Level Anomaly, and the MDT-CNES-CLS22 mean dynamic topography, are publicly available from the Copernicus Marine Environment Monitoring Service (CMEMS) at https://marine.copernicus.eu (last access: 15 October 2024). The Mesoscale Eddy Trajectory Atlas 3.2 (META) delayed-time product, used for eddy trajectory information, is available from AVISO at https://www.aviso.altimetry.fr (last access: 15 October 2024). The current-meter data from the Yucatan Channel were obtained from a mooring array deployed by the CANEK research group at CICESE. These data are available upon reasonable request from Julio Sheinbaum (julios@cicese.mx).
ML, JJ, LR, and EC conceived the study and designed its overall objectives. The methodology was developed by ML, JJ, LR, EC, GD, and IM. ML conducted the data analysis, while GD prepared the CANEK mooring time series. JS contributed to the refinement and revision of the manuscript. All authors discussed the results and contributed to the final version of the paper.
The contact author has declared that none of the authors has any competing interests.
Publisher's note: Copernicus Publications remains neutral with regard to jurisdictional claims made in the text, published maps, institutional affiliations, or any other geographical representation in this paper. The authors bear the ultimate responsibility for providing appropriate place names. Views expressed in the text are those of the authors and do not necessarily reflect the views of the publisher.
The PhD grant for Marco Larrañaga was supported by CNES and Université Paul Sabatier.
This research has been supported by the National Academies of Sciences, Engineering, and Medicine (grant no. 200013149). The content is solely the responsibility of the authors and does not necessarily represent the official views of the Gulf Research Program or the National Academies of Sciences, Engineering, and Medicine.
This paper was edited by Mario Hoppema and reviewed by Kathleen Donohue and one anonymous referee.
Amores, A., Jordà, G., Arsouze, T., and Le Sommer, J.: Up to what extent can we characterize ocean eddies using present-day gridded altimetric products?, J. Geophys. Res.-Oceans, 123, 7220–7236, 2018. a, b
Archer, M. R., Li, Z., and Fu, L.-L.: Increasing the Space–Time Resolution of Mapped Sea Surface Height From Altimetry, J. Geophys. Res.-Oceans, 125, https://doi.org/10.1029/2019jc015878, 2020. a, b
Athié, G., Candela, J., Ochoa, J., and Sheinbaum, J.: Impact of Caribbean cyclones on the detachment of Loop Current anticyclones, J. Geophys. Res.- Oceans, 117, https://doi.org/10.1029/2011jc007090, 2012. a, b, c, d, e
Athié, G., Sheinbaum, J., Leben, R., Ochoa, J., Shannon, M. R., and Candela, J.: Interannual variability in the Yucatan Channel flow, Geophys. Res. Lett., 42, 1496–1503, https://doi.org/10.1002/2014gl062674, 2015. a
Athié, G., Sheinbaum, J., Candela, J., Ochoa, J., Pérez-Brunius, P., and Romero-Arteaga, A.: Seasonal Variability of the Transport through the Yucatan Channel from Observations, J. Phys. Oceanogr., 50, 343–360, https://doi.org/10.1175/jpo-d-18-0269.1, 2020. a
Biggs, D. C., Fargion, G. S., Hamilton, P., and Leben, R. R.: Cleavage of a Gulf of Mexico loop current eddy by a deep water cyclone, J. Geophys. Res.-Oceans, 101, 20629–20641, https://doi.org/10.1029/96jc01078, 1996. a
Bunge, L., Ochoa, J., Badan, A., Candela, J., and Sheinbaum, J.: Deep flows in the Yucatan Channel and their relation to changes in the Loop Current extension, J. Geophys. Res.-Oceans, 107, 26-1–26-7, https://doi.org/10.1029/2001jc001256, 2002. a
Candela, J., Sheinbaum, J., Ochoa, J., Badan, A., and Leben, R.: The potential vorticity flux through the Yucatan Channel and the Loop Current in the Gulf of Mexico, Geophys. Res. Lett., 29, 16-1–16-4, https://doi.org/10.1029/2002gl015587, 2002. a, b
Candela, J., Ochoa, J., Sheinbaum, J., López, M., Pérez-Brunius, P., Tenreiro, M., Pallàs-Sanz, E., Athié, G., and Arriaza-Oliveros, L.: The Flow through the Gulf of Mexico, J. Phys. Oceanogr., 49, 1381–1401, https://doi.org/10.1175/jpo-d-18-0189.1, 2019. a, b
Chang, Y.-L. and Oey, L.-Y.: Why Can Wind Delay the Shedding of Loop Current Eddies?, J. Phys. Oceanogr., 40, 2481–2495, https://doi.org/10.1175/2010jpo4460.1, 2010. a
Chelton, D. B., Schlax, M. G., and Samelson, R. M.: Global observations of nonlinear mesoscale eddies, Prog. Oceanogr., 91, 167–216, https://doi.org/10.1016/j.pocean.2011.01.002, 2011. a, b, c
Chérubin, L. M., Morel, Y., and Chassignet, E. P.: Loop Current Ring Shedding: The Formation of Cyclones and the Effect of Topography, J. Phys. Oceanogr., 36, 569–591, https://doi.org/10.1175/jpo2871.1, 2006. a, b, c
Cochrane, J.: Separation of an anticyclone and subsequent developments in the Loop Current (1969), Contributions on the Physical Oceanography of the Gulf of Mexico, 2, 91–106, 1972. a
Donohue, K., Watts, D., Hamilton, P., Leben, R., Kennelly, M., and Lugo-Fernández, A.: Gulf of Mexico Loop Current path variability, Dynam. Atmos. Oceans, 76, 174–194, https://doi.org/10.1016/j.dynatmoce.2015.12.003, 2016. a, b
Dukhovskoy, D. S., Leben, R. R., Chassignet, E. P., Hall, C. A., Morey, S. L., and Nedbor-Gross, R.: Characterization of the uncertainty of loop current metrics using a multidecadal numerical simulation and altimeter observations, Deep-Sea Res. Pt. I, 100, 140–158, https://doi.org/10.1016/j.dsr.2015.01.005, 2015. a, b
Durante, G., Sheinbaum, J., and Candela, J.: Capturing the Loop Current by Its Ends – Part I: A Volume-Conserving Objective Mapping of the Canek Velocity Database, J. Atmos. Ocean. Tech., 42, 1529–1547, https://doi.org/10.1175/jtech-d-24-0139.1, 2025. a
Elliott, B. A.: Anticyclonic Rings in the Gulf of Mexico, J. Phys. Oceanogr., 12, 1292–1309, https://doi.org/10.1175/1520-0485(1982)012<1292:aritgo>2.0.co;2, 1982. a
European Union-Copernicus Marine Service: Global ocean gridded normalized measurement noise of sea level anomalies, https://doi.org/10.48670/MOI-00144, 2015. a
Fratantoni, P. S., Lee, T. N., Podesta, G. P., and Muller-Karger, F.: The influence of Loop Current perturbations on the formation and evolution of Tortugas eddies in the southern Straits of Florida, J. Geophys. Res.-Oceans, 103, 24759–24779, https://doi.org/10.1029/98jc02147, 1998. a, b, c, d, e
Garcia-Jove, M., Sheinbaum, J., and Jouanno, J.: Sensitivity of Loop Current metrics and eddy detachments to different model configurations: The impact of topography and Caribbean perturbations, Atmósfera, 29, 235–265, https://doi.org/10.20937/atm.2016.29.03.05, 2016. a, b, c
Hamilton, P., Lugo-Fernández, A., and Sheinbaum, J.: A Loop Current experiment: Field and remote measurements, Dynam. Atmos. Oceans, 76, 156–173, https://doi.org/10.1016/j.dynatmoce.2016.01.005, 2016. a, b
Hamilton, P., Leben, R., Bower, A., Furey, H., and Pérez-Brunius, P.: Hydrography of the Gulf of Mexico Using Autonomous Floats, J. Phys. Oceanogr., 48, 773–794, https://doi.org/10.1175/jpo-d-17-0205.1, 2018. a
Hiron, L., Cruz, B. J., and Shay, L. K.: Evidence of Loop Current Frontal Eddy Intensification Through Local Linear and Nonlinear Interactions with the Loop Current, J. Geophys. Res.-Oceans, 125, https://doi.org/10.1029/2019jc015533, 2020. a, b, c
Hogg, A. M., Meredith, M. P., Chambers, D. P., Abrahamsen, E. P., Hughes, C. W., and Morrison, A. K.: Recent trends in the Southern Ocean eddy field, J. Geophys. Res.-Oceans, 120, 257–267, https://doi.org/10.1002/2014jc010470, 2015. a, b, c
Hurlburt, H. E. and Thompson, J. D.: A Numerical Study of Loop Current Intrusions and Eddy Shedding, J. Phys. Oceanogr., 10, 1611–1651, https://doi.org/10.1175/1520-0485(1980)010<1611:ansolc>2.0.co;2, 1980. a
Jouanno, J., Ochoa, J., Pallàs-Sanz, E., Sheinbaum, J., Andrade-Canto, F., Candela, J., and Molines, J.-M.: Loop Current Frontal Eddies: Formation along the Campeche Bank and Impact of Coastally Trapped Waves, J. Phys. Oceanogr., 46, 3339–3363, https://doi.org/10.1175/jpo-d-16-0052.1, 2016. a, b, c, d
Jousset, S., Mulet, S., Greiner, E., Wilkin, J., Vidar, L., Chafik, L., Raj, R., Bonaduce, A., Picot, N., and Dibarboure, G.: New Global Mean Dynamic Topography CNES-CLS-22 Combining Drifters, Hydrography Profiles and High Frequency Radar Data, ESS Open Archive [preprint], https://doi.org/10.22541/essoar.170158328.85804859/v2, 2025. a
Kantha, L.: Empirical Models of the Loop Current Eddy Detachment/Separation Time in the Gulf of Mexico, J. Waterway Port Coast. Ocean Eng., 140, https://doi.org/10.1061/(asce)ww.1943-5460.0000220, 2014. a
Larrañaga, M., Renault, L., and Jouanno, J.: Partial Control of the Gulf of Mexico Dynamics by the Current Feedback to the Atmosphere, J. Phys. Oceanogr., 52, 2515–2530, https://doi.org/10.1175/jpo-d-21-0271.1, 2022. a
Larrañaga, M., Renault, L., Wineteer, A., Contreras, M., Arbic, B. K., Bourassa, M. A., and Rodriguez, E.: Assessing the Future ODYSEA Satellite Mission for the Estimation of Ocean Surface Currents, Wind Stress, Energy Fluxes, and the Mechanical Coupling Between the Ocean and the Atmosphere, Remote Sens., 17, 302, https://doi.org/10.3390/rs17020302, 2025. a
Larsen, J. C.: Transport and heat flux of the Florida Current at 27°N derived from cross-stream voltages and profiling data: theory and observations, Philos. T. Roy. Soc. Lond. A, 338, 169–236, https://doi.org/10.1098/rsta.1992.0007, 1992. a
Laxenaire, R., Chassignet, E. P., Dukhovskoy, D. S., and Morey, S. L.: Impact of upstream variability on the Loop Current dynamics in numerical simulations of the Gulf of Mexico, Front. Mar. Sci., 10, https://doi.org/10.3389/fmars.2023.1080779, 2023. a, b
Leben, R. R.: Altimeter-derived loop current metrics, Geophysical Monograph 161, 181, American Geophysical Union, https://doi.org/10.1029/161GM15, 2005. a, b, c, d, e
Le Hénaff, M., Kourafalou, V. H., Morel, Y., and Srinivasan, A.: Simulating the dynamics and intensification of cyclonic Loop Current Frontal Eddies in the Gulf of Mexico, J. Geophys. Res.-Oceans, 117, https://doi.org/10.1029/2011jc007279, 2012. a, b, c, d, e, f
Le Hénaff, M., Kourafalou, V. H., Dussurget, R., and Lumpkin, R.: Cyclonic activity in the eastern Gulf of Mexico: Characterization from along-track altimetry and in situ drifter trajectories, Prog. Oceanogr., 120, 120–138, https://doi.org/10.1016/j.pocean.2013.08.002, 2014. a
Le Hénaff, M., Kourafalou, V. H., Androulidakis, Y., Ntaganou, N., and Kang, H.: Influence of the Caribbean Sea eddy field on Loop Current predictions, Front. Mar. Sci., 10, https://doi.org/10.3389/fmars.2023.1129402, 2023. a
Lugo-Fernández, A. and Leben, R. R.: On the Linear Relationship between Loop Current Retreat Latitude and Eddy Separation Period, J. Phys. Oceanogr., 40, 2778–2784, https://doi.org/10.1175/2010jpo4354.1, 2010. a, b
Meunier, T., Pallás-Sanz, E., Tenreiro, M., Portela, E., Ochoa, J., Ruiz-Angulo, A., and Cusí, S.: The Vertical Structure of a Loop Current Eddy, J. Geophys. Res.-Oceans, 123, 6070–6090, https://doi.org/10.1029/2018jc013801, 2018. a
Meunier, T., Sheinbaum, J., Pallàs-Sanz, E., Tenreiro, M., Ochoa, J., Ruiz-Angulo, A., Carton, X., and de Marez, C.: Heat Content Anomaly and Decay of Warm-Core Rings: the Case of the Gulf of Mexico, Geophys. Res. Lett., 47, https://doi.org/10.1029/2019gl085600, 2020. a
Molina, M. J., Timmer, R. P., and Allen, J. T.: Importance of the Gulf of Mexico as a climate driver for U.S. severe thunderstorm activity, Geophys. Res. Lett., 43, https://doi.org/10.1002/2016gl071603, 2016. a
Morey, S. L., Gopalakrishnan, G., Sanz, E. P., Azevedo Correia De Souza, J. M., Donohue, K., Pérez-Brunius, P., Dukhovskoy, D., Chassignet, E., Cornuelle, B., Bower, A., Furey, H., Hamilton, P., and Candela, J.: Assessment of Numerical Simulations of Deep Circulation and Variability in the Gulf of Mexico Using Recent Observations, J. Phys. Oceanogr., 50, 1045–1064, https://doi.org/10.1175/jpo-d-19-0137.1, 2020. a
Morrow, R., Fu, L.-L., Ardhuin, F., Benkiran, M., Chapron, B., Cosme, E., d'Ovidio, F., Farrar, J. T., Gille, S. T., Lapeyre, G., Le Traon, P.-Y., Pascual, A., Ponte, A., Qiu, B., Rascle, N., Ubelmann, C., Wang, J., and Zaron, E. D.: Global Observations of Fine-Scale Ocean Surface Topography With the Surface Water and Ocean Topography (SWOT) Mission, Front. Mar. Sci., 6, https://doi.org/10.3389/fmars.2019.00232, 2019. a
Nickerson, A. K., Weisberg, R. H., and Liu, Y.: On the Evolution of the Gulf of Mexico Loop Current Through Its Penetrative, Ring Shedding and Retracted States, Adv. Space Res., 69, 4058–4077, https://doi.org/10.1016/j.asr.2022.03.039, 2022. a
Oey, L., Lee, H., and Schmitz, W. J.: Effects of winds and Caribbean eddies on the frequency of Loop Current eddy shedding: A numerical model study, J. Geophys. Res.-Oceans, 108, https://doi.org/10.1029/2002jc001698, 2003. a
Pegliasco, C., Delepoulle, A., Mason, E., Morrow, R., Faugère, Y., and Dibarboure, G.: META3.1exp: a new global mesoscale eddy trajectory atlas derived from altimetry, Earth Syst. Sci. Data, 14, 1087–1107, https://doi.org/10.5194/essd-14-1087-2022, 2022. a, b, c
Pichevin, T. and Nof, D.: The momentum imbalance paradox, Tellus A, 49, 298–319, https://doi.org/10.1034/j.1600-0870.1997.t01-1-00009.x, 1997. a
Pérez-Brunius, P., Furey, H., Bower, A., Hamilton, P., Candela, J., García-Carrillo, P., and Leben, R.: Dominant Circulation Patterns of the Deep Gulf of Mexico, J. Phys. Oceanogr., 48, 511–529, https://doi.org/10.1175/jpo-d-17-0140.1, 2018. a
Rodríguez, E., Bourassa, M., Chelton, D., Farrar, J. T., Long, D., Perkovic-Martin, D., and Samelson, R.: The Winds and Currents Mission Concept, Front. Mar. Sci., 6, https://doi.org/10.3389/fmars.2019.00438, 2019. a
Schmitz Jr., W. J.: Cyclones and Westward Propagation in the Shedding of Anticyclonic Rings from the Loop Current, AGU – American Geophysical Union, 241–261, ISBN 9781118666166, https://doi.org/10.1029/161GM18, 2005. a, b, c
Shay, L. K., Goni, G. J., and Black, P. G.: Effects of a Warm Oceanic Feature on Hurricane Opal, Mon. Weather Rev., 128, 1366–1383, https://doi.org/10.1175/1520-0493(2000)128<1366:eoawof>2.0.co;2, 2000. a
Sheinbaum, J.: Flow structure and transport in the Yucatan Channel, Geophys. Res. Lett., 29, https://doi.org/10.1029/2001gl013990, 2002. a, b, c
Sheinbaum, J., Athié, G., Candela, J., Ochoa, J., and Romero-Arteaga, A.: Structure and variability of the Yucatan and loop currents along the slope and shelf break of the Yucatan channel and Campeche bank, Dynam. Atmos. Oceans, 76, 217–239, https://doi.org/10.1016/j.dynatmoce.2016.08.001, 2016. a, b, c, d
Sosa-Gutiérrez, R., Pallàs-Sanz, E., Jouanno, J., Chaigneau, A., Candela, J., and Tenreiro, M.: Erosion of the Subsurface Salinity Maximum of the Loop Current Eddies From Glider Observations and a Numerical Model, J. Geophys. Res.-Oceans, 125, e2019JC015397, https://doi.org/10.1029/2019JC015397, 2020. a
Torres, H., Wineteer, A., Klein, P., Lee, T., Wang, J., Rodriguez, E., Menemenlis, D., and Zhang, H.: Anticipated Capabilities of the ODYSEA Wind and Current Mission Concept to Estimate Wind Work at the Air–Sea Interface, Remote Sens., 15, 3337, https://doi.org/10.3390/rs15133337, 2023. a
Vukovich, F. M. and Maul, G. A.: Cyclonic Eddies in the Eastern Gulf of Mexico, J. Phys. Oceanogr., 15, 105–117, https://doi.org/10.1175/1520-0485(1985)015<0105:ceiteg>2.0.co;2, 1985. a
Wineteer, A., Torres, H. S., and Rodriguez, E.: On the Surface Current Measurement Capabilities of Spaceborne Doppler Scatterometry, Geophys. Res. Lett., 47, https://doi.org/10.1029/2020gl090116, 2020. a
Yablonsky, R. M. and Ginis, I.: Impact of a Warm Ocean Eddy's Circulation on Hurricane-Induced Sea Surface Cooling with Implications for Hurricane Intensity, Mon. Weather Rev., 141, 997–1021, https://doi.org/10.1175/mwr-d-12-00248.1, 2012. a
Yang, H., Yang, C., Liu, Y., and Chen, Z.: Energetics during eddy shedding in the Gulf of Mexico, Ocean Dynam., 73, 79–90, https://doi.org/10.1007/s10236-023-01538-y, 2023a. a, b
Yang, X., Le Hénaff, M., Mapes, B., and Iskandarani, M.: Dynamical interactions between Loop Current and Loop Current Frontal Eddies in a HYCOM ensemble of the circulation in the Gulf of Mexico, Front. Mar. Sci., 10, https://doi.org/10.3389/fmars.2023.1048780, 2023b. a, b, c
Zavala-Hidalgo, J., Morey, S. L., and O'Brien, J. J.: Cyclonic Eddies Northeast of the Campeche Bank from Altimetry Data, J. Phys. Oceanogr., 33, 623–629, https://doi.org/10.1175/1520-0485(2003)033<0623:cenotc>2.0.co;2, 2003. a, b, c, d
Zavala-Hidalgo, J., Morey, S. L., O'brien, J. J., and Zamudio, L.: On the Loop Current eddy shedding variability, Atmósfera, 19, 41–48, 2006. a
- Abstract
- Introduction
- Data and methods
- 29 years of LC detachment, reattachment, and separation statistics
- On the role of cyclonic eddies in LC detachments
- The origin of western cyclonic structures leading to separations events
- Summary and discussion
- Appendix A: Supporting information
- Data availability
- Author contributions
- Competing interests
- Disclaimer
- Acknowledgements
- Financial support
- Review statement
- References