
the Creative Commons Attribution 4.0 License.
the Creative Commons Attribution 4.0 License.
 | 22 Oct 2026
Hydrographic transformation of the Persian/Arabian Gulf outflow over rough shelf bathymetry in the Gulf of Oman
Ahmed Abdelmaksoud

Aisha H. Al-Suwaidi
Gerd Bruss
Kaveh Samimi-Namin
Mohammed Y. Ali
Hypersaline overflows from marginal seas contribute to global ocean circulation and climate variability. The Persian/Arabian Gulf (P/AG) contributes dense, saline, oxygenated deep outflow into the Arabian Sea's Oxygen Minimum Zone (OMZ). Here, we present high-resolution hydrographic mapping of the United Arab Emirates-Oman margin in the northwestern Arabian Sea, integrating conductivity-temperature-depth profiles, multibeam bathymetry and remotely-operated vehicle imagery. The P/AG outflow forms a thin (10–30 m) bottom-attached layer that, on crossing an abrupt bathymetric step, undergoes a hydraulic transition and thickens to 200 m over the rough, irregular seafloor of the unstable shelf, where dilution and loss of bottom contact occur. Near-bottom salinity, oxygen, and pH decrease systematically downstream in association with enhanced mixing. Distinct benthic assemblages coincide with attached versus detached flow sectors, consistent with differing near-bed hydrodynamic regimes. These observations indicate that the bathymetric step/hydraulic transition is responsible for the near-field plume transformation followed by the lower effect of bathymetric roughness. Because outflow density depends on Gulf warming and evaporation, modest climatic shifts may alter outflow dynamics, its detachment depth, pathway geometry, and intermediate-depth ventilation of the Arabian Sea OMZ.
- Article
(8211 KB) - Full-text XML
-
Supplement
(1149 KB) - BibTeX
- EndNote


Marginal seas produce water masses with properties distinct from the open ocean and provide pathways for climate signals to penetrate the ocean interior (Melet et al., 2022). Net evaporation in basins such as the Persian/Arabian Gulf (P/AG), the Mediterranean, and the Red Sea increases salinity and drives dense outflows into adjacent basins. Exchange between marginal seas and the open ocean is often regulated by hydraulic controls, and the resulting overflows undergo strong diapycnal mixing due to bottom friction, turbulence, and entrainment, substantially modifying their properties (Melet et al., 2022; Peters and Johns, 2005; Pratt and Lundberg, 1991).
This study focuses on the Oman–United Arab Emirates (UAE) margin of the northeastern Arabian Plate, where the P/AG outflow enters the Gulf of Oman as the northwestern mouth of the Arabian Sea and interacts with a broad continental shelf characterized by strong spatial variability in seafloor morphology. P/AG water is characterized by high salinity, temperature, and comparatively elevated oxygen content (Brewer and Dyrssen, 1985; Yao and Johns, 2010; Swift and Bower, 2003; Font et al., 2024). It exits the Gulf as a dense near-bottom flow through the Strait of Hormuz, entraining ambient water until reaching neutral buoyancy at relatively shallow intermediate depths. Mixing within the strait itself may already condition the outflow, since internal tides generated over the bathymetric highs and steep near-coastal topography of the Strait of Hormuz have been suggested to influence water mass transformation and exchange through the strait (Subeesh et al., 2025). The outflow then follows the southern margin of the Gulf of Oman as a gravity-driven current and spreads into the Arabian Sea and the broader Indian Ocean, with its signature traceable as far as the Bay of Bengal (Bower et al., 2000; Pous et al., 2004b; Jain et al., 2017; Sheehan et al., 2020; Ezam et al., 2010; Prasad et al., 2001). Dynamical processes within the Gulf of Oman, such as eddy–topography interactions and mesoscale eddy field strain, play a central role in determining the open-ocean signature of P/AG water (L'Hégaret et al., 2015, 2016; Queste et al., 2018; Vic et al., 2015; Font et al., 2024). Such eddies can trap and redistribute the outflow, while double-diffusive processes such as salt fingering have been observed beneath the plume in the Arabian Sea (L'Hégaret et al., 2021; Turner, 1967).
Previous hydrographic and acoustic Doppler current profiler observations show that, after exiting the Strait of Hormuz, P/AG water cascades down the continental slope and spreads along the Gulf of Oman margin (Pous et al., 2004b). Along the Omani coast, the outflow core occurs at a depth of 200 m with a potential density range of 25.5–27 kg m−3 (Font et al., 2024). Climatological and historical analyses indicate that P/AG water typically equilibrates between approximately 200 and 350 m (Prasad et al., 2001; Swift and Bower, 2003). Observations off Oman document that the P/AG outflow pathway and thermohaline properties vary with the mesoscale field, which can eject boundary water offshore through near-shelf dipoles and lee eddies (L'Hégaret et al., 2015). High-resolution simulations and process analyses demonstrate that remotely generated mesoscale eddies interact with the steep slope to generate frictional boundary layers and submesoscale vortices that peel P/AG water from the boundary, thereby enhancing lateral dispersion and dilution (Vic et al., 2015).
The Arabian Sea Oxygen Minimum Zone (OMZ) ranks among the strongest globally, with suboxia spanning much of the intermediate depths in its northern and northeastern sectors, including the Gulf of Oman (Rixen et al., 2020; Schmidt et al., 2021). OMZs host distinctive biogeochemical pathways and exert a significant influence on carbon and nitrogen cycling relative to their area, shaping ecosystems through habitat compression and contributing to outgassing of greenhouse gases (Gruber and Galloway, 2008; Hood et al., 2024; Stramma et al., 2010). Nearby source waters, notably P/AG water, are estimated to oxygenate ∼35 % of the OMZ (Davila et al., 2023). Consequently, it is poised to respond rapidly to variations in P/AG water properties (Ditkovsky et al., 2023; Hood et al., 2024; Lachkar et al., 2019, 2022, 2023).
Despite decades of study, key aspects of the near-field transformation of P/AG water remain poorly constrained, including outflow thickness variability, detachment behaviour, bathymetric role in mixing, downstream oxygen modification, and links between physical structure and benthic communities. Here we present high-resolution observational mapping of the P/AG outflow along the Oman–UAE margin using CTD profiles, multibeam bathymetry, and ROV imagery. The dataset resolves spatial variability in outflow thickness, identifies zones of bottom attachment and detachment, documents downstream oxygen and pH modification, and reveals benthic assemblages consistent with boundary-layer structure.
2.1 Data
This study uses 51 Conductivity, Temperature, and Depth (CTD) profiles collected in the Gulf of Oman, offshore Fujairah, between 9 and 18 July 2025 (Fig. 1). Profiles were obtained using a Sea-Bird SBE 19plus V2 SeaCAT CTD operating at 4 Hz and attached to a rosette water sampler to ensure stability during deployment. However, we did not collect water samples to adjust the CTD measurements. The profiling speed during downcasting was ∼0.35 m s−1 (median value for all CTD profiles), resulting in a vertical sampling interval of ∼0.0875 m. During profiling, we stopped at 50 m intervals to collect continuous oxygen measurements for a few minutes for another purpose unrelated to the current work. However, as the data quality control (Fig. S1 in the Supplement) illustrates, these stops had no significant effect on salinity or density. The original CTD resolution was used for hydrographic parameters, Brunt-Väisälä frequency squared, Turner angle, and the subsequent Thope-scale analysis. High-resolution multibeam bathymetry was collected using a Kongsberg EM712 system with Seafloor Information System (SIS) software. This bathymetry dataset can be accessed from Abdelmaksoud et al. (2025a). ROV imagery was also used to assess relationships between benthic communities and the outflow.
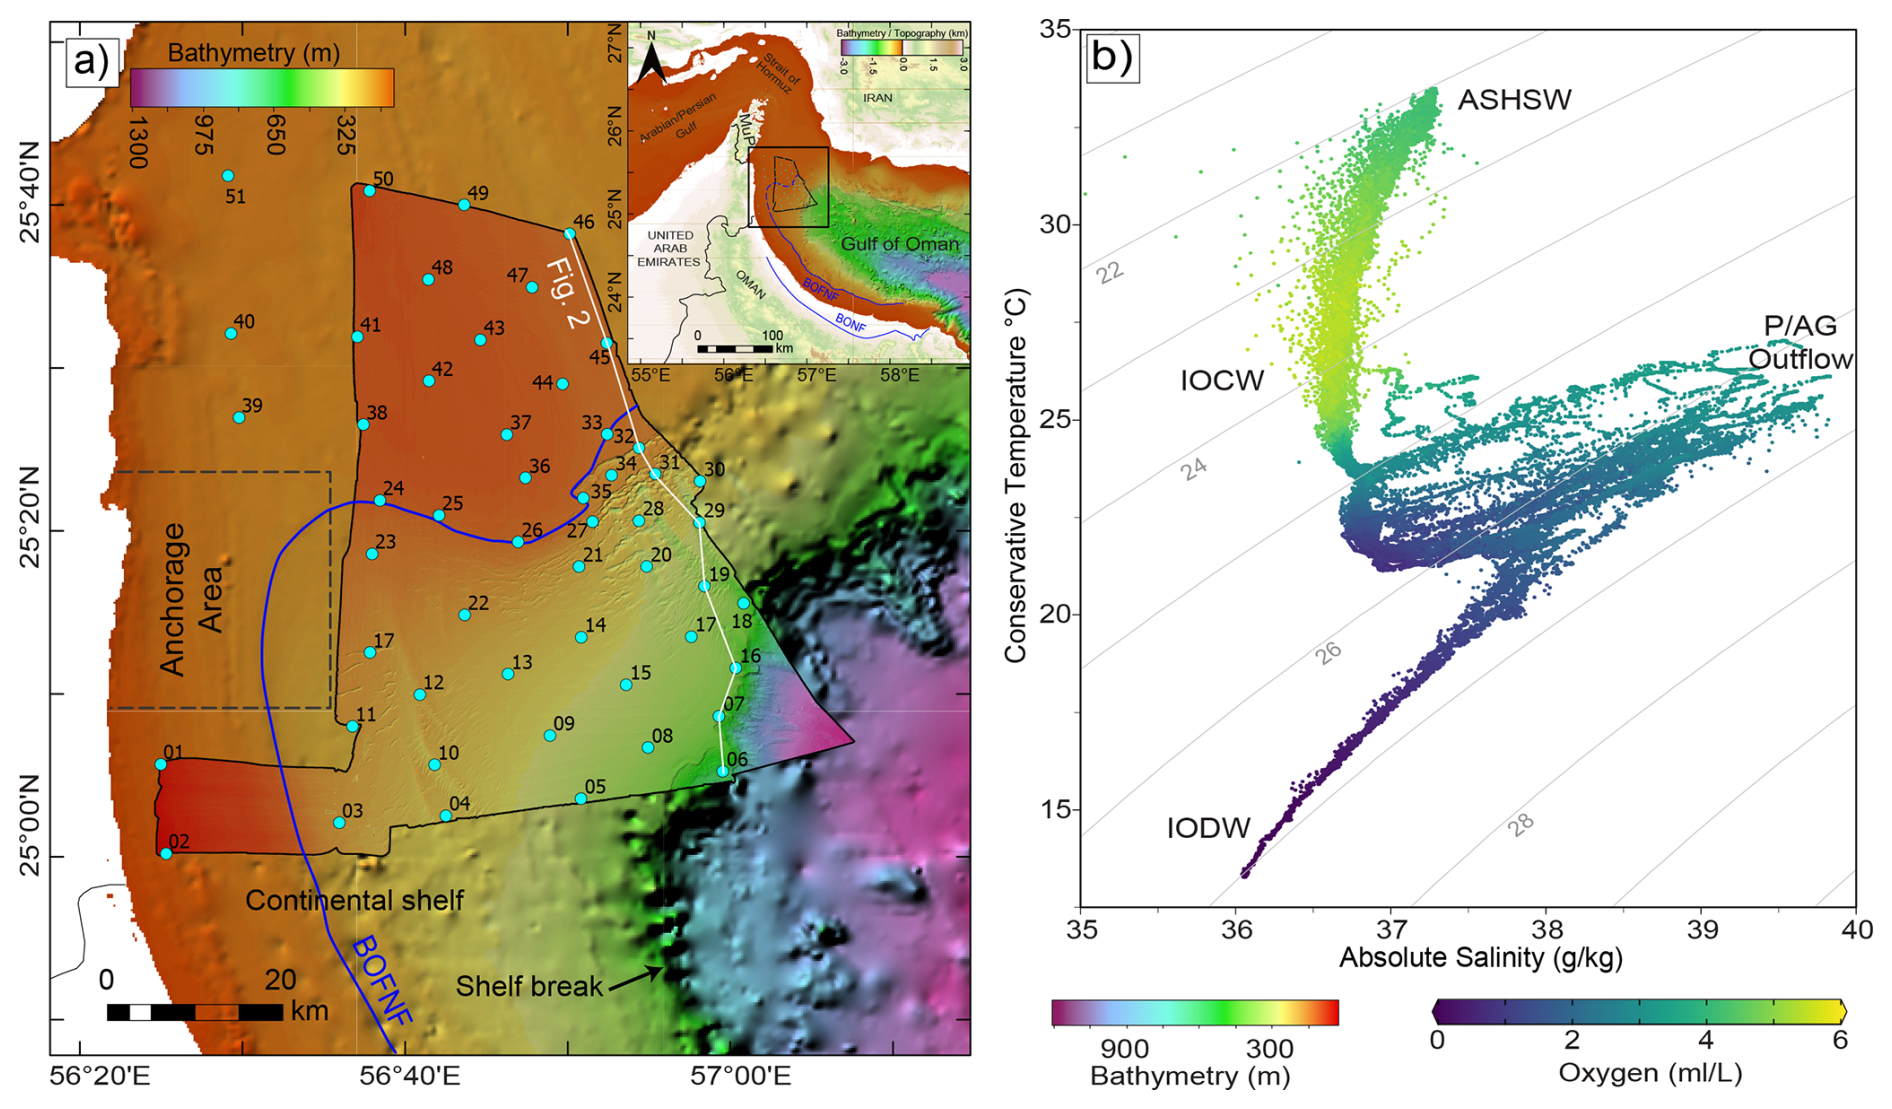
Figure 1Bathymetry and CTD data. (a) A high-resolution multibeam bathymetry of the northwestern Arabian Sea superimposed over regional bathymetry, showing acquired CTD data (cyan dots with station numbers), with an inset showing the P/AG and the Gulf of Oman as the mouth of the Arabian Sea. The white line denotes the CTD section of Fig. 2. (b) Absolute salinity versus conservative temperature plot showing four distinct water masses across the water column of the Arabian Sea. BOFNF stands for Batinah Offshore Normal Fault; ASHSW, Arabian Sea High Salinity Water; IOCW, Indian Ocean Central Water; IODW, Indian Ocean Deep Water; P/AG Outflow, Persian/Arabian Gulf Outflow.
2.2 Methods
2.2.1 CTD analysis and parameter mapping
Practical Salinity and in situ temperature were first converted to Absolute Salinity (SA) and Conservative Temperature (Θ) using the TEOS-10 Gibbs SeaWater MATLAB toolbox (McDougall and Barker, 2011). Vertical sections were generated for salinity, temperature, dissolved oxygen, pH, and turbidity – using Ocean Data Viewer (ODV; Schlitzer, 2024). The P/AG water fraction (P/AGwf) was calculated following Font et al. (2024) based on the composite-tracer approach of Jenkins (1999). The endpoints used are 1 °C and 34.86 g kg−1 for Indian Ocean Deep Water (IODW), 29.56 °C and 41.04 g kg−1 for P/AG water, and 23.45 °C and 36.37 g kg−1 for Indian Ocean Central Water (IOCW), similar to those of Font et al. (2024).
Parameter maps were produced for the deepest measurements (∼5 m above the seafloor). Additional maps of the upper depth of the outflow and its thickness (H) were derived using a P/AGwf threshold of ≥0.3. This threshold represents water parcels in which P/AG contributes at least 30 % of the local mixture and remains a substantial hydrographic component of the outflow. This more conservative threshold excludes weak peripheral P/AG water influence and better isolates the dynamically coherent mixed plume. The plume core is defined by P/AGwf≥0.55, corresponding to mixtures in which P/AG water is the dominant water mass component.
Turner angle (, αΘΘz−βΘ(SA)z)) and Brunt-Väisälä frequency squared () were then calculated using the TEOS-10 functions from individual CTD downcasts before horizontal interpolation. Where ΔSA, ΔΘ, and ΔP are the differences between absolute salinities, conservative temperatures, and pressures, respectively. ρ, βΘ, and αΘ are the density and saline contraction and thermal expansion coefficients, respectively. The calculated Tu values were classified into four regimes: statically unstable, °; diffusive convection, ; doubly stable, ; and salt fingering, (McDougall et al., 2009; McDougall and Barker, 2011; Roquet et al., 2015; Ruddick, 1983). Positive values of N2 represent statically stable stratification, and negative values represent density inversion. Density inversions were interpreted as physically meaningful overturning only where the associated density structure exceeded the adopted density-noise threshold and passed the Thorpe-overturn quality-control criteria (Sect. 2.2.2).
2.2.2 Hydrographic proxies for hydraulic adjustment and mixing
Because neither Acoustic Doppler Current Profiler (ADCP) current measurements nor turbulence microstructure profiles are available, hydrographic overturn proxies were used to quantify relative mixing intensity from the CTD density fine structure. These proxies are not interpreted as direct measurements of turbulent dissipation or absolute turbulent diffusivity. Instead, they are used to identify relative mixing hotspots along the section. The Thorpe length scale (LT), also called the Thorpe overturn scale (Thorpe, 1977), represents the root-mean-square vertical displacement required to reorder an unstable density overturn into a statically stable profile. Physically, LT is the vertical size of CTD-resolved density overturning. Larger LT indicates greater vertical reordering of water parcels and therefore stronger overturning evidence in the CTD profile (Galbraith and Kelley, 1996; Gargett and Garner, 2008; Jalali et al., 2017; Park et al., 2014).
The Thorpe analysis was performed on the CTD profiles and each used density profile was quality-controlled following Park et al. (2014) and Gargett and Garner (2008), retaining only vertically coherent, well-resolved overturns (Figs. S1–S4 and Table S1 in the Supplement). The Thorpe analysis was performed using the original-resolution profiles. Pressure reversals and observations with smoothed positive-down profiling speeds below 0.25 dbar s−1 (∼0.25 m s−1) were removed before the hydrographic and overturn analyses. Following Park et al. (2014), the first 20 m below the sea surface were excluded from the analysis because near-surface measurements are often highly contaminated, likely by turbulence generated by the hull. The density variable used for overturn detection was the potential density anomaly referenced to the surface or 0 dbar (σ0, IOC et al., 2010). Apparent density inversions were initially treated as candidate overturns. They were retained only if they were vertically coherent, exceeded the adopted density-noise threshold, and passed the overturn-ratio criterion. A fixed dataset-level effective residual density noise floor was estimated from detrended σ0 residuals within screened, locally well-mixed intervals. The median residual root-mean-square density variability was kg m−3. Thresholds corresponding to three-, four-, and fivefold this value were tested. The principal overturn distribution varied only slightly among these tests. The five-times-RMS value, kg m−3, was adopted for the primary analysis because it produced the clearest and most stable overturn boundaries while retaining the principal vertically coherent patches. The estimated RMS is interpreted as a dataset-specific effective residual noise floor that may include unresolved natural fine structure in addition to instrumental noise. Top-down and bottom-up intermediate-density profiles were constructed using the adopted density-noise threshold following Gargett and Garner (2008) and Park et al. (2014). The average of the top-down and bottom-up intermediate profiles was then used for the primary overturn analysis. Sensitivity tests using the measured, top-down, bottom-up, and averaged intermediate profiles showed that the averaged profile retained the principal overturns identified in both processing directions while minimizing isolated and direction-dependent features. Candidate overturn patches were identified using the MixSea Thorpe-reordering procedure (Voet et al., 2023). The overturn ratio (Ro), which represents a data-filtering criterion used to distinguish genuine turbulent density overturns from artificial, instrument-induced false inversions (Gargett and Garner, 2008), was also used. Only candidate patches satisfying Ro≥0.25 were retained. Sensitivity tests using Ro values from 0.10 to 0.30 produced the same principal overturn pattern, whereas Ro=0.35 removed several otherwise coherent patches. A minimum of 0.5 m for LT and 1.5 m for patch thickness were used as additional Thorpe QC criteria.
The Ozmidov length, Lo, represents the largest turbulent length scale that is not strongly constrained by stable stratification and was defined as ), where ϵ is the turbulent kinetic energy dissipation rate, and N is the buoyancy frequency. The empirical Dillon-type relationship was expressed as Lo=αLt, where α is the Ozmidov-to-Thorpe scale ratio. An α value of 0.80 was adopted. Combining the Ozmidov-scale definition with this relationship gives the Thorpe-derived dissipation proxy and therefore . The diapycnal diffusivity estimate based on Thorpe scales () was calculated using the Osborn relationship , which gives . A mixing efficiency of Γ=0.20 was assumed. Using α=0.80 and Γ=0.20 gives (Dillon, 1982; Ozmidov, 1965; Osborn, 1980). In the calculations, the average value of N2 over an overturn is used. The resulting LT, ϵT, and Kρ(T) estimates are interpreted as relative hydrographic indicators of overturning and mixing susceptibility rather than direct turbulence measurements.
The diffusivity estimates from Thorpe scale analysis bear large, unquantified uncertainties and can be interpreted as a mixing proxy; as relative indicators of mixing hotspots rather than absolute turbulence measurements (Fig. 3). The principal accepted overturn patches satisfied the profiling-speed, background-stratification, density-noise, overturn-ratio, and minimum patch thickness and LT criteria. Some patches nevertheless contain large pointwise Thorpe-displacement excursions associated with extended constant-density intervals in the averaged intermediate profile (Fig. S4). Because samples with identical intermediate-profile density values lack a unique stable sorting order, the precise magnitude and sign of individual Thorpe displacements may partly reflect sorting ambiguity. These excursions do not necessarily invalidate the corresponding overturn patch, but they increase the uncertainty of sample-scale displacement estimates.
Bathymetric roughness was quantified from the multibeam-derived bathymetric profile extracted along the CTD section. The horizontal resolution of the bathymetric grid, hence the bathymetric profile, is 10 m. For each along-section location, we calculated an effective local roughness amplitude, hr, as one half of the bathymetric relief within a moving window of ±1 km: , where Dmax and Dmin are the maximum and minimum depths within the window. The full window length is therefore 2 km. The roughness-to-plume-thickness ratio was then calculated as: hr H where H is the local P/AG plume thickness. This ratio is used here as a geometric relative roughness-height index, analogous to the roughness-height to current-depth ratios used in laboratory and numerical gravity-current studies, where obstacle or roughness height is normalized by the thickness of the dense current (Cenedese et al., 2018; Maggi et al., 2022; Ottolenghi et al., 2017; Özgökmen and Fischer, 2008). hr H is not a direct measurement of form drag, velocity shear, bottom stress, or turbulent dissipation; it is interpreted as a geometric plume-roughness interaction proxy and is evaluated together with CTD-derived plume thickening, P/AGwf decay, N2 structure, turbidity, and overturn-based mixing proxies.
To place the plume-thickness variations in a hydraulic context, we computed a critical velocity, , the along-section speed at which the Froude number of the bottom-attached layer, , equals unity. Here is the reduced gravity from the density contrast between the P/AG plume and the overlying ambient water, and H is the local plume thickness. The plume-to-ambient density contrast was calculated as , where ρp is the plume density (P/AGw-weighted mean potential density referenced to 0 dbar) and ρa is the ambient density (median potential density within the 50 m layer immediately above the plume top). A flow with speed exceeding ci is supercritical (Fr>1), and a slower flow is subcritical (Fr<1). Because current measurements are unavailable, the Froude number cannot be estimated but ci, calculated from hydrographic properties, provides a velocity scale that can be compared with independent current estimates from the literature. Because ci depends on the product g′H, downstream plume thickening may partly or fully compensate for a decrease in plume-to-ambient density contrast. It is interpreted as consistent with, rather than proof of, a change in hydraulic state.
3.1 Water mass structure and double-diffusive stability
Four distinct water masses were identified at the mouth of the Gulf of Oman during summer (Fig. 1b). The upper layer, termed Arabian Sea High-Salinity Water (ASHSW), is shallow and characterized by an absolute salinity of ∼37.2 g kg−1 and temperature of ∼33 °C. Indian Ocean Central Water has a salinity of ∼36.6 g kg−1 and temperature of ∼28 °C. The P/AG outflow exhibits very high salinity (37.0–39.8 g kg−1) and moderate temperatures of 20–27 °C. Indian Ocean Deep Water, the deepest layer, has lower temperatures (∼13–20 °C) and salinities (∼36.0–37.0 g kg−1). Oxygen concentrations are 4–5 mL L−1 in the Arabian Sea High-Salinity Water and 5–6 mL L−1 in IOCW. The P/AG outflow shows intermediate values (1.5–3.5 mL L−1), whereas IODW exhibits the lowest oxygen (<1 mL L−1).
The Turner-angle section (Fig. 2f) characterises the susceptibility of the water column to double diffusion between these water masses. Where the warm, salty P/AG core overlies cooler, fresher deep water (IODW), mainly where the plume detaches and lifts off the seabed, downstream conditions favour salt fingering at the base of the plume; the interior is largely doubly stable, with diffusive-convection-favourable conditions occurring where cooler, fresher water overlies the core (at depths of around 100–200 m, from station 32 to station 06). N2 distribution shows negative values, coinciding mainly with the Gulf outflow plume after the bathymetric step (at depths of around 150–300 m, from station 32 to station 06) (Sect. 3.3).
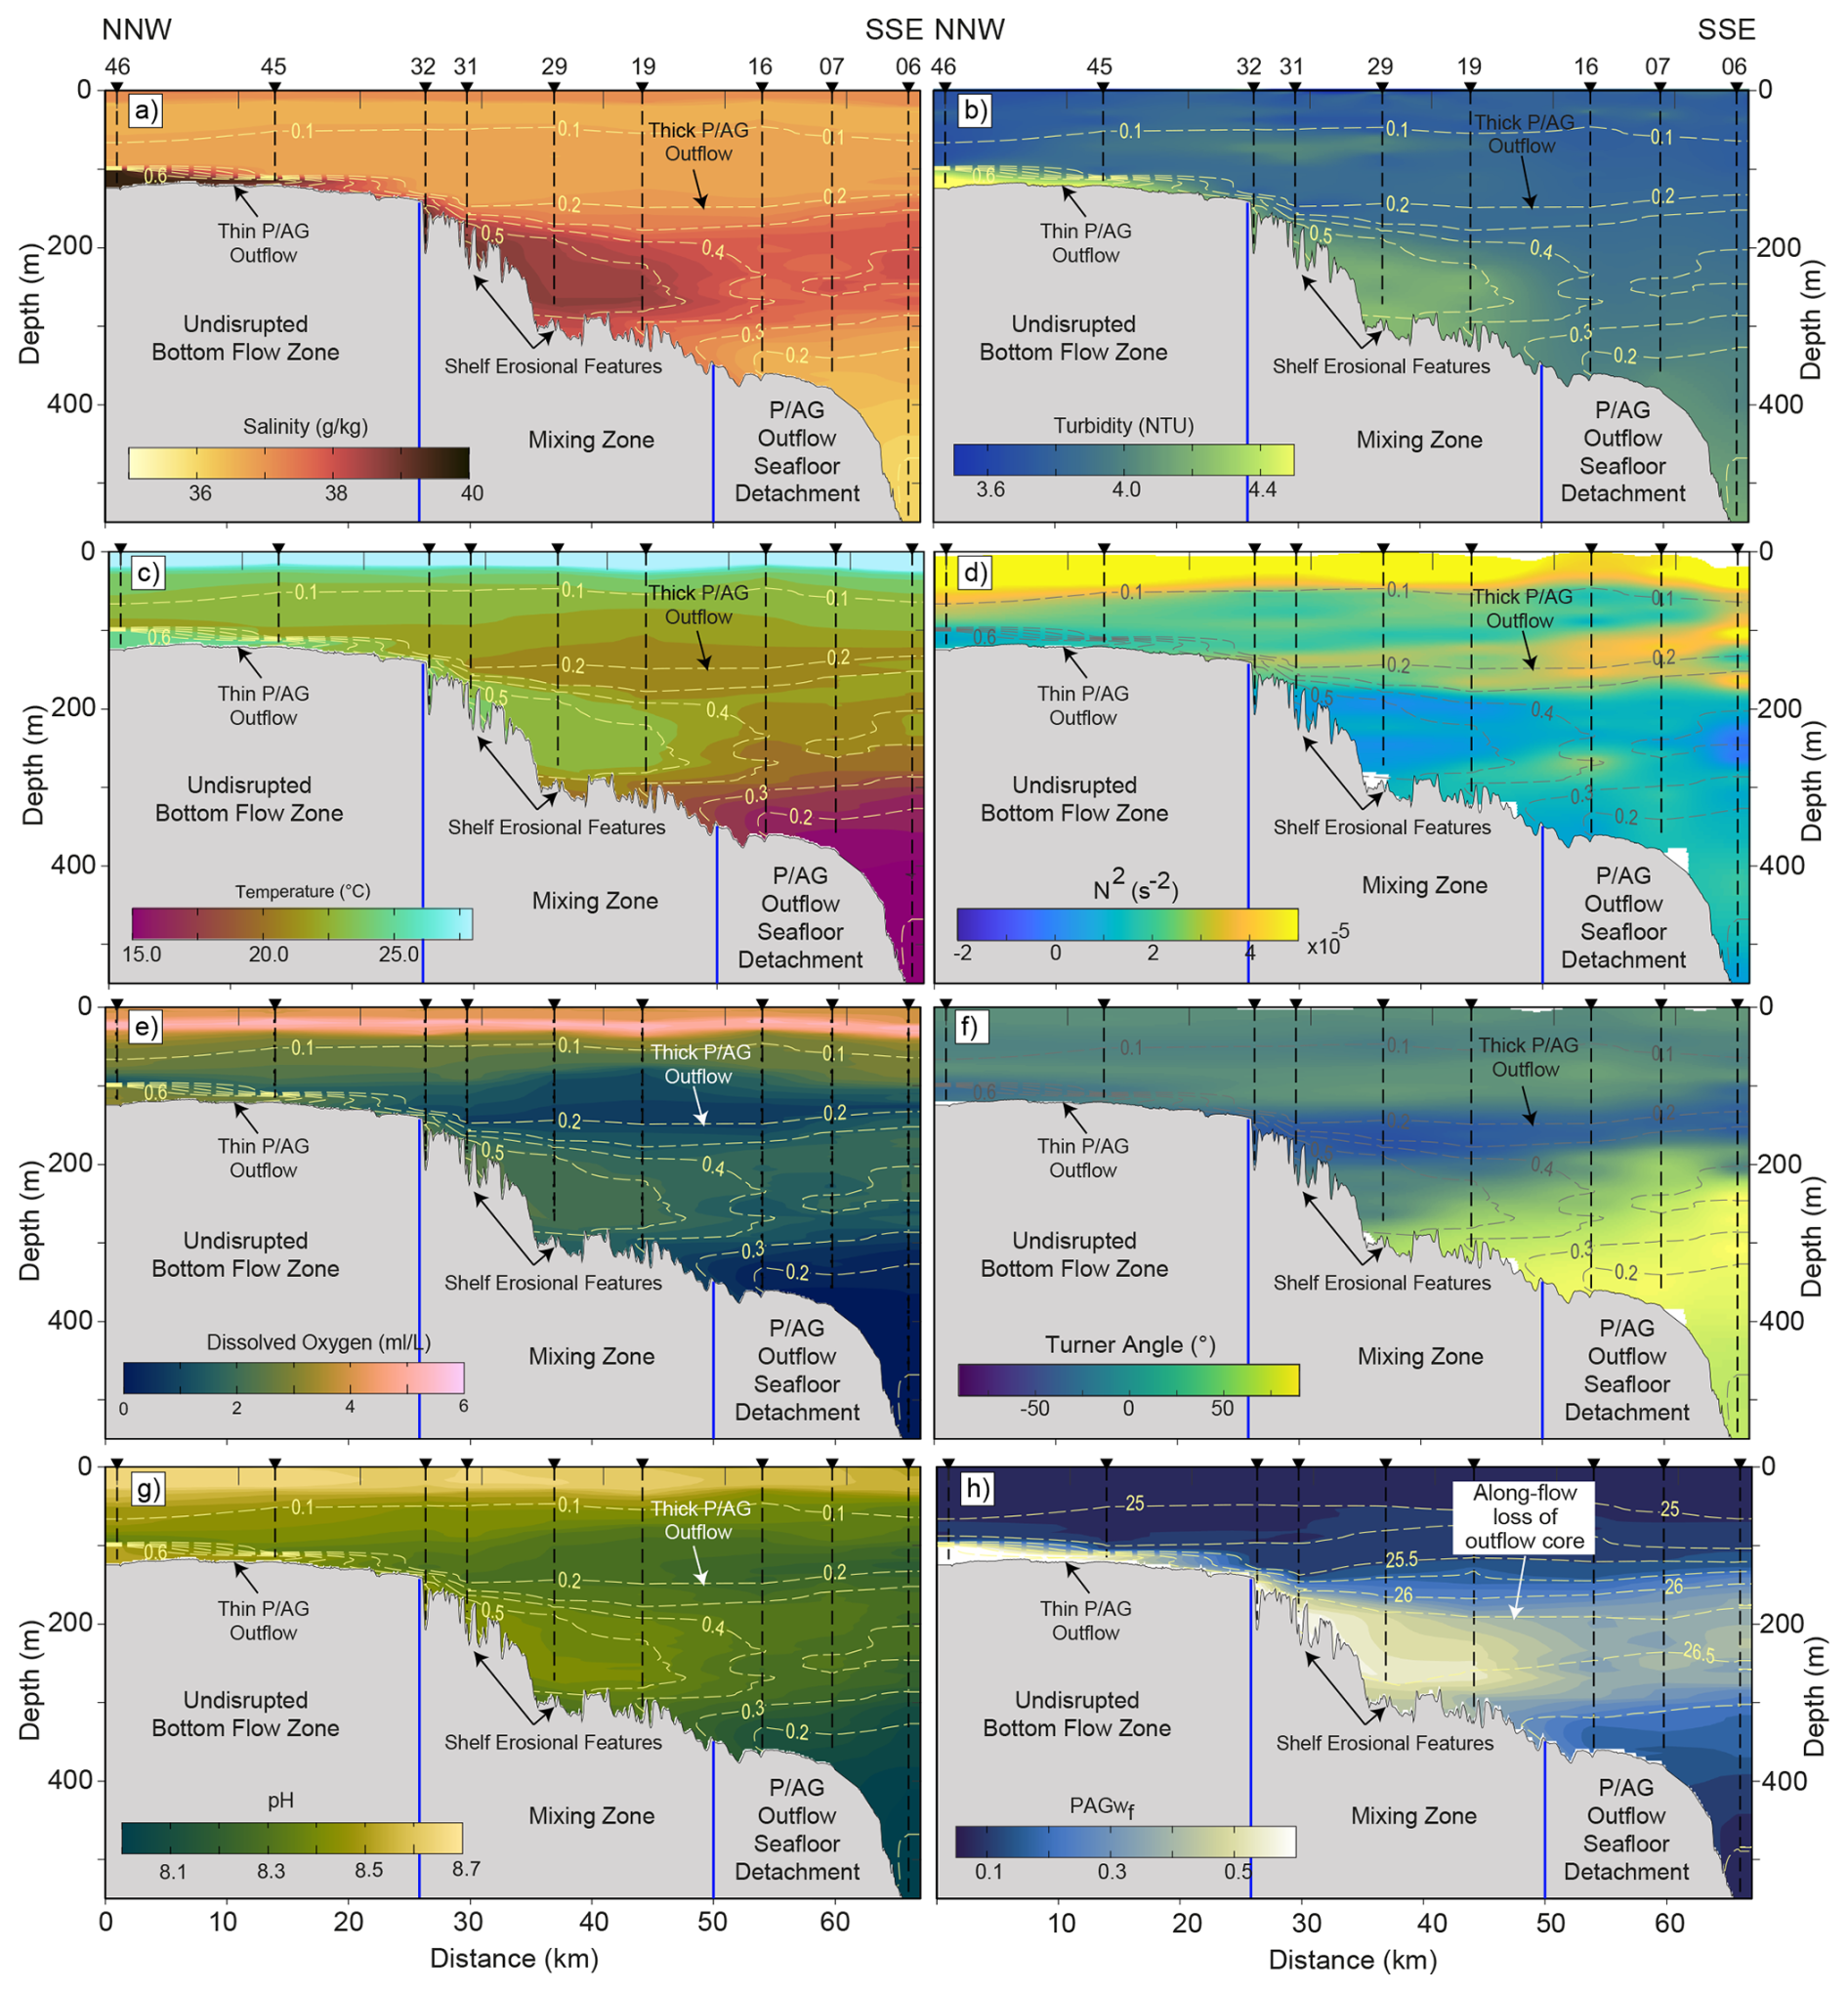
Figure 2An NNW-SSE CTD transect (along the hydrographically inferred P/AG plume corridor; the white line in Fig. 1a) showing P/AG outflow and its relation to the seafloor irregularities. The parameters include salinity (a), turbidity (b), temperature (c), Brunt-Väisälä frequency (d), dissolved oxygen (e), Turner angle (f), pH (g), and P/AGwf (h). (i) Along-transect thickness of the P/AG outflow core and main plume. (j) The local seabed roughness relative to the height and plume thickness (hr H), plotted with the plume thickness. (a)–(g) are superimposed by P/AGwf contours, whereas h is superimposed by density contours.
3.2 Characteristics and thickness variability of the P/AG outflow
The outflow forms a distinct layer characterized by elevated salinity, temperature, oxygen, and pH (Fig. 2a and b). As the outflow enters the Gulf of Oman, it separates into three lateral sectors. Across the mouth of the Gulf of Oman over relatively flat and shallow bathymetry (depths < 130 m) of the stable shelf, properties are highest (salinity ∼ 39.0 g kg−1, temperature ∼26 °C, oxygen ∼3.0 mL L−1, pH ∼ 8.51; Figs. 2a, c, e and 4a–c). Over the unstable shelf (depths of 130–370 m), which is characterized by pockmarks and erosional features, values decrease to ∼38.5 g kg−1, ∼23.5 °C, ∼2.5 mL L−1, and pH ∼ 8.42. Farther south over the lower shelf and upper slope (depths > 370 m), properties decline further (∼37.2 g kg−1, ∼22 °C, ∼2.0 mL L−1, pH ∼ 8.35). The western shallowest occurrence of the outflow is at ∼110 m depth. A high-turbidity layer occurs above the seafloor and thickens basinward from ∼20 m above the flat shelf to >400 m above the upper slope (Fig. 2a and b). P/AGwf values reach ∼0.7 over the stable shelf and exhibit along-flow lateral variations, largely coincident with the rough, eroded bathymetry. The outflow core and plume are thin over the stable shelf and are disrupted by rough bathymetry (Fig. 3c). The core fades shortly after these flow disruptions. The roughness-to-plume-thickness ratio (hr H) is used as a measure of the dynamical interaction between the P/AG outflow plume and the seabed. The hr H increases to >1 immediately after the bathymetric step (Fig. 3d, near station 32 southwards). The top of the outflow occurs at depths of 50–100 m above the flat shelf, with a very thin layer that has a thickness of 10–30 m, exhibiting a southeastward deepening and thickness increase (Fig. 4e and f). The upper depth of the P/AG outflow increases up to 170 m in the center, then becomes shallower at the extreme southern portions, reaching ∼130–140 m (Fig. 4e). The thickness increases up to 200 m above the lower shelf and upper slope (Fig. 4f).
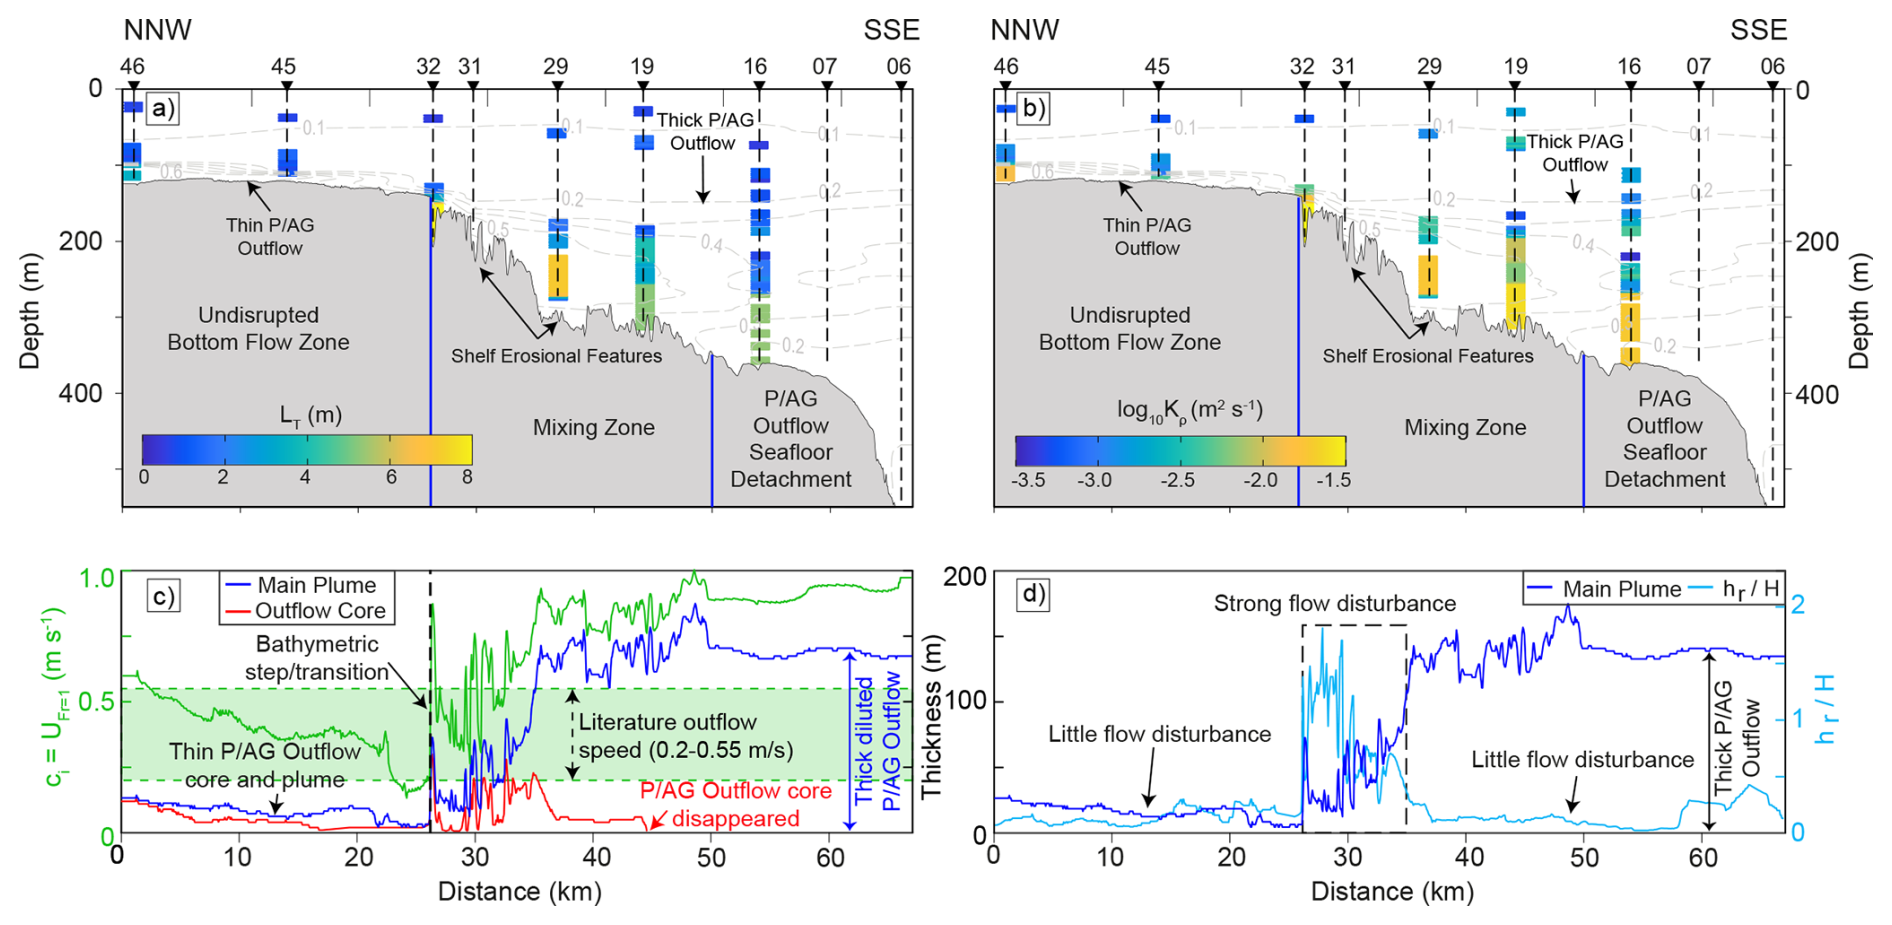
Figure 3An NNW-SSE CTD transect (along the hydrographically inferred P/AG plume corridor; the white line in Fig. 1a) showing CTD- and bathymetric-derived proxies. The parameters include Thorpe scale (a) and the diapycnal diffusivity (based on Thorpe scales) proxy (b) plotted for the accepted overturns only, as well as the along-transect thickness of the P/AG outflow core and main plume and the CTD-derived critical velocity, ci (c), and the roughness-to-plume thickness ratio hr H plotted with the plume thickness along the transect (d). (a) and (b) are superimposed by P/AGwf contours.
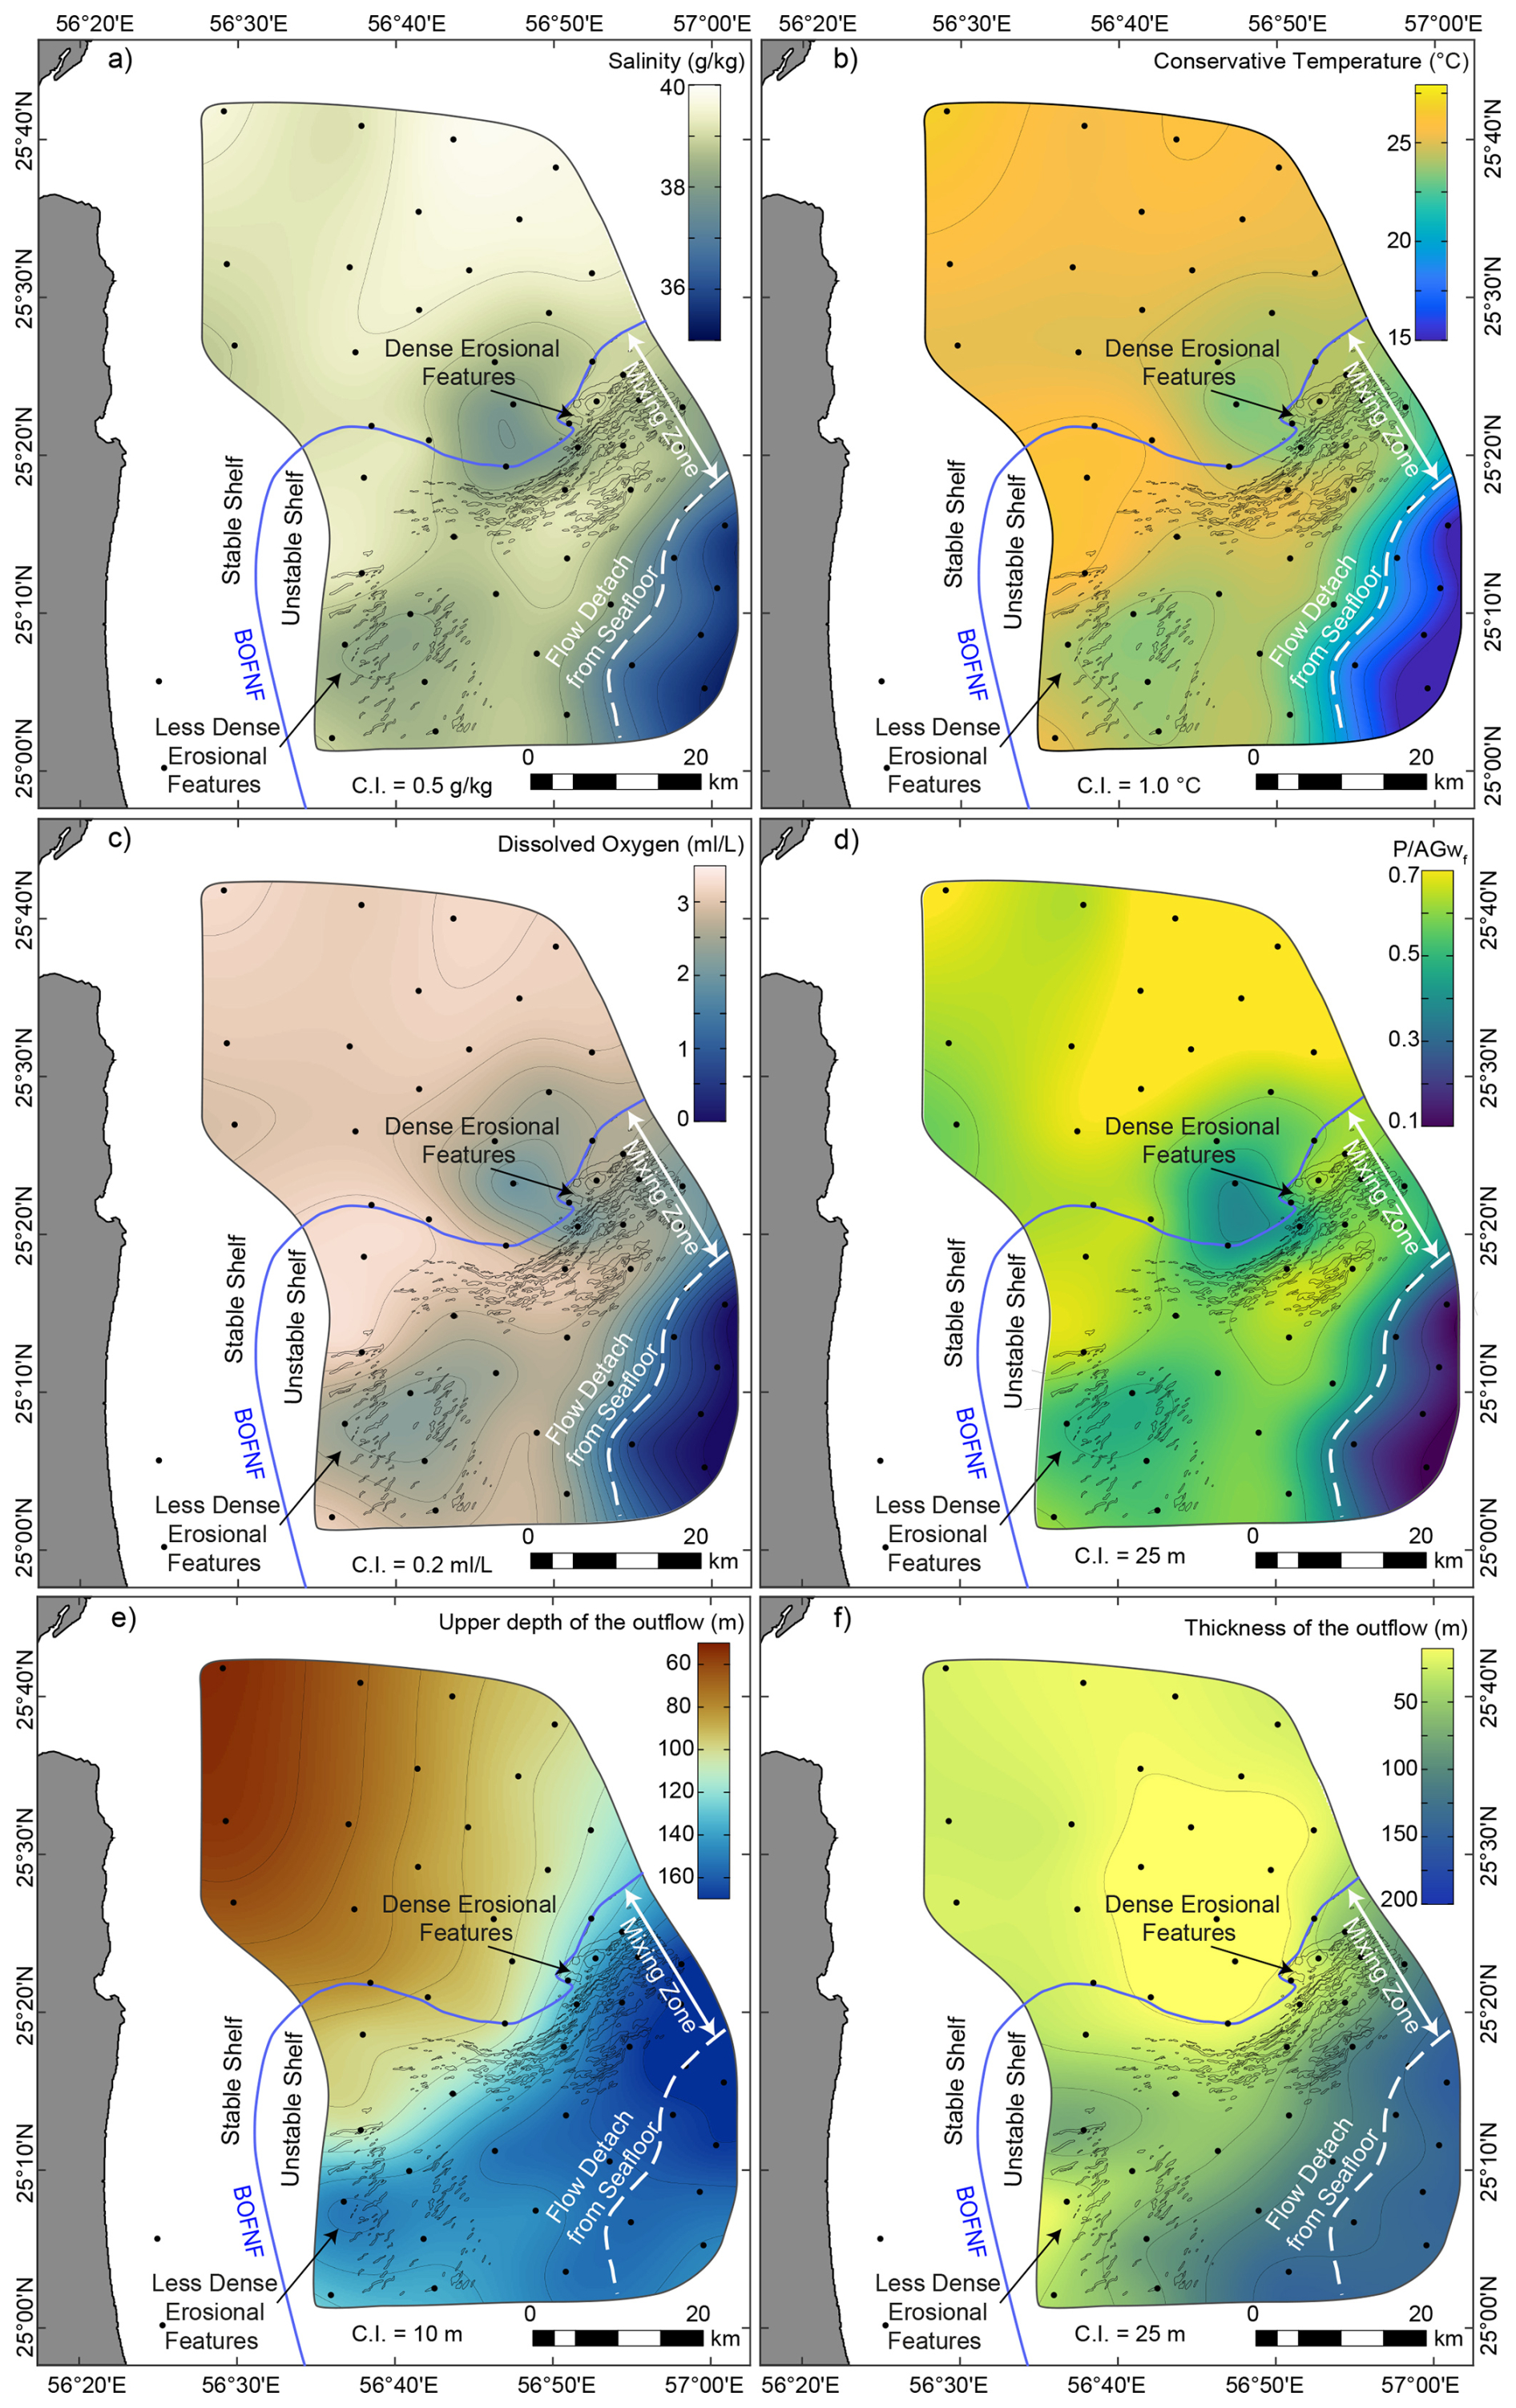
Figure 4Near-seafloor parameters maps, as well as maps for outflow top depth and thickness. CTD maps above the seafloor, including salinity, conservative temperature, oxygen content, and P/AGwf (a–d, respectively). The top depth and thickness variation of the P/AG outflow are also mapped (e, f, respectively).
The critical velocity ci mirrors this structure (Fig. 3c). Over the stable shelf ci is low, falling to a minimum of ∼0.15–0.20 m s−1 immediately upstream of the bathymetric step, where the plume is thinnest. At the step, ci increases sharply to ∼0.8 m s−1 with subsequent fluctuations and the eventual convergence to ∼0.8–1.0 m s−1 across the unstable shelf and downstream, following the thickening of the plume.
3.3 CTD-derived Thorpe-scale and diffusivity proxies
The Thorpe-scale section (Fig. 3a) shows that CTD-resolved density overturning is spatially heterogeneous along the P/AG outflow transect. Over the stable shelf, where the P/AG plume is thin and bottom-attached, LT values are generally low, indicating limited overturning within the compact plume. Toward the stable-to-unstable shelf transition (Fig. 3a, at station 32), LT increases coinciding with the zone where the plume thickness curve shows rapid thickening (Fig. 3c) and where the high-P/AGwf core begins to weaken (Fig. 2h). Across the rough unstable shelf, elevated LT extend through a broader part of the plume and its upper interface, consistent with stronger vertical reordering of density in the same sector where salinity, temperature, oxygen, and pH decrease downstream.
The section of diapycnal diffusivity based on the Thorpe scales, (Fig. 3b), shows a similar distribution along the transect. Low over the stable shelf (stations 45 and 46) reflects the limited overturning in the thin attached plume. Higher values (up to 0.03 m2 s−1 at station 32, depths of ∼150–200 m) occur mainly near the bathymetric transition and across the unstable shelf (e.g., ∼0.02 m2 s−1 at ∼250 m depth of station 29, ∼0.025 m2 s−1 at ∼300 m depth of station 19, and ∼0.025 m2 s−1 at ∼275–350 m depth of station 16), where the plume-thickness curve indicates rapid expansion of the P/AG layer (Fig. 3c) and the P/AGwf section shows progressive dilution of the plume core (Fig. 2h). These enhanced diffusivity-proxy patches indicate locations where CTD fine structure records stronger overturning and vertical exchange within the transforming outflow.
Comparison with the along-transect hr H curve (Fig. 3d) shows that the strongest Thorpe-derived signals occur where seabed roughness becomes large relative to the local P/AG plume thickness (Fig. 3a, b, and d). In the stable shelf sector, low hr H, small plume thickness, and weak Thorpe-derived signals are consistent with a compact, bottom-attached plume. Immediately after the bathymetric transition, hr H increases as roughness elements become comparable to the plume thickness, while the LT and sections show enhanced patchiness within the plume. Farther across the unstable shelf, the combined pattern of high or variable hr H, plume thickening, elevated LT, enhanced , P/AGwf decay, reduced oxygen, and increased turbidity supports localized roughness-modulated overturning and dilution of the P/AG plume.
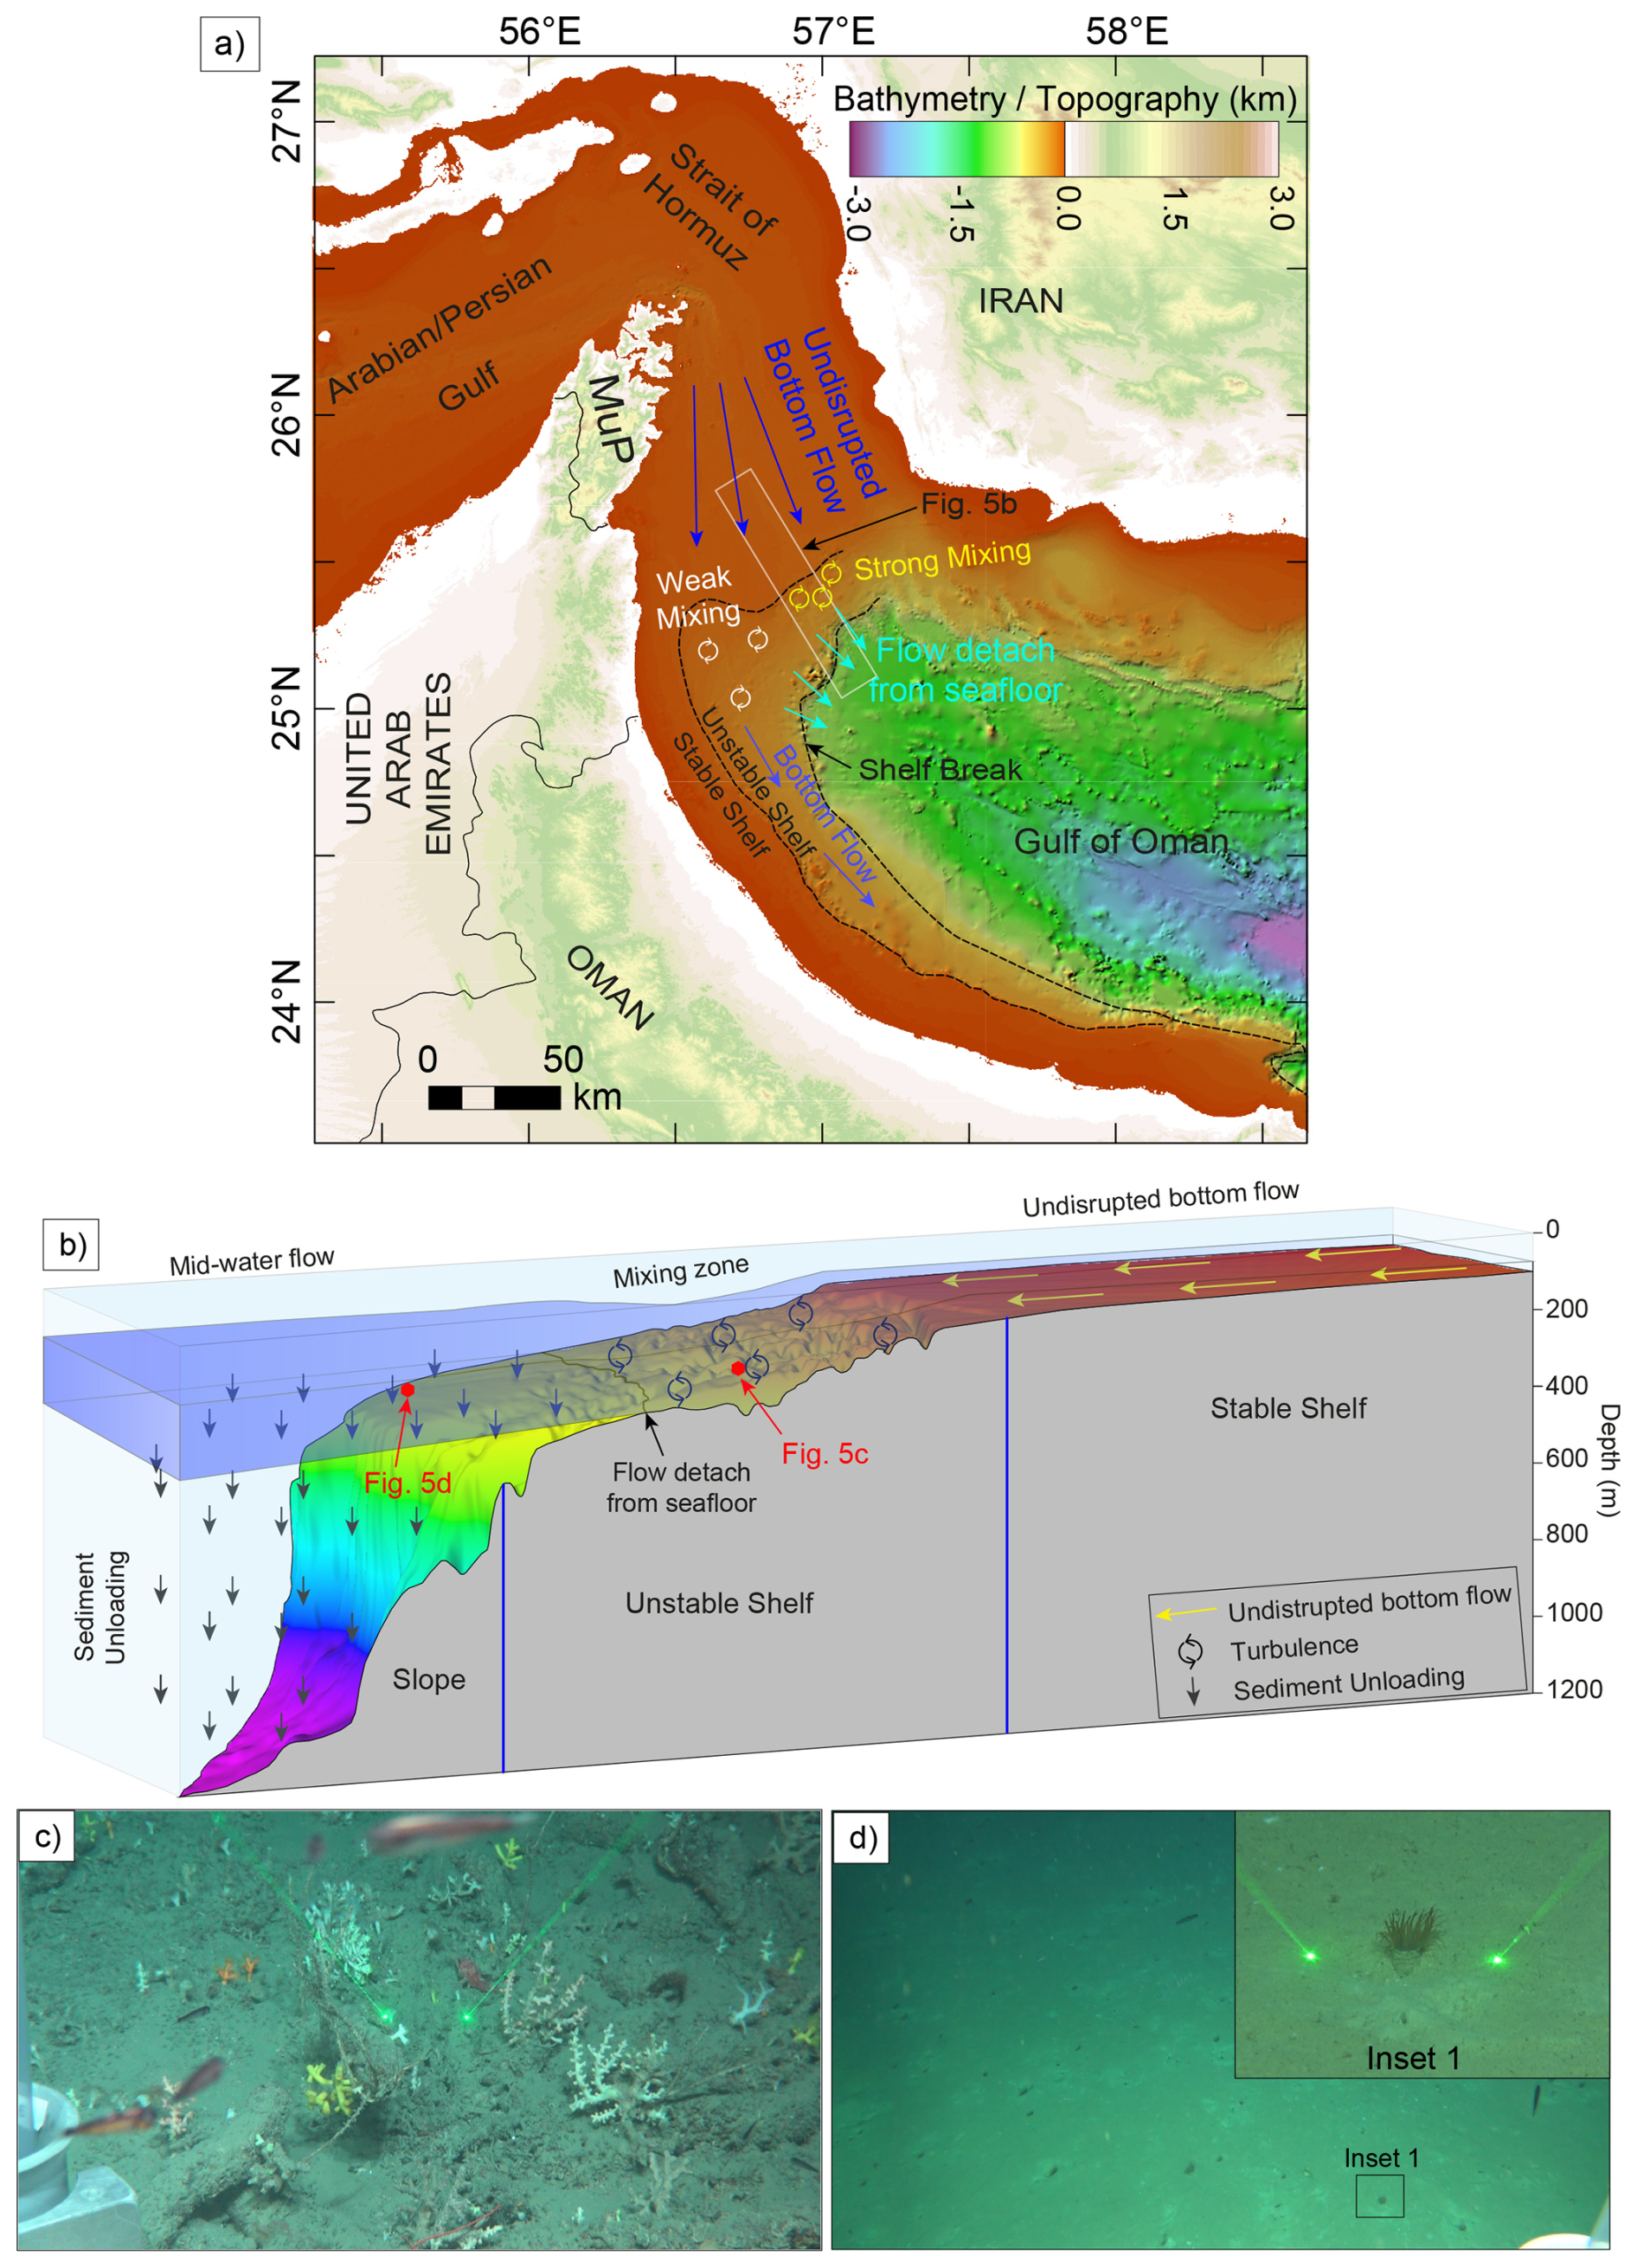
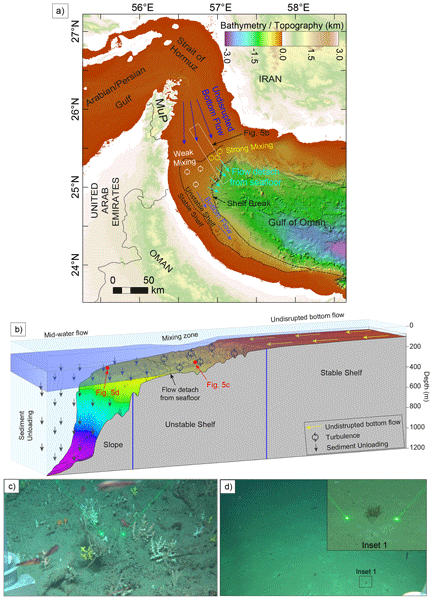
Figure 5Map and 3D illustration of the outflow behaviour, as well as comparison of benthic communities from the bottom-attached and -detached flow. (a) A map illustration of the outflow behaviour of the P/AG outflow relative to the bathymetry. (b) A 3D illustration of the P/AG outflow behaviour over the stable shelf, unstable shelf, and upper slope. (c) and (d) are photos from ROV dives from the mixing zone and another representing an area where the outflow detached from the seafloor, respectively.
3.4 Benthic evidence for P/AG outflow bottom attachment-detachment
Near-seafloor parameters (Fig. 4a–c) show sharp lateral transitions (salinity 38–36 g kg−1, conservative temperature 25–15 °C, oxygen 3 to <0.5 mL L−1) across the depth range where the outflow shifts from bottom-attached to detached flow. Where the outflow remains attached (Fig. 5c), the seabed consists of exposed or semi-consolidated substrate with little fine-sediment drape, consistent with persistent near-bottom shear and resuspension. At deeper sites where the near-bottom hydrographic signature of the outflow weakens (Fig. 5d), the seafloor is dominated by fine-sediment accumulation beneath a detached outflow layer.
Superimposed on this downstream decline are two localized patches of reduced near-bottom P/AGwf, accompanied by lower salinity, temperature and oxygen, one in the north (near station 36) and one to the southwest (Fig. 4a–d). In both, the outflow signal persists near the seabed but is locally weakened rather than absent.
ROV imagery from ∼284 m depth (Fig. 5c) shows a conspicuous epibenthic community on hard or firm ground, dominated by sessile suspension feeders. Branching azooxanthellate scleractinian colonies and octocorals are common, with additional scattered epifauna on exposed patches of substrate. This assemblage is consistent with a relatively energetic bottom boundary layer associated with the attached outflow. By contrast, imagery from ∼360 m depth (Fig. 5d) shows a flat, soft-sediment seabed with sparse epifauna; tube anemones, consistent with cerianthids, are present and locally abundant. This shift, from coral-bearing hard-substrate assemblages to soft-sediment, cerianthid-dominated assemblages, coincides with the hydrographic transition, providing an independent benthic indicator of attachment and separation of the outflow along the margin.
4.1 Distribution, mixing, and flow behaviour of the P/AG outflow
Hydrographic CTD measurements in the northwestern Arabian Sea reveal spatial variability in P/AG outflow characteristics. The continental shelf of the northeastern Arabian Plate margin is subdivided into two domains: a stable and an unstable shelf, based on the integration of multibeam bathymetry and seismic reflection data. The outflow waters exit the Strait of Hormuz, hugging the flat continental stable shelf bathymetry, with a very thin bottom-attached flow of 10–30 m (Figs. 2–4). This flow has high salinity, temperature, and density, resulting in negative buoyancy and a compact, coherent core with high P/AGwf and comparatively little dilution. The flow has a sharp upper interface (high N2), indicating stable stratification (Fig. 2d). Outflows exiting dense marginal seas typically begin as thin bottom-attached plumes before being transformed by entrainment (e.g., Bower et al., 2000).
At the transition from the stable to the unstable shelf, the abrupt bathymetric shift serves as the initial trigger for flow transformation. This transition marks an abrupt increase in the seafloor depths delimited by a major gravitational collapse, i.e., northern extension of the Batinah Offshore Normal Fault. The outflow suffers from rapid hydrographic and geometric adjustment, increasing in thickness from ∼20 to ∼170 m, with localized patches of N2<0 occurring in the immediate vicinity of the bathymetric transition/step (Figs. 2d and 4f). This situation is consistent with locally statically unstable stratification and transient density overturning during hydraulic adjustment of the bottom-attached plume across the bathymetric step (Alford et al., 2013; Jalali et al., 2017). This indicates the bathymetric step is dynamically active and likely promotes enhanced turbulent entrainment/mixing at the onset of plume transformation.
The critical-velocity estimate provides an independent, if indirect, line of support for this interpretation. Independent values for the P/AG outflow speed in this region are ∼0.2–0.55 m s−1 from moored-ADCP, lowered-ADCP, and model studies (Bower et al., 2000; Ezam et al., 2010; Pous et al., 2004a, b). The ci based on our CTD data falls to ∼0.15–0.20 m s−1 upstream of the step (Fig. 3e) which is below the estimates from the literature, implying near-critical to supercritical conditions (Fr≳1) over the thin, bottom-attached plume. Downstream of the step, ci rises to ∼0.8–1.0 m s−1, exceeding those same speeds and implying subcritical conditions (Fr<1). A transition from supercritical to subcritical flow across a topographic step is the signature of a hydraulic jump and is consistent with the abrupt thickening, the transient N2<0, and the enhanced overturn proxies at the same location (Figs. 2d and 3a–c). We stress that the historical current data are non-synoptic and that ci increases partly because the plume thickens, so this comparison is indicative rather than a direct measurement of hydraulic state. Consistent with this, model results place the maximum outflow velocity where the bottom slope steepens (Ezam et al., 2010).
The unstable shelf has extensive crescent-shaped and elongated pockmarks and irregularities on the seafloor (Abdelmaksoud et al., 2025b). Within this domain, the outflow is characterized by lower salinity, temperature, and oxygen content than the undisrupted flow above the stable shelf, with continued plume thickening and weakening of P/AGwf. The outflow in this domain exhibits disruption, and its compact core eventually fades. Its ambient interface is consistent with sustained interfacial entrainment/mixing, dilution of the dense core, and the development of a thicker, more diffuse interfacial mixing layer. Mechanistically, the roughness effect is expressed in terms of roughness height relative to plume thickness, hr H. The hr H exceeds unity immediately after the bathymetric step. Where the roughness elements become a substantial fraction of plume thickness, they enhance form drag, wake generation, and near-bottom turbulence, thereby sustaining entrainment and dilution across the pockmarked shelf sector (Cenedese and Adduce, 2010; Cenedese et al., 2018; Maggi et al., 2022; Ottolenghi et al., 2017; Özgökmen and Fischer, 2008). This situation is consistent with roughness-enhanced boundary-layer turbulence and hydraulic transitions documented for other marginal-sea overflows (Peters and Johns, 2005; Price et al., 1993).
Once the P/AG outflow water gains enough buoyancy, it begins to detach from the seafloor above the unstable shelf and to flow at an intermediate level (Fig. 5). The detached flow from the seafloor has lower salinity, temperature, and oxygen content, with its top occurring higher in the water column, i.e., towards shallower depths (Figs. 2–4). The intensity of the mixing and dilution of the P/AG outflow changes across the unstable shelf domain. This intensity is broadly consistent with the density of seafloor irregularities and with the plume thickening downstream of the bathymetric step, with higher-mixing zones tending to occur where irregularities are denser (Fig. 5a).
Over the lower shelf to the upper slope, the near-bottom P/AG outflow signatures weaken strongly, and the P/AGwf near the seabed becomes small or disappears (Fig. 2h), indicating that the bottom attachment is lost and the plume persists higher in the water column. The outflow transitions into a detached intermediate-depth plume, following from the preceding thickening and dilution across the unstable shelf. The disappearance of the pronounced N2 maximum at the upper plume interface (Fig. 2d, at station 46 southward to station 32 and at 100–150 m depths) shortly after the stable-unstable shelf transition or bathymetric step (Fig. 2d, at station 29 and around 150 m depth) is consistent with erosion of the initially sharp plume to the ambient density interface by entrainment and dilution until the bottom-attached gravity current can no longer maintain a clear near-bottom density excess. Farther offshore, the gradual re-establishment of moderate N2 suggests formation of a new, weaker and broader interface around the detached plume as it adjusts toward its intermediate intrusion/neutral-buoyancy depth (Fig. 2d, at stations 16, 07, and 06 at 100–150 m depths). The detached intermediate-depth plume/intrusion exhibits continued along-slope propagation, and the maps (Fig. 4) suggest that, throughout the study area, the plume remains organized as a margin following, bathymetrically steered boundary plume/current, with a clear shallow-side/upslope limit imposed by the shelf morphology. Along-path dilution of the intermediate-depth plume within the Gulf of Oman is also evident, with the plume exhibiting P/AGwf of around 0.4 near the mouth of the Gulf (this study, Fig. 2h), and the value is reduced to less than 0.3 to the south across the Omani Margin (Font et al., 2024).
The two near-bottom low-P/AGwf patches around stations 36 and 11 (Fig. S5) are interpreted as localized lateral interleaving of ambient, lower-P/AG water into the near-bottom outflow layer. On the σ0=26 isopycnal, which removes the effect of plume thickness and depth, the P/AGwf field shows a lateral structure (Fig. S5), indicating interleaving of P/AG-rich and P/AG-poor water across the shelf. Such interleaving is expected at the margins of the boundary plume, where mesoscale and submesoscale stirring can peel P/AG water from the boundary and draws ambient water inward (L'Hégaret et al., 2016; Vic et al., 2015). Because the survey is non-synoptic, a partly transient origin, such as plume meandering on sub-seasonal timescales (Pous et al., 2004a, b), cannot be excluded. Internal tides are well documented in the Gulf of Oman, with generation attributed to tidal flow across the shelf break off the Musandam Peninsula (Small and Martin, 2002) and to steep topography within the Strait of Hormuz (Subeesh et al., 2025); moored records further southeast on the Al-Batinah shelf show a predominantly diurnal, shoreward-propagating internal tide of largely remote origin (Bruss et al., 2026). Reported pycnocline displacements are of order 10–25 m, so internal tides can displace a density interface on diurnal to semidiurnal timescales. Because each station represents a single snapshot, aliasing of the internal-tide phase may contribute to the observed patchiness, although the present data cannot separate this from mesoscale and submesoscale stirring. The patches are therefore not attributed to the seabed erosional features, and there is no evidence that they represent local detachment of the outflow.
The Thorpe-scale analysis provides a quantitative hydrographic basis for interpreting the fine structure and step-like density profiles observed along the P/AG outflow pathway. Elevated LT and occur preferentially near the stable-to-unstable shelf transition and across the rough bathymetry, where the P/AG plume thickens, the P/AGwf core weakens, and the sharp upper-interface N2 maximum is eroded. LT and estimates are not direct microstructure measurements, and their interpretation is constrained by standard CTD-overturn quality-control requirements and by the known uncertainty of overturn-based estimates near rough topography (Galbraith and Kelley, 1996; Gargett and Garner, 2008; Jalali et al., 2017). Nevertheless, their spatial coincidence with high hr H, plume thickening, P/AGwf decay, turbidity enhancement, oxygen reduction, and weakening of the upper plume interface supports the interpretation that bathymetric roughness modulates localized overturning and dilution of the P/AG plume. This relationship is strongest where the hydrographic overturn proxies coincide with the bathymetric transition and rough seabed sectors, whereas isolated overturns outside the plume or away from rough terrain are interpreted more cautiously because they may also reflect internal-wave activity, mesoscale intrusion, or double-diffusive layering.
Double diffusion is intrinsic to the P/AG outflow: its warm, salty core overlies cooler, fresher deep water, favouring salt fingering at the base of the plume, consistent with salt fingering reported beneath P/AG water further downstream in the Sea of Oman (Font et al., 2024) and in the Arabian Sea (L'Hégaret et al., 2021). Because double diffusion operates within statically stable stratification (N2>0) and transfers heat and salt across the plume's interfaces without producing density inversions, the salt-fingering and diffusive-convection regimes (Fig. 2f) are dynamically distinct from the overturning detected by the Thorpe scale (Fig. 3a and b). Double diffusion contributes to the slow, along-path erosion of the plume's salinity, temperature, and oxygen contrasts, whereas the abrupt transformation at the bathymetric step is driven by hydraulic adjustment and overturning. In the hierarchy of processes acting on the outflow it is therefore a secondary, background contributor to interface erosion, rather than the primary driver of the step-localised transformation. The Turner angle diagnoses only susceptibility to double diffusion, not its flux, which, having a lower effective diffusivity and a different mixing efficiency than shear-driven turbulence, is not captured by and cannot be quantified without microstructure data.
The outflow results in further erosion and deepening of the seafloor irregularities of the unstable shelf. The outflow water then carries the erosional products and deposits its load directly after detaching from the seafloor above the lower shelf and slope (Fig. 2b). Strong bottom flows over rough bathymetry are known to maintain thick bottom nepheloid layers through resuspension (McCave, 1986; Gardner et al., 2018). Marine nepheloid layers, particularly bottom nepheloid layers on continental margins, mark loci of active suspension and redeposition driven by energetic near-bed currents (Biscaye and Eittreim, 1977; Gardner et al., 2018).
4.2 Impact of the P/AG outflow on benthic life
Benthic zonation closely follows the attachment behaviour of P/AG outflow. Where the outflow remains bottom-attached, conditions consistent with an energetic near-bed boundary layer limit fine-sediment accumulation, maintaining exposed or semi-consolidated substrate and enhancing delivery of suspended particles and oxygenated water. Such conditions favor sessile suspension feeders, including corals and other epifauna, consistent with the importance of hydrodynamics and substrate availability in deep-water coral ecosystems (Flach et al., 1998; Roberts et al., 2006).
Below the detachment depth, fine sediments dominate and the hydrographic signature weakens, indicating lower-energy, lower-oxygen conditions. Cerianthid tube anemones commonly occur on such soft substrates and can form distinctive assemblages observable in video surveys (Davies et al., 2014; Flach, 2002). The thick nepheloid layer along the lower shelf and slope may further enhance food supply by retaining suspended organic matter, acting as a reservoir redistributed by mixing (Hanz et al., 2019). These patterns provide a biological imprint of boundary-layer dynamics and independently support the hydrographic interpretation of outflow attachment and separation.
4.3 Implications for OMZ ventilation and climate sensitivity of the P/AG outflow
P/AG outflow brings high-oxygen waters from the Arabian Gulf to the Arabian Sea-OMZ, thereby ventilating the OMZ. Glider observations off Oman directly demonstrate that P/AG water supplies oxygen to the OMZ at intermediate depths, quantifying its ventilation contribution along the slope (Font et al., 2024). Modeling further indicates that changes in Gulf properties can modulate OMZ intensity by altering the density and ventilation potential of exported P/AG water (Lachkar et al., 2019). Downstream changes in the oxygen content and pH of the outflow water show consistent dilution and oxygen loss along the continental shelf. Layer fine structure and step-like profiles along transects indicate active mixing above the seafloor. These results provide a high-resolution continuous mapping of P/AG outflow O2 modification along the continental shelf, linking local mixing intensity to the outflow's potential to ventilate the upper oxycline of the Arabian Sea. The spatial correspondence between P/AG outflow persistence and elevated near-bottom oxygen levels suggests that the upper oxycline is effectively ventilated. Where the shelf-trapped P/AG water layer is strongest and most persistent, near-bottom oxygen is elevated relative to adjacent waters, indicating effective ventilation near the upper oxycline depths (Font et al., 2024; Swift and Bower, 2003). Downstream maps show progressive oxygen reduction along the outflow pathway basinwards, reflecting dilution and consumption (Fig. 5). As mixing intensity varies across the stable-unstable shelf boundary, depending on seafloor roughness, the magnitude and spatial footprint of P/AG outflow ventilation depend on local thickness, attachment state, and mixing intensity.
The attachment–detachment thresholds documented here imply that the P/AG outflow's pathway is sensitive to moderate shifts in source-water density, which depends strongly on the Gulf surface temperature and evaporation. Warming in the P/AG would reduce outflow density, alter lift-off depths, modify downstream oxygen delivery, and potentially reorganize benthic zonation along the margin, indicating a climatically sensitive mechanism. Interannual to decadal changes in evaporation and heat content modulate the density contrast across the Strait of Hormuz and, by extension, the strength and properties of the exported outflow (Campos et al., 2020).
High-resolution hydrographic mapping along the Oman–UAE margin shows that the P/AG outflow transforms from a thin, bottom-attached plume over the smoother shelf into a thicker, more diluted, and partly detached intermediate-depth plume across the rough unstable shelf and upper slope. This transformation is marked by downstream decreases in salinity, temperature, oxygen, and pH, together with plume thickening, weakening of the P/AGwf core, erosion of the upper-interface stratification, and enhanced turbidity. The transformation is initiated by hydraulic adjustment at the bathymetric step, with bathymetric roughness further modulating plume dilution, overturning susceptibility, sediment resuspension, and detachment across the unstable shelf, where these processes become most pronounced. ROV observations provide an independent benthic expression of this transition, with attached-flow sectors associated with exposed substrate and coral-dominated communities, and detached-flow sectors associated with finer sediments and cerianthid assemblages. These results suggest that future changes in P/AG source-water density may alter plume pathways, lift-off depth, oxygen delivery, and benthic zonation along the margin
The used TEOS-10 GSW MATLAB toolbox is publicly available (McDougall and Barker, 2011), and the MixSea library is open-source (https://doi.org/10.5281/zenodo.10636077, Voet et al., 2023). The Ocean Data Viewer (ODV; Schlitzer, 2024) is publicly available.
The bathymetry and CTD profiles are archived at Zenodo repository (https://doi.org/10.5281/zenodo.17160219, Abdelmaksoud et al., 2025a and https://doi.org/10.5281/zenodo.19200743, Abdelmaksoud et al., 2026). The regional bathymetry and topography dataset is publicly available (https://doi.org/10.5285/37c52e96-24ea-67ce-e063-7086abc05f29, GEBCO Compilation Group, 2025).
The supplement related to this article is available online at https://doi.org/10.5194/os-22-3369-2026-supplement.
AA, AHA, and MYA conceptualized the study. AA performed data curation and formal analysis, and wrote the manuscript draft. AHA, MYA, GB, and KSM reviewed and edited the manuscript.
The contact author has declared that none of the authors has any competing interests.
Publisher's note: Copernicus Publications remains neutral with regard to jurisdictional claims made in the text, published maps, institutional affiliations, or any other geographical representation in this paper. The authors bear the ultimate responsibility for providing appropriate place names. Views expressed in the text are those of the authors and do not necessarily reflect the views of the publisher.
This research was supported by Khalifa University of Science and Technology. We thank the Environment Agency Abu Dhabi (EAD) for providing access to their vessel, Jaywun, to acquire the CTD and bathymetry data. We thank Moamen Ali and Omar Aldhanhani (Khalifa University) as well as the EAD team and the Jaywun crew for their help in acquiring the data. The R/V OceanXplorer crew (led by Mattie Rodrigue and Andrew Craig) are also thanked for their appreciated efforts in collecting the ROV imagery.
This research has been funded by the Khalifa University of Science, Technology and Research (grant no. KU-INT-RIG-2024-8474000756).
This paper was edited by Ilker Fer and reviewed by two anonymous referees.
Abdelmaksoud, A., Ali, M., and Al-Suwaidi, A.: Formation Mechanism of Seafloor Gas Seeps and Pockmarks at Active Continental Margins: Insights from the Gulf of Oman, Zenodo [data set], https://doi.org/10.5281/zenodo.17160219, 2025a.
Abdelmaksoud, A., Al-Suwaidi, A., Ali, M., Shah, A., Almehairbi, S. S., Al Ali, L. M., and Ali, M. Y.: Evidence of pockmarks and seafloor gas venting in the northwestern Arabian Sea, Commun. Earth Environ., 6, 41, https://doi.org/10.1038/s43247-025-02009-6, 2025b.
Abdelmaksoud, A., Al-Suwaidi, A., and Ali, M.: CTD profiles at the mouth of the Gulf of Oman (acquired July 2025), Zenodo [data set], https://doi.org/10.5281/zenodo.19200743, 2026.
Alford, M. H., Girton, J. B., Voet, G., Carter, G. S., Mickett, J. B., and Klymak, J. M.: Turbulent mixing and hydraulic control of abyssal water in the Samoan Passage, Geophys. Res. Lett., 40, 4668–4674, https://doi.org/10.1002/grl.50684, 2013.
Biscaye, P. E. and Eittreim, S. L.: Suspended particulate loads and transports in the nepheloid layer of the abyssal Atlantic Ocean, Mar. Geol., 23, 155–172, https://doi.org/10.1016/0025-3227(77)90087-1, 1977.
Bower, A. S., Hunt, H. D., and Price, J. F.: Character and dynamics of the Red Sea and Persian Gulf outflows, J. Geophys. Res.-Oceans, 105, 6387–6414, https://doi.org/10.1029/1999JC900297, 2000.
Brewer, P. G. and Dyrssen, D.: Chemical Oceanography of the Persian Gulf, Prog. Oceanogr., 14, 41–55, https://doi.org/10.1016/0079-6611(85)90004-7, 1985.
Bruss, G. A., Font, E., Queste, B. Y., and Hall, R. A.: Internal tides on the Al-Batinah shelf: evolution, structure and predictability, Ocean Sci., 22, 31–47, https://doi.org/10.5194/os-22-31-2026, 2026.
Campos, E. J. D., Gordon, A. L., Kjerfve, B., Vieira, F., and Cavalcante, G.: Freshwater budget in the Persian (Arabian) Gulf and exchanges at the Strait of Hormuz, PLOS ONE, 15, e0233090, https://doi.org/10.1371/journal.pone.0233090, 2020.
Cenedese, C. and Adduce, C.: A new parameterization for entrainment in overflows, J. Phys. Oceanogr., 40, 1835-1850, https://doi.org/10.1175/2010JPO4374.1, 2010.
Cenedese, C., Nokes, R., and Hyatt, J.: Lock-exchange gravity currents over rough bottoms, Environ. Fluid Mech., 18, 59-73, https://doi.org/10.1007/s10652-016-9501-0, 2018.
Davies, J. S., Howell, K. L., Stewart, H. A., Guinan, J., and Golding, N.: Defining biological assemblages (biotopes) of conservation interest in the submarine canyons of the South West Approaches (offshore United Kingdom) for use in marine habitat mapping, Deep-Sea Res. Pt. II, 104, 208–229, https://doi.org/10.1016/j.dsr2.2014.02.001, 2014.
Davila, X., Olsen, A., Lauvset, S. K., McDonagh, E. L., Brakstad, A., and Gebbie, G.: On the origins of open ocean oxygen minimum zones, J. Geophys. Res.-Oceans, 128, e2023JC019677, https://doi.org/10.1029/2023JC019677, 2023.
Dillon, T. M.: Vertical overturns: A comparison of Thorpe and Ozmidov length scales, J. Geophys. Res.-Oceans, 87, 9601–9613, https://doi.org/10.1029/JC087iC12p09601, 1982.
Ditkovsky, S., Resplandy, L., and Busecke, J.: Unique ocean circulation pathways reshape the Indian Ocean oxygen minimum zone with warming, Biogeosciences, 20, 4711–4736, https://doi.org/10.5194/bg-20-4711-2023, 2023.
Ezam, M., Bidokhti, A. A., and Javid, A. H.: Numerical simulations of spreading of the Persian Gulf outflow into the Oman Sea, Ocean Sci., 6, 887–900, https://doi.org/10.5194/os-6-887-2010, 2010.
Flach, E.: Factors controlling soft bottom macrofauna along and across European continental margins, in: Ocean margin systems, edited by: Wefer, G., Billett, D., Hebbeln, D., Jørgensen, B., Schlüter, M., and van Weering, T., Springer, Berlin, Heidelberg, 351–363, https://doi.org/10.1007/978-3-662-05127-6_22, 2002.
Flach, E., Lavaleye, M., De Stigter, H., and Thomsen, L.: Feeding types of the benthic community and particle transport across the slope of the NW European continental margin (Goban Spur), Prog. Oceanogr., 42, 209–231, https://doi.org/10.1016/S0079-6611(98)00035-4, 1998.
Font, J., Swart, S., Bruss, G. A., Sheehan, P. M. F., Heywood, K. J., and Queste, B. Y.: Ventilation of the Arabian Sea Oxygen Minimum Zone by Persian Gulf Water, J. Geophys. Res.-Oceans, 129, e2023JC020668, https://doi.org/10.1029/2023JC020668, 2024.
Galbraith, P. S. and Kelley, D. E.: Identifying overturns in CTD profiles, J. Atmos. Ocean. Tech., 13, 688–702, https://doi.org/10.1175/1520-0426(1996)013<0688:IOICP>2.0.CO;2, 1996.
Gardner, W. D., Richardson, M. J., and Mishonov, A. V.: Global assessment of benthic nepheloid layers and linkage with upper ocean dynamics, Earth Planet. Sc. Lett., 482, 126–134, https://doi.org/10.1016/j.epsl.2017.11.008, 2018.
Gargett, A. and Garner, T.: Determining Thorpe scales from ship-lowered CTD density profiles, J. Atmos. Ocean. Tech., 25, 1657–1670, https://doi.org/10.1175/2008JTECHO541.1, 2008.
GEBCO Compilation Group: GEBCO 2025 Grid, GEBCO Compilation Group [data set], https://doi.org/10.5285/37c52e96-24ea-67ce-e063-7086abc05f29, 2025.
Gruber, N. and Galloway, J. N.: An Earth-system perspective of the global nitrogen cycle, Nature, 451, 293–296, https://doi.org/10.1038/nature06592, 2008.
Hanz, U., Wienberg, C., Hebbeln, D., Duineveld, G., Lavaleye, M., Juva, K., Dullo, W.-C., Freiwald, A., Tamborrino, L., and Reichart, G.-J.: Environmental factors influencing benthic communities in the oxygen minimum zones on the Angolan and Namibian margins, Biogeosciences, 16, 4337–4356, https://doi.org/10.5194/bg-16-4337-2019, 2019.
Hood, R., Rixen, T., Lévy, M., Hansell, D. A., Coles, V. J., and Lachkar, Z.: Oxygen, carbon and pH variability in the Indian Ocean, in: The Indian Ocean and its role in the global climate system, edited by: Ummenhofer, C. and Hood, R., Elsevier, 265–291, https://doi.org/10.1016/B978-0-12-822698-8.00017-2, 2024.
IOC, SCOR, and IAPSO: The international thermodynamic equation of seawater – 2010: Calculation and use of thermodynamic properties, Intergovernmental Oceanographic Commission, UNESCO Manuals and Guides, 56, 196, UNESCO, https://unesdoc.unesco.org/ark:/48223/pf0000188170 (last access: 6 October 2026), 2010.
Jain, V., Shankar, D., Vinayachandran, P. N., Kankonkar, A., Chatterjee, A., Amol, P., Almeida, A. M., Michael, G. S., Mukherjee, A., Chatterjee, M., Fernandes, R., Luis, R., Kamble, A., Hegde, A. K., Chatterjee, S., Das, U., and Neema, C. P.: Evidence for the existence of Persian Gulf Water and Red Sea Water in the Bay of Bengal, Clim. Dynam., 48, 3207–3226, https://doi.org/10.1007/s00382-016-3259-4, 2017.
Jalali, M., Chalamalla, V. K., and Sarkar, S.: On the accuracy of overturn-based estimates of turbulent dissipation at rough topography, J. Phys. Oceanogr., 47, 513–532, https://doi.org/10.1175/JPO-D-15-0169.1, 2017.
Jenkins, A.: The impact of melting ice on ocean waters, J. Phys. Oceanogr., 29, 2370–2381, https://doi.org/10.1175/1520-0485(1999)029<2370:TIOMIO>2.0.CO;2, 1999.
Lachkar, Z., Lévy, M., and Smith, K. S.: Strong Intensification of the Arabian Sea Oxygen Minimum Zone in Response to Arabian Gulf Warming, Geophys. Res. Lett., 46, 5420–5429, https://doi.org/10.1029/2018GL081631, 2019.
Lachkar, Z., Mehari, M., Lévy, M., Paparella, F., and Burt, J. A.: Recent expansion and intensification of hypoxia in the Arabian Gulf and its drivers, Front. Mar. Sci., 9, 891378, https://doi.org/10.3389/fmars.2022.891378, 2022.
Lachkar, Z., Lévy, M., Hailegeorgis, D., and Vallivattathillam, P.: Differences in recent and future trends in the Arabian Sea oxygen minimum zone: processes and uncertainties, Front. Mar. Sci., 10, 1122043, https://doi.org/10.3389/fmars.2023.1122043, 2023.
L'Hégaret, P., Duarte, R., Carton, X., Vic, C., Ciani, D., Baraille, R., and Corréard, S.: Mesoscale variability in the Arabian Sea from HYCOM model results and observations: Impact on the Persian Gulf Water path, Ocean Sci., 11, 667–693, https://doi.org/10.5194/os-11-667-2015, 2015.
L'Hégaret, P., Carton, X., Louazel, S., and Boutin, G.: Mesoscale eddies and submesoscale structures of Persian Gulf Water off the Omani coast in spring 2011, Ocean Sci., 12, 687–701, https://doi.org/10.5194/os-12-687-2016, 2016.
L'Hégaret, P., de Marez, C., Morvan, M., Meunier, T., and Carton, X.: Spreading and Vertical Structure of the Persian Gulf and Red Sea Outflows in the Northwestern Indian Ocean, J. Geophys. Res.-Oceans, 126, e2019JC015983, https://doi.org/10.1029/2019JC015983, 2021.
Maggi, M. R., Adduce, C., and Negretti, M. E.: Lock-release gravity currents propagating over roughness elements, Environ. Fluid Mech., 22, 383–402, https://doi.org/10.1007/s10652-022-09845-6, 2022.
McCave, I.: Local and global aspects of the bottom nepheloid layers in the world ocean, Neth. J. Sea Res., 20, 167–181, https://doi.org/10.1016/0077-7579(86)90040-2, 1986.
McDougall, T., Feistel, R., Millero, F. J., Jackett, D., Wright, D., King, B., Marion, G., Chen, C.-T. A., Spitzer, P., and Seitz, S.: The international thermodynamic equation of seawater 2010 (TEOS-10): Calculation and use of thermodynamic properties, Global ship-based repeat hydrography manual, IOCCP report no. 14, IOCCP, https://www.teos-10.org/ (last access: 5 October 2026), 2009.
McDougall, T. J. and Barker, P. M.: Getting started with TEOS-10 and the Gibbs Seawater (GSW) oceanographic toolbox, 127, SCOR/IAPSO WG, 1–28, ISBN 978-0-646-55621-5, http://www.teos-10.org/pubs/Getting_Started.pdf (last access: 5 October 2026), 2011.
Melet, A. V., Hallberg, R., and Marshall, D. P.: The role of ocean mixing in the climate system, in: Ocean mixing: Drivers, Mechanisms and Impacts, edited by: Meredith, M. and Garabato, A. N., Elsevier, 5–34, https://doi.org/10.1016/B978-0-12-821512-8.00009-8, 2022.
Osborn, T. R.: Estimates of the local rate of vertical diffusion from dissipation measurements, J. Phys. Oceanogr., 10, 83–89, https://doi.org/10.1175/1520-0485(1980)010<0083:EOTLRO>2.0.CO;2, 1980.
Ottolenghi, L., Cenedese, C., and Adduce, C.: Entrainment in a dense current flowing down a rough sloping bottom in a rotating fluid, J. Phys. Oceanogr., 47, 485–498, https://doi.org/10.1175/JPO-D-16-0175.1, 2017.
Özgökmen, T. M. and Fischer, P. F.: On the role of bottom roughness in overflows, Ocean Model., 20, 336–361, https://doi.org/10.1016/j.ocemod.2007.10.004, 2008.
Ozmidov, R. V.: On the turbulent exchange in a stably stratified ocean, Izv. Acad. Ser. USSR Atmos. Oceanic Phys. Engl. Transl., 1, 493–497, 1965.
Park, Y.-H., Lee, J.-H., Durand, I., and Hong, C.-S.: Validation of Thorpe-scale-derived vertical diffusivities against microstructure measurements in the Kerguelen region, Biogeosciences, 11, 6927–6937, https://doi.org/10.5194/bg-11-6927-2014, 2014.
Peters, H. and Johns, W. E.: Mixing and entrainment in the Red Sea outflow plume. Part II: Turbulence characteristics, J. Phys. Oceanogr., 35, 584–600, https://doi.org/10.1175/JPO2689.1, 2005.
Pous, S., Carton, X., and Lazure, P.: Hydrology and circulation in the Strait of Hormuz and the Gulf of Oman. Results from the GOGP99 experiment: Part I. Strait of Hormuz, J. Geophys. Res.-Oceans, 109, C12037, https://doi.org/10.1029/2003JC002145, 2004a.
Pous, S., Carton, X., and Lazure, P.: Hydrology and circulation in the Strait of Hormuz and the Gulf of Oman. Results from the GOGP99 experiment: Part II. Gulf of Oman, J. Geophys. Res.-Oceans, 109, C12038, https://doi.org/10.1029/2003JC002146, 2004b.
Prasad, T. G., Ikeda, M., and Kumar, S. P.: Seasonal spreading of the Persian Gulf Water mass in the Arabian Sea, J. Geophys. Res.-Oceans, 106, 17059–17071, https://doi.org/10.1029/2000JC000480, 2001.
Pratt, L. J. and Lundberg, P. A.: Hydraulics of rotating strait and sill flow, Annu. Rev. Fluid Mech., 23, 81–106, https://doi.org/10.1146/annurev.fl.23.010191.000501, 1991.
Price, J. F., Baringer, M. O. N., Lueck, R. G., Johnson, G. C., Ambar, I., Parrilla, G., Cantos, A., Kennelly, M. A., and Sanford, T. B.: Mediterranean outflow mixing and dynamics, Science, 259, 1277–1282, https://doi.org/10.1126/science.259.5099.1277, 1993.
Queste, B. Y., Vic, C., Heywood, K. J., and Piontkovski, S. A.: Physical controls on oxygen distribution and denitrification potential in the north west Arabian Sea, Geophys. Res. Lett., 45, 4143–4152, https://doi.org/10.1029/2017GL076666, 2018.
Rixen, T., Cowie, G., Gaye, B., Goes, J., do Rosário Gomes, H., Hood, R., Lachkar, Z., Schmidt, H., Segschneider, J., and Singh, A.: Reviews and syntheses: Present, past, and future of the oxygen minimum zone in the northern Indian Ocean, Biogeosciences, 17, 6051–6080, https://doi.org/10.5194/bg-17-6051-2020, 2020.
Roberts, J. M., Wheeler, A. J., and Freiwald, A.: Reefs of the deep: the biology and geology of cold-water coral ecosystems, Science, 312, 543–547, https://doi.org/10.1126/science.1119861, 2006.
Roquet, F., Madec, G., McDougall, T. J., and Barker, P. M.: Accurate polynomial expressions for the density and specific volume of seawater using the TEOS-10 standard, Ocean Model., 90, 29–43, https://doi.org/10.1016/j.ocemod.2015.04.002, 2015.
Ruddick, B.: A practical indicator of the stability of the water column to double-diffusive activity, Deep-Sea Res. Pt. A, 30, 1105–1107, https://doi.org/10.1016/0198-0149(83)90063-8, 1983.
Schlitzer, R.: Ocean data view, https://odv.awi.de (last access: 15 May 2026), 2024.
Schmidt, H., Getzlaff, J., Löptien, U., and Oschlies, A.: Causes of uncertainties in the representation of the Arabian Sea oxygen minimum zone in CMIP5 models, Ocean Sci., 17, 1303–1320, https://doi.org/10.5194/os-17-1303-2021, 2021.
Sheehan, P. M. F., Webber, B. G. M., Sanchez-Franks, A., Matthews, A. J., Heywood, K. J., and Vinayachandran, P. N.: Injection of oxygenated Persian Gulf Water into the southern Bay of Bengal, Geophys. Res. Lett., 47, e2020GL087773, https://doi.org/10.1029/2020GL087773, 2020.
Small, J. and Martin, J.: The generation of non-linear internal waves in the Gulf of Oman, Cont. Shelf Res., 22, 1153–1182, https://doi.org/10.1016/S0278-4343(01)00094-2, 2002.
Stramma, L., Schmidtko, S., Levin, L. A., and Johnson, G. C.: Ocean oxygen minima expansions and their biological impacts, Deep-Sea Res. Pt. I, 57, 587–595, https://doi.org/10.1016/j.dsr.2010.01.005, 2010.
Subeesh, M., Song, H., Addad, Y., Scott, J. R., Marshall, J., and Al Shehhi, M. R.: Seasonality of internal tides in the Strait of Hormuz: observations and modeling, J. Geophys. Res.-Oceans, 130, e2024JC021007, https://doi.org/10.1029/2024JC021007, 2025.
Swift, S. A. and Bower, A. S.: Formation and circulation of dense water in the Persian/Arabian Gulf, J. Geophys. Res.-Oceans, 108, 4-1–4-21, https://doi.org/10.1029/2002JC001360, 2003.
Thorpe, S. A.: Turbulence and mixing in a Scottish loch, Philos. T. Roy. Soc. Lond. A, 286, 125–181, 1977.
Turner, J.: Salt fingers across a density interface, Deep-Sea Res. Oceanogr. Abstr., 14, 599–611, https://doi.org/10.1016/0011-7471(67)90066-6, 1967.
Vic, C., Roullet, G., Capet, X., Carton, X., Molemaker, M. J., and Gula, J.: Eddy-topography interactions and the fate of the Persian Gulf Outflow, J. Geophys. Res.-Oceans, 120, 6700–6717, https://doi.org/10.1002/2015JC011033, 2015.
Voet, G., Drake, H., and Cusack, J.: modscripps/mixsea: v0.1.2, Zenodo [code], https://doi.org/10.5281/zenodo.10636077, 2023.
Yao, F. and Johns, W. E.: A HYCOM modeling study of the Persian Gulf: 2. Formation and export of Persian Gulf Water, J. Geophys. Res.-Oceans, 115, C11018, https://doi.org/10.1029/2009JC005788, 2010.