
the Creative Commons Attribution 4.0 License.
the Creative Commons Attribution 4.0 License.
 | 27 Aug 2026
Water masses in the Atlantic Ocean: water mass ages and ventilation
Mian Liu
Toste Tanhua
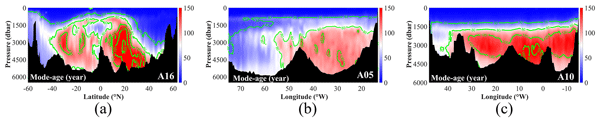
The distribution of water masses and their characteristics, including ventilation, provides fundamental insights into large-scale oceanographic processes such as thermohaline circulation and marine biogeochemical cycles. The characteristics of main water masses in the Atlantic Ocean have been comprehensively documented in a companion study (Liu and Tanhua, 2021); this study presents quantitative assessments of water mass age characteristics and ventilation time scales through an analysis using the transient tracers chlorofluorocarbon-12 (CFC-12), sulfur hexafluoride (SF6), and argon-39 (39Ar). We use two distinct age concepts: mean-age as an integrative metric of water mass chronology, and mode-age as a proxy for advective time scales. Under our fixed transit-time distribution shape (), the two ages are linearly related (mode-age ≈ 0.162⋅ mean-age). Here we mainly report mode-ages; the corresponding mean-ages can be obtained by dividing with 0.162. Empirical results demonstrate systematic age progression with increasing depth and along water mass trajectories. Surface layer central waters exhibit mode ages up to ∼ 30 years (mean-age ∼ 100 years). In the intermediate layer, meridional age gradients characterize the Antarctic Intermediate Water (AAIW) reaching maximum mode-age ∼ 80 years (mean-age ∼ 300 years) at 30° N, whereas zonal variations manifest in Mediterranean Water (MW) with peak mode-ages ∼ 100 years (mean-age ∼ 400 years) observed in equatorial regions. As the dominant deep water component, North Atlantic Deep Water (NADW) exhibits extreme ages in the Antarctic Circumpolar Current (ACC) region at 50° S, achieving mode-age ∼ 100 years (mean-age ∼ 600 years). Bottom layer water masses display their oldest signatures: Antarctic Bottom Water (AABW) from the Weddell Sea reaches mode-age ∼ 100 years (mean-age ∼ 600 years) at equatorial latitudes, while its extension, Northeast Atlantic Bottom Water (NEABW), attains exceptional values of mode-age ∼ 120 years (mean-age ∼ 800 years) at 50° N. The age analysis reveals significant basin-scale asymmetries, with western basins exhibiting younger ages compared to eastern counterparts. Ventilation efficiency modulates these age distributions, as evidenced by lower mode-ages and reduced apparent oxygen utilization (AOU) in better-ventilated western basins. The calculated oxygen utilization rate (OUR) demonstrates spatial concordance with dissolved oxygen (DO) concentrations, corroborating enhanced oxidative processes in high-oxygen regimes. This integrated age framework provides novel insights into water mass ventilation dynamics and their biogeochemical implications through quantitative characterization of temporal-spatial age distributions across multiple oceanographic provinces.
- Article
(20818 KB) - Full-text XML
-
Supplement
(2350 KB) - BibTeX
- EndNote


The Atlantic Ocean is composed by a complex vertical stratification of water masses characterized by differences in properties such as salinity, temperature and oxygen. Liu and Tanhua (2021) have systematically characterized 16 main water masses that have been extensively considered and studied due to their significant impacts on ocean circulation patterns and global climate regulation (e.g., Hall and Bryden, 1982; Bryden et al., 2005; Kuhlbrodt et al., 2007; Clark et al., 2012). Ocean ventilation constitutes a fundamental thermohaline process responsible for the vertical displacement of surface waters into the deep ocean, effectively redistributing surface heat and salinity anomalies through density-driven stratification. This process inherently obeys the principle of mass conservation, simultaneously enabling the upwelling of deep-sea waters to the surface ocean. The resultant vertical exchange plays a critical role in maintaining global heat distribution patterns and sustaining the thermodynamic equilibrium of the ocean system (Talley, 2013; Armour et al., 2016; Talley et al., 2016). Beyond its thermodynamic significance, ocean ventilation emerges as a pivotal mechanism governing marine biogeochemical cycles. By mediating the downward transport of atmospheric oxygen and carbon dioxide to abyssal depths, this process fundamentally regulates dissolved oxygen concentrations and carbon sequestration rates in the deep ocean (Tanhua et al., 2006; Ziska et al., 2013; Skinner et al., 2017). Related studies have further elucidated ventilation's deterministic role in controlling abyssal redox conditions and organic carbon remineralization processes (van Heuven et al., 2011; Ito et al., 2016; Schmidtko et al., 2017).
Early studies of the water mass ventilation are proposed by Sandström already in the early 20th century (Sandström, 1908, 1916). Sverdrup and Bjerknes also reported the impacts of ventilation and currents on the climate through the air-sea interactions (Sverdrup, 1940; Bjerknes, 1964). Hereafter many studies have been focusing on the ventilation. For instance, Dickson and Brown (1994) estimated the formation and pathway of the North Atlantic Deep Water (NADW) based on the hydrodynamics, Orsi et al. (1999) investigated the circulation of the Antarctic Bottom Water (AABW) by using Chlorofluorocarbons (CFCs). Recent studies suggest that the intensity of ocean ventilation varies with environmental factors, such as intensity of the westerly winds (e.g. Rahmstorf, 2010; Purkey and Johnson, 2010; Morrison et al., 2015).Several studies investigate the regional scale or specific water masses, for instance, the upwelling of Circumpolar Deep Water (CDW) in the Southern Ocean (Tamsitt et al., 2017), the ventilation in the South China Sea (Wang et al., 2021), the decline of deep and bottom water in the Weddell Sea (Huhn et al., 2013), and changes in the North Atlantic over the past three decades (Guo et al., 2026). In parallel, advances in ocean modeling have provided new insights into water mass transformation and tracer transport on basin to global scales, offering valuable perspectives on the climatic drivers of ventilation variability (e.g., Li et al., 2023). However, few studies look at the ventilation over ocean basin scales, which is helpful to understand the effect of ocean-climate interactions, and in addition can provide a basis for the biogeochemical studies.
The water mass age is an important parameter to evaluate the ventilation and refers to as the elapsed time on the pathway. The CFCs and Sulfur hexafluoride (SF6) are recognized as effective transient tracers for water masses and to estimate their ages, i.e. the time since the water left the surface ocean (Fine, 2011). The concentrations of CFC-12 in surface seawater increased continuously following the increase of the atmospheric concentration since their introduction in the early 20th century (Gammon et al., 1982; Warner and Weiss, 1985) up to about the turn of the century. The use of CFCs as a tracer in the oceanography is well established (e.g. Bullister and Weiss, 1983; Doney and Bullister, 1992; Fine, 2011), and transient tracers is a core variable in the GO-SHIP repeat hydrography program. Similarly, the transient tracer is an Essential Ocean Variable (EOV) in the Global Ocean Observing System (GOOS) framework. SF6 has been used as a new tracer since mid-1990s complementing the CFCs due to the reduction of CFCs in the atmosphere (Maiss et al., 1996; Bullister et al., 2002). The application of SF6 is generally appropriate for recently formed water masses in the upper ocean (Tanhua et al., 2008), i.e. for well ventilated, or young, waters. The CFCs are used to trace the relative deeper water masses (before mid-1990s or partial pressure of CFC-12 lower than about 450 parts per trillion, ppt), while the SF6 is the better choice for recently formed shallow water masses (after mid-1990s or partial pressure of CFC-12 higher than about 450 ppt, Tanhua et al., 2008). The complementary nature of CFCs and SF6 allows for more accurate tracing of water masses (Vollmer and Weiss, 2002; Tanhua et al., 2004, 2005; Bullister et al., 2006). In addition, the application of transient tracers also provides support to the hydrographic and biogeochemical field in calculating the upwelling velocity (Tanhua and Liu, 2015) or estimating the ventilation and anthropogenic carbon cycle (van Heuven et al., 2011; Tanhua et al., 2013; Patara et al., 2021).
As two typical representatives of transient tracers, the CFC-12 and SF6 are commonly employed for determining water mass ages, verifying hydrological models, and estimating rates of marine biogeochemical processes, such as anthropogenic carbon storage and oxygen consumption. They exhibit advantages in tracing upper and middle water masses with relatively younger ages. However, challenges arise when attempting to obtain data from deep and bottom layers with old waters. The chemically inert isotope argon-39 (39Ar), which has a half-life of 269 years, addresses this gap. 39Ar is particularly advantageous for tracing deep and bottom water masses with ages exceeding 500 years (Broecker and Peng, 2000; Holzer and Primeau, 2010; Lu et al., 2014). Initially, its application was constrained by the requirement for large sampling volumes – typically around 1000 liters – and the limitations of low-level counting (LLC) detection methods (Loosli, 1983; Schlosser et al., 1994; Schlitzer et al., 1985). Consequently, 39Ar was not widely utilized in oceanographic tracer studies. With advancements in Atom Trap Trace Analysis (ATTA) technology (Chen et al., 1999; Jiang et al., 2012), 39Ar has gradually gained prominence as an effective tracer for investigating deep and bottom waters (Lu et al., 2014; Ebser et al., 2018), the accuracy and stability have also been significantly improved (Jia et al., 2025). Therefore, the multi-parameter combination of CFCs, SF6, and 39Ar can transcend the temporal limitations associated with single-tracer dating methodologies while providing more comprehensive insights into biogeochemical processes. In this study, we introduce 39Ar to investigate water mass ages within the Atlantic Ocean, in particular for the older waters.
The apparent oxygen utilization (AOU, µmol kg−1) is an important indicator in characterizing the respiration of organic matter consuming oxygen, and balancing the oxygen supply through ventilation and photosynthesis. The oxygen utilization rate (OUR, µmol kg−1 yr−1), which can be calculated from AOU and water mass age, is a significant parameter in estimating the biogeochemical processes such as primary productivity or remineralization (e.g. Jenkins, 1982; Bender, 1990). The OUR has been recognized to be a function of pressure for a long time (e.g. Tseitlin, 1992). However, the OUR is the integrated oxygen consumption rate along the pathway of a water mass and represents a regional view of export flux (e.g. Stanley et al., 2012; Koeve and Kähler, 2016), and thus an imperfect measure of local OUR. In this study, the OUR is calculated from water mass ages estimated from the CFC-12 and SF6. The change of OUR over time in different water masses are presented and the impacts from the currents and topography are discussed.
In the study by Liu and Tanhua (2021), the characteristics of main water masses in the Atlantic Ocean are defined by six key properties, using the Global Ocean Data Analysis Project version 2 the annual update 2023 (GLODAPv2.2023, Lauvset et al., 2016; Olsen et al., 2016; Lauvset et al., 2024) data product as a source of unbiased data. The static distribution of the water masses is estimated with the Optimal Multi-Parameter analysis (OMP analysis, Karstensen and Tomczak, 1997, 1998). As a continuation of that work, here we estimate the ventilation of water masses in the Atlantic Ocean with the combination of the above mentioned three transient tracers (CFC-12, SF6 and 39Ar). The water mass ages are estimated and the OURs are calculated. The goal of this study is to further improve the report of water masses in the Atlantic Ocean by adding the age as a measure of ventilation, and to provide a hydrographic assistant for the biogeochemical researches.
In this article, we start in Sect. 2 with an overview of the data sources and methodologies employed. Section 3 presents the core results, illustrating the spatial distributions of mean and mode ages for the principal Atlantic Ocean water masses, stratified from surface to bottom. In Sect. 4, the derived water mass ages are applied to estimate Oxygen Utilization Rates (OUR) and to examine associated biogeochemical implications. Section 5 offers a comparative analysis of water mass ages obtained from traditional transient tracers (CFC-12 and SF6) and the radioisotope 39Ar. Finally, Sect. 6 provides a comprehensive summary of conclusions, discusses the broader relevance of the findings, and acknowledges the limitations of the present study.
2.1 Transit Time Distribution (TTD) and the Inverse Gaussian Model
To quantify the ventilation timescales of water masses, we apply the Transit Time Distribution (TTD) framework. The TTD, denoted as G(τ), represents the distribution of transit times τ that water parcels take to travel from the surface formation region to an interior observation point (Hall and Plumb, 1994; Waugh et al., 2003). The concentration of a transient tracer in the ocean interior, c(t), can be modeled as the convolution of its time-evolving atmospheric source function, c0(t), with the TTD:
A common and practical parameterization of the TTD is the one-parameter Inverse Gaussian (IG) distribution (Waugh et al., 2003, 2004), which represents a solution to the one-dimensional advection-diffusion equation for a steady-state flow. The IG-TTD is defined as:
where: τ is the transit time (in years); Γ is the mean-age (in years), representing the first moment of the TTD: , which signifies the average time elapsed since the water was last in contact with the atmosphere; Δ is the width (in years) of the TTD, which quantifies the spread of transit times around the mean age due to mixing and dispersion processes.
The mixing ratio, defined as (, unitless), indicates the relative importance of mixing versus advection in the transport. A low ratio (≪1) suggests advection-dominated transport with a narrow range of transit times, while a high ratio (≫1) indicates strong mixing and a wide range of transit times.
The mixing ratio, defined as (unitless) – note: this is a shape parameter of the TTD and is not to be confused with atmospheric tracer mixing ratios (e.g., the concentration ratio of a gas in air) – indicates the relative importance of mixing versus advection in the transport. A low ratio (≪ 1) suggests advection-dominated transport with a narrow range of transit times, while a high ratio (≫ 1) indicates strong mixing and a wide range of transit times.
While other forms of TTD, for instance, a two-IG distribution to characterize a mix of two water masses with different TTSs was used by Stöven and Tanhua (2014) for the Mediterranean Sea, or non-steady-state circulations may better represent reality in certain regions, the one-parameter IG-TTD remains a widely adopted and practical model. This is particularly true given the typical scarcity of multiple, independent tracer observations needed to constrain more complex distributions across large ocean basins. In this study, we apply the one-parameter IG-TTD framework as a robust approach for basin-scale analysis.
2.2 Definitions of Water Mass Age: Tracer-age, Mean-age, and Mode-age
The fundamental concept of water mass age is the time elapsed since a water parcel was last in equilibrium with the atmosphere at the surface (Thiele and Sarmiento, 1990). From the TTD framework, we derive and utilize three specific age definitions, each with its own physical interpretation and application (see conceptual diagram in Fig. 1).
Tracer-age is the simplest age estimate, obtained by matching the observed tracer partial pressure in a water sample directly to the historical atmospheric record (Fig. 1a). It assumes the transport along a purely advective pathway (i.e., no mixing), corresponding to a TTD that approaches a delta function as . This concept systematically underestimates the “true” age in the presence of mixing, as it ignores the distribution of transit times/pathways (Sonnerup et al., 2001).
Mean-age (Γ) is the first moment of the TTD. The mean-age represents the average value of the transport times of all water parcel and represents an integrative timescale (Fig. 1b), particularly applicable to the study of biogeochemical accumulation processes, such as calculating integrated oxygen consumption rates (e.g., Jenkins, 1987; Sonnerup et al., 2013).
Mode-age (τmode) is the transit time at which the TTD, G(t), reaches its maximum (Fig. 1b). For the IG-TTD, it is calculated as , with the mixing ratio fixed at in this study, this simplifies to . The mode-age represents the most probable transit time of the dominant water fraction in the sample, making it a better proxy for the advective timescale along the core pathway of a water mass.
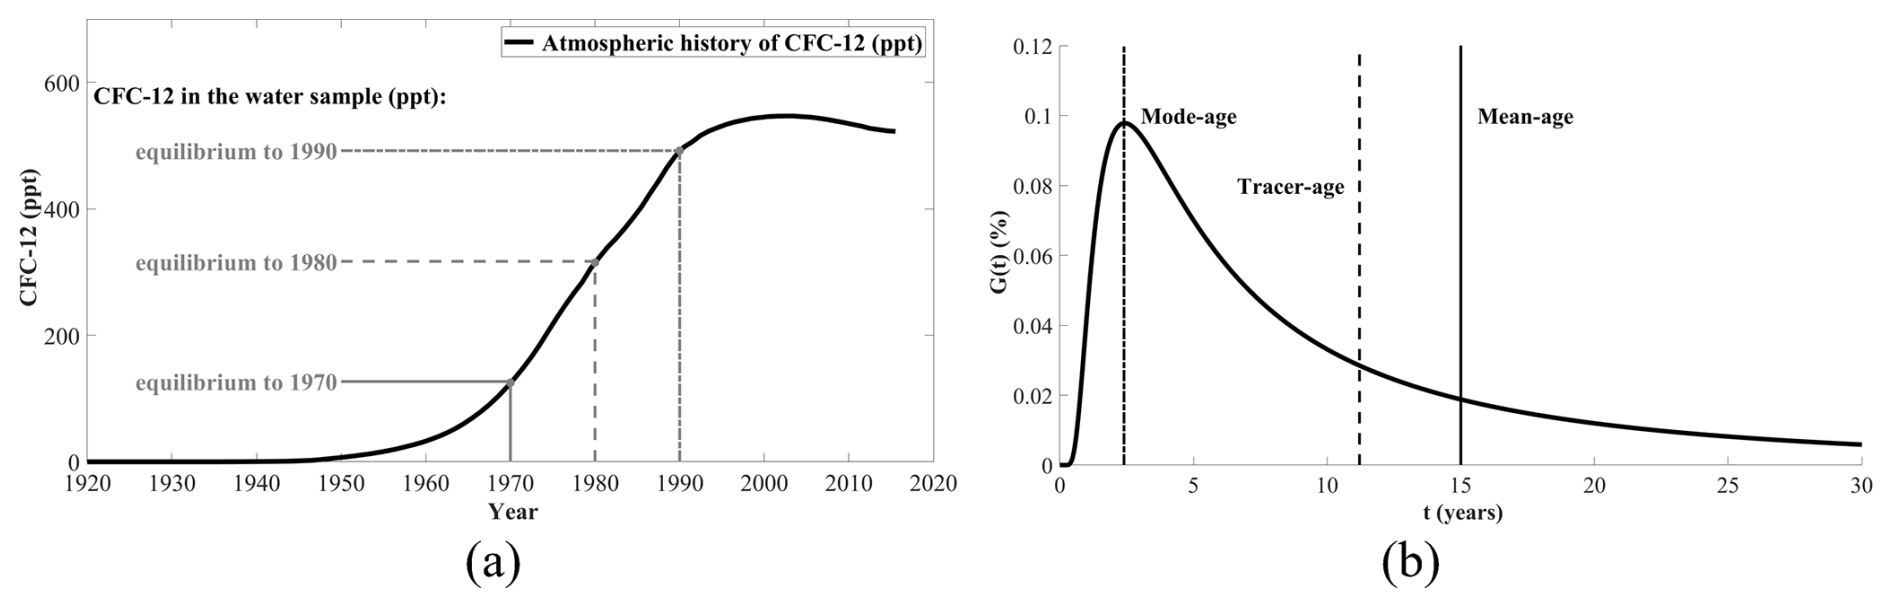
Figure 1Schematic diagram illustrating three concepts of water mass ages. (a) The tracer age: The transient tracer (such as CFC-12) in the water sample in equilibrium with the atmospheric at a certain year-This approach and assumes that the ocean is a purely advective process (without mixing); (b) The concepts of mean- and mode-ages: Based on the inverse Gaussian transport time distribution model, assuming the mixing ratio () and observed tracer partial pressure CFC-12 = 300 ppt, as an example. Shown are the positions of the mean-age (Γ), tracer age, and the mode-age (τmode).
To calculate tracer partial pressures from measured concentrations, the saturation of transient tracers (CFC-12 and SF6) in surface seawater must be determined. This saturation is a function of potential temperature (θ) and practical salinity (S), following established solubility relationships (Warner and Weiss, 1985; Bullister et al., 2002).
2.3 Determination of the Mixing Ratio and age calculation procedure
A critical step in applying the IG-TTD is specifying the shape parameter, the mixing ratio (). The atmospheric concentrations of these tracers provide the essential input for age calculations: the CFC-12 increased monotonically until mid-1990s, while the SF6 is still increasing (Fig. 2a). Ideally, the mixing ratio is determined by fitting the TTD model to observations of two or more transient tracers with different input histories. However, the similar atmospheric growth curves of CFC-12 and SF6 often preclude a robust, independent determination of across large ocean basins (Waugh et al., 2004), and the short atmospheric history of SF6 reduce this method to recently ventilated waters. Furthermore, the limited number of collocated transient tracer observations restricts the application of more complex models. In this context, understanding how the mixing ratio influences age estimates is crucial. For instance, under given tracer partial pressure (e.g., CFC-12 = 300 ppt) and sampling year (e.g., 1990), an increase in the ratio of the IG-TTD leads to a corresponding increase in the calculated mean-age, while the mode-age decreases. This behavior arises from the shape of the Inverse Gaussian distribution: a higher mixing ratio extends the distribution's tail, elevating the mean-age, while simultaneously shifting its peak earlier, thereby reducing the mode-age (Fig. 2b). Observational evidence from hydrographic sections further supports this theoretical relationship, demonstrating how the resulting age fields vary systematically under different assumed mixing ratios (Fig. 3).
To ensure a consistent and widely comparable analysis across the whole Atlantic Ocean, we adopt the standard mixing ratio . This value represents a balance between advective and diffusive processes and is commonly used in large-scale oceanographic studies (Waugh et al., 2004; Stanley et al., 2012; Stöven and Tanhua, 2014; Thomas et al., 2020). We acknowledge this as a limitation but note it is a necessary and widely accepted approach for basin-scale analyses where tracer data are limited.
The mean-age (Γ) and mode-age (τmode) for each sample was calculated by finding the value that minimizes the difference between the observed tracer partial pressures and those predicted by convolving the IG-TTD (with ) with the atmospheric histories of CFC-12 and SF6. The atmospheric histories for the Northern Hemisphere were taken from Bullister et al. (2002). Where both CFC-12 and SF6 data were available, they were used jointly in the inversion, but a switch criterion based on the observed CFC-12 partial pressure was applied. Following Tanhua et al. (2008), we note that the atmospheric growth rate of CFC-12 slowed down significantly around the turn of the century, making it less reliable as a tracer for recently ventilated waters. Consequently, when the in-situ CFC-12 partial pressure exceeded ∼ 450 ppt (indicative of young, well-ventilated waters), the inversion preferentially relied on SF6, whose atmospheric concentration continues to increase. Conversely, when the CFC-12 partial pressure fell below ∼ 450 ppt (typical of older, deeper waters), CFC-12 was used as the primary tracer, owing to its longer atmospheric history and higher signal-to-noise ratio at low concentrations. This threshold-based selection ensures that the most appropriate tracer is employed for each water mass age regime. The corresponding mode-age was then calculated from the derived mean-age and the fixed mixing ratio. For the radioactive tracer 39Ar, the convolution integral incorporates an additional exponential decay term, e−λt, where λ is the decay constant corresponding to its 269-year half-life.
Because this study adopts a fixed mixing ratio of , the mean-age and mode-age become linearly related with specifically τmode≈0.162Γ. Under this fixed ratio, the spatial patterns of the two ages are identical, differing only by a constant scale factor. To maintain logical consistency with the OUR calculations (Sect. 4), which use the mode-age, we present the mode-age distributions in the main figures (Figs. 5–13, 15, 17). The corresponding mean-age sections are provided in the Supplement (Figs. S1–S9) for readers interested in the integrative timescale.
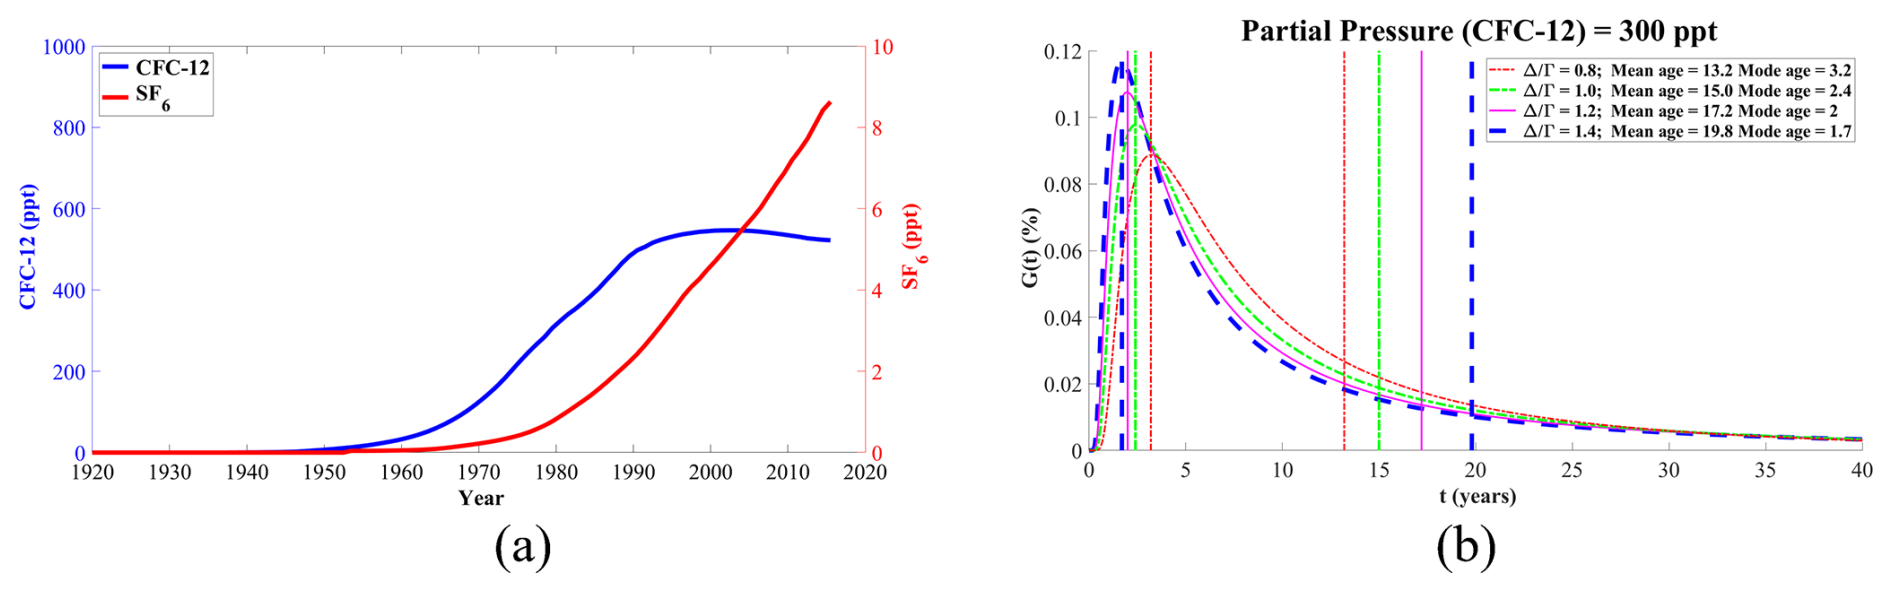
Figure 2The relationships between mean-age, mode-age and mixing ratio (). (a) Historical atmospheric partial pressure data of transient tracers over time (CFC-12 and SF6) in the Northern Hemisphere (data source: Bullister et al., 2002); (b) Relationship between mean-ages and mode-ages under same partial pressure (CFC-12 = 300 ppt) but different mixing ratios () assuming the sampling year is 1990.
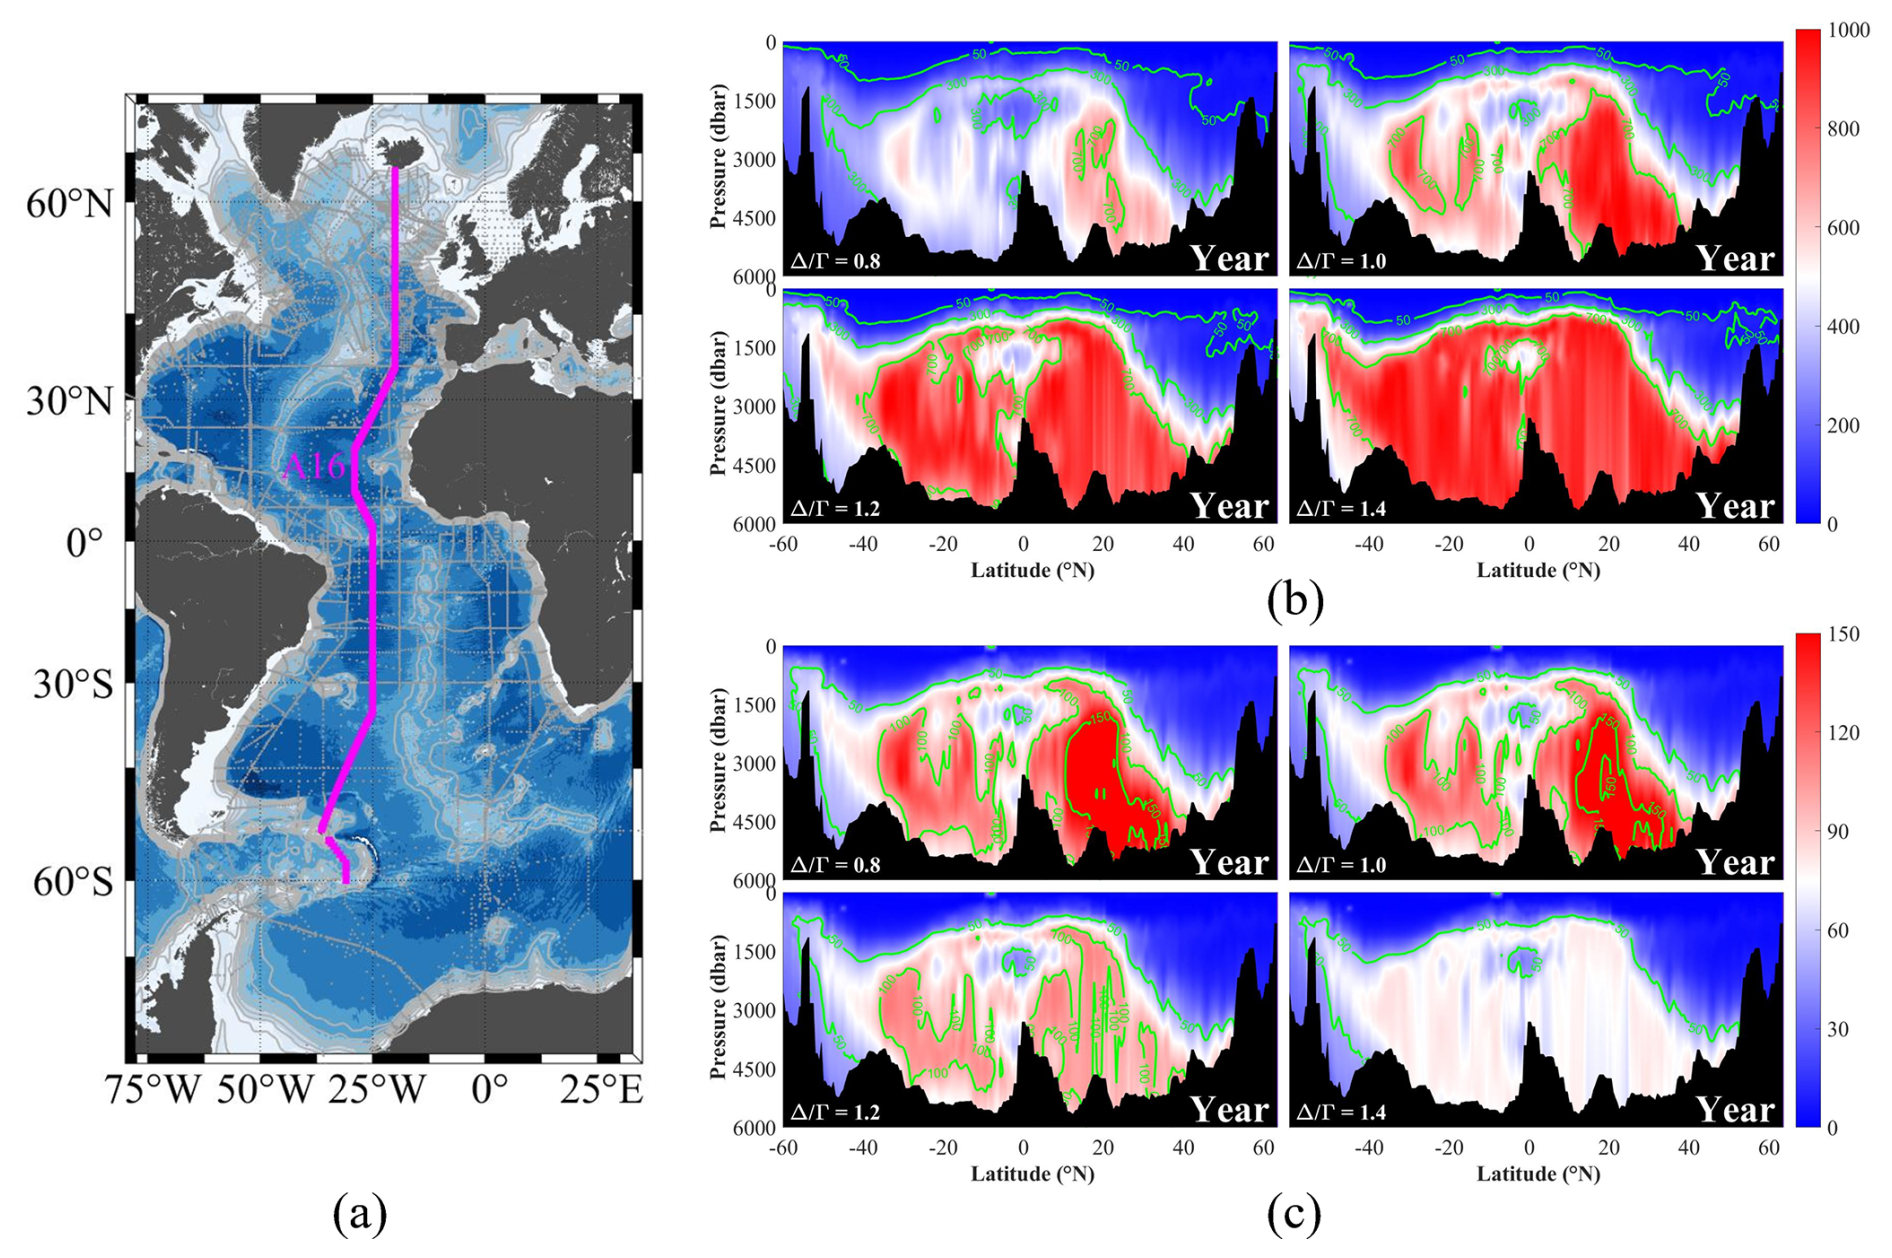
Figure 3(a) Map of the A16 section under the framework of the WOCE/GO-SHIP project in 2013. (b) Distributions of mean-ages and (c) mode-ages under varying mixing ratios (, 1.0, 1.2, and 1.4) derived from GLODAPv2 observational data. Green contour lines correspond to mean-ages of 50, 300, and 700 years and mode-ages of 50, 100, and 150 years, respectively.
In this study, we follow the division of vertical layers and distributions of water masses presented by Liu and Tanhua (2021), but now focus on the transient tracers and water mass ages. Three hydrographic sections are selected from the WOCE/GO-SHIP sections in this work to represent the mode-ages of the main water masses (Table 1). The A16 sections in 2013 (Expo-code 33RO20130803 and 33RO20131223) show the meridional distribution across the whole Atlantic Ocean, while the A05 section in 2010 (Expo-code 74DI20100106) and A10 section in 2011 (Expo-code 33RO20110926) show the zonal distributions in the North and South Atlantic Ocean respectively (Fig. 4). The partial pressures of CFC-12 and SF6 along the above sections are shown in Fig. 4 (Only CFC-12 data are displayed along A05 section due to the lack of SF6 data in this section). Both tracers show similar distributions with high values in the shallow layers, and a general decrease with increasing pressure. As detailed in Sect. 2.3, under our fixed mixing ratio ( the mean- and mode-ages are linearly related; we therefore show only mode-age sections in the following figures (mean-age sections are provided in the Supplements).
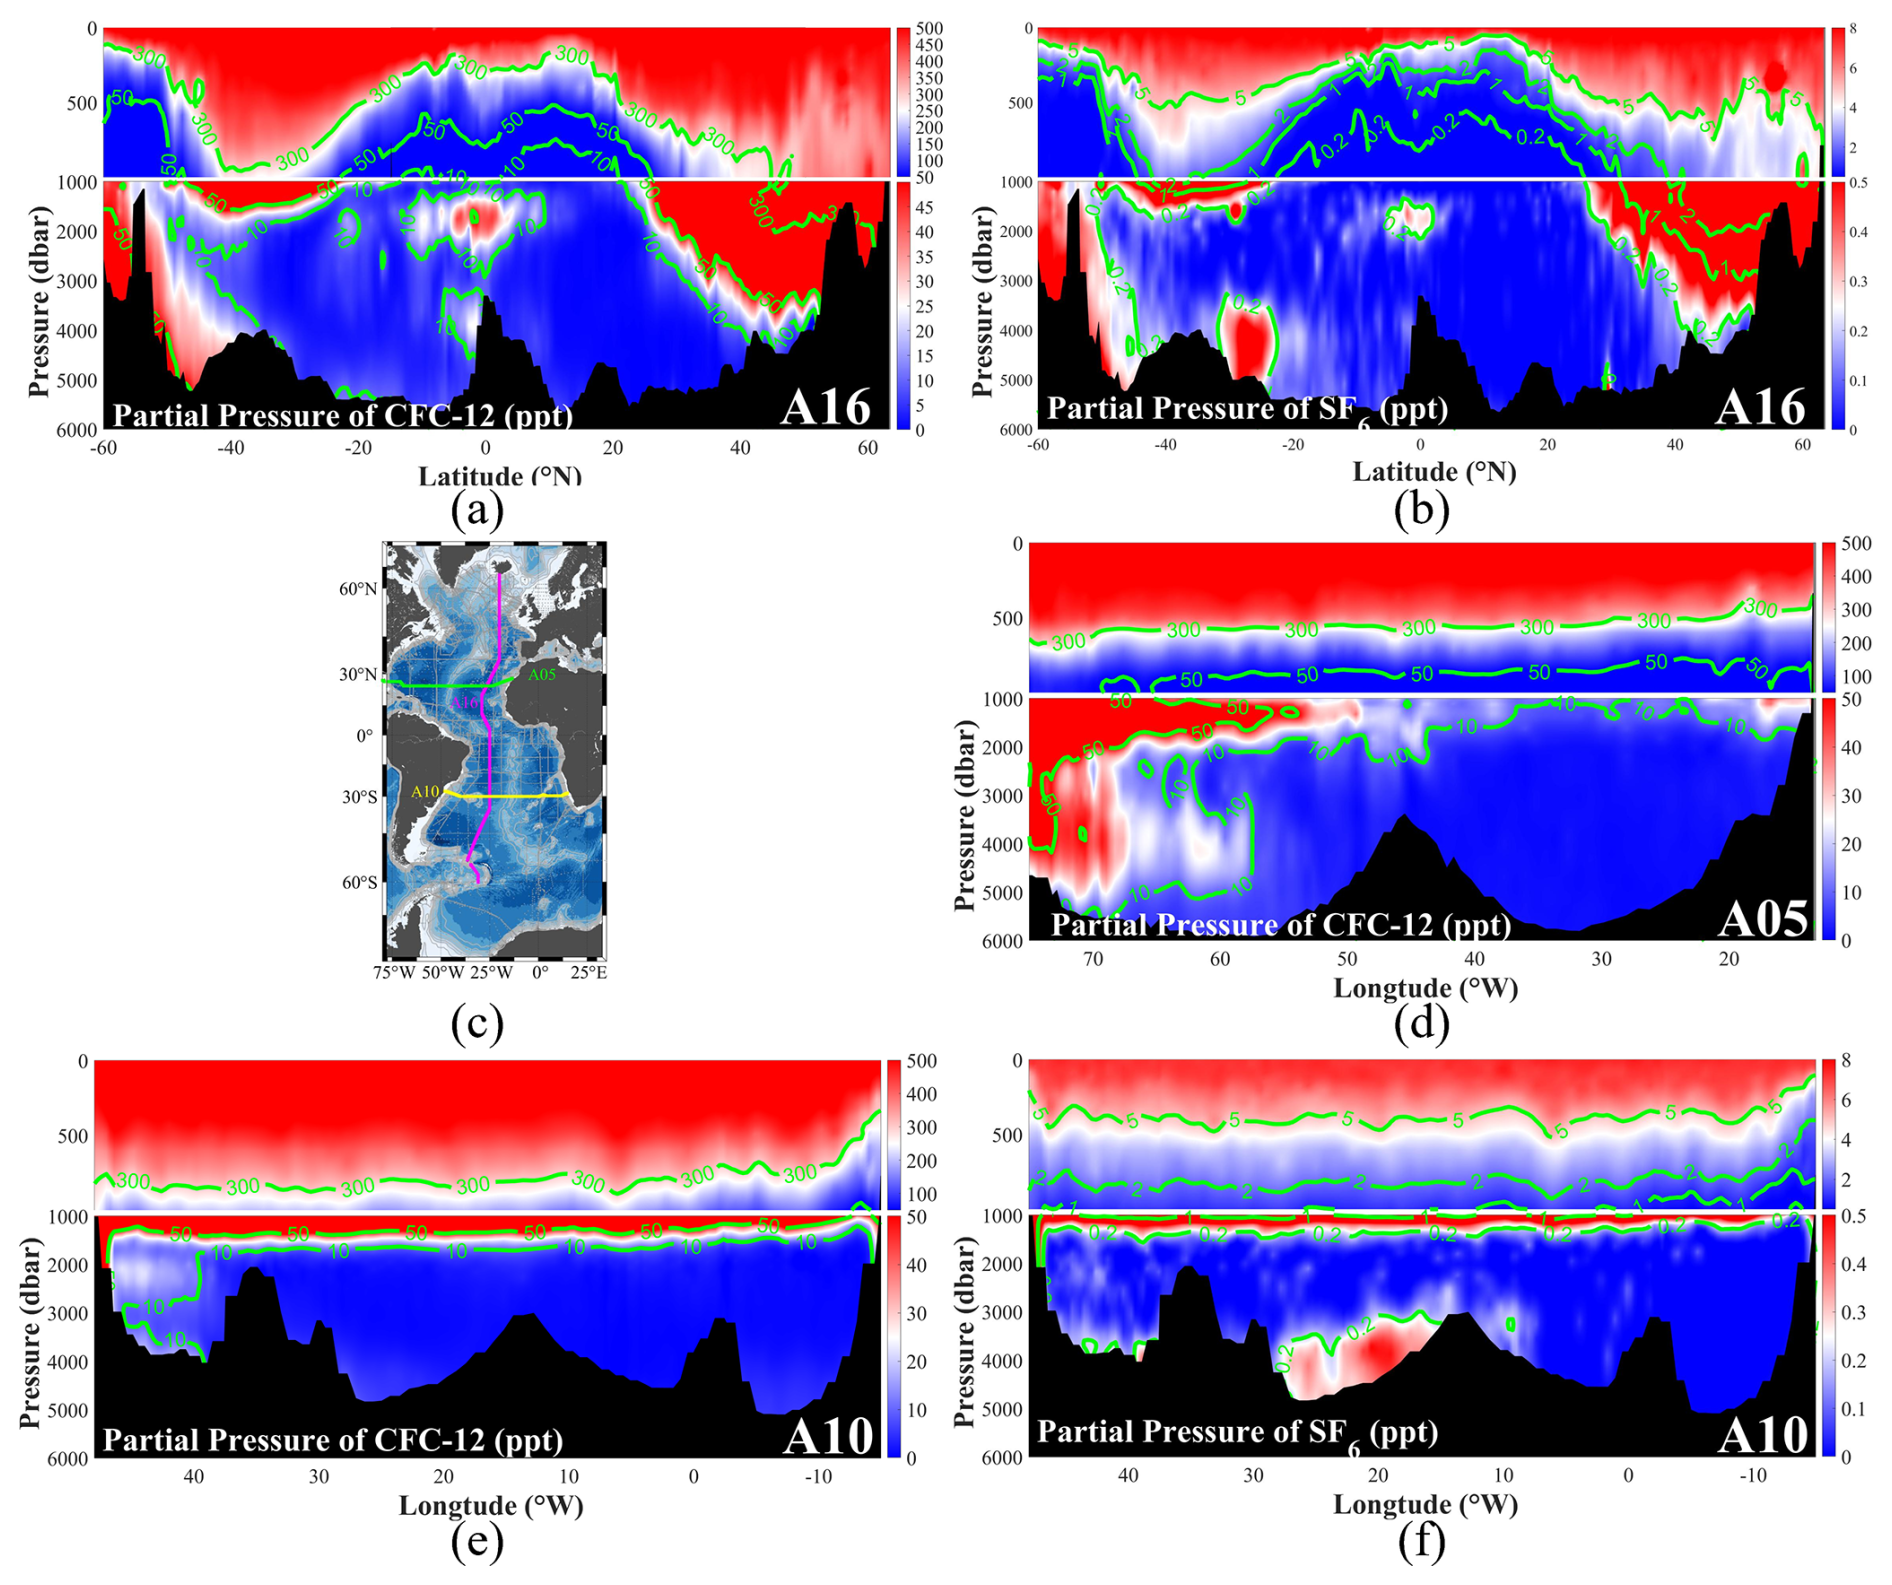
Figure 4Map of three selected WOCE/GO-SHIP sections to represent the ages of the main water masses in the Atlantic Ocean (middle left) and partial pressures of CFC-12 and SF6 along the three selected sections. Note the different colorbars between upper and lower parts divided at pressure of 1000 dbar. The green contour lines indicate the partial pressures of CFC-12 at 10, 50 and 300 ppt and SF6 at 0.2, 1, 2 and 5 ppt, respectively.
Table 1Summary of hydrographic cruises in the Atlantic Ocean selected for the oceanographic sections in this study.

Data sources: a Bullister and Baringer (2013); b Wanninkhof (2013); c King (2010); d Baringer (2013). All data accessed via CCHDO (https://cchdo.ucsd.edu/, last access: 7 August 2026).
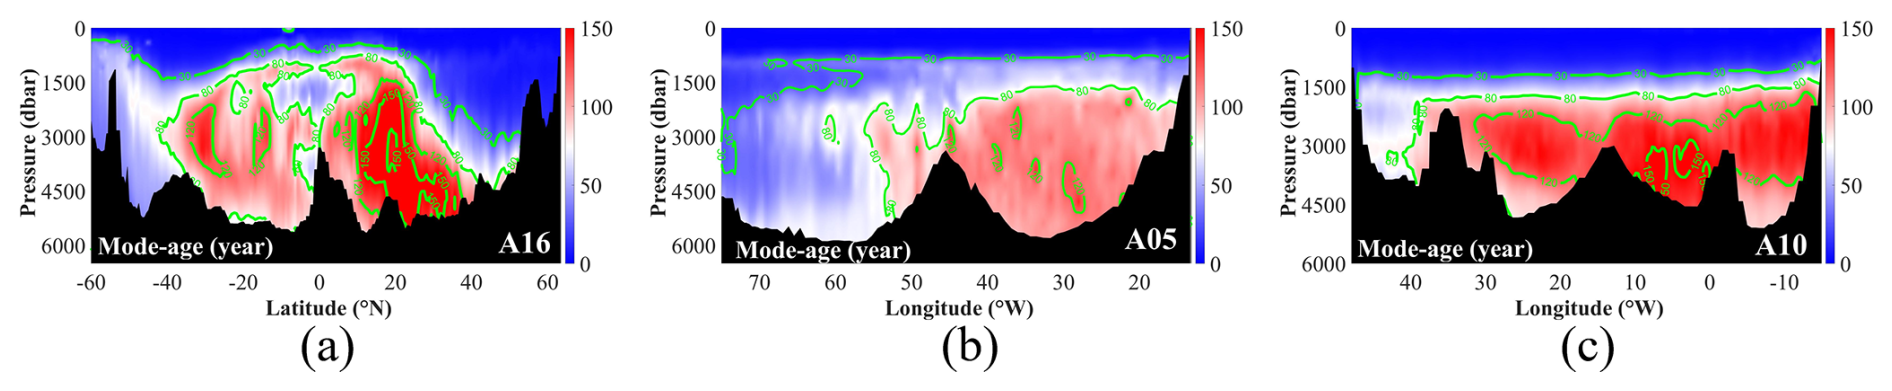
The upper water layers have the lowest mode-ages within ∼ 30 years (Fig. 5), the surface water has, by definition, zero age. The distributions of mode-ages also show spatial differences in the horizontal direction. Relatively low ages are found in the high latitude regions. This indicates that the deep water masses are newly formed here, and thus have low ages. In the region between 20 and 40° N, the mode-age reaches the peak value up to ∼ 150 years, suggesting the sluggish water exchange and long residence time of old water masses (Fig. 5a). In the zonal direction, the mode-ages are significantly lower in the west in the general region below 1500 m dbar, suggesting that these regions are better ventilated due to the western boundary current (Fig. 5b and c).
In the analysis of water mass ages in each layer, maps with mode-ages in each station are firstly presented as a qualitative overview. The average values of the mode-ages at the core pressure of each water mass are plotted at certain station. In addition, the quantitative calculations are made along the three selected sections to represent the distributions of water mass ages in detail and estimate the impacts from currents and mixing.
3.1 The upper layer
The spreading of central waters can be traced by the distributions of ages. After leaving their formation areas in the mid-latitude regions, the West North Atlantic Central Water (WNACW) and West South Atlantic Central Water (WSACW) spread generally in zonal direction towards the formation areas of the East North Atlantic Central Water (ENACW) and East South Atlantic Central Water (ESACW) with Azores Current and South Atlantic Current, respectively (Fig. 6a). The mode-ages show that the “mixed” age of all the compositions in the western central waters is ∼ 8 years (Figs. 6b and 7). When focusing on the main body of WNACW and WSACW, the mode-ages show that the advective time-scale is ∼ 15 years for both water masses (i.e. Both WNACW and WSACW take ∼ 15 years from the formation area to the equator, Figs. 6b and 7).
At greater depths, the ENACW and ESACW are transported from their formation areas and spread with the main currents towards the equator (Fig. 6a). In the northern hemisphere, the ENACW spreads southward with the Canaries Current, while the ESACW in the southern hemisphere is transported northward with the Benguela Current and the South Equatorial Current. The difference in mode-age is ∼ 16 years between the formation areas and the equatorial region (Figs. 6 and 7). The mode-ages indicate that the main body of ENACW and ESACW takes approximately 30 years to be transported from formation areas to the equator (Figs. 6b and 7).
The central waters occupy the upper layer above the neutral density isoline of 27.10 kg m−3. The core pressures of western and eastern central waters are around the neutral density (γ) of 26.5 and 26.9 kg m−3 respectively (Liu and Tanhua, 2021). The ages of central waters at their core neutral densities are shown in Fig. 6. The eastern central waters have mode-ages up to approximately 30 years, while the western central waters are younger with mode-ages of ∼ 15 years (Fig. 6). The relatively low ages in the upper layer indicate that these water masses are newly formed.
In the meridional direction along the A16 section, the mode-ages show low values of around 20 years in the mid-latitude regions that are close to the formation areas of central waters (Figs. 6 and 7). In contrast, the ages are higher (∼ 30 years) in the tropical region. In the zonal direction, the ages in the eastern basin are slightly higher than in the western basin for the central waters, but the difference is only within ∼ 10 years for mode-ages, indicating that the influence from western boundary current is not significant in the upper layer (Fig. 7).
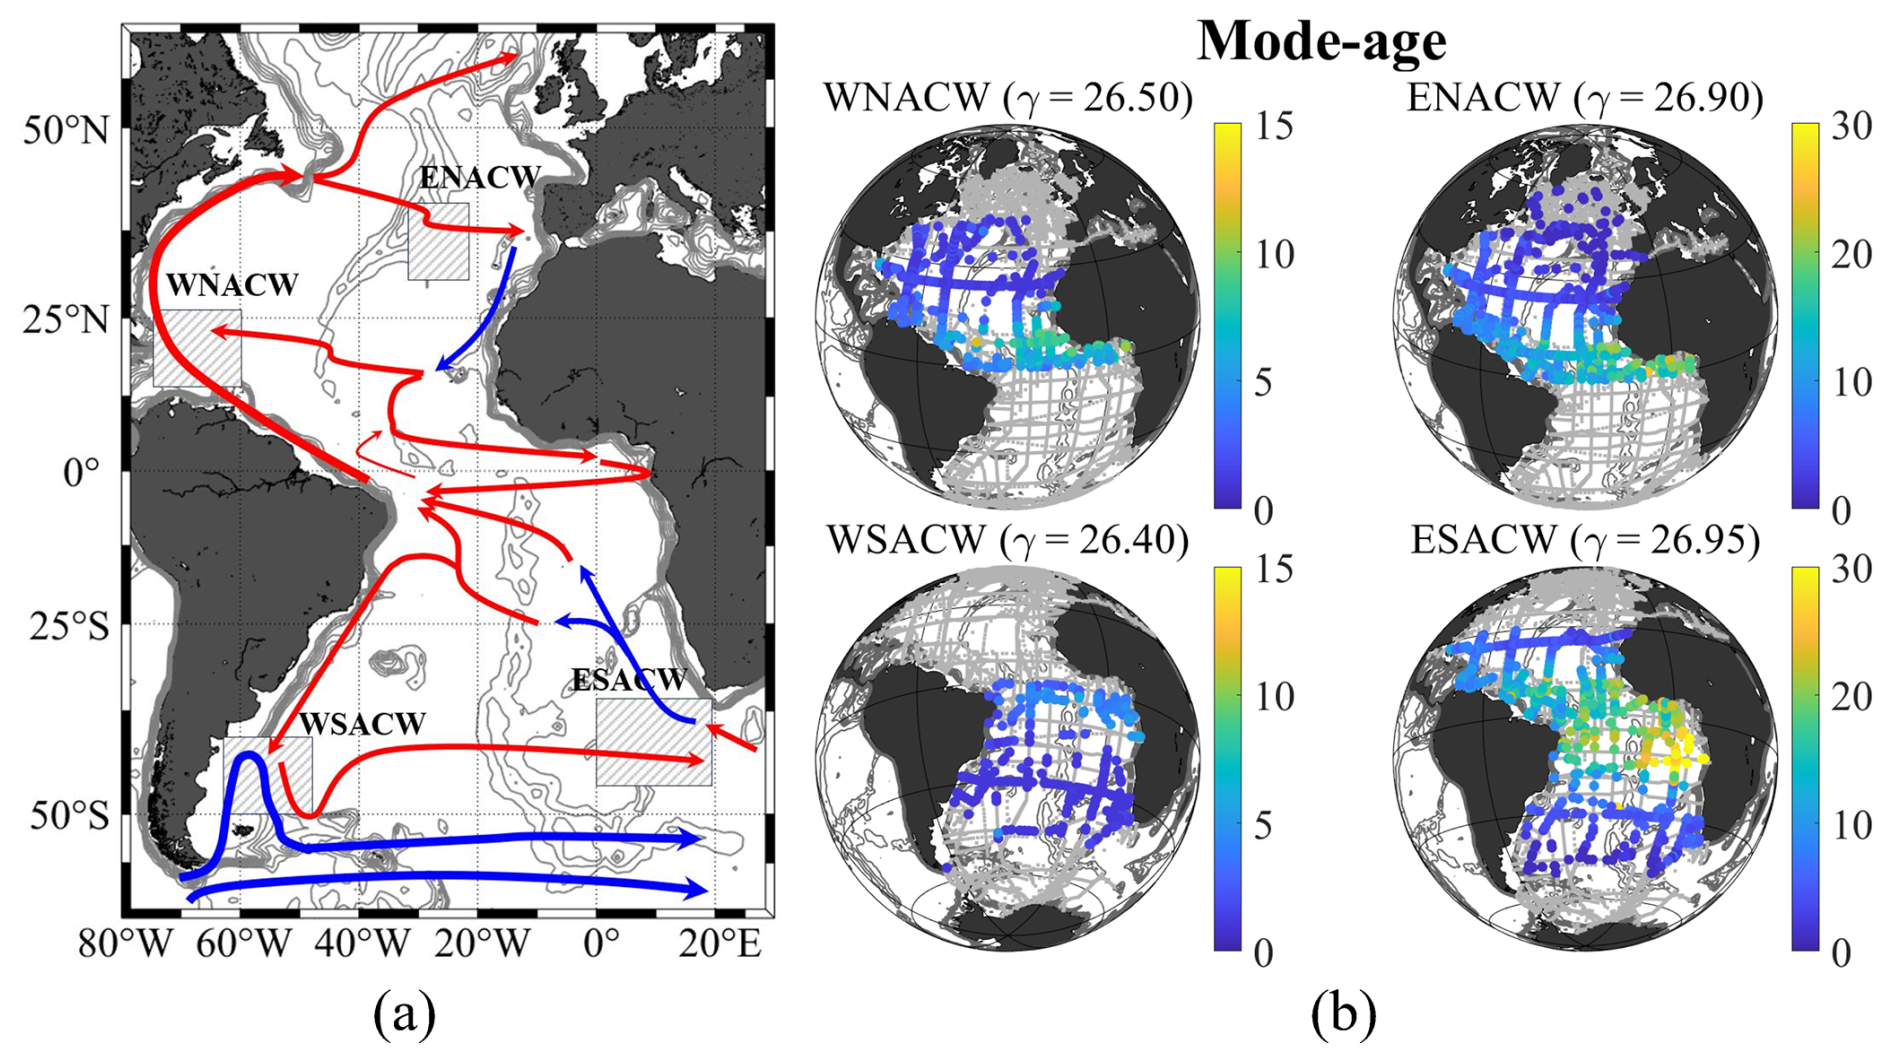
Figure 6Mode-ages of central water masses in the Atlantic Ocean. (a) The main currents in the upper layer with warm (red) and cold (blue) currents and the approximate formation areas (rectangular shadows) of central water masses. (b) Mode-ages of central water masses at their core neutral densities (kg m−3). The colored dots show the ages in each station. The grey dots show all the GLODAPv2 stations that have less than 20 % contribution of the water mass in question or lack of transient-tracer data.
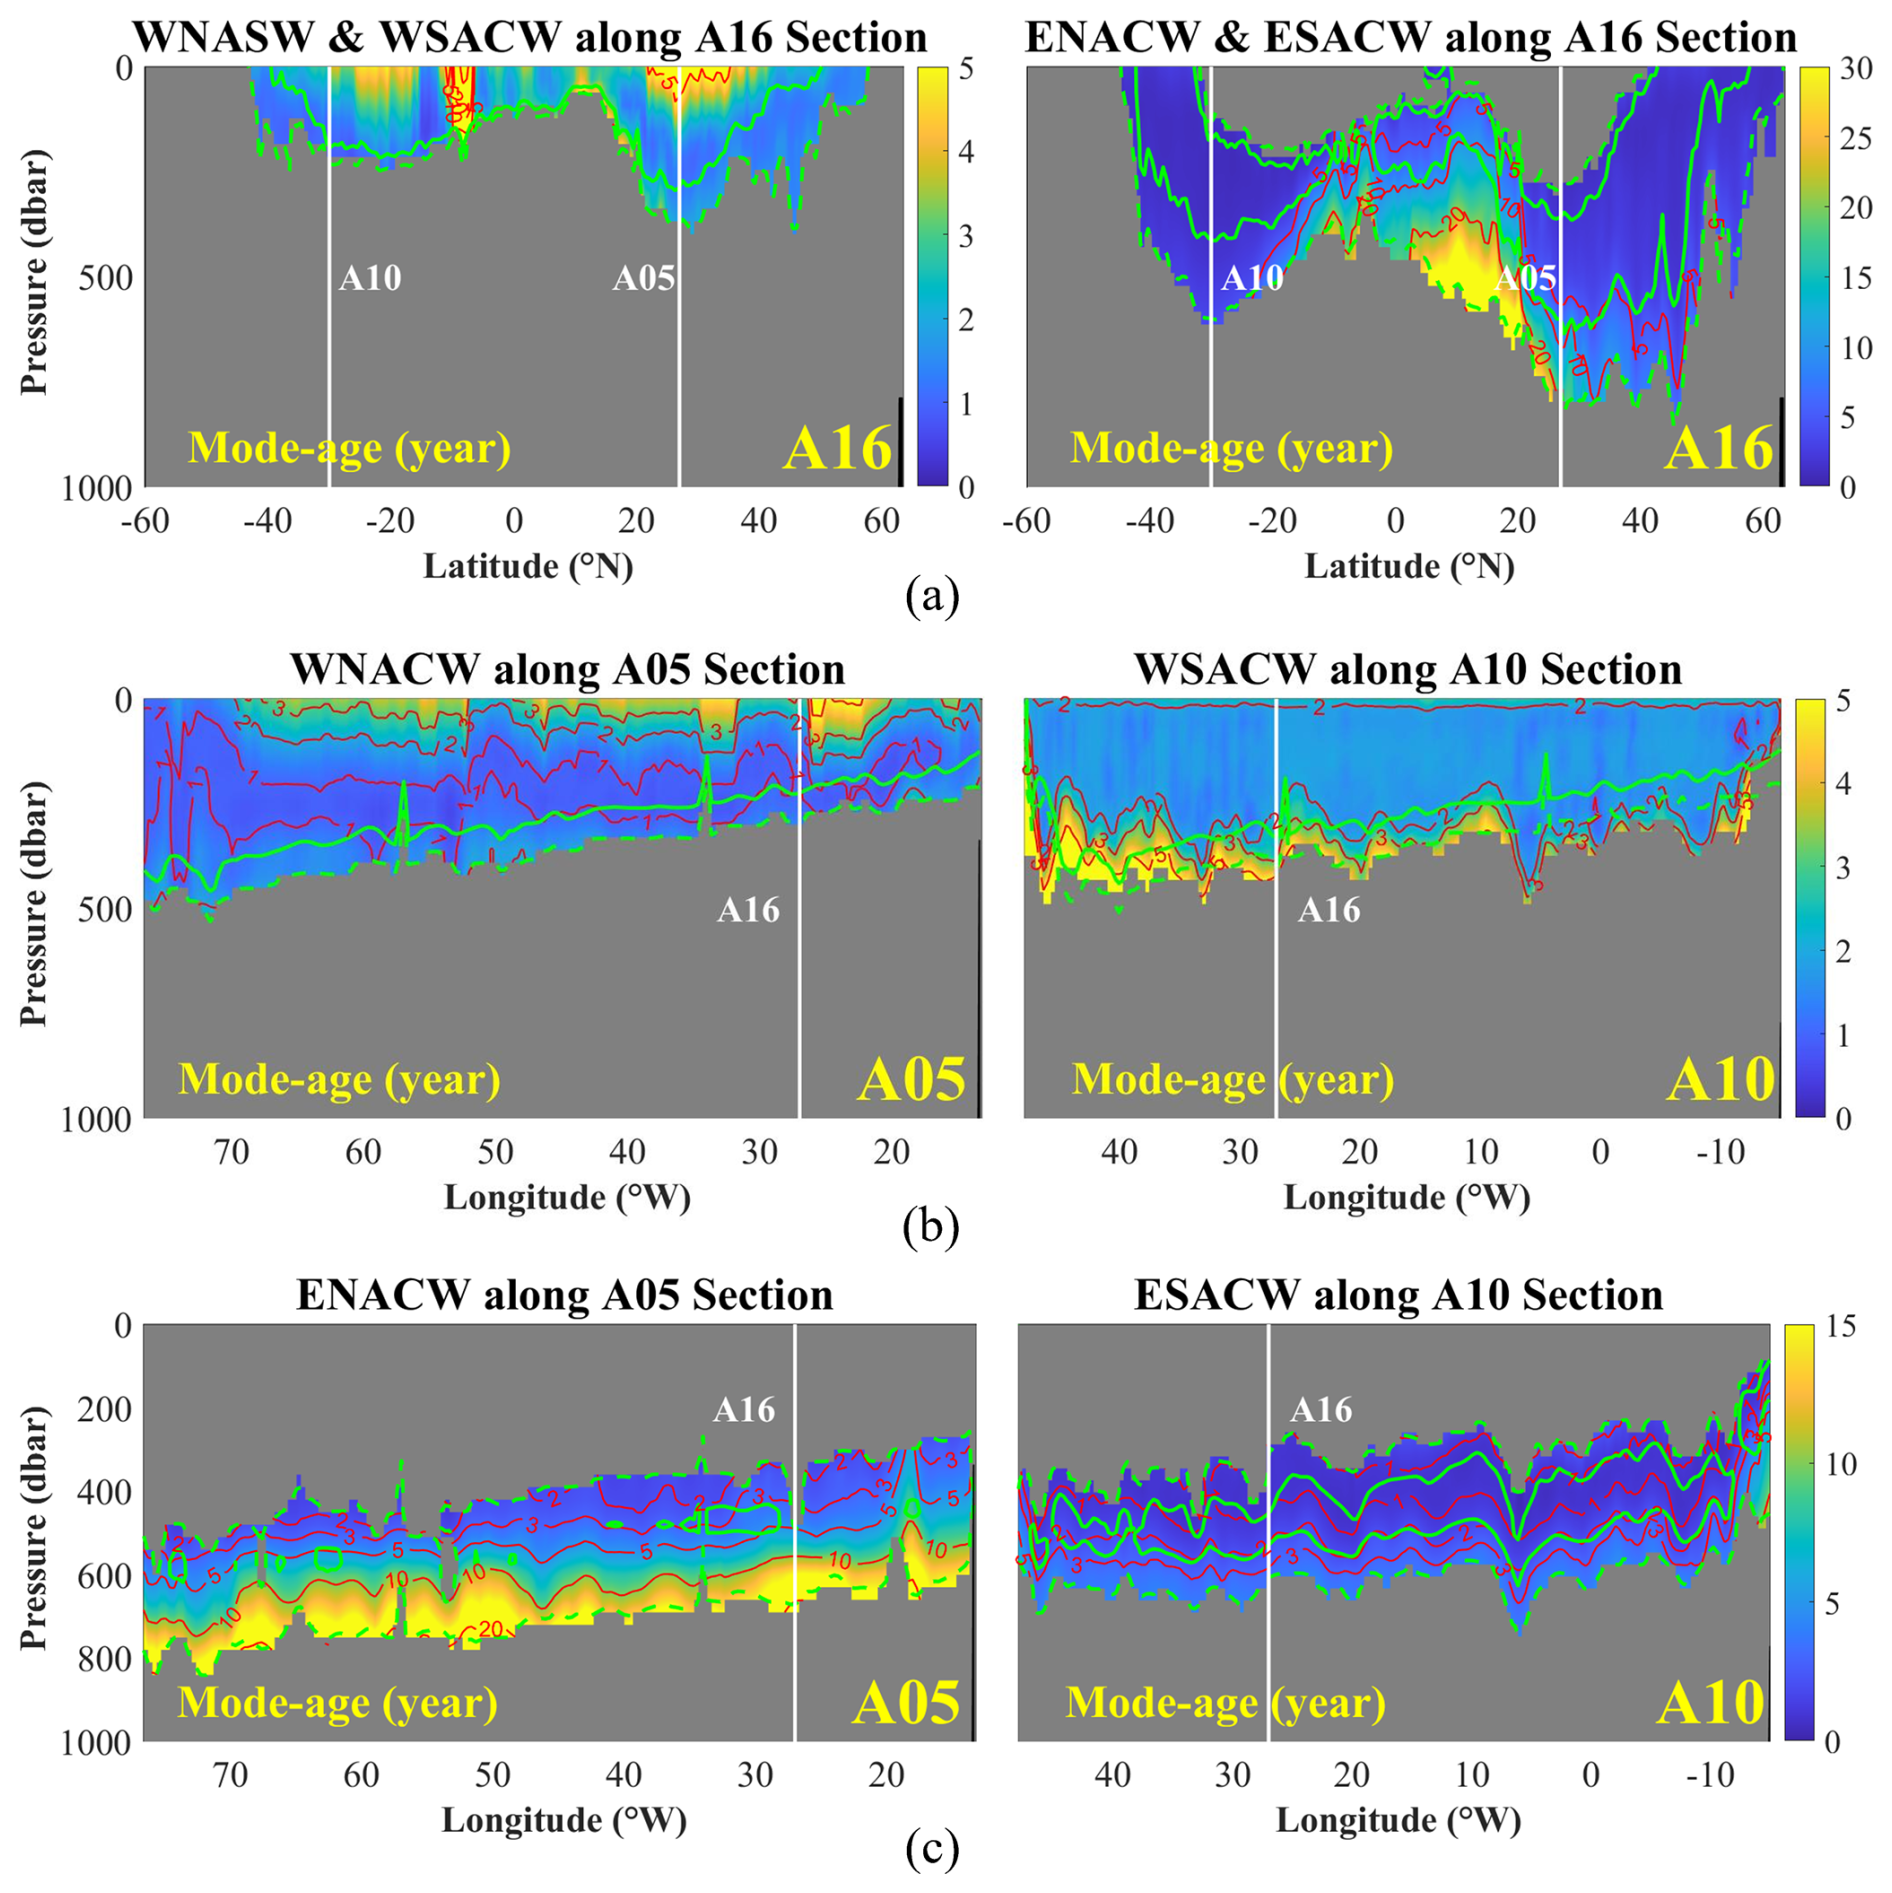
Figure 7The mode-ages (years) of central waters along the three sections for the upper 1500 dbar. The solid green isolines show the 50 % fractions of water masses and the dashed green lines show the 20 % fractions. The grey color indicates areas with less than 20 % contribution from central waters. White vertical lines show cross overs with other sections.
3.2 The Intermediate Layer
Three main water masses belong to the intermediate layer (γ between 27.10 and 27.90 kg m−3), including the Antarctic Intermediate Water (AAIW), the Subarctic Intermediate Water (SAIW) and the Mediterranean Water (MW). The ages of SAIW are not displayed in this study due to the lack of tracer data with a complete section through the distribution region of this water mass.
3.2.1 Antarctic Intermediate Water (AAIW)
The AAIW spreads from the formation area between 40 and 50° S northward to approximately 30° N along the Western Boundary Current (WBC) (Fig. 8a). The northward flow of this water mass is part of the Atlantic western boundary current system (Talley, 1996) and the upper limb of AMOC (Kirchner et al., 2009).
Compared to the central waters, AAIW has significantly higher ages. In principle, the AAIW is supposed to get higher ages towards the north, as the transport time increases with the distance from the formation area in the south. In the meridional direction, the mode-ages increase from 0 to ∼ 80 years from formation area to the equator, and further increase up to ∼ 100 years to 20° N (Figs. 8 and 9). However, both mean- and mode-ages decrease (the mean-age follows the fixed proportion) in the further north region between 20 and 30° N (Fig. 8b), giving the impression of the AAIW being younger in the north Atlantic Ocean. The observed decrease in ages likely results from mixing with younger surrounding water masses, although other factors such as limitations of the steady-state IG-TTD assumption (e.g., Waugh et al., 2004) or regional variations in the mixing ratio (e.g., Thomas et al., 2020) may also contribute. The maximum distance of AAIW to the north can reach 30° N. However, the mixing is speculated between 20° N and 30° N, since the ENACW and upper NADW comes into contact with AAIW from the upper and lower (Liu and Tanhua, 2021) (Figs. 7a, 9a and 11a). Both ENACW and upper NADW are newly formed in this region, so the “mixed” AAIW obtains younger ages. Age differences are also found in the zonal direction. In better ventilated western basins, the AAIW transports northward with the western boundary current (WBC), so the mode-ages are lower. By contrast, the ages are significantly higher in the eastern basins with poor ventilation. The mode-ages reach up to ∼ 100 years in the east between 0 and 20° S (Fig. 8b). The mode-ages along the A05 section also show the zonal difference (Fig. 9b). In the eastern basin (east of the Mid-Atlantic-Ridge, MAR), the mode-age appears up to ∼ 80 years, in contrast only ∼ 50 years in the west. This distribution confirms that the AAIW is transported by the WBC and takes a longer time to cross the MAR. Generally lower ages are found along the A10 Section in contrast to the A05 Section due to closer distance to the formation area of AAIW (Fig. 9c). Similar zonal difference exists with mode-ages of ∼ 10 years in the west and ∼ 20 years in the east.
The mode-ages of AAIW also vary in the vertical direction. These variations are consistent with the influence of mixing with adjacent water masses along its boundaries. Near the upper boundary, the AAIW is characterized by relatively lower ages, which is consistent with mixing with the generally younger eastern central waters above. Conversely, at the lower boundary with the deep and overflow layer, AAIW encounters the southward upper NADW. Along the A10 section, the upper NADW exhibits high mode-ages (∼ 80 years) due to the long southward transport. The resulting composite water mass at this interface shows intermediate mode-ages (∼ 60 years), higher than those in the AAIW core (∼ 20 years) (Fig. 9c).
A contrasting pattern is observed along the A05 section. In the northern Atlantic sampled by A05, the AAIW obtains higher water mass ages, while the locally encountered upper NADW is relatively younger. Consequently, the mode-ages at the interface (∼ 50 years) are lower than those in the AAIW core at this location (∼ 60 years) (Fig. 9b). These observed patterns at the boundaries are interpreted as reflecting the mixing of AAIW with water masses of contrasting ages, and the resulting composite age signals are consistent with the independent age estimates for NADW presented in the following section.
3.2.2 Mediterranean Water (MW)
The MW is referred to as the product of the Mediterranean Overflow Water (MOW) that flows across the Strait of Gibraltar and mixes with the ENACW (Liu and Tanhua, 2021). This water mass is formed in the Gulf of Cadiz where the MOW exits the Strait of Gibraltar as a deep current and turns into two branches (Fig. 8a). The northward branch spreads into the West European Basin until 50° N, while the westward branch spreads across the MAR into the west basin of the North Atlantic Ocean (Price et al., 1993; Carracedo et al., 2016).
The spreading of MW can also be traced by the transient tracers (Fig. 9a), in addition to the water mass variables that goes into the OMP analysis (Liu and Tanhua, 2021). The mode-ages of MW have an increasing trend towards the south (Fig. 8b). The northward flow spreads faster so the mode-age is ∼ 20 years at 50° N. In contrast, the southward flow shows a higher mode-age of ∼ 100 years at 25° N along the A05 Section (Fig. 9b). In the zonal direction, the ages decrease to the west (Fig. 9b), since the fraction of MW is only between 20 % and 30 % along this section (green dash contour lines in Fig. 9b), and is therefore influenced by the lower ages from the NADW.
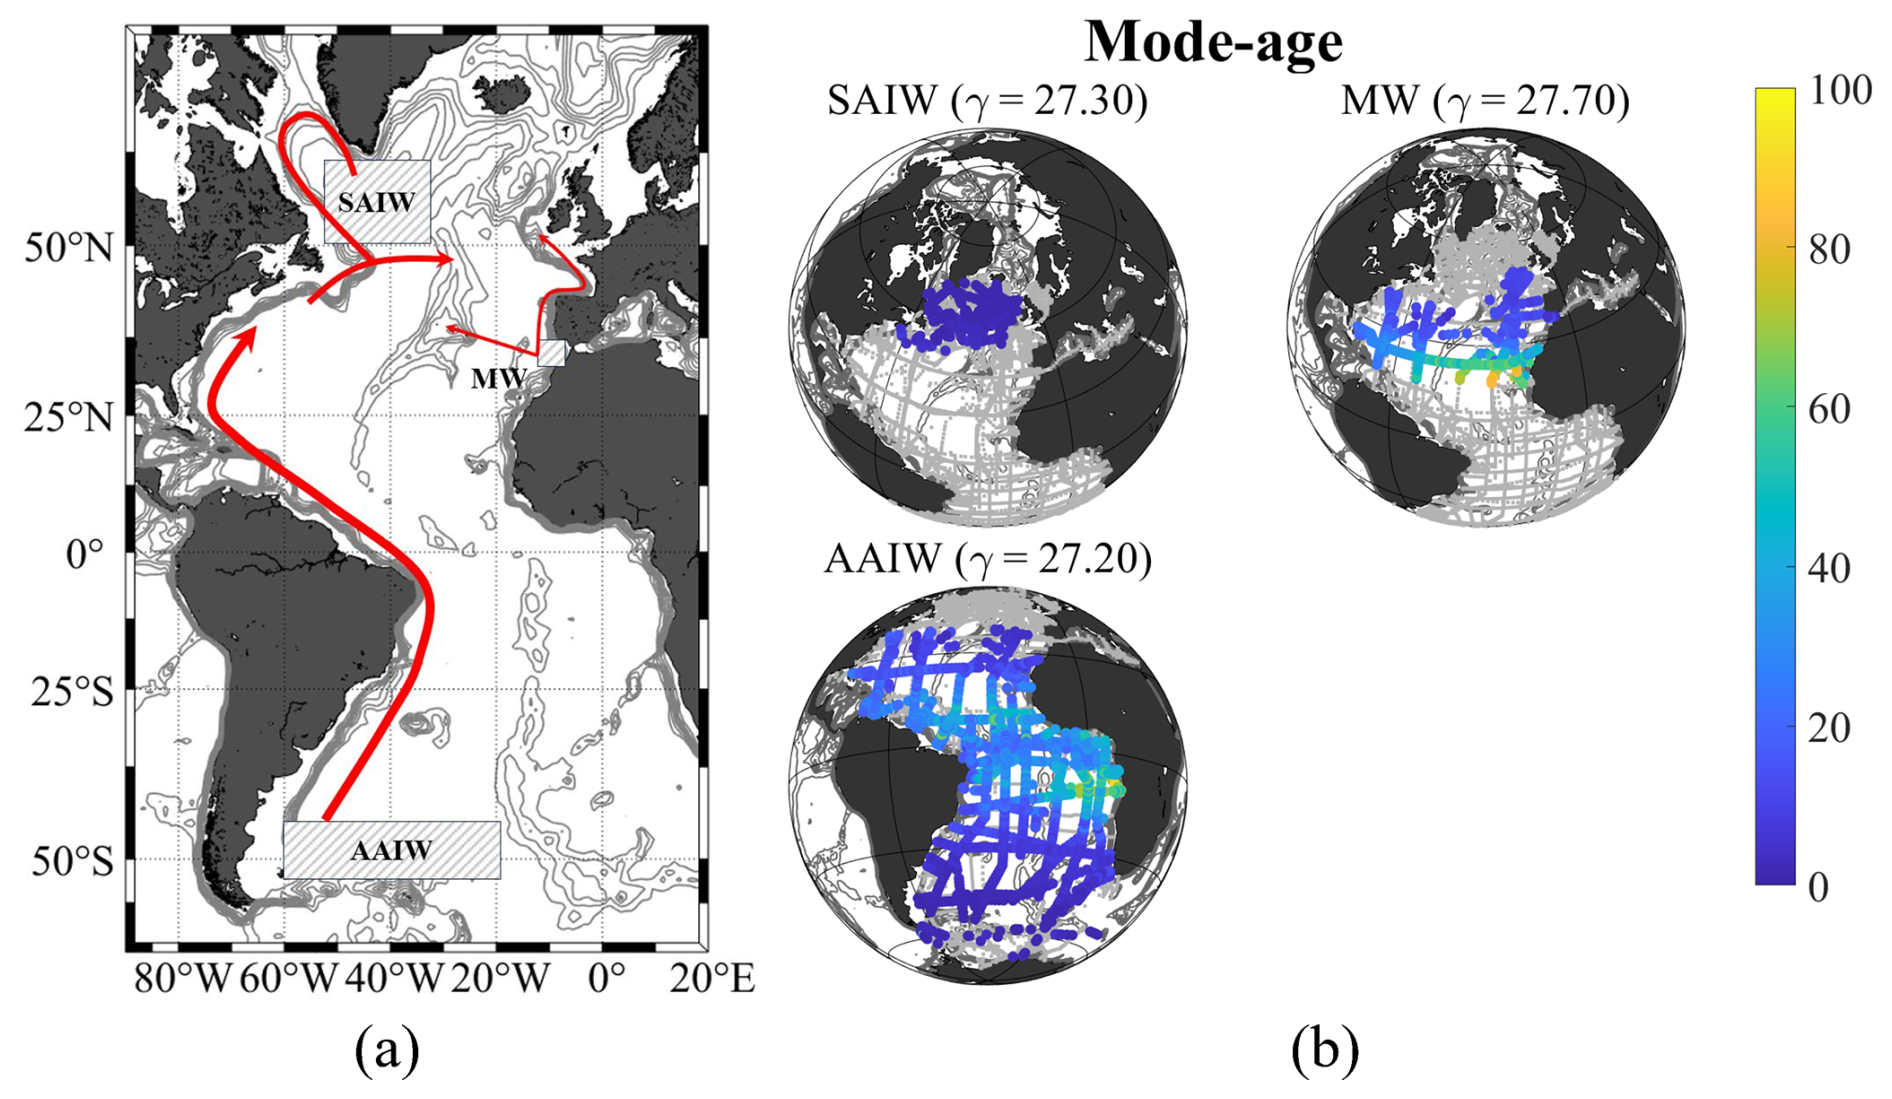
Figure 8Mode-ages of intermediate water masses in the Atlantic Ocean. (a) Main currents in the intermediate layer. The currents (arrows) and the formation areas (rectangular shadows) of water masses in the intermediate layer. (b) The mode-ages of intermediate water masses at their core neutral densities (kg m−3). The colored dots show the ages in each station. The grey dots show all the GLODAPv2 stations that have less than 20 % contribution of the water mass in question or lack of transient-tracer data.
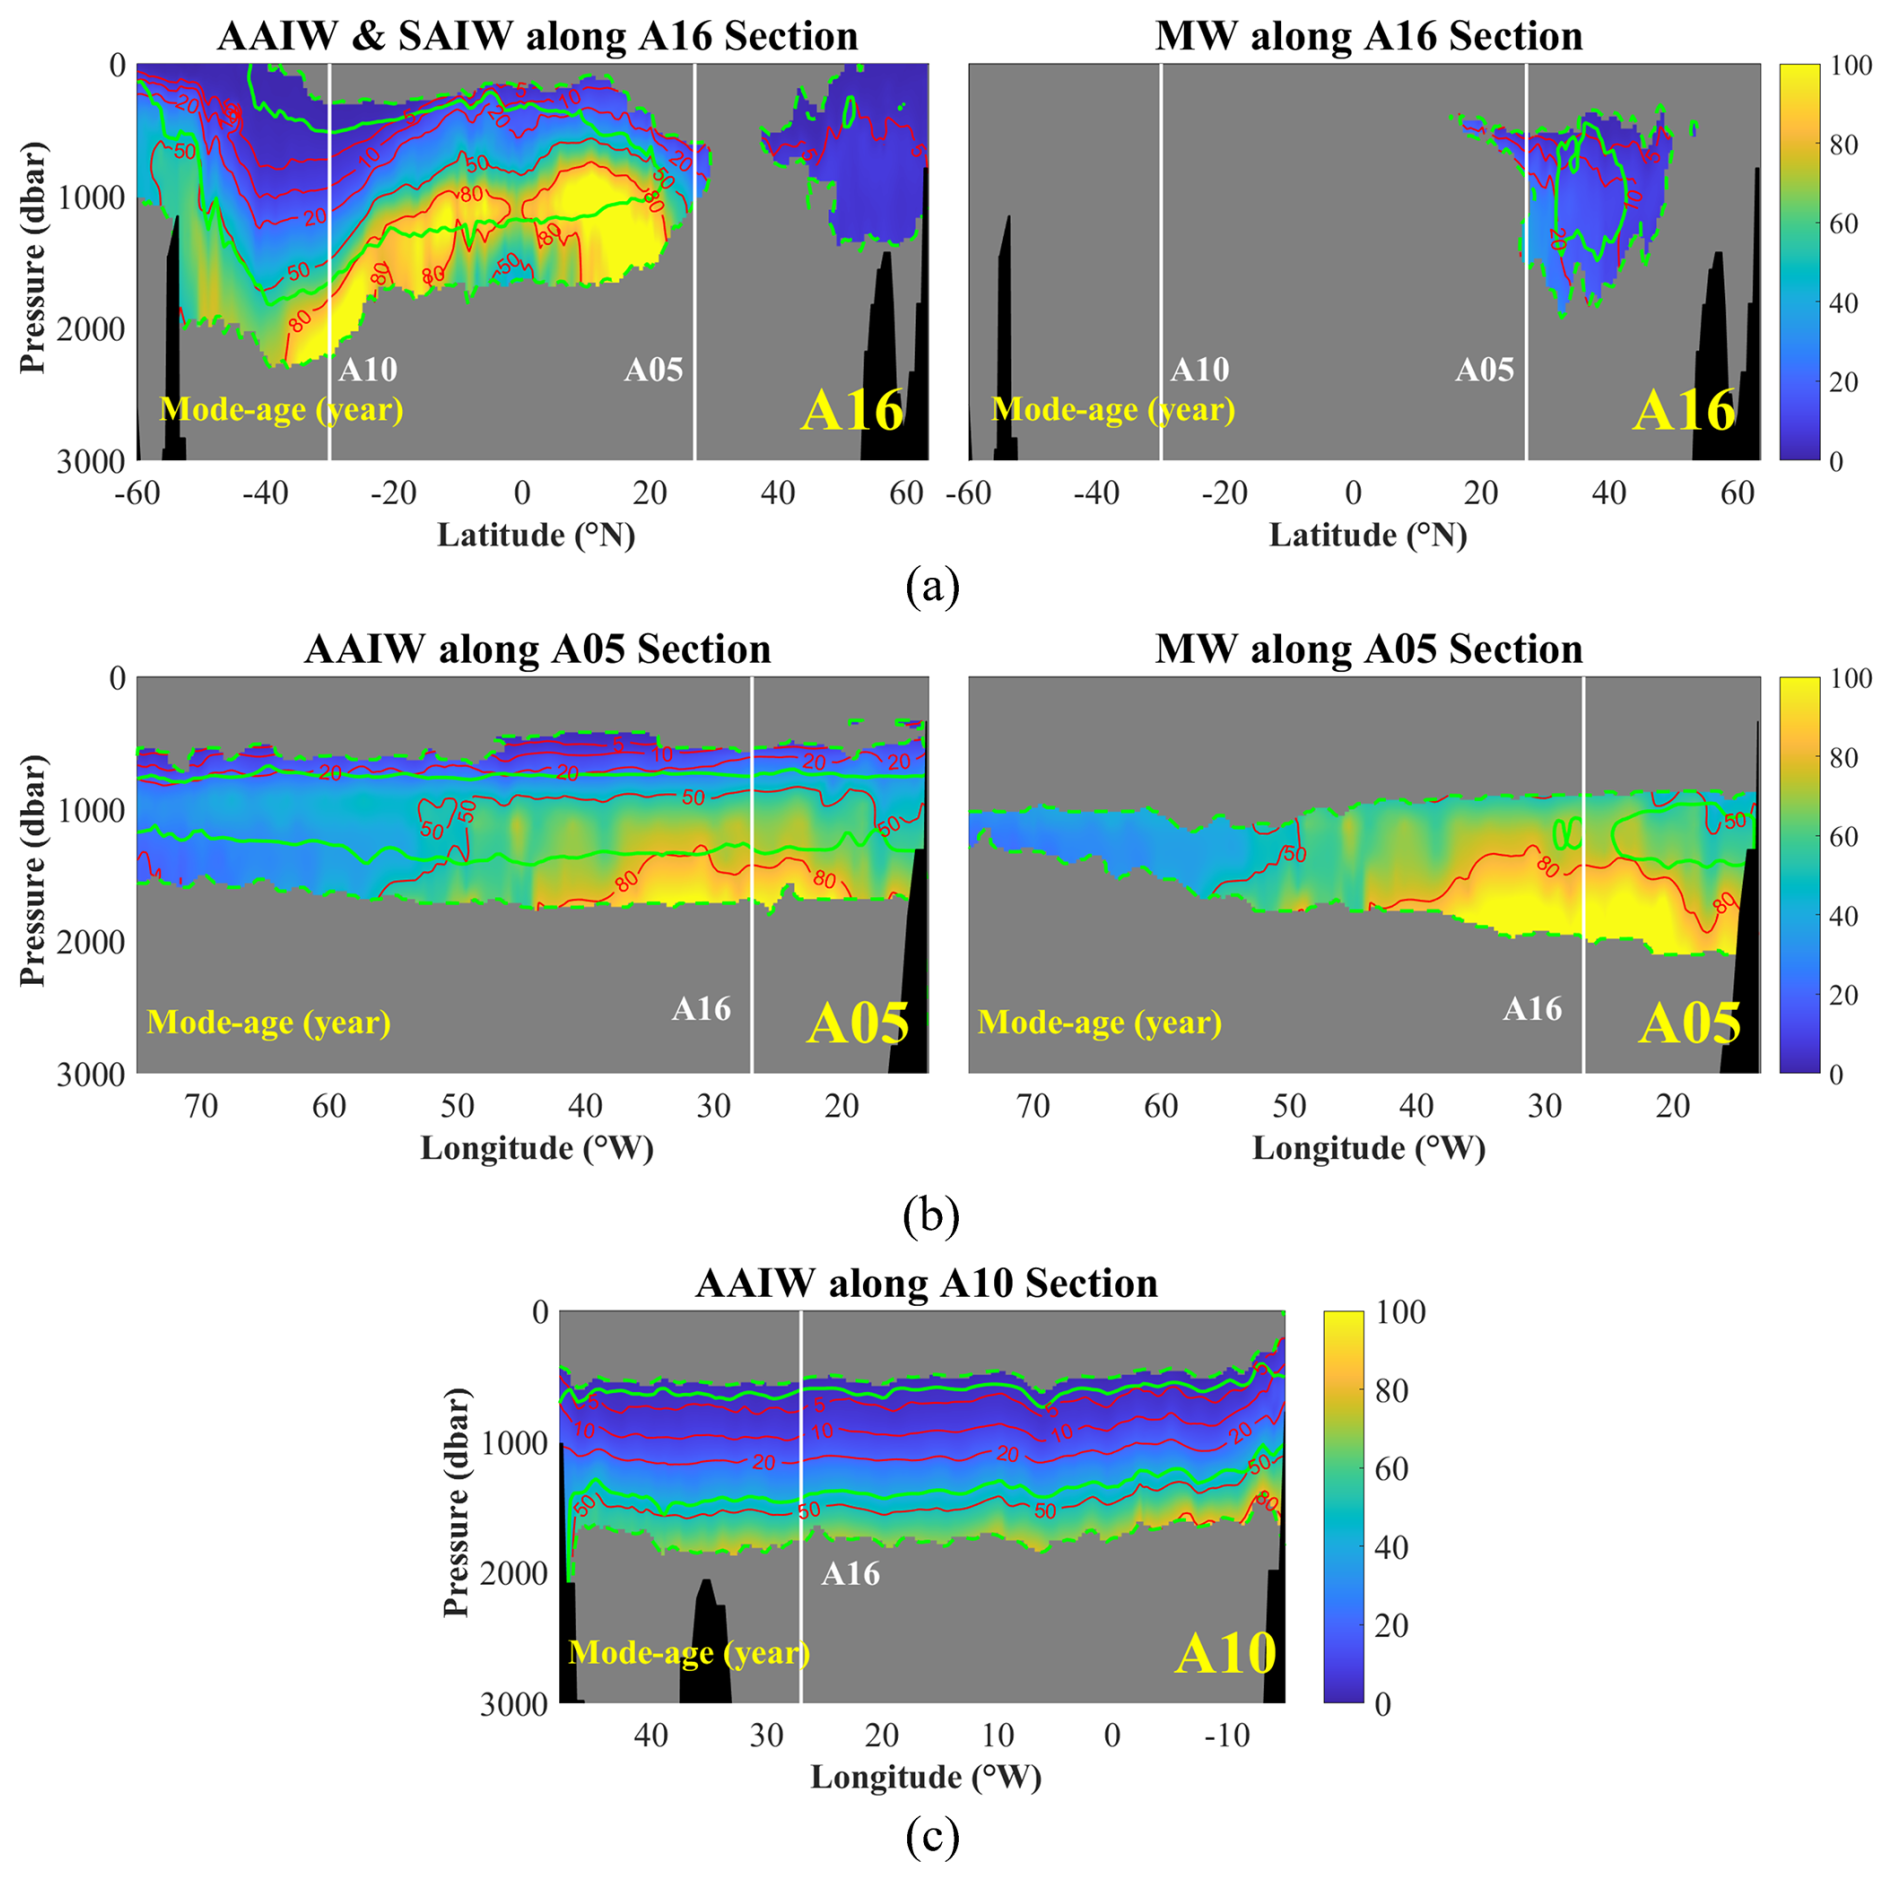
Figure 9Mode-ages (years) of intermediate water masses along the three sections for the upper 4000 dbar. The solid green isolines show the 50 % fractions of water masses and the dashed green lines show the 20 % fractions. The grey blank indicates less than 20 % contribution from intermediate water mass. White vertical lines show cross overs with other sections.
3.3 Deep and Overflow Layer
The North Atlantic Deep Water (NADW), including its upper and lower portions, dominates the deep and overflow layer (γ between 27.90 and 28.10 kg m−3) of the Atlantic Ocean. This water mass is formed in the high latitude region in the North Atlantic and spreads southward at pressures between 2000 and 4000 dbar until it meets AAIW and AABW in the Antarctic Circum-polar Current (ACC) region. The southward spreading pathway is along the Deep Western Boundary Current (DWBC, Fig. 10a). Meanwhile, the NADW also extends eastward with the eddies and finally covers the deep and overflow layer (Dickson and Brown, 1994).
Upper and lower North Atlantic Deep Water (NADW)
The NADW is a water mass that is transported far southward from its formation area, with a mode-age of ∼ 100 years at the southern limb in the Antarctic Circum-polar Current (ACC) region (Fig. 10b). The increasing ages during the pathway to the south is shown along the A16 section (Fig. 11a). After leaving the formation area, the mode-ages increase ∼ 20 years from 60 to 40° N. Afterwards, a sharp increase in mode-ages appears in the region between 30 and 10° N. In this interval, the highest mode-age reaches up to ∼ 150 years. This is because the A16 section at this latitude range passed through the east part of the Atlantic Ocean (east of MAR) and the distance from the Deep Western Boundary Current (DWBC, Figs. 4 and 10a) was high. High ages in this region are due to the sluggish water exchange over the ridge. This result can also be confirmed by the observation along the A05 Section (Fig. 11b): The NADW near the DWBC region has a low mode-age of ∼ 40 years, while it reaches up to ∼ 100 years east of the MAR. After passing the equator, when the A16 section returns to the west of the MAR, the mode-ages of NADW are ∼ 80 years in the latitude range between 0 and 20° S, which further increase to ∼ 100 years along the pathway southward until 40° S. In the ACC region between 40 and 60° S, the mode-ages of upper and lower NADW decrease to ∼ 80 years. Similar to the situation of AAIW in the north Atlantic, this is also the result of mixing with newly formed AAIW and AABW. The spreading of NADW in the zonal direction is slower eastward, so the ages are generally higher in the eastern basin of the Atlantic Ocean (Fig. 10b). The tracer data along the A05 and A10 sections also reflect the above result. In the A05 section, the mode-ages are ∼ 50 years in the west and ∼ 100 to ∼ 120 years in the east (Fig. 11b). In the A10 section, the mode-ages are ∼ 80 years in the west and ∼ 120 years in the east (Fig. 11c).
In the vertical direction, the upper NADW mixes with the AAIW from above and the lower NADW mixes with the AABW from below. As the NADW is transported in the opposite direction to these two water masses, the “mixed” ages in the north, which is closer to the formation area of NADW, are higher than the age at the core density of NADW, while the opposite situation exists when spreading to south. After entering the ACC region, both mean- and mode-ages decrease (the mean-age follows the fixed proportion) since the fractions of newly formed AAIW and AABW are high.
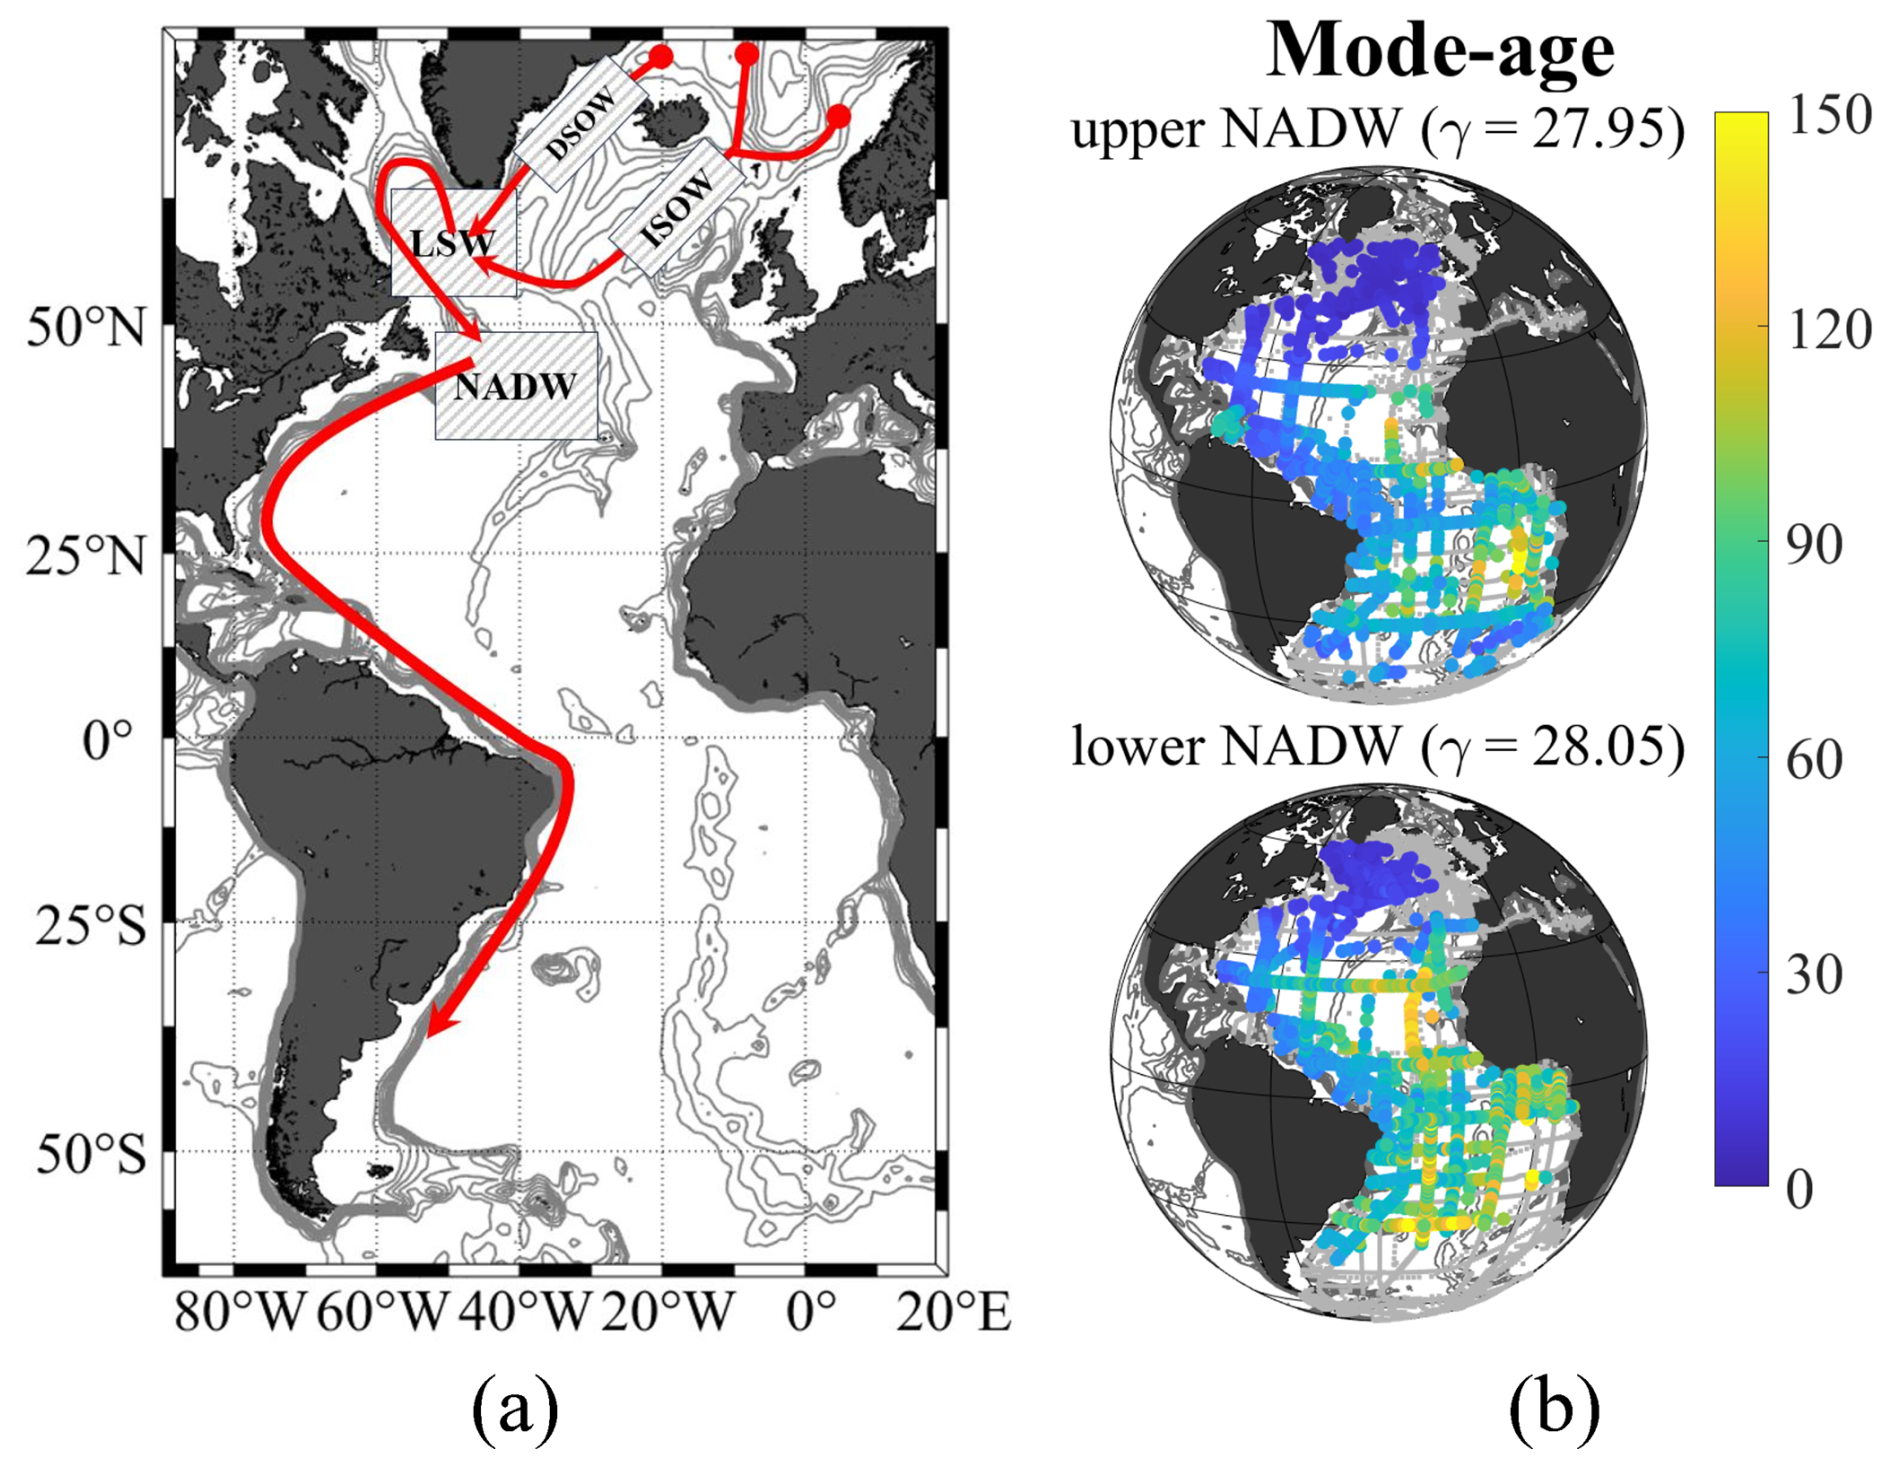
Figure 10Mode-ages of upper and lower NADW in the Atlantic Ocean. (a) Main currents in the deep and overflow layer. The currents (arrows) and the formation areas (rectangular shadows) of water masses in the deep and overflow layer. (b) The mode-ages (years) of upper and lower NADW at their core neutral densities (kg m−3). The colored dots show the ages in each station. The grey dots show all the GLODAPv2 stations that have less than 20 % contribution of the water mass in question or lack of transient-tracer data.
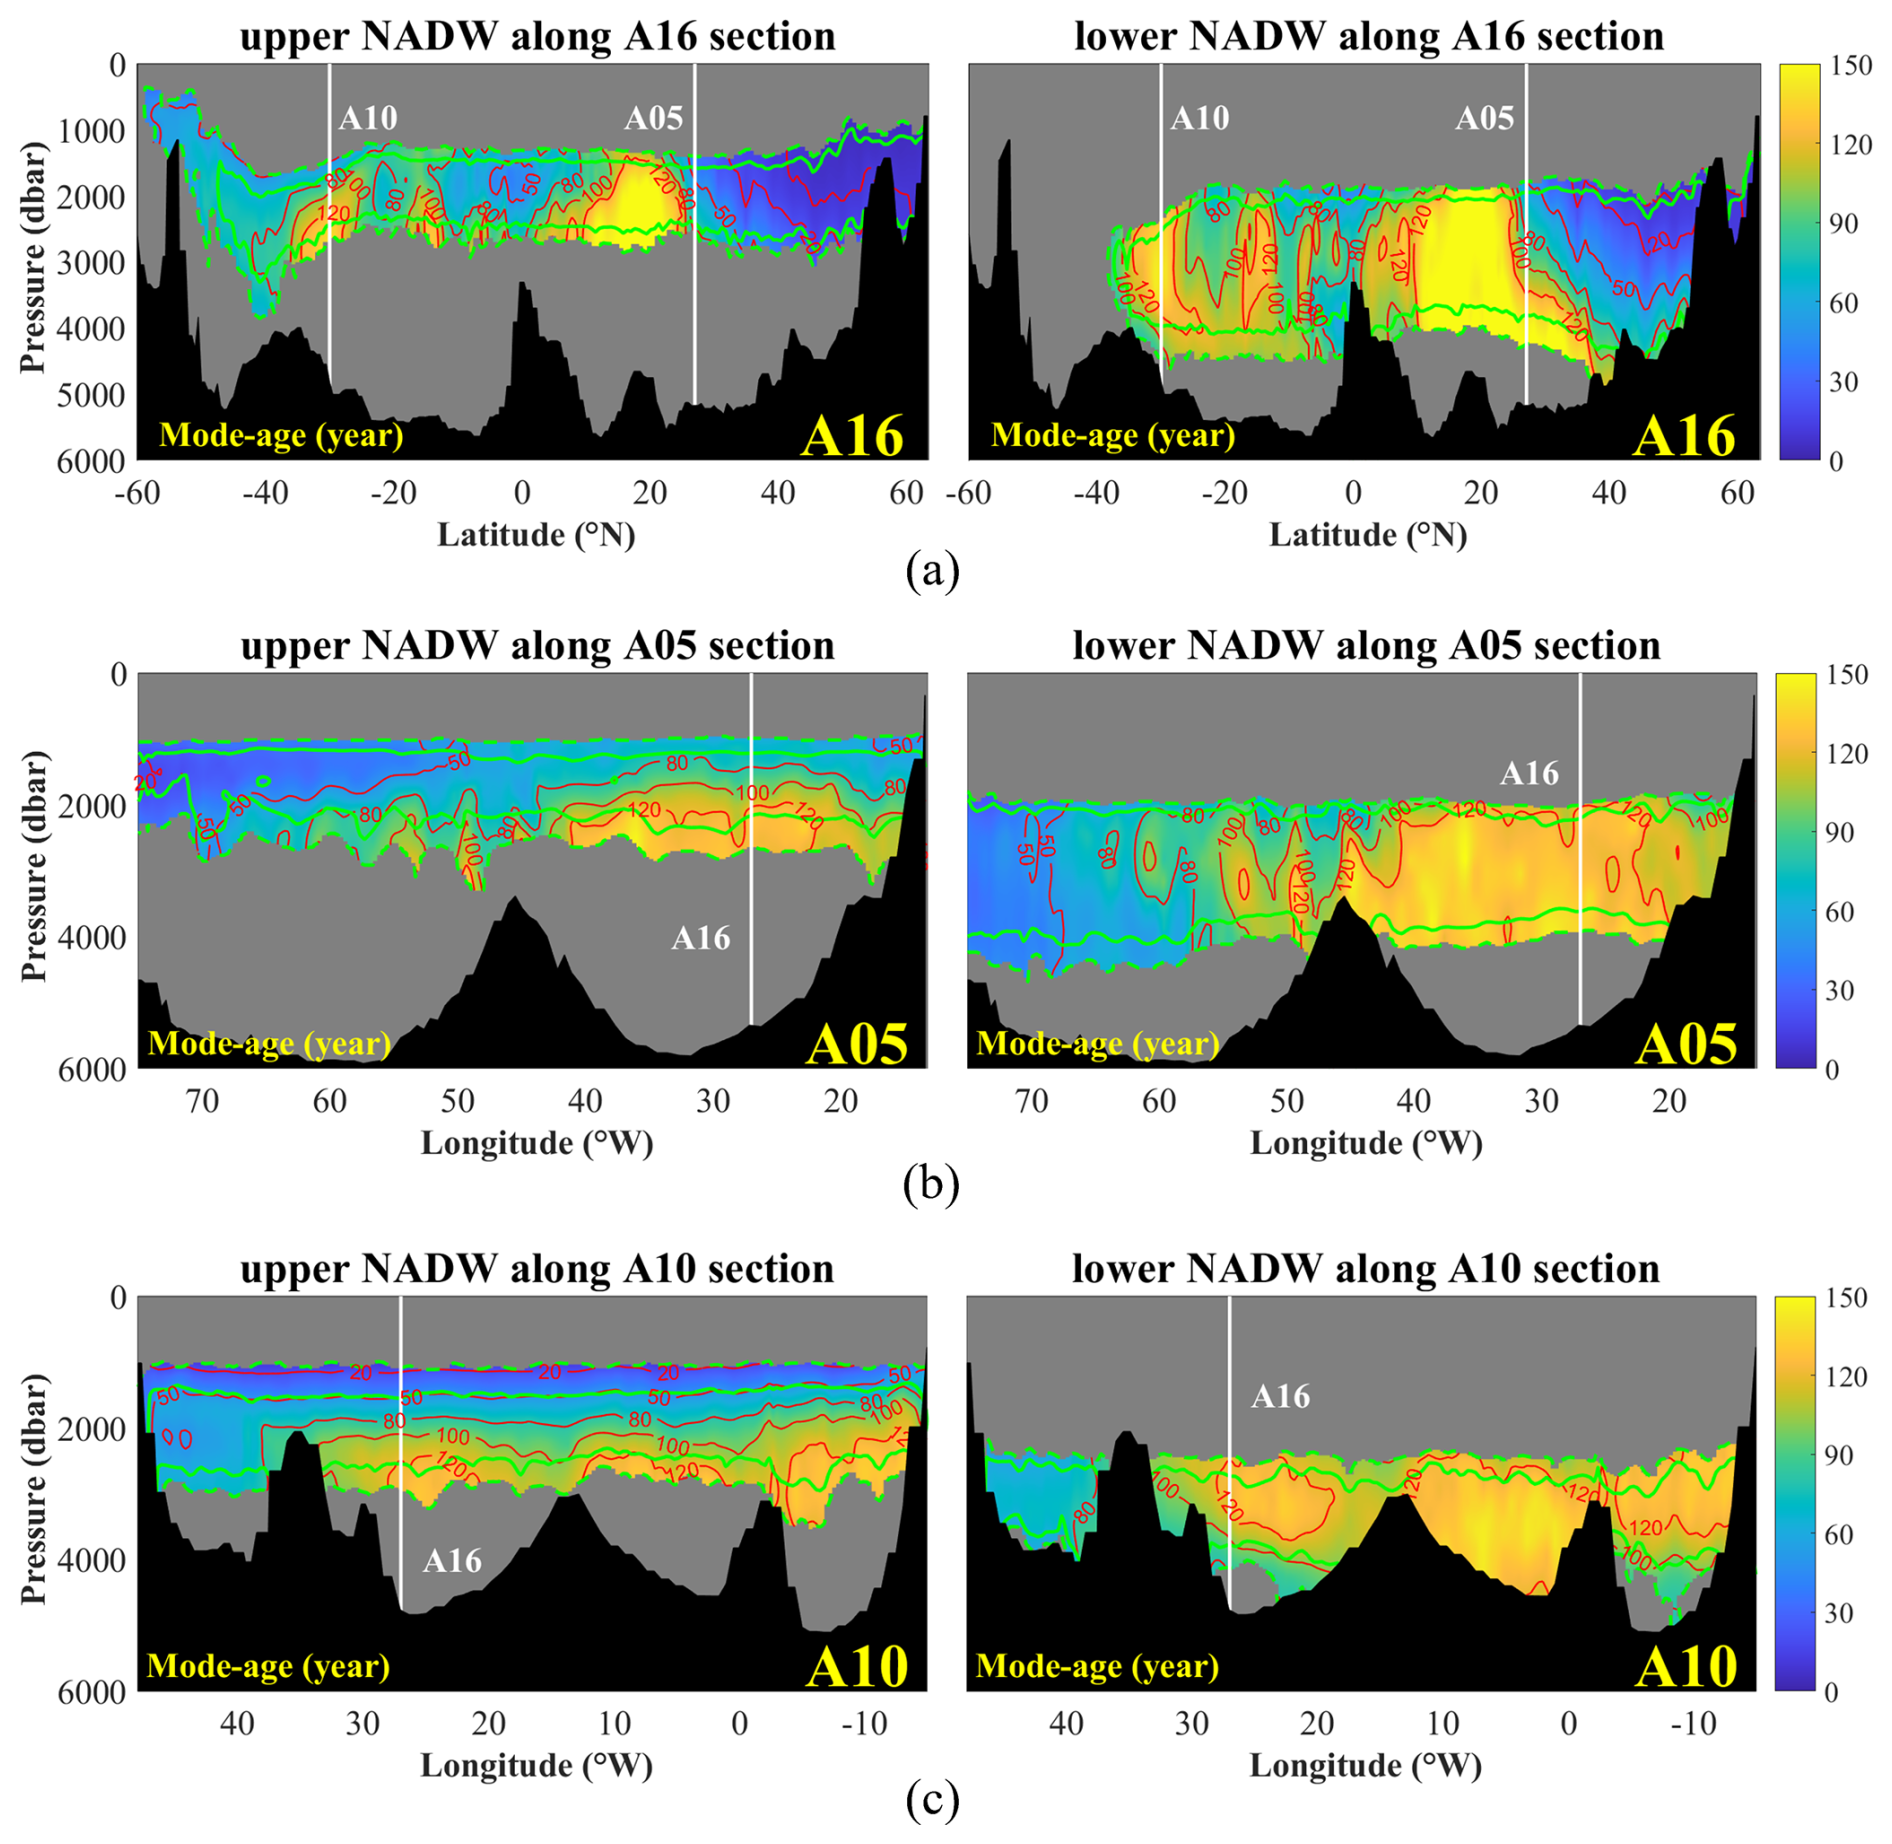
Figure 11Mode-ages (years) of upper and lower NADW along the A16 (a), A05 (b) and A10 (c) section lines. The green contour lines show fractions of water masses in 50 % and the dashed green lines show the 20 % fractions. The grey blank indicates less than 20 % contribution from NADW. The white vertical lines show cross overs with other section lines.
3.4 Bottom Layer
The bottom layer is noticed already by Wüst (1933) as it is filled with water from the south. Sverdrup (1940) further pointed out the role of ACC plays in the formation and spreading of Antarctic Bottom Water (AABW). On this basis, Mantyla and Reid (1983) elaborated that the most original dense bottom water is restricted near the Antarctic region by topography and the northward flow of bottom water is the mixture of original dense water and the overlying warm water. Gordon and Huber (1990) and Orsi et al. (1999) illustrated that the pathway of AABW to the north is through the Drake Passage sill into the Argentina and Brazilian Basin (Fig. 12a). In the Atlantic Ocean, the AABW dominates the bottom layer (γ>28.10 kg m−3), which origins from the Weddell Sea and spreads to the north. After passing the equator, the AABW is redefined as Northeast Atlantic Bottom Water (NEABW, Liu and Tanhua, 2021).
Antarctic Bottom Water (AABW) and Northeast Atlantic Bottom Water (NEABW)
The transport of bottom water is a long process going from the south towards the north. In the meridional direction, the AABW is transported towards the equator with a mode-age of ∼ 100 years at the equator, and further northward as NEABW to 40° N with a mode-age of ∼ 150 years (Fig. 12b). Combined with the A16 Section, more specific segments/details can be seen. In the early stage from the surface of Weddell Sea to the bottom (below the pressure 4000 dbar) at 40° S, the mode-age of AABW is ∼ 50 years. In the range between 10 and 30° S, high values of ∼ 120 years (mode-age) appear due to the mixing with the lower NADW with high ages (Fig. 13a). After passing the equator, the redefined NEABW contains a mode-age up to ∼ 150 years at 40° N, indicating that the bottom water, including the AABW and NEABW, takes about 150 years (mode-age) for the transport from the formation area (Weddell Sea) to 40° N. North of 40° N, the ages decrease due to the mixing with newly formed lower NADW in this region (Figs. 12b and c, 13a). The distribution of mode-ages also shows a difference in the zonal direction. As shown in Fig. 12b, the general age distribution presents a trend with lower ages in the west, and higher in the east. Along the A10 section at 30° S, the AABW has a mode-age of ∼ 50 in the west and ∼ 100 in the east. A similar situation is recorded along the A05 section; the mode-age of NEABW is ∼ 80 years in the west and ∼ 120 years in the east (Fig. 13b). An additional factor that affects the age distributions is the mixing between AABW and NADW. In the south hemisphere, mode-ages are relatively low (∼ 80 years) at the pressures below 4000 dbar, where the AABW has a fraction higher than 50 %, while they are significantly higher when the AABW mixes with lower NADW at pressure of ∼ 3000 dbar, especially in the region between 0 and 10° W, reaching ∼ 120 years. This is because the “old” NADW takes up a fraction for more than 50 % to 80 %. The situation in the north hemisphere is the opposite, the mode-ages of NEABW are higher in the bottom layer below 4000 dbar but lower in the deep layer at 3000 dbar due to the mixing with the young NADW. In the western basin, the mode-age is ∼ 80 years in the bottom, while ∼ 50 years when mixed with NADW. Similar in the east basin, the mode-age is ∼ 120 years below 4000 dbar, while ∼ 100 years at 3000 dbar (Fig. 13b).
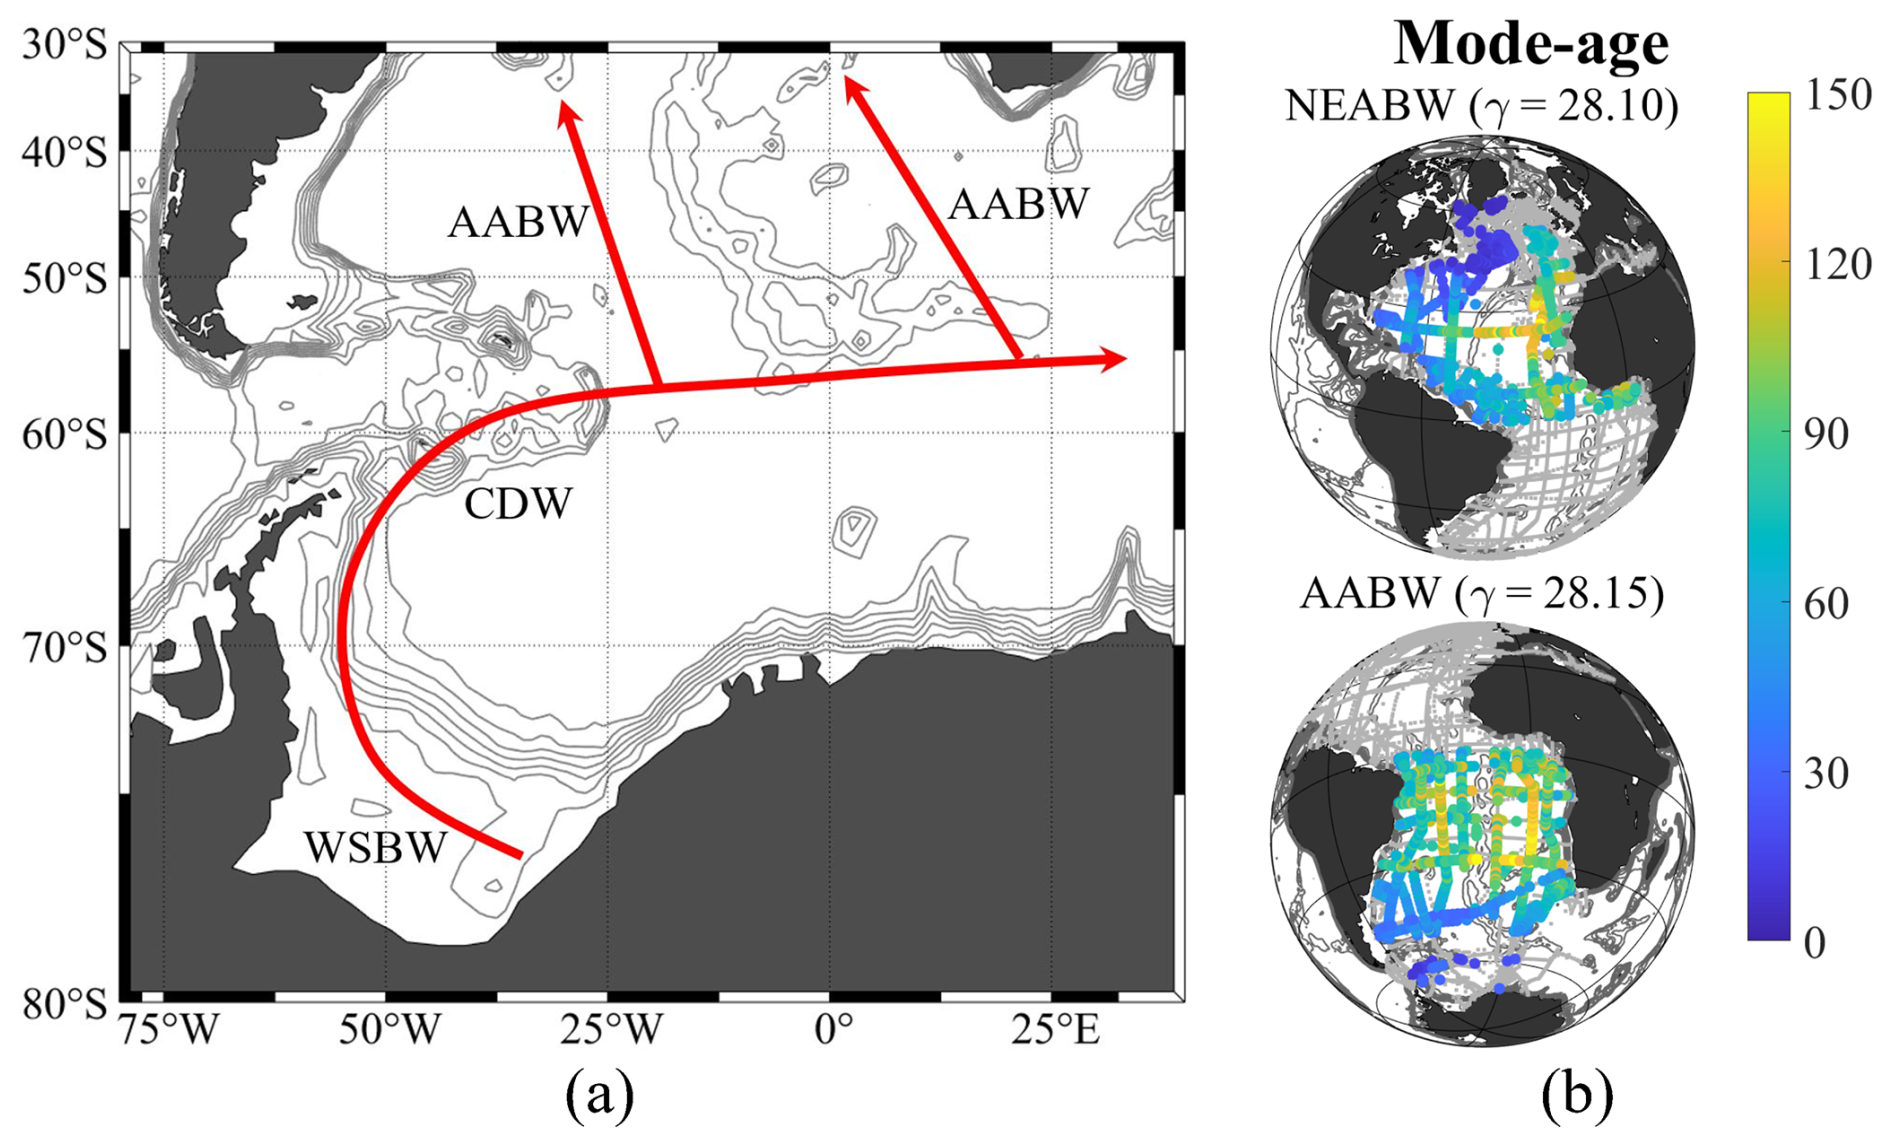
Figure 12Mode-ages of bottom water masses in the Atlantic Ocean. (a) Main currents in the bottom layer. The currents (arrows) and the formation areas (rectangular shadows) of water masses in the deep and overflow layer. (b) The mode-ages (years) of bottom water masses at their core neutral densities (kg m−3). The colored dots show the ages in each station. The grey dots show all the GLODAPv2 stations that have less than 20 % contribution of the water mass in question or lack of transient-tracer data.
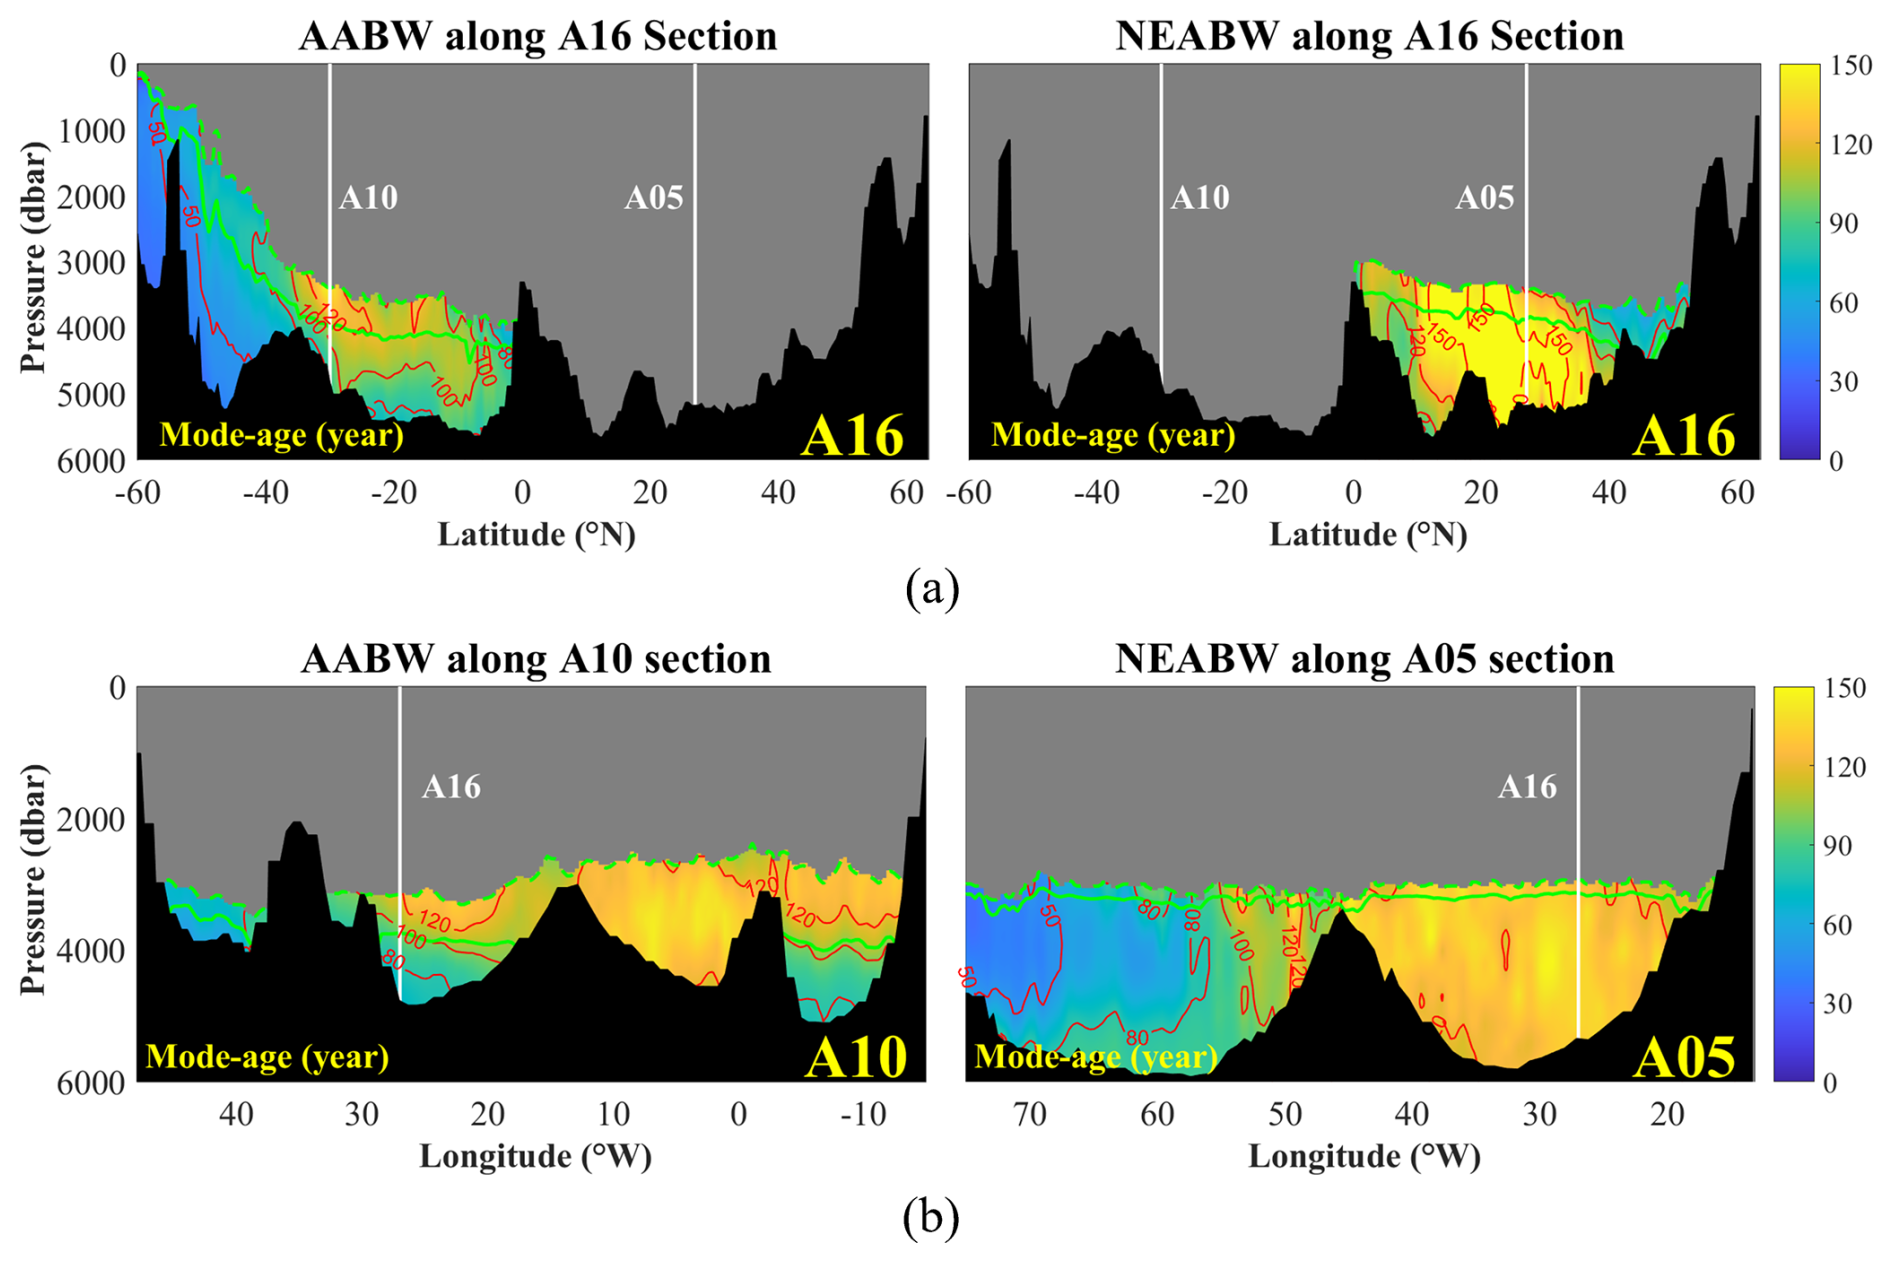
Figure 13Mode-ages of AABW and NEABW along the A16 (a), A05 and A10 (b) section lines. The green contour lines show fractions of water masses in 50 and the dashed green lines show the 20 % fractions. The grey blank indicates less than 20 % contribution from bottom water masses. The white vertical lines show cross overs with other section lines.
The transit time distribution (TTD) provides a framework for using transient tracers to estimate the time scales governing ventilation, which in turn can be applied to quantify biogeochemical rates. For instance, based on the TTD determined from the tracer observations, Wang et al. (2021) estimated the OUR in the northern South China Sea.
The oxygen concentration in seawater under steady state is maintained by the balance of supply from oxygen-rich surface water and consumption by the respiration of organic matter. The Apparent Oxygen Utilization (AOU) shows the accumulated oxygen consumption in a water mass since isolated from the atmosphere, and is defined as the difference between saturated and measured oxygen concentration (i.e. AOU = Oxysaturated − Oxymeasured, Redfield, 1942; Redfield et al., 1963; Pytkowicz, 1971). The Oxygen Utilization Rate OUR (µmol kg−1 yr−1) can be calculated from AOU and water mass age and shows the integrated oxygen utilization rate (oxidation rate) during the pathway of a water mass from surface of the formation area to the sampling location (Jenkins, 1987; Doney and Bullister, 1992; Sonnerup et al., 2013). In addition, the OUR is also an important indicator in characterizing the combination of ventilation and respiration of the interior ocean (Koeve and Kähler, 2016; Thomas et al., 2020).
The true local OUR is difficult to determine because water samples contain a mixture of paths with different transit times (Tomczak, 1999; Koeve and Kähler, 2016). Researchers have tried a variety of ways to define the age of a water mass. For instance, the tracer-age (CFC age) is used in Karstensen et al. (2008), while the mean-age (partial pressure ages) is used in Sonnerup et al. (2015) in estimating the “integrated” water mass age that effects the oxygen consumption. There is no direct evidence that one age definition is theoretically superior for OUR calculations; both the mean-age and the mode-age are approximations. The mean-age (Γ) averages over all pathways, including old water fractions that have experienced very low respiration rates in the deep ocean; using it would tend to lower the estimated OUR. The mode-age, in contrast, represents the most probable transit time of the dominant water fraction and is often interpreted as the advective timescale. As a working assumption, we adopt the mode-age to calculate OUR, reasoning that it may better reflect the respiration accumulated along the core pathway of the water mass. However, we emphasize that the resulting OUR values are indicative rather than absolute. If the mean-age were used instead, the computed OUR would be roughly six times lower (given ), bracketing the plausible range. Our choice of mode-age likely provides an upper-end estimate of the respiration rate for the dominant water mass. For example, if we use the mean-age instead of the mode-age for the NADW core in the western basin, the OUR would decrease from ∼ 2 to ∼ 0.3 µmol kg−1 yr−1. Both values are within the range reported in the literature (e.g., Jenkins, 1987; Stanley et al., 2012), highlighting the uncertainty associated with the choice of age metric.
Water masses with mode-ages larger than ∼ 50 years in some parts of their distribution, including the AAIW, NADW, AABW and NEABW in the Atlantic Ocean, are defined here as wide-spread water masses. The transports of these wide-spread water masses are significantly influenced by the currents and topography. Therefore, their mode-age shows regional differences. Such differences also exist in DO and AOU, and lead to the spatial differences in OUR, especially between the eastern and western basins (Fig. 14). In the meridional direction, the mode-age increases with the distance from formation area. In the zonal direction, significant differences exist between the east and west of MAR. The wide-spread water masses generally have lower mode-ages in the western basin, which is better ventilated by the WBC and the DWBC (Fig. 14, left). In addition, surface oxygen-rich water is transported by these water masses to the deeper layers and are gradually consumed during the path-way. As a result, the DO is highest in the formation area and decreases with the distance. Meanwhile, the western basin displays higher DO due to the better ventilation (Fig. 14, middle left). The OUR shows a similar distribution to DO indicating that higher oxygen consumption rate, or oxidation rate is co-located with the regions with high oxygen concentration. At the same time, Fig. 14 also shows that the OUR approaches 0 when the mode-age is larger than ∼ 50 years.
In the intermediate layer, the AAIW show low mode-ages, high DO and low AOU in the formation area near the Antarctic region. During the northward transport between 40° S and 20° N, the mode-ages increase and the DOs decrease with distance from the formation area (Fig. 14, upper panel). In general, the mode-ages are lower in the west, while the zonal difference for DOs is not significant except for some regions in the eastern basins. The mode-ages are mostly between ∼ 60 and ∼ 90 years and reaches up to ∼ 120 years in the poor ventilated eastern basin. The DOs are between 160 and 220 µmol kg−1 in the south hemisphere and mostly between 100 and 160 µmol kg−1 in the north hemisphere. The OURs in the Antarctic region obtain the highest value in the latitude region between 20 and 40° S and decrease on the pathway to the north until 20° N.
In the deep and overflow layer, the NADW is newly formed in the high north latitude. In most regions covered by the NADW between 30° N and 40° S, the differences between west and east exist with obvious low mode-age and AOU (high DO) and in the west, where is well ventilated by the DWBC (Fig. 14). The mode-age is between ∼ 30 and ∼ 60 years in the west and between ∼ 90 and ∼ 150 years in the east. The AOU is lower in the west and higher in the east. The OUR, which shows the opposite distribution as the AOU in the zonal direction, obtains the highest value in the formation area of NADW, maintains relative higher in the west along the DWBC region and shows a lower value in the eastern basin.
The bottom layer is occupied by the AABW and NEABW in the south and north hemisphere respectively. The AABW is formed in the Antarctic region with an original mode-age lower than ∼ 30 years and increases on the way to the north. Similar to the AAIW and NADW, the western basin is better ventilated, therefore the mode-ages are lower in the west at the same latitude (Fig. 14, lower panel). In contrast to the AAIW and NADW, the AABW obtains relative lower DOs and higher AOUs when formed (see also Fig. 15b). In the western basin of the South Atlantic, the DOs decrease to 220 µmol kg−1 and the AOUs increase to 130 µmol kg−1 on the pathway, while in the eastern basin, the DOs are 240 µmol kg−1 and the AOUs are 110 µmol kg−1. This is because the eastern basin is more influenced by the relative oxygen-rich NADW from the north. Similarly, the DOs and AOUs of NEABW in the North Atlantic also show similar states to the NADW. In west regions ventilated by the DWBC, the DOs reach the values of higher than 260 µmol kg−1 and AOU is lower than 70 µmol kg−1. This result can also be confirmed in Fig. 15. Although the distributions of DOs and AOUs are more complex in the bottom layer, the OURs still match the distribution of mode-ages. The highest OURs appears in the formation area near the Antarctic region with values higher than 4 µmol kg−1 yr−1. In the western Atlantic region with low mode-ages, the OURs show relative higher values (> between 1 and 3 µmol kg−1 yr−1) and low value (below 1 µmol kg−1 yr−1) in the east (Fig. 14, lower panel).
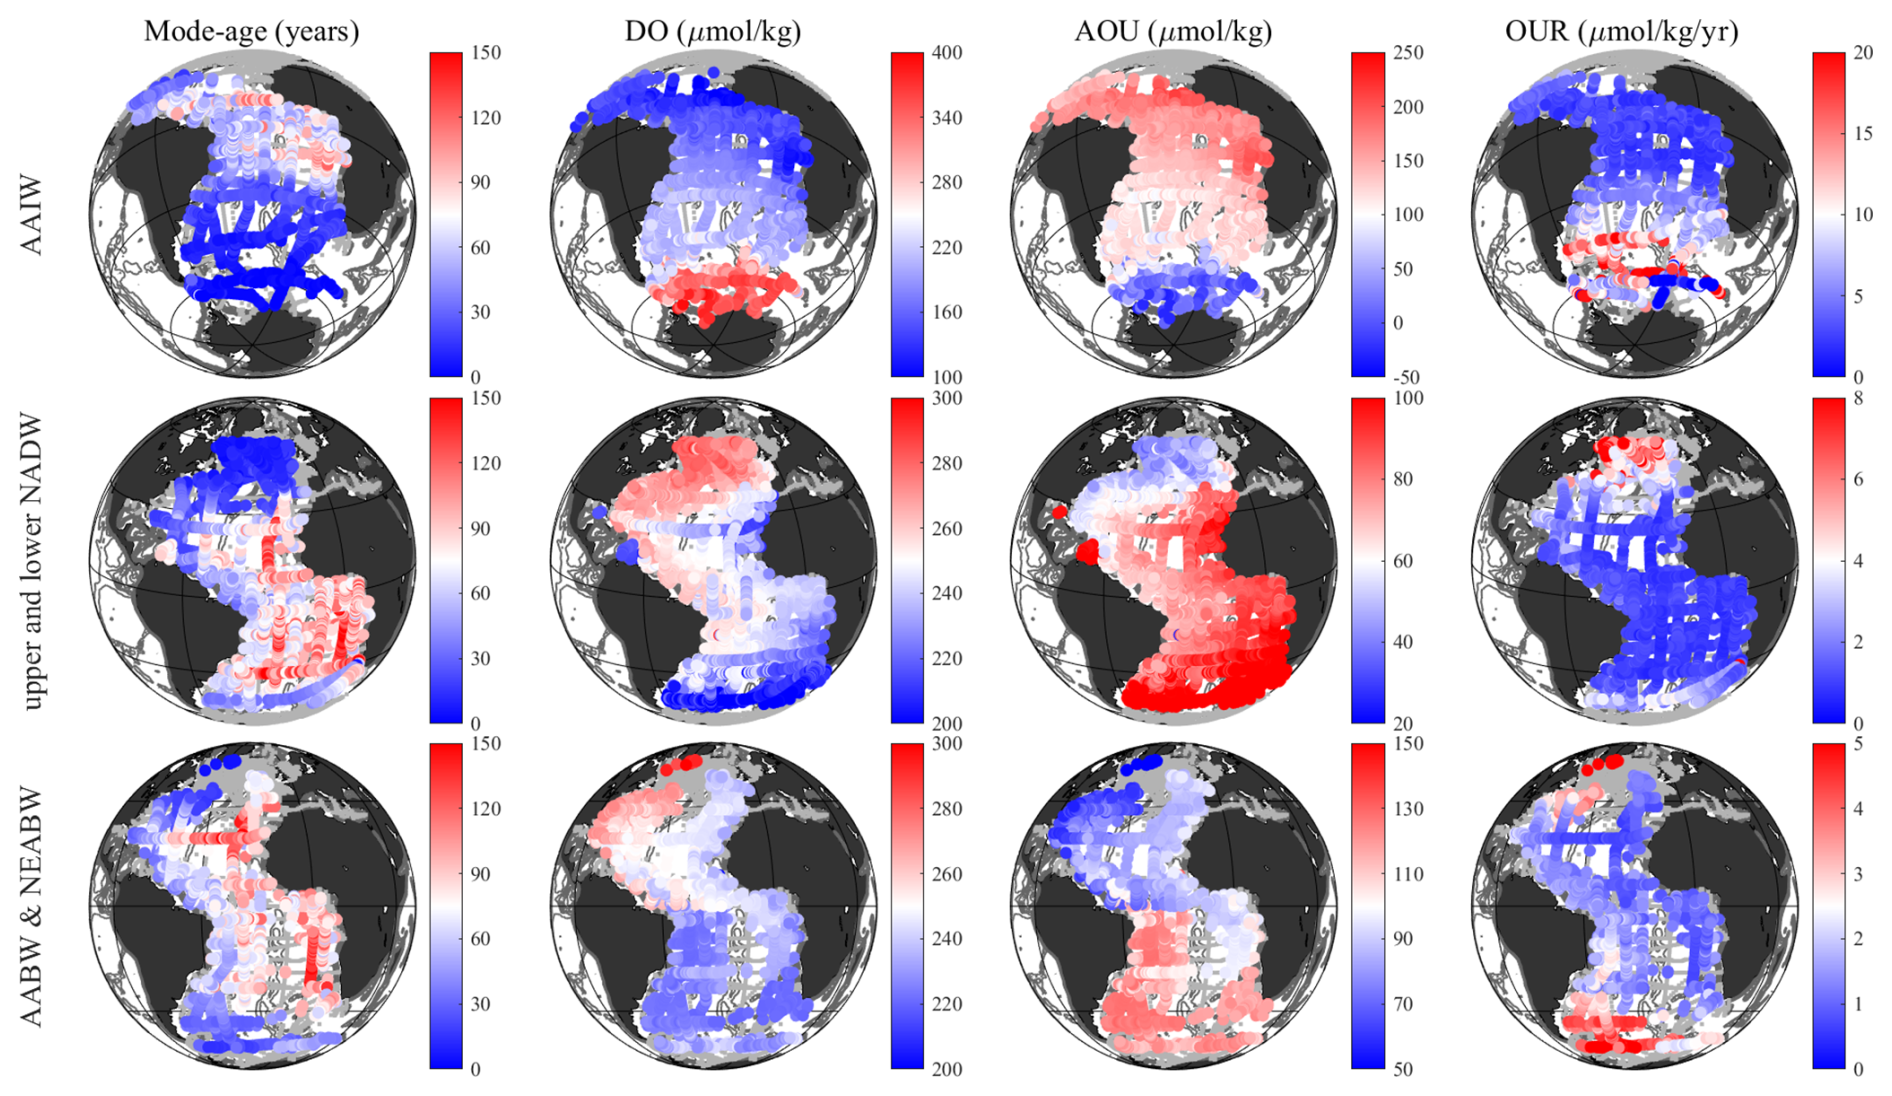
Figure 14Mode-age, DO, AOU and OUR of wide-spread water masses in the Atlantic Ocean. The colored dots show the values in each station at core neutral densities of each water mass (AAIW at 27.20, upper NADW at 27.95, lower NADW at 28.05, AABW at 28.15, NEABW at 28.10 kg m−3), the upper and lower NADW, AABW and NEABW are shown in one plot. The grey dots show all the GLODAPv2 stations that have less than 20 % contribution of the water mass in question. Note: Negative AOU values indicate oxygen supersaturation, which is typically observed in well-ventilated surface or near-surface waters.
The above four properties are also represented along the A16 section (Fig. 15). The AAIW has the lowest mode-age among the three water masses, but also the largest variations in the DO and AOU. The mode-age indicates that in total of ∼ 40 to 60 years is needed for the main body of AAIW (fractions > 80 %) to be transported to the equator (Fig. 15a). The DO decreases rapidly from 260 to below 180 µmol kg−1 at the oxygen minimum zone at 20° S, while the AOU increases from 60 to 150 µmol kg−1 during the northward pathway (Fig. 15b and c). The OUR is higher than 8 µmol kg−1 yr−1 at the beginning and decreases to 3 µmol kg−1 yr−1 close to the equator (Fig. 15d). The mode-age of NADW is ∼ 140 years at 40° S and reaches a peak of ∼ 160 years in the region of 20° N due to the sluggish water exchange caused by the topography. The NADW contains the highest oxygen concentration and the lowest AOU and OUR in the abyssal Atlantic Ocean. The value of DO is 260 µmol kg−1 at the starting point at 60° N and still remains 220 µmol kg−1 at 40° S where it meets the AABW and AAIW. The AOU of NADW remains below 100 µmol kg−1 during the entire pathway. The OUR of NADW is below 5 µmol kg−1 yr−1 close to the formation area, and below 1 µmol kg−1 yr−1 south of 60° N. The transport of the main body of AABW takes in total of ∼ 100 years from the Weddell Sea to the equator. The DO and AOU remain unchanged at 220 and 130 µmol kg−1 respectively on the pathway to the equator, indicating very low OUR. Although derived from the AABW, the characteristics of the NEABW are more similar to the NADW in all the above properties.
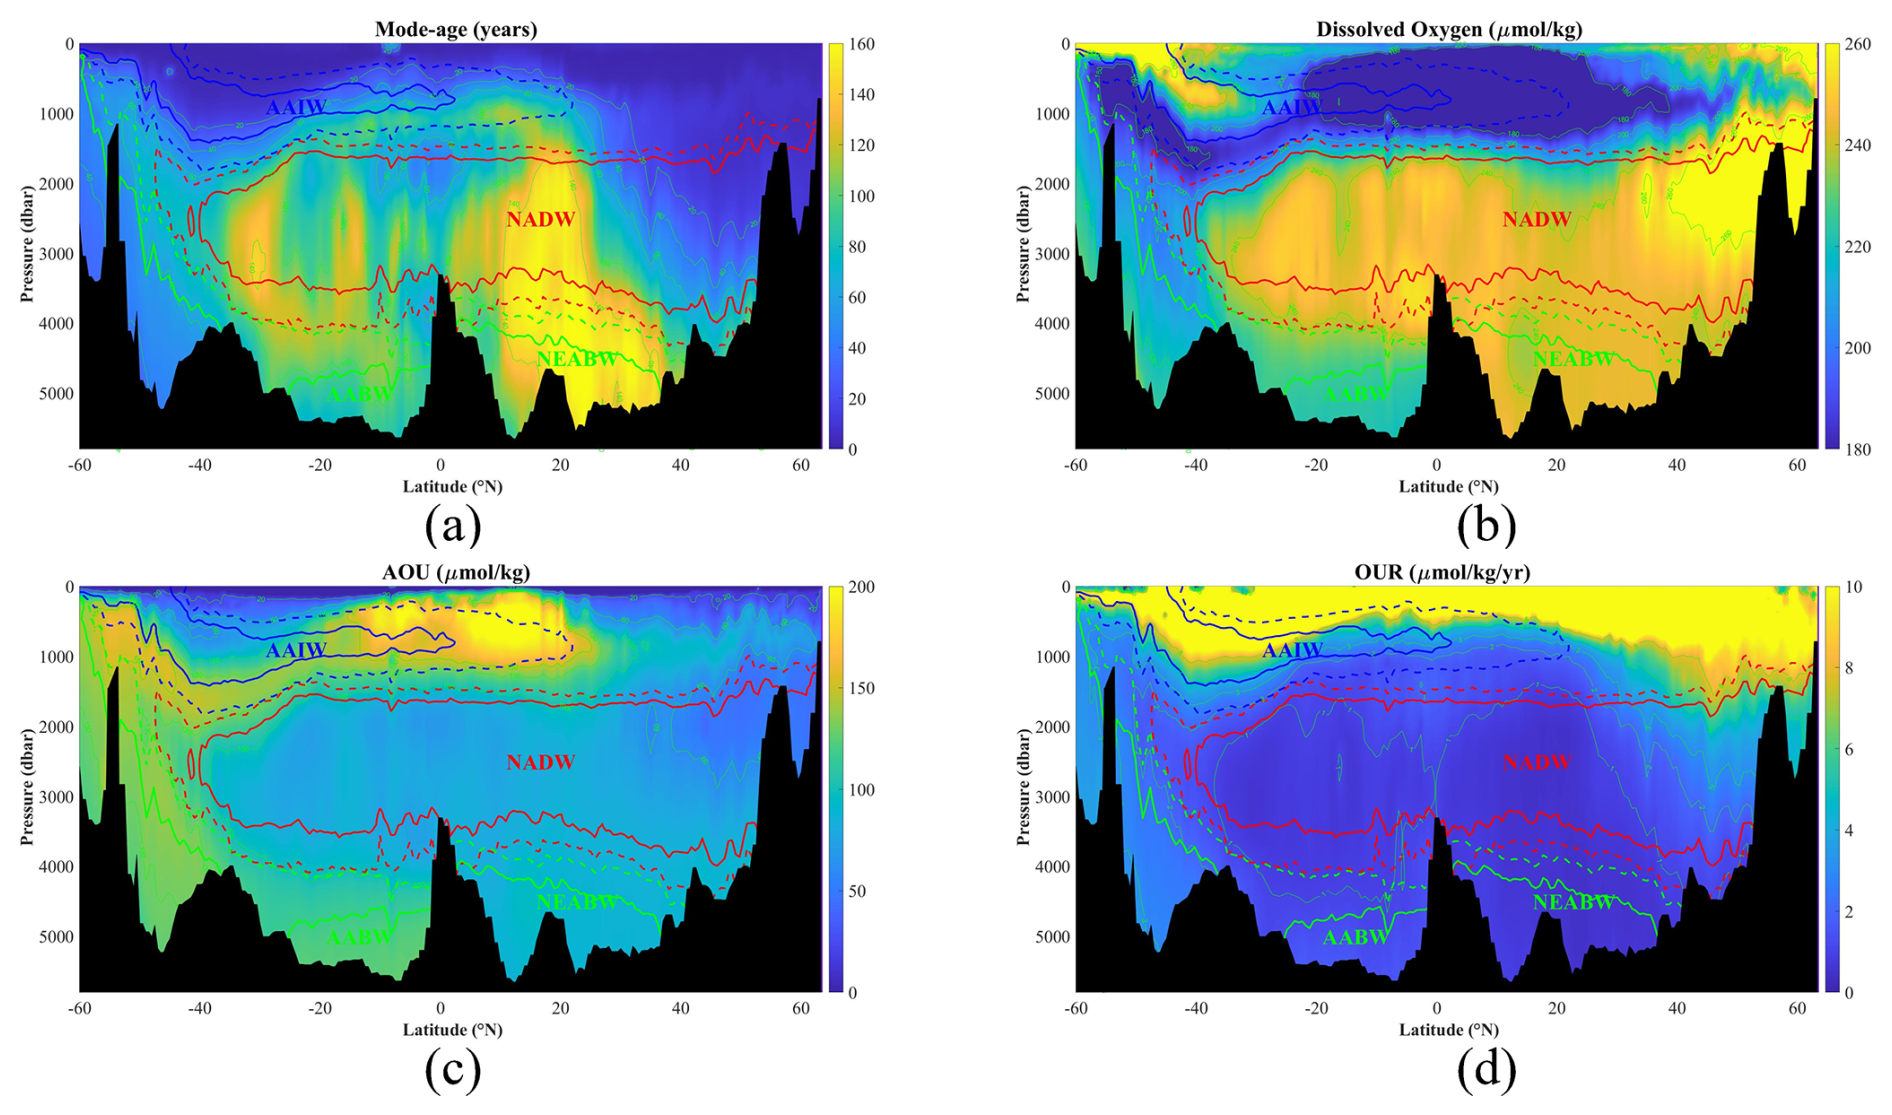
Figure 15Distributions of (a) mode-age, (b) dissolved oxygen, (c) AOU and (d) OUR along the A16 section line. The color solid lines show the fractions of 80 % in each water mass and the dashed lines show the fractions of 50 %.
The radioactive isotope 39Ar (half-life 269 years) is a valuable tracer for dating old water masses. The 39Ar data used in this study are compiled from the doctoral thesis of Rodriguez (1993), which tabulates 125 measurements collected during the 1980s and early 1990s in the Atlantic Ocean using low-level decay counting (Loosli, 1983; Schlosser et al., 1994). More recent 39Ar data from ATTA technology (e.g., Lu et al., 2014; Ebser et al., 2018) are not yet available in sufficient numbers for basin-scale synthesis. Therefore, our analysis relies on the Rodriguez (1993) dataset. We note that these 39Ar measurements were taken approximately two decades before most GLODAPv2 CFC-12/SF6 data (which are from the 2000s and 2010s). This temporal mismatch, together with the assumption of steady-state circulation, introduces additional uncertainty into the comparison. Nevertheless, the paired analysis presented below (Fig. 18) is based on spatially collocated stations, recognizing that the ventilation state may have changed over the intervening decades. For 39Ar we focus our attention on older water masses, as younger ones are better characterized by CFC-12 and SF6. Because this study adopts a fixed mixing ratio (), the 39Ar-derived ages, which physically represent mean residence times, are converted to mode-ages by multiplying by 0.162 for consistent comparison with the CFC-12/SF6-derived mode-ages. All ages reported in this section are therefore mode-ages.
For this purpose, we make a distinction between the western (green dots) and eastern (red dots) Atlantic, divided by the Mid-Atlantic-Ridge (Fig. 16a). The distribution of 39Ar is shown in Fig. 16b. Near the formation area of each wide-spread water mass, the concentration of 39Ar approaches approximately 100 %, indicating that the surface waters are in equilibrium with the atmosphere. As these water masses are transported over long distances and extended periods, the continuous decay of 39Ar leads to concentrations decreasing to roughly 30 % at their furthest locations. By integrating this information with its half-life of 269 years, the water mass ages can be estimated. For 39Ar we focus our attention to the older water masses, as the younger ones are better characterized by CFC12 and SF6.
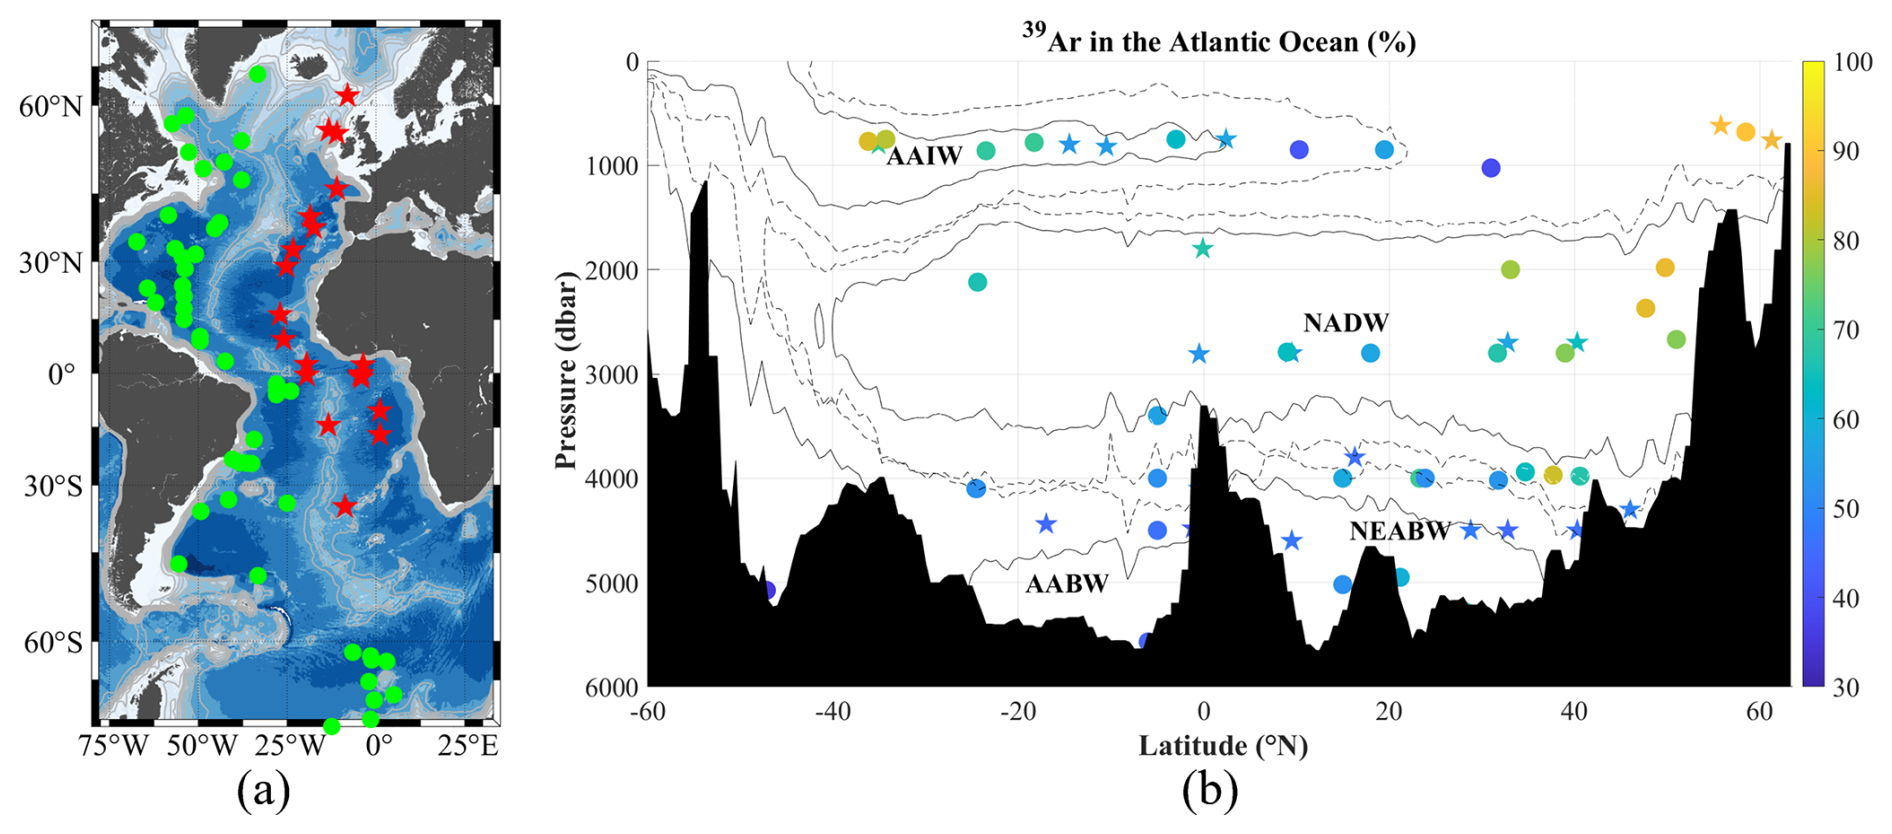
Figure 16(a) Map of the 39Ar sampling stations. The green circle dots show the stations in the west Atlantic Ocean (west of the Mid Atlantic Ridge), while the red stars show the stations in the east Atlantic Ocean. (b) Distributions of 39Ar in the Atlantic Ocean (% Modern). The circle dots show the data in the west, while the stars show the data in the east Atlantic Ocean. The solid isolines show the 80 % fractions of water masses and the dashed lines show the 50 % fractions.
Similar to the findings from CFC-12 and SF6 observations, the mode-ages derived from measurements using 39Ar increase with transport from the source of formation (Fig. 17). At a latitude of approximately 40° S, the AAIW exhibits mode-ages ranging between ∼ 16 to ∼ 32 years (the corresponding mean-ages are ∼ 100–200 years). When transported northward to about 20° S, the mode-ages rise to ∼ 60 years (mean-age ∼ 300 years). Upon reaching approximately 10° N during further northward transport, these values escalate to around ∼ 100 years for mode-age (∼ 700 years for mean-age). However, near the region at about 20° N, the terminus for northward flow, the mode-age decreases back down to roughly ∼ 65 years (mean-age ∼ 400 years) due to mixing with younger upper NADW. In the deep and overflow layer, the newly formed NADW initiates at high northern latitudes, exhibiting both mean- and mode-ages approaching zero. During southward transport at around 30° S, the concentration data indicates corresponding mode-ages of approximately ∼ 65 years (mean-age ∼ 400 years). Similarly, the bottom water masses (AABW and NEABW) display mode-ages of around ∼ 80–100 years (mean-age ∼ 500–600 years) at the farthest end of the transport distance approximately 50° N.
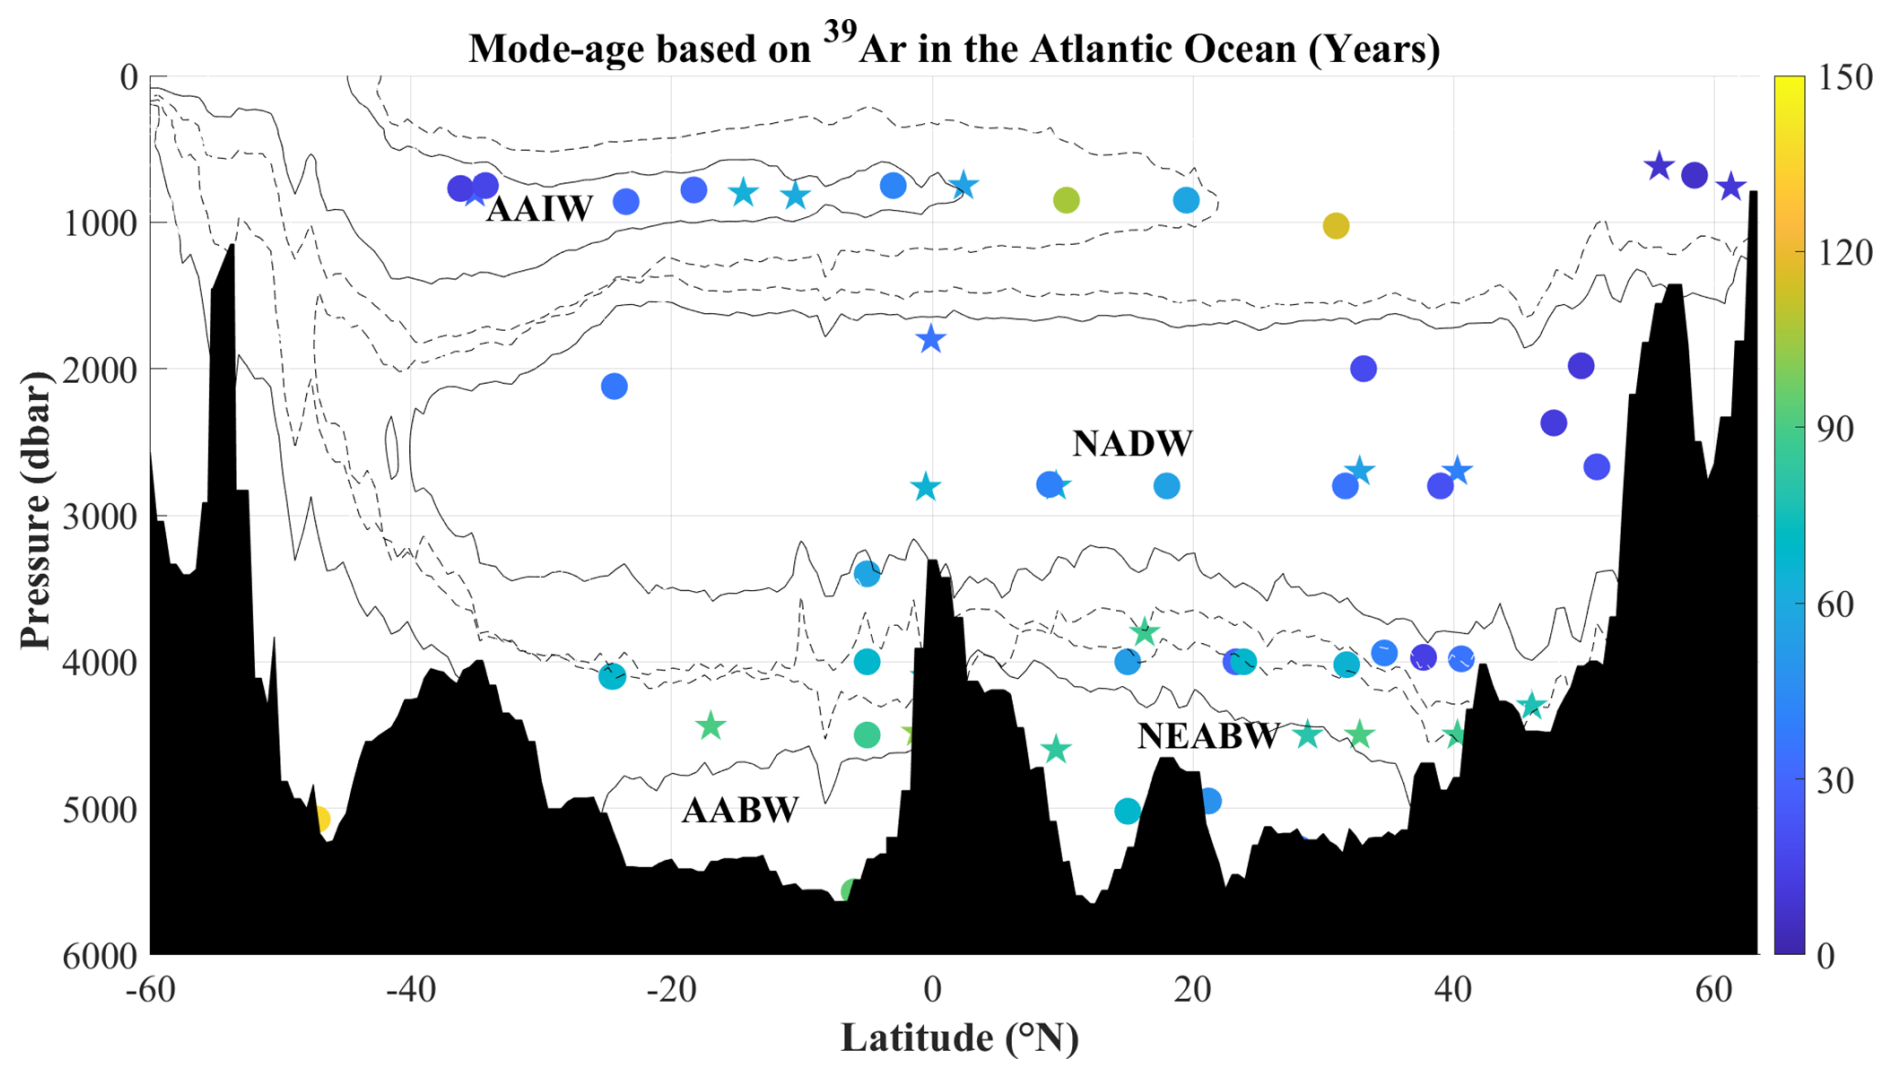
Figure 17Mode-ages of the wide-spread water masses estimated by 39Ar in the Atlantic Ocean. The circle dots show the data in the west, while the stars show the data in the east Atlantic Ocean. The solid isolines show the 80 % fractions of water masses and the dashed lines show the 50 % fractions.
The contrast between the western and eastern Atlantic Ocean is distinctly evident (Fig. 16b). Generally, higher concentrations of 39Ar are observed in the west compared to the east at equivalent latitudes. For instance, in the vicinity of the AAIW formation area at 40° S, the 39Ar concentration is approximately 100 % in the west and around 70 % in the east. In the intermediate layer near the equator, these concentrations decrease to about 70 % (west) and 50 % (east). These findings suggest that mode-ages are close to zero at 40° S. The mode-age is estimated to be ∼ 50 years in the west and ∼ 80 years in the east north of 40° S. The mean-age is estimated to be ∼ 300 years in the west and ∼ 500 years in the east north of 40° S. Similar results are also observed in the deep water and overflow layers. Based on elevated levels of 39Ar near its formation area, it can be inferred that both mean- and mode-ages of NADW are close to zero at 60° N across both West and East Atlantic Oceans. Between 20° N and the equator, the mode-age is estimated to be ∼ 50 years in the west and ∼ 80 years in the east, respectively. For bottom water masses below a depth of 4000 m, concentrations of 39Ar generally fall below 50 %, with higher levels observed in the west (50 %–60 %) compared to lower levels seen in the east (40 %–50 %) between 20° S and 40° N, indicating the mode-ages range from ∼ 65–80 years in the west, and ∼ 80–100 years in the east.
Table 2Comparison of mode-ages (years) estimated from CFC-12/SF6 and 39Ar for selected Atlantic water masses.
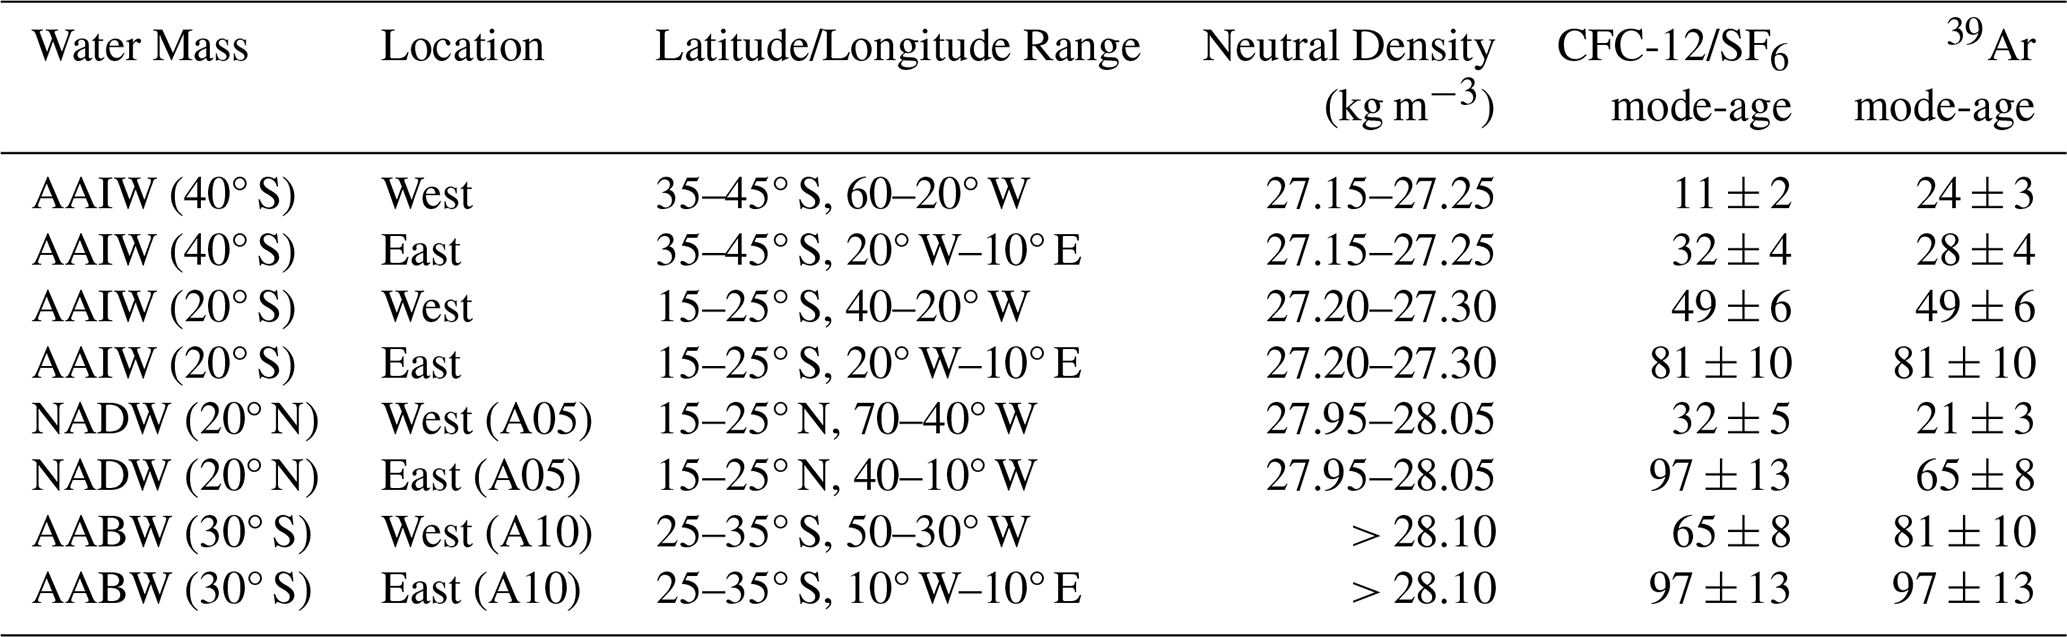
Note: Uncertainties for CFC-12/SF6 are derived from mixing ratio sensitivity tests (); uncertainties for 39Ar are from measurement statistics (1σ). Location definitions follow the neutral density ranges given in Liu and Tanhua (2021), “West” = west of Mid-Atlantic Ridge (MAR); “East” = east of MAR. A full version of this table including mean- and mode-ages and additional locations is provided in the Supplement (Table S1). The ages are core values at the specified neutral density ranges. For NADW, “A05” refers to the zonal section at ∼ 24° N; for AABW/NEABW, “A10” refers to the zonal section at ∼ 30° S. Uncertainty ranges are rounded to nearest 5 years. 39Ar data are from stations not exactly coincident with CFC-12/SF6 stations; spatial pairing criteria are described in Sect. 5 and Fig. 18.
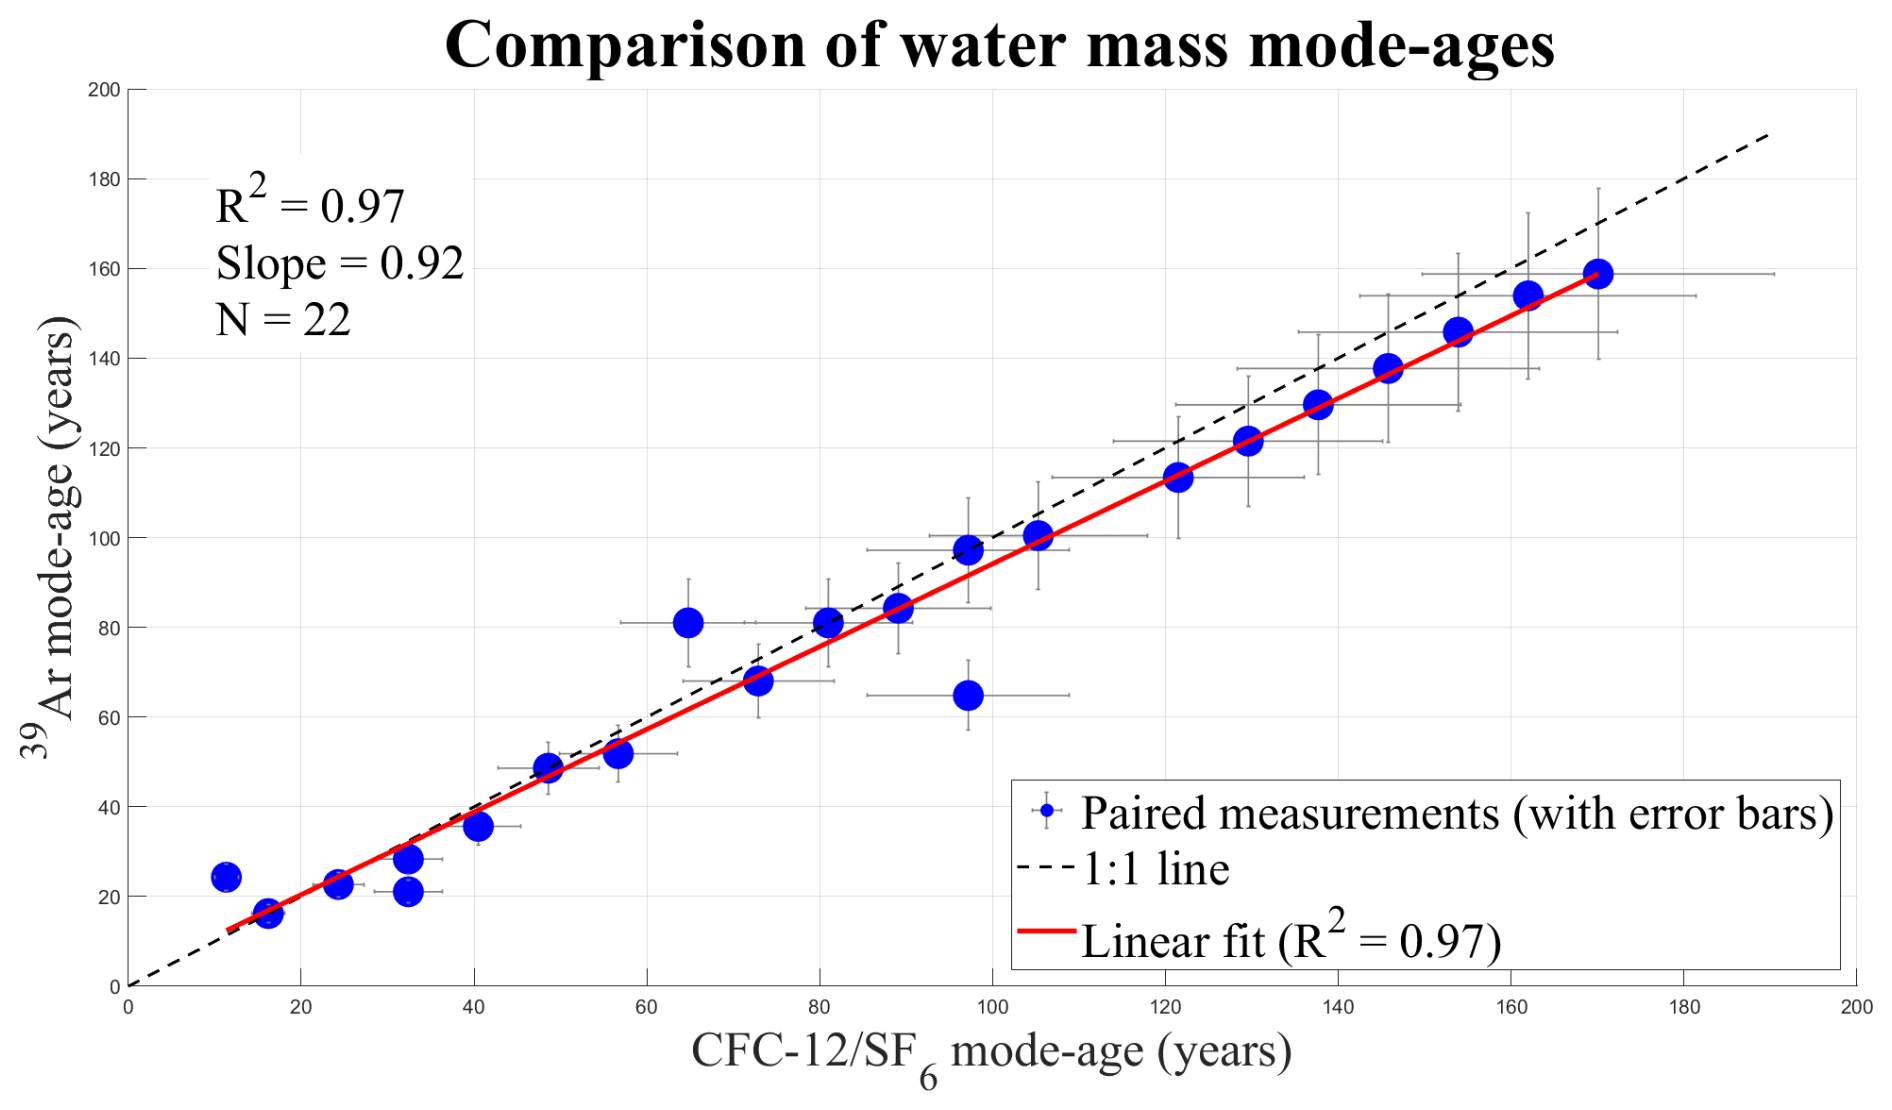
Figure 18Scatter plot of 39Ar-derived mode-ages versus CFC-12/SF6-derived mode-ages for paired Atlantic water mass samples (AAIW, NADW, AABW/NEABW). Each point represents an 39Ar measurement (Rodriguez, 1993; collected in the 1980s–1990s) paired with the nearest GLODAPv2 station (2000s–2010s) within 2° in latitude/longitude and 200 dbar in pressure, sampling the same water mass. Error bars: horizontal = CFC-12/SF6 age uncertainty estimated from mixing ratio sensitivity tests (); vertical =39Ar age uncertainty from measurement statistics (1σ). Dashed line: 1:1 reference. Solid red line: linear regression (major axis) with R2=0.98 (N=22). The comparison assumes steady state ventilation over the ∼ 20 years temporal mismatch between the two datasets.
Linear regression of the 22 paired points yields: 39Ar mode-age = 0.92 × (CFC-12/SF6 mode-age) + 2.5 years (R2=0.98). The 1:1 reference line (dashed) is crossed at a CFC-12/SF6 mode-age of ∼ 31.25 years, corresponding to a 39Ar mode-age of the same value. This crossing point (∼ 30 years) marks the threshold below which the two methods agree within uncertainties. For mode-ages > ∼ 30 years, CFC-12/SF6 ages are systematically higher than 39Ar ages, as indicated by the slope of 0.92, suggesting overestimation by CFC-12/SF6 in deep, old waters due to tracer concentrations approaching detection limits. For younger waters (< 30 years mode-age), the two methods agree within uncertainties, although for such young waters 39Ar is not an ideal tracer. The high R2 confirms overall consistency, while the offset at high ages demonstrates the complementary value of 39Ar for dating waters on centennial-to-millennial timescales. We note that the comparison assumes steady-state ventilation over the ∼ 20-year temporal mismatch between the two datasets; changes in circulation over that period may contribute to the bias.
As expected, the inferred ages of water masses differ depending on the tracer employed. These discrepancies arise not only from potential limitations in the assumed IG-TTD, but also from the distinct temporal validity ranges and detection limits of each tracer. Our comparative analysis (as summarized in Table 2 and Fig. 18) reveals a systematic pattern: mean- and mode-ages derived from 39Ar are generally lower than those estimated from CFC-12 and SF6 for deeper/older water masses. This is exemplified by the NADW in the eastern basin near 20° N, where CFC-12/SF6 yield a mean-age of ∼ 1000 years and a mode-age of ∼ 150 years, whereas 39Ar suggests younger ages of ∼ 600 and ∼ 90 years, respectively. Similarly, for AABW/NEABW near 50° N, CFC-12 and SF6 based estimates (∼ 800 years mean, ∼ 120 years mode) exceed those from 39Ar (∼ 500 years mean, ∼ 100 years mode). A likely explanation for this systematic tendency towards higher age estimates from CFC-12 and SF6 in deep and bottom layers might be attributed to their extremely low concentrations at great depths and for older waters. These concentrations often approach or fall below analytical detection limits, which can amplify uncertainties and appear to skew age calculations towards higher values. In contrast, the 39Ar with 269-year half-life appears to be better suited for dating waters with transit times on the order of centuries to a millennium, and thus could provide relative more robust age estimates for these older water masses, as its slower decay rate remains measurable over such longer timescales.
The geographic distributions of main water masses in the Atlantic Ocean are reported in Liu and Tanhua (2021). In the present work, the transports of water masses are traced by transient tracers (CFC-12, SF6 and 39Ar) and their ventilation timescales (water mass ages) are quantified. Three distinct concepts of water mass age are discussed within the analytical framework. While the tracer-age concept (assuming purely advective transport) is introduced for context, the quantitative analysis and results presented herein are based on the mean-age and mode-age derived from the Transit Time Distribution (TTD) model. The application of a standard mixing ratio () and 100 % surface saturation is followed. The mean-age, representing the average transit time of all water parcels in a sample and providing an integrative timescale, is used to characterize the overall ventilation status. The mode-age, representing the most probable transit time and serving as a proxy for advective timescales, is applied to trace the dominant transport pathways and to estimate process rates like the oxygen utilization rate (OUR).
In general, the water mass age increases with the depth and distance from the formation area, so the central waters in the upper layer obtain the lowest ages of within ∼ 100 years. In the intermediate layer, the AAIW and MW are two conspicuous water masses and both take ∼ 300 years to spread from south to north (AAIW) and east to west (MW) respectively. As the dominant water mass in the deep and overflow layer, the NADW takes ∼ 500 years to spread along the DWBC in the west Atlantic Ocean, and takes ∼ 900 years eastward to cover the east part. The bottom waters origin from south of Antarctic Circumpolar Current region take ∼ 600 years to spread northward and cover the bottom layer. Similar as the NADW, the mean-age of both AABW and NEABW show spatial difference between the west (low mean-age) and the east (high mean-age). This is because the west Atlantic Ocean is well ventilated by the DWBC while the water exchange is sluggish in the east.
The transient tracers (CFC-12, SF6 and 39Ar), serve as effective tools for identifying and quantifying oceanographic ventilation, each tracer possessing distinct advantages and limitations in determining and tracing the depths and mean ages of water masses. CFC-12 and SF6 exhibit optimal applicability for water masses range within 2000 dbar pressure (or mean-ages 500 years). However, their utility becomes constrained in deeper aqueous regimes (below 2000 dbar or mean-age 500 years) due to inherent limitations in tracer concentration sensitivity, which may induce systematic overestimations of water mass ages when applied to deep or bottom layers. The chemically inert radioisotope 39Ar, characterized by a 269-year half-life, effectively addresses this observational gap through its unique temporal resolution. Consequently, the synergistic application of SF6, CFCs, and 39Ar in multi-tracer frameworks overcomes temporal constraints inherent to single-tracer approaches, enabling comprehensive investigation of coupled biogeochemical-climate interactions. This integrated methodology facilitates novel insights into climate-driven water mass reorganization, carbon cycle dynamics, and other critical marine processes essential for understanding oceanic responses to global change.
The ventilations and respiration rates (oxidation rates, OUR) of wide-spread water masses are estimated by the mode-ages. The currents and topography have significant impacts on the mode-ages and furthermore the apparent oxygen utilization rate (OUR). The western basins of the Atlantic Ocean are better ventilated with lower the mode-ages, while the OURs show the opposite distribution, suggesting that the mode-age is a more important determinant of OUR than AOU, and that higher respiration rates exist in better-ventilated regions.
The quantitative age framework and ventilation rates established in this study provide a crucial baseline dataset. This baseline is essential for detecting future changes in ocean circulation and biogeochemical cycles, and will serve to validate the next generation of climate and ocean models.
This study provides a quantitative, basin-scale assessment of Atlantic water mass ages using a multi-tracer approach. However, several methodological assumptions should be considered when interpreting the results. First, the calculated ages rely on the assumption of a steady-state circulation and an Inverse Gaussian Transit Time Distribution (IG-TTD) with a fixed mixing ratio (). While this is a necessary and common simplification for basin-scale analysis, regional deviations from this idealized transport are likely. Consequently, the mean-age and mode-age presented in this study are linearly related (τmode≈0.162Γ) and do not provide independent statistical information; they are shown together solely for conceptual comparison of their different physical interpretations (integrative vs. advective timescales). Second, the complementary use of tracers (CFC-12, SF6, 39Ar) mitigates but does not fully eliminate the inherent uncertainties associated with each method, particularly in deep layers where tracer concentrations are very low. Third, the apparent oxygen utilization rates (OUR) derived here represent integrated rates along flow paths and are subject to the same age estimation uncertainties. Moreover, the choice of using mode-age for OUR calculations is a working assumption; the true local OUR remains difficult to constrain. Fourth, the 39Ar data used for comparison originate from the 1980s–1990s (Rodriguez, 1993), whereas the CFC-12/SF6 data are from later cruises (predominantly 2000s–2010s). The comparison thus implicitly assumes a steady-state circulation and ventilation, which is a simplification given observed multidecadal changes in the Atlantic Ocean (e.g., Talley et al., 2016). This temporal mismatch introduces additional uncertainty into the age comparisons, particularly for older water masses where ventilation may have varied over the intervening decades (e.g. Guo et al. 2026).
Notwithstanding these limitations, the comprehensive age and ventilation maps presented here establish a baseline of the contemporary Atlantic Ocean ventilation structure. This dataset can serve to validate and constrain the next generation of ocean circulation and biogeochemical models. Furthermore, by quantifying current ventilation timescales and their spatial patterns, this work provides a reference frame against which future observational studies can detect changes in ocean circulation and ventilation in response to climatic forcing.
The GLODAPv2 data used in this study are available at the NOAA National Centers for Environmental Information (NCEI) via https://www.ncei.noaa.gov/access/ocean-carbon-data-system/oceans/GLODAPv2/ (last access: 7 August 2026, Lauvset et al., 2024; Olsen et al., 2016). The bottle data from the WOCE/GO-SHIP cruises A16N (33RO20130803), A16S (33RO20131223), A05 (74DI20100106), and A10 (33RO20110926) are available from the CCHDO (https://cchdo.ucsd.edu/, last access: 7 August 2026) (https://cchdo.ucsd.edu/cruise/33RO20130803, Bullister and Baringer, 2013; https://cchdo.ucsd.edu/cruise/33RO20131223, Wanninkhof, 2013; https://cchdo.ucsd.edu/cruise/74DI20100106, King, 2010; https://cchdo.ucsd.edu/cruise/33RO20110926, Baringer, 2013). The 39Ar data are compiled from the doctoral thesis of Rodriguez (1993). The water mass fraction estimates and water mass age data generated in this study are available from the corresponding author upon reasonable request.
The supplement related to this article is available online at https://doi.org/10.5194/os-22-2595-2026-supplement.
ML designed the research study and conducted the analysis. ML and TT interpreted the results and wrote the paper.
The contact author has declared that neither of the authors has any competing interests.
Publisher's note: Copernicus Publications remains neutral with regard to jurisdictional claims made in the text, published maps, institutional affiliations, or any other geographical representation in this paper. The authors bear the ultimate responsibility for providing appropriate place names. Views expressed in the text are those of the authors and do not necessarily reflect the views of the publisher.
This work is based on the comprehensive and detailed data from the GLODAP data product throughout the past few decades. In particular, we are grateful to the efforts from all the scientists and crews on cruises, who generated funding and dedicated time on committing the collection of data. We also would like to thank the working groups of GLODAP for their support and information of the collation, quality control and publishing of data. Their contributions and selfless sharing are prerequisites for the completion of this work. Thank all the colleagues from the School of Environmental Science and Engineering, Xiamen University of Technology for their support in my research work. In addition, we are grateful to Tim Stöven for his support and advices in running calculating programs of water mass ages. This work benefited from the Chinesisch-Deutsch Mobilitätsprogramm: Perspectives of the Multi-Tracer Application in Marginal Seas and Challenges (M-308). Thanks also goes to Minggang Cai and his research group at the College of Ocean and Earth Sciences, Xiamen University for the help and support during Mian Liu's postdoctoral work.
The authors gratefully thank the Fujian Province Natural Science Foundation General Project (grant no. 2026J0011512); the Research Projects for Overseas Scholars in Xiamen City (grant no. 0108/50103250009); the Research Start-up Project for the Introduction (Cultivation) of High-level Talents of Xiamen University of Technology (grant no. YKJ23021R); the National Natural Science Foundation of China (grant no. 22106128); and the Xiamen University of Technology National Natural Science Foundation of China Training Programme for Excellence (grant no. XPYM2409). Mian Liu received support from the China Scholarship Council (CSC) to support the PhD study at GEOMAR Helmholtz Centre for Ocean Research Kiel, Germany.
This paper was edited by Benjamin Rabe and reviewed by three anonymous referees.
Armour, K. C., Marshall, J., Scott, J. R., Donohoe, A., and Newsom, E. R.: Southern Ocean warming delayed by circumpolar upwelling and equatorward transport, Nat. Geosci., 9, 549–554, https://doi.org/10.1038/ngeo2731, 2016.
Baringer, M.: Bottle data from cruise 33RO20110926 (A10), National Centers for Environmental Information (NCEI), https://cchdo.ucsd.edu/cruise/33RO20110926 (last access: 7 August 2026), 2013.
Bender, M. L.: The δ18O of dissolved O2 in seawater: A unique tracer of circulation and respiration in the deep sea, J. Geophys. Res.-Oceans, 95, 22243–22252, https://doi.org/10.1029/JC095iC12p22243, 1990.
Bjerknes, J.: Atlantic Air-Sea Interaction, in: Advances in Geophysics, edited by: Landsberg, H. E. and Van Mieghem, J., Elsevier, 1–82, https://doi.org/10.1016/S0065-2687(08)60005-9, 1964.
Broecker, W. S. and Peng, T.-H.: Comparison of 39Ar and 14C ages for waters in the deep ocean, Nucl. Instrum. Methods Phys. Res. B, 172, 473–478, https://doi.org/10.1016/S0168-583X(00)00339-6, 2000.
Bryden, H. L., Longworth, H. R., and Cunningham, S. A.: Slowing of the Atlantic meridional overturning circulation at 25 degrees N, Nature, 438, 655–657, https://doi.org/10.1038/nature04385, 2005.
Bullister, J. and Baringer, M.: Bottle data from cruise 33RO20130803 (A16N), CCHDO [data set], https://cchdo.ucsd.edu/cruise/33RO20130803 (last access: 7 August 2026), 2013.
Bullister, J. L. and Weiss, R. F.: Anthropogenic Chlorofluoromethanes in the Greenland and Norwegian Seas, Science, 221, 265–268, https://doi.org/10.1126/science.221.4607.265, 1983.
Bullister, J. L., Wisegarver, D. P., and Menzia, F. A.: The solubility of sulfur hexafluoride in water and seawater, Deep-Sea Res. Pt. I, 49, 175–187, https://doi.org/10.1016/s0967-0637(01)00051-6, 2002.
Bullister, J. L., Wisegarver, D. P., and Sonnerup, R. E.: Sulfur hexafluoride as a transient tracer in the North Pacific Ocean, Geophys. Res. Lett., 33, L18603, https://doi.org/10.1029/2006GL026514, 2006.
Carracedo, L. I., Pardo, P. C., Flecha, S., and Pérez, F. F.: Mediterranean water spreading in the North Atlantic, J. Geophys. Res., 121, 3425–3445, https://doi.org/10.1002/2015JC011324, 2016.
Chen, C. Y., Li, Y. M., Bailey, K., O'Connor, T. P., Young, L., and Lu, Z. T.: Ultrasensitive isotope trace analyses with a magneto-optical trap, Science, 286, 1139–1141, https://doi.org/10.1126/science.286.5442.1139, 1999.
Clark, P. U., Shakun, J. D., Baker, P. A., Bartlein, P. J., Brewer, S., Brook, E., Carlson, A. E., Cheng, H., Kaufman, D. S., and Liu, Z.: Global climate evolution during the last deglaciation, P. Natl. Acad. Sci. USA, 109, E1134–E1142, https://doi.org/10.1073/pnas.1116619109, 2012.
Dickson, R. R. and Brown, J.: The production of North Atlantic Deep Water: Sources, rates, and pathways, J. Geophys. Res.-Oceans, 99, 12319–12341, https://doi.org/10.1029/94jc00530, 1994.
Doney, S. C. and Bullister, J. L.: A chlorofluorocarbon section in the eastern North Atlantic, Deep-Sea Res, 39, 1857–1883, https://doi.org/10.1016/0198-0149(92)90003-c, 1992.
Ebser, S., Kersting, A., Stöven, T., and Tanhua, T.: 39Ar dating with small samples provides new key constraints on ocean ventilation, Nat. Commun., 9, 5046, https://doi.org/10.1038/s41467-018-07465-7, 2018.
Fine, R. A.: Observations of CFCs and SF6 as Ocean Tracers, Annu. Rev. Mar. Sci, 3, 173–195, https://doi.org/10.1146/annurev.marine.010908.163933, 2011.
Gammon, R. H., Cline, J., and Wisegarver, D.: Chlorofluoromethanes in the northeast Pacific Ocean: Measured vertical distributions and application as transient tracers of upper ocean mixing, J. Geophys. Res.-Oceans, 87, 9441–9454, https://doi.org/10.1029/JC087iC12p09441, 1982.
Gordon, A. L. and Huber, B. A.: Southern Ocean winter mixed layer, J. Geophys. Res., 95, 11655–11672, https://doi.org/10.1029/JC095iC07p11655, 1990.
Guo, H., Koeve, W., Kriest, I., Frenger, I., Tanhua, T., Brandt, P., He, Y., Xue, T., and Oschlies, A.: North Atlantic ventilation change over the past three decades is potentially driven by climate change, Nat. Commun., 17, 200, https://doi.org/10.1038/s41467-025-67923-x, 2026.
Hall, M. M. and Bryden, H. L.: Direct Estimates and Mechanisms of Ocean Heat-Transport, Deep-Sea Res., 29, 339–359, https://doi.org/10.1016/0198-0149(82)90099-1, 1982.
Hall, T. M. and Plumb, R. A.: Age as a diagnostic of stratospheric transport, J. Geophys. Res.-Atmos., 99, 1059–1070, https://doi.org/10.1029/93jd03192, 1994.
Holzer, M. and Primeau, F. W.: Improved constraints on transit time distributions from argon-39: A maximum entropy approach, J. Geophys. Res., 115, C12024, https://doi.org/10.1029/2010JC006200, 2010.
Huhn, O., Rhein, M., Hoppema, M., and van Heuven, S.: Decline of deep and bottom water ventilation and slowing down of anthropogenic carbon storage in the Weddell Sea, 1984–2011, Deep-Sea Res. Pt. I, 76, 66–84, https://doi.org/10.1016/j.dsr.2013.01.005, 2013.
Ito, T., Nenes, A., Johnson, M. S., Meskhidze, N., and Deutsch, C.: Acceleration of oxygen decline in the tropical Pacific over the past decades by aerosol pollutants, Nat. Geosci., 9, 443–447, https://doi.org/10.1038/ngeo2717, 2016.
Jenkins, W. J.: Oxygen utilization rates in North Atlantic subtropical gyre and primary production in oligotrophic systems, Nature, 300, 246–248, https://doi.org/10.1038/300246a0, 1982.
Jenkins, W. J.: 3H and 3He in the Beta Triangle: Observations of Gyre Ventilation and Oxygen Utilization Rates, J. Phys. Oceanogr., 17, 763–783, https://doi.org/10.1175/1520-0485(1987)017<0763:Aitbto>2.0.Co;2, 1987.
Jia, Z.-H., Zhang, P., Li, L.-B., Chen, Q.-W., Liu, J.-L., Liu, Y.-G., Wu, Q., Yang, Y., Sun, L.-T., Yang, G.-M., Jiang, W., and Lu, Z.-T.: Stability and reliability study of a 39Ar enrichment system for accurate 39Ar dating, Nucl. Instrum. Methods Phys. Res. A, 1075, 170438, https://doi.org/10.1016/j.nima.2025.170438, 2025.
Jiang, W., Bailey, K., Lu, Z.-T., Mueller, P., O'Connor, T. P., Cheng, C.-F., Hu, S.-M., Purtschert, R., Sturchio, N. C., Sun, Y. R., Williams, W. D., and Yang, G.-M.: An atom counter for measuring 81Kr and 85Kr in environmental samples, Geochim. Cosmochim. Ac., 91, 1–6, https://doi.org/10.1016/j.gca.2012.05.019, 2012.
Karstensen, J. and Tomczak, M.: Ventilation processes and water mass ages in the thermocline of the southeast Indian Ocean, Geophys. Res. Lett., 24, 2777–2780, https://doi.org/10.1029/97gl02708, 1997.
Karstensen, J. and Tomczak, M.: Age determination of mixed water masses using CFC and oxygen data, J. Geophys. Res.-Oceans, 103, 18599–18609, https://doi.org/10.1029/98jc00889, 1998.
Karstensen, J., Stramma, L., and Visbeck, M.: Oxygen minimum zones in the eastern tropical Atlantic and Pacific oceans, Prog. Oceanogr., 77, 331–350, https://doi.org/10.1016/j.pocean.2007.05.009, 2008.
King, B.: Bottle data from cruise 74DI20100106 (A05), CCHDO [data set], https://cchdo.ucsd.edu/cruise/74DI20100106 (last access: 7 August 2026), 2010.
Kirchner, K., Rhein, M., Huttl-Kabus, S., and Böning, C. W.: On the spreading of South Atlantic Water into the Northern Hemisphere, J. Geophys. Res.-Oceans, 114, https://doi.org/10.1029/2008jc005165, 2009.
Koeve, W. and Kähler, P.: Oxygen utilization rate (OUR) underestimates ocean respiration: A model study, Global Biogeochem. Cy., 30, 1166–1182, https://doi.org/10.1002/2015gb005354, 2016.
Kuhlbrodt, T., Griesel, A., Montoya, M., Levermann, A., Hofmann, M., and Rahmstorf, S.: On the driving processes of the Atlantic meridional overturning circulation, Rev. Geophys., 45, https://doi.org/10.1029/2004rg000166, 2007.
Lauvset, S. K., Key, R. M., Olsen, A., van Heuven, S., Velo, A., Lin, X., Schirnick, C., Kozyr, A., Tanhua, T., Hoppema, M., Jutterström, S., Steinfeldt, R., Jeansson, E., Ishii, M., Perez, F. F., Suzuki, T., and Watelet, S.: A new global interior ocean mapped climatology: the 1° × 1° GLODAP version 2, Earth Syst. Sci. Data, 8, 325–340, https://doi.org/10.5194/essd-8-325-2016, 2016.
Lauvset, S. K., Lange, N., Tanhua, T., Bittig, H. C., Olsen, A., Kozyr, A., Álvarez, M., Azetsu-Scott, K., Brown, P. J., Carter, B. R., Cotrim da Cunha, L., Hoppema, M., Humphreys, M. P., Ishii, M., Jeansson, E., Murata, A., Müller, J. D., Pérez, F. F., Schirnick, C., Steinfeldt, R., Suzuki, T., Ulfsbo, A., Velo, A., Woosley, R. J., and Key, R. M.: The annual update GLODAPv2.2023: the global interior ocean biogeochemical data product, Earth Syst. Sci. Data, 16, 2047–2072, https://doi.org/10.5194/essd-16-2047-2024, 2024.
Li, Q., England, M. H., Hogg, A. M., Rintoul, S. R., and Morrison, A. K.: Abyssal ocean overturning slowdown and warming driven by Antarctic meltwater, Nature, 615, 841–847, 2023.
Liu, M. and Tanhua, T.: Water masses in the Atlantic Ocean: characteristics and distributions, Ocean Sci., 17, 463–486, https://doi.org/10.5194/os-17-463-2021, 2021.
Loosli, H. H.: A dating method with 39Ar, Earth Planet. Sc. Lett., 63, 51–62, https://doi.org/10.1016/0012-821X(83)90021-3, 1983.
Lu, Z. T., Schlosser, P., Smethie, W. M., Sturchio, N. C., Yokochi, R., and Purtschert, R.: Tracer applications of noble gas radionuclides in the geosciences, Annu. Rev. Earth Pl. Sci., 42, 371–407, https://doi.org/10.1146/annurev-earth-050212-123944, 2014.
Maiss, M., Steele, L. P., Francey, R. J., Fraser, P. J., Langenfelds, R. L., Trivett, N. B. A., and Levin, I.: Sulfur hexafluoride – A powerful new atmospheric tracer, Atmos. Environ., 30, 1621–1629, https://doi.org/10.1016/1352-2310(95)00425-4, 1996.
Mantyla, A. W. and Reid, J. L.: Abyssal characteristics of the World Ocean waters, Deep-Sea Res., 30, 805–833, https://doi.org/10.1016/0198-0149(83)90002-7, 1983.
Morrison, A. K., Frolicher, T. L., and Sarmiento, J. L.: Upwelling in the Southern Ocean, Phys. Today, 68, 27–32, https://doi.org/10.1063/pt.3.2654, 2015.
Olsen, A., Key, R. M., van Heuven, S., Lauvset, S. K., Velo, A., Lin, X., Schirnick, C., Kozyr, A., Tanhua, T., Hoppema, M., Jutterström, S., Steinfeldt, R., Jeansson, E., Ishii, M., Pérez, F. F., and Suzuki, T.: The Global Ocean Data Analysis Project version 2 (GLODAPv2) – an internally consistent data product for the world ocean, Earth Syst. Sci. Data, 8, 297–323, https://doi.org/10.5194/essd-8-297-2016, 2016.
Orsi, A. H., Johnson, G. C., and Bullister, J. L.: Circulation, mixing, and production of Antarctic Bottom Water, Prog. Oceanogr., 43, 55–109, https://doi.org/10.1016/s0079-6611(99)00004-X, 1999.
Patara, L., Böning, C. W., and Tanhua, T.: Multidecadal Changes in Southern Ocean Ventilation since the 1960s Driven by Wind and Buoyancy Forcing, J. Climate, 34, 1485–1502, https://doi.org/10.1175/Jcli-D-19-0947.1, 2021.
Price, J. F., Baringer, M. O., Lueck, R. G., Johnson, G. C., Ambar, I., Parrilla, G., Cantos, A., Kennelly, M. A., and Sanford, T. B.: Mediterranean outflow mixing and dynamics, Science, 259, 1277–1282, https://doi.org/10.1126/science.259.5099.1277, 1993.
Purkey, S. G. and Johnson, G. C.: Warming of Global Abyssal and Deep Southern Ocean Waters between the 1990s and 2000s: Contributions to Global Heat and Sea Level Rise Budgets, J. Climate, 23, 6336–6351, https://doi.org/10.1175/2010jcli3682.1, 2010.
Pytkowicz, R. M.: On the apparent oxygen utilization and the preformed phosphate in the oceans1, Limnol. Oceanogr., 16, 39-42, https://doi.org/10.4319/lo.1971.16.1.0039, 1971.
Rahmstorf, S.: The Great Ocean Conveyor: Discovering the Trigger for Abrupt Climate Change, Nature, 464, 681–681, https://doi.org/10.1038/464681a, 2010.
Redfield, A. C.: The processes determining the concentration of oxygen, phosphate and other organic derivatives within the depths of the Atlantic Ocean, Pap. Phys. Oceanogr. Meteorol. Mass. Inst. Technol. Woods Hole Oceanogr. Inst., 9, 1–22, https://doi.org/10.1575/1912/1053, 1942.
Redfield, A. C., Ketchum, B. H., and Richards, F. A.: The influence of organisms on the composition of seawater, in: The Sea, Ideas and Observations on Progress in the Study of the Seas, edited by: Hill, M. N., John Wiley, New York, 26–77, ISBN 9780674017283, 1963.
Rodriguez, J.: Beiträge zur Verteilung von 39Ar im Atlantik, Ph.D. thesis, Inauguraldissertation der Philosophisch-naturwissenschaftlichen Fakultät der Universität Bern zur Erlangung der Doktorwurde, Bern, Switzerland, 1993.
Sandström, J. W.: Dynamishce versuche mit merrwasser, Annalen der Hydrographie und Maritimen Meteorologie, 36, 6–23, 1908.
Sandström, J. W.: Meteorologische studien im Schwedischen Hochgebirge, Göteborgs Kungl. Vetenskaps- och Vitterhetssamhälles Handlingar, 17, 1–48, 1916.
Schlitzer, R., Roether, W., and Weidmann, U.: A meridional 14C and 39Ar section in the northeast Atlantic deep water, J. Geophys. Res., 90, 6945–6952, https://doi.org/10.1029/JC090iC04p06945, 1985.
Schlosser, P., Kromer, B., Weppernig, R., Loosli, H. H., Bayer, R., Bonani, G., and Suter, M.: The distribution of 14C and 39Ar in the Weddell Sea, J. Geophys. Res., 99, 10275–10287, https://doi.org/10.1029/94JC00313, 1994.
Schmidtko, S., Stramma, L., and Visbeck, M.: Decline in global oceanic oxygen content during the past five decades, Nature, 542, 335–339, https://doi.org/10.1038/nature21399, 2017.
Skinner, L. C., Primeau, F., Freeman, E., de la Fuente, M., Goodwin, P. A., Gottschalk, J., Huang, E., McCave, I. N., Noble, T. L., and Scrivner, A. E.: Radiocarbon constraints on the glacial ocean circulation and its impact on atmospheric CO2, Nat. Commun., 8, https://doi.org/10.1038/ncomms16010, 2017.
Sonnerup, R. E., Quay, P. D., and Bullister, J. L.: Thermocline ventilation and oxygen utilization rates in the subtropical North Pacific based on CFC-11 and CFC-12 measurements from 1991 to 2000, J. Geophys. Res., 106, 9259–9287, https://doi.org/10.1029/1999JC000086, 2001.
Sonnerup, R. E., Mecking, S., and Bullister, J. L.: Transit time distributions and oxygen utilization rates in the Northeast Pacific Ocean from chlorofluorocarbons and sulfur hexafluoride, Deep-Sea Res. Pt. I, 72, 61–71, https://doi.org/10.1016/j.dsr.2012.10.013, 2013.
Sonnerup, R. E., Mecking, S., Bullister, J. L., and Warner, M. J.: Transit time distributions and oxygen utilization rates from chlorofluorocarbons and sulfur hexafluoride in the Southeast Pacific Ocean, J. Geophys. Res.-Oceans, 120, 3761–3776, https://doi.org/10.1002/2015jc010781, 2015.
Stanley, R. H. R., Doney, S. C., Jenkins, W. J., and Lott, III, D. E.: Apparent oxygen utilization rates calculated from tritium and helium-3 profiles at the Bermuda Atlantic Time-series Study site, Biogeosciences, 9, 1969–1983, https://doi.org/10.5194/bg-9-1969-2012, 2012.
Stöven, T. and Tanhua, T.: Ventilation of the Mediterranean Sea constrained by multiple transient tracer measurements, Ocean Sci., 10, 439–457, https://doi.org/10.5194/os-10-439-2014, 2014.
Sverdrup, H. U.: The unity of the sciences of the sea, Sigma Xi Quarterly, 28, 105–115, https://www.jstor.org/stable/23049117 (last access: 7 August 2026), 1940.
Talley, L.: Antarctic Intermediate Water in the South Atlantic, in: The South Atlantic: Present and Past Circulation, edited by: Wefer, G., Berger, W. H., Siedler, G., and Webb, D. J., Springer Berlin Heidelberg, Berlin, Heidelberg, 219–238, https://doi.org/10.1007/978-3-642-80353-6_11, 1996.
Talley, L.: Closure of the Global Overturning Circulation Through the Indian, Pacific, and Southern Oceans: Schematics and Transports, Oceanography, 26, 80–97, https://doi.org/10.5670/oceanog.2013.07, 2013.
Talley, L., Feely, R., Sloyan, B., Wanninkhof, R., Baringer, M., Bullister, J., Carlson, C., Doney, S., Fine, R., Firing, E., Gruber, N., Hansell, D. A., Ishii, M., Johnson, G. C., Katsumata, K., Key, R. M., Kramp, M., Langdon, C., Macdonald, A. M., Mathis, J. T., McDonagh, E. L., Mecking, S., Millero, F. J., Mordy, C. W., Nakano, T., Sabine, C. L., Smethie, W. M., Swift, J. H., Tanhua, T., Thurnherr, A. M., Warner, M. J., and Zhang, J.-Z.: Changes in ocean heat, carbon content, and ventilation: A review of the first decade of GO-SHIP global repeat hydrography, Annu. Rev. Mar. Sci., 8, 185–215, https://doi.org/10.1146/annurev-marine-052915-100829, 2016.
Tamsitt, V., Drake, H. F., Morrison, A. K., Talley, L. D., Dufour, C. O., Gray, A. R., Griffies, S. M., Mazloff, M. R., Sarmiento, J. L., Wang, J., and Weijer, W.: Spiraling pathways of global deep waters to the surface of the Southern Ocean, Nat. Commun., 8, 172, https://doi.org/10.1038/s41467-017-00197-0, 2017.
Tanhua, T., Olsson, A., and Jeansson, E.: Tracer studies of the Arctic Ocean and the Greenland Sea, J. Geophys. Res., 109, C06009, https://doi.org/10.1029/2003JC001920, 2004.
Tanhua, T., Bulsiewicz, K., and Rhein, M.: Spreading of overflow water from the Greenland to the Labrador Sea, Geophys. Res. Lett., 32, L10605, https://doi.org/10.1029/2005GL022700, 2005.
Tanhua, T., Biastoch, A., Kortzinger, A., Luger, H., Boning, C., and Wallace, D. W. R.: Changes of anthropogenic CO2 and CFCs in the North Atlantic between 1981 and 2004, Global Biogeochem. Cy., 20, https://doi.org/10.1029/2006gb002695, 2006.
Tanhua, T., Waugh, D. W., and Wallace, D. W. R.: Use of SF6 to estimate anthropogenic CO2 in the upper ocean, J. Geophys. Res.-Oceans, 113, https://doi.org/10.1029/2007jc004416, 2008.
Tanhua, T., Waugh, D. W., and Bullister, J. L.: Estimating changes in ocean ventilation from early 1990s CFC-12 and late 2000s SF6 measurements, Geophys. Res. Lett., 40, 927–932, https://doi.org/10.1002/grl.50251, 2013.
Tanhua, T. and Liu, M.: Upwelling velocity and ventilation in the Mauritanian upwelling system estimated by CFC-12 and SF6 observations, J. Marine Syst., 151, 57–70, https://doi.org/10.1016/j.jmarsys.2015.07.002, 2015.
Thiele, G. and Sarmiento, J. L.: Tracer Dating and Ocean Ventilation, J. Geophys. Res.-Oceans, 95, 9377–9391, https://doi.org/10.1029/JC095iC06p09377, 1990.
Thomas, J. L., Waugh, D. W., and Gnanadesikan, A.: Relationship between Age and Oxygen along Line W in the Northwest Atlantic Ocean, Ocean Sci. J., 55, 203–217, https://doi.org/10.1007/s12601-020-0019-5, 2020.
Tomczak, M.: Some historical, theoretical and applied aspects of quantitative water mass analysis, J. Mar. Res., 57, 275–303, https://doi.org/10.1357/002224099321618227, 1999.
Tseitlin, V.: Depth dependence of oxygen utilization rate, Okeanologiya, 32, 264–269, 1992.
van Heuven, S., Hoppema, M., Huhn, O., Slagter, H. A., and de Baar, H. J. W.: Direct observation of increasing CO2 in the Weddell Gyre along the Prime Meridian during 1973–2008, Deep-Sea Res. Pt. II, 58, 2613–2635, https://doi.org/10.1016/j.dsr2.2011.08.007, 2011.
Vollmer, M. K. and Weiss, R. F.: Simultaneous determination of sulfur hexafluoride and three chlorofluorocarbons in water and air, Mar. Chem., 78, 137–148, https://doi.org/10.1016/S0304-4203(02)00013-2, 2002.
Wang, W. M., Cai, M. G., Huang, P., Ke, H. W., Liu, M., Liu, L. H., Deng, H. X., Luo, B. J., Wang, C. H., Zheng, X. H., and Li, W. Q.: Transit Time Distributions and Apparent Oxygen Utilization Rates in Northern South China Sea Using Chlorofluorocarbons and Sulfur Hexafluoride Data, J. Geophys. Res.-Oceans, 126, https://doi.org/10.1029/2021jc017535, 2021.
Wanninkhof, R.: Bottle data from cruise 33RO20131223 (A16S), CCHDO [data set], https://cchdo.ucsd.edu/cruise/33RO20131223 (last access: 7 August 2026), 2013.
Warner, M. J. and Weiss, R. F.: Solubility of Chlorofluorocarbon-11 and Chlorofluorocarbon-12 in water and seawater, Deep-Sea Res, 32, 1485–1497, https://doi.org/10.1016/0198-0149(85)90099-8, 1985.
Waugh, D. W., Hall, T. M., and Haine, T. W. N.: Relationships among tracer ages, J. Geophys. Res.-Oceans, 108, https://doi.org/10.1029/2002jc001325, 2003.
Waugh, D. W., Haine, T. W. N., and Hall, T. M.: Transport times and anthropogenic carbon in the subpolar North Atlantic Ocean, Deep-Sea Res. Pt. I, 51, 1475–1491, https://doi.org/10.1016/s0967-0637(04)00145-1, 2004.
Wüst, G.: Das Bodenwasser und die Gliederung der Atlantischen Tiefsee, Wiss. Ergebn. Dtsch. Atl. Exp. “Meteor”, 6, 1–106, 1933.
Ziska, F., Quack, B., Abrahamsson, K., Archer, S. D., Atlas, E., Bell, T., Butler, J. H., Carpenter, L. J., Jones, C. E., Harris, N. R. P., Hepach, H., Heumann, K. G., Hughes, C., Kuss, J., Krüger, K., Liss, P., Moore, R. M., Orlikowska, A., Raimund, S., Reeves, C. E., Reifenhäuser, W., Robinson, A. D., Schall, C., Tanhua, T., Tegtmeier, S., Turner, S., Wang, L., Wallace, D., Williams, J., Yamamoto, H., Yvon-Lewis, S., and Yokouchi, Y.: Global sea-to-air flux climatology for bromoform, dibromomethane and methyl iodide, Atmos. Chem. Phys., 13, 8915–8934, https://doi.org/10.5194/acp-13-8915-2013, 2013.
- Abstract
- Introduction
- Data and methods
- Results: Ages of water masses in the Atlantic Ocean
- The application of water mass ages in estimating the oxygen utilization rate (OUR)
- Estimation of water mass ages based on 39Ar
- Conclusions and discussion
- Data availability
- Author contributions
- Competing interests
- Disclaimer
- Acknowledgements
- Financial support
- Review statement
- References
- Supplement
- Abstract
- Introduction
- Data and methods
- Results: Ages of water masses in the Atlantic Ocean
- The application of water mass ages in estimating the oxygen utilization rate (OUR)
- Estimation of water mass ages based on 39Ar
- Conclusions and discussion
- Data availability
- Author contributions
- Competing interests
- Disclaimer
- Acknowledgements
- Financial support
- Review statement
- References
- Supplement