
the Creative Commons Attribution 4.0 License.
the Creative Commons Attribution 4.0 License.
 | 12 Aug 2026
Water mass modification of the warm Atlantic Inflow towards the Arctic across the Iceland-Faroe Ridge
Guðrið Eriksdóttir
Bogi Hansen
Karin Margretha H. Larsen
Steffen M. Olsen
Andrea M. U. Gierisch
Sólveig Rósa Ólafsdóttir
The warm Atlantic inflow across the Iceland-Faroe Ridge (IFR) is the strongest of the three branches carrying warm water to the Nordic Seas and further into the Arctic Ocean. This branch (IF-inflow) carries almost 50 % of the total Atlantic water inflow. After crossing the ridge, a large part of this water is converted to dense water that returns to the Atlantic as cold overflow, which contributes to the deep limb of the Atlantic Meridional Overturning Circulation (AMOC). A better understanding of the temperature and salinity variations of the IF-inflow is therefore important for assessing both regional and global climate. Based on satellite altimetry and drifter observations, we document the pathway of the Atlantic water through the Iceland Basin to the IFR and show how this pathway is affected by variable intrusion of the Subpolar Gyre into the basin with a narrower, faster and southward-shifted pathway during periods of strong Subpolar Gyre intrusion. The variable intrusion is furthermore shown to be the main cause of the long-term salinity variations upstream as well as downstream of the IFR while the temperature has increased due to the general warming of the oceans in addition to the variations caused by variable intrusion. As the Atlantic water crosses the IFR, it is cooled by at least 1 °C and freshened by at least 0.1 g kg−1. We show that this transformation mainly is caused by mixing with Arctic water masses, rather than by air-sea-interactions, and that most of the modification takes place upstream of the ridge crest. The Atlantic water changes character from an almost barotropic to a much more baroclinic flow over the ridge enabling water masses, otherwise constrained to follow isobaths, to cross the ridge. We find that the cooling and freshening of the Atlantic water across the IFR are relatively constant throughout the whole period from 1993 to 2023, except for the last few years. The freshening across the ridge implies that the salinity difference between IF-inflow water and the deep waters northeast of the ridge has been reduced by roughly 20 %–30 % after crossing the ridge, which weakens the potential for dense-water formation downstream. Updated transport estimates show a slight strengthening for this AMOC branch. From 1993 to 2023, the volume transport of the IF-inflow increased by 12±7 %, while the heat transport relative to 0 °C increased by 16±8 %.
- Article
(14417 KB) - Full-text XML
-
Supplement
(2476 KB) - BibTeX
- EndNote


The exchange of water between the North Atlantic and the Arctic Mediterranean (Nordic Seas and Arctic Ocean with shelves) plays a central role in both the global and the regional climate. Through a complex system of currents, warm, saline water of Atlantic origin flows into the Nordic Seas from the North Atlantic. During its further journey through the Arctic Mediterranean, most of the Atlantic water is transformed into a denser water mass that can sink due to buoyancy loss (Østerhus et al., 2019). The subsurface Greenland-Scotland Ridge, extending from Greenland to Scotland via Iceland and the Faroe Islands (Faroes), acts as a barrier between the deep waters on either side. This cold, dense water fills up the basins north of the ridge and sets up pressure gradients across it. The deep water flows over the ridge at its deepest parts towards the Equator. This is the overflow. Conservation of mass dictates that water must then flow poleward in the upper layer. This is the Atlantic inflow. South of the Greenland-Scotland Ridge, the overflow water sinks to deeper levels as it entrains ambient waters (e.g., Dickson and Brown, 1994; Geyer et al., 2006; Ullgren et al., 2016).
This exchange of warm, saline water in the upper layer towards the Nordic Seas and cold, dense but less saline water at depth towards the Atlantic Ocean is the northernmost component of the Atlantic Meridional Overturning Circulation (AMOC), which transports heat poleward. Furthermore, the dense water that sinks transports excess heat and carbon from the surface to the deep ocean (Buckley and Marshall, 2016). According to the IPCC's 6th Assessment Report, the AMOC is very likely to decline over the 21st century (Arias et al., 2021), making it critical to understand the processes that regulate it.
Three main branches carry warm water to the Nordic Seas: the Denmark Strait inflow, the Faroe-Scotland inflow, and the inflow across the Iceland-Faroe Ridge (IFR). Østerhus et al. (2019) estimate the total Atlantic inflow across the Greenland-Scotland Ridge to be approximately 8 Sv. The strongest of these branches by volume, carrying 3.8±0.5 Sv or 48 % of the total flow, is the branch across the IFR (Hansen et al., 2015, 2023). This is the IF-inflow, which is the focus of this study. Figure 1 shows the study region where the warm Atlantic water meets the cold Arctic water just north of the IFR in the Iceland-Faroe Front.
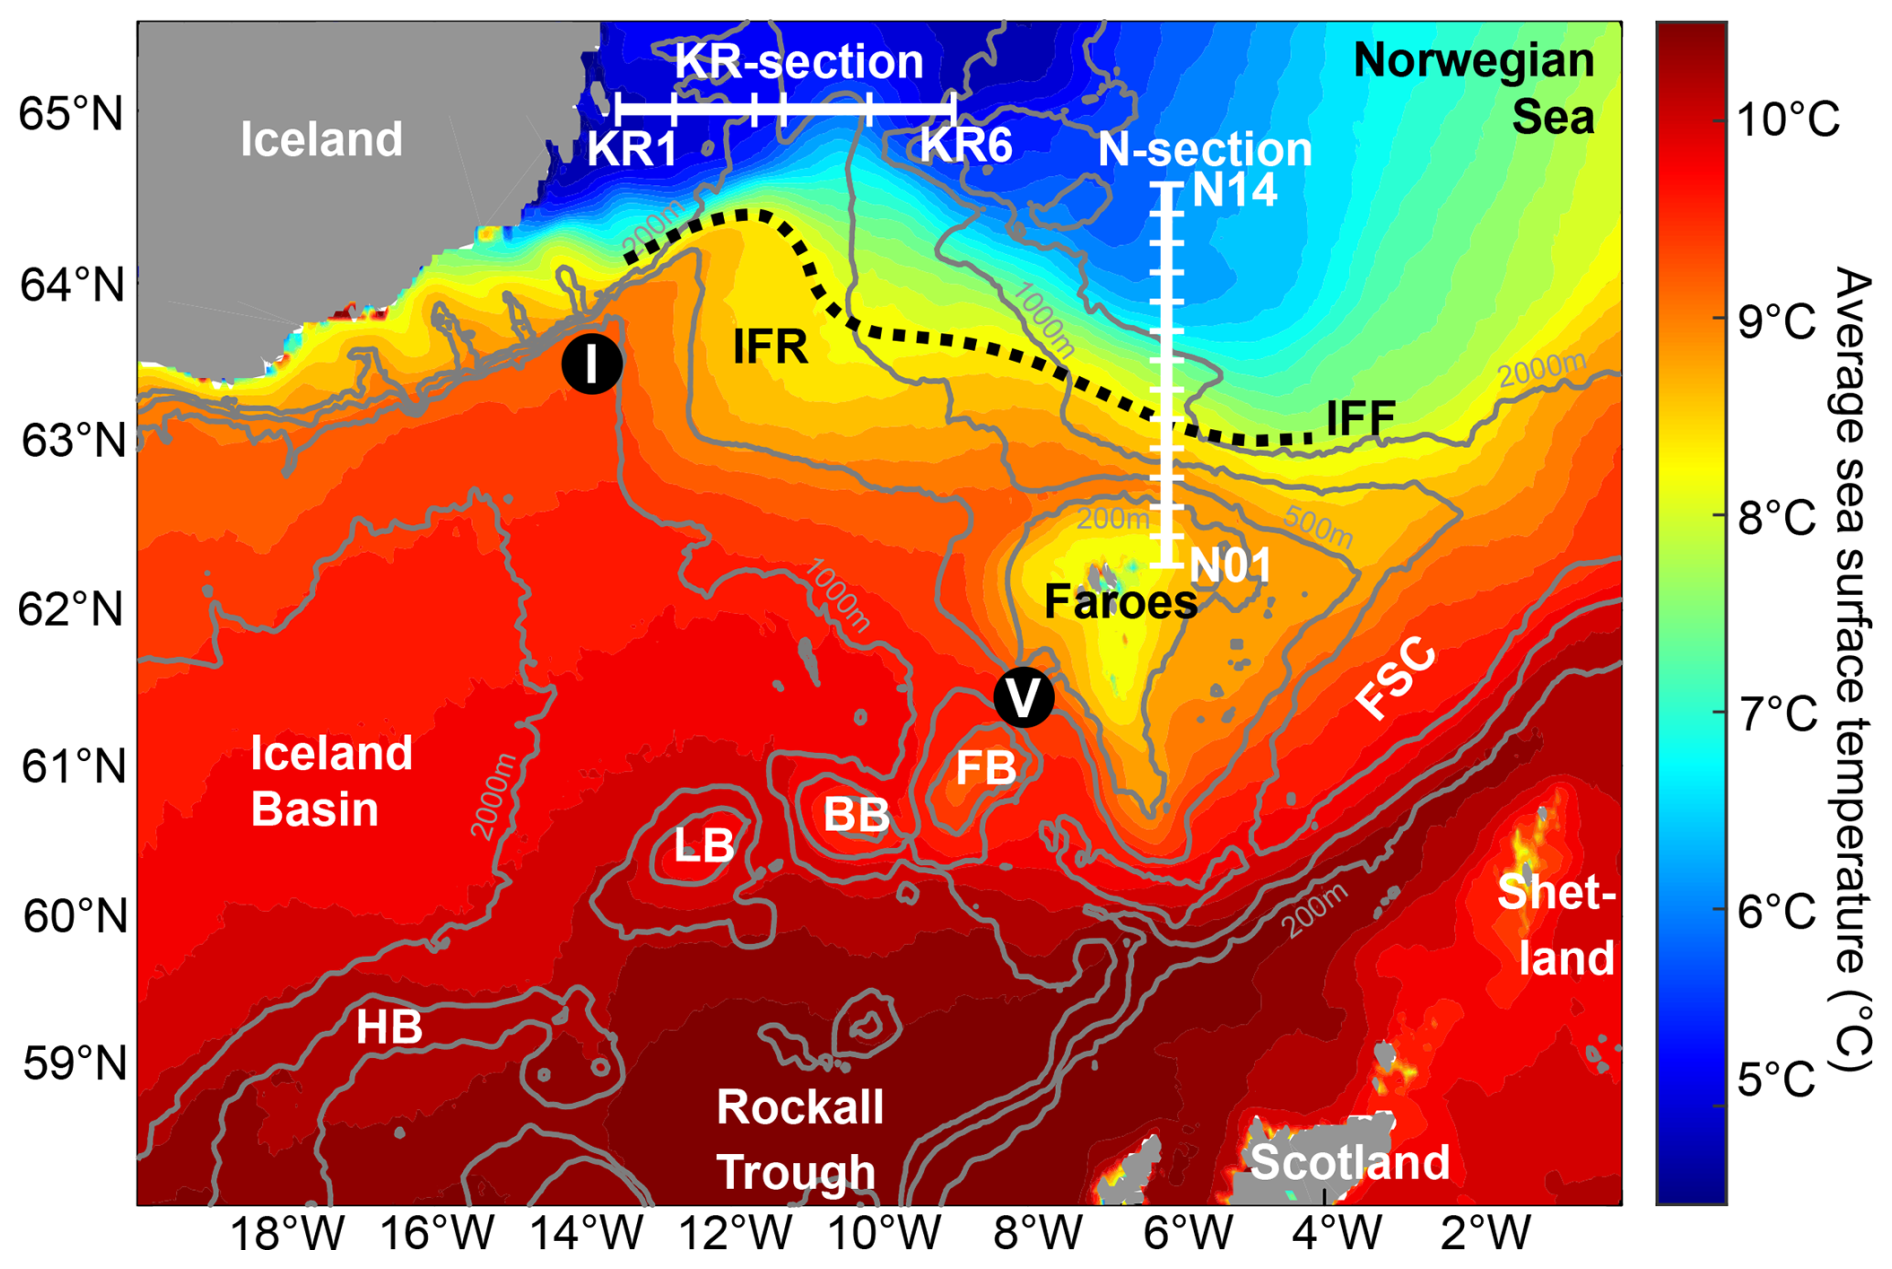
Figure 1The colours indicate average sea surface temperature (SST) based on remotely sensed monthly SST maps in the period 2003–2020 (NASA Goddard Space Flight Center, Ocean Ecology Laboratory, Ocean Biology Processing Group). Two standard stations: I and V are shown by black circles. White lines show two standard sections: the N-section with standard stations N01 to N14 and the KR-section with standard stations KR1 to KR6. Isobaths are shown for 200, 500, 1000 and 2000 m depth. IFR: Iceland-Faroe Ridge. FSC: Faroe-Shetland Channel. HB: Hatton Bank. LB: Lousy Bank. BB: Bill Baileys Bank. FB: Faroe Bank. IFF: Iceland-Faroe Front.
Hydrographic investigations of the waters at the IFR were initiated as early as in the 19th century (Knudsen, 1898) and have continued ever since, with much of the early studies reviewed by Hansen and Østerhus (2000). The main focus of most of these studies has, however, been on the formation of overflow water in the frontal zone and the overflow across the ridge. Despite this overflow-focus, considerable information has been gained on the temperature and salinity of the Atlantic water over and around the IFR.
In the mid-1990s, efforts were initiated to combine the hydrographic observations with velocity observations in order to generate time series of transport. The IFR is around 300 km wide and located below 300 m depth with a sill depth of around 480 m close to the Faroes. Furthermore, the IF-inflow occurs over most of the length of the ridge, but likely with large temporal and spatial variations (Childers et al., 2014; Hansen et al., 2023). High fishing activity (trawling) endangers any moorings deployed on the ridge. Instead of monitoring the transport of IF-inflow over the ridge, it was therefore decided (Hansen et al., 2003) to monitor it at the N-section north of the Faroe Islands (Fig. 1). This is possible due to the pathway of the IF-inflow. The Atlantic water that crosses the IFR meets fresher and colder water at the Iceland-Faroe Front, which is topographically locked to the ridge (Fig. 1). Here, the Atlantic water turns southeast and accelerates into a relatively narrow boundary current, the Faroe Current (Rossby et al., 2009; Hansen et al., 2010), which is easier to monitor.
The N-section has been sampled two to six times annually by hydrographic cruises since the late 1980s. Since 1997, this has been complemented by an array of moored Acoustic Doppler Current Profilers (ADCPs), deployed below the extent of fishing gear or in trawl-protected frames on the bottom. By combining this information with data from satellite altimetry, a system has been established that allows monitoring of the volume transport of the Atlantic water flowing through the N-section as well as its heat transport relative to 0 °C (Hansen et al., 2023).
This monitoring has documented that this branch of the AMOC has not weakened since 1993 (Hansen et al., 2023) and we present updated transport values supporting earlier indications of strengthened flow. The focus of this manuscript is, however, not on the transport of the IF-inflow, but rather on its hydrographic properties. The monitoring system generates annual values for transport-weighted temperature and salinity for the Atlantic water passing through the N-section. These values represent the properties of the water continuing further into the Arctic Mediterranean.
The main aim of this manuscript is therefore to explain the temperature and salinity of the Atlantic waters that have passed through the N-section, both their average values and their variations. To that end, we first establish the main pathway for the Atlantic water flow towards the IFR based on satellite altimetry (Sect. 3.1) and drifters (Sect. 3.2). Using Empirical Orthogonal Function (EOF) analysis on satellite altimetry data along this pathway, we then determine the long-term variations of the flow field since the start of the altimetry era in 1993 (Sect. 3.3).
By analysing hydrographic data from standard stations and sections, we document the water mass properties and their variations during this period both upstream and downstream of the IFR (Sect. 4.1). Causes of the long-term property variations are then discussed. It is well known (e.g., Hátún et al., 2005; Larsen et al., 2012) that the temperature and salinity of the Atlantic water flowing towards and across the IFR are affected by variations of the North Atlantic Subpolar Gyre (SPG). In Sect. 4.2, we use the results from Sect. 3.3 to address the extent to which SPG variations can explain the long-term temperature and salinity variations in a period with general warming of the oceans.
Previous investigations have shown that the core of the Atlantic water is considerably modified by cooling and freshening along a path from west of the Faroes across the IFR (Larsen et al., 2012). Here, we present a more holistic approach by determining the cross-ridge water mass modifications of the total Atlantic water crossing the ridge (Sect. 5.1). The extent to which these modifications can be explained by atmospheric forcing are discussed in Sect. 5.2, while modifications caused by mixing with water of Arctic origin are discussed in Sect. 5.3. This latter topic is split into two questions: where more precisely over the ridge do the modifications take place? (Sect. 5.3.1) and: what Arctic water masses are admixed into the Atlantic water? (Sect. 5.3.2).
With projections of AMOC weakening, timely updates on important AMOC branches are essential. In Sect. 6, we therefore present updated time series of volume transport and heat transport relative to 0 °C of the IF-inflow and discuss their trends. The manuscript is finalized in Sect. 7 by a summary of the main results and a brief discussion of their implications.
2.1 Satellite-tracked drifter data
Satellite-tracked drifter data from the Global Drifter Program were obtained from NOAA (https://erddap.aoml.noaa.gov/gdp/erddap/tabledap/drifter_6hour_qc.html, last access: 14 January 2026). The drifter data are from buoys having a drogue centred at 15 m depth representing the surface flow. We selected quality controlled 6-hourly interpolated drifting buoy data from the area 50–70° N and 10–40° W. All available drifters from 1991 to March 2024 with the drogue attached are used, adding up to 1533 drifters in the area.
In this study, we mainly use the 101 drifters that crossed the IFR eastwards from the Iceland Basin to the Norwegian Sea (more details are in Sect. 3.2). For spatial analysis these data are gridded. The grid size used is 0.1° latitude and 0.2° longitude. To evaluate the eddy field, eddy kinetic energy (EKE) was calculated as where u′ and v′ are the eastward and northward velocity anomalies, respectively. For each grid cell, the local mean flow was calculated by averaging all available observations within that specific cell over the entire period. The velocity anomalies were then computed by subtracting this long-term grid mean from the individual 6-hourly velocity measurements falling within the respective cell. The eddy kinetic energy was first calculated for the individual measurements. The final eddy kinetic energy assigned for the grid cell is the mean of these individual eddy kinetic energy values within the cell. The velocities were obtained directly from the downloaded data product. The eddy kinetic energy was only calculated if there were at least 5 different drifters entering the cell.
The temporal distribution of the drifters crossing the IFR shows substantial gaps in coverage throughout the sampling period from 1991 to 2024. The data is heavily weighted toward the recent period, with 74 drifters crossing the IFR from 2015 to 2024 and only 7 drifters crossing the IFR from 2000 to 2014.
2.2 Temperature and salinity data
Hydrographic data from the northeastern Iceland Basin and the IFR region are analysed. The hydrographic observations were carried out by the Faroe Marine Research Institute (FAMRI) in the years from 1981 to 2024. Data from two standard hydrographic stations located southwest of the IFR are also used (Fig. 1). Station I, occupied by the Marine and Freshwater Research Institute (MFRI) in Iceland, is the deepest station on the “Stokksnes” section (ST5). Station V, occupied by FAMRI, is the deepest station on the “V-section” (V06), crossing the Faroe Bank Channel. Northeast of the IFR, we use hydrographic data from two standard sections. These are the 14 standard stations, N01 to N14, on the N-section occupied by FAMRI and the six standard stations, KR1 to KR6, on the KR-section (Krossanes) occupied by MFRI (Fig. 1). With two to six occupations per year, all these stations have been occupied more than a hundred times since 1993. The hydrographic data are processed following Sea-Bird guidelines (https://www.seabird.com/faqs, last access: 4 August 2026), incl. annual factory calibration of the temperature sensors and calibration of salinity against water samples. Here, the data are reported as Conservative Temperature and Absolute Salinity following TEOS-10 standards.
2.3 Data on sea level height
Altimetry data were selected from the global gridded (0.25°×0.25°) sea level anomaly field 1993–2022 available from Copernicus Marine Environment Monitoring Service (CMEMS) (http://marine.copernicus.eu, last access: 23 April 2025): SEALEVEL_GLO_PHY_L4_MY_008_047. This product has been replaced by a new product with different resolution. We also use gridded values for the Mean Dynamic Topography associated with this data set (Mulet et al., 2021).
2.4 North Atlantic sea surface temperature
Sea surface temperature for the North Atlantic (15–65° N and 20–90° W) were selected from the global gridded (0.05°×0.05°) OSTIA (Worsfold et al., 2024) sea surface temperature for the period 1993–2024. This is a reprocessed product available from Copernicus Marine Environment Monitoring Service (CMEMS) (http://marine.copernicus.eu, last access: 20 March 2026): METOFFICE-GLO-SST-L4-REP-OBS-SST (https://doi.org/10.48670/moi-00168).
2.5 Argo data
Argo data for the IFR area (60–65° N and 20–5° W) were selected for the period from 2001 and onwards from Euro-Argo ERIC (https://dataselection.euro-argo.eu/, last access: 24 March 2026). We selected “delayed-mode” and only “good data” and used adjusted temperature, salinity and pressure.
Another Argo-product was also used to calculate the mean temperature for the upper ocean over time. Monthly temperature for the North Atlantic (15–65° N and 20–90° W) were selected from the global gridded (1°×1°) Roemmich-Gilson Argo Climatology (Roemmich and Gilson, 2009) for the period 2004–2024. Temperature from the surface down to 500 dbar were used. The data are available from The University California San Diego (https://sio-argo.ucsd.edu/RG_Climatology.html, last access: 24 March 2026).
These data were collected and made freely available by the International Argo Program and the national programs that contribute to it (http://www.argo.ucsd.edu, http://www.ocean-ops.org, last access: 4 August 2026). The Argo Program is part of the Global Ocean Observing System (Argo, 2026). Here, the data are reported as Conservative Temperature and Absolute Salinity following TEOS-10 standards.
2.6 SWOT data
SWOT (Surface Water and Ocean Topography) data were obtained from AVISO (https://www.aviso.altimetry.fr, last access: 4 August 2026). We downloaded all available cycles and passes from the mission's start of the 21 d science orbit in July 2023 until now of the data set: SWOT Level-3 KaRIn Low Rate SSH Expert (v3.0) (https://doi.org/10.24400/527896/A01-2023.018). Afterward the area around the IFR (60–65.2° N and 4–20° W) was selected from each pass that contained this area. Calculations were done on the individual passes before all the data were gridded and averaged for the cell value. The grid size used is 0.05° latitude and 0.1° longitude. To evaluate the eddy field, eddy kinetic energy was calculated from the geostrophic velocity anomalies. These were obtained directly from the downloaded data product generated by CSIRO/CLS. The geostrophic velocity anomalies are derived from filtered sea surface height anomalies using a 2D spline fitting method following Tranchant et al. (2025). These data are produced and made freely available by AVISO and DUACS teams as part of the DESMOS Science Team project.
3.1 The Mean Dynamic Topography southwest of the IFR
In the geostrophic approximation, surface velocity is parallel to contours of sea level height. Data on sea level height can thus inform us on the mean surface flow of the water approaching the IFR as well as its variation. The time average sea level height – termed the Mean Dynamic Topography (MDT) – is shown in Fig. 2. To the extent that this version of the MDT represents mean flow, the surface water that ends up crossing the IFR flows between the two thick black dashed lines on average. There is a drop in sea level height of 10 cm across the flow.
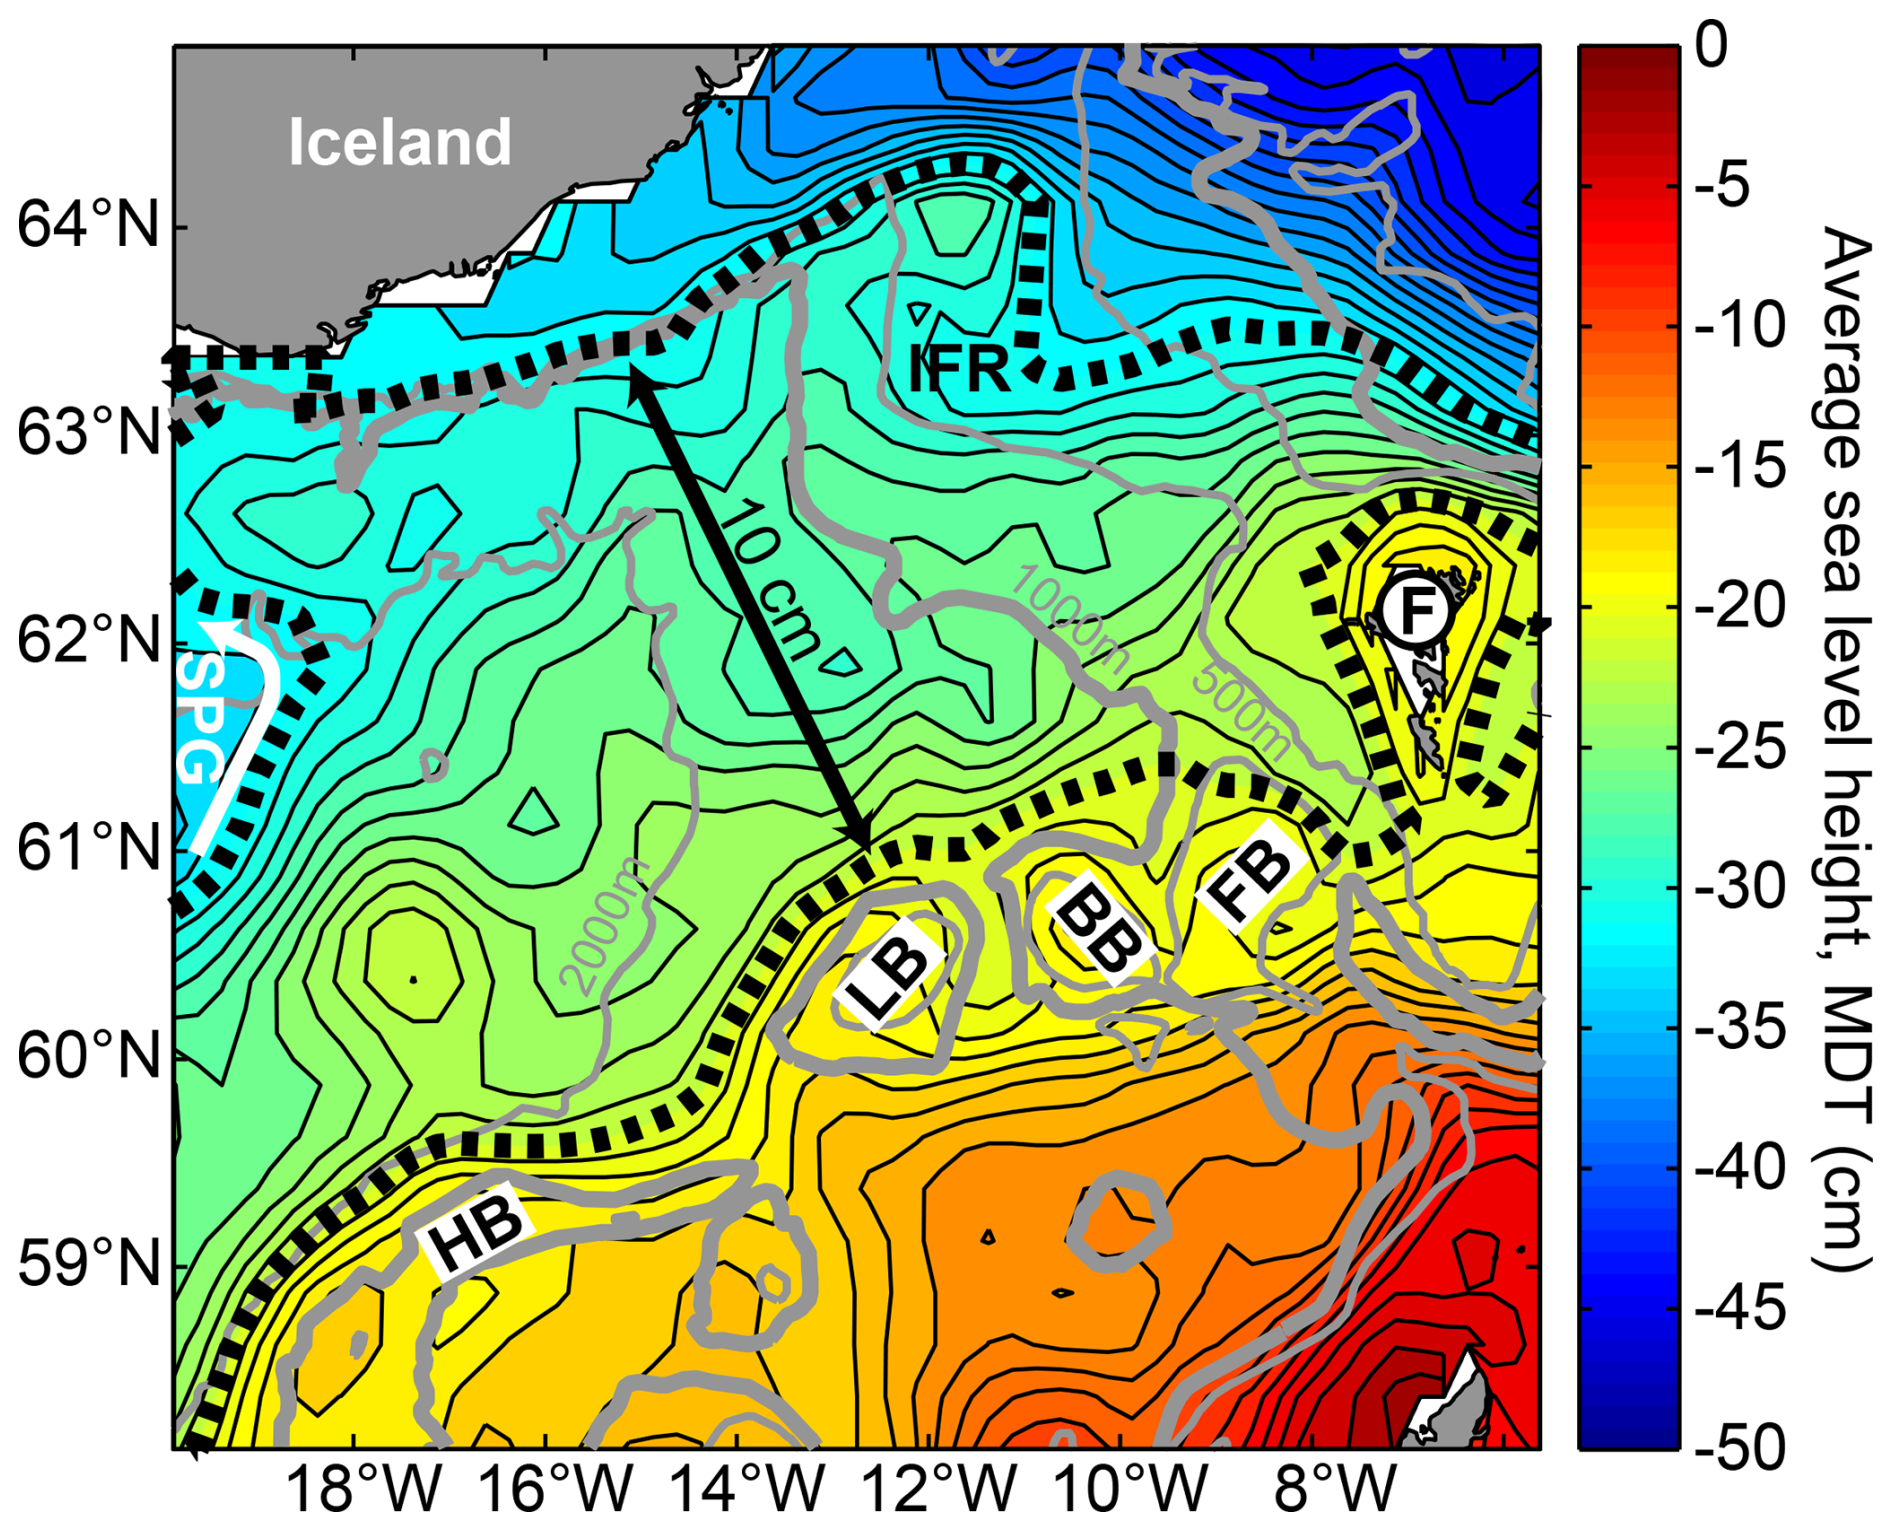
Figure 2The Mean Dynamic Topography in the region west and southwest of the IFR is illustrated by the background colours and isolines for every centimetre. The thick dashed black lines represent the average surface boundaries of the Atlantic water crossing the IFR. The curved white arrow shows intrusion of water from the SPG into the region. Grey lines show bottom contours for 500, 1000 and 2000 m with a thicker 1000 m contour. The Faroes are indicated by an F in a circle. IFR: Iceland-Faroe Ridge. HB: Hatton Bank. LB: Lousy Bank. BB: Bill Baileys Bank. FB: Faroe Bank.
The area south of the southern dashed line also has a net north-eastward flow but this water is on its way to pass south and then east of the Faroes rather than north of the Faroes. The curved white arrow close to the western border of Fig. 2 shows water that has entered the eastern Iceland Basin, but is returning towards the west. It has been labelled SPG to indicate that most of this water is part of a closed circulation cell south of the Greenland-Scotland Ridge.
According to the MDT (Fig. 2), all the water crossing the IFR at the surface has passed through the Iceland Basin on average. Its northward extent is limited by the south Icelandic slope and its southward extent by the plateau and banks west of the Faroes. The accuracy of the MDT is limited by the accuracy of the geoid, altimetry and other input data (Mulet et al., 2021), but Koman et al. (2022) found good correspondence between surface velocities in the Iceland Basin determined from Argo floats and altimetry (their Fig. 6). As will be shown, this water is highly barotropic in the upper 500 m. We therefore expect the surface boundaries in Fig. 2 also to apply to this layer to a high degree.
Assuming geostrophy, a barotropic flow over a flat bottom at depth D has a volume transport , where g is the acceleration of gravity, f the Coriolis parameter and Δh is the sea level difference across the flow. From Fig. 2, Δh is 10 cm. According to Hansen et al. (2023), most of the Atlantic water crosses the ridge close to the Faroese end where the sill depth is 500 m. Using this value for D, Q is found to be 3.8 Sv, which is equal to the observed value (Hansen et al., 2023). The close agreement between the values shows that we should expect a sea level difference across the flow around 10 cm.
3.2 Drifter flow paths towards the IFR
Of the available drifter data, 101 drifters crossed the IFR eastwards from the Iceland Basin to the Norwegian Sea. The IFR is here defined as the area between the 1000 m isobath in the Iceland Basin (the western boundary, WB) and the 500 m isobath in the Norwegian Sea (the eastern boundary, EB). Drifters crossing the IFR have crossed these two boundaries, which are extended towards Iceland and Faroes (Fig. 3a). Additionally, there were 44 drifters passing south of Faroes into the Norwegian Sea (Fig. 3b). Some drifters have crossed the IFR, subsequently turning into the Faroe-Shetland Channel, some even traveling around the Faroe Islands, before turning to the Norwegian Sea. They are only included in Fig. 3a.
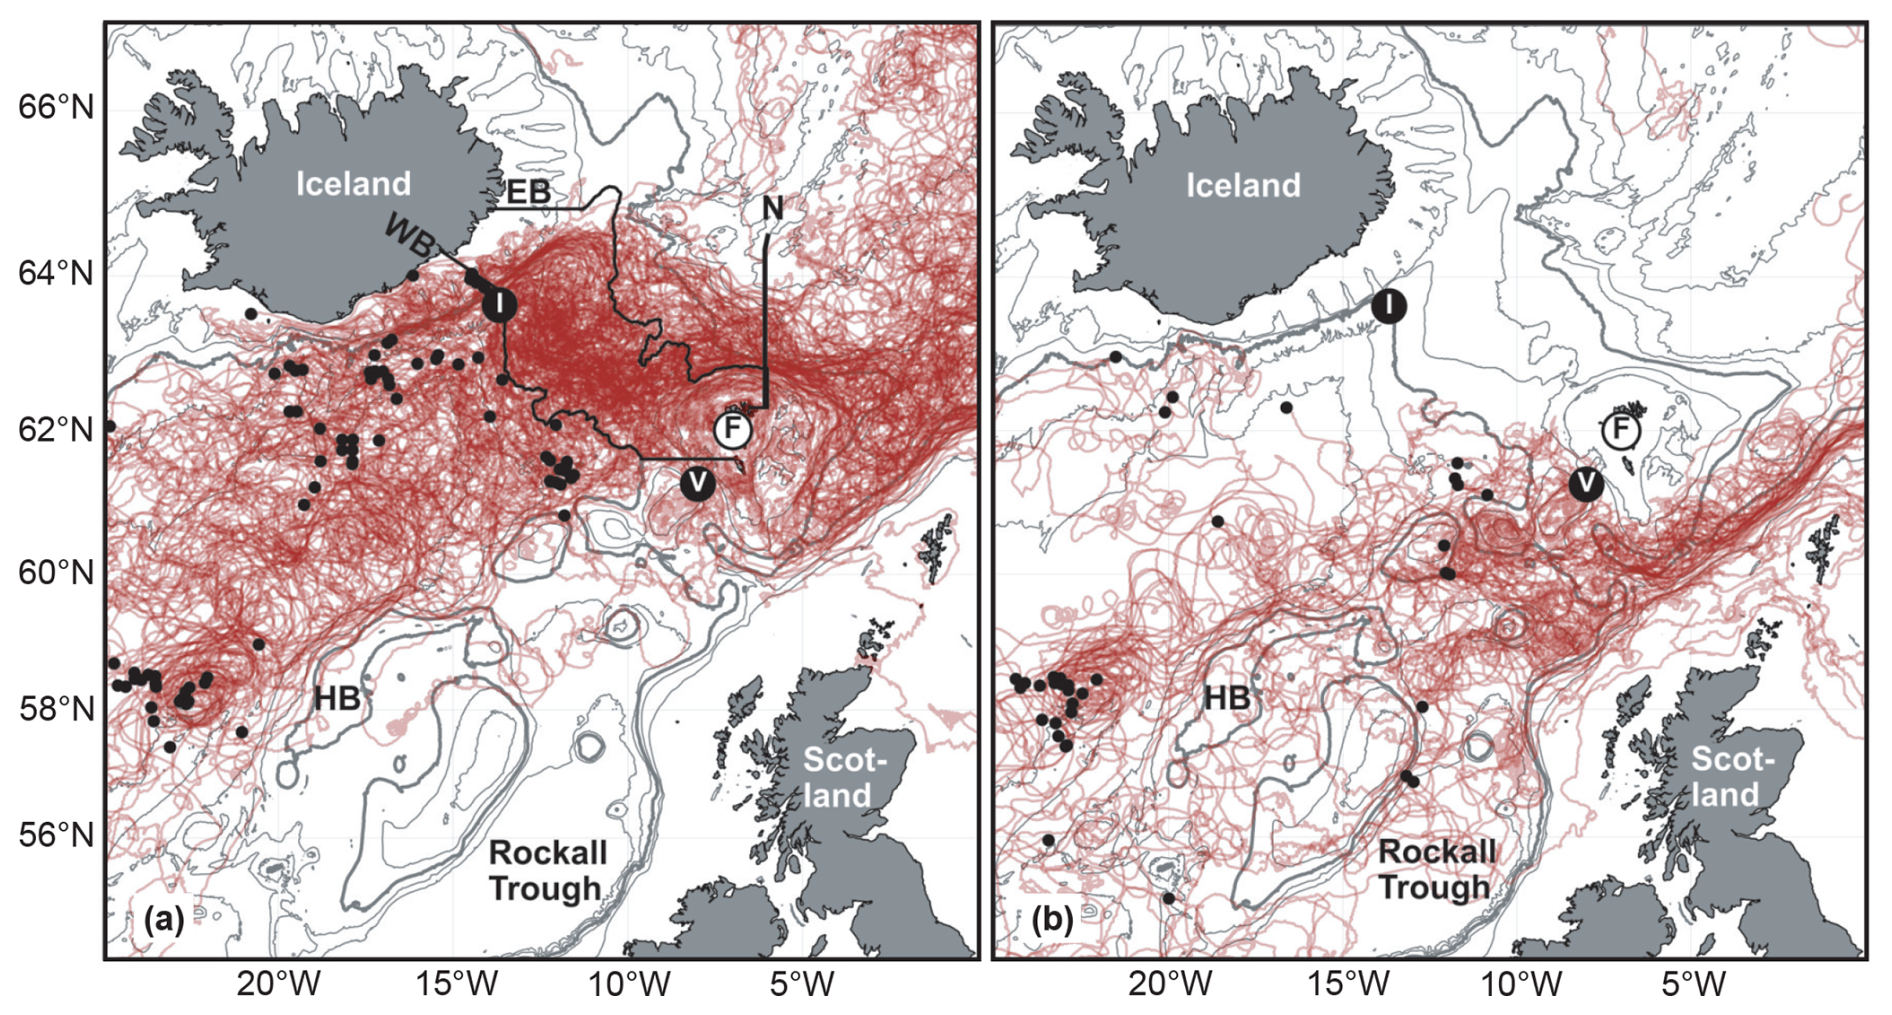
Figure 3(a) Flow paths of 101 drifters crossing the IFR. Black curves show the western boundary (WB) and the eastern boundary (EB) defining the IFR area. The thick black line north of the Faroes (F) indicates the N-section. (b) 44 drifters passing south of the Faroes. Black circles on both maps show where the drifters were deployed if they fall inside the map area. In (a) six deployment locations fall outside the map and in (b) eight deployment locations fall outside. Drifter paths are shown with semi-transparent red lines. Grey lines show bottom contours for 200, 500, 1000, 1500, 2000 and 3000 m with a thicker 1000 m contour. HB is Hatton Bank. Black circles with white letters show the locations of standard stations I and V.
The drifter data support that the origin of the Atlantic water crossing the IFR into the Norwegian Sea is from the Iceland Basin and they also indicate a clear surface pathway from the Iceland Basin through the Faroe-Shetland Channel. All of the 101 drifters passing the IFR have entered through the Iceland Basin, although there are eight drifters that flowed from the Iceland Basin on to the banks in this area and back to the Iceland Basin to eventually cross the IFR (Fig. 3a and Fig. S1 in the Supplement). Only four drifters deployed in the Rockall Through area crossed the Iceland-Scotland Ridge, all of them south of the Faroes.
The drifter dataset is not ideal due to the fact that the drifters were not deployed homogeneously and they will be affected by the wind despite only drifters with the 15 m drogue attached were used (Brambilla and Talley, 2006; Poulain et al., 2009). Westerlies dominate the area and this implies that the Ekman drift on the surface drifters is towards the south. We cannot exclude the possibility that Ekman drift has prevented drifters to pass from the Rockall Trough to the IFR. However, according to Fig. 3a, the southward forcing does not seem to be so strong that it prevents most drifters coming through the Iceland Basin to cross the Iceland-Scotland Ridge between Iceland and the Faroe Islands.
Both the MDT and the drifter data suggest the Iceland Basin as the typical pathway for Atlantic water to approach the IFR. We note that the surface temperature distribution in Fig. 1 also is consistent with the flow field in Fig. 2. These results also agree with a study using vessel-mounted ADCP data from 130 transects along four different routes between Scotland, Iceland and Greenland (Childers et al., 2014, 2015) and an earlier drifter study (Jakobsen et al., 2003).
3.3 Long-term variations of the surface flow southwest of the IFR
To study the long-term circulation changes of the Atlantic water approaching the IFR, an EOF analysis was made on the annually averaged sea level anomaly data for the 1993–2022 period, modified by subtracting the spatial average from all grid points at every time-step. Without any modification, the first EOF mode would be dominated by the long-term sea level rise (Supplement Fig. S2). Our focus is on surface velocities, which in the geostrophic approximation are determined by sea surface slopes. Subtraction of the spatial average at every time-step conserves surface slopes in every grid point, thus conserving surface velocities while removing the confounding effects of sea level rise. The region of the EOF analysis was designed to cover the average flow path (Fig. 2), extended southwards to allow for flow variations, but limited eastwards and northwards to exclude variations downstream of the IFR.
For annually averaged modified sea level anomaly data, the first EOF mode (Fig. 4a, b) explains more than half (52 %) of the total variance with the second mode only explaining 10 % of the variance. The principal component of the first mode, pc1, reached its lowest value in 2005 and its highest in 2016 (Fig. 4a). To illustrate the effect of this variation, the two bottom panels in Fig. 4 show the average sea level height (the Absolute Dynamic Topography) for these two extreme years.
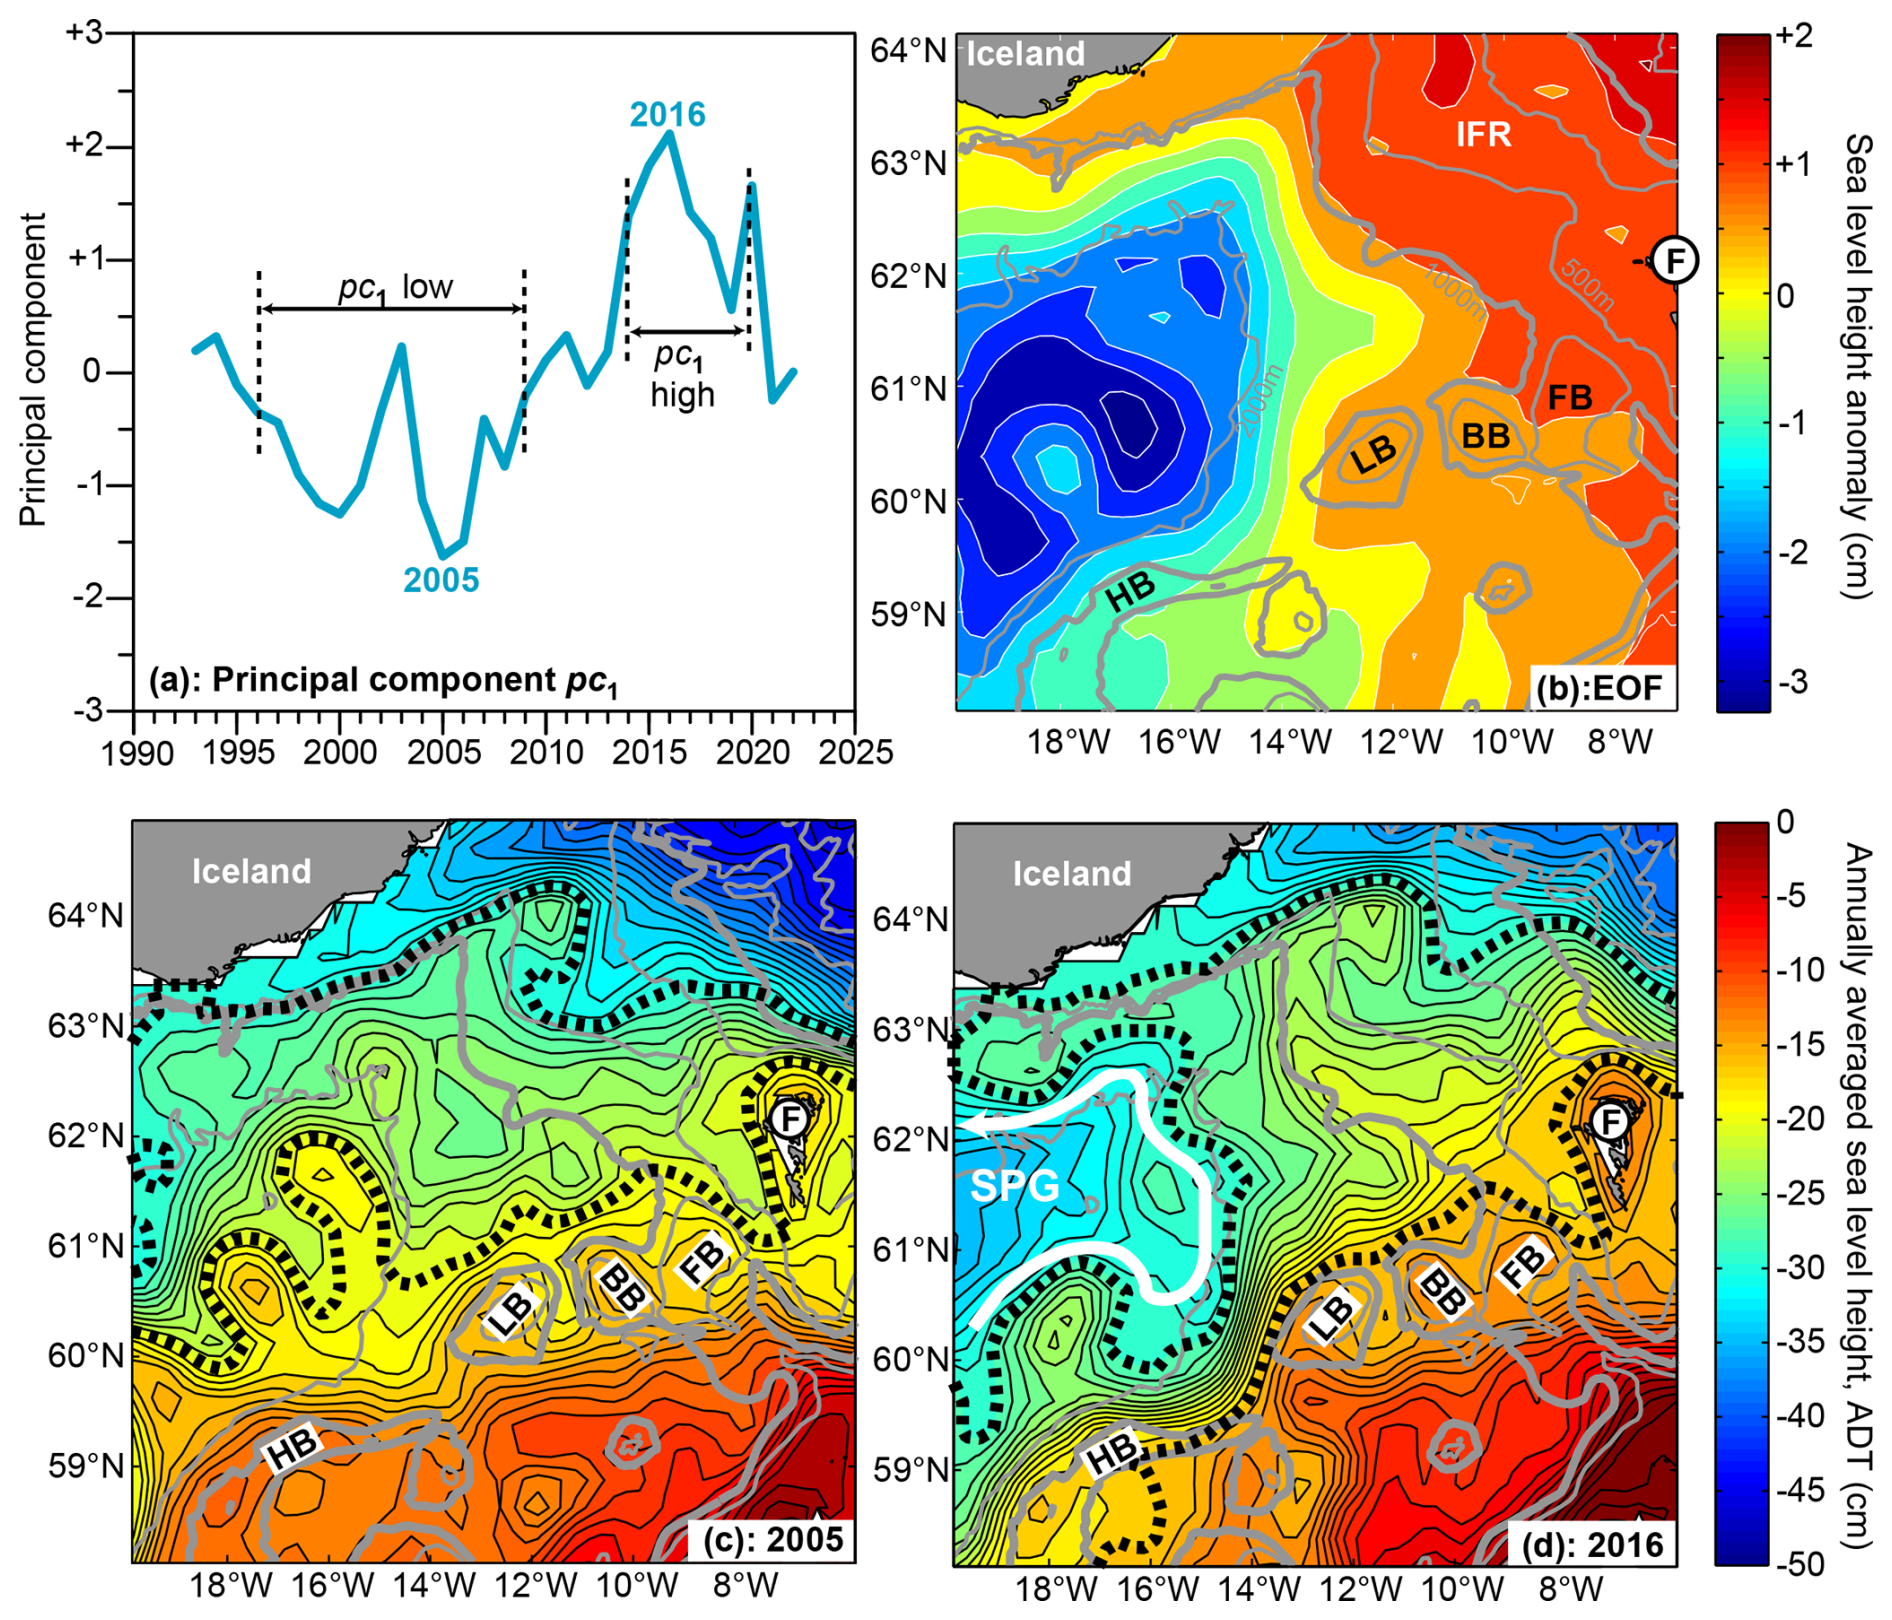
Figure 4EOF-analysis of annually averaged “modified” (see text) sea level anomaly for the 1993–2022 period. (a) The principal component (temporal variation) of the first EOF-mode, pc1, is shown in cyan. Two periods of low and high pc1 values are indicated. (b) Spatial structure of the first EOF-mode. (c, d) The background colours and thin black lines show the average sea level height (Absolute Dynamic Topography, ADT) for the extreme years 2005 (c) and 2016 (d), respectively. The thick dashed black lines represent the surface boundaries of the Atlantic water crossing the IFR for each of the two years. The curved white arrow in (d) shows intrusion of water from the SPG into the region. Grey lines on the maps show bottom contours for 500, 1000 and 2000 m with a thicker 1000 m contour. The Faroes are indicated by an F in a circle. IFR: Iceland-Faroe Ridge. HB: Hatton Bank. LB: Lousy Bank. BB: Bill Baileys Bank. FB: Faroe Bank.
From Fig. 4, it appears that the principal component of the first EOF mode, pc1, is an indicator for the intrusion of the SPG into the eastern Iceland Basin along with a south-eastward migration and focussing of the flow corridor feeding the IFR with Atlantic water. When pc1 is at its minimum (Fig. 4c), the traces of SPG, seen in the MDT (Fig. 2), have moved westwards out of the region. The Atlantic water flows through the northern part of the Iceland Basin. When pc1 is at its maximum, in contrast, the SPG intrudes almost all the way to the IFR (Fig. 4d), and the Atlantic water flow corridor is pushed south-eastwards so that it passes over Hatton Bank.
Dividing drifters that cross the IFR into two periods (Fig. 4a): 1996–2009 with low pc1 (19 drifters) and 2014–2020 with high pc1 (50 drifters), we find that the pathway towards the IFR is more south-easterly during the period with high pc1 than during the period with low pc1, which is in line with the EOF analysis (Fig. 5a, b). In Fig. 5c and d, only drifters deployed south of 60° N are included. This ensures that our conclusion avoids being an artefact of the inhomogeneous deployment of the drifters in the two periods. We observe that drifters in the period with high pc1 (2014–2020, 23 drifters) do not enter the north-western part of the Iceland Basin, which is in agreement with Fig. 4d. In contrast, during the period with low pc1 (1996–2009), although only three drifters are available for this period, two out of three drifters enter this area, which is consistent with Fig. 4c.
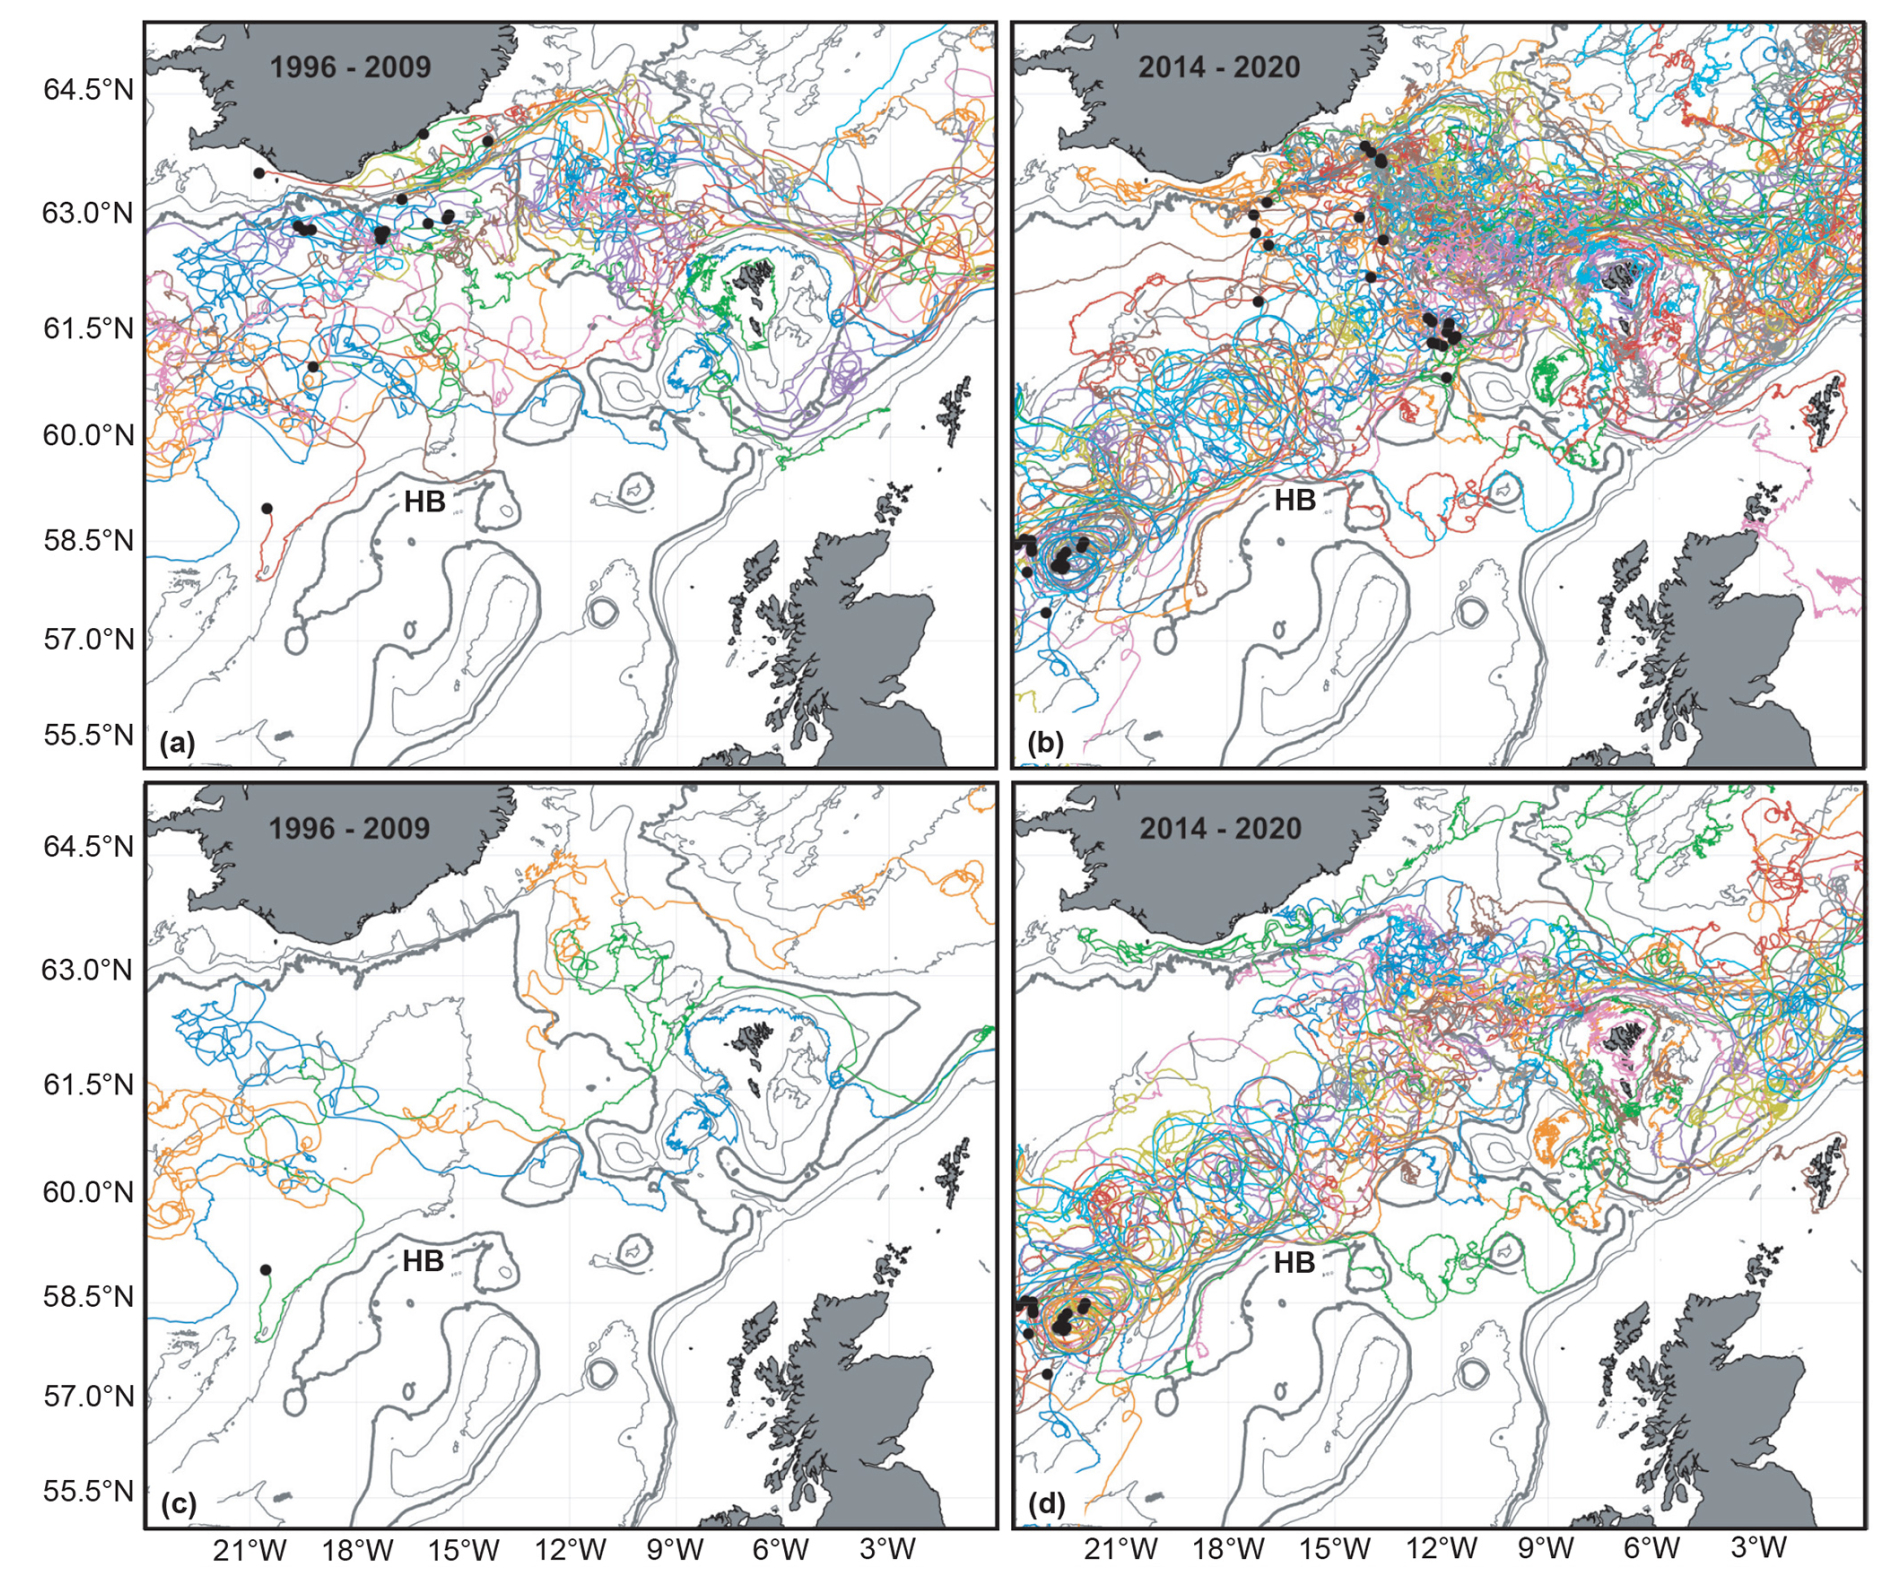
Figure 5(a, c) Drifters crossing IFR in a period with no or little intrusion of the SPG into the Iceland Basin (pc1 was low). (b, d) Drifters crossing IFR in a period where SPG intruded far into the Iceland Basin (pc1 was high). (a) All the drifters (19) crossing in the period from 1996 to 2009. (c) The same as in (a), but only those drifters (3) that were deployed south of 60° N. (b) All drifters (50) crossing in the period from 2014 to 2020. (d) The same as in (b), but only drifters (23) deployed south of 60° N. Black circles show where the drifters were deployed if they fall inside the map area. In (a) three deployment locations fall outside the map, in (b) eight deployment locations fall outside, in (c) two deployment locations fall outside and in (d) eight deployment locations fall outside. Grey lines show bottom contours for 200, 500, 1000, 2000 and 3000 m with a thicker 1000 m contour. HB: Hatton Bank.
4.1 Water mass properties upstream and downstream of the IFR
Mean profiles for the two standard stations I and V southwest of the IFR (locations are shown in Fig. 1) are fairly barotropic except for the seasonal surface layer and below around 400 m in the Faroe Bank Channel (station V), where cold, low-salinity overflow water is under the Atlantic water (Fig. 6a, b).
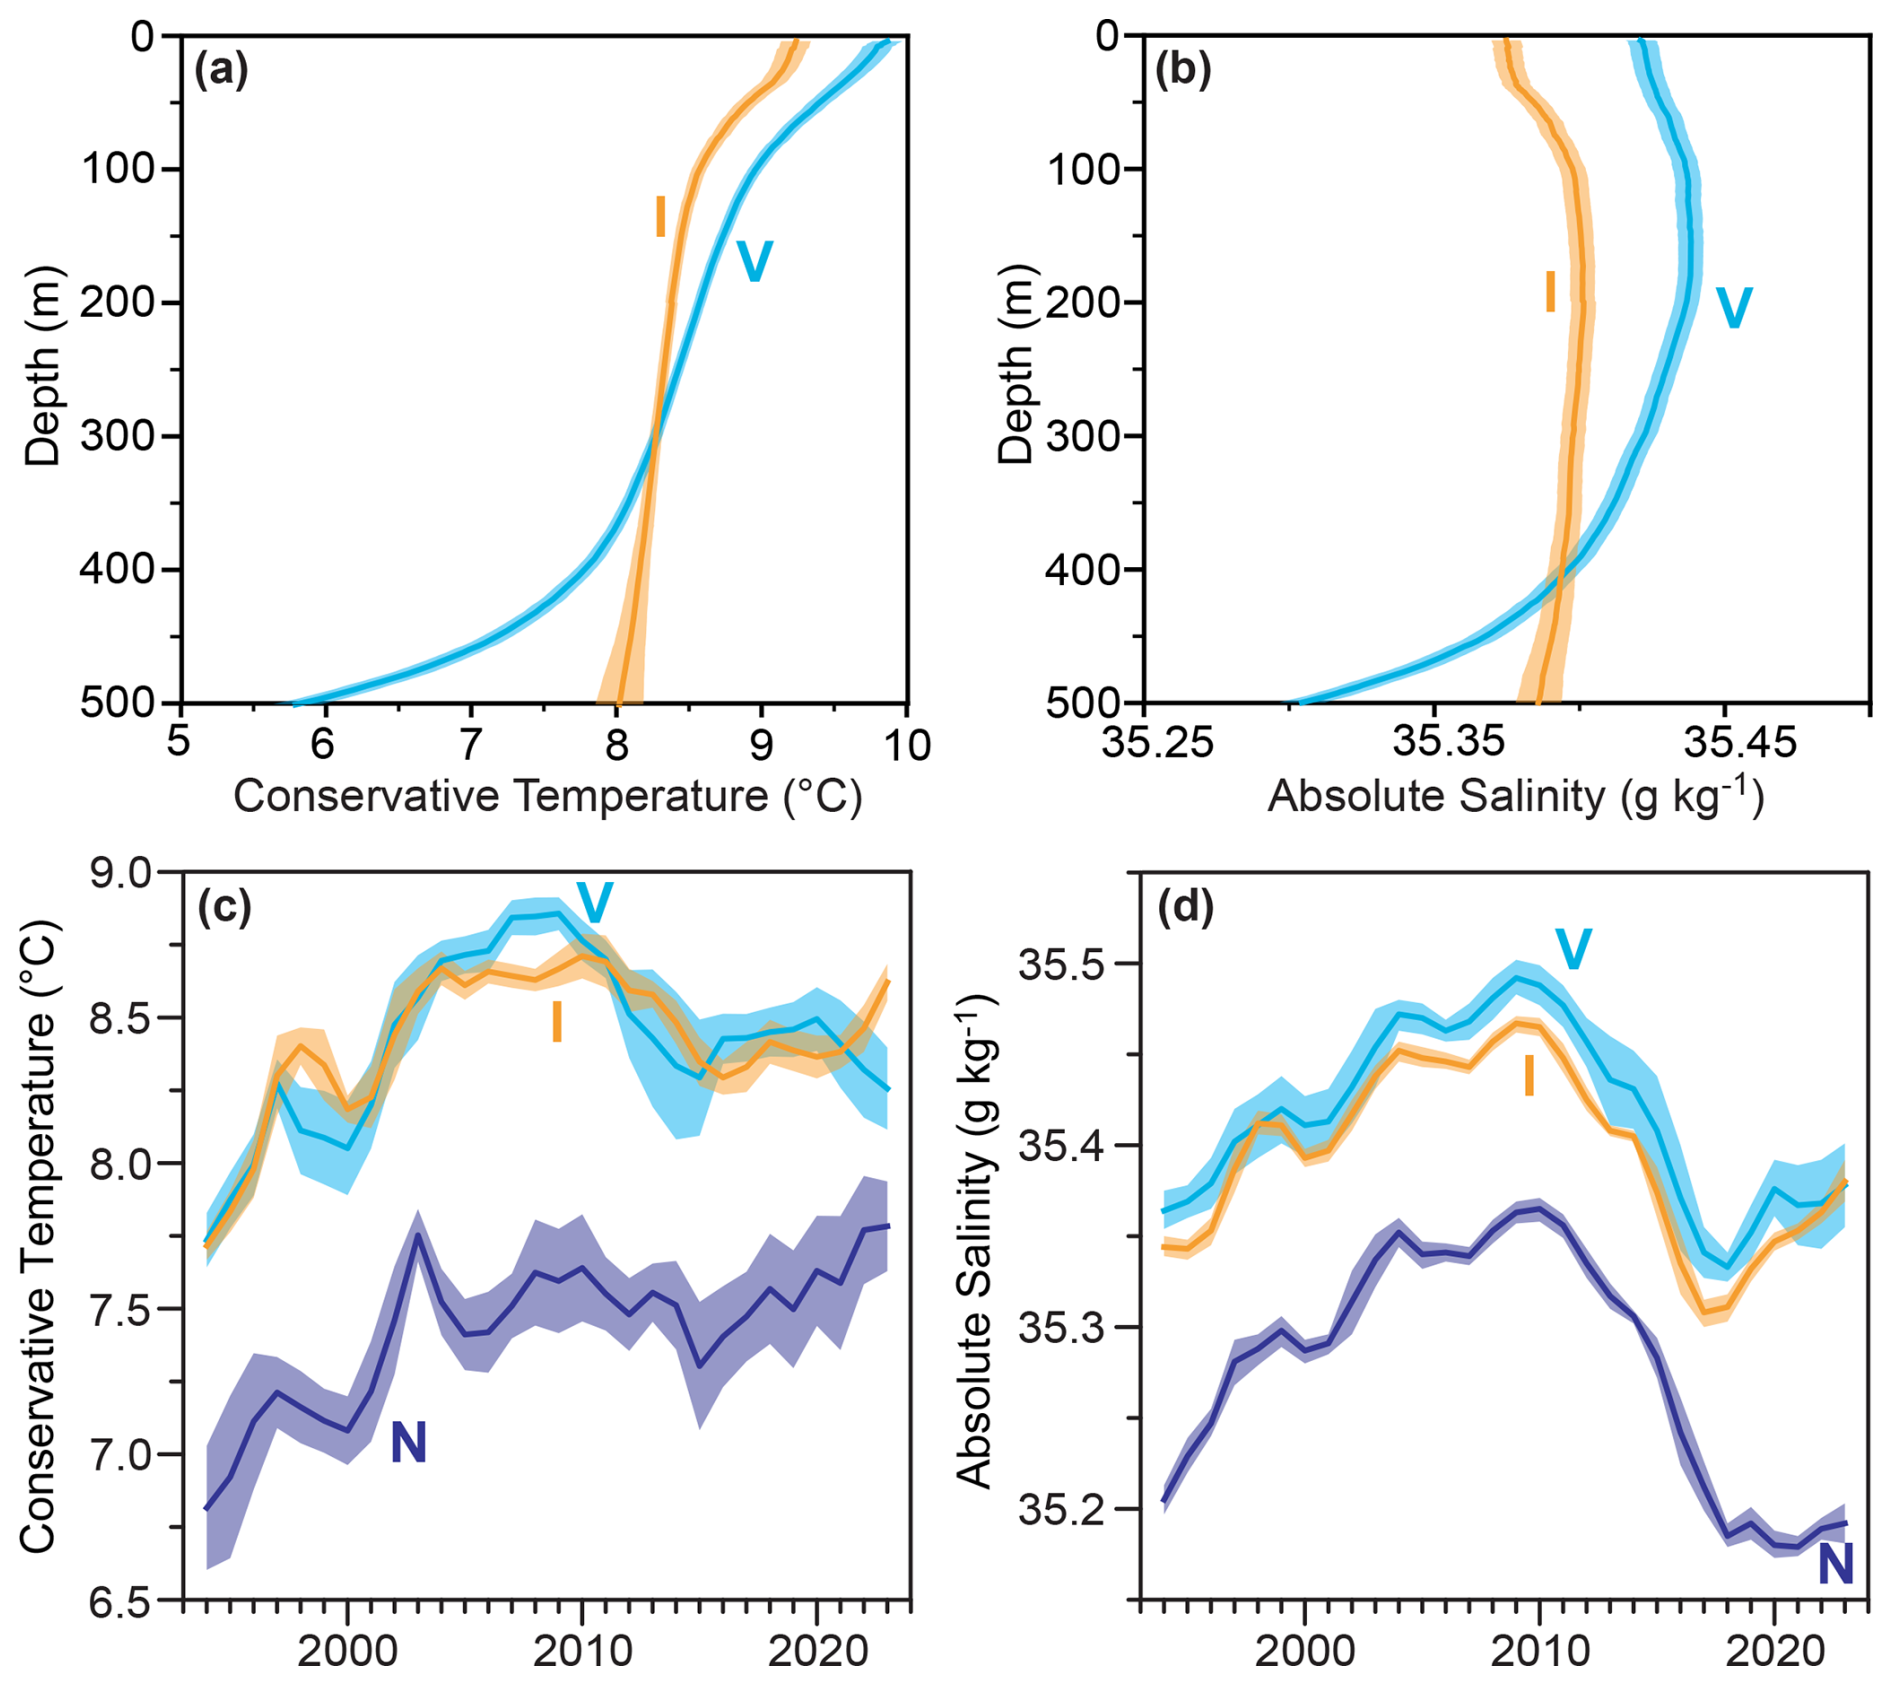
Figure 6Average profiles of Conservative Temperature (a) and Absolute Salinity (b) for the two standard stations I (orange) and V (cyan) upstream of the IFR. For positions see Fig. 1. 3 year running mean de-seasoned temperature (c) and salinity (d) averaged from the surface to 500 m depth for the two standard stations I (orange) and V (cyan). Dark blue curves show transport-weighted temperature (c) and salinity (d) on the N-section (see text). In all the panels, semi-transparent areas indicate average ±1 standard error.
To characterize the water mass variations of the Atlantic water approaching the IFR region, we compute depth-averaged temperature and salinity over the upper 500 m, corresponding to the approximate sill depth of the IFR. Although typically more frequent, there are years with only two occupations at different times of the year for both station I and V. The time series have been de-seasoned using the same method as in Larsen et al. (2012), but annual averages will still be rather uncertain. To reduce this uncertainty, the time series plotted in Fig. 6c, d have therefore been averaged over three years (running mean).
Although the values at station V (cyan curves) and station I (orange curves) at a specific time typically differ for both temperature (Fig. 6c) and salinity (Fig. 6d), these differences are relatively small compared to the overall variations throughout the period. This motivates the generation of time series for “Iceland Basin temperature”, TIB, and “Iceland Basin salinity”, SIB, by averaging the 3 year running mean values at stations I and V. In the following, the time series TIB and SIB will be used to represent upstream values for the temperature and salinity of the Atlantic water reaching the IFR.
The properties downstream of the ridge are monitored at the N-section (location shown in Fig. 1). Average water mass characteristics on the N-section are shown in Fig. 7. The position and properties of the Atlantic water core are variable and unlike the stations upstream of the IFR (I and V), the water column at the N-section is highly variable vertically as well as horizontally (Supplement Fig. S3). Therefore, it is not possible to use a simple depth average for a few standard stations to show the Atlantic water properties at this section. Instead, time series of transport-weighted temperature and salinity are generated by combining 3 year running mean temperature at station N03 with monthly averaged velocity fields on the section, generated from altimetry data as detailed in Hansen et al. (2023). Dark blue curves in Fig. 6c, d show annual averages of these time series with standard errors derived from the temperature at N03. From Fig. 6c, d, the Atlantic water on the N-section has been cooled and freshened relative to the water upstream of the ridge. We quantify this cooling and freshening in Sect. 5.1.
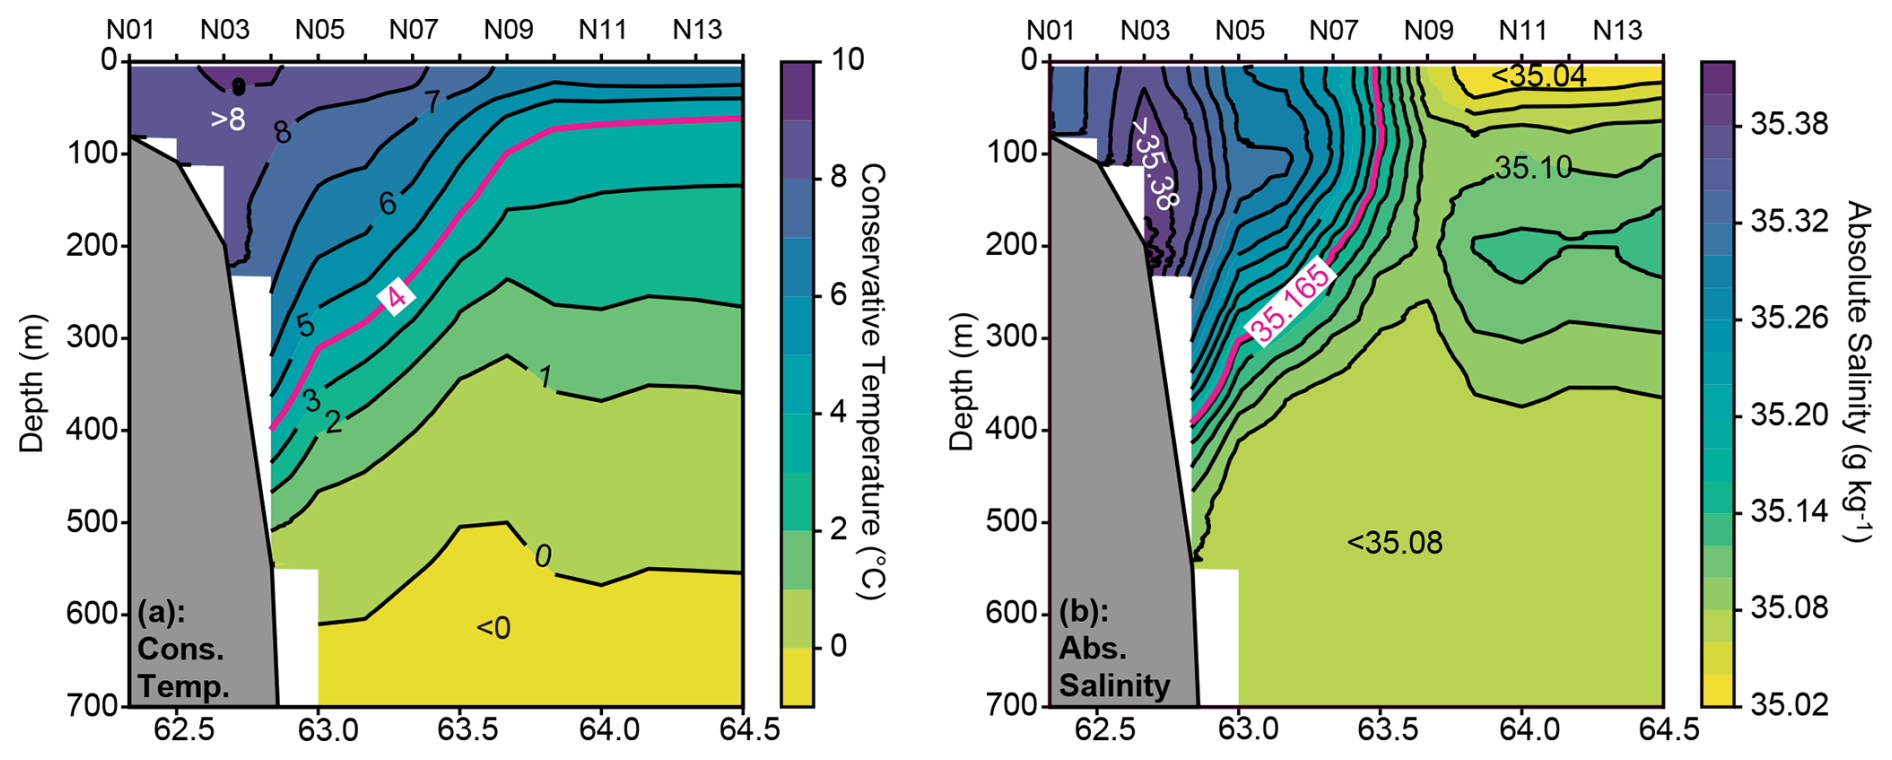
Figure 7Average water mass characteristic at the N-section. Mean Conservative Temperature (a) and Absolute Salinity (b) for the period from 1993 to May 2024 from 99 cruises where all 14 standard stations were occupied. Magenta lines show the 4 °C isotherm and the 35.165 g kg−1 isohaline (corresponding to the 35.0 isohaline in practical salinity units), used by Hansen et al. (2023) to define the deep and northern boundary of Atlantic water on the section.
4.2 Causes of the long-term temperature and salinity variations
Throughout the period from 1994 to 2023, Fig. 6c, d shows that the long-term variation of the temperature and salinity downstream of the ridge (on the N-section) is very similar to that upstream (at stations I and V). During the IFR-crossing, the Atlantic water has been cooled and freshened, but by relatively stable amounts. Thus, the long-term variations of both temperature and salinity of the IF-inflow at the N-section are primarily caused by processes upstream of the IFR.
As mentioned in the introduction, these variations have previously been linked to the SPG as represented by the Gyre Index (Hátún et al., 2005; Larsen et al., 2012). Periods with a strong SPG, i.e. a high Gyre Index, were found to be characterized by relatively low temperatures and salinities of the water approaching the ridge, and vice versa. The original version of the Gyre Index (Häkkinen and Rhines, 2004) was based on Empirical Orthogonal Function (EOF) analysis of satellite altimetry data from a large area in the North Atlantic. Since then, various other versions have been suggested, creating considerable ambiguity (Hátún and Chafik, 2018), and it has been emphasized that one index may not necessarily describe the SPG variation in all regions (Foukal and Lozier, 2017; Biri and Klein, 2019).
With this in mind, we decided to focus on a regional rather than a large-scale part of the SPG. For that reason, the EOF analysis presented in Fig. 4 was restricted to a small region around the Iceland Basin, so that unrelated variations would not disturb the signal. The principal component, pc1, of the first EOF mode is therefore not an index for the SPG as a whole. Rather it represents the intrusion of cold low-salinity SPG-water into the Iceland Basin, which provides a causal foundation for the relationship between salinity (cyan curve) and pc1 (black curve) that appears in Fig. 8a. Most of the long-term salinity variations of the Atlantic water approaching the IFR may therefore be seen as a delayed response to the intrusion of SPG-water into the Iceland Basin. A delay in the salinity responses to SPG variations was to be expected since the water is being modified throughout its path along the boundary between the Subtropical and Subpolar gyres and studies on anomaly propagation in the North Atlantic (e.g., Sutton and Allen, 1997; Årthun et al., 2017) suggest that a delay of a few years may be appropriate. In years when pc1 is high and the SPG extends far eastwards into the Iceland Basin (Fig. 4d), a smaller lag might be expected and Fig. 8 indicates that this may well be the case.
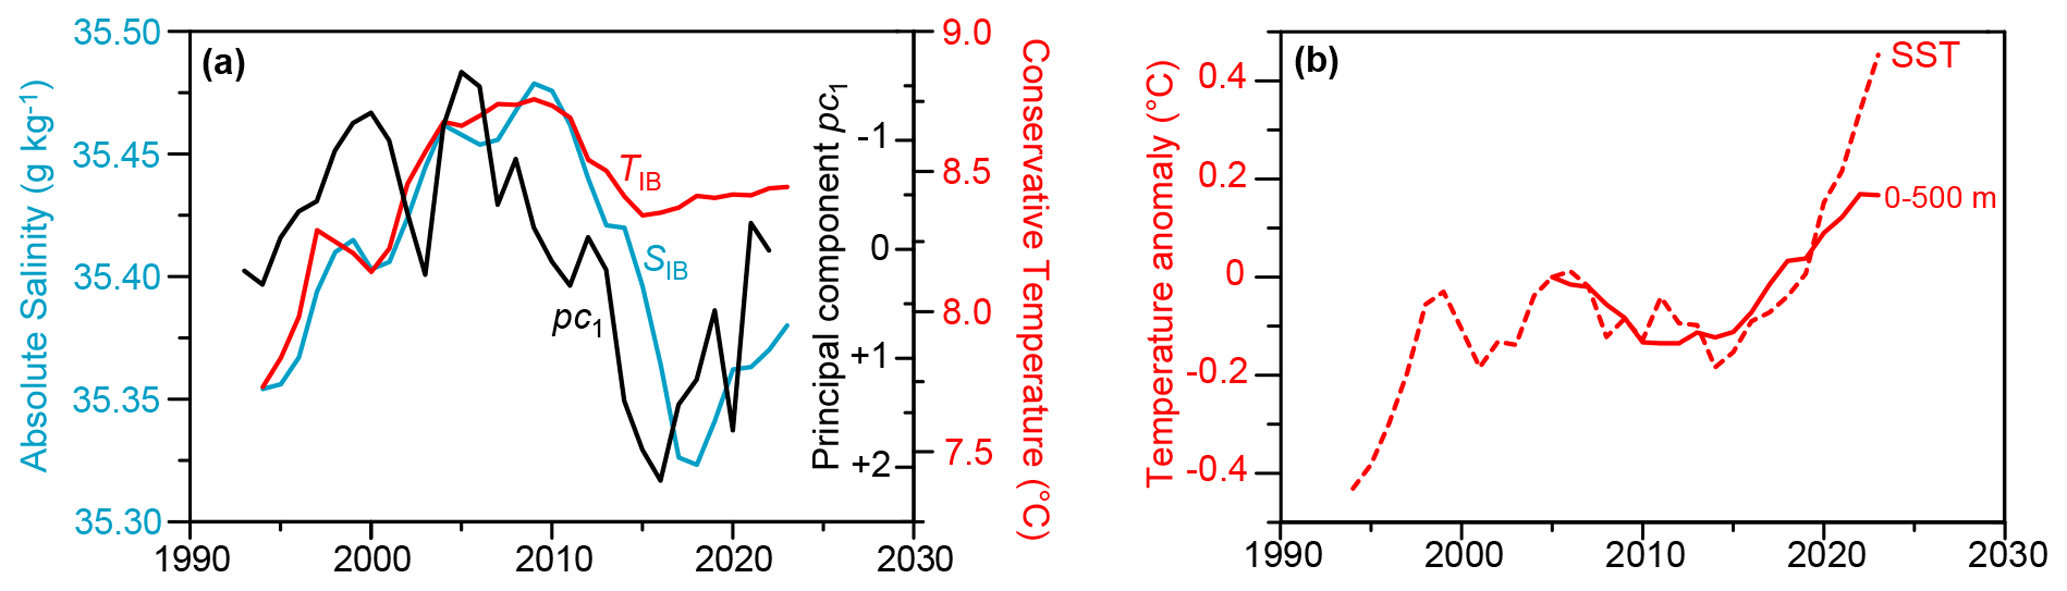
Figure 8(a) 3 year running mean Absolute Salinity SIB (cyan curve) and Conservative Temperature TIB (red curve) of the 500 m layer of Atlantic water just before reaching the IFR together with the principal component pc1 from Fig. 4a (black curve, note inverted scale). (b) 3 year running mean temperature anomalies for the North Atlantic (15–65° N and 20–90° W) at the surface (dashed curve labelled SST) and averaged over the 0 to 500 m depth layer (continuous). The 0–500 m average is based on Argo data and only available from 2004 onward. Anomalies are relative to the 2004–2006 period.
For temperature, the correspondence between pc1 and TIB in Fig. 8a is not as clear as for SIB, especially for the period after 2015. This is also the period when the variations of TIB and SIB in Fig. 8a start to diverge. Before that, the two parameters tended to co-vary as noted by Larsen et al. (2012). After 2015, when pc1 became strongly positive, only salinity seems to have responded to this SPG intrusion, whereas temperature remained almost constant. This indicates the occurrence of some other process counteracting the effects of SPG intrusion for temperature, but less for salinity. The obvious candidate for this process is the general warming that has also affected the North Atlantic, as demonstrated in Fig. 8b. This figure shows temperature anomalies for an area upstream of our region, which includes most of the Subtropical as well as the Subpolar gyres (15–65° N and 20–90° W). In the Iceland Basin, winter convection regularly occurs down to 500 m or deeper (González-Pola et al., 2022) but other parts of the North Atlantic have shallower convection. Thus, it is not obvious for what depth interval to calculate temperature anomalies. Irrespective of this choice, Fig. 8b indicates warming after 2015. We suggest that this warming of the upstream water can explain at least partly why TIB in Fig. 8a did not decrease to the same extent as SIB after 2015.
Another contributory process might be linked to more local changes in the air-sea heat flux. In this region, the ocean generally loses heat to the atmosphere, but variably from year to year. The most pronounced divergence between TIB and SIB occurred from 2014 to 2017. If temperature had followed the salinity decrease, it would have decreased by ≈0.7 °C rather than remaining almost constant. In this period, the heat loss seems to have been ≈6 W m−2 less than average (Supplement Fig. S4). For a 500 m deep layer, this implies ≈0.3 °C less cooling than normal over these three years. Thus, variable air-sea heat flux may have contributed, but it is not likely to have dominated.
5.1 Observed cooling and freshening during the crossing
From Fig. 6c, d, the Atlantic water crossing the N-section has been strongly cooled and freshened relative to the 0–500 m depth layers at stations I and V. Table 1 shows a cooling of about 1 °C and a freshening above 0.1 g kg−1 on average over the period 1993–2023. Stations I and V are at opposite ends of the region just upstream of the IFR and all of the drifters crossing the IFR passed between these two stations or close to one of them (Fig. 3a). The deep parts of the 0–500 m water column at station V furthermore include some cold low-salinity water from the top of the deep overflow in the Faroe Bank Channel. From Fig. 3, only a small portion of the water takes a detour through the channel and most of the water crossing the IFR is unlikely to be colder or less saline than both stations I and V. The numbers in the last two columns of Table 1 are therefore not likely to be overestimates for the Atlantic water crossing the IFR.
Table 1Averages for the period 1993–2023 of transport-weighted (Tr-w) properties on the N-section and of 0–500 m depth-averaged properties on stations I and V (time series shown in Fig. 6c, d). The last two columns list differences.

Table 1 indicates more cross-ridge cooling and freshening than was reported by Larsen et al. (2012) who reported a cooling of 0.7 °C and a freshening of 0.05 psu. They, however, studied changes in the core properties, not the total Atlantic water crossing the IFR.
5.2 Modifications caused by atmospheric forcing
To estimate an upper limit for the contribution of air-sea interactions to the observed temperature and salinity changes of the water crossing the IFR, the maximum crossing time of the water must be determined. This may be achieved from the drifter data. 97 of the 101 drifters that crossed the IFR, reached the N-section. The maximum crossing time, as defined by the first crossing of the WB until the crossing of the N-section (Fig. 3a), had a median of 63 d.
To estimate the cross-ridge temperature decrease by air-sea interaction, we assume that the average net heat loss to the atmosphere (55 W m−2) during the maximum crossing time is used to cool a 500 m deep water column. Similarly, the average precipitation minus evaporation (0.001 m d−1) during the maximum crossing time is used to reduce the salinity of a 500 m deep water column (for details, see Larsen et al., 2012). The result is that only around 15 % of the observed cooling and 5 % of the freshening (Table 1) is explained by air-sea interaction.
5.3 Modifications caused by mixing with Arctic water masses
If not caused by atmospheric forcing, mixing with colder and less saline water masses of Arctic origin is a likely explanation for the change in the Atlantic water during the IFR crossing. Overflow of Arctic water across the IFR is a well established process although the process is intermittent both in space and time (e.g., Tait, 1967; Meincke, 1972; Beaird et al., 2013). Some of this water has been produced remotely (e.g., Hansen and Østerhus, 2000), but Arctic water masses also sink in the Iceland-Faroe Front and follow the bottom below the Atlantic water (Meincke, 1978) or subduct from the surface layer of the Iceland-Faroe Front and intrude into the Atlantic water (Beaird et al., 2016). Arctic water masses also cross the front in eddies (Hansen and Meincke, 1979; de Marez et al., 2025). These processes are responsible for both vertical and horizontal mixing between the water masses. The relative importance of these processes is beyond the scope of this work. We focus on the overall impact of the mixing.
5.3.1 Localization of the modifications over the IFR
To examine the water mass transformation across the IFR we analyse Conductivity Temperature Depth (CTD) data from the northeastern Iceland Basin and the IFR region. The CTD profiles were divided into three regions: (i) Upstream of the IFR; (ii) the flank of the IFR towards the Iceland Basin; (iii) the ridge crest of the IFR (Fig. 9a). Mean temperature and salinity profiles for each of these regions are shown in Fig. 9b, c and the individual profiles are shown in the Supplement Fig. S5. The differences between the mean temperature and salinity profiles for the three areas are largest at depth and decreasing towards the surface. This indicates that the deepest part of the water column is modified the most. It also appears that most of the change has already occurred when the Atlantic water has reached the ridge crest (blue curves in Fig. 9b, c). Standard station N05, which is north of the Atlantic water core on the N-section (Fig. 7), is further modified. In contrast, stations N03 and N04 over the Faroe slope are less modified, indicating a more direct route.
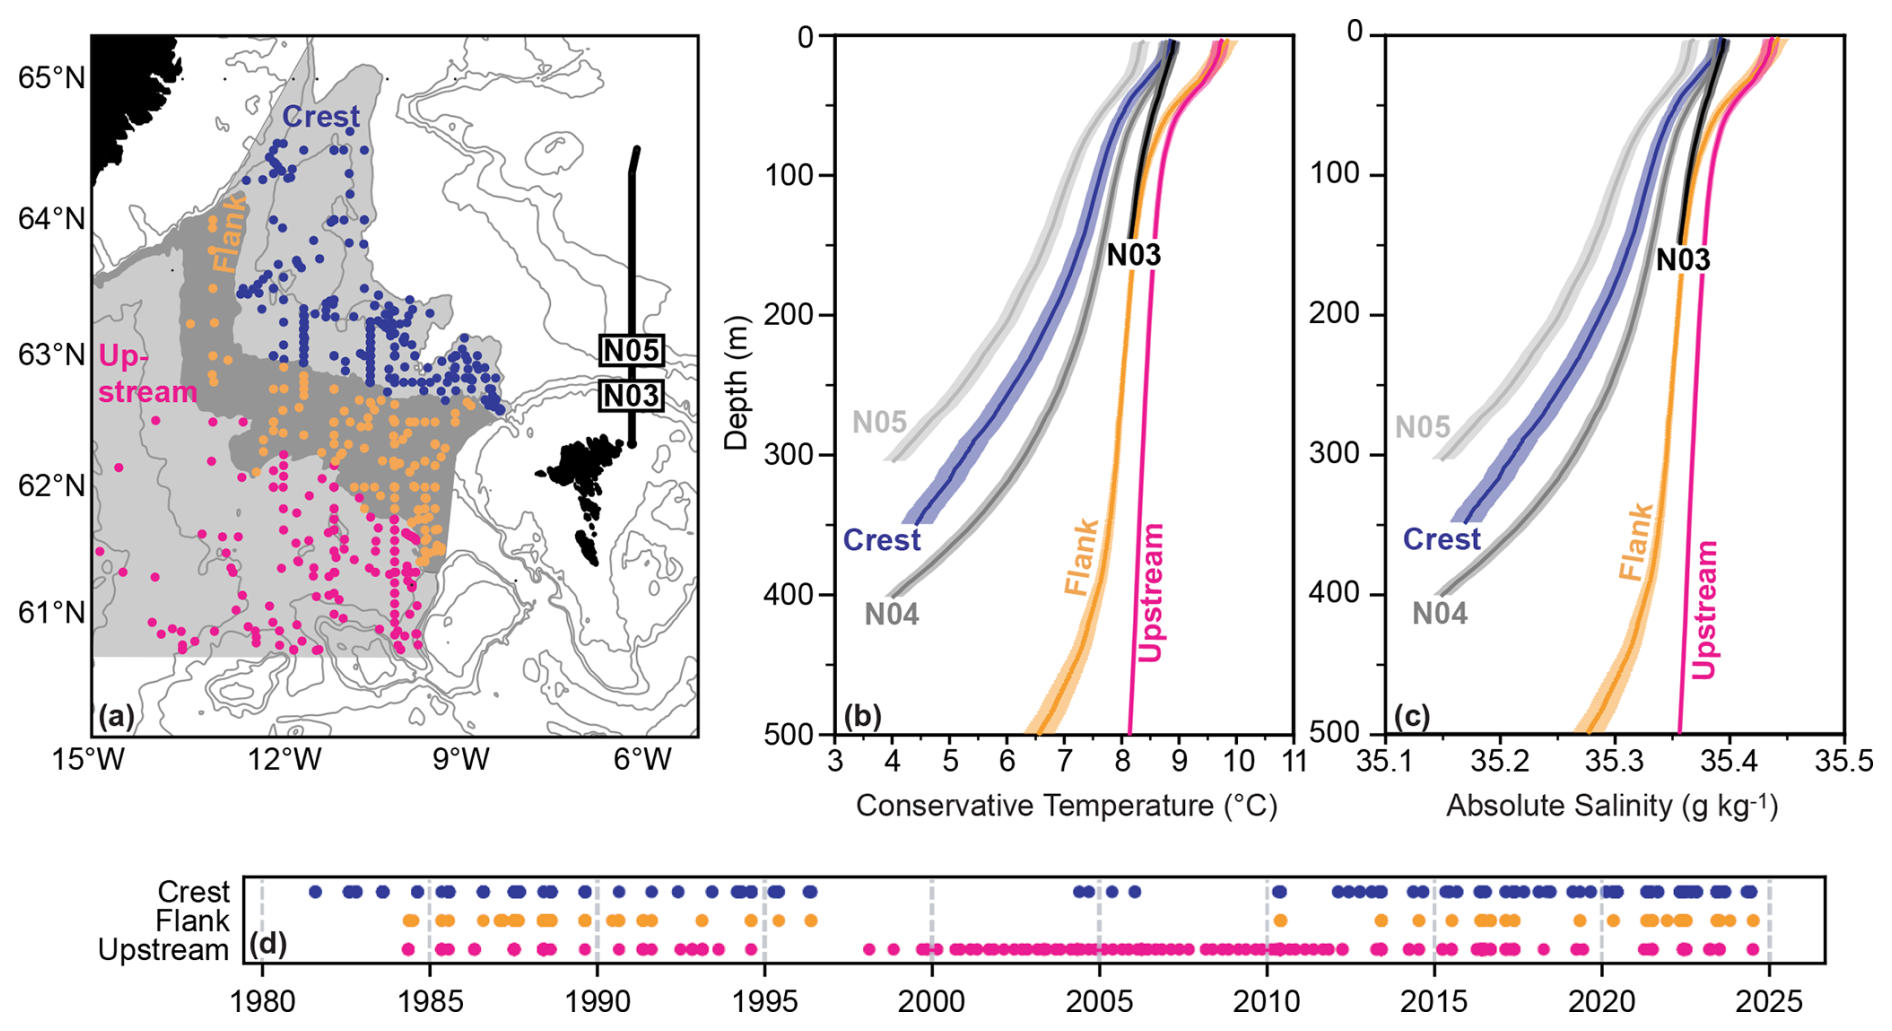
Figure 9(a) The CTD profiles in the IFR area were divided into three regions: (i) Upstream of the IFR (magenta). This region is in the Iceland Basin from 60.7° N and north to the 1000 m isobath and west of 9.6 to 15° W. There are 209 CTD casts in this region. (ii) The flank of the IFR (orange). This is from the 1000 m isobath to the 500 m isobath in the Iceland Basin. Here there are 139 CTD casts. (iii) The ridge crest (blue). This region is from the 500 m isobath in the Iceland Basin to the 500 m isobath in the Norwegian Sea, with 330 CTD casts. CTD stations are shown with a dot. The area borders are shown with grey shading. The N-section is shown with a thick black line north of the Faroes and two standard CTD stations N03 and N05 are indicated. Thin grey lines show bottom contours for 200, 400, 500, 1000, 1500 and 2000 m. Mean temperature (b) and salinity (c) profiles for the three regions in (a). Semi-transparent areas around each profile show the average ±1 standard error. Upstream and on the flank, only CTD casts that are at least 500 m deep were included. On the crest, only casts that are at least 350 m were included. The profiles for the three standard stations on the N-section N03, N04 and N05 are also shown down to the depth of the 4 °C isotherm, defined as the deep boundary of Atlantic water on the section (Hansen et al., 2023). (d) Time of observation for the profiles in the three regions.
In order to check if these results are biased considering the large time span and the variations in TIB and SIB, the analysis has been done for two subperiods (1984–1997 and 2010–2024) where the distribution of measurements in time is more regular in the three regions (Supplement Fig. S6). The conclusion is the same even though the later period is a little warmer and less saline than the first. Argo profiles show the same result although the data are sparse in the flank and ridge areas (Supplement Fig. S7).
For mixing in a specific region to affect the water column, the water has to spend sufficient time in the region. This may be investigated by drifter data. To identify spatial clustering in the drifter movements across the IFR, we analysed gridded drifter data. Our analyses reveal that the drifters spent a disproportionate amount of time over the upstream flank of the ridge, as shown in Fig. 10a. However, regions where drifters spend much time do not necessarily indicate high drifter concentration. Such patterns could also reflect low velocity of a few drifters in the area and therefore long periods in these bins. To obtain a more accurate representation of the drifter distribution across the IFR the number of individual drifters in each grid cell is included (Fig. 10b). A large number of individual drifters are observed on the upstream flank, indicating that the upstream flank is a common area for drifters to occupy.
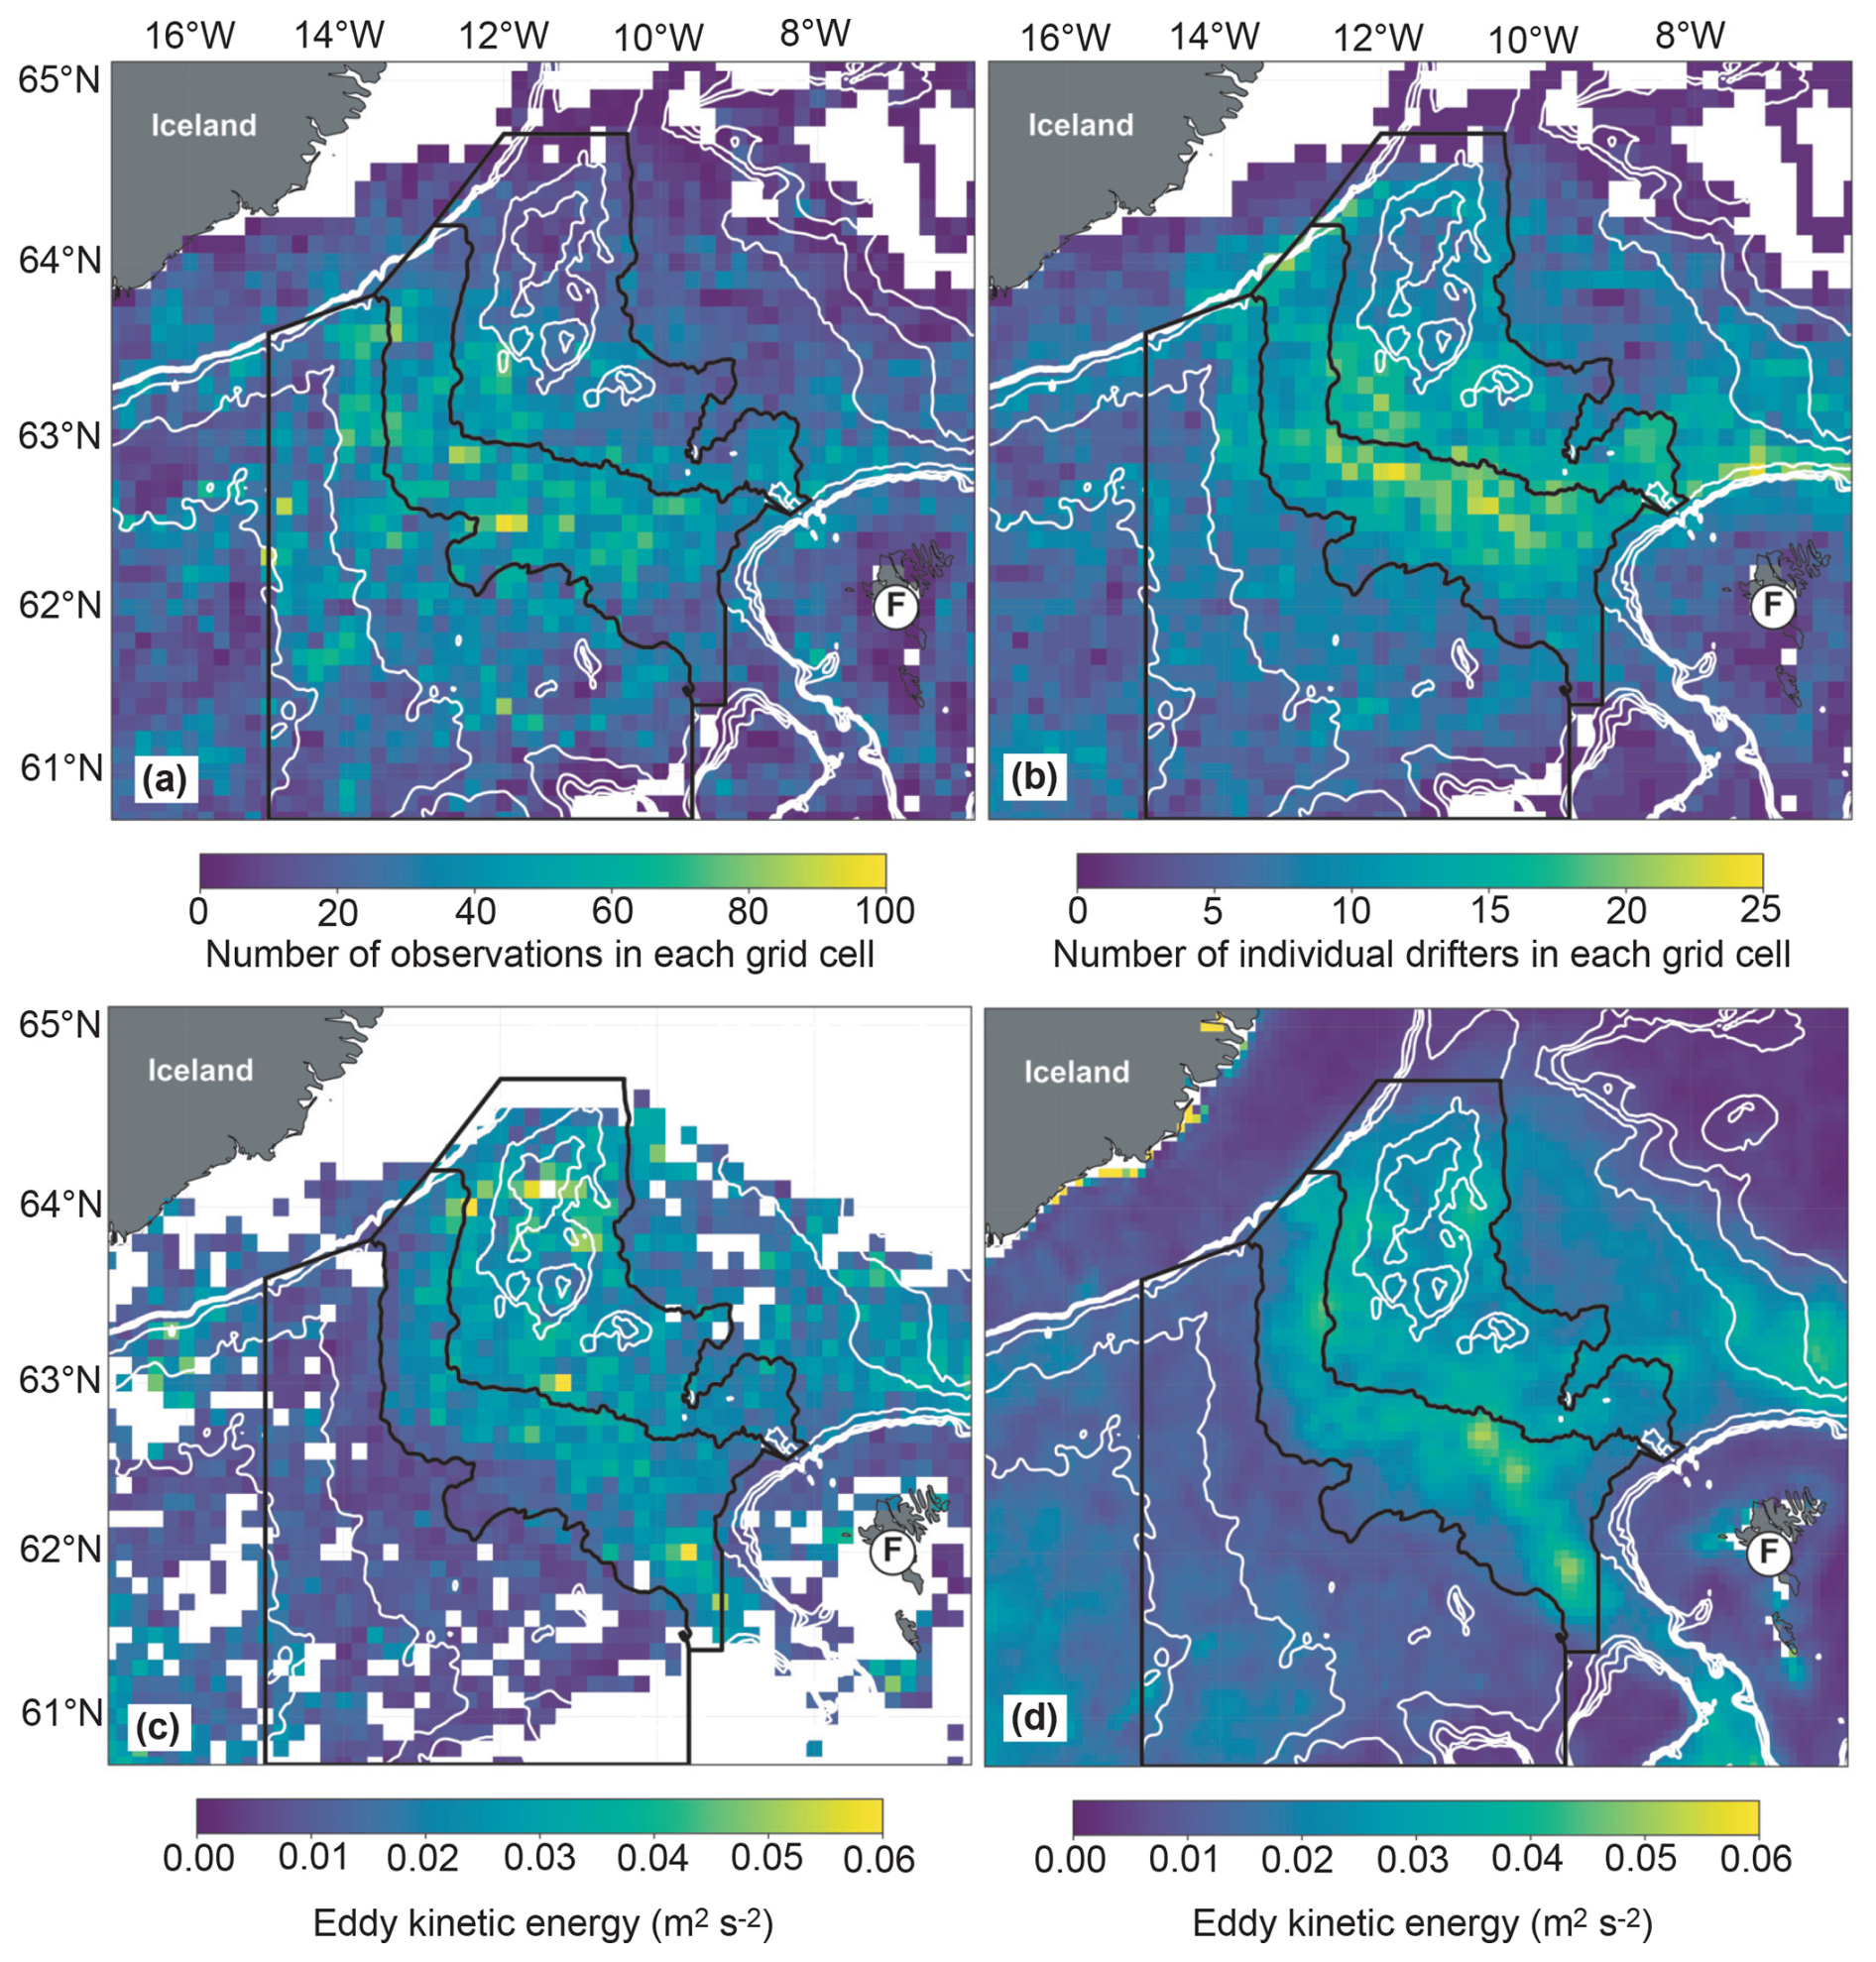
Figure 10(a) Number of 6-hourly observations in each grid cell by the 101 drifters crossing the IFR. (b) Number of individual drifters (unique drifter ID numbers) entering each grid cell. (c) Distribution of eddy kinetic energy for drifter data. The eddy kinetic energy is only shown for grid cells with at least 5 different drifters passing. (d) Distribution of eddy kinetic energy for SWOT data. Observations in each grid cell for the SWOT is in Supplement Fig. S8. The grid size for (a), (b) and (c) is 0.1 degrees latitude and 0.2 degrees longitude. The grid size used in (d) is 0.05° latitude and 0.1° longitude. The white lines on both maps show bottom contours for 300, 350, 400, 500, 1000, 1500 and 2000 m. Black lines show the same areas as in Fig. 9. An F in a white circle shows the Faroe Islands.
Figure 10a, b confirms that the satellite-tracked drifters that cross the IFR exhibited prolonged residence times on the upstream flank of the IFR. Together with a high level of eddy kinetic energy both for the drifters and also for SWOT data (Fig. 10c, d), this indicates enhanced mixing in this area and that the Atlantic water spends sufficient time over the upstream flank for the mixing to act.
Figure 9 demonstrates that the Atlantic water changes character from an almost barotropic (depth-independent) water column upstream of the ridge (upper 500 m) to a much more baroclinic water column on and downstream of the ridge. A possible explanation is that the barotropic current requires baroclinicity to cross the ridge. According to the Taylor-Proudman theorem (e.g., Cushman-Roisin, 1994), a barotropic water column is prevented from crossing isobaths under the geostrophic assumption, that is as long as friction can be ignored. Thus, the baroclinicity added by admixture of Arctic water at depth, as the water enters the IFR, is essential for enabling the crossing. This may also explain why the water spends an extended time over the flank, as baroclinic development must occur before crossing takes place.
5.3.2 Water masses that are admixed into the Atlantic water
Since most of the mixing occurs over the IFR, some of the cold low-salinity water admixed into the IF-inflow is likely to be the near-bottom water mass that is flowing towards the Iceland Basin on its way to become overflow water. Bottom temperature observations have documented that this overflow water is found all along the ridge crest although in variable concentrations (Jochumsen et al., 2016). Overflow is often defined as water having potential density anomaly 27.8 kg m−3 or above (Hansen and Østerhus, 2000). Over the upstream flank of the ridge, old (Meincke, 1972) as well as newer (e.g., Beaird et al., 2013; Jochumsen et al., 2016, Supplement Fig. S9) observations also show high concentrations of overflow water, again with a high variability.
Mixing between the warm, saline Atlantic water and the less saline, cold Arctic water masses is likely initiated on the upstream flank of the IFR, near the inflow-overflow interface. This interface lies close to the bottom on the flank and ascends downstream across the IFR. Both the initiation of mixing and the ascent of the interface are consistent with the average temperature and salinity profiles (Fig. 9).
Temperature-salinity (T-S) diagrams for the same three regions as in Fig. 9 are presented in Fig. 11. Upstream of the IFR in the Iceland Basin, the upper 500 m consist of warm and saline water of Atlantic origin, labelled IB (Fig. 11a). Over the IFR (Fig. 11b, c), the IB water has been joined by cold Norwegian Sea Arctic Intermediate Water (NSAIW) from intermediate depths in the Norwegian Sea, which is a clear indicator of overflow.
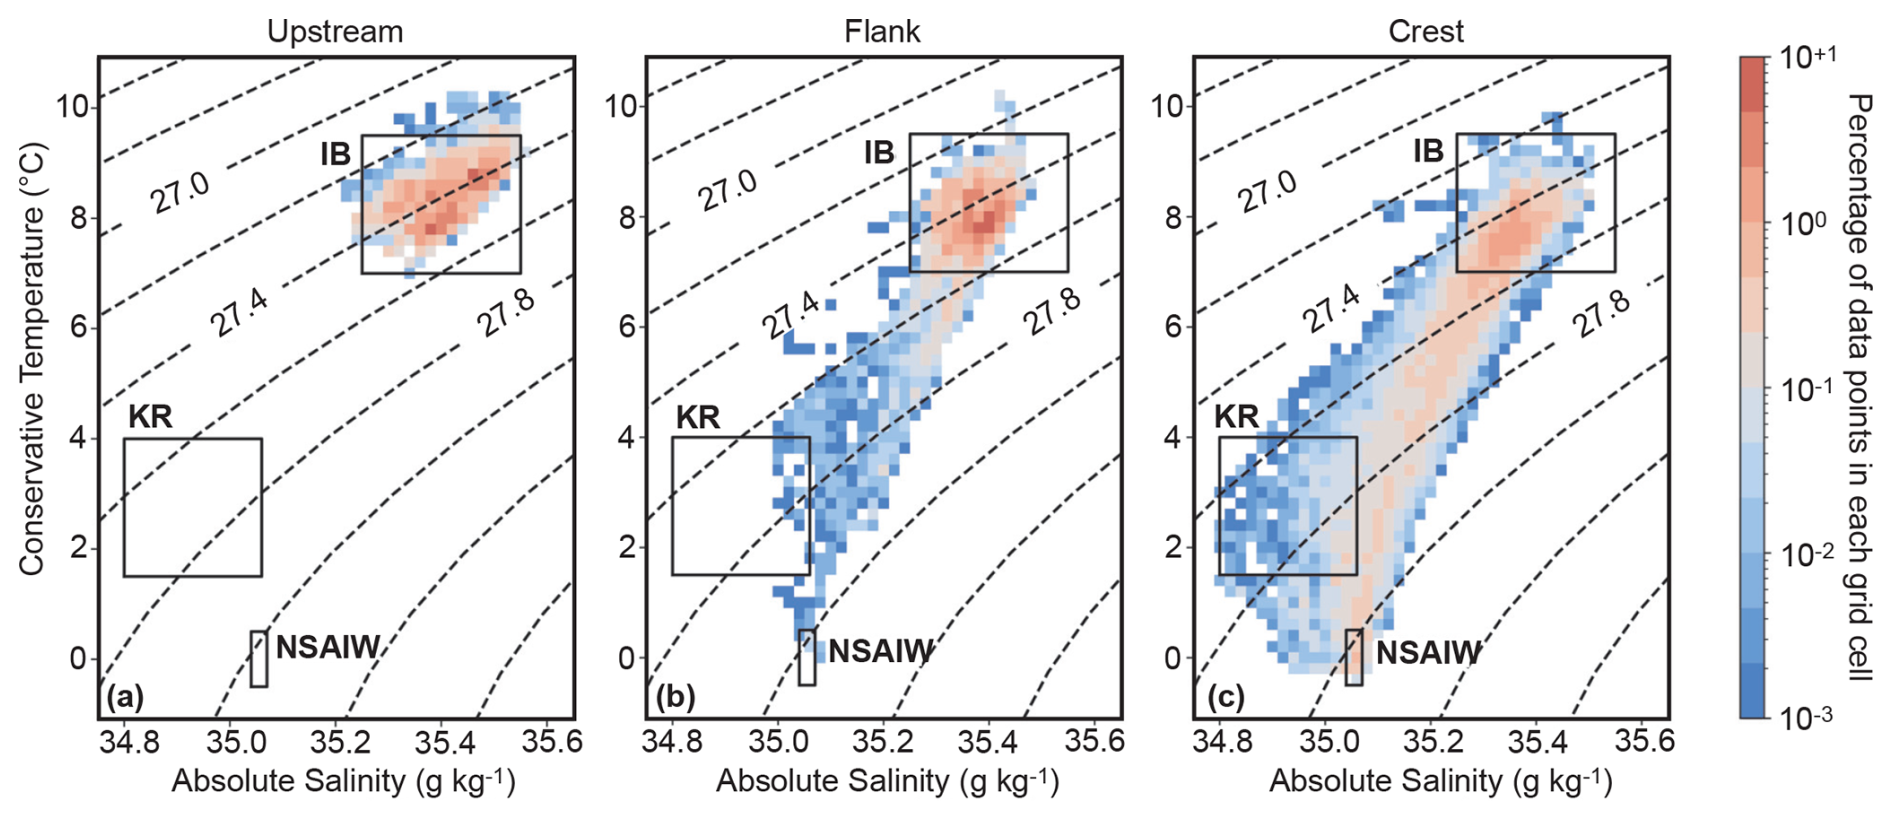
Figure 11T-S diagrams for the same three regions and the same CTD-profiles as in Fig. 9. (a) Upstream of the IFR (100–500 m depth). (b) The flank of the IFR towards the Iceland Basin (100–500 m depth). (c) The IFR crest (100–350 m depth or bottom). The uppermost 100 m are not shown due to the seasonal thermocline. The ranges of the IB, KR and NSAIW are shown with black boxes. The range of IB is found from the T-S diagram of the uppermost 500 m at stations V and I (Supplement Fig. S10a, b). The range of KR is found from the T-S diagram of the uppermost 100 m at the KR-section, stations KR2–KR6 (Supplement Fig. S10c). The range for NSAIW is adopted from Hansen and Østerhus (2000) with practical salinity converted to Absolute Salinity.
Between the IB and the NSAIW waters, there are indications of a third water mass of intermediate temperature and low salinity, which is especially prominent over the ridge crest (Fig. 11c). In Fig. 11, this water mass has been labelled KR, which refers to the Icelandic KR-section. The KR-section is located east-west at 65° N off the east coast of Iceland (Fig. 1) across the East Icelandic Current carrying the Arctic water that meets the Atlantic water in the Iceland-Faroe Front (Perkins et al., 1998). Average water mass characteristics on the KR-section are shown in Fig. 12.
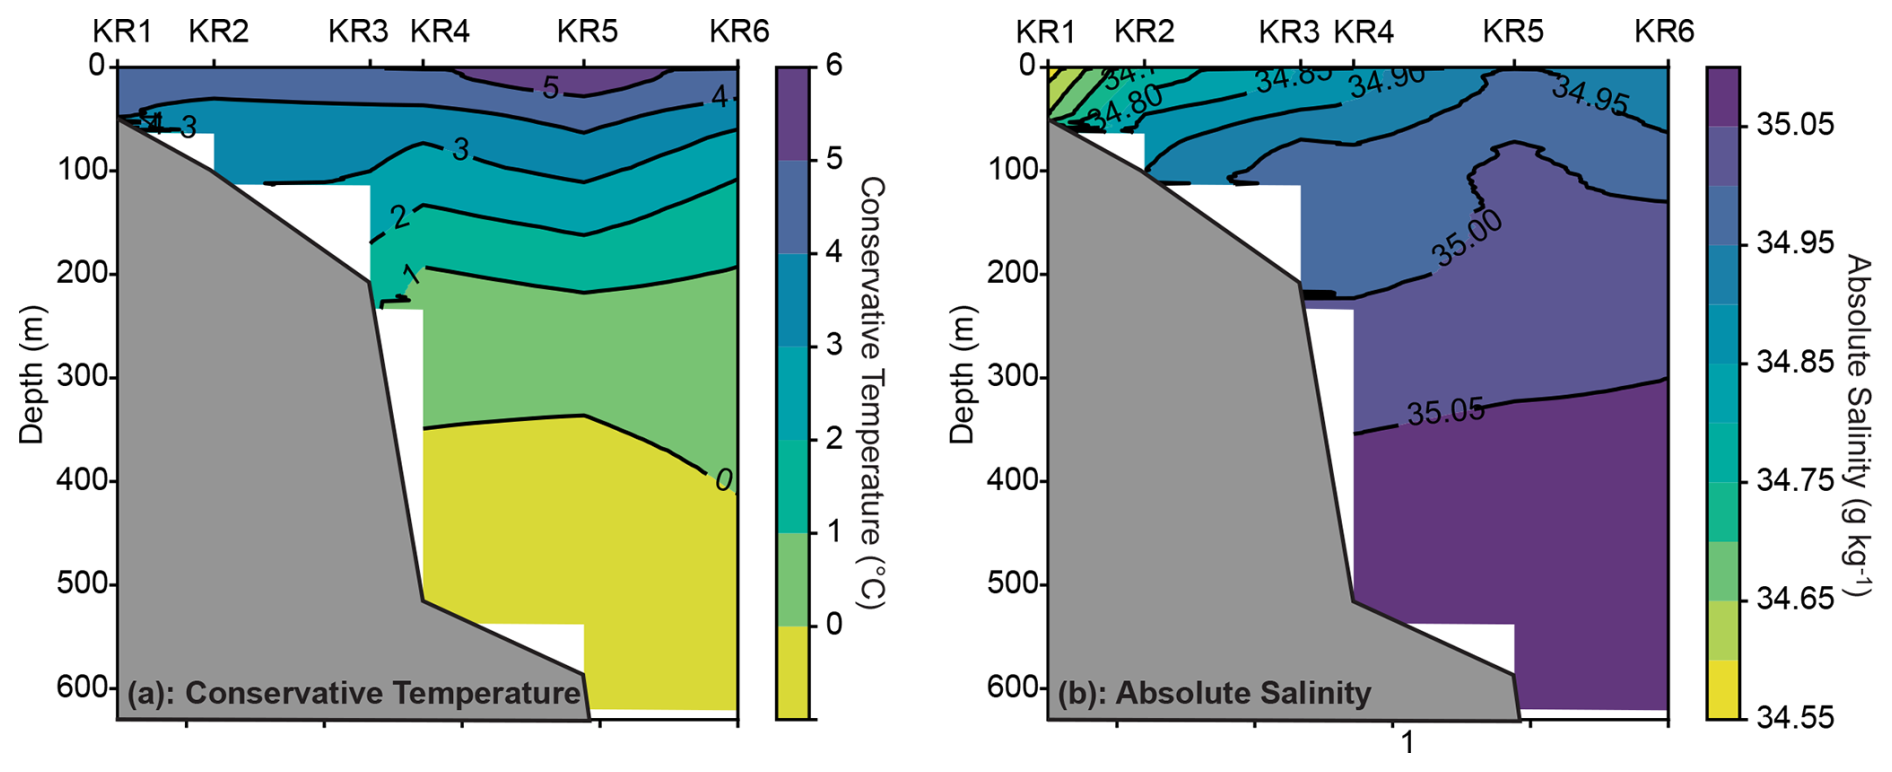
Figure 12The KR-section. Mean temperature (a) and salinity (b) for the period from 1993 to May 2024, based on 102 cruises where all 6 standard stations were occupied.
A detailed discussion of source waters and mixing processes is beyond the scope of this study, but we choose to use the 0–100 m depth layer on the KR-section for the intermediate low-salinity water mass. The reason for choosing this depth layer is that the Modified East Icelandic Water (MEIW), as described by Read and Pollard (1992), sinks from near-surface layers in the frontal zone. This water mass is formed as a mixture of Atlantic water and low-salinity water brought to the area by the East Icelandic Current. Fogelqvist et al. (2003) showed that the MEIW joins the overflow across the IFR. During this descent, it is modified by mixing and gains density, but remains less dense than the other, deeper sources of overflow water (Read and Pollard, 1992; Fogelqvist et al., 2003). Notably, Fogelqvist et al. (2003) found that MEIW represents most of the overflow across the IFR and is the uppermost overflow water, suggesting that mixing with MEIW is the main mechanism for modifying the Atlantic inflow across the IFR. Also, if deeper layers on the KR-section were included, they would more or less fall on the mixing line between the KR square and the NSAIW square in Fig. 11.
To a first approximation, it therefore seems likely that the 0–100 m depth layer at KR2–KR6 represents the water mass that is admixed into the IF-inflow, causing it to cool and freshen. To test this hypothesis, we calculate the ratio of this water mass to the water mass at IB that mixed together give the same properties as the water at the N-section each year. For the 1995–2015 period, a mean ratio of 23 % KR-water to 77 % IB-water fits the data (Supplement Fig. S11) for both temperature and salinity. Before 1995 and after 2015, temperature and salinity data give different mixing ratios. Choosing a 0–200 m depth interval on the KR-section instead of 0–100 m gives similar results with a slightly different mixing ratio (not shown). This discrepancy indicates that the picture of a mixture between two water masses in a fixed ratio is too simple even though it explains the results through most of the period (Fig. 13).
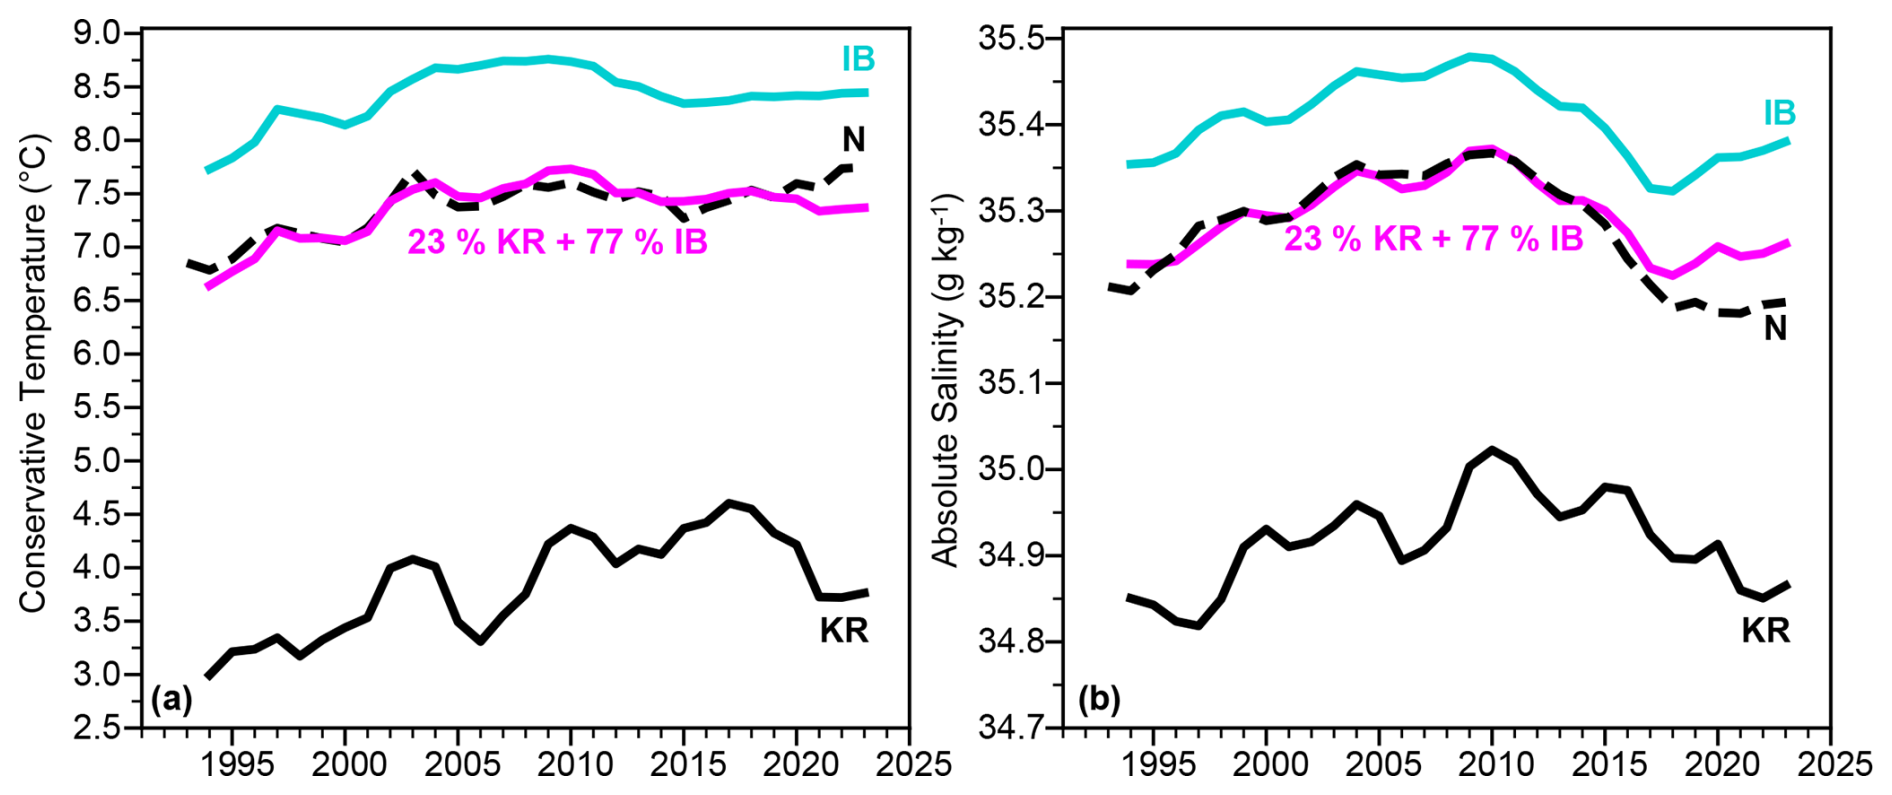
Figure 13The effect of Atlantic-Arctic water mixing on temperature (a) and salinity (b). The continuous black curves are 3 year running mean of the water from the surface to 100 m depth for the KR-section (KR). The cyan curves show the 3 year running mean of the 500 m layer of Atlantic water just before reaching the IFR (TIB and SIB as in Fig. 8). The dashed black curves show annual values for transport-weighted temperature and salinity on the N-section updated from Hansen et al. (2023) (N as in Fig. 6c, d). The magenta curves are the result when combining the KR series (black) with the Iceland Basin series (cyan) in a 23 % to 77 % ratio.
The time series of the annually averaged volume transport and heat transport relative to 0 °C carried by the IF-inflow through the N-section presented in Hansen et al. (2023) were extended two years (Fig. 14 and Table 2). From 1993 to 2023, the volume transport of the IF-inflow increased by 12±7 %, while the heat transport relative to 0 °C increased by 16±8 %. Compared to the former time series (Hansen at al., 2023) the trends are now higher and more significant in the extended time series. The change compared to the average value is higher for relative heat transport due to the fact that the temperature (Fig. 6c) as well as the volume transport has increased.
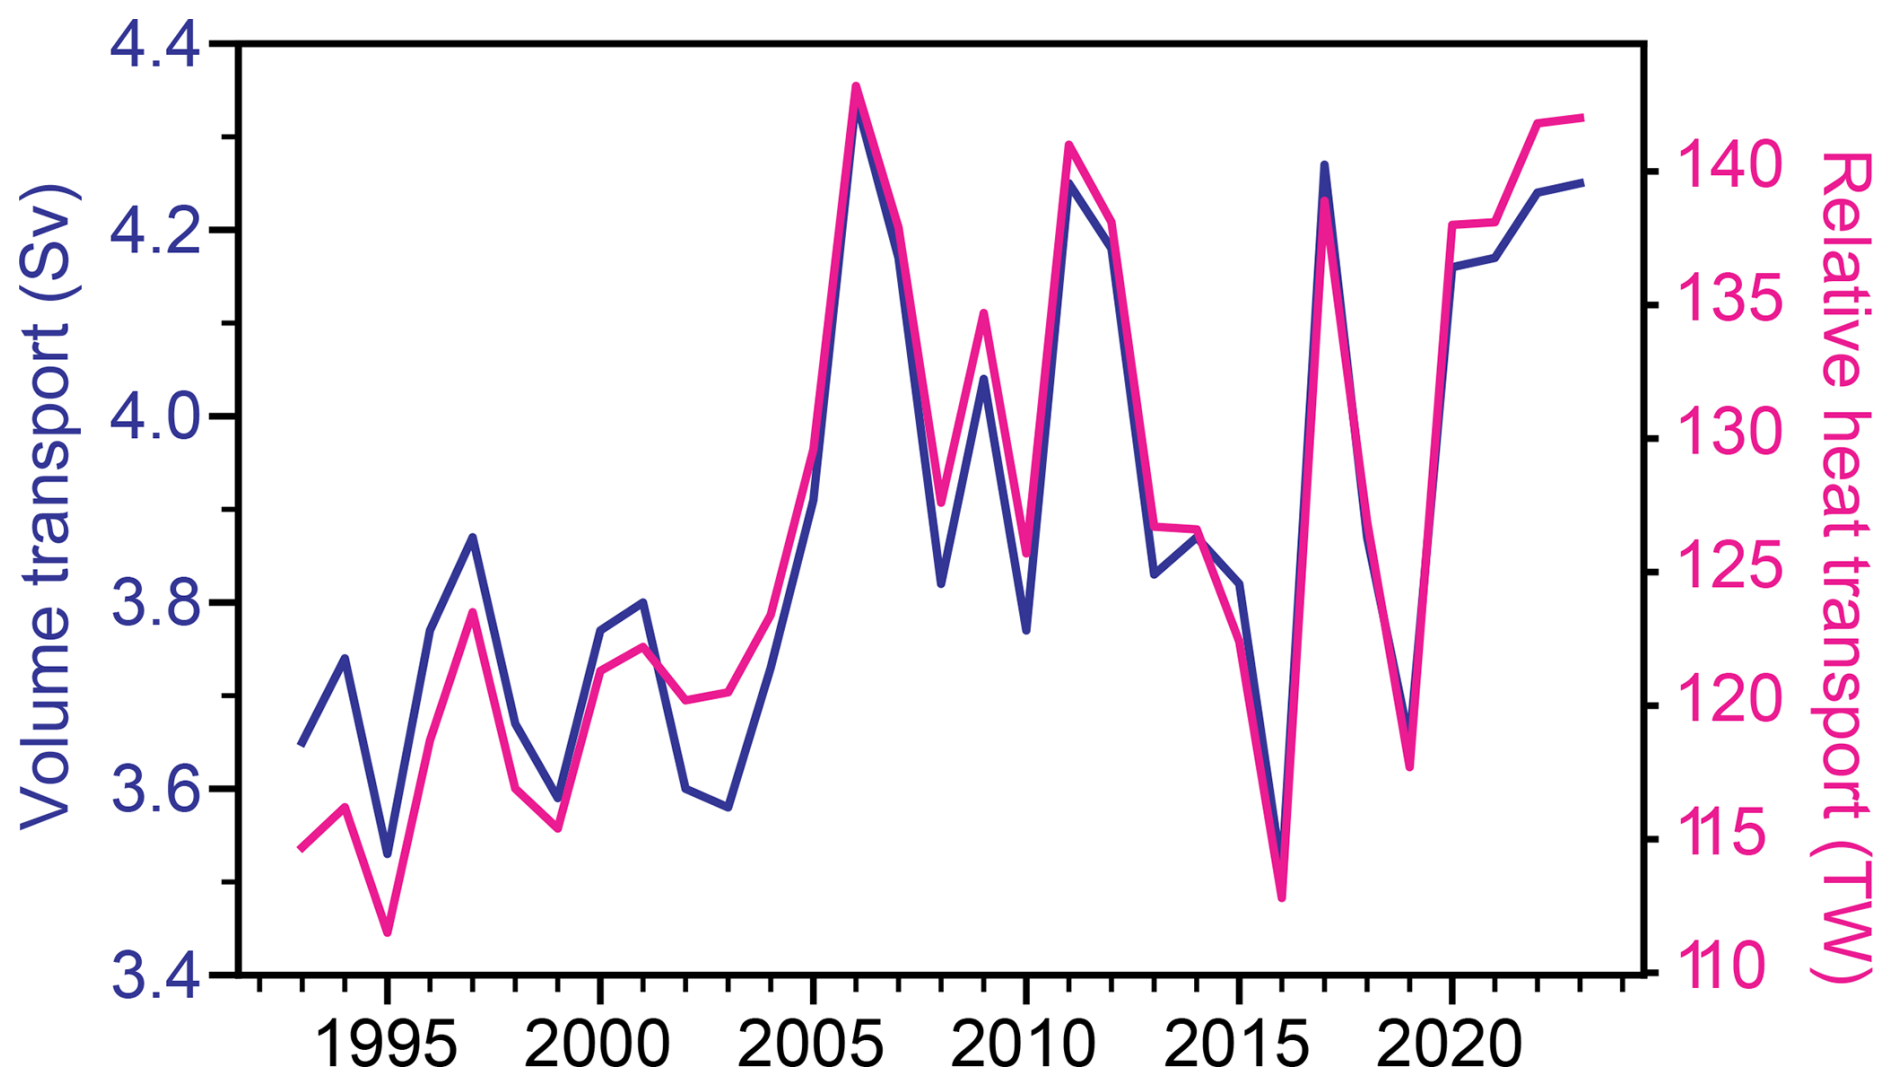
Figure 14Annually averaged volume transport (blue) and relative heat transport (magenta) across the N-section. The heat transport is relative to a temperature of 0 °C. TW is 1012 W.
Table 2Characteristics of the two transport time series of IF-inflow through the N-section (Fig. 14). Uncertainty estimates for the average values are based on Hansen et al. (2015). The trends are listed with 95 % confidence intervals. “Change” indicates the relative (to average) change through the 1993–2023 period. TW is 1012 W.

The IF-inflow is part of the northernmost limb of the AMOC but rather than weakening, as projected for the AMOC at lower latitudes, it has been strengthening. When the sea ice melts, the ocean underneath the ice comes into direct contact with the air and is cooled, enhancing deep-water formation. The result is that even though ventilation decreases in the Nordic Seas, it is strengthened in the Barents Sea and the Arctic Ocean, such that the transport across the Greenland-Scotland Ridge remains stable or strengthens. This process seems already to have been initiated (Årthun et al., 2025) and is consistent with the updated time-series.
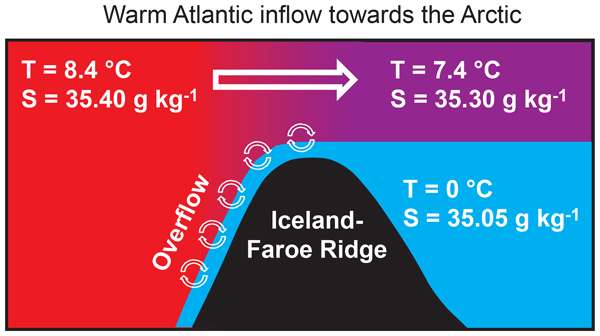
According to Table 1, the temperature of the Atlantic water is reduced from 8.40 to 7.37 °C by crossing the IFR, and we have concluded that most of this is due to mixing with Arctic water over the IFR. It would be tempting to conclude that the heat transport relative to 0 °C has been similarly reduced by this mixing process, which would mean a reduction of around 10 %. That would, however, require that the volume transport is not affected in a compensatory manner. The amount of cooling is likely linked to the amount of Arctic water over the ridge and to the overflow across the ridge, but according to Hansen et al. (2010) and Olsen et al. (2016), the volume transport of the IF-inflow is also linked to the overflow. Conclusions as to the effect of mixing with colder Arctic waters on the heat transport would therefore be premature at this stage.
The main aim of this study was to explain the temperature and salinity of the IF-inflow as it passes through the monitoring N-section and continues further into the Arctic Mediterranean. Our results indicate three main controlling processes: (i) variations of the SPG intrusion into the Iceland Basin, (ii) general warming of the oceans, (iii) water mass modification during the crossing of the IFR. Air-Sea interaction over the IFR only has a small effect on the water mass modifications.
We find that the long-term salinity variations of the water approaching the IFR to a large extent may be seen as a lagged response to the variable intrusion of the SPG into the Iceland Basin. The temperature of the approaching water is also affected by SPG intrusion but warming source waters have induced additional temperature increases.
SPG-intrusion and the general warming of the oceans, thus, have controlled the long-term variations of the properties of the water approaching the IFR and these variations are to a large extent propagated across the IFR so that they also have controlled the long-term variations of transport-weighted temperature and salinity of the IF-inflow into the Arctic Mediterranean on decadal time scales. The average values for temperature and salinity are, however, strongly modified as the water crosses the ridge with a cooling of at least 1 °C and a freshening of more than 0.1 g kg−1. These modifications are primarily caused by admixture of cold low-salinity water of Arctic origin into the Atlantic water mass. Without any detailed analysis of source waters and processes, we find the resulting water mass passing into the Arctic Mediterranean may be seen as a mixture of original Atlantic water from west of the ridge and water from the upper 100 m east of Iceland in an approximate 3 to 1 ratio.
Our results have some important implications. They show that this branch of the AMOC has actually strengthened slightly over the observational period and there are – in contrast to a projected AMOC decline – no signs of a weakening.
The cross-ridge freshening of the IF-inflow implies a reduced potential for dense-water formation downstream. The deep waters of the Arctic Mediterranean have salinities around 35.05 g kg−1. Before crossing the IFR, the Atlantic water has salinities that are 0.35–0.45 g kg−1 above this. After crossing, this difference has been reduced by 0.1 g kg−1. Since the density at low temperature is strongly dependent on salinity, this reduction impacts the potential for increasing the density of the IF-inflow waters to levels approaching the deep-water density. This also affects the relative importance of the two main inflow branches as regards dense-water formation. Already before crossing the IFR, the IF-inflow has lower average salinities than the inflow through the Faroe-Shetland Channel and therefore lower potential for dense-water formation. After crossing, the salinity difference between the two inflow branches has increased.
Understanding the processes controlling the properties of Atlantic water that enters the Nordic Seas is important for validating and improving ocean and climate models as a whole. As such, our study indirectly strengthens the ability to produce more realistic forecasts of AMOC related changes in a warming climate.
Python, Matlab and Fortran have been used to analyze the data and create the figures. This code is available from the corresponding author upon request.
The satellite-tracked drifter data from the Global Drifter Program are available from NOAA (https://erddap.aoml.noaa.gov/gdp/erddap/tabledap/drifter_6hour_qc.html, last access: 14 January 2026). The CTD observations used in the study and the updated time series in Fig. 15 are available from https://envofar.fo/index.php?page=climate (last access: 4 August 2026). The altimetry product SEALEVEL_GLO_PHY_L4_MY_008_047 were available from Copernicus Marine Environment Monitoring Service (http://marine.copernicus.eu, last access: 23 April 2025). This product has been replaced by a new product with different resolution. The OSTIA sea surface temperature is available from Copernicus Marine Environment Monitoring Service, METOFFICE-GLO-SST-L4-REP-OBS-SST (https://doi.org/10.48670/moi-00168). The Argo data are available from Euro-Argo ERIC (https://dataselection.euro-argo.eu/, last access: 24 March 2026). The Roemmich-Gilson Argo Climatology is available from The University California San Diego (https://sio-argo.ucsd.edu/RG_ Climatology.html, last access: 24 March 2026). The SWOT data (SWOT Level-3 KaRIn Low Rate SSH Expert (v3.0), https://doi.org/10.24400/527896/A01-2023.018) are available from AVISO (https://www.aviso.altimetry.fr, last access: 4 August 2026).
The supplement related to this article is available online at https://doi.org/10.5194/os-22-2405-2026-supplement.
GE coordinated and performed most of the analysis and manuscript writing. BH assisted with analysis and writing. KMHL and SRÓ provided data and assisted with writing. SMO and AMUG assisted with writing.
The contact author has declared that none of the authors has any competing interests.
Publisher's note: Copernicus Publications remains neutral with regard to jurisdictional claims made in the text, published maps, institutional affiliations, or any other geographical representation in this paper. The authors bear the ultimate responsibility for providing appropriate place names. Views expressed in the text are those of the authors and do not necessarily reflect the views of the publisher.
We thank all scientific and technical staff as well as captain and crew on all research vessels who performed the hydrographic observations and deployed the drifters. Likewise, we thank colleagues at FAMRI for all kind of support while performing this research and writing the paper. Thanks to Ilana Schiller-Weiss for comments on the draft manuscript. Sólvá K. Eliasen kindly provided the SST map in Fig. 1. The observations at the N-section have been supported by the Danish Ministry of Climate, Energy and Utilities through its climate support program to the Arctic.
This research is part of the Faroe-AMOC project (https://www.pure.fo/en/projects/, last access: 4 August 2026), which received funding from the National Centre for Climate Research (NCKF – hosted at the Danish Meteorological Institute) and the Research Council Faroe Islands. KMHL and SMO are supported by Ocean observations and indicators for climate and assessments, ObsSea4Clim, Grant agreement ID: 101136548 (https://doi.org/10.3030/101136548), internal contribution Nr. 42.
This paper was edited by Sjoerd Groeskamp and reviewed by two anonymous referees.
Argo: Argo float data and metadata from Global Data Assembly Centre (Argo GDAC), SEANOE, https://doi.org/10.17882/42182, 2026.
Arias, P. A., Bellouin, N., Coppola, E., Jones, R. G., Krinner, G., Marotzke, J., Naik, V., Palmer, M. D., Plattner, G.-K., Rogelj, J., Rojas, M., Sillmann, J., Storelvmo, T., Thorne, P. W., Trewin, B., Achuta Rao, K., Adhikary, B., Allan, R. P., Armour, K., Bala, G., Barimalala, R., Berger, S., Canadell, J. G., Cassou, C., Cherchi, A., Collins, W., Collins, W. D., Connors, S. L., Corti, S., Cruz, F., Dentener, F. J., Dereczynski, C., Di Luca, A., Diongue Niang, A., Doblas-Reyes, F. J., Dosio, A., Douville, H., Engelbrecht, F., Eyring, V., Fischer, E., Forster, P., Fox-Kemper, B., Fuglestvedt, J. S., Fyfe, J. C., Gillett, N. P., Goldfarb, L., Gorodetskaya, I., Gutierrez, J. M., Hamdi, R., Hawkins, E., Hewitt, H. T., Hope, P., Islam, A. S., Jones, C., Kaufman, D. S., Kopp, R. E., Kosaka, Y., Kossin, J., Krakovska, S., Lee, J.-Y., Li, J., Mauritsen, T., Maycock, T. K., Meinshausen, M., Min, S.-K., Monteiro, P. M. S., Ngo-Duc, T., Otto, F., Pinto, I., Pirani, A., Raghavan, K., Ranasinghe, R., Ruane, A. C., Ruiz, L., Sallée, J.-B., Samset, B. H., Sathyendranath, S., Seneviratne, S. I., Sörensson, A. A., Szopa, S., Takayabu, I., Tréguier, A.-M., van den Hurk, B., Vautard, R., von Schuckmann, K., Zaehle, S., Zhang, X., and Zickfeld, K.: Technical Summary, in: Climate Change 2021: The Physical Science Basis, Contribution of Working Group I to the Sixth Assessment Report of the Intergovernmental Panel on Climate Change, edited by: Masson-Delmotte, V., Zhai, P., Pirani, A., Connors, S. L., Péan, C., Berger, S., Caud, N., Chen, Y., Goldfarb, Z., Gomis, M. I., Huang, M., Leitzell, K., Lonnoy, E., Matthews, J. B. R., Maycock, T. K., Waterfield, T., Yelekçi, O., Yu, R., and Zhou, B., Cambridge University Press, Cambridge, United Kingdom and New York, NY, USA, 33–144, https://doi.org/10.1017/9781009157896.002, 2021.
Årthun, M., Eldevik, T., Viste, E., Drange, H., Furevik, T., Johnson, H. L., and Keenlyside, N. S.: Skillful prediction of northern climate provided by the ocean, Nat. Commun., 8, https://doi.org/10.1038/NCOMMS15875, 2017.
Årthun, M., Brakstad, A., Dörr, J., Johnson, H. L., Mans, C., Semper, S., and Våge, K.: Atlantification drives recent strengthening of the Arctic overturning circulation, Sci. Adv., 11, eadu1794, https://doi.org/10.1126/SCIADV.ADU1794, 2025.
Beaird, N. L., Rhines, P. B., and Eriksen, C. C.: Overflow waters at the Iceland-Faroe Ridge observed in multiyear seaglider surveys, J. Phys. Oceanogr., 43, 2334–2351, https://doi.org/10.1175/JPO-D-13-029.1, 2013.
Beaird, N. L., Rhines, P. B., and Eriksen, C. C.: Observations of seasonal subduction at the Iceland-Faroe Front, J. Geophys. Res.-Oceans, 121, 4026–4040, https://doi.org/10.1002/2015JC011501, 2016.
Biri, S. and Klein, B.: North Atlantic Sub-Polar Gyre Climate Index: A New Approach, J. Geophys. Res.-Oceans, 124, 4222–4237, https://doi.org/10.1029/2018JC014822, 2019.
Brambilla, E. and Talley, L. D.: Surface drifter exchange between the North Atlantic subtropical and subpolar gyres, J. Geophys. Res.-Oceans, 111, https://doi.org/10.1029/2005JC003146, 2006.
Buckley, M. W. and Marshall, J.: Observations, inferences, and mechanisms of the Atlantic Meridional Overturning Circulation: A review, Rev. Geophys., 54, 5–63, https://doi.org/10.1002/2015RG000493, 2016.
Childers, K. H., Flagg, C. N., and Rossby, T.: Direct velocity observations of volume flux between Iceland and the Shetland Islands, J. Geophys. Res.-Oceans, 119, 5934–5944, https://doi.org/10.1002/2014JC009946, 2014.
Childers, K. H., Flagg, C. N., Rossby, T., and Schrum, C.: Directly measured currents and estimated transport pathways of Atlantic Water between 59.58N and the Iceland-Faroes-Scotland Ridge, Tellus A, 67, 28067, https://doi.org/10.3402/tellusa.v67.28067, 2015.
Cushman-Roisin, B.: Introduction to Geophysical Fluid Dynamics, Prentice-Hall, Inc., New Jersey, ISBN 0-13-353301-8, 1994.
de Marez, C., Ruiz-Angulo, A., and Gula, J.: Mesoscale Induced Vertical Fluxes Over the Iceland-Faroe Ridge, Geophys. Res. Lett., 52, https://doi.org/10.1029/2025GL115520, 2025.
Dickson, R. R. and Brown, J.: The production of North Atlantic deep water, sources, rates, and pathways, J. Geophys. Res., 99, 12319–12341, https://doi.org/10.1029/94JC00530, 1994.
Fogelqvist, E., Blindheim, J., Tanhua, T., Østerhus, S., Buch, E., and Rey, F.: Greenland–Scotland overflow studied by hydro-chemical multivariate analysis, Deep-Sea Res. Pt. I, 50, 73–102, https://doi.org/10.1016/S0967-0637(02)00131-0, 2003.
Foukal, N. P. and Lozier, M. S.: Assessing variability in the size and strength of the North Atlantic subpolar gyre, J. Geophys. Res.-Oceans, 122, 6295–6308, https://doi.org/10.1002/2017JC012798, 2017.
Geyer, F., Østerhus, S., Hansen, B., and Quadfasel, D.: Observations of highly regular oscillations in the overflow plume downstream of the Faroe Bank Channel, J. Geophys. Res., 111, C12020, https://doi.org/10.1029/2006JC003693, 2006.
González-Pola, C., Larsen, K. M. H., Fratantoni, P., and Beszczynska-Möller, A. (Eds.): ICES Report on ocean climate 2020, ICES Cooperative Research Reports, 356, 121, https://doi.org/10.17895/ices.pub.19248602, 2022.
Häkkinen, S. and Rhines, P. B.: Decline of Subpolar North Atlantic Circulation during the 1990s, Science, 304, 555–559, https://doi.org/10.1126/SCIENCE.1094917, 2004.
Hansen, B. and Meincke, J.: Eddies and meanders in the Iceland-Faroe Ridge area, Deep-Sea Res. Pt. A., 26, 1067–1082, https://doi.org/10.1016/0198-0149(79)90048-7, 1979.
Hansen, B. and Østerhus, S.: North Atlantic-Nordic Seas exchanges, Prog. Oceanogr., 45, 109–208, https://doi.org/10.1016/S0079-6611(99)00052-X, 2000.
Hansen, B., Østerhus, S., Hátún, H., Kristiansen, R., and Larsen, K. M. H.: The Iceland-Faroe inflow of Atlantic water to the Nordic Seas, Prog. Oceanogr., 59, 4, 443–474, https://doi.org/10.1016/j.pocean.2003.10.003, 2003.
Hansen, B., Hátún, H., Kristiansen, R., Olsen, S. M., and Østerhus, S.: Stability and forcing of the Iceland-Faroe inflow of water, heat, and salt to the Arctic, Ocean Sci., 6, 1013–1026, https://doi.org/10.5194/os-6-1013-2010, 2010.
Hansen, B., Larsen, K. M. H., Hátún, H., Kristiansen, R., Mortensen, E., and Østerhus, S.: Transport of volume, heat, and salt towards the Arctic in the Faroe Current 1993–2013, Ocean Sci., 11, 743–757, https://doi.org/10.5194/os-11-743-2015, 2015.
Hansen, B., Larsen, K. M. H., Hátún, H., Olsen, S. M., Gierisch, A. M. U., Østerhus, S., and Ólafsdóttir, S. R.: The Iceland–Faroe warm-water flow towards the Arctic estimated from satellite altimetry and in situ observations, Ocean Sci., 19, 1225–1252, https://doi.org/10.5194/os-19-1225-2023, 2023.
Hátún, H. and Chafik, L.: On the Recent Ambiguity of the North Atlantic Subpolar Gyre Index, J. Geophys. Res.-Oceans, 123, 5072–5076, https://doi.org/10.1029/2018JC014101, 2018.
Hátún, H., Sande, A. B., Drange, H., Hansen, B., and Valdimarsson, H.: Influence of the Atlantic Subpolar Gyre on the Thermohaline Circulation, Science, 309, 1841–1844, https://doi.org/10.1126/SCIENCE.1114777, 2005.
Jakobsen, P. K., Ribergaard, M. H., Quadfasel, D., Schmith, T., and Hughes, C. W.: Near-surface circulation in the northern North Atlantic as inferred from Lagrangian drifters: Variability from the mesoscale to interannual, J. Geophys. Res, 108, 3251, https://doi.org/10.1029/2002JC001554, 2003.
Jochumsen, K., Schnurr, S. M., and Quadfasel, D.: Bottom temperature and salinity distribution and its variability around Iceland, Deep-Sea Res. Pt. I, 111, 79–90, https://doi.org/10.1016/J.DSR.2016.02.009, 2016.
Knudsen, M.: Den Danske Ingolf-expedition, Bianco Lunos Kgl Hof-Bogtrykkeri (F. Dreyer), København, 1, 21–154, https://hdl.handle.net/2027/uc1.31210011308259 (last access: 4 August 2026), 1898.
Koman, G., Johns, W. E., Houk, A., Houpert, L., and Li, F.: Circulation and overturning in the eastern North Atlantic subpolar gyre, Prog. Oceanogr., 208, 102884, https://doi.org/10.1016/j.pocean.2022.102884, 2022.
Larsen, K. M. H., Hátún, H., Hansen, B., and Kristiansen, R.: Atlantic water in the Faroe area: sources and variability, ICES J. Mar. Sci., 69, 802–808, https://doi.org/10.1093/icesjms/fss028, 2012.
Meincke, J.: The hydrographic section along the Iceland–Faroe Ridge carried out by R.V. “Anton Dohrn” in 1959–1971, Berichte der Deutschen Wissenschaftlichen Kommission für Meeresforschung, 22, 372–384, 1972.
Meincke, J.: On the distribution of low salinity intermediate waters around the Faroes, Deutsche Hydrographische Zeitschrift, 31, 50–64, https://doi.org/10.1007/BF02226000, 1978.
Mulet, S., Rio, M.-H., Etienne, H., Artana, C., Cancet, M., Dibarboure, G., Feng, H., Husson, R., Picot, N., Provost, C., and Strub, P. T.: The new CNES-CLS18 global mean dynamic topography, Ocean Sci., 17, 789–808, https://doi.org/10.5194/os-17-789-2021, 2021.
Olsen, S. M., Hansen, B., Østerhus, S., Quadfasel, D., and Valdimarsson, H.: Biased thermohaline exchanges with the Arctic across the Iceland–Faroe Ridge in ocean climate models, Ocean Sci., 12, 545–560, https://doi.org/10.5194/os-12-545-2016, 2016.
Østerhus, S., Woodgate, R., Valdimarsson, H., Turrell, B., de Steur, L., Quadfasel, D., Olsen, S. M., Moritz, M., Lee, C. M., Larsen, K. M. H., Jónsson, S., Johnson, C., Jochumsen, K., Hansen, B., Curry, B., Cunningham, S., and Berx, B.: Arctic Mediterranean exchanges: a consistent volume budget and trends in transports from two decades of observations, Ocean Sci., 15, 379–399, https://doi.org/10.5194/os-15-379-2019, 2019.
Perkins, H., Hopkins, T. S., Malmberg, S.-A., Poulain, P.-M., and Warn-Varnas, A.: Oceanographic conditions east of Iceland, J. Geophys. Res., 103, 531–552, https://doi.org/10.1029/98JC00890, 1998.
Poulain, P. M., Gerin, R., Mauri, E., and Pennel, R.: Wind Effects on Drogued and Undrogued Drifters in the Eastern Mediterranean, J. Atmos. Ocean. Tech., 26, 1144–1156, https://doi.org/10.1175/2008JTECHO618.1, 2009.
Read, J. F. and Pollard, R. T.: Water Masses in the Region of the Iceland-Færoes Front, J. Phys. Oceanogr., 22, https://doi.org/10.1175/1520-0485(1992)022<1365:WMITRO>2.0.CO;2, 1992.
Roemmich, D. and Gilson, J.: The 2004–2008 mean and annual cycle of temperature, salinity, and steric height in the global ocean from the Argo Program, Prog. Oceanogr., 82, 81–100, https://doi.org/10.1016/J.POCEAN.2009.03.004, 2009.
Rossby, T., Prater, M. D., and Søiland, H.: Pathways of inflow and dispersion of warm waters in the Nordic seas, J. Geophys. Res-Oceans., 114, C04011, https://doi.org/10.1029/2008JC005073, 2009.
Sutton, R. T. and Allen, M. R.: Decadal predictability of North Atlantic sea surface temperature and climate, Nature, 388, 563–567, https://doi.org/10.1038/41523, 1997.
Tait, J. B.: The Iceland-Faroe Ridge International (ICES) “Overflow” Expedition, May–June 1960, Rapports et Procès-Verbaux des Rèunions du Conseil International pour l'Exploration de la Mer, 157, 71, https://epic.awi.de/id/eprint/27312/1/Tai1967a.pdf (last access: 4 August 2026), 1967.
Tranchant, Y.-T., Legresy, B., Foppert, A., Pena-Molino, B., and Phillips, H. E.: SWOT reveals fine-scale balanced motions and dispersion properties in the Antarctic Circumpolar Current, Earth Space Sci., https://doi.org/10.22541/ESSOAR.173655552.25945463/V2, 2025.
Ullgren, J. E., Darelius, E., and Fer, I.: Volume transport and mixing of the Faroe Bank Channel overflow from one year of moored measurements, Ocean Sci., 12, 451–470, https://doi.org/10.5194/os-12-451-2016, 2016.
Worsfold, M., Good, S., Atkinson, C., and Embury, O.: Presenting a Long-Term, Reprocessed Dataset of Global Sea Surface Temperature Produced Using the OSTIA System, Remote Sens., 16, 3358, https://doi.org/10.3390/RS16183358, 2024.
- Abstract
- Introduction
- Data and methods
- The Atlantic water pathway towards the IFR
- Long-term variations of the Atlantic water properties
- Water mass modification during IFR-crossing
- Transport through the N-section
- Summary and implications
- Code availability
- Data availability
- Author contributions
- Competing interests
- Disclaimer
- Acknowledgements
- Financial support
- Review statement
- References
- Supplement
- Abstract
- Introduction
- Data and methods
- The Atlantic water pathway towards the IFR
- Long-term variations of the Atlantic water properties
- Water mass modification during IFR-crossing
- Transport through the N-section
- Summary and implications
- Code availability
- Data availability
- Author contributions
- Competing interests
- Disclaimer
- Acknowledgements
- Financial support
- Review statement
- References
- Supplement