
the Creative Commons Attribution 4.0 License.
the Creative Commons Attribution 4.0 License.
 | 30 Jul 2026
Climate modes synergistically influence marine heatwaves in the North Sea
Yuxin Lin
Feng Zhou
Qicheng Meng
Global shelf seas have experienced unprecedented marine heatwaves (MHWs) in recent decades. Although MHWs have been extensively studied at the global scale, their regional variability and underlying mechanisms remain poorly understood, particularly in shelf seas influenced by multiple climate modes. Here, we examine MHW variability in the Northeastern Atlantic shelf using a correlation-based k-means clustering approach. Two distinct subregions with contrasting seasonal patterns are identified. In winter, the southern North Sea experiences increased MHW frequency, intensity, and duration. This enhancement is linked to a positive East Atlantic Pattern, which intensifies westerly winds and enhances warm Atlantic inflow through both atmospheric and oceanic pathways. In contrast, the northern North Sea shows enhanced MHW frequency and duration in summer, while MHW intensity weakens. This summer response is modulated by Atlantic Multidecadal Variability, with its positive phase strengthening Pacific–Atlantic connections via Rossby wave propagation, altering cloud cover and surface radiative forcing. A shallow mixed layer, enhanced stratification, and circulation-induced upwelling favor frequent and persistent but less intense summer MHWs. This north–south contrast demonstrates that different combinations of atmospheric and oceanic processes shape MHW variability across the shelf, providing a diagnostic and mechanistic framework for understanding regional MHW variability and its potential predictability.
- Article
(8440 KB) - Full-text XML
-
Supplement
(629 KB) - BibTeX
- EndNote


Marine heatwaves (MHWs), defined as anomalous warm seawater events (Pearce et al., 2011), have become more frequent, persistent, and intense over the past decades, with persistent temperature extremes significantly affecting marine ecosystems and commercial fisheries (Yan et al., 2020). These trends are largely attributed to anthropogenic global warming (Oliver et al., 2018b; Mohamed et al., 2024; Wang and Zhou, 2024). Beyond long-term warming trends, recent studies have highlighted the importance of large-scale climate modes in enhancing MHW characteristics globally through atmospheric and oceanic teleconnections (Wang and Zhou, 2024; Holbrook et al., 2019). For example, El Niño–Southern Oscillation (ENSO) influences MHWs over the tropical Pacific and Indian Oceans (Hamdeno et al., 2024; Liu et al., 2022; Mohamed et al., 2022; Oliver et al., 2018a; Saranya et al., 2022). During El Niño phases, the significant increases in sea surface temperature (SST) lead to prolonged MHWs in the eastern tropical Pacific (Podesta and Glynn, 2001). Similarly, the North Atlantic Oscillation (NAO) primarily affects the tropical and North Atlantic MHWs (Holbrook et al., 2019; Gröger et al., 2024; Mohamed et al., 2023; Scannell et al., 2016). Although current forecast systems show skills in predicting the occurrence of MHWs in the El Niño region (de Boisséson and Balmaseda, 2024), with prediction accuracy significantly improving during El Niño events (Jacox et al., 2022), the forecast accuracy remains poor in the Northeastern Atlantic Ocean influenced by NAO, particularly in the North Sea (de Boisséson and Balmaseda, 2024; McAdam et al., 2023). This limitation warrants further investigations into the mechanisms driving MHWs at the relevant spatio-temporal scales.
The North Sea is a shelf sea located on the passive continental margin of northwest Europe, connecting the Baltic Sea to the Atlantic. The SST and MHW patterns in this region are influenced by large-scale North Atlantic climate modes, including NAO, the Atlantic Multidecadal Variability (AMV) and East Atlantic Pattern (EAP) (van der Molen and Pätsch, 2022; Mohamed et al., 2023, 2025; Scannell et al., 2016). Distinct seasonal differences of MHW mechanisms and climate modes responses in the North Sea have been documented (Gröger et al., 2024; Mohamed et al., 2023). Summer and winter exhibit contrasting patterns: during summer, MHWs are more frequent with higher intensity but shorter duration, while winter shows fewer events with lower intensity but longer duration. The NAO and EAP represent the two dominant modes of atmospheric circulation variability over the Euro-Atlantic region (Thornton et al., 2023), while AMV refers to large-scale multidecadal fluctuations in Atlantic SST (Kerr, 2000). These climate modes regulate westerly winds in the North Atlantic, affecting warm Atlantic inflow into the southern North Sea (van der Molen and Pätsch, 2022). Existing studies show that MHW frequency in the southern North Sea increases during the positive phase of AMV or EAP, while positive NAO primarily intensifies winter MHW occurrence (Mohamed et al., 2023; Scannell et al., 2016). The southern North Sea, characterized by shallow depths (Fig. 1a), experiences low-frequency, high-intensity, and long-duration MHWs. In contrast, the northern North Sea, which features larger water depth, exhibits more frequent and intense, but shorter MHWs (Chen and Staneva, 2024). However, the underlying dynamic mechanisms remain poorly understood (Mohamed et al., 2023).

Figure 1(a) The research domain of the North Sea. The bathymetry (m) is shown on a logarithmic scale. (b) Power spectrum analysis of 12-month running-mean marine heatwave cumulative intensity (MHWCI) anomalies in the North Sea derived from OSTIA. Orange dots indicate periods exceeding the 90 % confidence level (black dashed line), while blue dots represent periods below this threshold. The 90 % confidence level is calculated using a χ2 test against a red-noise (AR(1)) background spectrum based on the lag-1 autocorrelation.
Moreover, historical studies have indicated that climate modes in the Atlantic Ocean are interconnected (Börgel et al., 2020; Sun et al., 2015; Delworth and Zeng, 2016; Delworth et al., 2017). For example, the AMV alters the zonal position of NAO centers of action (Börgel et al., 2020), while the NAO-Atlantic Meridional Overturning Circulation interaction shapes the AMV (Sun et al., 2015; Delworth and Zeng, 2016; Delworth et al., 2017). These Atlantic climate variations also connect with Pacific Ocean patterns (Oshika et al., 2015). The AMV modulates the impact of Arctic Oscillation on tropical climate variability (Chen et al., 2025; Xue et al., 2025). Conversely, ENSO-induced dipolar convection anomalies exert an influence on NAO and EAP (Hou et al., 2023; Brönnimann, 2007; Jiménez-Esteve and Domeisen, 2018; Scaife et al., 2024; Wicker et al., 2024). Existing literature (Mohamed et al., 2023; Liu et al., 2022; Hamdeno et al., 2024; Gröger et al., 2024) has focused primarily on the effects of individual climate modes on MHWs, leaving their synergistic influence largely unexplored.
In this study, we address the knowledge gap in understanding synergistic impacts of climate modes on MHWs in shelf seas. We focus on the greater North Sea region, which is projected to warm as fast as global levels (Hobday and Pecl, 2014) but exhibits large climate variability caused by interactions between the Arctic and subtropical zones (Quante and Colijn, 2016). This makes it an ideal regional example for understanding how climate modes synergistically influence MHWs in complex shelf sea settings. Specifically, this study aims to (1) identify coherent spatial domains in the North Sea based on the seasonal patterns of interannual marine heatwave cumulative intensity (MHWCI) variability, (2) quantify how the frequency, intensity, and duration of MHWs differ between these domains during their seasonally dominant periods, and (3) examine the associated atmospheric and oceanic processes that modulate the observed regional contrasts. A correlation-based k-means clustering approach is used to characterize MHWCI variability, followed by an examination of the associated large-scale climate variability, air-sea heat fluxes, and oceanic heat transport.
2.1 Data
2.1.1 SST and MHW identification
Our analysis of MHWs in the North Sea (Fig. 2a) is based on high-resolution SST data (0.05°×0.05°, daily) obtained from the Copernicus Marine Environment Monitoring Service (CMEMS). This product is generated by the Operational Sea Surface Temperature and Sea Ice Analysis (OSTIA) (Worsfold et al., 2024), which integrates multiple satellite observations and in situ measurements, and covers the period 1982–2021. An independent observation-based SST dataset from the FerryBox system (Macovei et al., 2021), developed by Helmholtz-Zentrum Hereon, is used for validation purposes (Fig. S1 in the Supplement).

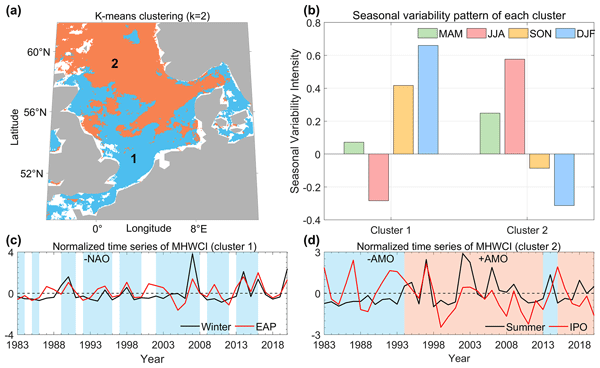
Figure 2k-means clustering of marine heatwave cumulative intensity (MHWCI) in the North Sea and associated climate modes. (a) Spatial distribution of two clusters based on the seasonal patterns of interannual MHWCI variability. (b) Seasonal variability of each cluster. Positive values indicate seasons with stronger contributions to interannual variability, while negative values indicate weaker contributions. (c) Z-score normalized time series of domain-averaged MHWCI for Cluster 1 during winter (black) and the East Atlantic Pattern (EAP, red); blue shading denotes negative NAO phases in October of the preceding year. (d) Z-score normalized time series of domain-averaged MHWCI for Cluster 2 during summer (black) and Interdecadal Pacific Oscillation (IPO) index (red); blue and red shading indicate negative and positive phases of Atlantic Multidecadal Variability (AMV), respectively. All time series in (c) and (d) are standardized using z-score normalization and are therefore dimensionless. The blue bar from 2013–2015 indicates the Atlantic “cold blob” event.
MHWs, which are defined as individual thermal events during which their associated temperature is larger than the 90th percentile threshold for at least 5 d (Hobday et al., 2016), are detected by using the MATLAB Marine Heatwaves (M_MHW) toolbox (Zhao and Marin, 2019). The climatological mean and percentile-based threshold used to detect MHW events are computed over the period 1982–2021, which corresponds to the full temporal coverage of the SST dataset used in this study. To ensure internal consistency across all analyses, a unified climatological baseline and detrending strategy is applied throughout this study. All anomalies are computed relative to the same reference period, and long-term trends are removed before analyses that focus on variability and climate-mode relationships.
The SST time series was detrended before MHW detection to reduce the influence of background warming on MHW detection and characteristics and to better isolate climate variability (Liu et al., 2022). To isolate variability relative to the long-term warming background, SST was detrended before MHW detection. The detrending was performed by identifying a linear trend estimated from the global-mean SST time series over 1982–2021 and subtracting this common trend from the SST time series at each grid point. This procedure reduces the influence of externally forced warming on the identification of marine heatwaves and subsequent analyses.
Characteristics of MHWs, including frequency, duration, mean intensity, and cumulative intensity, were derived following event detection. Among these metrics, cumulative intensity integrates the effects of event duration and mean intensity and provides an effective measure of the overall impact of MHWs (Marin et al., 2021). In this study, the cumulative intensity was summed to derive the monthly MHWCI, representing the combined impact of all MHW events occurring within a given month (Gröger et al., 2024; Mohamed et al., 2023). Specifically, the cumulative intensity of all MHW events whose onset date falls within a given month was summed to form the monthly MHWCI, while months without any MHW events were assigned a value of zero. This results in a continuous monthly MHWCI time series, which was subsequently expressed as anomalies relative to its long-term mean to characterize interannual variability
2.1.2 Atmospheric and oceanic reanalysis data
Atmospheric conditions were characterized using the monthly ERA5 reanalysis dataset (Hersbach et al., 2020) produced by the European Centre for Medium-Range Weather Forecasts (ECMWF). ERA5 provides monthly variables at a spatial at resolution of 0.25°×0.25°. The variables used in this study include 10-m wind components, 500 hPa geopotential height, precipitation, and surface heat fluxes. Although ERA5 is available from 1940 onward, only data from 1982–2021 were used in this study to ensure consistency with the satellite-based SST record used for marine heatwave detection.
Oceanic conditions were analyzed using monthly data from the ECMWF Ocean Reanalysis System 5 (ORAS5) (Zuo et al., 2019), which provides global ocean reanalysis data at a horizontal resolution of 0.25°. Variables of interest include potential temperature and ocean current velocity, which were used to examine subsurface thermal structure and oceanic heat transport associated with MHW variability. Our analysis focuses on seasonal to interannual variability, for which monthly-mean fields are commonly used in existing studies (Mohamed et al., 2023; Liu et al., 2022).
2.1.3 Climate modes
The influence of large-scale climate modes is investigated using indices of the NAO, the EAP, and the AMV, which are known to modulate atmospheric circulation over the North Atlantic and adjacent shelf seas. The NAO and EAP indices are obtained from the National Oceanic and Atmospheric Administration (NOAA) Climate Prediction Center and are derived from the first and second modes of a rotated empirical orthogonal function (EOF) analysis of monthly mean 500 hPa geopotential height anomalies over the North Atlantic.
The AMV index is derived from basin-averaged SST anomalies over the North Atlantic. To isolate internal multidecadal variability, the AMV index is calculated by removing the global-mean SST anomaly from the North Atlantic mean SST anomaly (Trenberth and Shea, 2006). Positive and negative phases of each climate mode are defined using a fixed threshold at zero, with values greater (less) than zero indicating positive (negative) phases. Seasonal indices are computed by averaging the corresponding monthly values over the relevant seasons.
Previous studies have shown that positive phases of the AMV and EAP are associated with increased annual MHW cumulative intensity in the North Sea, whereas positive NAO phases primarily enhance wintertime MHW occurrence in the southern North Sea (Mohamed et al., 2023, 2025).
2.2 k-means clustering analysis
Distinct regional patterns of MHWCI variability in the North Sea were identified using a correlation-based k-means clustering approach (Jain, 2010; Lloyd, 1982). Clustering methods have been used in climate research to identify spatially coherent regions and recurrent climate or circulation regimes (Plaut and Simonnet, 2001; Jacobeit, 2010). Unlike conventional k-means clustering, which minimizes Euclidean distance and is sensitive to absolute feature magnitude, the correlation-based version emphasizes similarity in the shape of normalized feature vectors. Similar correlation-distance-based clustering approaches have been used to classify precipitation variability regimes, identify climatically meaningful oceanic regions from subsurface temperature data, and characterize regional SST variability patterns (Santos et al., 2019; Radin et al., 2024; Radin and Nieves, 2024).
Given the pronounced seasonal variability of MHW in this region, this approach classifies grid points according to their seasonally resolved interannual variability characteristics, rather than applying the clustering separately to individual seasons. Specifically, a k-means clustering is performed using seasonal variability information derived from the full monthly record, thereby revealing spatially coherent regions with distinct seasonal responses to large-scale climate forcing.
For each grid point, MHWCI anomalies were computed for each season by subtracting the long-term seasonal climatology. The four seasons are defined as winter (December of the previous year and January-February of the current year, DJF), spring (March–May, MAM), summer (June–August, JJA), and autumn (September–November, SON), which correspond to well-established physical regimes in the North Sea (Chen and Staneva, 2024; Mohamed et al., 2023), including wintertime deep mixing and weak stratification, and summertime strong stratification with shallow mixed layers. The interannual variability during each season was quantified as the standard deviation of anomalies across the 40 years, yielding a four-component feature vector per grid point, with each component representing DJF, MAM, JJA, and SON variability. To reduce the influence of extreme values and ensure equal weighting among the four seasonal components, a logarithmic transformation followed by standardization was applied to the feature vectors. The dissimilarity between two grid points (Eq. 1) was defined as the correlation distance between their feature vectors:
where r(xi,xj) is the Pearson correlation coefficient between the seasonal variability patterns of MHWCI, emphasizing the similarity in their seasonal variability structures. The total within-cluster dissimilarity was computed as the sum of squared correlation distances (WCSS), which decreases as the number of clusters K increases. The number of clusters K was determined using the Elbow Method, where the reduction in WCSS begins to level off (Syakur et al., 2018). In this study, K=2 was selected as the optimal number of clusters (Fig. A1). Further validation of clustering robustness is provided in Appendix A. This number results in two well-separated and spatially coherent regions in the North Sea, broadly corresponding to the southern and northern subregions, indicating distinct temporal variability characteristics of MHWCI.
Based on the assessment, grid points were partitioned into two clusters by grouping them with similar seasonal patterns. Each cluster is characterized by its dominant season, defined as the season with the highest mean standardized variability, and the relative contributions of all four seasons. This approach identifies regions where MHWCI variability exhibits specific seasonal dependence, thereby revealing distinct spatial patterns that may be linked to different large-scale climate variations.
2.3 Quantification of upper-ocean stratification
To characterize the upper-ocean stratification associated with MHWs, mixed layer depth (MLD) is diagnosed following a density-based criterion. Specifically, MLD is defined as the depth at which the potential density first exceeds the potential density at 10 m by 0.03 kg m−3 (England et al., 2025), which has been shown to be suitable for shallow and seasonally stratified shelf seas. Vertical stratification and dynamical stability are further quantified using the gradient Richardson number, Ri, defined as:
where N is the buoyancy frequency,
and S is the vertical shear
Here, g denotes gravitational acceleration, ρ is seawater density, and u and v are the zonal and meridional velocity components, respectively. All variables are derived from the ORAS5 reanalysis and are computed over the same temporal intervals as the temperature fields to ensure consistency among stratification and heat budget diagnostics.
2.4 Heat budget analysis
The physical processes driving MHWCI variations in the subregions identified by the k-means clustering were quantitatively examined through an upper-ocean heat budget analysis. After linearizing the variables, the perturbation equation of upper ocean heat anomalies (Eq. 3) can be described as (Liu et al., 2014; Tan et al., 2016):
where the overbar and prime denote the monthly mean and anomaly, respectively. The left-hand side represents the sea surface temperature anomaly tendency. We calculated this tendency as the temperature difference between February and December for winter and between August and June for summer, respectively. The right-hand side comprises four main terms, namely the net heat flux, geostrophic heat advection, Ekman heat advection, and entrainment heat flux, respectively. The last term denotes the residual term (RES), which includes nonlinear heat advection and diffusion, etc. These terms are averaged over the respective seasonal periods. refers to the sea surface net heat flux anomaly, comprising the net shortwave and longwave radiative components, as well as the net latent and sensible heat fluxes. Positive values of indicate ocean gaining heat from the atmosphere. ρ is the seawater density (1025 kg m−3), Cp is the specific heat capacity (3890 J kg−1 K−1), and hm is the MLD. ORAS5 provides ocean variables on 75 vertical levels, with vertical spacing increasing from approximately 1 m near the surface, allowing a physically consistent estimation of MLD and mixed-layer heat budget terms at seasonal to interannual timescales. The horizontal circulation in the surface layer can be divided into the Ekman current component ue and the geostrophic current component ug. we is the Ekman pumping (entrainment) velocity, with positive values indicating Ekman upwelling, pumping or divergence and negative values for Ekman downwelling or convergence, respectively. Tm is the mixed-layer temperature, and is set to SST in this study for simplicity. Td is the temperature below the base of the mixed layer. This heat tendency equation (Eq. 6) follows the standard formulation commonly used in upper-ocean heat budget studies. All terms are computed using monthly mean fields.
2.5 Horizontal wave activity flux
Large-scale atmospheric teleconnections influence the formation and persistence of MHWs by modulating atmospheric circulation and surface heat fluxes. The Pacific–Atlantic teleconnection is closely linked to Rossby wave propagation (Hou et al., 2023). The propagation of these teleconnection signals was diagnosed using the wave activity flux (WAF, Eq. 7), which quantifies the direction and intensity of stationary Rossby wave energy propagation (Takaya and Nakamura, 2001). Hence, the horizontal WAF (unit: m2s−2) was calculated as follows:
where p is the pressure normalized to 1000 hPa, φ is the latitude, λ is the longitude, a is the radius of the Earth, is the geostrophic stream function, z (m) is the geopotential height, f is the Coriolis parameter and ψ′ is the perturbed stream function, calculated as the deviation of the geostrophic stream function from its climatological mean state. , U and V represent the averaged wind speed, zonal, and meridional wind velocity, respectively.
3.1 Seasonal-to-decadal variability of MHWs
To link regional MHW variability with its large-scale drivers, we first identify the dominant spatial-seasonal patterns of MHWCI and their associated climate indices, and then examine the corresponding atmospheric and oceanic anomalies. Power spectrum analysis of the detrended monthly MHWCI (Fig. 1b), constructed as a continuous time series by summing the cumulative intensity of all MHW events occurring within each month (and set to zero when no events occur), shows that, after removing the dominant seasonal pattern, substantial variability remains at interannual timescales. Several spectral peaks exceed the 90 % confidence level, suggesting that MHWCI variability in the North Sea is organized on multi-year timescales. This provides a basis for exploring whether such variability exhibits coherent spatial and seasonal structures across the region.
Based on the seasonal patterns of interannual MHWCI variability, the correlation-based k-means clustering identifies two spatially coherent subregions (named as Cluster 1 and 2, respectively) in the North Sea (Fig. 2a). Cluster 1 mainly covers the central and southern parts of the North Sea, while Cluster 2 includes the deeper northern region. The two clusters are geographically contiguous and broadly aligned with the contrast between the shallow southern shelf and the deeper northern basin.
Seasonal differences between the two clusters were quantified by calculating the relative contribution of each season, expressed as the percentage of its spatially averaged interannual variability intensity (VI) relative to all four seasons within each cluster. Positive values of VI indicate seasons that contribute more strongly to the total variability of that cluster, while negative values indicate weaker contributions. In Cluster 1, variability is dominated by winter (VI = 0.66) and autumn (VI = 0.41), with substantially weaker variability in summer (VI = −0.28) and spring (VI = 0.07) (Fig. 2b). Cluster 2, by contrast, shows its strongest variability in summer (VI = 0.57) and moderate variability in spring (VI = 0.24), while variability in autumn (VI = −0.08) and winter (VI = −0.30) is relatively weak. These results indicate a clear seasonal asymmetry between the central-southern and northern North Sea, implying that seasons with the most active MHW-related variability differ between the two regions.
In the central-southern North Sea (Cluster 1), variability is dominated by winter, whereas in the northern deeper region (Cluster 2) it is primarily expressed in summer. These seasonal contrasts are derived from the relative contributions of each season to the standardized interannual variability of MHWCI and therefore reflect when MHW-related variability is most active in each region. Based on this diagnosis, the subsequent analyses focus on winter MHWCI for Cluster 1 and summer MHWCI for Cluster 2 in order to examine large-scale climate influences during the season of maximum variability for each region. The relationship between regional differences and large-scale climate modes was examined using the time series of domain-average MHWCI extracted for each cluster. Consistent with the identified seasonal dominance, the winter series was analyzed for Cluster 1 and the summer series for Cluster 2.

Figure 3Composite anomalies of MHW characteristics during positive phases of the cluster-specific time series in winter (a–c) and summer (d–f). (a, d) W number, (b, e) MHW intensity (°C), and (c, f) MHW duration (days).
While the clustering analysis identifies when MHWCI variability is most pronounced in each region, it does not indicate which MHW characteristics primarily contribute to the enhanced cumulative intensity. To address this, composite analysis of MHW frequency, intensity, and duration anomalies was examined during positive phases of the cluster-specific MHWCI time series (Fig. 3). In Cluster 1, enhanced winter MHWCI is associated with concurrent increases in MHW frequency, intensity, and duration (Fig. 3a–c), indicating that winter MHWs in the central and southern North Sea become more frequent, persistent, and intense. In contrast, enhanced summer MHWCI in Cluster 2 is mainly associated with increases in MHW frequency and duration, while mean intensity shows a slight reduction (Fig. 3d–f). This suggests that summer MHWs in the northern North Sea tend to be more persistent but less intense.
Based on the seasonal dominance and the contributing MHW characteristics identified above, the temporal evolution of the cluster-mean MHWCI and its relationship with large-scale climate indices is examined (Fig. 2c and d). In Cluster 1, the winter-averaged MHWCI exhibits pronounced interannual variability, with enhanced values tending to coincide with positive phases of EAP (r=0.64, 95 % confidence interval). In addition, negative phases of the NAO in the preceding October frequently precede winters with elevated MHWCI.
In Cluster 2, the summer-averaged MHWCI displays pronounced decadal modulation (Fig. 2d). During the negative AMV phase (1982–1994, blue shading in Fig. 2d), MHWCI exhibits relatively weak intensity. In contrast, during the positive AMV phase (1994–2013, red shading in Fig. 2d), MHWCI shows notable enhancement, with its interannual variability strongly correlated with both ENSO and the Interdecadal Pacific Oscillation (IPO) (r=0.69 and 0.70, respectively). However, this teleconnection substantially weakens after 2013 (Fig. S2), and the correlations are no longer statistically significant (p>0.1), indicating a substantial reduction in Pacific influence on North Sea MHWs.
These results demonstrate that MHWCI variability in the North Sea is organized into two spatially distinct regions with contrasting seasonal dominance, MHW characteristics, and temporal behaviour. Based on these differences, subsequent analyses focus on winter MHWs in Cluster 1 and summer MHWs in Cluster 2 to investigate the associated atmospheric and oceanic processes.
3.2 Cluster 1: winter mechanisms in the central and southern North Sea
The winter EAP-related pathway in Cluster 1 is examined through the evolution of large-scale atmospheric circulation, surface forcing, regional circulation, stratification, and heat transport. Composite anomalies are calculated for winters when the standardized cluster-mean MHWCI exceeds +1 SD (standard deviation) (black line in Fig. 2c), providing the background physical conditions associated with enhanced winter MHWCI.
Figure 4 shows the composite anomalies of 500 hPa geopotential and WAF (Eq. 7) from October of the preceding year to January of the MHW winter. The anomalous WAF flux is shown only when its magnitude is larger than 0.1 m2 s−2 (Hou et al., 2023). In October, during enhanced MHWCI periods, the geopotential anomalies, defined relative to the long-term monthly climatology, exhibit pronounced negative anomalies over the subpolar North Atlantic, with positive anomalies observed over the subtropical and polar regions (Fig. 4a). This atmospheric configuration corresponds to a negative NAO phase, characterized by a weakened Azores High and intensified Icelandic Low. Additionally, the WAF vectors indicate relatively weak wave activity over the eastern Atlantic.

Figure 4Composite anomalies of 500 hPa geopotential (shading, m2 s−2) and horizontal wave activity flux (WAF, vector, m2 s−2) from October of the preceding year to January of the following year, based on winters when the standardized Cluster 1 MHWCI exceeds + 1 SD (standard deviation). The anomalous WAF flux is shown only when its magnitude is larger than 0.1 m2 s−2.
In November, the system enters a transition phase. The negative geopotential anomalies over the subpolar Atlantic intensify and extend eastward, while positive anomalies expand toward northern Europe (Fig. 4b). During this period, an eastward-propagating Rossby wave train becomes apparent, with WAF vectors indicating energy propagation from the North American sector toward the eastern North Atlantic.
By December, the wave train includes both eastward and westward-propagating components across the North Atlantic. This WAF configuration generates strong convergence over the subpolar region, significantly reinforcing the negative geopotential anomalies there. Consequently, the atmospheric transitions to a positive EAP phase. The geopotential field displays a distinct tripole structure, reflecting intensified Azores High and Icelandic Low systems, accompanied by a strengthened high-pressure system over western Europe (Fig. 4c). This configuration persists into January (Fig. 4d).
The sea surface temperature (SST) and wind stress anomalies from October to January are illustrated in Fig. 5. In October, anomalous cyclonic wind stress is observed over the central North Atlantic, accompanied by negative SST anomalies in the same region (Fig. 5a). In November, the region of SST cooling expands northward and eastward, accompanied by a weakening of cyclonic wind anomalies over the mid-latitude North Atlantic (Fig. 5b). By December and January, strengthened southwesterly wind anomalies are evident over the northeastern North Atlantic and the North Sea region (Fig. 5c and d). During these months, SST anomalies over the southern North Sea become positive, in contrast to the persistent negative SST anomalies over the subpolar Atlantic. These patterns indicate a clear spatial contrast in surface thermal patterns between the open North Atlantic and the shelf region during winters with enhanced MHWCI in Cluster 1.

Figure 5Composite anomalies of sea surface temperature (shading, °C) and wind stress (vectors, N m−2) from October to January, based on winters when the standardized Cluster 1 MHWCI exceeds + 1 SD (standard deviation).
Figure 6 presents composite anomalies of the net surface heat flux and its individual components averaged over the Cluster 1 region during winters with enhanced MHWCI. The net surface heat flux anomaly is negative, indicating a net loss of heat from the ocean to the atmosphere. Among the individual components, the sensible heat flux exhibits the largest negative anomalies, while latent heat flux, shortwave radiation, and longwave radiation anomalies are weaker in magnitude. The dominance of the sensible heat flux anomaly is consistent with the strengthened near-surface winds observed during these winters. The surface heat flux anomalies indicate that atmospheric forcing acts to cool the ocean surface over the Cluster 1 region during periods of enhanced MHWCI.

Figure 6Composite anomalies of net heat flux and its components (W m−2) in the North Sea during winters (blue bars) and summers (red bars) with positive values in the cluster-specific time series. Components include shortwave (Qsw) and longwave (Qlw) radiation, as well as the net latent (Qla) and sensible (Qsen) heat flux anomalies. Positive values indicate ocean heat gain from the atmosphere, while negative values indicate heat loss.
Figure 7 shows composite anomalies of oceanic circulation and stratification-related variables during enhanced MHWCI winters. The surface current anomalies (Fig. 7a) reveal enhanced northward and eastward flow at the southern entrance of the North Sea, indicating increased inflow from the adjacent North Atlantic. Within the southern and central North Sea, the current anomalies exhibit convergence, as reflected by the spatial arrangement of the velocity vectors. Additionally, the warm water inflow reduces cold outflow from the Baltic Sea.

Figure 7Composite anomalies of oceanic variables during positive phases of the cluster-specific time series in winter (a–d) and summer (e–h). (a, e) Oceanic current (vectors, m s−1), (b, f) mixed layer depth (MLD, m), (c, g) Richardson number (Ri), (d, h) meridional overturning circulations (MOC, Sv). The MOC is domain-integrated overturning circulations, obtained by integrating the velocity field over the entire zonal and meridional extent of the study domain, respectively. Negative stream function values correspond to clockwise circulation, while positive values indicate counterclockwise circulation. Black arrow-headed lines in (d) and (h) indicate the direction of the overturning circulation.
In winter, the Cluster 1 region is predominantly well mixed due to strong wind forcing and shallow bathymetry, as reflected by weak climatological stratification (Fig. S4a) with low Ri (Fig. S3). Consistent with this background state, composite MLD anomalies (Fig. 7b) are negligible across most of the Cluster 1 region, with positive anomalies confined to very shallow shelf regions.
The Richardson number anomalies displayed in Fig. 7c exhibit a similar spatial structure. While Ri anomalies are weak or near zero over the well-mixed central basin, pronounced negative anomalies appear in the same shallow shelf regions where MLD shoaling is observed. This spatial correspondence indicates that changes in stratification and velocity shear are spatially collocated over shallow shelf areas during enhanced MHWCI winters.
These localized structural changes occur together with coherent atmospheric and oceanic anomalies. Enhanced Atlantic inflow provides a positive contribution to the mixed-layer heat budget, while strengthened southwesterly winds are associated with increased surface heat loss. Additionally, positive MLD anomalies are confined to very shallow shelf regions and are negligible across most of the Cluster 1 area, suggesting that changes in MLD play only a limited role in the basin-scale evolution of winter MHWs. Meanwhile, reduced Ri indicates enhanced shear relative to stratification, which modulates vertical mixing without promoting deep redistribution of heat. Consequently, heat transported by horizontal advection can be preferentially retained in the near-surface layer, favoring the development and persistence of winter MHWs despite concurrent surface heat loss.
To further assess the dynamical response associated with these coupled structural and heat transport anomalies, the corresponding overturning circulation anomalies are investigated. Figure 7d presents composite anomalies of the meridional overturning circulation (MOC) during enhanced MHWCI winters. The MOC is strengthened, with increased northward and downward transport in the southern and central North Sea, respectively. These overturning features align with regions of enhanced Atlantic inflow and current convergence. The enhanced downward transport in the central North Sea occurs within a water column that is already well mixed during winter. As a result, the intensified overturning circulation does not produce a discernible mixed-layer deepening, consistent with the absent MLD and Ri anomalies observed in the central basin. Instead, the enhanced overturning facilitates the redistribution and retention of advected heat within the water column, contributing to elevated winter temperatures and enhanced MHWCI in the central North Sea.
The relative contributions of different processes to the upper-ocean temperature tendency during winter are quantified using a mixed-layer heat budget analysis (Eq. 6, Fig. 8). The total temperature tendency is positive, indicating net warming over the winter season in Cluster 1. Among the individual terms, geostrophic heat advection provides the largest positive contribution to the temperature tendency, while the contribution from surface heat flux is negative. Ekman advection and entrainment terms are comparatively small, and the residual term contributes weakly. The relative magnitudes of the heat budget terms indicate that horizontal ocean heat transport supplies a substantial positive contribution to wintertime warming, partially offsetting the cooling effect associated with surface heat loss.

Figure 8Quantitative contribution (° C per season) of atmospheric and oceanic processes to the upper ocean temperature anomaly tendency for two clusters identified by the k-means algorithm. The atmospheric and oceanic variables are shown as composite patterns during positive phases of the cluster-specific time series in winter (blue) and summer (red). The temperature tendency () represents the difference in the sea surface temperature anomaly between February and December for winter and between August and June for summer, respectively. Contributions from the net heat flux anomaly (Qnet), geostrophic heat advection (AdvGeo), Ekman heat advection (AdvEk), entrainment heat flux (EHF), and residual term (RES), averaged over the same periods, are also shown.
3.3 Cluster 2: summer mechanisms in the northern North Sea
The summer MHWCI variability in Cluster 2 exhibits a distinct dependence on the background state of the AMV. As shown in Fig. 2d, the Cluster 2 MHWCI remains relatively weak during the negative AMV phase but is substantially enhanced during the positive AMV phase before 2013. During this strong positive AMV period, the summer MHWCI is strongly correlated with the IPO index. However, this relationship weakens after 2013, when the correlation with Pacific indices becomes statistically insignificant. These results suggest that the Pacific influence on summer MHW variability in the northern North Sea is not stationary but is modulated by the background state of the North Atlantic.
To examine this phase dependence, we regressed atmospheric and oceanic variables onto the IPO index during three periods: the negative AMV phase, the strong positive AMV phase before 2013, and the post-2013 positive AMV period. The large-scale atmospheric circulation and horizontal WAF are shown in Fig. 9, while the corresponding wind stress, SST, precipitation, and cloud-cover anomalies are shown in Fig. 10. This comparison allows us to assess whether the IPO-related signal is transmitted from the Pacific to the North Atlantic-European sector and whether it produces a local response over the northern North Sea.

Figure 9Summer Composite patterns of 500 hPa geopotential anomalies (shading, m2 s−2) and horizontal WAF (vector, m2 s−2) during (a) positive AMV phase (1994–2012), (b) positive AMV phase (2013–2021), and (c) negative AMV phase. All fields are regressed onto the IPO index. Only significant anomalies at the 90 % confidence level are shown. The orange box indicates the North Sea region.

Figure 10Summer atmospheric patterns regressed to the IPO index during different AMV phases. Composite anomalies during positive AMV phase (1994–2012) (a–c), positive AMV phase (2013–2021) (d–f), and negative AMV phase (g–i): (a, d, g) wind stress (vectors, N m−2) and sea surface temperature (SST, shading, °C), (b, e, h) precipitation (cm), and (c, f, i) cloud cover. Only significant anomalies at the 90 % confidence level are shown. The black boxes in (b), (e), and (h) indicate the Caribbean Sea. The black boxes in (c), (f), and (i) indicate the North Sea region.
During the strong positive AMV phase, the warm North Atlantic background may have provided favorable large-scale conditions for the development and downstream transmission of IPO-related atmospheric anomalies. Previous studies have shown that North Atlantic SST anomalies can influence tropical Pacific variability by modifying the Walker circulation and Pacific trade winds, thereby affecting Pacific-related variability on multidecadal timescales (McGregor et al., 2014; Levine et al., 2017). In addition, ENSO-related teleconnections to the North Atlantic-European sector are known to be sensitive to the SST background state and upper-level flow, which regulate Rossby-wave excitation and propagation pathways (Fernández-Castillo et al., 2025). Consistent with this background-state modulation, the IPO-related atmospheric response is well developed over the North Pacific during the strong positive AMV phase. The regression pattern of 500 hPa geopotential height exhibits a clear dipole-like structure between the subpolar and subtropical North Pacific. This circulation pattern is accompanied by enhanced WAF extending eastward from the Pacific sector toward North America and the North Atlantic (Fig. 9a), indicating that IPO-related stationary wave activity is more effectively transmitted downstream under the strong positive AMV background. The tropical Atlantic and Caribbean region also forms part of this broader Pacific-Atlantic teleconnection pattern. During the strong positive AMV phase, negative SST anomalies and reduced precipitation develop over the Caribbean Sea (Fig. 10a and b), suggesting a coherent tropical Atlantic response associated with the downstream atmospheric adjustment. In contrast, the downstream WAF propagation and the convection anomalies are much weaker during the negative AMV phase and after 2013, suggesting that the AMV background modulates the efficiency with which IPO-related atmospheric variability is transmitted from the Pacific into the Atlantic sector.
This large-scale circulation response is accompanied by a positive geopotential anomaly over the northern North Sea, where the regression patterns show reduced cloud cover within Cluster 2 (black box in Fig. 10c). Reduced cloud cover favors increased downward shortwave radiation at the sea surface and therefore enhances the surface radiative contribution to the upper-ocean heat budget. Consistently, the summer heat-budget analysis shows a positive net surface heat-flux contribution over Cluster 2 (Fig. 6), indicating that atmospheric surface forcing provides an important pathway linking the large-scale circulation response to regional MHW.
The heat-budget analysis further supports this interpretation. In contrast to the winter mechanism in Cluster 1, where geostrophic heat advection associated with enhanced Atlantic inflow provides the dominant warming contribution, the summer temperature tendency in Cluster 2 is mainly associated with surface heat flux and the RES term (Fig. 8). The contributions from geostrophic and Ekman heat advection are comparatively weak. This indicates that the summer MHW response in the northern North Sea is primarily mediated by atmospheric surface forcing rather than by horizontal oceanic heat transport.
The regional upper-ocean structure further determines how this atmospheric forcing influences MHW characteristics. During summer, the northern North Sea is characterized by a shallow MLD and strong stratification (Fig. S4b). During enhanced MHWCI summers, the mixed layer becomes shallower over much of Cluster 2 (Fig. 7f), reducing the effective heat capacity of the surface layer. Figure 7g also shows predominantly positive Ri anomalies over the same region, indicating enhanced stratification stability and a reduced susceptibility to shear-driven instabilities. The spatial co-location of MLD shoaling and increased Ri suggests that buoyancy-driven stratification strengthens sufficiently to offset any increase in velocity shear, resulting in a more stably stratified upper ocean during these summers. Together, these changes imply that radiative and surface heat flux anomalies are confined to a thin surface layer, allowing relatively short-lived atmospheric forcing anomalies to produce a pronounced near-surface thermal response. In addition to surface forcing, the regression patterns indicate a dynamical response in the regional circulation. The reduced Atlantic flow leads to weakened surface winds over the northern North Sea. These wind anomalies are accompanied by negative MOC anomalies (Fig. 7h), indicating an anomalous anticlockwise overturning circulation with enhanced upwelling over the northern North Sea.
This mechanism is consistent with the observed changes in MHW characteristics. Enhanced summer MHWCI in Cluster 2 is mainly associated with increased MHW frequency and duration, whereas mean intensity slightly decreases. The teleconnection-related radiative anomaly provides a relatively persistent but moderate surface heating tendency. However, the northern North Sea remains dynamically active in summer, and local circulation, vertical exchange, and residual processes can limit the development of strong peak warming. Therefore, the remote atmospheric forcing preferentially increases the persistence and occurrence of MHWs rather than their mean intensity (Fig. 3d–f).
After 2013, previous studies have documented an abrupt cooling in the subpolar North Atlantic (Mooney, 2015), often referred to as the development of the “cold anomaly” or “cold blob,” which coincides with a weakening of the AMV signal during the early 2010s (Moat et al., 2020; Josey and Sinha, 2022; Frajka-Williams et al., 2017). During this period, the IPO-related atmospheric and oceanic responses are much weaker. The geopotential dipole over the North Pacific is less coherent, and the WAF pattern no longer shows a clear downstream pathway from the Pacific to the North Atlantic-European sector (Fig. 9b). The Caribbean wind, precipitation, and SST anomalies are also weaker and less spatially organized, indicating a reduced tropical Atlantic response (Fig. 10d–f). As a result, the IPO-related response over the northern North Sea becomes weak and spatially less coherent.
This Pacific-Atlantic teleconnection weakens even further during the negative AMV phase. The IPO-regressed geopotential dipole in the Pacific is much less pronounced (Fig. 9c), further diminishing the dipole circulation and reducing zonal wind anomalies between these regions. The SST anomaly distribution remains inconsistent with the IPO spatial pattern, with the North American coastal warming signature nearly absent (Fig. 10g). Correspondingly, the westerly wind anomalies over the tropical Pacific are substantially more suppressed. This also suppresses the Rossby wave source, leading to a marked reduction of eastward Rossby wave energy flux into the Atlantic region (Fig. 9c). The diminished atmospheric response produces minimal impacts on North Atlantic circulation and limited modification of the North Sea (Fig. 10h and i).
4.1 Contrasting climate influences in MHWs across the North Sea
Our analysis of observed SST data demonstrates how multiple climate modes interact to influence MHWs at a regional scale through seasonally distinct mechanisms. Different from previous studies that mainly applied clustering analysis to group heatwaves based on common characteristics (Chauhan et al., 2023; Artana et al., 2024), location (Hansen et al., 2024), and underlying dynamic drivers (Vogt et al., 2022), this study employed a correlation-based k-means clustering approach to further explore their spatial and temporal coherence. Our analysis identified two distinct regions in the North Sea, a southern shallow region and a northern deep region, each dominated by different climate variations and seasonal dynamics. Similar north–south spatial contrasts in MHW-induced stratification associated with water depth have also been reported in the North Sea (Chen et al., 2022).
In the central-southern shallow North Sea (Cluster 1), enhanced MHWCI is closely linked to positive winter EAP conditions, typically following a negative late-autumn NAO. Previous studies have shown that MHW frequency in the southern North Sea increases during positive phases of either NAO or EAP (Mohamed et al., 2023). Similar NAO-related influences have also been reported in the adjacent Baltic Sea (Gröger et al., 2024). Our results refine this understanding by identifying the positive winter EAP as the primary driver, enhancing not only the frequency but also the intensity and duration.
Recent research also indicates that AMV plays a more important role than the NAO in influencing the frequency of summer MHWs in the southern North Sea (Mohamed et al., 2023). However, its role in the northern North Sea has received little attention. Our results show that in Cluster 2, representing the deeper northern North Sea, the enhanced MHW frequency and duration in summer is linked to the synergistic influence of the AMV and Pacific climate modes. These teleconnections propagated from the Pacific to the North Sea through Rossby wave energy propagation, which is consistent with studies emphasizing the role of Pacific teleconnections in shaping the North Atlantic atmospheric pattern (Hou et al., 2023).
The detrended results show that Cluster 2 exhibits increased MHW frequency and duration, accompanied by a slight decrease in intensity during positive MHWCI periods. This pattern suggests that the summer response in the northern North Sea cannot be attributed solely to the long-term warming trend. This result is consistent with basin-wide observations from 1993 to 2022, which show a declining trend of MHW intensity but increasing frequency and duration (Chen and Staneva, 2024). Such a change is attributed to large-scale atmospheric circulation changes and regional oceanic processes rather than global warming. The reduction in intensity has been proposed to be related to the weakening of the North Atlantic Jet Stream and more frequent atmospheric blocking events (Woollings et al., 2018), which promote stagnant atmospheric conditions and persistent but less intense warm anomalies over the North Sea, while freshwater-salt exchange, stratification changes, and Baltic Sea inflow also modulate regional SST responses (Mathis and Pohlmann, 2014). As an additional possible mechanism, the interannual-decadal variability linked to the AMV and Pacific teleconnections could modulate the summer North Atlantic atmospheric pattern, which then changes MHW intensity in the northern North Sea.
4.2 Global implications and future perspectives
Current MHW forecast systems exhibit the highest skill in the El Niño region, the Caribbean, the wider tropics, the north-eastern extra-tropical Pacific, and southwest of the extra-tropical basins. However, the skill is much lower in the North Sea, whatever the forecast range (de Boisséson and Balmaseda, 2024; Jacox et al., 2022). This is likely due to the impact of unresolved atmospheric variability, limited representation of teleconnections and climate modes (Ardilouze et al., 2017; Patterson et al., 2022). Since climate indices serve as important forecasting factors influencing these events (Jacox et al., 2022; Mi et al., 2025), incorporating synergistic climate interactions into forecasting frameworks could enhance predictive skill for MHWs.
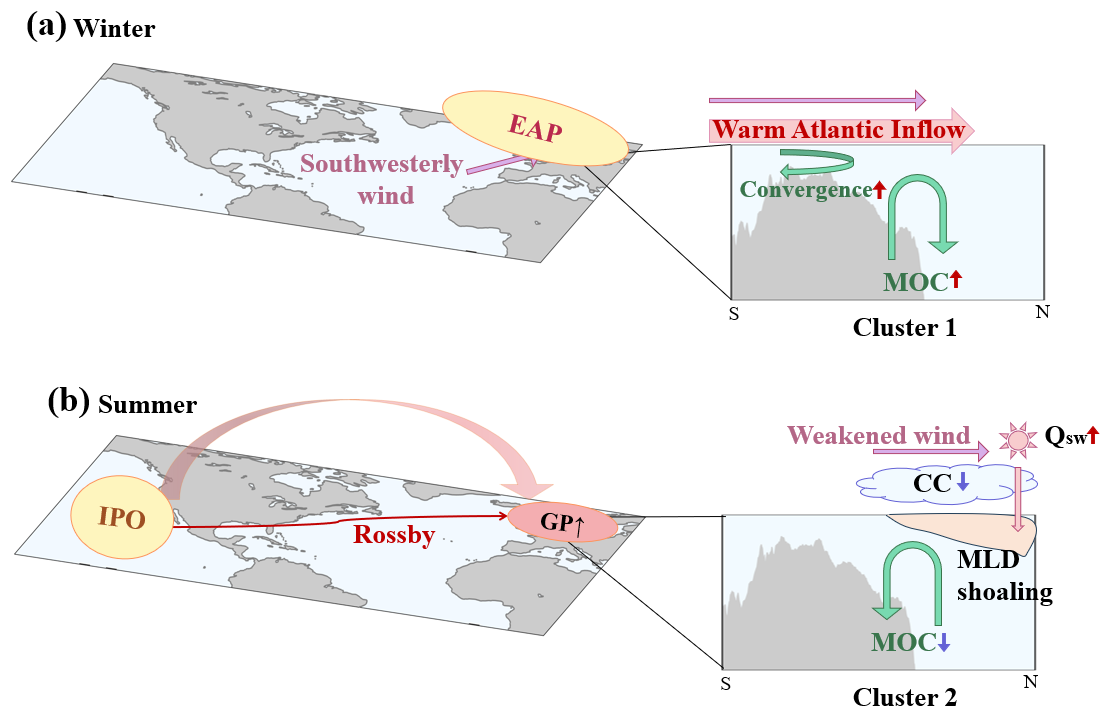
Figure 11Schematic illustration of two distinct cluster patterns showing the synergistic impacts of climate modes on MHWCI in the Northwestern European shelf. (a) The winter pattern characterized by a combined negative NAO phase in late autumn and a positive EAP phase in winter. (b) The summer pattern characterized by simultaneous positive phases of AMV and IPO. Purple arrows indicate wind anomalies. Red upward and blue downward arrows represent increases and decreases in the associated variables. Blue cloud shapes denote cloud cover (CC), while red circles denote geopotential (GP). Qsw indicates the downward shortwave heat flux. Green arrows mark horizontal flow convergence or the Meridional Overturning Circulation (MOC).
Similar teleconnection mechanisms have been documented in other shelf seas and marginal seas, including the Baltic Sea (Gröger et al., 2024) and South China Sea (Deng et al., 2022). For instance, the Indian Ocean Basin-Wide index has been identified as a key predictor of long-term MHWs occurrence in the South China Sea (Mi et al., 2025), while including ENSO-related variability in the tropical Pacific may extend the duration of skilful forecasts of atmospheric patterns over the North Atlantic (Shackelford et al., 2025). Our results reveal clear regional and seasonal contrasts in how large-scale climate variations influence MHW variability across the North Sea. These contrasts highlight that MHW predictability in shelf seas depends on the timing, location, and combined effects of multiple climate drivers rather than their individual strengths alone. Realistic simulation of these spatially and seasonally varying relationships in forecast systems would improve the ability to predict when and where MHWs are most likely to occur.
By applying a correlation-based k-means clustering approach, this study revealed coherent spatial and temporal patterns of MHWCI variability in the North Sea and their connections to large-scale climate variations. The results show that multiple interacting climate modes jointly drive MHWCI variability on the northeastern Atlantic shelf, emphasizing the need to consider combined effects rather than individual forcing mechanisms.
The relative importance and mechanisms of these large-scale drivers vary regionally and seasonally. In winter, MHWCI variability in the southern North Sea is primarily regulated by EAP, acting through two complementary pathways: an atmospheric pathway associated with strengthened southwesterly winds, and an oceanic pathway characterized by increased Atlantic inflow and strengthened MOC. Under a wintertime well-mixed pattern, enhanced ocean heat transport contributes to elevated water-column temperatures, favoring the development of winter MHWs (Fig. 11a).
In contrast, summer MHWCI variability in the northern North Sea is dominated by the combined influence of the AMV and Pacific-related teleconnections. During positive AMV phases, strengthened IPO-like atmospheric responses in the Pacific enhance Pacific–Atlantic teleconnections via Rossby wave energy propagation. These teleconnections modulate cloud cover and surface radiative forcing over the North Sea, leading to a surface-flux-dominated heat budget in summer. The shallow mixed layer and enhanced stratification, reflected by reduced MLD and increased Ri, increase the sensitivity of surface temperature to atmospheric forcing and suppress vertical redistribution of heat. Concurrently, changes in regional overturning circulation, including enhanced upwelling in the northern North Sea, limit the accumulation of extreme surface warming. As a result, summer MHWs in this region are characterized by increased frequency and duration but reduced intensity (Fig. 11b). When the AMV transitions to neutral or negative phases after 2013, the weakening of IPO-like patterns reduces Pacific–Atlantic coupling, thereby diminishing their influence on the region. Together, these regionally and seasonally distinct mechanisms provide a clear physical basis for how large-scale climate modes modulate MHWs in shelf seas.
These findings have practical implications for enhancing process-based prediction and for understanding how MHW characteristics may respond to future changes in large-scale climate modes. Future research should test whether similar interaction patterns occur in other shelf seas, evaluate the potential of climate indices to improve MHW prediction skill, and investigate how the underlying mechanisms may change under future climate conditions.
The stability and interpretability of the correlation-based k-means clustering results were assessed through two complementary analyses: the elbow method and the silhouette coefficient. The elbow curve method runs k-means clustering on the dataset for a range of K (from 1 to 10). For each of the K values, the total within-cluster sum of squared correlation distances (WCSS) (Lloyd, 1982) was computed. The optimal K corresponds to the point at which the decrease in distance becomes substantially less pronounced, indicating that further partitioning does not significantly improve intra-cluster cohesion. As shown in Fig. A1, the elbow occurs at K=2, suggesting that two clusters sufficiently capture the dominant spatial patterns of MHWCI variability in the region.
The mean silhouette coefficient (Rousseeuw, 1987) was then calculated for each K using the same correlation distance metric. For a given observation i, the silhouette coefficient is defined as:
where a(i) is the average correlation distance between a point and all others in its own cluster, b(i) is the minimum average distance to points in another cluster. The silhouette coefficient ranges from −1 to +1, with higher values indicating better separation. It yielded a favorable score of 0.563 for k=2, confirming the stability and physical interpretability of the two-cluster partition.

Figure A1Elbow method validation of k-means clustering of marine heatwave cumulative intensity (MHWCI) in the North Sea. The within-cluster sum of squared correlation distances (WCSS) is shown as a function of cluster numbers. The red circle indicates the optimal number of clusters determined by the Elbow method. WCSS denotes the within-cluster sum of squared correlation distances and is a dimensionless clustering metric.
A temporal subsampling test was further conducted to assess the robustness of the clustering. The correlation-based k-means clustering was repeated using moving 30-year windows over 1982–2021, and cluster labels were matched to the full-period reference result according to maximum spatial overlap. The membership confidence was defined as the fraction of subsampling experiments in which each grid point remained in the same cluster as in the reference result. The mean and median confidence values are 0.933 and 1.000, respectively, with 89.1 % of grid points showing confidence ≥ 0.80 and 84.5 % showing confidence ≥ 0.90. Lower confidence is mainly confined to the transition zone and coastal or marginal regions, suggesting that the broad north-south partition is robust while the exact boundary should be interpreted cautiously (Fig. A2).

Figure A2Robustness of the k-means clustering based on temporal subsampling.
The code used for data analysis and visualization in this study is available at Zenodo with https://doi.org/10.5281/zenodo.20256573 (Lin, 2025).
All datasets are publicly available. Observational temperature datasets from OSTIA (Worsfold et al., 2024) were used in this manuscript, available at: https://doi.org/10.48670/moi-00168 (Worsfold, 2025). The Ferrybox data are available at https://doi.org/10.1594/PANGAEA.930383 (Macovei et al., 2021). The ERA5 (https://doi.org/10.24381/cds.f17050d7, Hersbach et al., 2023) and ORAS5 (https://doi.org/10.24381/cds.67e8eeb7, Copernicus Climate Change Service, 2021) are provided by the Copernicus Climate Change Service, available at: https://cds.climate.copernicus.eu/datasets/reanalysis-era5-single-levels-monthly-means?tab=overview (last access: 1 September 2024) and https://cds.climate.copernicus.eu/datasets/reanalysis-oras5?tab=overview (last access: 1 September 2024).
The supplement related to this article is available online at https://doi.org/10.5194/os-22-2287-2026-supplement.
YL and WZ conceived the study together. YL analyzed data and wrote the original draft under the supervision of WZ. ZL, ZF, QM, and WZ contributed to the revision of the text and helped to determine the final structure of the article.
The contact author has declared that none of the authors has any competing interests.
Publisher's note: Copernicus Publications remains neutral with regard to jurisdictional claims made in the text, published maps, institutional affiliations, or any other geographical representation in this paper. The authors bear the ultimate responsibility for providing appropriate place names. Views expressed in the text are those of the authors and do not necessarily reflect the views of the publisher.
The authors would like to thank Yoanna Voynova and Vlad-Alexandru Macovei from Helmholtz-Zentrum Hereon for providing information of the FerryBox installed on commercial vessels travelling in the North Sea.
This study is a contribution to the BMBF MARE:N project “Natural hazards and marine ECOsystem response – causal linkage and predictability (NECO)” (grant no. 03F0950A: Yuxin Lin, Wenyan Zhang). It is also supported by the Helmholtz research programme in PoF IV “Changing Earth – Sustaining our Future” – “Topic 4: Coastal Transition Zones under Natural and Human Pressure” (Wenyan Zhang). This work is also supported by a grant from the Research Grants Council of the Hong Kong Special Administrative Region, China (Project Reference Number AoE/P-601/23-N) and the National Natural Science Foundation of China (grant nos. 42230404 and U23A2023). Yuxin Lin is supported by grants from the China Scholarship Council.
The article processing charges for this open-access publication were covered by the Helmholtz-Zentrum Hereon.
This paper was edited by Aida Alvera-Azcárate and reviewed by three anonymous referees.
Ardilouze, C., Batté, L., Bunzel, F., Decremer, D., Déqué, M., Doblas-Reyes, F. J., Douville, H., Fereday, D., Guemas, V., MacLachlan, C., Müller, W., and Prodhomme, C.: Multi-model assessment of the impact of soil moisture initialization on mid-latitude summer predictability, Clim. Dynam., 49, 3959–3974, https://doi.org/10.1007/s00382-017-3555-7, 2017.
Artana, C., Rodrigues, R. R., Fevrier, J., and Coll, M.: Characteristics and drivers of marine heatwaves in the western South Atlantic, Commun. Earth Environ., 5, 555, https://doi.org/10.1038/s43247-024-01726-8, 2024.
Börgel, F., Frauen, C., Neumann, T., and Meier, M.: The Atlantic Multidecadal Oscillation controls the impact of the North Atlantic Oscillation on North European climate, Environ. Res. Lett., 15, https://doi.org/10.1088/1748-9326/aba925, 2020.
Brönnimann, S.: Impact of El Niño–Southern Oscillation on European climate, Rev. Geophys., 45, https://doi.org/10.1029/2006RG000199, 2007.
Chauhan, A., Smith, P., Rodrigues, F., Christensen, A., John, M., and Mariani, P.: Distribution and impacts of long-lasting marine heat waves on phytoplankton biomass, Front. Mar. Sci., 10, https://doi.org/10.3389/fmars.2023.1177571, 2023.
Chen, S., Chen, W., Wu, R., Yu, B., Graf, H.-F., Cai, Q., Ying, J., and Xing, W.: Atlantic multidecadal variability controls Arctic-ENSO connection, npj Clim. Atmos. Sci., 8, 44, https://doi.org/10.1038/s41612-025-00936-x, 2025.
Chen, W. and Staneva, J.: Characteristics and trends of marine heatwaves in the northwest European Shelf and the impacts on density stratification, in: 8th edition of the Copernicus Ocean State Report (OSR8), edited by: von Schuckmann, K., Moreira, L., Grégoire, M., Marcos, M., Staneva, J., Brasseur, P., Garric, G., Lionello, P., Karstensen, J., and Neukermans, G., Copernicus Publications, State Planet, 4-osr8, 7, https://doi.org/10.5194/sp-4-osr8-7-2024, 2024.
Chen, W., Staneva, J., Grayek, S., Schulz-Stellenfleth, J., and Greinert, J.: The role of heat wave events in the occurrence and persistence of thermal stratification in the southern North Sea, Nat. Hazards Earth Syst. Sci., 22, 1683–1698, https://doi.org/10.5194/nhess-22-1683-2022, 2022.
Copernicus Climate Change Service: ORAS5 global ocean reanalysis monthly data from 1958 to present, Copernicus Climate Change Service [data set], https://doi.org/10.24381/cds.67e8eeb7, 2021.
de Boisséson, E. and Balmaseda, M. A.: Predictability of marine heatwaves: assessment based on the ECMWF seasonal forecast system, Ocean Sci., 20, 265–278, https://doi.org/10.5194/os-20-265-2024, 2024.
Delworth, T. L. and Zeng, F.: The Impact of the North Atlantic Oscillation on Climate through Its Influence on the Atlantic Meridional Overturning Circulation, J. Climate, 29, 941–962, https://doi.org/10.1175/JCLI-D-15-0396.1, 2016.
Delworth, T. L., Zeng, F., Zhang, L., Zhang, R., Vecchi, G. A., and Yang, X.: The Central Role of Ocean Dynamics in Connecting the North Atlantic Oscillation to the Extratropical Component of the Atlantic Multidecadal Oscillation, J. Climate, 30, 3789–3805, https://doi.org/10.1175/JCLI-D-16-0358.1, 2017.
Deng, Y., Liu, Z., Zu, T., Hu, J., Gan, J., Lin, Y., Li, Z., Quan, Q., and Cai, Z.: Climatic Controls on the Interannual Variability of Shelf Circulation in the Northern South China Sea, J. Geophys. Res.-Oceans, 127, e2022JC018419, https://doi.org/10.1029/2022JC018419, 2022.
England, M. H., Li, Z., Huguenin, M. F., Kiss, A. E., Sen Gupta, A., Holmes, R. M., and Rahmstorf, S.: Drivers of the extreme North Atlantic marine heatwave during 2023, Nature, 642, 636–643, https://doi.org/10.1038/s41586-025-08903-5, 2025.
Fernández-Castillo, P., Losada, T., Rodríguez-Fonseca, B., García-Maroto, D., Mohino, E., and Durán, L.: Multidecadal variability of the ENSO early-winter teleconnection to Europe and implications for seasonal forecasting, npj Clim. Atmos. Sci., 8, 272, https://doi.org/10.1038/s41612-025-01160-3, 2025.
Frajka-Williams, E., Beaulieu, C., and Duchez, A.: Emerging negative Atlantic Multidecadal Oscillation index in spite of warm subtropics, Sci. Rep., 7, 11224, https://doi.org/10.1038/s41598-017-11046-x, 2017.
Gröger, M., Dutheil, C., Börgel, F., and Meier, M. H. E.: Drivers of marine heatwaves in a stratified marginal sea, Clim. Dynam., 62, 3231–3243, https://doi.org/10.1007/s00382-023-07062-5, 2024.
Hamdeno, M., Alvera-Azcárate, A., Krokos, G., and Hoteit, I.: Investigating the long-term variability of the Red Sea marine heatwaves and their relationship to different climate modes: focus on 2010 events in the northern basin, Ocean Sci., 20, 1087–1107, https://doi.org/10.5194/os-20-1087-2024, 2024. Hansen, F., Feser, F., and Zorita, E.: Day- and nighttime heatwave clusters over Europe and their physical drivers, EGU General Assembly 2024, Vienna, Austria, 14–19 April 2024, https://doi.org/10.5194/egusphere-egu24-16462, 2024.
Hersbach, H., Bell, B., Berrisford, P., Hirahara, S., Horányi, A., Muñoz Sabater, J., Nicolas, J., Peubey, C., Radu, R., Schepers, D., Simmons, A., Soci, C., Abdalla, S., Abellan, X., Balsamo, G., Bechtold, P., Biavati, G., Bidlot, J., Bonavita, M., and Thépaut, J. N.: The ERA5 global reanalysis, Q. J. Roy. Meteorol. Soc., 146, https://doi.org/10.1002/qj.3803, 2020.
Hersbach, H., Bell, B., Berrisford, P., Biavati, G., Horányi, A., Muñoz Sabater, J., Nicolas, J., Peubey, C., Radu, R., Rozum, I., Schepers, D., Simmons, A., Soci, C., Dee, D., and Thépaut, J.-N.: ERA5 monthly averaged data on single levels from 1940 to present, Copernicus Climate Change Service (C3S) Climate Data Store (CDS) [data set], https://doi.org/10.24381/cds.f17050d7, 2023.
Hobday, A. J. and Pecl, G. T.: Identification of global marine hotspots: sentinels for change and vanguards for adaptation action, Rev. Fish Biol. Fish., 24, 415–425, https://doi.org/10.1007/s11160-013-9326-6, 2014.
Hobday, A. J., Alexander, L. V., Perkins, S. E., Smale, D. A., Straub, S. C., Oliver, E. C. J., Benthuysen, J. A., Burrows, M. T., Donat, M. G., Feng, M., Holbrook, N. J., Moore, P. J., Scannell, H. A., Sen Gupta, A., and Wernberg, T.: A hierarchical approach to defining marine heatwaves, Prog. Oceanogr., 141, 227–238, https://doi.org/10.1016/j.pocean.2015.12.014, 2016.
Holbrook, N. J., Scannell, H. A., Sen Gupta, A., Benthuysen, J. A., Feng, M., Oliver, E. C. J., Alexander, L. V., Burrows, M. T., Donat, M. G., Hobday, A. J., Moore, P. J., Perkins-Kirkpatrick, S. E., Smale, D. A., Straub, S. C., and Wernberg, T.: A global assessment of marine heatwaves and their drivers, Nat. Commun., 10, 2624, https://doi.org/10.1038/s41467-019-10206-z, 2019.
Hou, J., Fang, Z., and Geng, X.: Recent Strengthening of the ENSO Influence on the Early Winter East Atlantic Pattern, Atmosphere, 14, 1809, https://doi.org/10.3390/atmos14121809, 2023.
Jacobeit, J.: Classifications in climate research, Phys. Chem. Earth Pt. A/B/C, 35, 411–421, https://doi.org/10.1016/j.pce.2009.11.010, 2010.
Jacox, M. G., Alexander, M. A., Amaya, D., Becker, E., Bograd, S. J., Brodie, S., Hazen, E. L., Pozo Buil, M., and Tommasi, D.: Global seasonal forecasts of marine heatwaves, Nature, 604, 486–490, https://doi.org/10.1038/s41586-022-04573-9, 2022.
Jain, A. K.: Data clustering: 50 years beyond K-means, Pattern Recog. Lett., 31, 651–666, https://doi.org/10.1016/j.patrec.2009.09.011, 2010.
Jiménez-Esteve, B. and Domeisen, D. I. V.: The Tropospheric Pathway of the ENSO–North Atlantic Teleconnection, J. Climate, 31, 4563–4584, https://doi.org/10.1175/JCLI-D-17-0716.1, 2018.
Josey, S. A. and Sinha, B.: Subpolar Atlantic Ocean mixed layer heat content variability is increasingly driven by an active ocean, Commun. Earth Environ., 3, 111, https://doi.org/10.1038/s43247-022-00433-6, 2022.
Kerr, R. A.: A North Atlantic Climate Pacemaker for the Centuries, Science, 288, 1984–1985, https://doi.org/10.1126/science.288.5473.1984, 2000.
Levine, A. F. Z., McPhaden, M. J., and Frierson, D. M. W.: The impact of the AMO on multidecadal ENSO variability, Geophys. Res. Lett., 44, 3877–3886, https://doi.org/10.1002/2017GL072524, 2017.
Lin, Y.: Climate Modes Synergistically Influence Marine Heatwaves in the North Sea, Zenodo [code], https://doi.org/10.5281/zenodo.20256573, 2025.
Liu, K., Xu, K., Zhu, C., and Liu, B.: Diversity of Marine Heatwaves in the South China Sea Regulated by ENSO Phase, J. Climate, 35, 877–893, https://doi.org/10.1175/JCLI-D-21-0309.1, 2022.
Liu, Q. Y., Wang, D., Wang, X., Shu, Y., Xie, Q., Chen, J., Liu, Q. Y., Wang, D., Wang, X., and Shu, Y.: Thermal variations in the South China Sea associated with the eastern and central Pacific El Nino events and their mechanisms, J. Geophys. Res.-Oceans, 119, 8955–8972, https://doi.org/10.1002/2014JC010429, 2014.
Lloyd, S.: Least squares quantization in PCM, IEEE T. Inform. Theory, 28, 129–137, https://doi.org/10.1109/TIT.1982.1056489, 1982.
Macovei, V.-A. Voynova, Y. G, Gehrung, M., and Petersen, W.: Ship-of-Opportunity, FerryBox-integrated, membrane-based sensor pCO2, temperature and salinity measurements in the surface North Sea since 2013, PANGAEA [data set], https://doi.org/10.1594/PANGAEA.930383, 2021.
Marin, M., Feng, M., Phillips, H. E., and Bindoff, N. L.: A Global, Multiproduct Analysis of Coastal Marine Heatwaves: Distribution, Characteristics, and Long-Term Trends, J. Geophys. Res.- Oceans, 126, e2020JC016708, https://doi.org/10.1029/2020JC016708, 2021.
Mathis, M. and Pohlmann, T.: Projection of physical conditions in the North Sea for the 21st century, Clim. Res., 61, 1–17, https://doi.org/10.3354/cr01232, 2014.
McAdam, R., Masina, S., and Gualdi, S.: Seasonal forecasting of subsurface marine heatwaves, Commun. Earth Environ., 4, 225, https://doi.org/10.1038/s43247-023-00892-5, 2023.
McGregor, S., Timmermann, A., Stuecker, M. F., England, M. H., Merrifield, M., Jin, F.-F., and Chikamoto, Y.: Recent Walker circulation strengthening and Pacific cooling amplified by Atlantic warming, Nat. Clim. Change, 4, 888–892, https://doi.org/10.1038/nclimate2330, 2014.
Mi, C., Yi, A., Xue, J., Dong, C., and Shan, H.: Forecasting summer marine heatwaves in the South China Sea using explainable machine learning models, Deep-Sea Res. Pt. I, 218, 104457, https://doi.org/10.1016/j.dsr.2025.104457, 2025.
Moat, B. I., Smeed, D. A., Frajka-Williams, E., Desbruyères, D. G., Beaulieu, C., Johns, W. E., Rayner, D., Sanchez-Franks, A., Baringer, M. O., Volkov, D., Jackson, L. C., and Bryden, H. L.: Pending recovery in the strength of the meridional overturning circulation at 26° N, Ocean Sci., 16, 863–874, https://doi.org/10.5194/os-16-863-2020, 2020.
Mohamed, B., Ibrahim, O., and Nagy, H.: Sea Surface Temperature Variability and Marine Heatwaves in the Black Sea, Remote Sens., 14, 2383, https://doi.org/10.3390/rs14102383, 2022.
Mohamed, B., Barth, A., and Alvera-Azcárate, A.: Extreme marine heatwaves and cold-spells events in the Southern North Sea: classifications, patterns, and trends, Front. Mar. Sci., 10, https://doi.org/10.3389/fmars.2023.1258117, 2023.
Mohamed, B., Barth, A., and Alvera-Azcárate, A.: The summer marine heatwaves in the North Sea in 2023, EGU General Assembly 2024, Vienna, Austria, 14–19 April 2024, EGU24-8900, https://doi.org/10.5194/egusphere-egu24-8900, 2024.
Mohamed, B., Barth, A., Van der Zande, D., and Alvera-Azcárate, A.: Amplified warming and marine heatwaves in the North Sea under a warming climate and their impacts, Ocean Sci., 21, 2505–2525, https://doi.org/10.5194/os-21-2505-2025, 2025.
Mooney, C.: Why some scientists are worried about a cold `blob' in the North Atlantic ocean, Washington Post, 24 September 2015, https://www.washingtonpost.com/news/energy-environment/wp/2015/09/24/why-some-scientists-are- worried-about-a-cold-blob-in-the-north-atlantic-ocean/?utm term=.24388ab9clec (last access: 27 July 2026), 2015.
Oliver, E. C. J., Perkins-Kirkpatrick, S. E., Holbrook, N. J., and Bindoff, N. L.: Anthropogenic and Natural Influences on Record 2016 Marine Heat waves, B. Am. Meteorol. Soc., 99, S44–S48, https://doi.org/10.1175/BAMS-D-17-0093.1, 2018a.
Oliver, E. C. J., Donat, M. G., Burrows, M. T., Moore, P. J., Smale, D. A., Alexander, L. V., Benthuysen, J. A., Feng, M., Sen Gupta, A., Hobday, A. J., Holbrook, N. J., Perkins-Kirkpatrick, S. E., Scannell, H. A., Straub, S. C., and Wernberg, T.: Longer and more frequent marine heatwaves over the past century, Nat. Commun., 9, 1324, https://doi.org/10.1038/s41467-018-03732-9, 2018b.
Oshika, M., Tachibana, Y., and Nakamura, T.: Impact of the winter North Atlantic Oscillation (NAO) on the Western Pacific (WP) pattern in the following winter through Arctic sea ice and ENSO: part I – observational evidence, Clim. Dynam., 45, 1355–1366, https://doi.org/10.1007/s00382-014-2384-1, 2015.
Patterson, M., Weisheimer, A., Befort, D. J., and O'Reilly, C. H.: The strong role of external forcing in seasonal forecasts of European summer temperature, Environ. Res. Lett., 17, 104033, https://doi.org/10.1088/1748-9326/ac9243, 2022.
Pearce, A., Lenanton, R., Jackson, G., Moore, J., Feng, M., and Gaughan, D.: The “marine heat wave” off Western Australia during the summer of 2010/11, Fisheries Research Report No. 222, Department of Fisheries, Western Australia, 40 pp., 2011.
Plaut, G. and Simonnet, E.: Large-scale circulation classification, weather regimes, and local climate over France, the Alps and Western Europe, Clim. Res., 17, 303–324, https://doi.org/10.3354/cr017303, 2001.
Podesta, G. and Glynn, P.: The 1997–98 El Niño event in Panama and Galápagos: An update of thermal stress indices relative to coral bleaching, Bull. Mar. Sci., 69, 43–59, 2001.
Quante, M. and Colijn, F.: North Sea Region Climate Change Assessment, Springer, https://doi.org/10.1007/978-3-319-39745-0, 2016.
Radin, C. and Nieves, V.: Unveiling Regional Climate Patterns Through Global Subsurface Ocean Temperature Data: An AI Multi-Layer Analysis Framework, Earth Syst. Environ., 8, 1673–1681, https://doi.org/10.1007/s41748-024-00409-w, 2024.
Radin, C., Nieves, V., Vicens-Miquel, M., and Alvarez-Morales, J. L.: Harnessing Machine Learning to Decode the Mediterranean's Climate Canvas and Forecast Sea Level Changes, Climate, 12, 127, https://doi.org/10.3390/cli12080127, 2024.
Rousseeuw, P. J.: Silhouettes: A graphical aid to the interpretation and validation of cluster analysis, J. Comput. Appl. Math., 20, 53–65, https://doi.org/10.1016/0377-0427(87)90125-7, 1987.
Santos, C. A. G., Brasil Neto, R. M., da Silva, R. M., and Costa, S. G. F.: Cluster Analysis Applied to Spatiotemporal Variability of Monthly Precipitation over Paraíba State Using Tropical Rainfall Measuring Mission (TRMM) Data, Remote Sens., 11, 637, https://doi.org/10.3390/rs11060637, 2019.
Saranya, J. S., Roxy, M. K., Dasgupta, P., and Anand, A.: Genesis and Trends in Marine Heatwaves Over the Tropical Indian Ocean and Their Interaction With the Indian Summer Monsoon, J. Geophys. Res.-Oceans, 127, e2021JC017427, https://doi.org/10.1029/2021JC017427, 2022.
Scaife, A. A., Dunstone, N., Hardiman, S., Ineson, S., Li, C., Lu, R., Pang, B., Klein-Tank, A., Smith, D., Van Niekerk, A., Renwick, J., and Williams, N.: ENSO affects the North Atlantic Oscillation 1 year later, Science, 386, 82–86, https://doi.org/10.1126/science.adk4671, 2024.
Scannell, H. A., Pershing, A. J., Alexander, M. A., Thomas, A. C., and Mills, K. E.: Frequency of marine heatwaves in the North Atlantic and North Pacific since 1950, Geophys. Res. Lett., 43, 2069–2076, https://doi.org/10.1002/2015GL067308, 2016.
Shackelford, K., DeMott, C. A., van Leeuwen, P. J., and Barnes, E. A.: A Regimes-Based Approach to Identifying Seasonal State-Dependent Prediction Skill, J. Geophys. Res.-Atmos., 130, e2024JD042917, https://doi.org/10.1029/2024JD042917, 2025.
Sun, C., Li, J., and Jin, F.-F.: A delayed oscillator model for the quasi-periodic multidecadal variability of the NAO, Clim. Dynam., 45, 2083–2099, https://doi.org/10.1007/s00382-014-2459-z, 2015.
Syakur, M. A., Khotimah, B. K., Rochman, E. M. S., and Satoto, B. D.: Integration K-Means Clustering Method and Elbow Method For Identification of The Best Customer Profile Cluster, IOP Conf. Ser.: Mater. Sci. Eng., 336, 012017, https://doi.org/10.1088/1757-899X/336/1/012017, 2018.
Takaya, K. and Nakamura, H.: A Formulation of a Phase-Independent Wave-Activity Flux for Stationary and Migratory Quasigeostrophic Eddies on a Zonally Varying Basic Flow, J. Atmos. Sci., 58, 608–627, https://doi.org/10.1175/1520-0469(2001)058<0608:AFOAPI>2.0.CO;2, 2001.
Tan, W., Wang, X., Wang, W., Wang, C., and Zuo, J.: Different Responses of Sea Surface Temperature in the South China Sea to Various El Niño Events during Boreal Autumn, J. Climate, 29, 1127–1142, https://doi.org/10.1175/JCLI-D-15-0338.1, 2016.
Thornton, H. E., Smith, D. M., Scaife, A. A., and Dunstone, N. J.: Seasonal Predictability of the East Atlantic Pattern in Late Autumn and Early Winter, Geophys. Res. Lett., 50, e2022GL100712, https://doi.org/10.1029/2022GL100712, 2023.
Trenberth, K. E. and Shea, D. J.: Atlantic hurricanes and natural variability in 2005, Geophys. Res. Lett., 33, https://doi.org/10.1029/2006GL026894, 2006.
van der Molen, J. and Pätsch, J.: An overview of Atlantic forcing of the North Sea with focus on oceanography and biogeochemistry, J. Sea Res., 189, 102281, https://doi.org/10.1016/j.seares.2022.102281, 2022.
Vogt, L., Burger, F., Griffies, S., and Frölicher, T.: Local Drivers of Marine Heatwaves: A Global Analysis With an Earth System Model, Front. Clim., 4, https://doi.org/10.3389/fclim.2022.847995, 2022.
Wang, Y. and Zhou, Y.: Seasonal dynamics of global marine heatwaves over the last four decades, Front. Mar. Sci., 11, https://doi.org/10.3389/fmars.2024.1406416, 2024.
Wicker, W., Harnik, N., Pyrina, M., and Domeisen, D. I. V.: Heatwave Location Changes in Relation to Rossby Wave Phase Speed, Geophys. Res. Lett., 51, e2024GL108159, https://doi.org/10.1029/2024GL108159, 2024.
Woollings, T., Barriopedro, D., Methven, J., Son, S.-W., Martius, O., Harvey, B., Sillmann, J., Lupo, A. R., and Seneviratne, S.: Blocking and its Response to Climate Change, Curr. Clim. Change Rep., 4, 287–300, https://doi.org/10.1007/s40641-018-0108-z, 2018.
Worsfold, M.: Global Ocean OSTIA Sea Surface Temperature and Sea Ice Reprocessed, EU Copernicus Marine Service Information (CMEMS), Marine Data Store (MDS) [data set], https://doi.org/10.48670/moi-00168, 2025.
Worsfold, M., Good, S., Atkinson, C., and Embury, O.: Presenting a Long-Term, Reprocessed Dataset of Global Sea Surface Temperature Produced Using the OSTIA System, Remote Sens., 16, 3358, https://doi.org/10.3390/rs16183358, 2024.
Xue, J., Zhang, W., Zhang, Y., Luo, J.-J., Zhu, H., Sun, C., and Yamagata, T.: Interdecadal modulation of Ningaloo Niño/Niña strength in the Southeast Indian Ocean by the Atlantic Multidecadal Oscillation, Nat. Commun., 16, 1966, https://doi.org/10.1038/s41467-025-57160-7, 2025.
Yan, Y., Chai, F., Xue, H., and Wang, G.: Record-Breaking Sea Surface Temperatures in the Yellow and East China Seas, J. Geophys. Res.-Oceans, 125, e2019JC015883, https://doi.org/10.1029/2019JC015883, 2020.
Zhao, Z. and Marin, M.: A MATLAB toolbox to detect and analyze marine heatwaves Software, J. Open Sour. Softw., 4, https://doi.org/10.21105/joss.01124, 2019.
Zuo, H., Balmaseda, M. A., Tietsche, S., Mogensen, K., and Mayer, M.: The ECMWF operational ensemble reanalysis–analysis system for ocean and sea ice: a description of the system and assessment, Ocean Sci., 15, 779–808, https://doi.org/10.5194/os-15-779-2019, 2019.