
the Creative Commons Attribution 4.0 License.
the Creative Commons Attribution 4.0 License.
 | 28 Jul 2026
Documenting the 2015–2017 freshening of the eastern Eurasian Basin of the Arctic Ocean and evaluating its drivers and consequences
Dolly More
Andrey V. Pnyushkov
The Arctic Ocean is undergoing rapid change, with freshwater playing a central role in shaping stratification, vertical heat exchange, and sea-ice loss. Using long-term observations from the Nansen and Amundsen Basins Observational System (NABOS), we document a strong freshening event in the eastern Eurasian Basin between late 2015 and early 2017. During this period, salinity in the upper 175 m decreased by ∼ 0.5 psu, equivalent to an additional ∼ 0.6 m of freshwater, relative to the preceding (2013–2015) and following (2017–2018) years. The anomaly originated on the Kara Sea shelves in 2014–2015, when exceptional Yenisey and Ob discharge provided a combined freshwater surplus of ∼ 0.78 m, sufficient to explain the observed freshening. Trajectory analysis traced the freshwater anomaly to the Kara Sea, with transport times of 8–9 months to the shelf and 22–23 months to offshore. The resulting enhanced stratification suppressed upper-ocean currents by ∼ 22 % and vertical shear by ∼ 50 %. These changes enabled thicker sea ice to persist through the summers of 2016–2017, in contrast to near-ice-free conditions in adjacent years. While wind anomalies aided the retention of freshwater along the slope, anomalous river discharge was the dominant driver of the event. Overall, the 2015–2017 event demonstrates how episodic river discharge events can restructure upper-ocean stratification, reduce oceanic heat fluxes, and lead to delayed melt and increased summer sea ice, highlighting the sensitivity of upper-ocean processes and sea ice to episodic freshwater forcing in the Arctic.
- Article
(15471 KB) - Full-text XML
-
Supplement
(1892 KB) - BibTeX
- EndNote


The Arctic is warming faster than any other region on Earth, with profound physical and ecological consequences. Rising air temperatures, declining sea ice, ocean warming, and intensified hydrological cycles define this transformation. Surface air temperature has increased by ∼ 1.5°C per century since 1901, while the Arctic Ocean interior has warmed by ∼ 0.8°C per century (IPCC, 2021). Sea-ice extent has declined by ∼ 0.3 million km2 per decade since 1979 (Cavalieri et al., 2003).
Among the key consequences of this warming is the increasing input and redistribution of freshwater from rivers, glacial melt, and precipitation (Haine et al., 2015; Alkire et al., 2017). Although the Arctic Ocean covers only a small fraction of the global ocean area, it holds a disproportionately large share of the global ocean's freshwater (Serreze et al., 2006). Model projections suggest that Arctic River discharge could rise by 20 %–50 % by 2100 (Haine et al., 2015; Stadnyk et al., 2021; Rawlins and Karmalkar, 2024). Surface freshwater accumulation strengthens upper-ocean stratification, forming a low-salinity cap that insulates sea ice from underlying Atlantic Water (AW) heat (Carmack et al., 2015; Polyakov et al., 2013, 2020b). Conversely, surface salinification weakens stratification, promotes vertical mixing, and accelerates sea-ice melt.
Recent observations highlight the strong control of freshwater on sea-ice variability. In the Canadian Basin, enhanced freshwater since 2007 suppressed oceanic heat fluxes and temporarily slowed summer ice loss in the late 2010s (Polyakov et al., 2023). Such episodes demonstrate how regional freshwater dynamics can modulate or even interrupt long-term sea-ice decline.
The Siberian Arctic plays a central role in these processes. About 11 % of global river discharge enters the Arctic Ocean (Dai and Trenberth, 2002), and roughly 65 % of this input comes from the Ob, Yenisey, and Lena Rivers (Haine et al., 2015; Shiklomanov et al., 2021). These rivers deliver freshwater and dissolved materials that influence stratification, nutrient distribution, and biological productivity on the Siberian shelves (Dittmar and Kattner, 2003; Yamamoto-Kawai et al., 2013). The deep Arctic basins, connected to these shelves, receive much of this freshwater through complex interactions among shelf–basin exchange, wind forcing, and the AW boundary current (Aksenov et al., 2011; Pnyushkov et al., 2015; Baumann et al., 2018).
Despite growing observations, the relative contributions of river discharge, shelf storage, and cross-slope transport to large-scale freshening events remain poorly constrained (Pemberton et al., 2014; Timmermans and Marshall, 2020; Laukert et al., 2025). Sparse sampling beneath sea ice limits our ability to track freshwater pathways and variability. Models often poorly resolve mesoscale processes that redistribute freshwater (Nguyen et al., 2011; Müller et al., 2024), leading to biases in simulated freshwater storage and export (Hoffman et al., 2023). Moreover, changes in river discharge timing and snowmelt patterns further complicate predictions of freshwater release and retention (Rawlins et al., 2010; Stroeve et al., 2014).
This study addresses these gaps by examining the 2015–2017 extreme freshening event in the eastern Eurasian Basin. The objectives are to (1) quantify how riverine freshwater from the Yenisey and Ob Rivers contributed to this event, (2) investigate its pathways, transport timescales, and shelf–slope retention processes, and (3) assess its impacts on upper-ocean stratification, halocline structure, and sea-ice persistence. Using long-term mooring records, hydrographic observations, and reanalysis products, we evaluate how enhanced stratification during this event suppressed vertical shear and reduced upward heat flux from AW, enabling thicker and longer-lasting sea ice. By linking freshwater sources to their physical impacts, this study provides new insight into how anomalous river-driven freshening modulates upper-ocean structure and sea-ice variability in the Eurasian Basin.
2.1 Oceanic data
2.1.1 Mooring observations
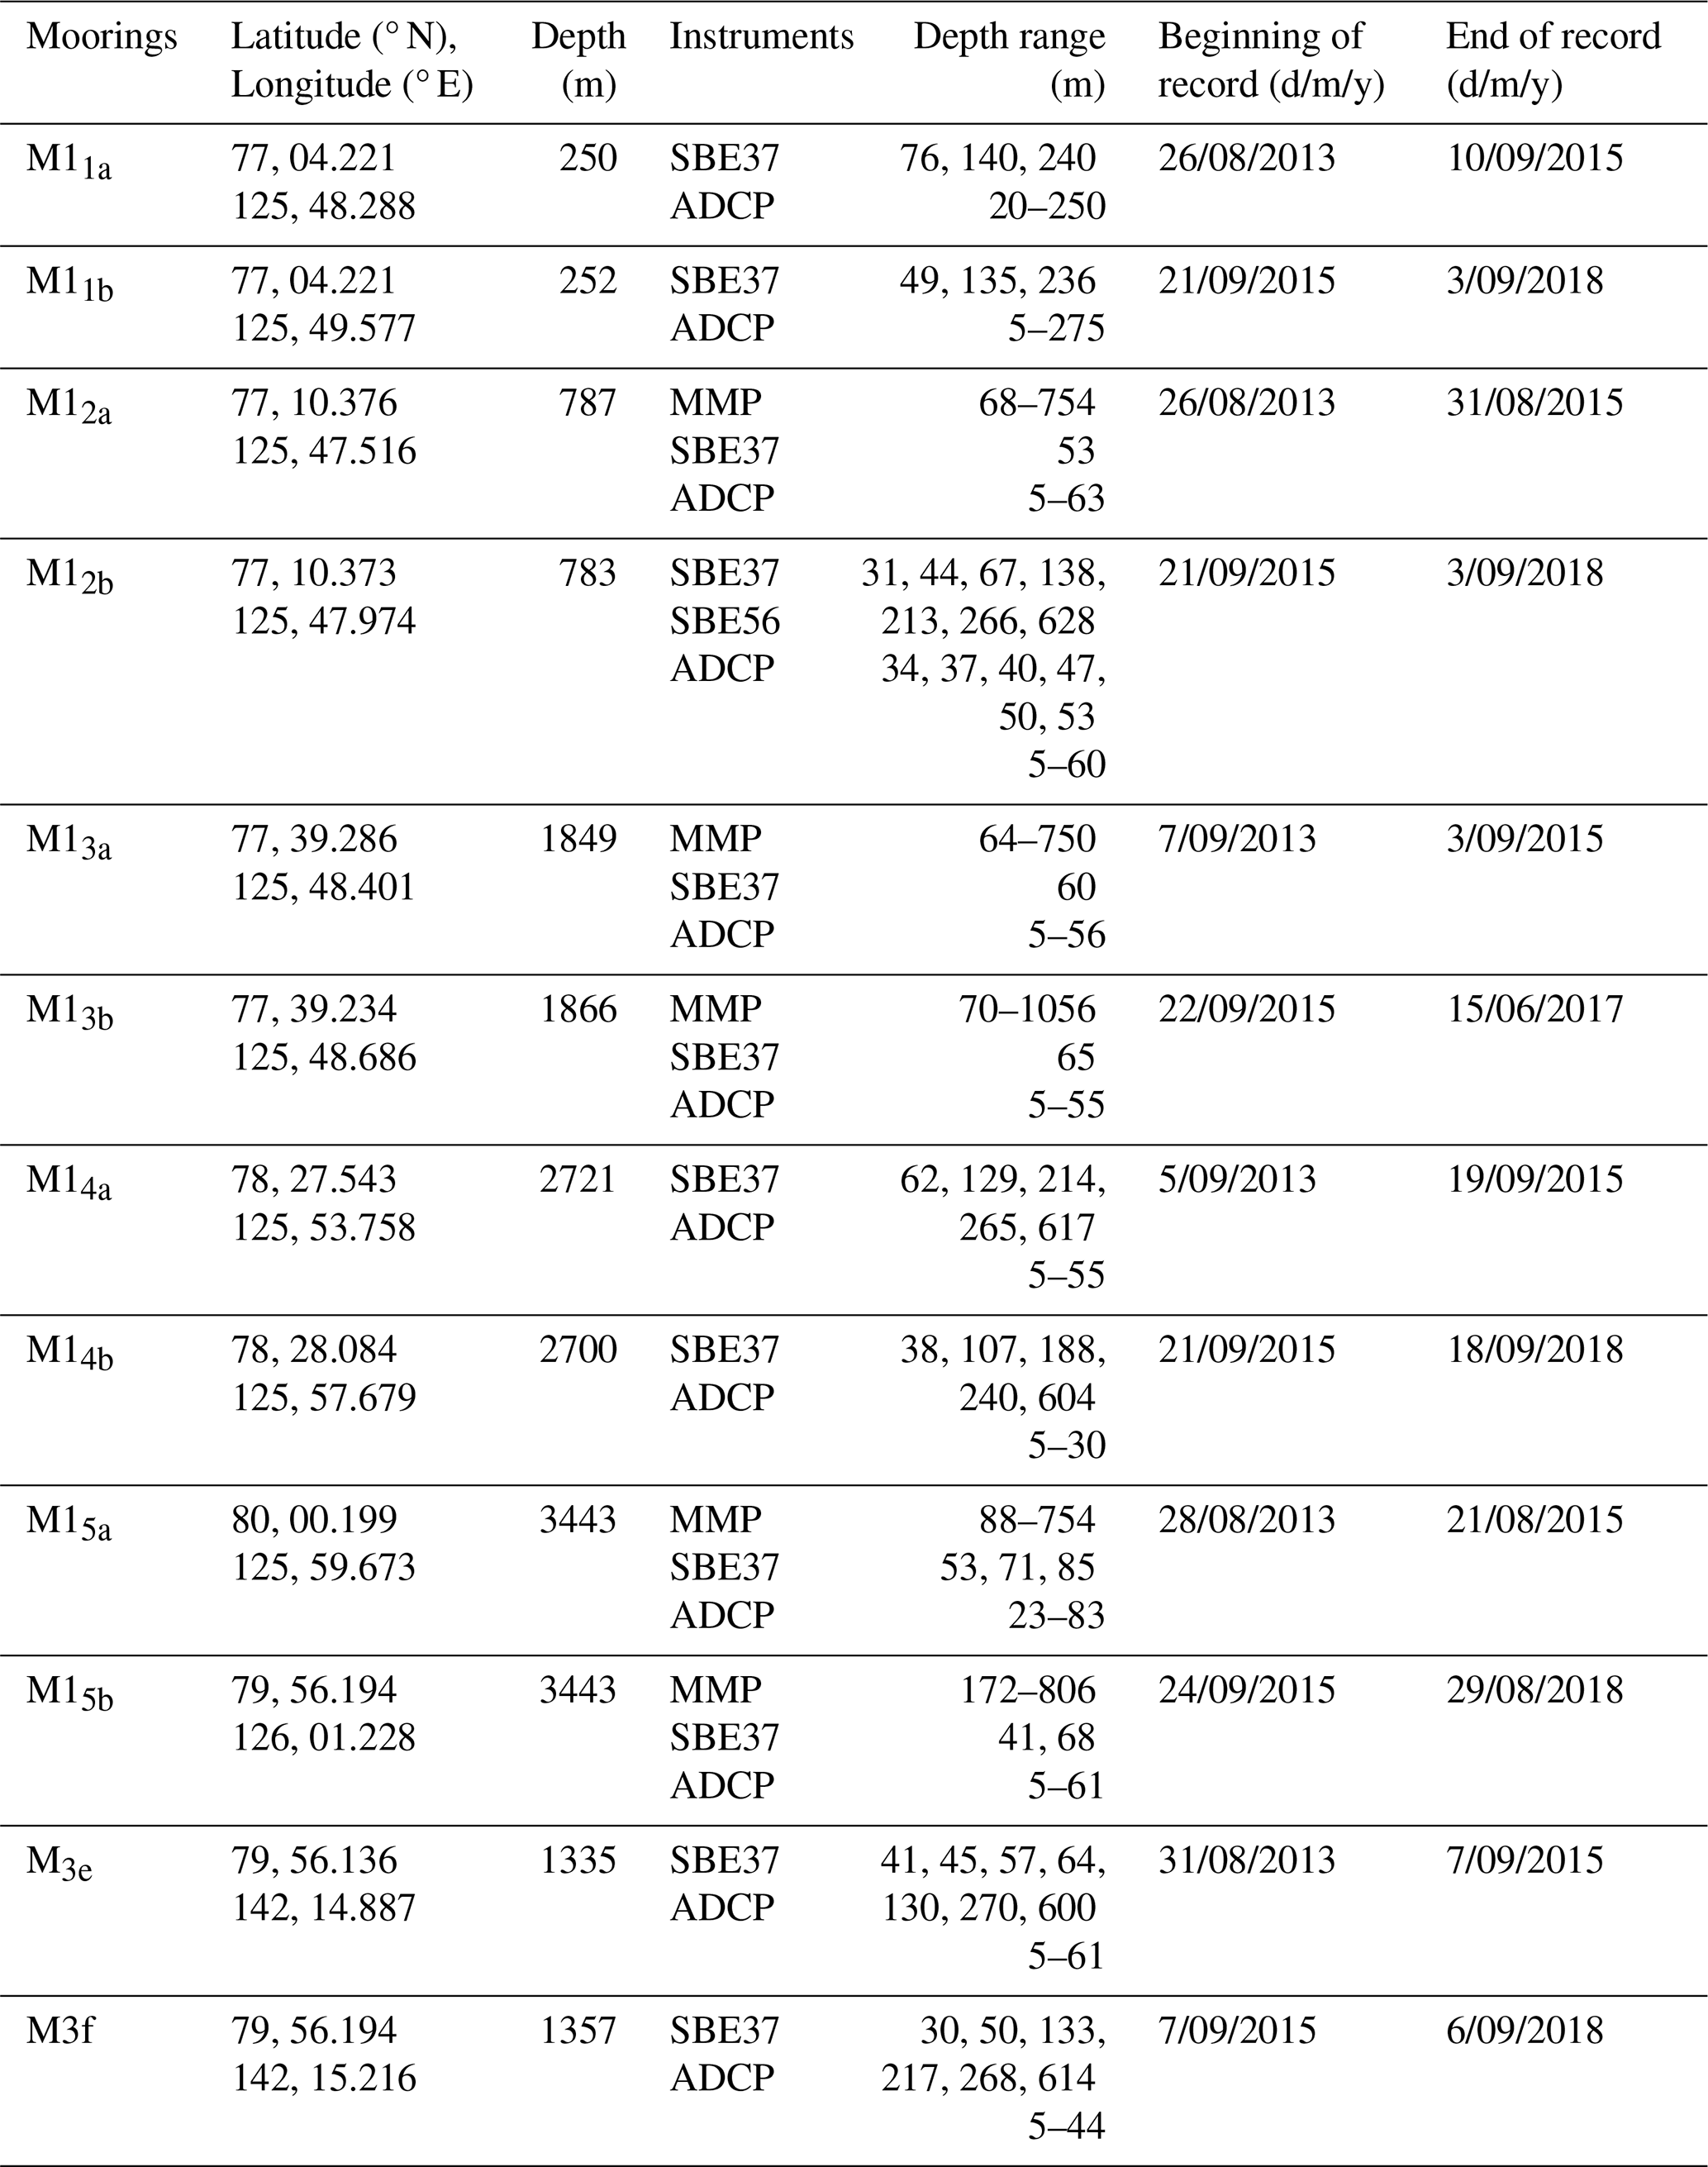
Our analysis uses records from six moorings (M11, M12, M13, M14, M15, and M3) deployed in the eastern Eurasian Basin, spanning the continental slope from the shallower near-shelf region to the deeper offshore slope between September 2013 and September 2018 (Fig. 1; Table 1). Together, these moorings sampled depths from approximately 30 to 2700 m (depth ranges for individual moorings are listed in Table 1). Most moorings conducted CTD (Conductivity–Temperature–Depth) observations using fixed-depth SBE37 microcat instruments, complemented by SBE56 thermistors. Two moorings (M13 and M15) were equipped with McLane Moored Profilers (MMPs; Table 1), which measured vertical profiles of temperature, salinity, and currents every two days at a profiling speed of ∼ 25 cm s−1, achieving ∼ 12 cm vertical spacing with a 0.5 s sampling interval. The MMPs provided temperature and conductivity measurements with calibration accuracies of ±0.002 °C and ±0.002 mS cm−1, respectively. The SBE37 recorded data every 15 min with accuracies of ±0.002 °C for temperature and ±0.003 mS cm−1 for conductivity. The SBE56 temperature sensors had an accuracy of ±0.002 °C.
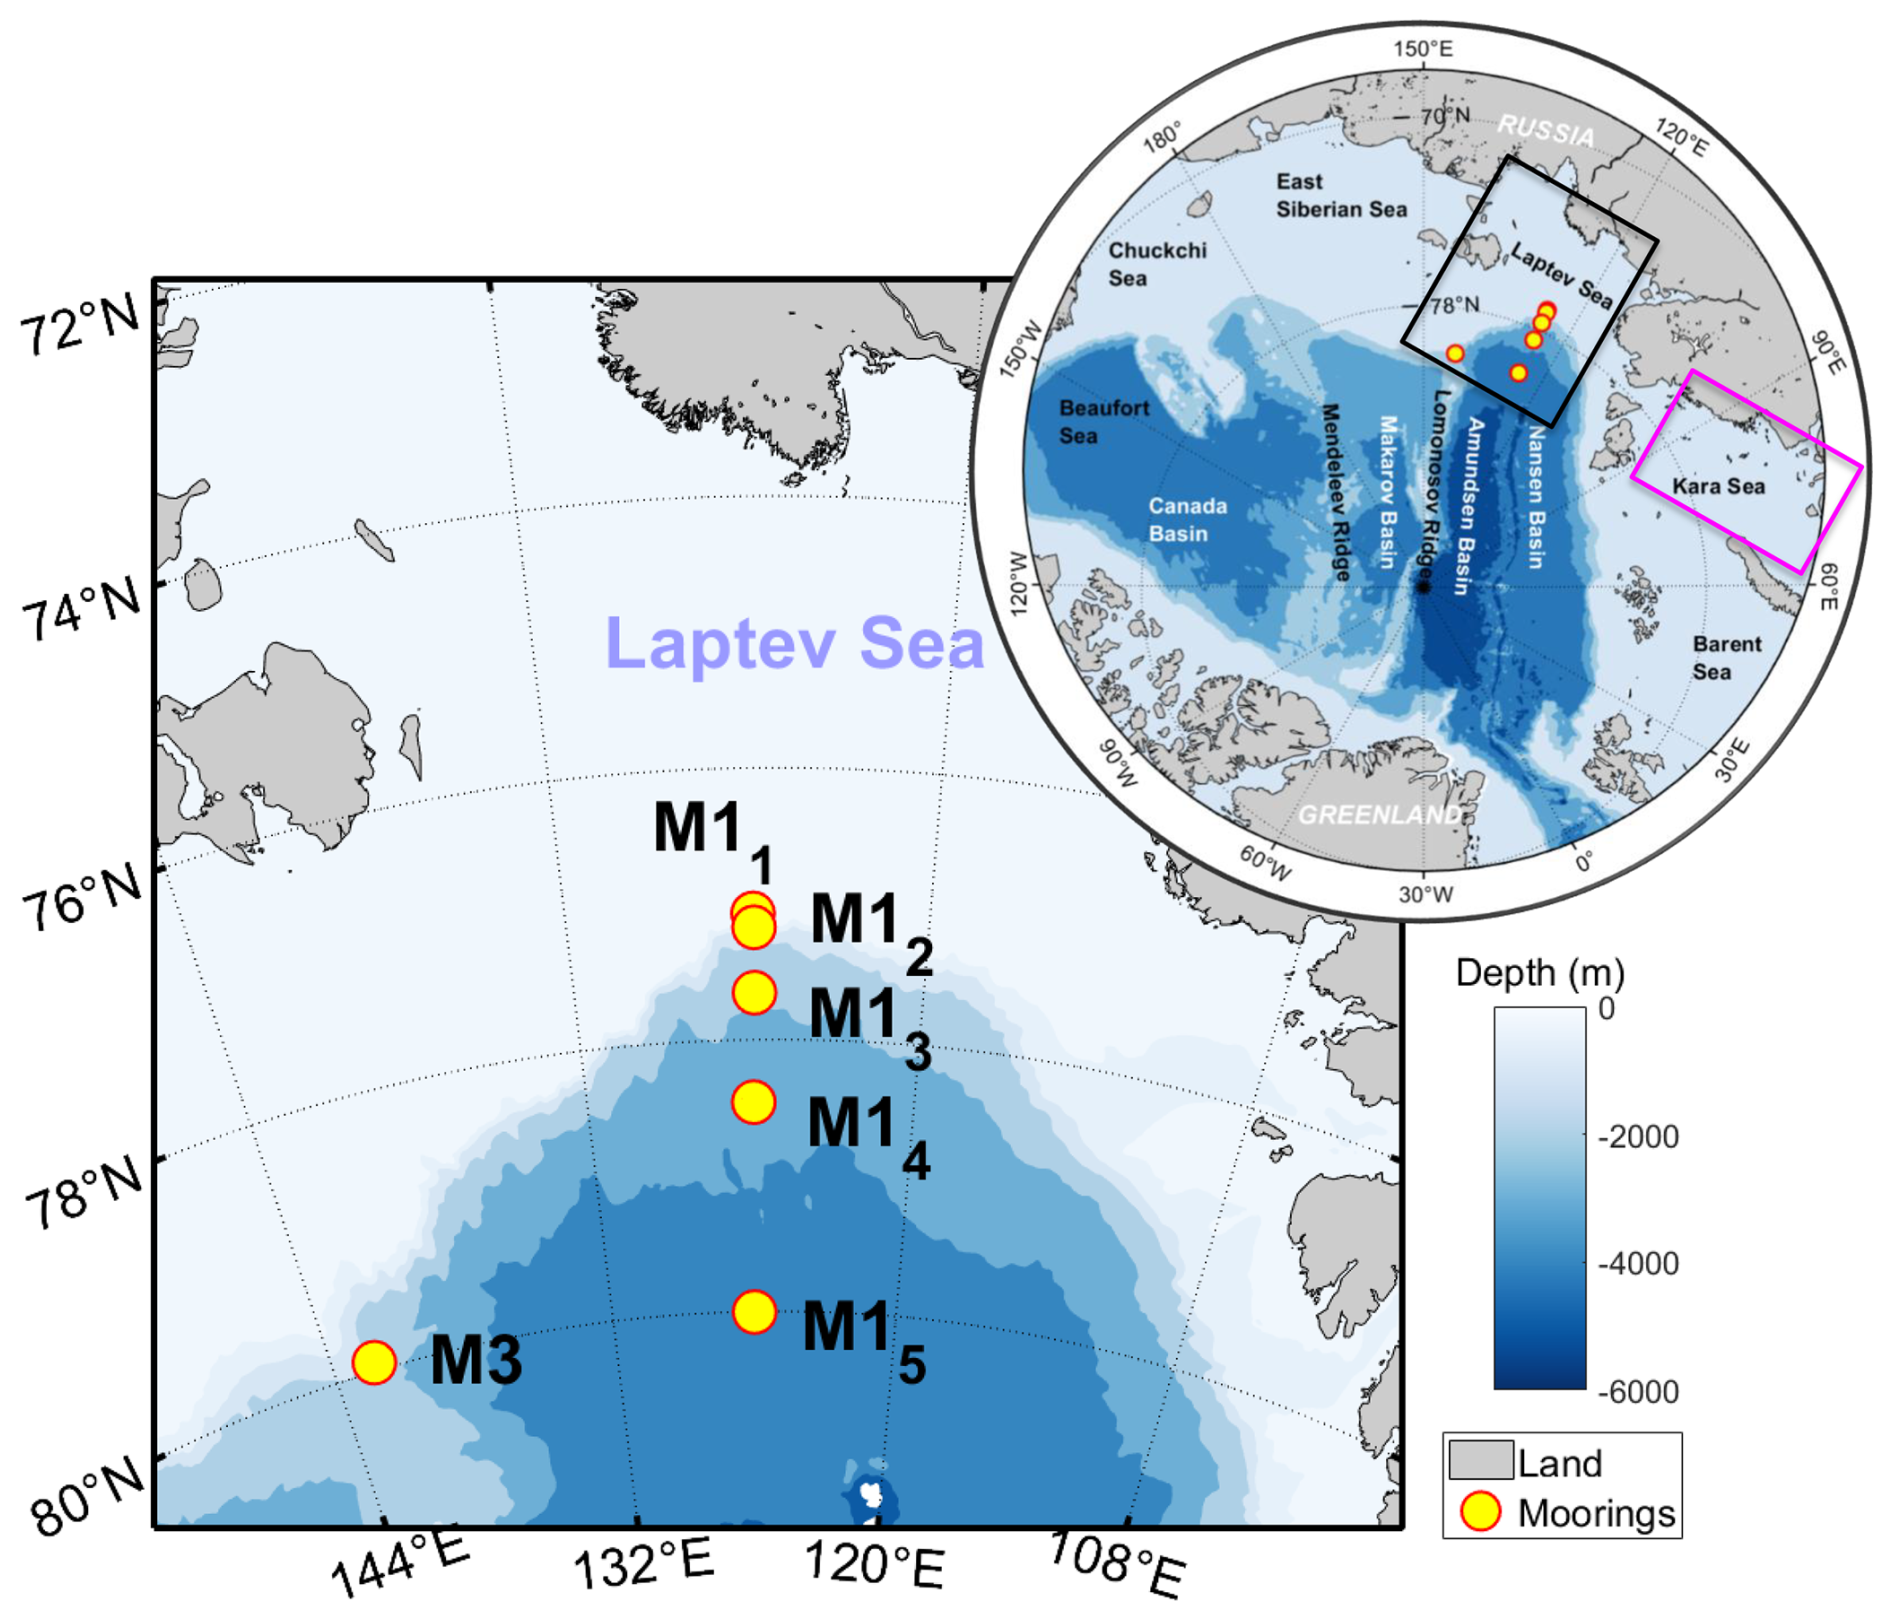
Figure 1Bathymetry map of the eastern Eurasian Basin (shaded by depth, in meters) showing the locations of six NABOS moorings (yellow circles). The inset in the upper right shows the Arctic Ocean, with the Laptev Sea region outlined by a black box, and the Kara Sea area used to compute the Kara Sea salinity time series identified by the magenda box.
Table 1Summary of the NABOS mooring data used in this study, including instrument details. For mooring locations, see Fig. 1.
Current measurements were obtained using 300 kHz Acoustic Doppler Current Profilers (ADCPs) and MMPs. ADCPs measured velocity in 2 m vertical bins with at least 1 h time resolution and an accuracy of 0.5 % of measured speed and 2° for direction. The acoustic current meters on MMPs have a velocity error of ±0.5 cm s−1. Directional accuracy of the MMP compass is 2°, but in the Arctic, errors can reach up to 30° due to weak horizontal geomagnetic fields (Thurnherr et al., 2017).
For this study, we merged data from two consecutive mooring deployments (2013–2015 and 2015–2018) to create continuous temperature and salinity time series on a unified 2 m vertical grid using linear interpolation. All eastern Eurasian Basin mooring data were collected and made publicly available by the Nansen and Amundsen Basins Observational System (NABOS) at the University of Alaska Fairbanks (https://uaf-iarc.org/nabos/data/, last access: 10 May 2026).
2.1.2 Water mass fraction data
Concentrations of meteoric water (MW) and sea-ice meltwater (SIM) fractions were derived from macronutrient observations described in Polyakov et al. (2020a) and available through the Arctic Data Center (Whitmore et al., 2023). The dataset includes discrete measurements of oxygen isotope composition (δ18O) and salinity collected during oceanographic cruises across the Arctic Ocean between 1981 and 2017, primarily during May–October at latitudes north of 60° N. Seawater samples were obtained using Niskin bottles at selected depths, and δ18O and salinity were used to calculate MW and SIM fractions. Temperature, salinity, and oxygen data from accompanying CTD profiles were matched to sampling depths, and discrete measurements were used to validate sensor accuracy. In this study, we use MW and SIM fraction data from 2013 and 2015 to examine changes in freshwater composition in the Kara and Laptev Seas preceding and during the onset of the 2015–2017 freshening event.
These MW and SIM fractions are derived quantities based on end-member analysis (e.g., salinity, water mass contributions, and δ18O) and therefore carry larger uncertainties, typically on the order of ±0.01–0.02 in fractional units. While the freshwater anomaly remains detectable in salinity down to greater depths, the corresponding MW fraction becomes small relative to its uncertainty and is thus not well resolved. In addition, vertical mixing and dilution reduce the distinct meteoric water signature with depth, even when the total freshwater anomaly persists. Consequently, the increase in MW from 2013 to 2015 appears confined to the upper ∼ 25 m, where the signal-to-noise ratio is highest.
2.2 Sea ice concentration
Sea ice concentration data were obtained from the Advanced Very High-Resolution Radiometer satellite archive, which provides global daily sea ice concentration from 1981 to 2021 at 0.25° × 0.25° spatial resolution (Comiso, 2017). For this study, we used the data corresponding to the mooring deployment period (September 2013 to September 2018). Sea ice concentration values corresponding to each mooring site were obtained by sampling the dataset at the latitude and longitude coordinates listed in Table 1.
2.3 River discharge data
Daily discharge data (m3 s−1) for the Yenisey, Ob, and Lena Rivers were obtained from the Arctic Great Rivers Observatory (ArcticGRO) archive (discharge product version 20220630; https://arcticgreatrivers.org/discharge, last access: 15 September 2025). The dataset, compiled by Russia's national hydrological agency (Roshydromet), covers the period 1979–2020 at daily resolution (Holmes et al., 2022). Published assessments indicate annual mean discharge uncertainties of approximately 1.5 %–3.5 % for large Siberian rivers (Shiklomanov et al., 2006), with higher reliability during the open-water season. To minimize uncertainty, only May–October discharge data were used to estimate seasonal totals and analyze interannual variability.
2.4 Reanalyses data
2.4.1 Ocean ORAS5 reanalysis
We used monthly salinity and ocean current data from the Ocean Reanalysis System 5 (ORAS5) and its near–real-time extension, Ocean5 (Zuo et al., 2019), produced by the European Centre for Medium-Range Weather Forecasts (ECMWF). The ORAS5 product has a horizontal resolution of approximately 0.25° × 0.25° (about 25 km in the tropics and 9 km in the Arctic) and spans from 1979 to the present. It is generated using the NEMO v3.4 ocean model with the NEMOvar data assimilation system, which employs a 3D-Var FGAT (First Guess at Appropriate Time) scheme and assimilates both satellite and in situ observations to constrain ocean dynamics. For salinity, we used monthly mean values from the upper 0–5 m layer to examine surface salinity variability in the Kara and Laptev Seas. For currents, we used monthly averaged zonal and meridional velocity components from the same layer for January 2011–December 2018 in a back-trajectory tracer analysis to investigate freshwater transport pathways. Previous studies have demonstrated that ORAS5 realistically represents Arctic hydrography and Eurasian Basin circulation, showing good agreement with in situ and satellite-derived observations (e.g., Polyakov et al., 2023; Zuo et al., 2019; Langehaug et al., 2023).
2.4.2 Atmospheric reanalysis data
Monthly surface wind fields from 2013 to 2018 were obtained from the ERA5 reanalysis, available via the Copernicus Climate Data Store (https://cds.climate.copernicus.eu, last access: 10 June 2026). The dataset provides 10 m wind components at a horizontal resolution of 0.25° × 0.25° (Hersbach et al., 2020). These wind fields were used to evaluate the role of atmospheric forcing in the 2015–2017 freshening event in the eastern Eurasian Basin. ERA5 is widely considered a high-quality reanalysis. However, specific evaluation information for this region is not available.
2.5 Defining the timing and vertical extent of the freshening event
2.5.1 Defining the timing of freshening events using wavelet
To determine the timing of the freshening event, we applied wavelet analysis to a salinity time series for each mooring location (Torrence and Compo, 1998). The study used DOG (derivative of the Gaussian) mother wavelet with 95 % confidence intervals. Wavelet transforms were computed using a standard wavelet analysis package to remove seasonal variability from the time series (Fig. S1 in the Supplement). Based on these results, the event was defined as occurring from late 2015 to early 2017, with slight variations in onset and termination across mooring sites. Equal-duration reference periods before and after the event were selected for comparative analysis. The identified freshening period represents an anomalous decrease in salinity across the upper halocline layer, clearly resolved in the 65–100 m salinity wavelet signals (Fig. S1).
2.5.2 Defining the freshening layer
To define the vertical extent of the freshening layer, we computed mean salinity anomaly profiles at each mooring by subtracting pre- and post-event averages from those during the event (Fig. S3). The upper limit, z1, is the shallowest reliable salinity measurement, while the lower limit, z2, is defined as the depth where the anomaly amplitude decreases to 3 % of its surface value (6 % for M15; Supplement Table S1). Using an alternative definition based on the depth where the anomaly becomes statistically indistinguishable from zero (≤ 0.003 psu, or 3 % for M15; Table S1) yields similar results.
To evaluate the sensitivity of results to layer definition, freshwater content was integrated between z1 and each of the lower limits z2 and (Fig. S4). The difference in mean freshwater content between the two thresholds was less than 3 %, and the two timeseries were strongly correlated (r≥0.99) across all moorings, indicating minimal sensitivity to the choice of lower boundary. Based on this result, the shallower limit z2 was used for further analysis (Fig. S3). For M15, wavelet analysis showed that the freshening signal became statistically significant below 75 m for the period before the event, supporting the use of 77 m as the upper limit (z1) for defining the freshening layer.
The effect of gaps in observational data in the upper ocean layer is assessed using data from Ice-Tethered Profiler 37, which drifted in the eastern Eurasian Basin for one year starting in late August 2009. The ITP records extend to 10 m depth. We simulated the absence of data in the upper 30 and 50 m layers and show that removing and extrapolating data above 30 m – available at three of the six moorings during the freshening event – changes the annual mean freshwater content (FWC, 10–175 m) by only 2.9 %, increasing to ∼ 10 % when the upper 50 m is excluded (Fig. S2).
2.6 Quantifying ocean responses
2.6.1 Quantifying freshwater and heat content
Freshwater content was calculated by integrating salinity anomalies over depth, following the approach of Aagaard and Carmack (1989).
where S0= 34.8 psu used as reference salinity, z1 and z2 are depths of upper and lower boundaries, and Sz is the observed salinity at depth z.
Ocean heat content (J m−2) was calculated using temperature with the freezing point as the reference temperature at a given salinity (Polyakov et al., 2017).
where θf is the freezing temperature, (−0.054 ⋅ Sz), ρ is water density, Cp is the specific heat of seawater, and z1 and z2 are depths of upper and lower boundaries. Here, Q can be defined as the relative heat content, which measures the amount of heat that must be removed to reach the freezing point at a given salinity.
2.6.2 Quantifying startification
The potential energy anomalies (PEA) provide a measure of stratification and were used to quantify the strength of the surface mixed layer and halocline. PEA was calculated following (Polyakov et al., 2018), by integrating the density anomaly relative to a reference from the surface to the base of the freshening layer, using the formula below.
where g is gravitational acceleration, ρi is the density of the water at a given depth z, and ρref is the reference density at the bottom of the layer.
2.7 Identifying freshwater sources and pathways
2.7.1 Cross-slope salinity shifts across the Laptev Sea slope
To assess whether cross-slope shifts of the Atlantic Water warm and salty core could cause freshening across the eastern Eurasian Basin slope, we defined a proxy of the advective term between pairs of adjacent moorings (M11–M15). For each mooring in the cross-slope section, which is roughly oriented north-south, daily salinity and meridional velocity profiles were averaged over the 50–150 m layer from September 2015 to September 2018 (excluding the freshening period from October 2015 to September 2017). For each pair of adjacent moorings separated by a distance Δx, the cross-slope salinity difference (ΔS) and mean meridional velocity () between each pairs of moorings were computed. We used the product of and ΔS as a proxy of the advective flux (F∼ ). A positive value of the flux difference (northern minus southern) indicates potential salinification at the mooring, i.e., northward advection of saltier water, while a negative value indicates freshening there.
2.7.2 Defining connections between Kara and Laptev seas salinity
Deseasoned monthly surface salinity time series from the Laptev (observations) and Kara (reanalysis) Seas were compared using cross-correlation analysis to assess temporal relationships in salinity variability. For de-seasoning, we subtracted the monthly climatology from the salinity time series. However, we note that a residual seasonal signal likely remains. This is because the seasonal cycle varies from year to year, and subtracting a mean seasonal climatology does not fully remove it. In addition, seasonality is expressed not only in the mean but also in the variance; this component is not removed by traditional de-seasoning methods. The Kara Sea region was selected for this comparison based on back-trajectory results indicating the primary pathway of Yenisey and Ob River discharge through the Kara Sea. The lag corresponding to the maximum correlation was used to estimate the timing of salinity signal propagation between the two seas.
2.7.3 Tracer trajectory calculation
To investigate the source of freshening in the eastern Eurasian Basin, we applied a Lagrangian trajectory analysis (Polyakov et al., 2023). Trajectories were computed using the ORAS5 monthly velocity field, averaged over the 0–5 m depth layer and linearly interpolated to an hourly time step, for the period 2013–2018. Parcels were initialized at each mooring location and integrated backward in time for 23 months, corresponding to the maximum lag identified between Kara and Laptev Sea salinity anomalies (see Sect 3.2). All tracers were assumed to be neutrally buoyant and were advected at a constant depth throughout their drift from the initialization point.
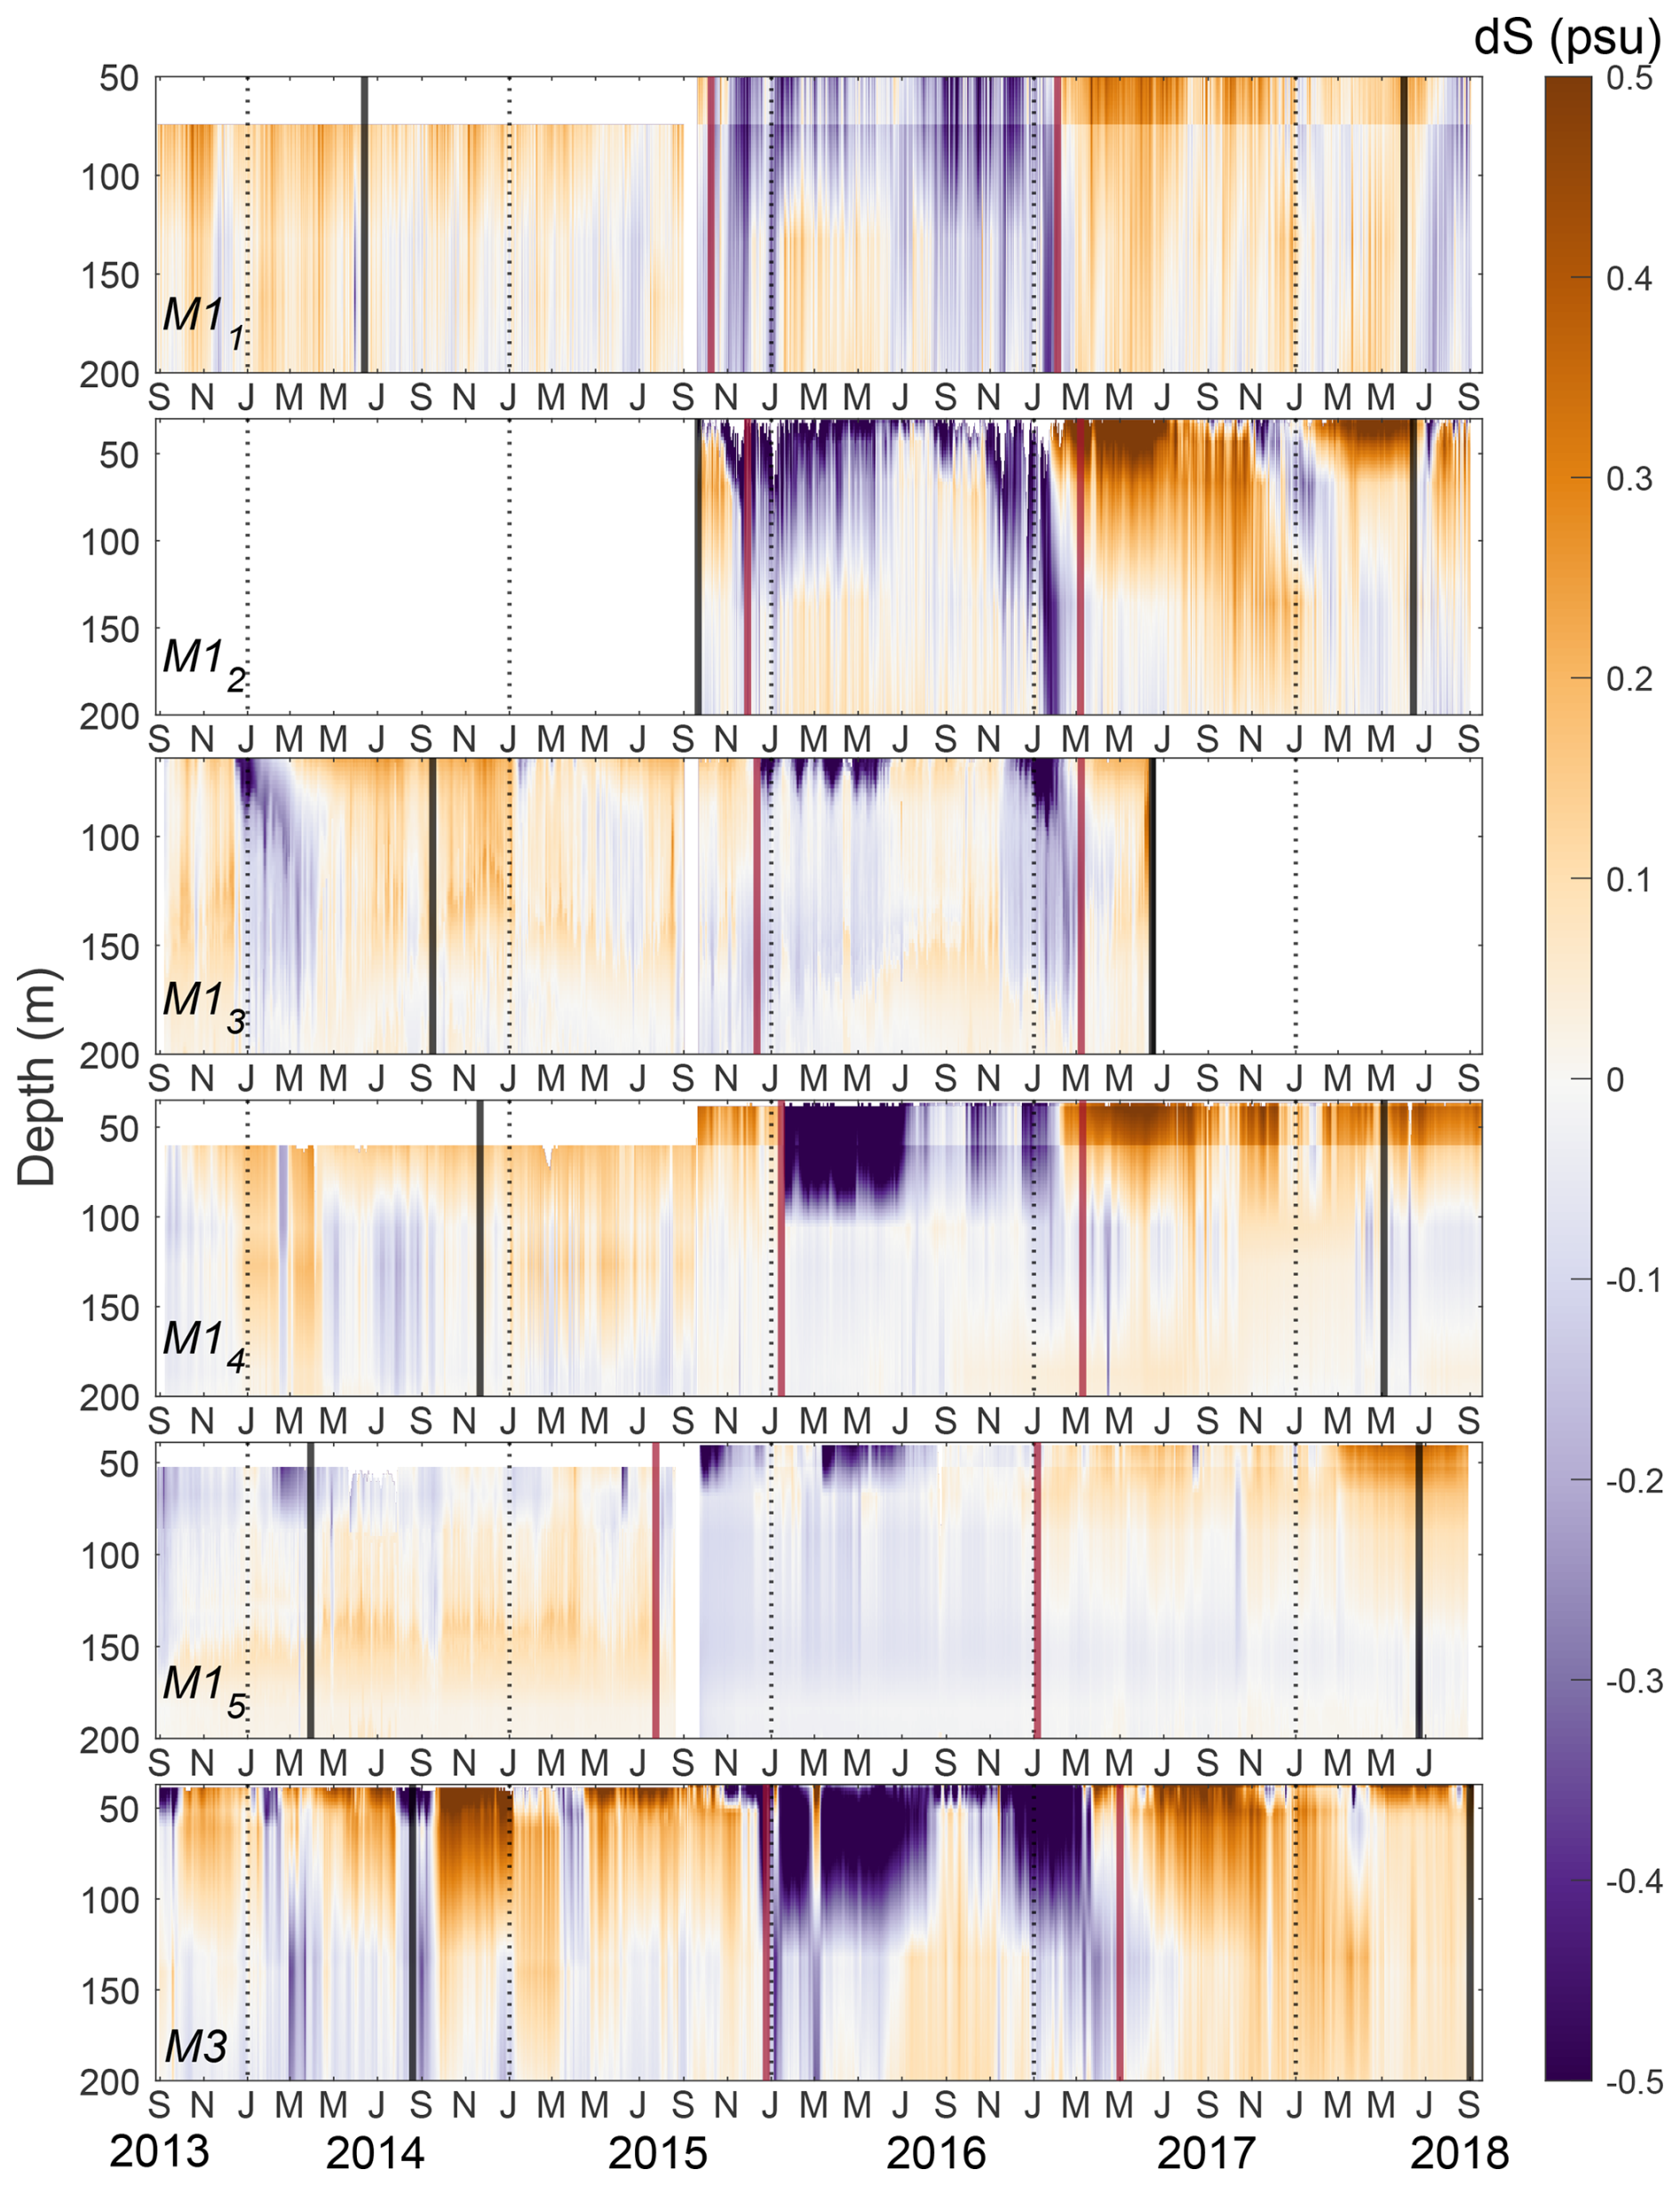
Figure 2Depth–time distributions of anomalous salinity (relative to the 2013–2018 mean) from six mooring locations in the eastern Eurasian Basin (see positions in Fig. 1) from 2013 to 2018. Vertical dotted lines mark 1 January as the start of each year. Vertical red lines indicate the freshening event (2015–2017), and solid black lines mark the periods before and after the event, used for comparative analysis. White gaps indicate missing data.
3.1 Documenting the 2015–2017 freshening event
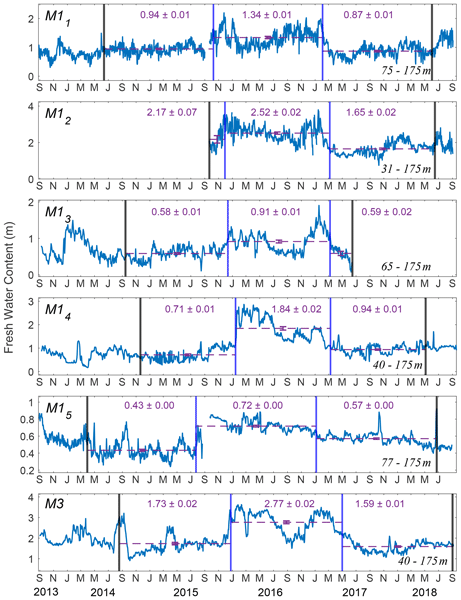
A strong freshening event was observed across six mooring locations (M11 to M15, and M3) in the eastern Eurasian Basin from 2015 to 2017 (Fig. 2). At all these locations, the vertical structure of the salinity anomaly showed that the surface layers had the strongest freshening (up to 0.5 psu). At the three mooring locations (M11, M12, and M13), the freshening is reliably detected down to depths of 175 m or even deeper (Fig. S3). At moorings M14, M15, and M3, the depth of freshening exceeds 100 m; however, due to discrete single-depth SBE37 observations, the exact vertical extent of the freshening cannot be clearly discerned. The evolution of the spatial pattern of salinity and temperature anomalies from September 2013 to September 2018 is illustrated using a Hovmöller diagram (Fig. 3). For this purpose, salinity and temperature anomalies at 77 m, the shallowest level with continuous records with a few gaps across all moorings, were analyzed. Low salinity (fresher) anomalies (up to −0.4 psu) first appeared at the shallower moorings M11–M13 in late 2015, and were observed later at the offshore moorings M14–M15 and M3 by early 2016 (Fig. 3). These anomalies which showed a strong season cycle, added nearly 0.60 m of freshwater to the upper ocean layer (∼ 30 to 175 m), with freshwater content increasing from winter 2015 and reaching a maximum in 2016 at M12 and M13, followed by a gradual decline observed at all moorings after 2017 (Fig. 4). These anomalies persisted until early 2017 across all mooring sites. The added freshwater reduced near-surface salinity and density, thereby strengthening the stratification. This enhanced stratification was reflected in the pronounced increase in estimated potential energy anomaly across all moorings (Fig. S5). For example, potential energy nearly doubled at M11 (from 0.66×10⁴ to 1.24×10⁴ J m−2), increased by ∼ 70 % at M13 (from 0.90×10⁴ to 1.52×10⁴ J m−2), and more than doubled at M3 (from 1.86×10⁴ to 3.90×10⁴ J m−2) during the event. This increased stratification is a potential contributor to reduced vertical heat exchange between surface waters and the underlying warm Atlantic layer over the freshening event.

Figure 3Hovmöller diagrams of temperature and salinity anomalies (relative to the 2013–2018 mean) at 77 m depth for six mooring locations in the eastern Eurasian Basin. The 77 m depth was selected based on the shallowest continuous salinity record across all moorings. The horizontal axis represents mooring site labels, and the vertical axis shows time (September 2013 to September 2018). Horizontal black lines mark the start of each year. White gaps indicate missing data.
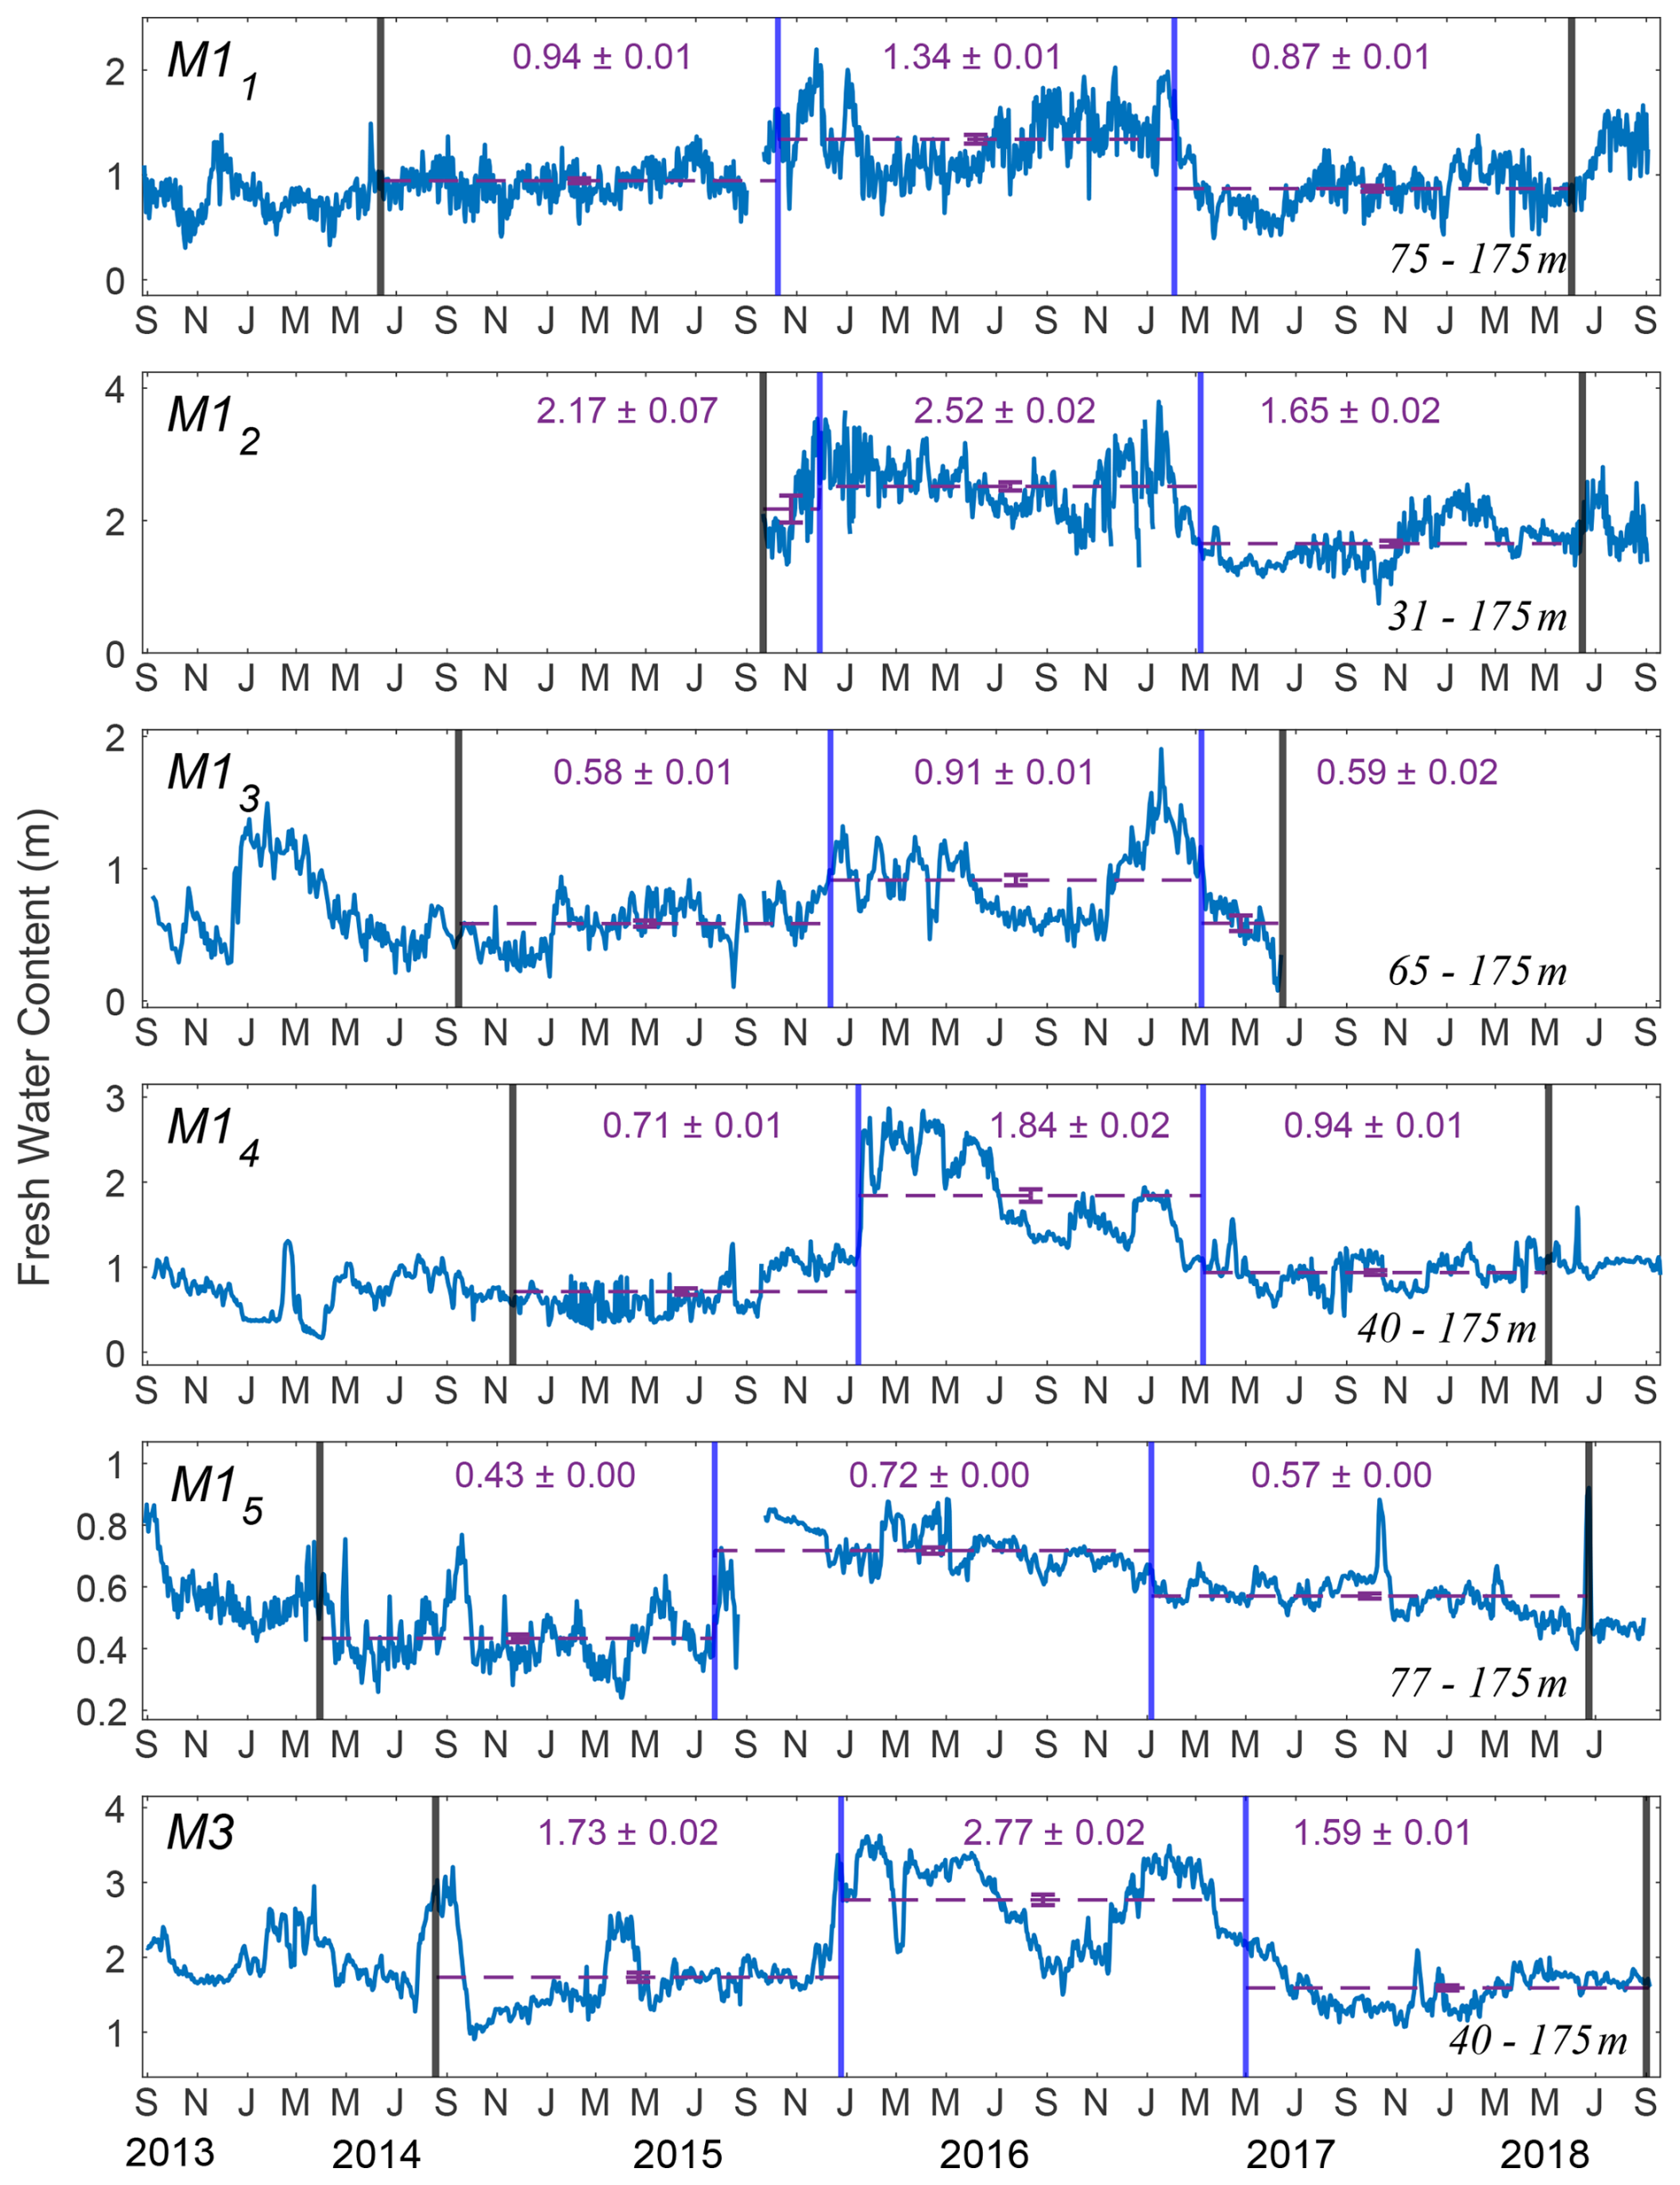
Figure 4Time series of freshwater content for six mooring locations in the eastern Eurasian Basin, averaged over the depth indicated for each mooring individually (bottom right). Horizontal dashed lines represent the mean freshwater content, and the error bar denotes ±three standard errors. Vertical dark blue lines indicate the period of the freshening event; the vertical black lines mark the periods before and after the event.
The 2015–2017 freshening event spanned over three seasons: two winters (2015–2016, 2016–2017) and one summer (2016). To examine how salinity varied across seasons during the freshening event, we analyzed seasonal averages for winter (DJF) and summer (JJAS) periods. Figure 5 shows that the event was not uniform across all locations and seasons. On average, salinity decreased by ∼ 0.2 psu during winter 2015–2016, with the strongest anomalies at M3 (0.25 psu) and M14 (0.43 psu) mooring locations. In summer 2016, salinity increased slightly compared to the preceding winter. However, summer 2016 remained ∼ 0.1–0.2 psu fresher than both summer 2015 and summer 2017, so that the freshening persisted over the three seasons despite seasonal variability.
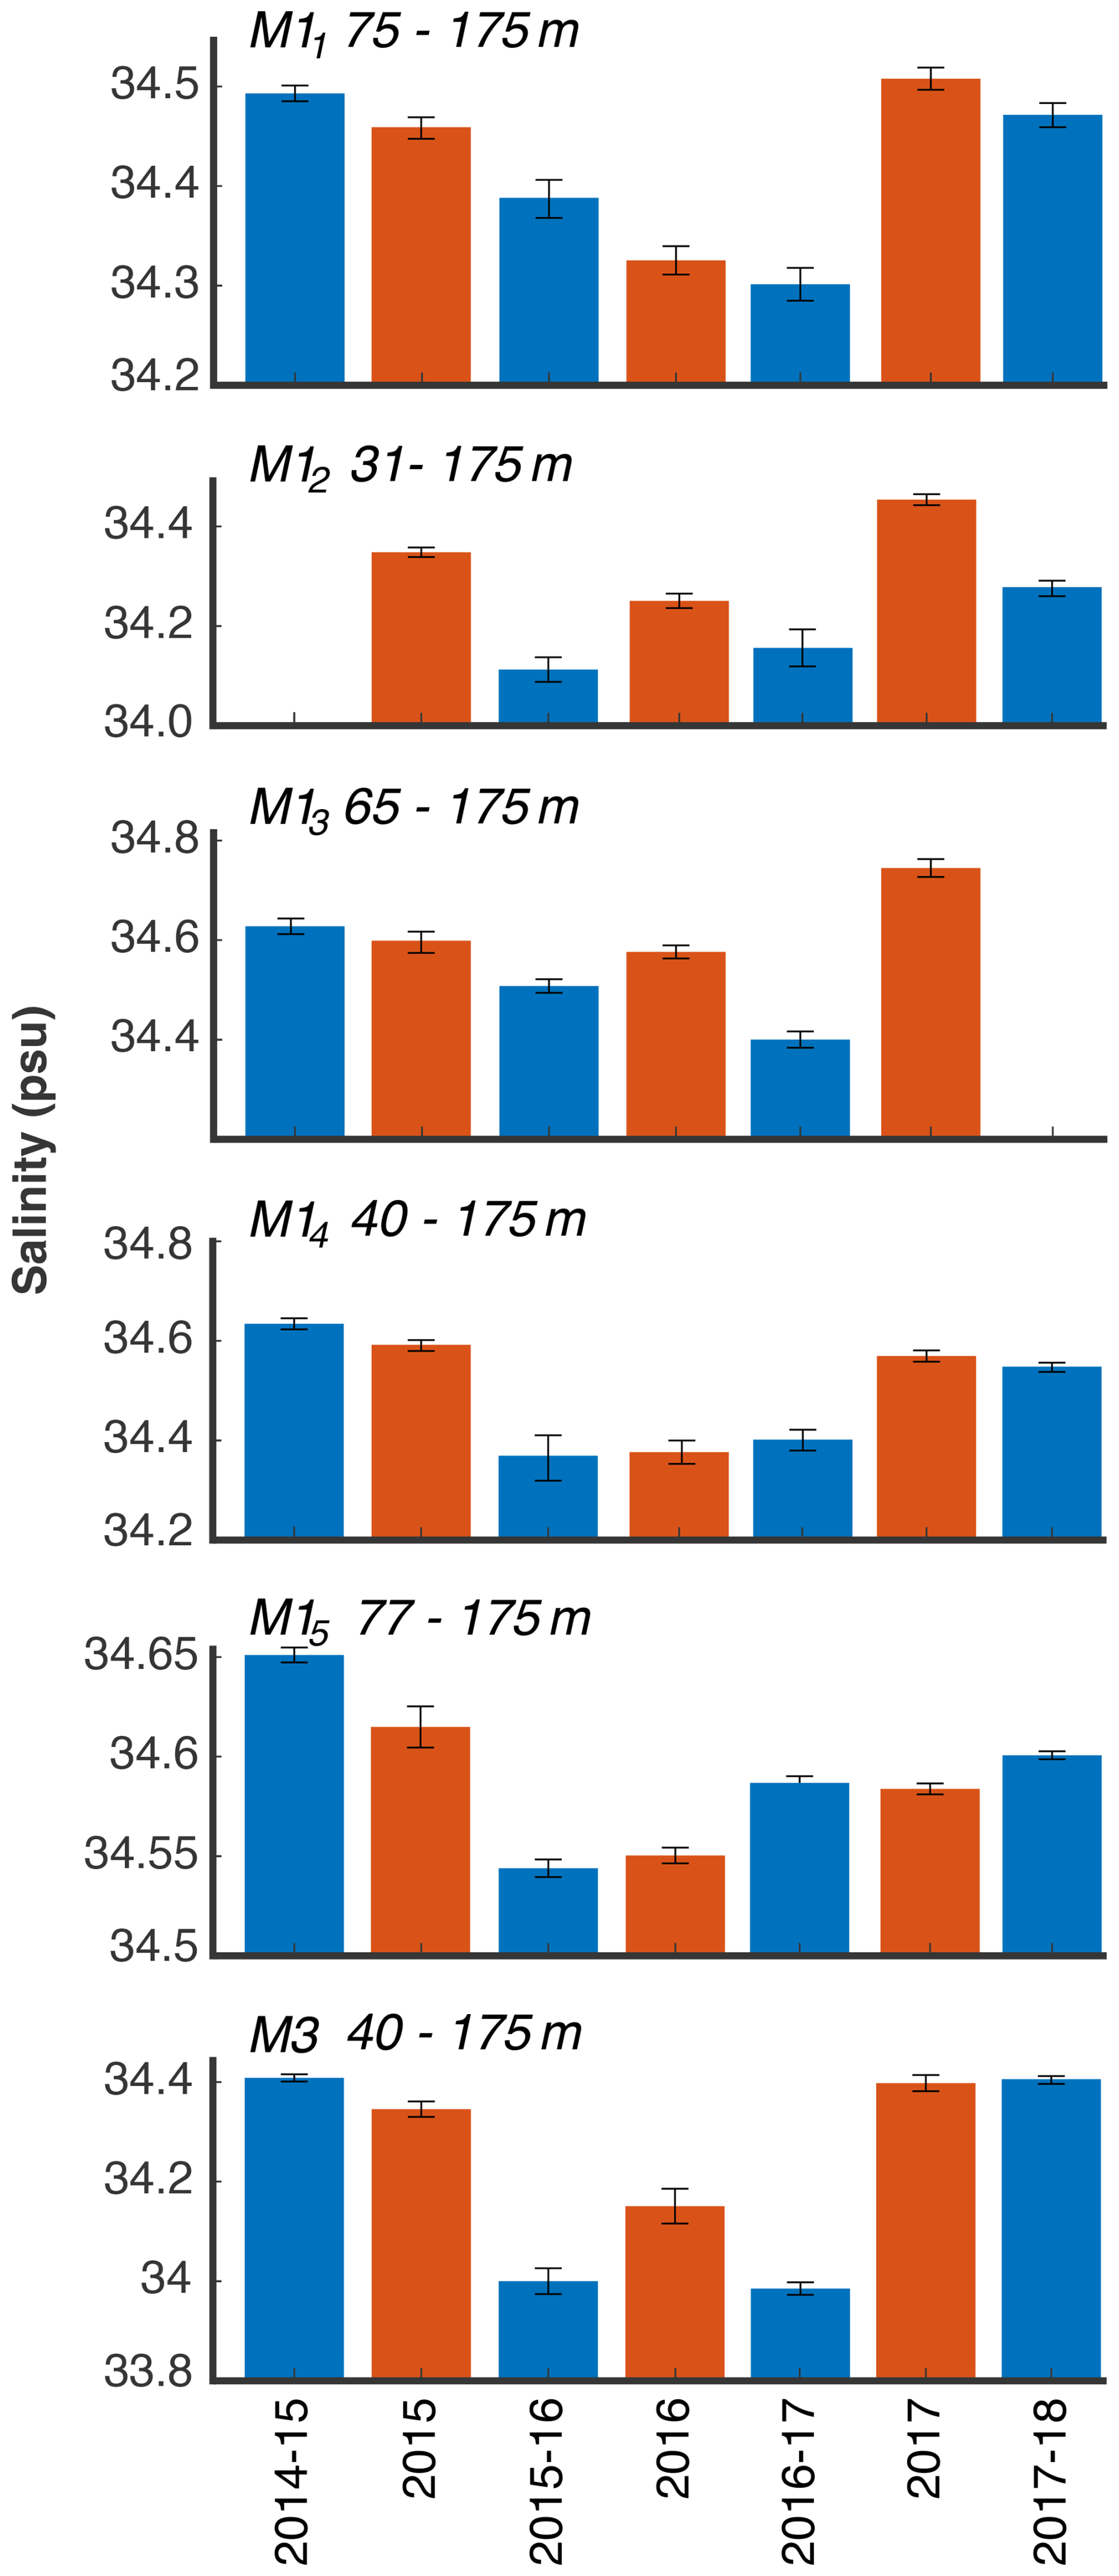
Figure 5Mean seasonal salinity averaged for summer (JJAS, orange) and winter (DJF, blue) from 2014 to 2018 from six mooring locations in the eastern Eurasian Basin. Salinity is averaged over the freshening depth identified individually for each mooring record. Black error bars denote ±3 standard errors.
The negative salinity anomalies were accompanied by positive (warmer) temperature anomalies of up to +0.4 °C at the shallower moorings M11–M13 and M3, while deeper offshore moorings M14 and M15 exhibited mixed temperature signals, lacking a clear tendency toward warming or cooling (Figs. 3 and S4). These anomalies persisted until early 2017 across all mooring sites. During the 2015–2017 freshening event, normalized freshwater content and ocean heat content exhibited contrasting tendencies across mooring locations (Fig. 6). The normalized values are unitless and represent the number of standard deviations (σ) above or below the mean. At the shallower moorings M11 and M12, freshwater content during the event increased by an average of 0.52m, while ocean heat content increased by 0.56×10⁷ J m−2. In contrast, at deeper moorings (M13 to M15 and M3), the freshwater content and the ocean heat content, averaged over the freshening event and the periods before and after it, showed a strong opposite tendency. For instance, the freshwater content averaged over four deeper moorings increased by 0.67m, but ocean heat content declined by 0.60×10⁷ J m−2. These contrasting regional differences should be considered in the context of the hydrographic front, located near the ∼ 750 m isobath, which separates the shallow M11 and M12 moorings from the deeper ones. The shallower and deeper domains exhibit markedly different thermal regimes (e.g., Baumann et al., 2018).
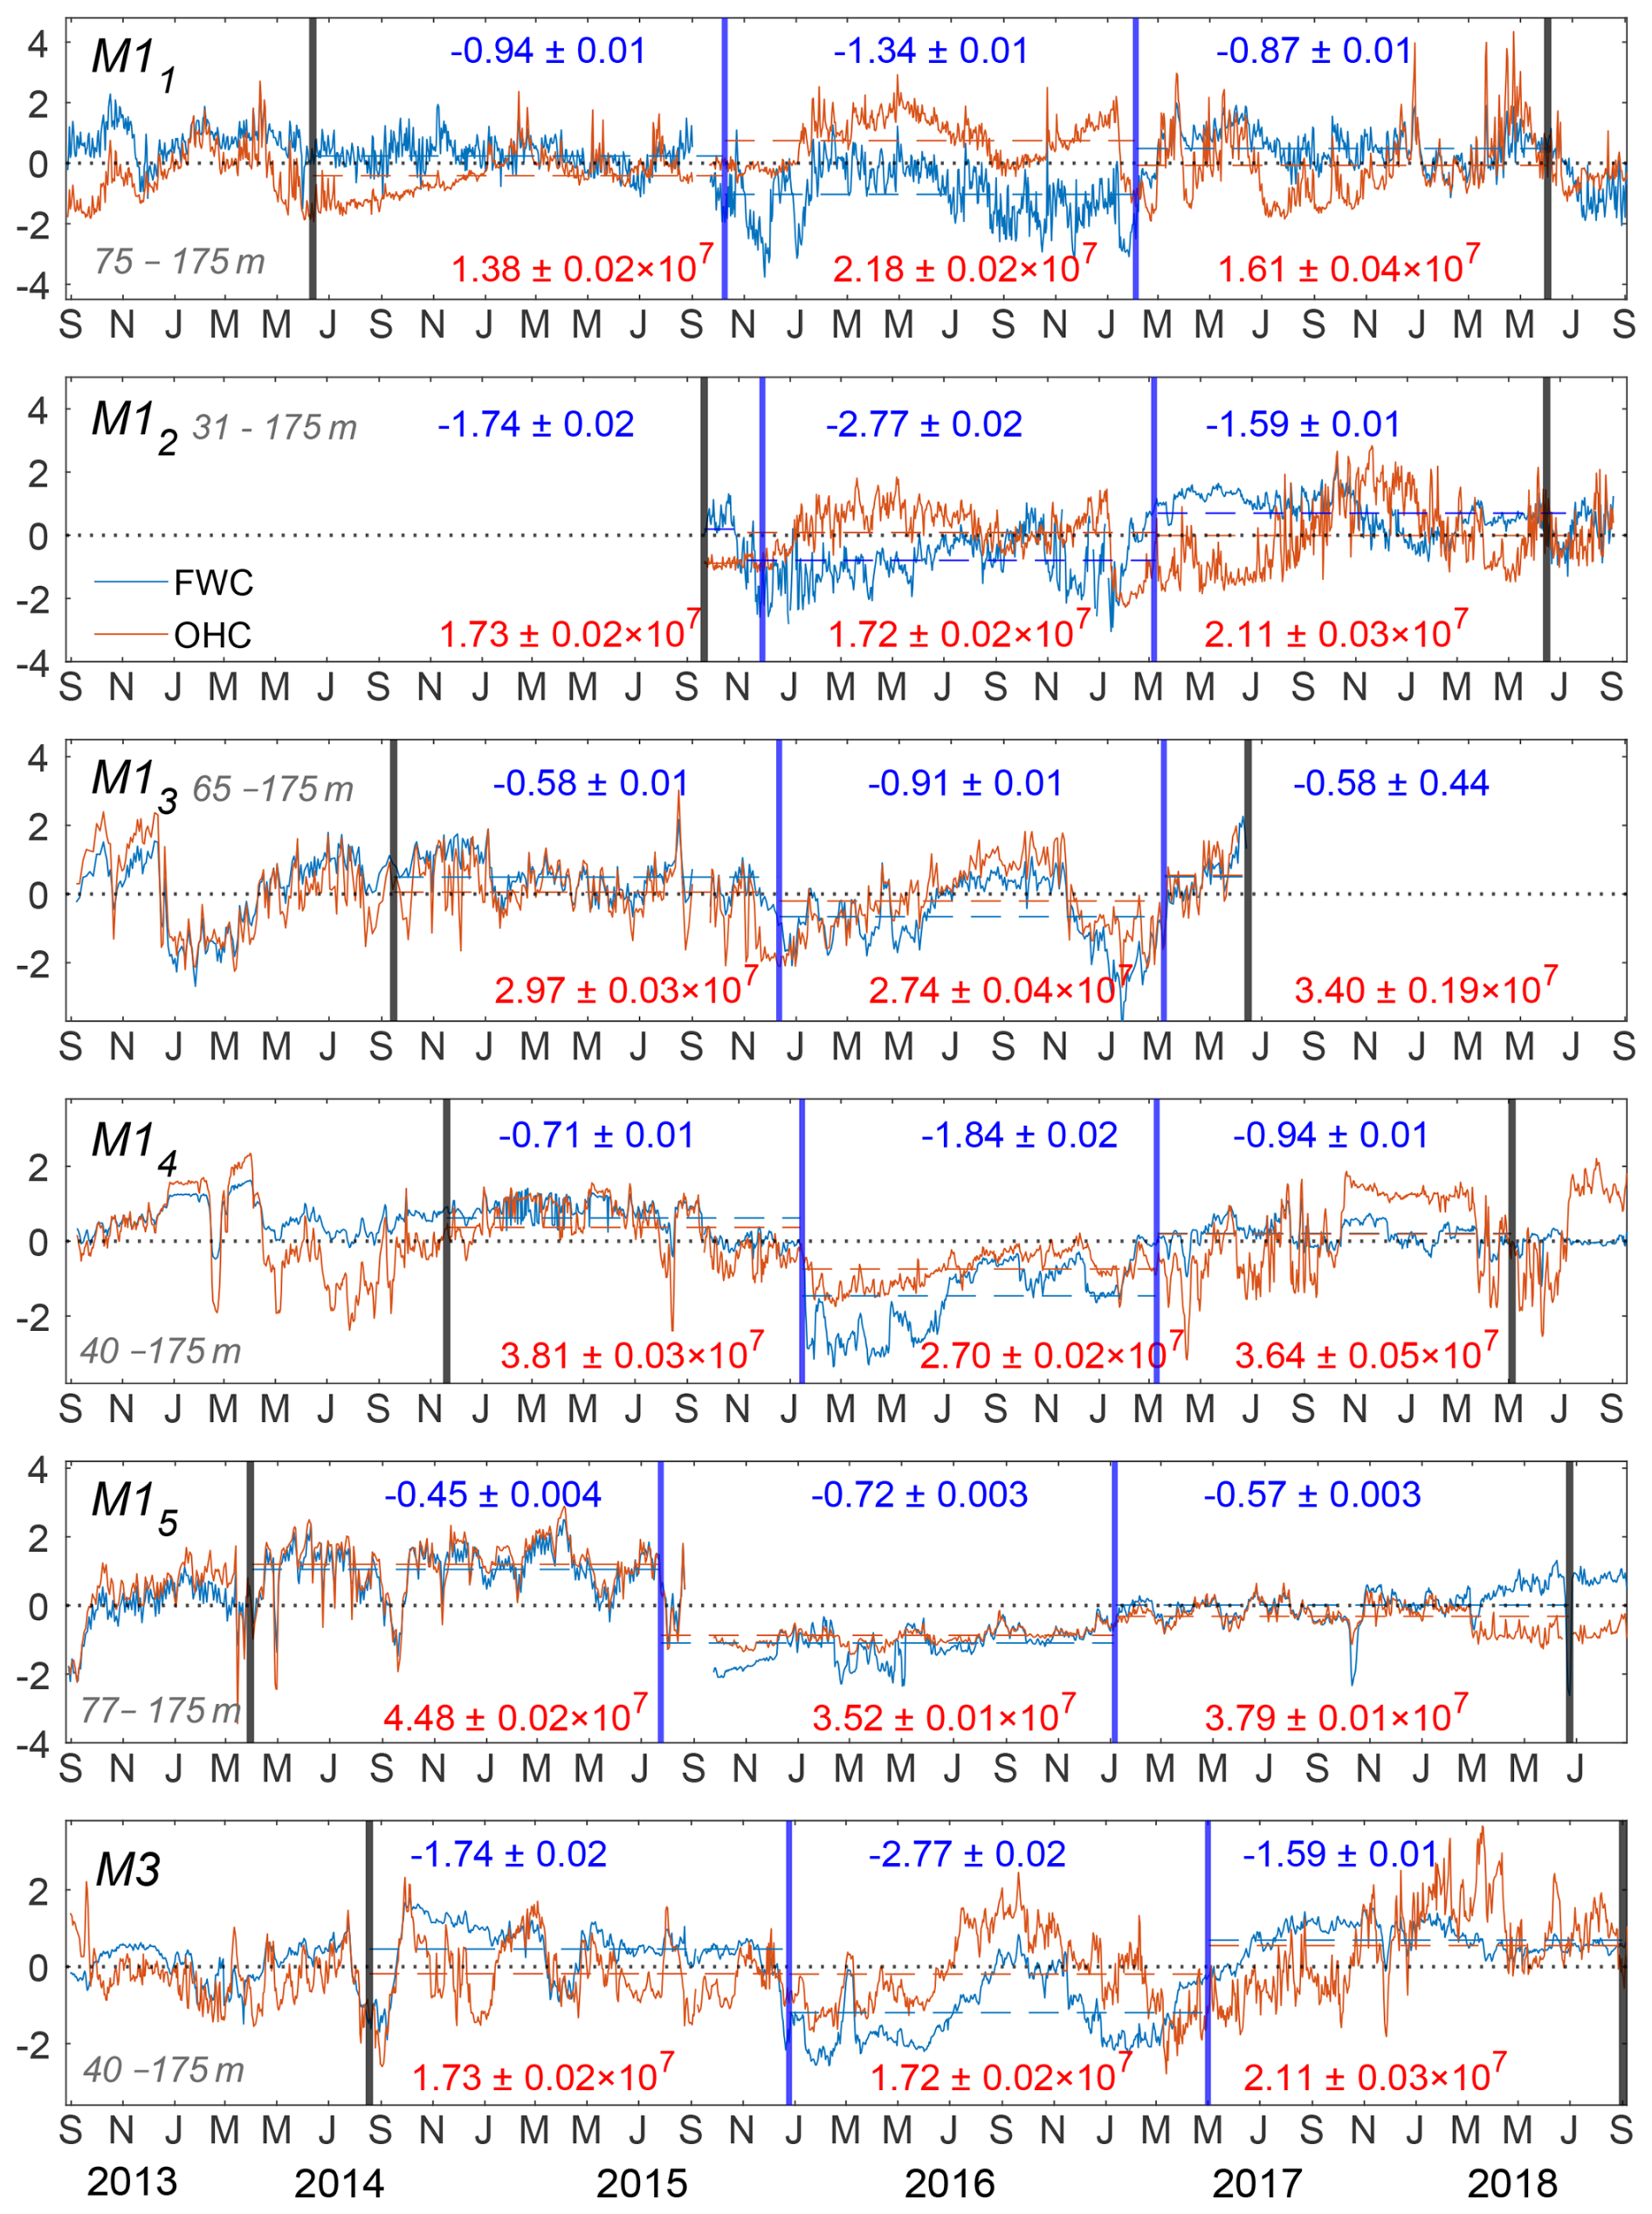
Figure 6Normalized time series of freshwater content (FWC, m; blue) and ocean heat content (OHC, J m−2; orange) averaged over the depth range (indicated in the bottom left of each panel) for six mooring locations in the eastern Eurasian Basin. FWC values are multiplied by −1 so that freshening appears as a negative anomaly, aligning visually with changes in OHC. Horizontal dashed lines represent the mean values for each period. Mean ±3 standard errors are shown in dark blue for FWC and in red for OHC. Vertical dark blue lines indicate the period of the freshening event; the vertical black lines mark the periods before and after the event.
3.2 Sources and drivers of the 2015–2017 freshening
3.2.1 Impact of cross-slope advection, precipitation, and ice melt
Variability in the position and strength of the front and boundary currents relative to the slope can significantly affect cross-slope exchanges of water masses, potentially influencing local salinity distributions (Pnyushkov et al., 2015). To evaluate the potential impact of cross-slope shifts of the boundary flow on the 2015–2017 freshening, we examined the salinity distribution and the meridional component of the current within the 50–150 m layer using data from moorings M11–M15 (see Methods).
Salinity averaged from September 2015 to September 2018 (excluding the freshening period) exhibits a maximum of 34.55 psu at the mid-slope mooring M13, where the warm and salty AW core is located. Lower salinities are observed at the shallower moorings M11–M12 (34.37 psu) and at the outer-slope moorings M14–M15 (34.50 psu) (Table S2; Fig. S6). This cross-slope structure implies that any meridional (cross-slope) displacement of the salinity maximum would lead to salinification at some portion of the slope (depending on the direction of the shift), which contradicts the coherent freshening observed at all mooring locations during 2015–2017.
To formalize this argument, we assume that near-slope salinity changes associated with cross-slope (meridional) migration of the AW jet can be described by a reduced salinity conservation equation retaining only two terms: the temporal tendency of salinity and meridional advection. Within this framework, freshening (negative ) must be balanced by meridional advection of the appropriate sign. If this balance is not satisfied – as indicated by our estimates – the observed freshening cannot be explained by a cross-slope shift of the salty AW core.
To quantify the advective contribution, we approximate the meridional salt advection using the product of the mean meridional velocity (averaged between adjacent moorings) and the corresponding meridional salinity difference (see Methods). The meridional flow is predominantly northward. A negative flux difference corresponds to freshening (e.g., mooring location M13; Table S2), whereas a positive flux difference indicates salinification (e.g., M12 and M14 mooring locations). In contrast, observations during 2015–2017 show freshening at all mooring locations. Thus, the observed freshening cannot be explained by an advective cross-slope shift of the salty AW jet core.
Therefore, processes other than cross-slope shifts of the AW core must have contributed to the anomalous freshening of the upper eastern Eurasian Basin in 2015–2017. Potential contributors are enhanced sea-ice melt, net precipitation, and increased inflow of river-derived meteoric water. Annual precipitation plays a minimal role in the Eurasian Basin, as it accounts for a small portion of the Arctic's yearly freshwater input (Serreze et al., 2006). Additionally, the increasing sea-ice melt is unlikely to explain the 2015–2017 freshening, since it has a relatively low impact on net freshwater content in the eastern Eurasian Basin (Bauch et al., 1995), as reflected by the negative values of sea-ice melt fraction (blue profiles, shipborne summer observations) across all mooring locations (approximately −0.01 to −0.02; Fig. 7). Meteoric water (primarily from riverine discharge, also shipborne observations), on the other hand, is the dominant contributor to freshwater content in the Laptev Sea and eastern Eurasian Basin as shown by the positive meteoric water fraction in the upper 0–50 m (Fig. 7; Bauch et al., 2013; Osadchiev et al., 2024). Notably, in 2015, the meteoric water fraction at moorings M11 and M14 doubled to 0.12 % from 0.06 % in 2013, whereas the sea-ice-melt fraction remained unchanged, suggesting that anomalous Siberian River discharge may be the cause of the observed freshening in the eastern Eurasian Basin (Fig. 7).
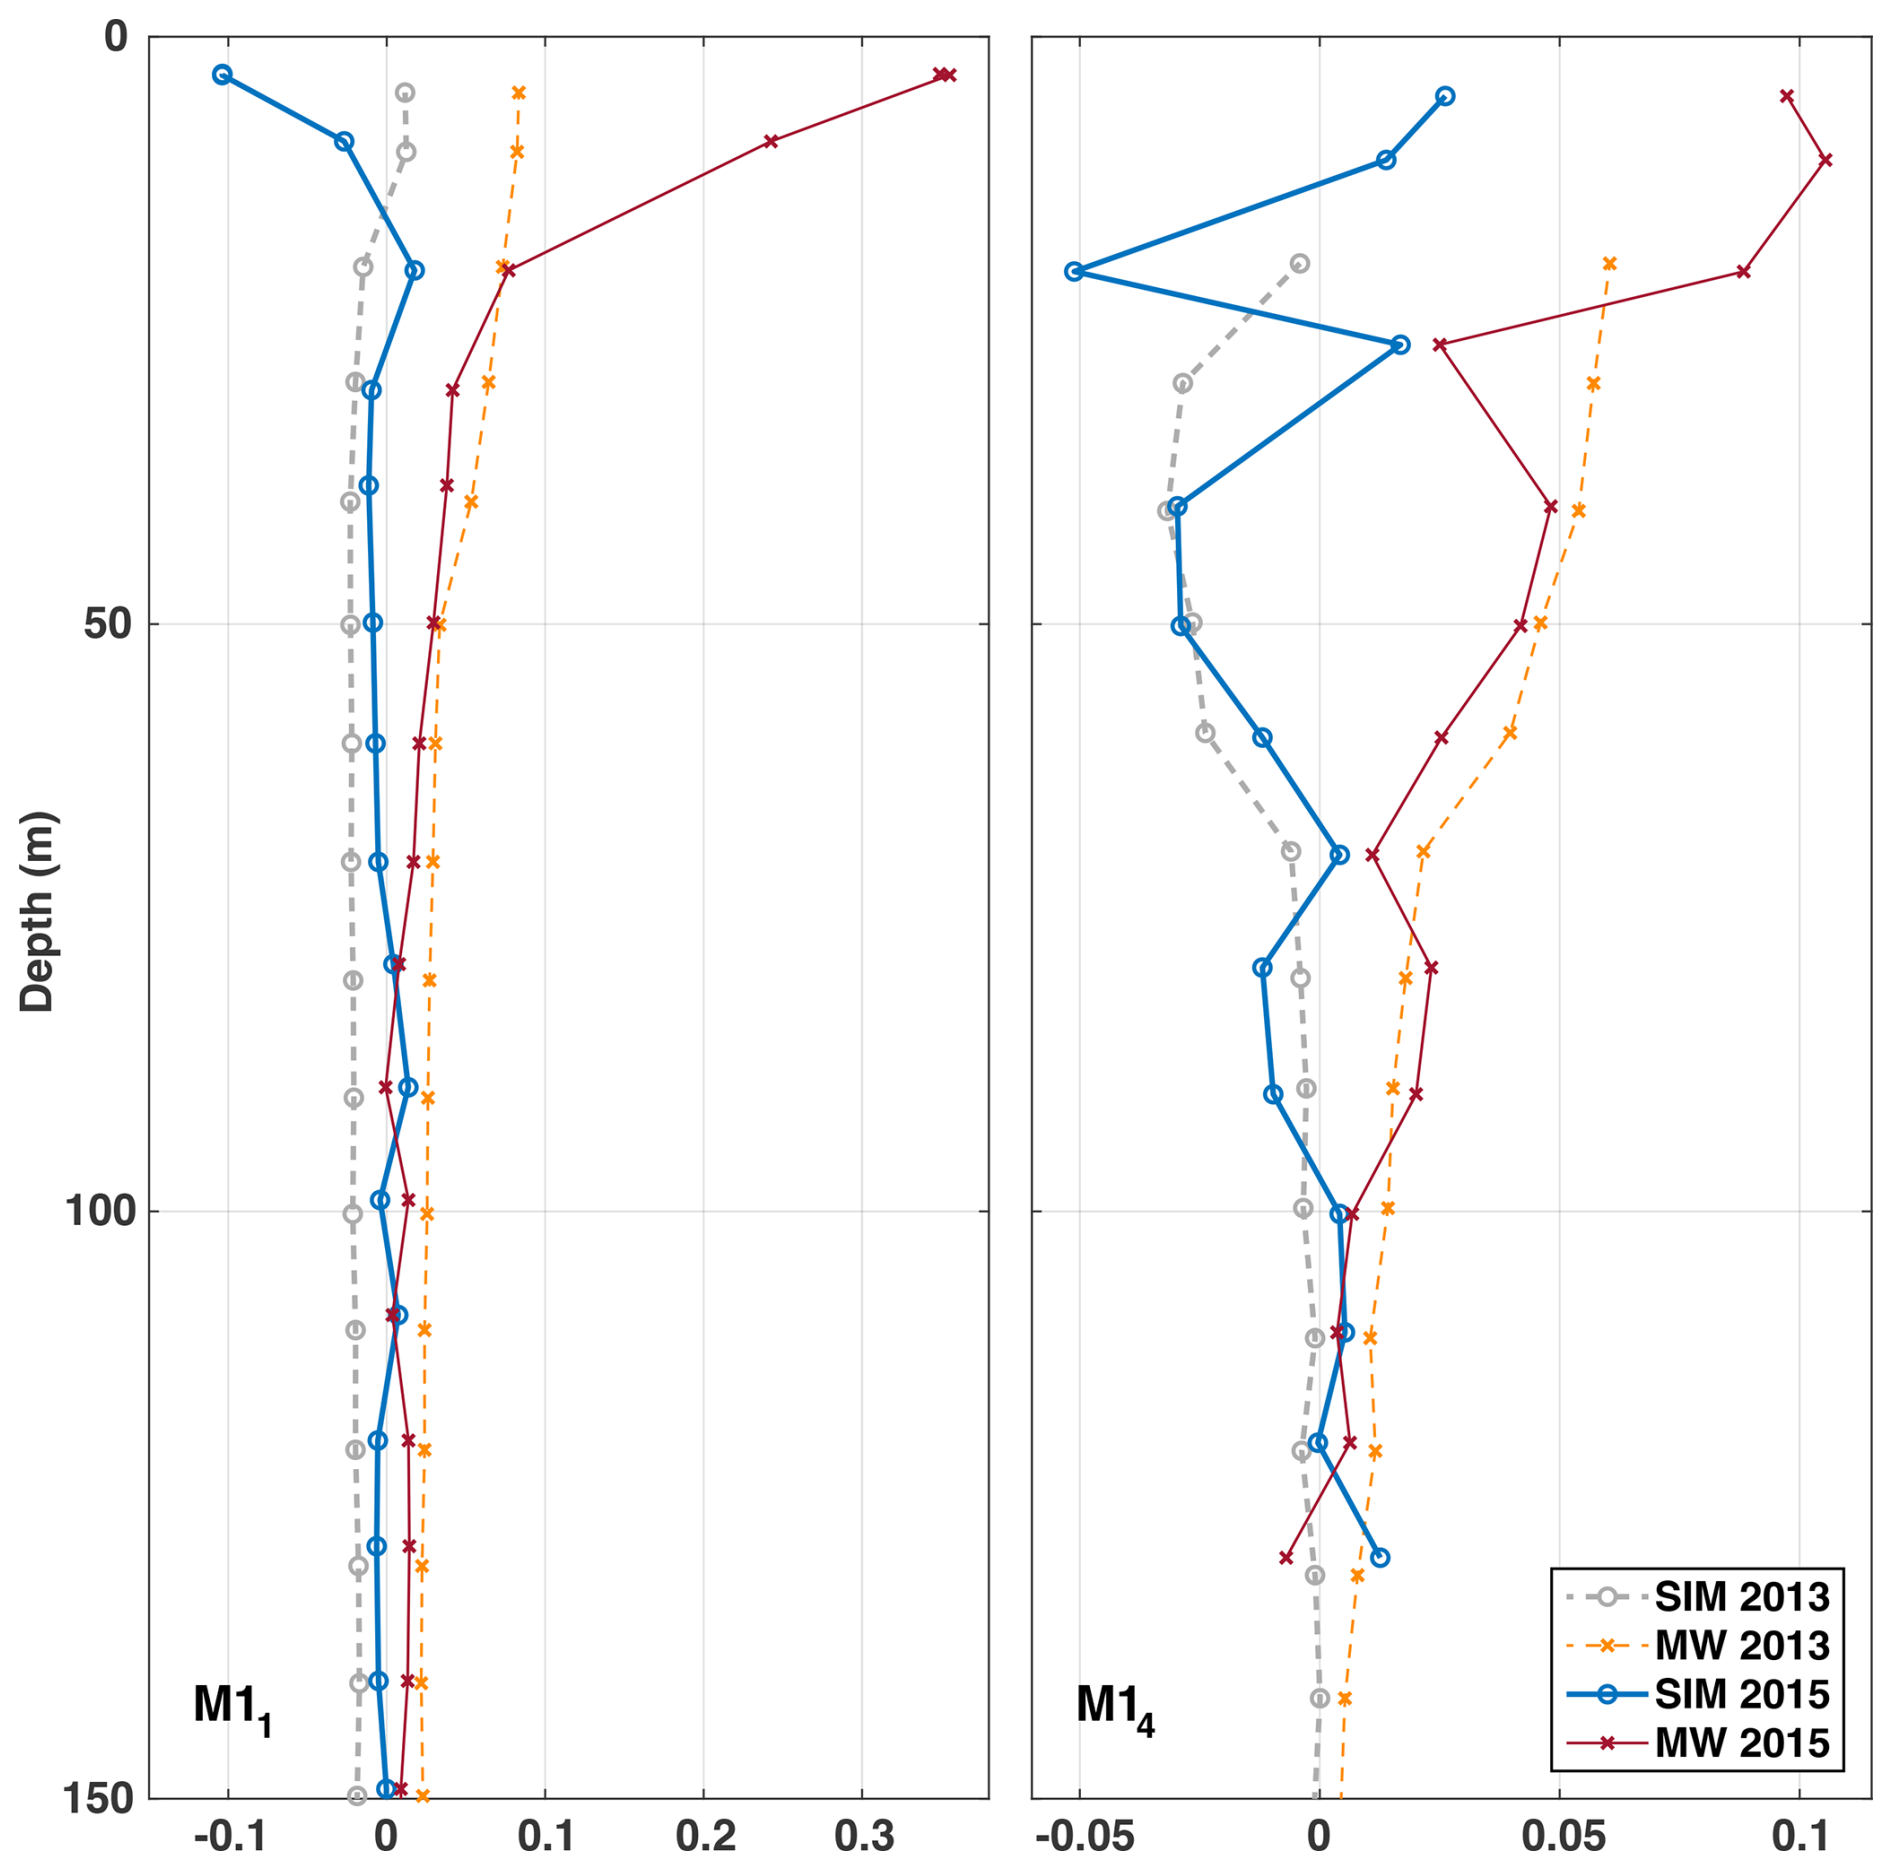
Figure 7Vertical profiles of sea ice melt (SIM; blue) and meteoric water (MW; orange) fractions at M11 and M14 mooring locations in the eastern Eurasian Basin for 2013 (lighter shade) and 2015 (darker shade).
3.2.2 Riverine discharge from the Kara Sea as a driver of salinity change
In the following analyses, drawing on multiple data sets and complementary methods, we demonstrate that the observed freshening in the upper eastern Eurasian Basin originates in the Kara Sea.
Checking records of peak Siberian river discharge (May–October), we find that although the Yenisey exhibits a higher instantaneous peak in 2013, this peak is short-lived. In contrast, the 2014–2015 discharge is sustained over a longer period, resulting in a larger integrated runoff. Consistent with this, the total May–October discharge of both the Yenisey and Ob rivers is anomalously high in 2014–2015 relative to 2013 (Fig. 8). In 2014, the Yenisey delivered km3 s−1 , corresponding to ∼ 0.19 m of freshwater when distributed over the mooring region (here defined in a broad sense as ∼ 77–82° N, 110–140° E; 5×10⁵ km2), while the Ob contributed km3 s−1 (∼ 0.16 m). In 2015, the Yenisey supplied km3 s−1 (∼ 0.14 m) and the Ob km3 s−1 (∼ 0.26 m). These anomalous discharges (∼ 0.35 m in 2014 and ∼ 0.40 m in 2015) can account for a substantial portion of the ∼ 0.60 m freshwater content increase derived from the mooring records for 2015–2017 (Fig. 4). The remaining contribution may be explained by local small and medium river discharges, which together account for ∼ 37 % of the total freshwater input to the Arctic Ocean (Holmes et al., 2013). Although Lena River discharge was also anomalous prior to the freshening event, our trajectory analysis (presented below) indicates that it contributed little to the freshening recorded by the moorings.
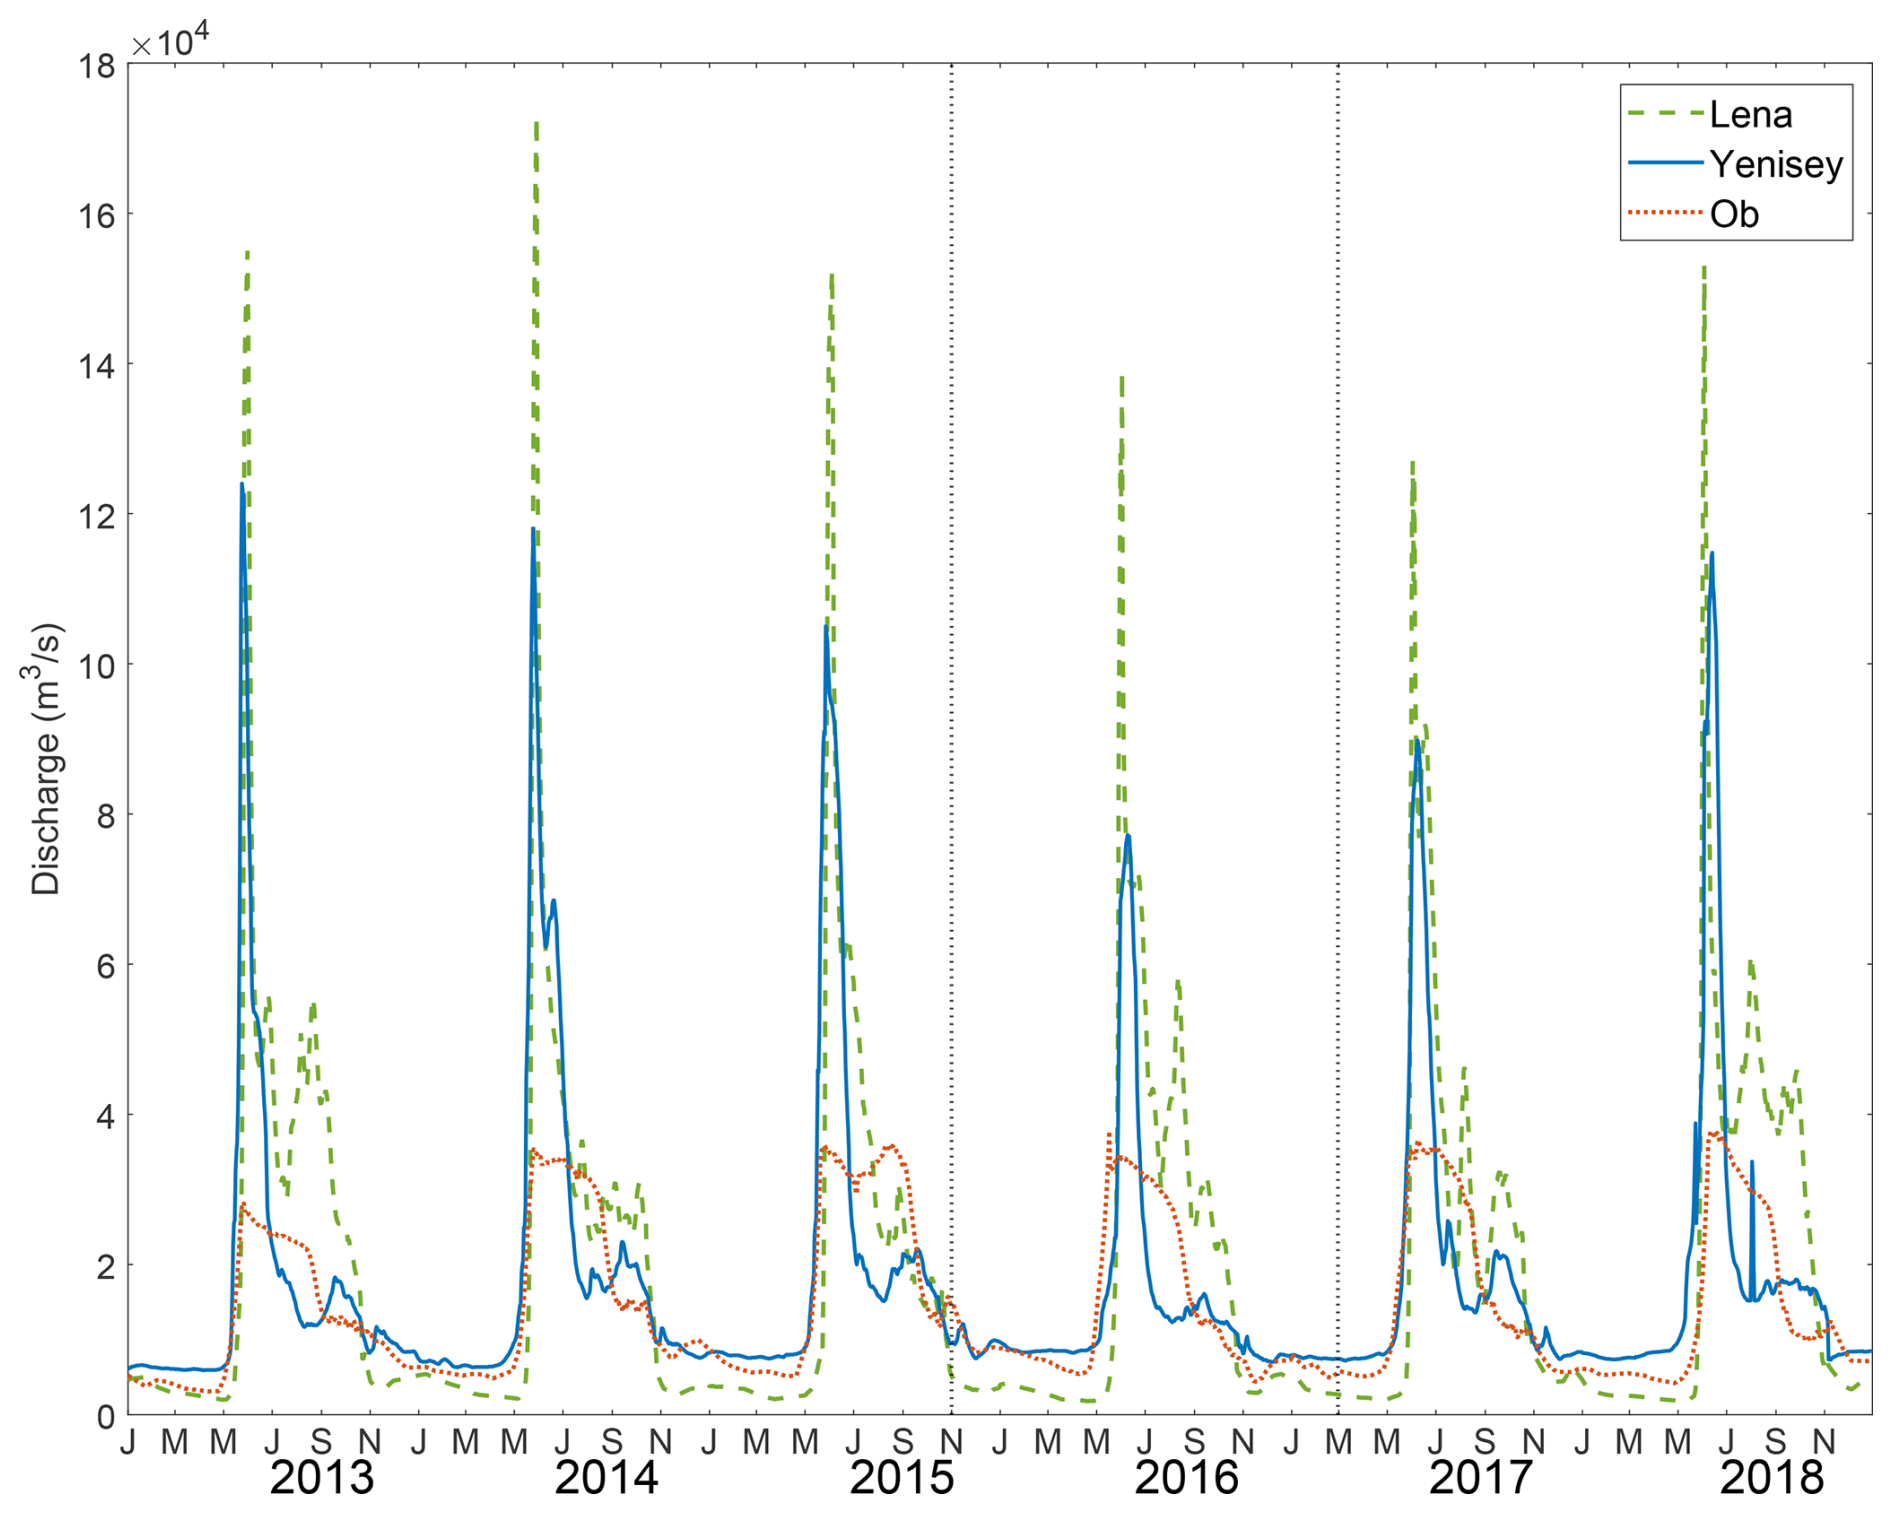
Figure 8Time series of river discharge from the Lena (green), Yenisey (blue), and Ob (orange) Rivers from 2013 to 2018. Dashed black lines indicate the period of the freshening event in the Eurasian Basin. Note the increased freshwater discharge from the Lena and Yenisey Rivers before the event. Data source: The Arctic Great Rivers Observatory: https://arcticgreatrivers.org/, last access: 15 September 2025.
The downstream impact of this anomalous freshwater input is evident in the spatial pattern of salinity decline observed across the Kara and Laptev Sea shelf and slope regions (Fig. 9). De-seasoned summer (JJA) 2016 ORAS5 salinity anomalies reveal a basin-wide freshening that begins in the Kara Sea (and even in the Barents Sea) and extends into the Laptev Sea. This pattern of salinity anomalies highlights the linkage between enhanced Siberian River discharge and the observed freshening in the eastern Eurasian Basin.
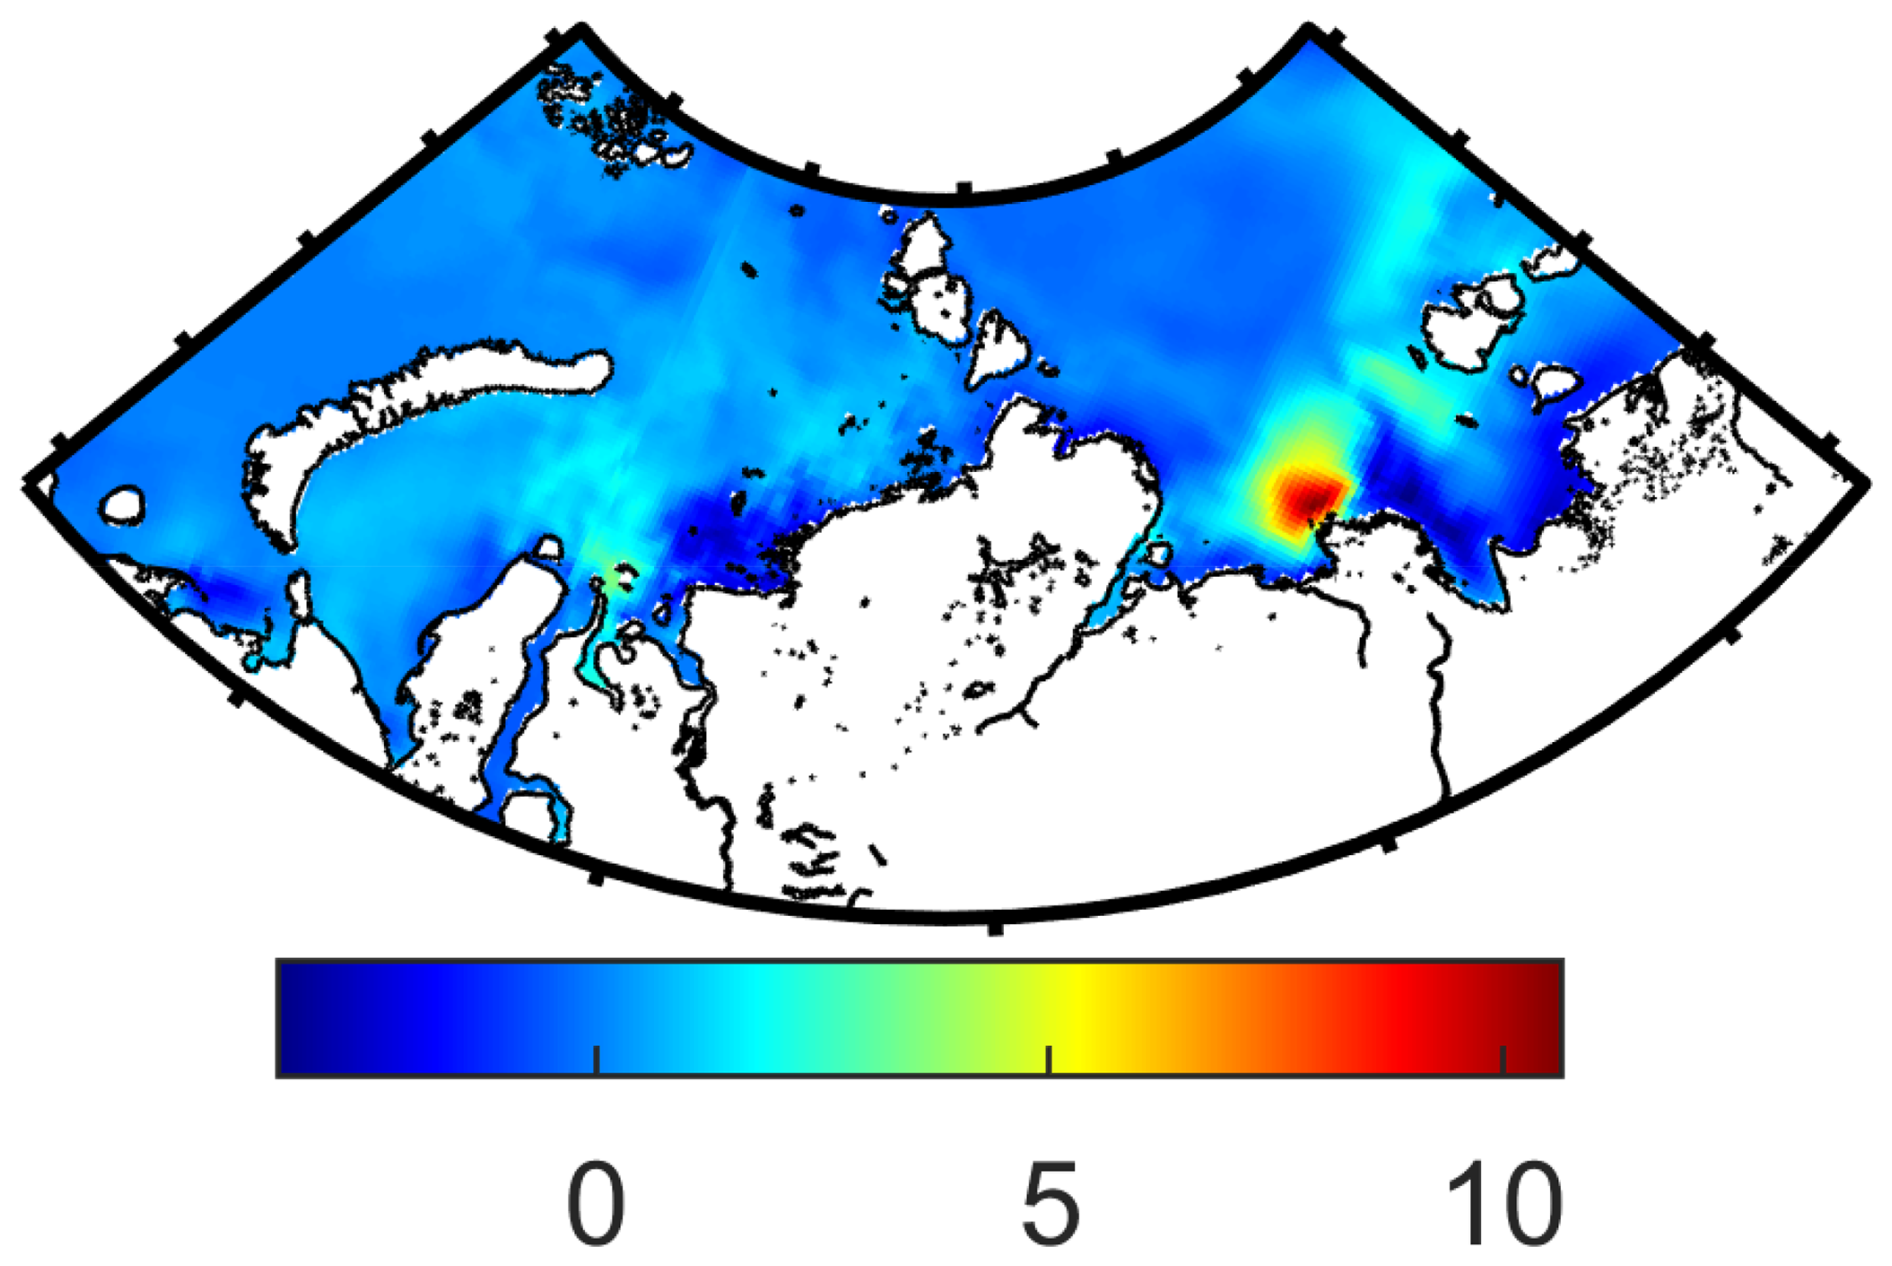
Figure 9Deseasoned summer (JJA) 2016 ORAS5 surface salinity anomalies over the Kara and Laptev seas, illustrating the spatial pattern of the freshening event.
The cross-correlation analysis of de-seasoned time series of salinity anomalies from the Kara and Laptev Seas provides further support to the findings above, showing positive correlations ranging from R= 0.39 at M11 to R= 0.78 for M15 (all statistically significant at 95 % level, Fig. 10). It also indicates that freshwater transport from the Kara Sea to reach the Laptev Sea takes between 8 and 23 months. The lag varied from 7–9 months at M11 and M12 to 22–23 months at M13-M15 and M3, suggesting that freshwater first reached shelf-edge regions before propagating to the offshore deeper slope areas. We note, however, that the lagged correlation peaks are broad, making precise estimates of the time lag difficult. This pattern is broadly consistent with the different start dates of freshening at mooring locations shown in Fig. 3.
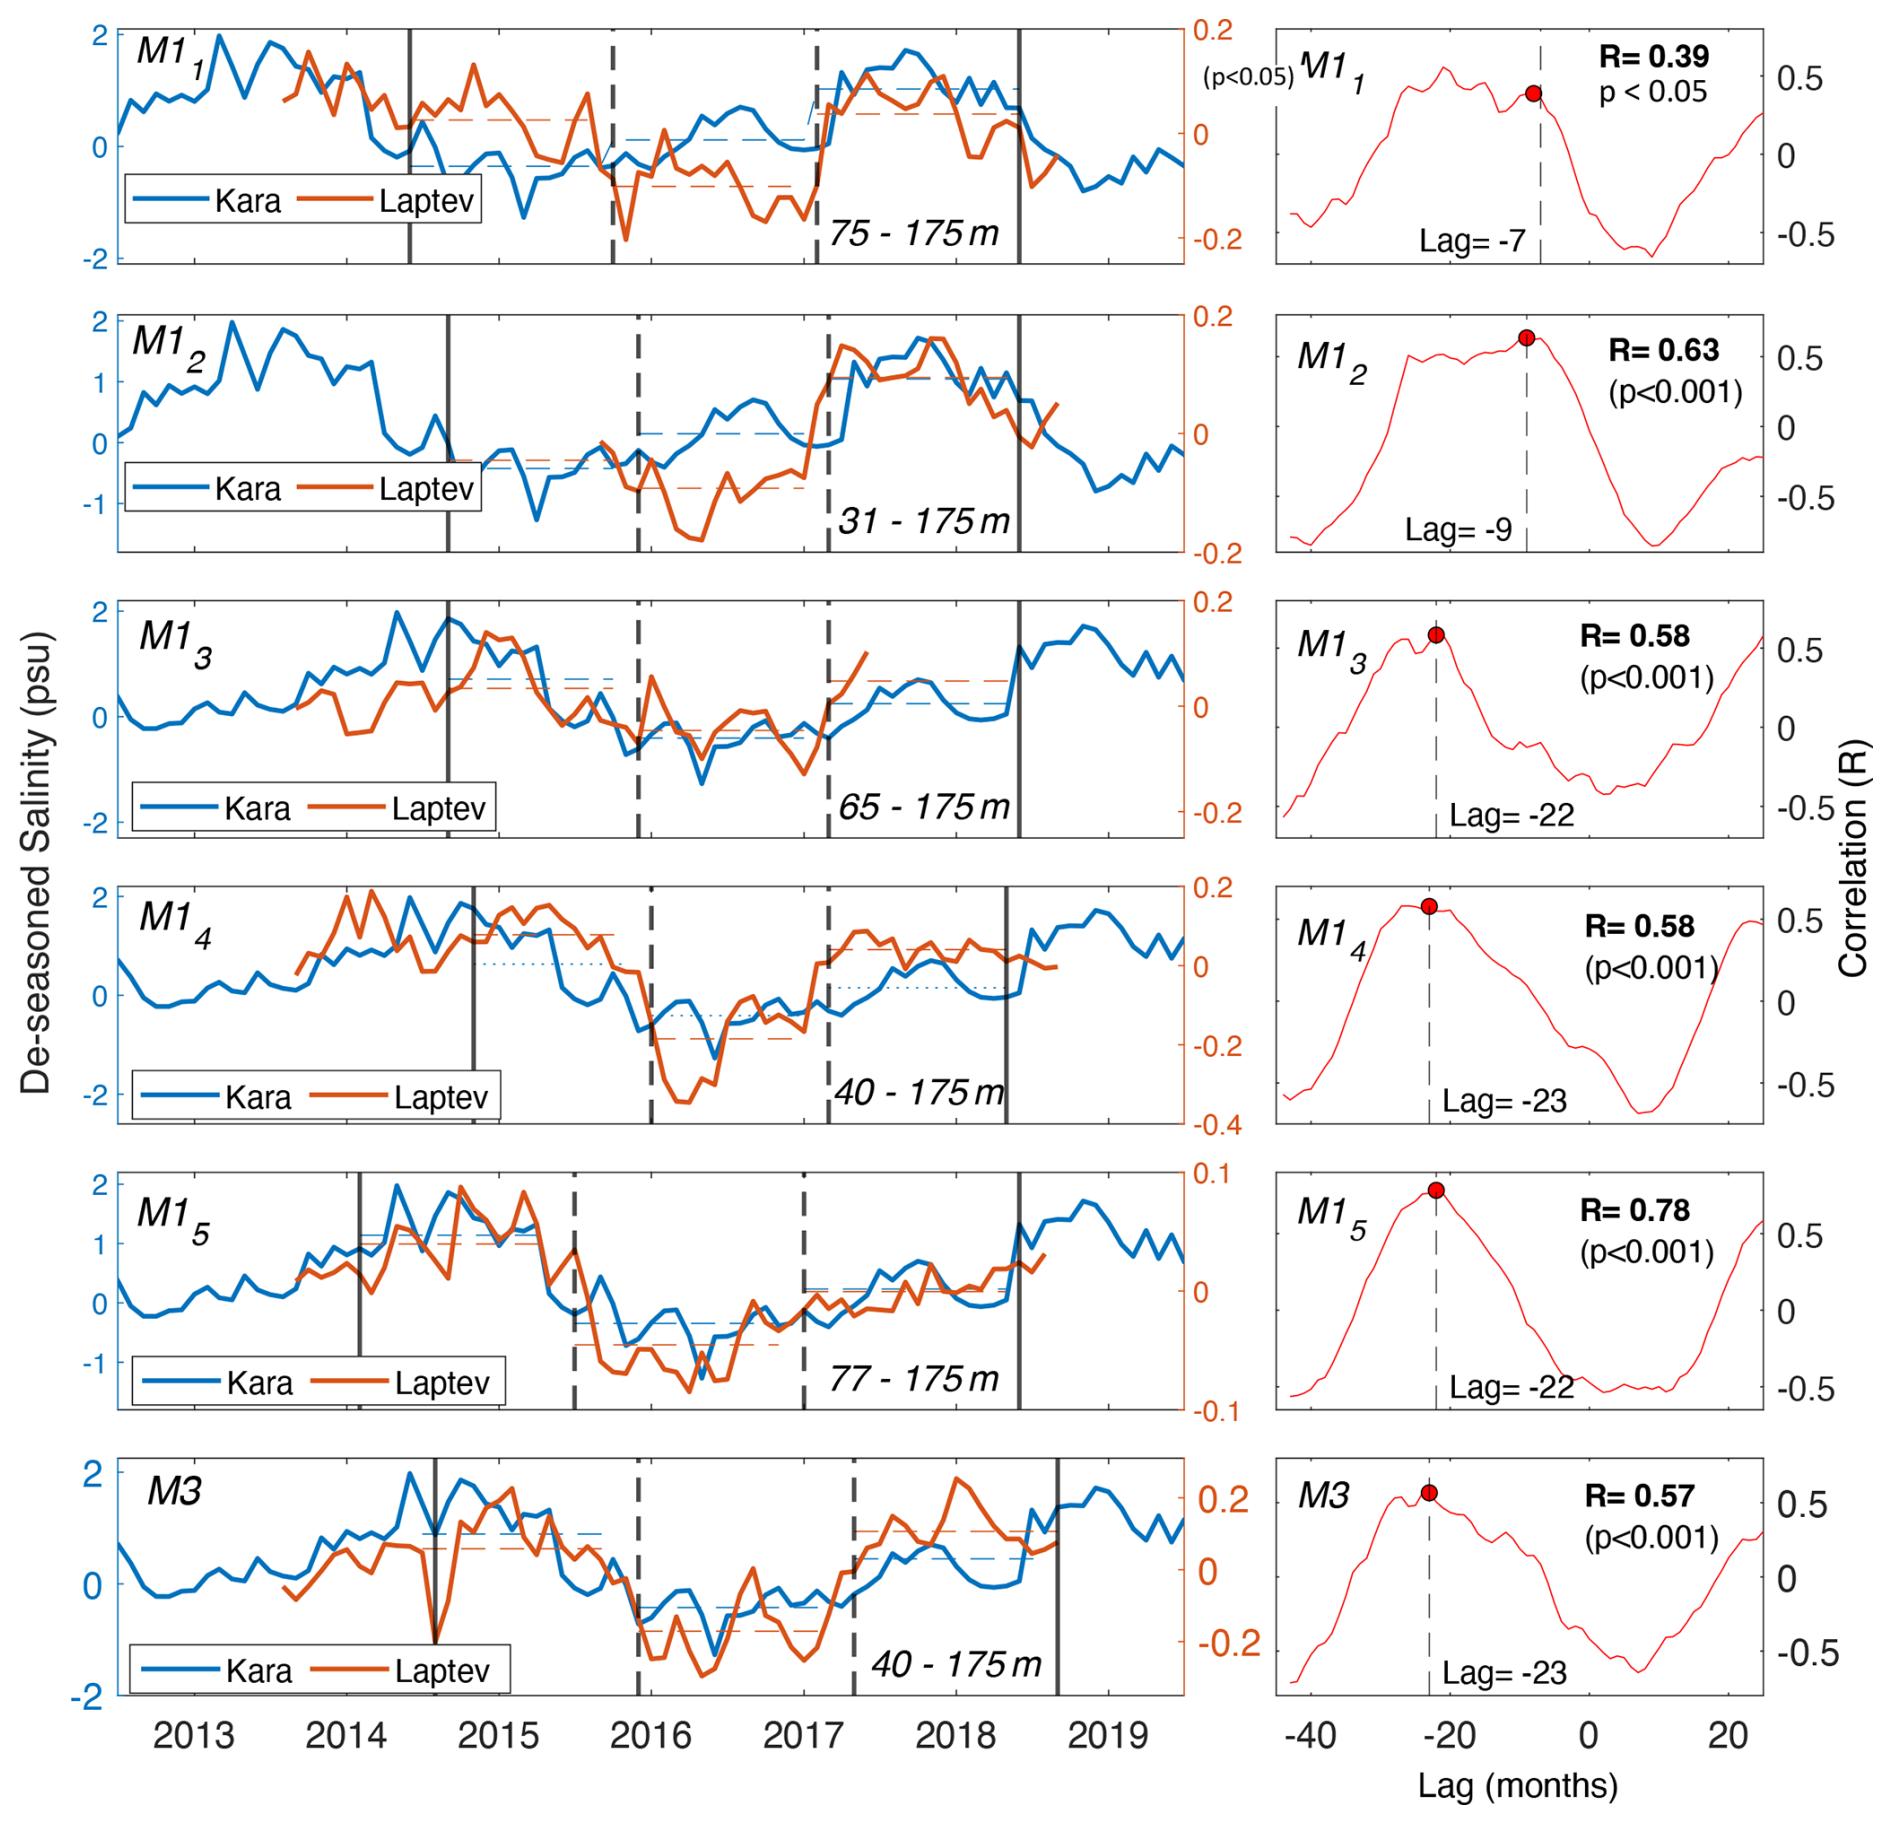
Figure 10Monthly time series of salinity anomalies averaged across the depth range (sub-surface to 175 m) for the Laptev Sea (orange), derived from mooring records, and the Kara Sea (blue), obtained from ORAS5 1 m surface salinity (the latter is lagged by maximum correlation).
The 2015–2017 freshening event in the eastern Eurasian Basin coincided with wind conditions favorable for the eastward advection of freshwater from the Kara Sea to the Laptev Sea. ERA5 reanalysis winds illustrate the atmospheric circulation pattern during the onset of the event, showing a configuration conducive to eastward freshwater transport from the Kara Sea into the Laptev Sea (Fig. 11). In particular, easterly/southeasterly winds favor a northeastward flow, enhancing the eastward transport of riverine waters from the Siberian river mouths. Thus, the timing and magnitude of the Yenisey and Ob discharges (Fig. 10), together with wind conditions promoting eastward advection from the Kara Sea (Fig. 11), represent the most plausible drivers of the 2015–2017 freshening observed in the eastern Eurasian Basin.
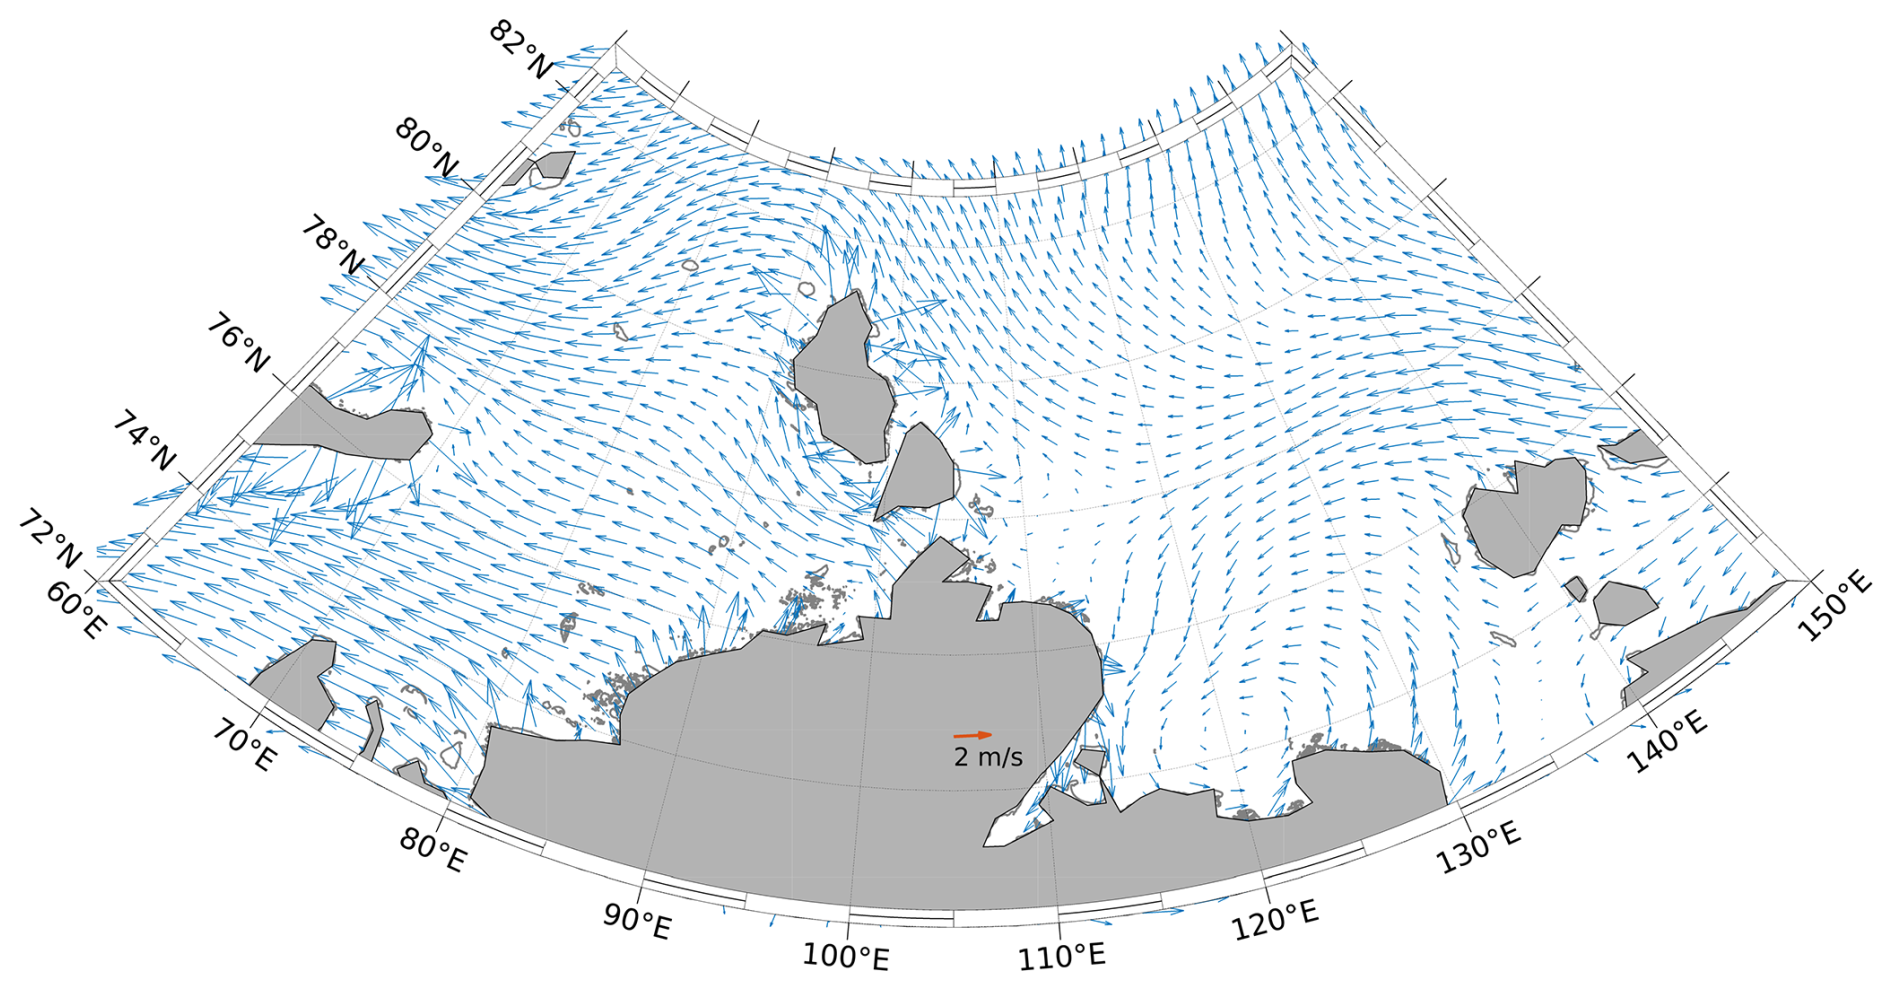
Figure 11ERA5 10 m wind vectors averaged over June–November 2015, corresponding to the onset of the freshening event in the Eurasian Basin.
To explore whether the surplus freshwater from the Yenisey and Ob discharges could reach the Laptev slope moorings under anomalous wind conditions, we conducted a Lagrangian tracer analysis. This involved using surface (0–5 m) parcels from monthly ORAS5 reanalysis velocities (see Methods for details). These parcels were initialized at each mooring location and advected backward over 23 months, a duration selected to match the salinity lag observed between Kara and Laptev Sea salinity. The resulting trajectories reveal that upper eastern Eurasian Basin freshening originates in the Kara Sea (Fig. 12). Also, the trajectories show that no parcel originates from the Lena River delta, implying that its runoff did not contribute to the observed freshening. The anomalous discharge from the Kara Sea moves eastward as a coastal current, enters the 10–20 km wide Vilkitsky Strait, and then continues eastward toward the continental slope of the eastern Eurasian Basin, which it subsequently follows. This pathway was identified by Janout et al. (2015). The trajectories remain very similar across all three periods – before, during, and after the freshening event. A negligible change in the trajectory pattern suggesting that the large Yenisey and Ob River discharge between 2014 and 2015 (Fig. 8) was probably the dominant source of the freshening observed in the eastern Eurasian Basin.

Figure 12Twenty-three months back trajectories calculated from six mooring locations in the eastern Eurasian Basin using ORAS5 current velocity fields (0–5 m) for a month of each period: April 2015 pre-event), April 2016 (event), and October 2017 post-event). Each color line represents a Lagrangian path traced backward from a mooring location: M11 (dark blue), M12 (light blue), M13 (green), M14 (yellow), M15 (orange), M3 (red).
3.3 Consequences of the eastern Eurasian Basin freshening on ocean currents and sea ice
The 2015–2017 freshening event resulted in strong upper-ocean stratification, as evidenced by an increase in the squared buoyancy frequency (N2) extending to ∼ 100 m from late 2015 through 2017 (Fig. 13a). This enhanced salinity stratification can strongly suppress vertical mixing and reduce heat exchange between the surface layer and the underlying Atlantic Water (AW) (e.g., Miller, 1976; Polyakov et al., 2025). Concurrently, upper-ocean circulation weakened markedly: both the near-surface current speed () and the vertical shear of horizontal currents (Uz) declined during the same period, reaching a minimum in 2017 (Fig. 13b–c). The annual mean current speed decreased from ∼ 7.3 cm s−1 in 2014–2016 to ∼ 5.7 cm s−1 in 2017 (a ∼ 22 % reduction), while vertical shear dropped from ∼ 9.2 s−1 in 2014–2015 to ∼ 4.8 s−1 in 2016 (∼ 47 % decrease) and ∼ 4.1 s−1 in 2017 (∼ 54 % decrease). As the freshening signal weakened, both variables recovered, with current speed increasing to ∼ 8.4 cm s−1 and shear rising to ∼ 8.6 s−1 in 2018, indicating a re-intensification of upper-ocean dynamics. We interpret the concurrent reductions in current speed and shear during the freshening period as a dynamical response to enhanced stratification, which likely inhibited downward penetration of wind-driven momentum into the ocean interior and confined the response to a very thin (<10 m) near-surface layer. However, due to surface reflection effects and associated contamination, ADCP-based measurements are not reliable within this near-surface layer.
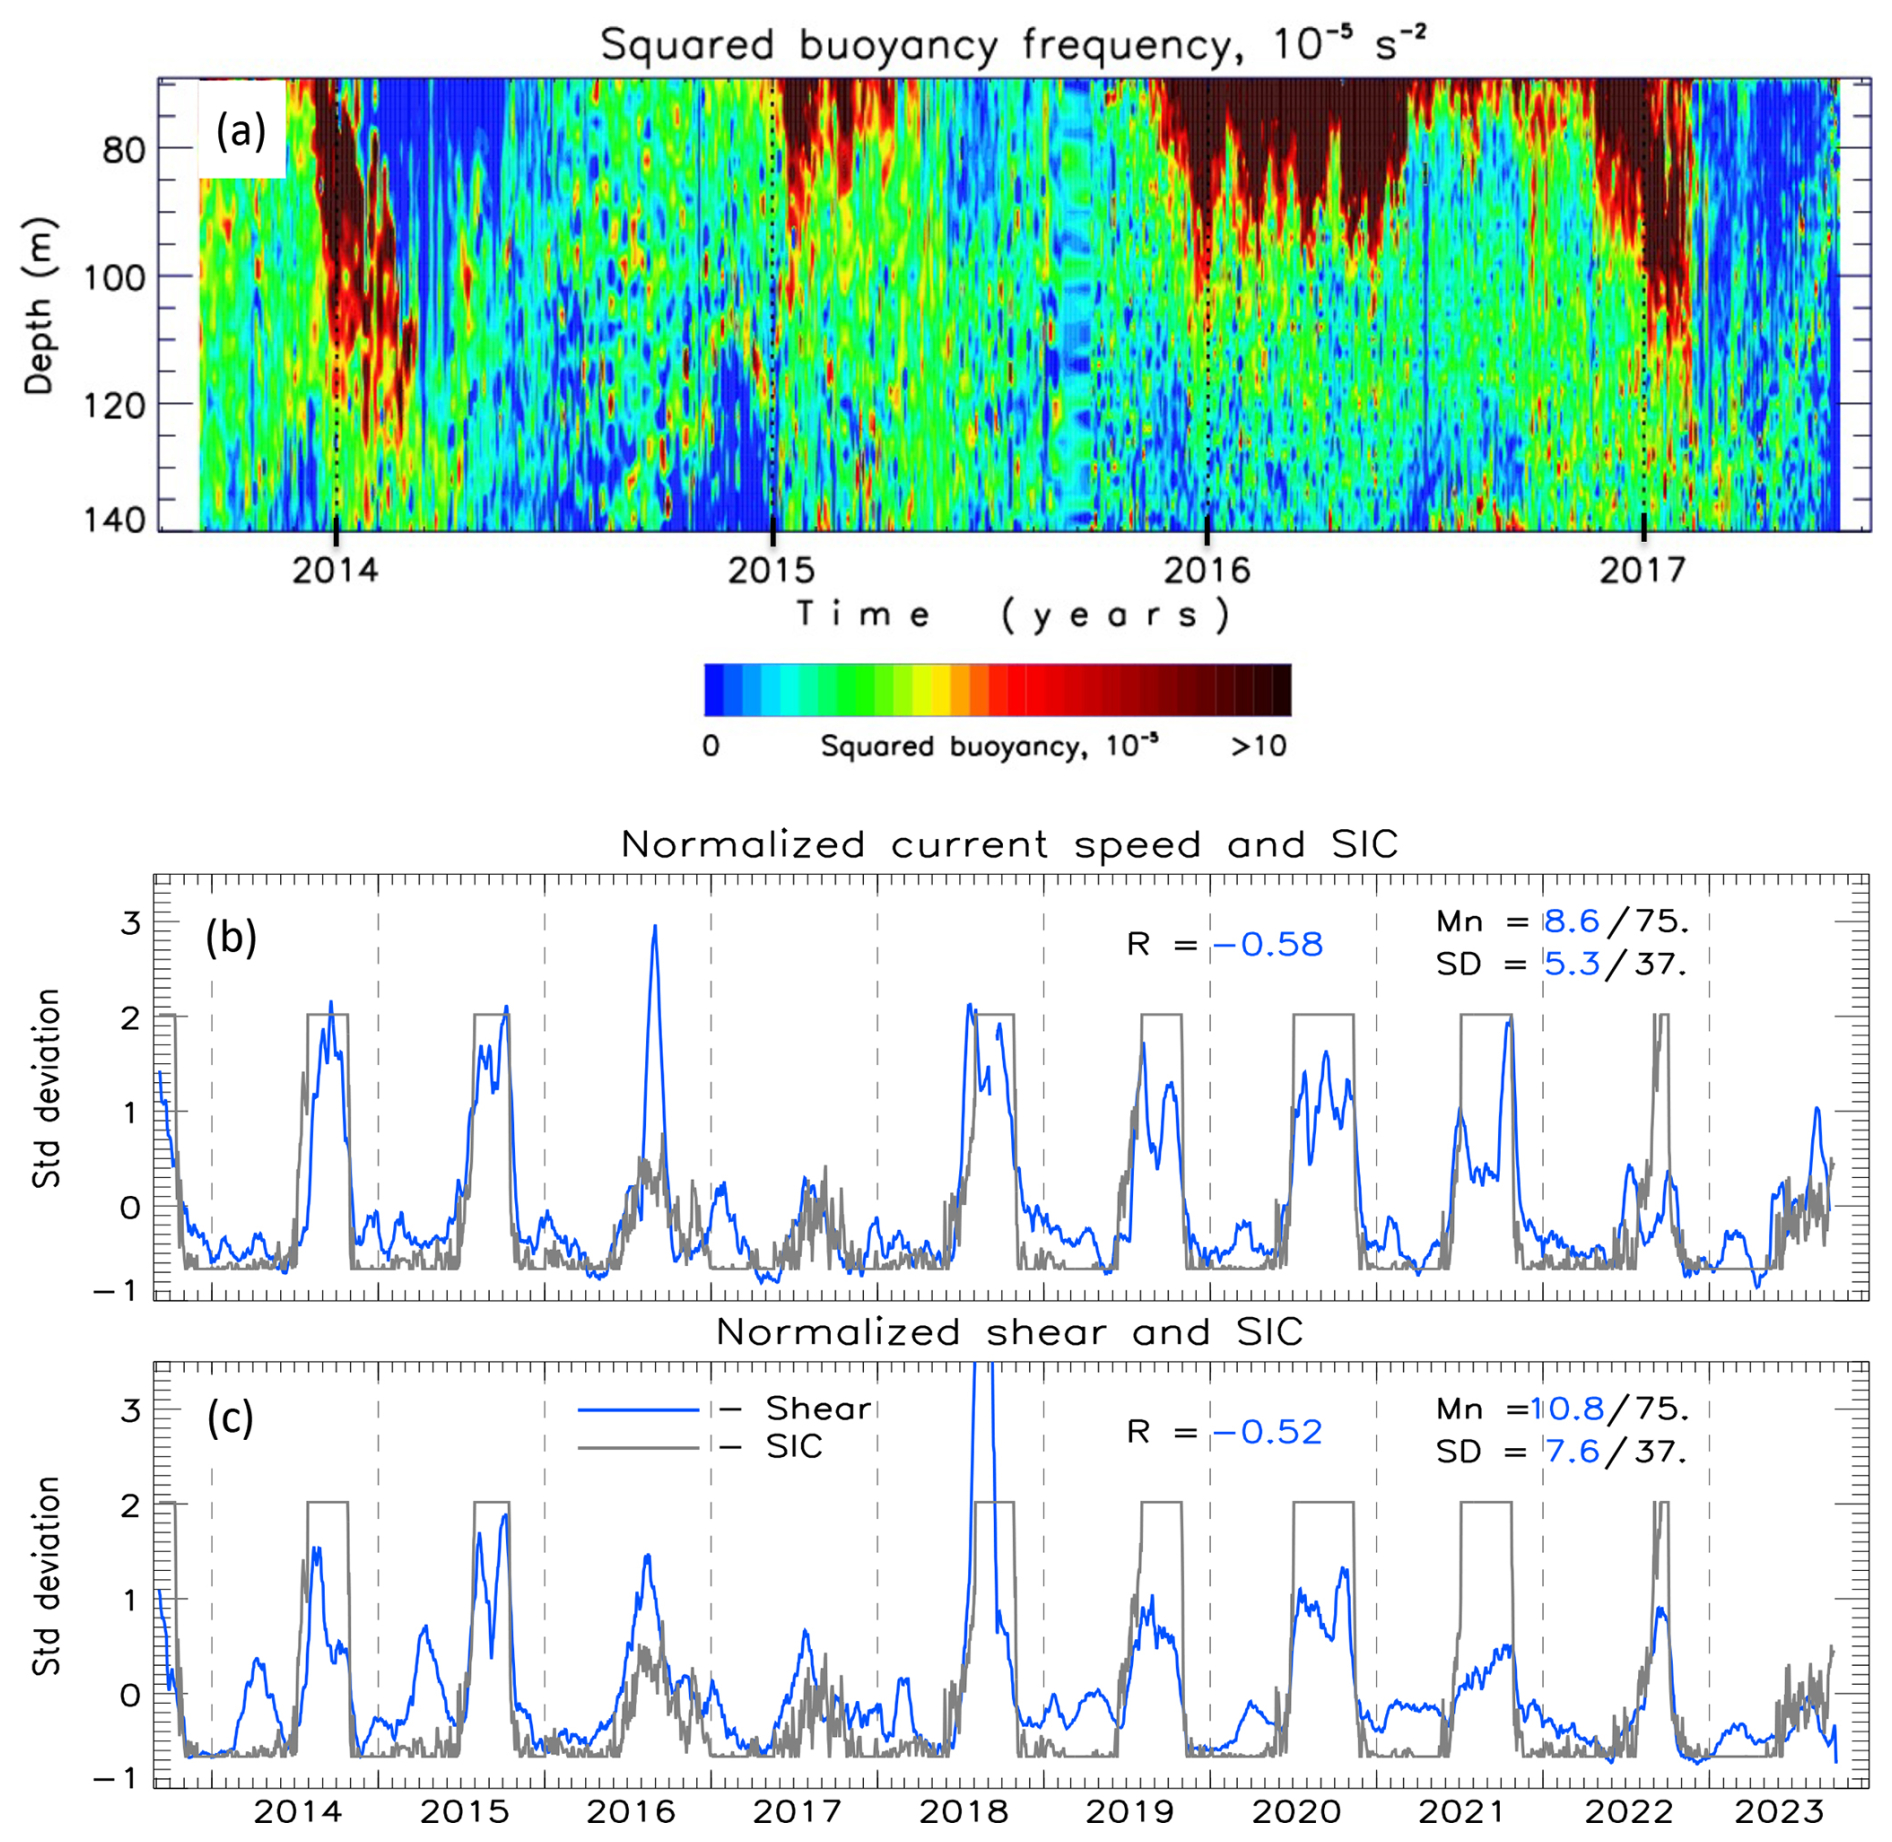
Figure 13Consequences of the 2015-2017 freshening event in the eastern Eurasian Basin. (a) Time-depth section of squared buoyancy frequency N2 for the M13 mooring location (adapted from Polyakov et al., 2020b). Vertical black dotted lines indicate year boundaries. (b, c) Time series of normalized (reduced to anomalies by subtracting means, Mn, and divided by standard deviations, SD) current speed , vertical shear of horizontal current (both from 10 m depth level), and sea ice concentration, SIC (the latter time series are multiplied by minus one) at the mooring location. Blue lines represent total current speed and shear, while grey lines indicate SIC. Mn and SD are provided for in cm s−1, in 103 s and SIC in %. Correlations R between and SIC (blue digits) are statistically significant (p<0.05).
The increased stratification and reduced upper-ocean currents and shear in 2015 and 2016 were accompanied by a significant increase in the sea ice concentration observed at all moorings during the following summers of 2016 and 2017 (Figs. 13, S7). At moorings M11, M12, and M13, the seasonal decline from June to September slowed in 2016–2017 compared to 2013–2015 and 2018, with sea ice concentration remaining higher through late summer than in other years. At moorings M14, M15, and M3, summer SIC remained near 50 %–70 % in 2016–2017, whereas in other years before and after, it dropped to zero between August and October, highlighting the presence of sea ice in offshore regions during the freshening event. Altogether, these findings suggest that the 2015–2017 freshening event altered upper-ocean stratification, resulting in delayed sea ice melt, thereby contributing to increased summer sea ice. We note, however, that both sea ice concentration and stratification exhibit strong seasonal variability, and part of their covariability may arise from common external forcing, such as seasonal winds affecting both ice drift and upper-ocean circulation. Nevertheless, the observed sequence of freshening, reduced shear, and enhanced sea ice is consistent with the proposed mechanism linking freshwater forcing to upper-ocean and sea ice changes.
4.1 Summary of findings
A freshening event, spanning October 2015–March 2017, was observed at six moorings (M11–M15, M3) in the eastern Eurasian Basin, beginning at the shelf moorings M11–M13 in late 2015 and reaching the offshore moorings M14, M15, and M3 by early 2016, persisting into early 2017. Salinity in the upper 175 m decreased by an average of 0.5 psu, which is equivalent to ∼ 0.60 m of freshwater, and nearly doubling the potential energy at the shelf moorings, thereby enhancing stratification during the freshening event. The observed freshening cannot be explained by the cross-slope shifts of the AW salty and warm core. Instead, chemical observations indicate that meteoric (river) water predominantly contributed to the freshwater content in the Eurasian Basin, doubled from 0.06 % in 2013 to 0.12 % in 2015. Discharge records show an anomalous increase from the Yenisey and Ob rivers in 2014–2015 relative to 2013, with Yenisey contributing ∼ 0.34 m and Ob contributing ∼ 0.44 m in 2014–2015 of freshwater when spread over the mooring domain, which together could supply enough freshwater to account for the observed freshwater in the eastern Eurasian Basin. Moreover, low-salinity anomalies detected in the Kara Sea in spring 2015 further supported the connection between Siberian River discharge and the freshening observed in the Eurasian Basin. The trajectory analysis reveals that the upper ocean freshening found in the mooring records indeed originated from the Kara Sea, emphasizing the Yenisey and Ob discharge as the primary source. Cross-correlation analysis between time series of Kara and Laptev Sea salinity shows that freshwater transport is aligned with the varying start dates of freshening observed at the moorings.
The 2015–2017 freshening increased stratification, which can inhibit vertical heat ventilation from the AW below. This diminished upward transfer of heat allows the sea ice to grow thicker. Consequently, thicker ice persisted through the melting summer season and delayed sea-ice melt. As a result, the summer sea ice concentration at offshore moorings in 2016–2017 stayed between 50 %–70 %, instead of declining to near-zero as in 2013–2015 and 2018. At the same time, during the freshening period, surface current speed and vertical shear in the upper 10m experienced a significant weakening by as much as 90 %.
4.2 Broader climate implications
The observed freshening between 2015 and 2017, along with increased upper-ocean stratification, resulted in more stable halocline conditions. This freshwater, therefore, can slow down atlantification (a part of climate change associated with the advection of anomalous water properties from upstream basins), because the buoyant freshwater layer limits the upward ventilation from the Atlantic warm layer (e.g., Polyakov et al., 2017, 2023). Following the 2015–2017 event, Polyakov et al., (2020b) reported an intense release of accumulated subsurface heat in 2018, with vertical heat flux increased by almost a factor of two relative to the previous years, causing extensive sea ice loss. Modeling experiments also demonstrate that adding freshwater can delay ice melt by strengthening stratification (Zhang et al., 2023).
At much longer time scales, during the Younger Dryas and 8.2 ka events, large freshwater discharges strengthened Arctic stratification and expanded sea-ice cover, yet subsequent re-ventilation of oceanic heat produced rapid warming and long-lasting ice retreat (Fahl and Stein, 2012; Spielhagen and Bauch, 2015). This illustrate that freshwater perturbations can act first as a stabilizing barrier, then as a trigger for abrupt transitions in ocean–ice regimes once the barrier erodes. At present, riverine-driven freshening could operate similarly by alternately insulating and exposing the Arctic's subsurface heat reservoir. Once extensive sea-ice loss occurs, positive feedback such as reduced albedo and enhanced ocean heat uptake reinforce the warming and hinder sea ice recovery (Dörr et al., 2021). Hence, existing observations, model studies, and paleoclimate examples together suggest that freshwater anomalies can exert a powerful control over Arctic stratification, sea-ice dynamics, and climate stability.
4.3 Uncertainties and Limitations
This study has a few limitations and uncertainties that should be considered when interpreting the findings. First, the mooring array provides reasonable multi-year coverage in the Eurasian Basin; however, mooring observations start at a depth of ∼ 30 m or greater (see Table 1) to avoid ice keels. Consequently, the maximum freshening, which resides in the very top layer, cannot be monitored, and the overall magnitude of freshening is underestimated by the available mooring records (see Methods where we quantify this effect). Vertical resolution varies among moorings: single-depth CTD sensors provide coarser resolution, while MMPs offer continuous vertical profiles. However, for integral characteristics like freshwater content, this had minimal effect (see Methods for details).
Another potential limitation comes from the assumption that the parcels remain at a fixed depth in our trajectory experiments using ORAS5 velocities, thus neglecting vertical motions that could alter their travel times or pathways. However, the freshwater pathway from the Kara Sea to the Laptev Sea identified in our analysis is well supported by observations (Janout et al., 2015; Osadchiev et al., 2023), reinforcing confidence in our result. Also, while ORAS5 performs better than several other reanalyses and model products in the Arctic (Hall et al., 2022), it still tends to overestimate sea-surface salinity and under-resolve currents in ice-covered regions (Jin et al., 2023). We used this reanalysis-based Kara Sea salinity data in the spatial distributions of salinities (Fig. 9) and for correlation analysis (Fig. 10). This bias may impact estimates of salinity in the Kara Sea, potentially reducing the observed correlations between the Kara and Laptev Sea time series.
Enhanced observations in the surface ocean layer and more sophisticated data assimilation in reanalysis models will help reduce uncertainties related to the above shortcomings. Despite these limitations, the core findings, including the anomalous freshening of the eastern Eurasian Basin and northern Laptev Sea driven by Yenisey and Ob dominated river discharge, and its impacts on sea ice and upper-ocean currents, are robust and well supported by extensive observations.
4.4 Final note
Understanding the role of episodic events is essential for assessing their influence on upper-ocean stratification, sea ice variability, and potential feedback within the Arctic climate system. This underscores the need for long-term sustained mooring deployments, with enhanced observations in the near-surface layer, and integration of these datasets with reanalysis to better understand and predict the cascading consequences of freshening events on Arctic climate and ecosystems. Our results demonstrate that extreme river discharge events can rapidly reorganize shelf–basin freshwater pathways, alter upper-ocean dynamics, and exert lasting influence on regional sea-ice cover. Improved representation of such episodic events in coupled models will be essential for predicting future Arctic climate variability.
All mooring data used in this study are available at https://arcticdata.io/catalog/#view/arctic-data (last access: 15 June 2026). The ERA5 reanalysis data is available from https://doi.org/10.24381/cds.adbb2d47 (Copernicus Climate Change Service, Climate Data Store, 2023). Sea ice concentration is available from https://www.ncei.noaa.gov/cdo-web/ (last access: 10 June 2026).
The supplement related to this article is available online at https://doi.org/10.5194/os-22-2267-2026-supplement.
All authors participated in preliminary analysis, data processing and analysis of mooring data, interpretation of hydrographic data and formulating objectives of the study. All authors contributed to interpreting the data and writing the paper.
The contact author has declared that none of the authors has any competing interests.
Publisher's note: Copernicus Publications remains neutral with regard to jurisdictional claims made in the text, published maps, institutional affiliations, or any other geographical representation in this paper. The authors bear the ultimate responsibility for providing appropriate place names. Views expressed in the text are those of the authors and do not necessarily reflect the views of the publisher.
IVP acknowledges funding from Office of Naval Research Grant N00014-21-1-2577. DM and IVP were supported by National Science Foundation (NSF) grant #1724523 and the U.S. Department of Energy grant 280253.
This research has been supported by the Office of Naval Research (grant no. N00014-21-1-2577), the Directorate for Geosciences (grant no. 1724523), and the Connecticut Department of Energy and Environmental Protection (grant no. 280253).
This paper was edited by Agnieszka Beszczynska-Möller and reviewed by Sergei Kirillov and two anonymous referees.
Aagaard, K. and Carmack, E. C.: The role of sea ice and other fresh water in the Arctic circulation, J. Geophys. Res.-Oceans, 94, 14485–14498, https://doi.org/10.1029/JC094iC10p14485, 1989.
Aksenov, Y., Ivanov, V. V., Nurser, A. J. G., Bacon, S., Polyakov, I. V., Coward, A. C., Naveira-Garabato, A. C., and Beszczynska-Moeller, A.: The arctic circumpolar boundary current, J. Geophys. Res.-Oceans, 116, https://doi.org/10.1029/2010JC006637, 2011.
Alkire, M. B., Morison, J., Schweiger, A., Zhang, J., Steele, M., Peralta-Ferriz, C., and Dickinson, S.: A Meteoric Water Budget for the Arctic Ocean, J. Geophys. Res.-Oceans, 122, 10020–10041, https://doi.org/10.1002/2017JC012807, 2017.
Bauch, D., Schlosser, P., and Fairbanks, R. G.: Freshwater balance and the sources of deep and bottom waters in the Arctic Ocean inferred from the distribution of HO, Progress in Oceanography, 35, 53–80, https://doi.org/10.1016/0079-6611(95)00005-2, 1995.
Bauch, D., Hölemann, J. A., Nikulina, A., Wegner, C., Janout, M. A., Timokhov, L. A., and Kassens, H.: Correlation of river water and local sea-ice melting on the Laptev Sea shelf (Siberian Arctic), J. Geophys. Res.-Oceans, 118, 550–561, https://doi.org/10.1002/jgrc.20076, 2013.
Baumann, T. M., Polyakov, I. V., Pnyushkov, A. V., Rember, R., Ivanov, V. V., Alkire, M. B., Goszczko, I., and Carmack, E. C.: On the seasonal cycles observed at the continental slope of the Eastern Eurasian basin of the Arctic Ocean, J. Phys. Oceanogr., 48, 1451–1470, https://doi.org/10.1175/JPO-D-17-0163.1, 2018.
Carmack, E., Polyakov, I., Padman, L., Fer, I., Hunke, E., Hutchings, J., Jackson, J., Kelley, D., Kwok, R., Layton, C., Melling, H., Perovich, D., Persson, O., Ruddick, B., Timmermans, M.-L., Toole, J., Ross, T., Vavrus, S., and Winsor, P.: Toward Quantifying the Increasing Role of Oceanic Heat in Sea Ice Loss in the New Arctic, B. Am. Meteorol. Soc., https://doi.org/10.1175/BAMS-D-13-00177.1, 2015.
Cavalieri, D. J., Parkinson, C. L., and Vinnikov, K. Y.: 30-Year satellite record reveals contrasting Arctic and Antarctic decadal sea ice variability, Geophys. Res. Lett., 30, https://doi.org/10.1029/2003GL018031, 2003.
Comiso, J.: Bootstrap Sea Ice Concentrations from Nimbus-7 SMMR and DMSP SSM/I-SSMIS, Version 3, National Snow and Ice Data Center, https://doi.org/10.5067/7Q8HCCWS4I0R, 2017.
Copernicus Climate Change Service, Climate Data Store: ERA5 hourly data on single levels from 1940 to present, Copernicus Climate Change Service (C3S) Climate Data Store (CDS) [data set], https://doi.org/10.24381/cds.adbb2d47, 2023.
Dai, A. and Trenberth, K. E.: Estimates of Freshwater Discharge from Continents: Latitudinal and Seasonal Variations, J. Hydrometeorol., 3, 660–687, https://doi.org/10.1175/1525-7541(2002)003<0660:EOFDFC>2.0.CO;2, 2002.
Dittmar, T. and Kattner, G.: The biogeochemistry of the river and shelf ecosystem of the Arctic Ocean: a review, Mar. Chem., 83, 103–120, https://doi.org/10.1016/S0304-4203(03)00105-1, 2003.
Dörr, J., Årthun, M., Eldevik, T., and Madonna, E.: Mechanisms of Regional Winter Sea-Ice Variability in a Warming Arctic, J. Climate, https://doi.org/10.1175/JCLI-D-21-0149.1, 2021.
Fahl, K. and Stein, R.: Modern seasonal variability and deglacial/Holocene change of central Arctic Ocean sea-ice cover: New insights from biomarker proxy records, Earth Planet. Sc. Lett., 351–352, 123–133, https://doi.org/10.1016/j.epsl.2012.07.009, 2012.
Haine, T. W. N., Curry, B., Gerdes, R., Hansen, E., Karcher, M., Lee, C., Rudels, B., Spreen, G., de Steur, L., Stewart, K. D., and Woodgate, R.: Arctic freshwater export: Status, mechanisms, and prospects, Global Planet. Change, 125, 13–35, https://doi.org/10.1016/J.GLOPLACHA.2014.11.013, 2015.
Hall, S. B., Subrahmanyam, B., and Morison, J. H.: Intercomparison of Salinity Products in the Beaufort Gyre and Arctic Ocean, Remote Sensing, 14, 71, https://doi.org/10.3390/rs14010071, 2022.
Hersbach, H., Bell, B., Berrisford, P., Hirahara, S., Horányi, A., Muñoz-Sabater, J., Nicolas, J., Peubey, C., Radu, R., Schepers, D., Simmons, A., Soci, C., Abdalla, S., Abellan, X., Balsamo, G., Bechtold, P., Biavati, G., Bidlot, J., Bonavita, M., De Chiara, G., Dahlgren, P., Dee, D., Diamantakis, M., Dragani, R., Flemming, J., Forbes, R., Fuentes, M., Geer, A., Haimberger, L., Healy, S., Hogan, R. J., Hólm, E., Janisková, M., Keeley, S., Laloyaux, P., Lopez, P., Lupu, C., Radnoti, G., de Rosnay, P., Rozum, I., Vamborg, F., Villaume, S., and Thépaut, J.-N.: The ERA5 global reanalysis, Q. J. Roy. Meteor. Soc., 146, 1999–2049, https://doi.org/10.1002/qj.3803, 2020.
Hoffman, E. L., Subrahmanyam, B., Trott, C. B., and Hall, S. B.: Comparison of Freshwater Content and Variability in the Arctic Ocean Using Observations and Model Simulations, Remote Sensing, 15, 3715, https://doi.org/10.3390/rs15153715, 2023.
Holmes, R. M., Coe, M. T., Fiske, G. J., Gurtovaya, T., McClelland, J. W., Shiklomanov, A. I., Spencer, R. G. M., Tank, S. E., and Zhulidov, A. V.: Climate change impacts on the hydrology and biogeochemistry of Arctic rivers, edited by: Goldman, C. R., Kumagai, M., and Robarts, R. D., Global Impacts of Climate Change on Inland Waters, Wiley, 3–26, https://doi.org/10.1002/9781118470596.ch1, 2013.
Holmes, R. M., McClelland, J., Tank, S., Spencer, R., and Shiklomanov, A.: Arctic Great Rivers Observatory IV Biogeochemistry and Discharge Data: 2020–2024, Arctic Data Center, https://doi.org/10.18739/A2FQ9Q683, 2022.
IPCC: Climate Change 2021: The Physical Science Basis. Contribution of Working Group I to the Sixth Assessment Report of the Intergovernmental Panel on Climate Change, https://doi.org/10.1017/9781009157896, 2021.
Janout, M. A., Aksenov, Y., Hölemann, J. A., Rabe, B., Schauer, U., Polyakov, I. V., Bacon, S., Coward, A. C., Karcher, M., Lenn, Y. D., Kassens, H., and Timokhov, L.: Kara Sea freshwater transport through Vilkitsky Strait: Variability, forcing, and further pathways toward the western Arctic Ocean from a model and observations, J. Geophys. Res.-Oceans, 120, 4925–4944, https://doi.org/10.1002/2014JC010635, 2015.
Jin, Y., Chen, M., Yan, H., Wang, T., and Yang, J.: Sea level variation in the Arctic Ocean since 1979 based on ORAS5 data, Front. Mar. Sci., 10, https://doi.org/10.3389/fmars.2023.1197456, 2023.
Langehaug, H. R., H. Sagen, A. Stallemo, P. Uotila, L. Rautiainen, S. M. Olsen, M. Devilliers, S. Yang, and E. Storheim: Constraining CMIP6 estimates of Arctic Ocean temperature and salinity in 2025–2055, Front. Mar. Sci., 10, 1211562, https://doi.org/10.3389/fmars.2023.1211562, 2023.
Laukert, G., Bauch, D., Rabe, B., Krumpen, T., Damm, E., Kienast, M., Hathorne, E., Vredenborg, M., Tippenhauer, S., Andersen, N., Meyer, H., Mellat, M., D'Angelo, A., Simões Pereira, P., Nomura, D., Horner, T. J., Hendry, K., and Kienast, S. S.: Dynamic ice–ocean pathways along the Transpolar Drift amplify the dispersal of Siberian matter, Nat. Commun., 16, 3172, https://doi.org/10.1038/s41467-025-57881-9, 2025.
Miller, J. R.: The Salinity Effect in a Mixed Layer Ocean Model, J. Phys. Oceanogr., 6, 29–35, https://doi.org/10.1175/1520-0485(1976)006<0029:TSEIAM>2.0.CO;2, 1976.
Müller, V., Wang, Q., Koldunov, N., Danilov, S., Sidorenko, D., and Jung, T.: Variability of Eddy Kinetic Energy in the Eurasian Basin of the Arctic Ocean Inferred From a Model Simulation at 1-km Resolution, J. Geophys. Res.-Oceans, 129, e2023JC020139, https://doi.org/10.1029/2023JC020139, 2024.
Nguyen, A. T., Menemenlis, D., and Kwok, R.: Arctic ice-ocean simulation with optimized model parameters: Approach and assessment, J. Geophys. Res.-Oceans, 116, https://doi.org/10.1029/2010JC006573, 2011.
Osadchiev, A., Sedakov, R., Frey, D., Gordey, A., Rogozhin, V., Zabudkina, Z., Spivak, E., Kuskova, E., Sazhin, A., and Semiletov, I.: Intense zonal freshwater transport in the Eurasian Arctic during ice-covered season revealed by in situ measurements, Sci. Rep., 13, 16508, https://doi.org/10.1038/s41598-023-43524-w, 2023.
Osadchiev, A., Kuskova, E., and Ivanov, V.: The roles of river discharge and sea ice melting in formation of freshened surface layers in the Kara, Laptev, and East Siberian seas, Front. Mar. Sci., 11, https://doi.org/10.3389/fmars.2024.1348450, 2024.
Pemberton, P., Nilsson, J., and Meier, H. E. M.: Arctic Ocean freshwater composition, pathways and transformations from a passive tracer simulation, Tellus A, 66, 23988, https://doi.org/10.3402/tellusa.v66.23988, 2014.
Pnyushkov, A. V., Polyakov, I. V., Ivanov, V. V., Aksenov, Y., Coward, A. C., Janout, M., and Rabe, B.: Structure and variability of the boundary current in the Eurasian Basin of the Arctic Ocean, Deep-Sea Res. Pt. I, 101, 80–97, https://doi.org/10.1016/j.dsr.2015.03.001, 2015.
Polyakov, I. V., Pnyushkov, A. V., Rember, R., Padman, L., Carmack, E. C., and Jackson, J. M.: Winter Convection Transports Atlantic Water Heat to the Surface Layer in the Eastern Arctic Ocean, J. Phys. Oceanogr., 43, 2142–2155, https://doi.org/10.1175/JPO-D-12-0169.1, 2013.
Polyakov, I. V., Pnyushkov, A. V., Alkire, M. B., Ashik, I. M., Baumann, T. M., Carmack, E. C., Goszczko, I., Guthrie, J., Ivanov, V. V., Kanzow, T., Krishfield, R., Kwok, R., Sundfjord, A., Morison, J., Rember, R., and Yulin, A.: Greater role for Atlantic inflows on sea-ice loss in the Eurasian Basin of the Arctic Ocean, Science, 356, 285–291, https://doi.org/10.1126/science.aai8204, 2017.
Polyakov, I. V., Pnyushkov, A. V., and Carmack, E. C.: Stability of the arctic halocline: a new indicator of arctic climate change, Environ. Res. Lett., 13, 125008, https://doi.org/10.1088/1748-9326/aaec1e, 2018.
Polyakov, I. V., Rippeth, T. P., Fer, I., Baumann, T. M., Carmack, E. C., Ivanov, V. V., Janout, M., Padman, L., Pnyushkov, A. V., and Rember, R.: Intensification of Near-Surface Currents and Shear in the Eastern Arctic Ocean, Geophys. Res. Lett., 47, e2020GL089469, https://doi.org/10.1029/2020GL089469, 2020a.
Polyakov, I. V., Rippeth, T. P., Fer, I., Alkire, M. B., Baumann, T. M., Carmack, E. C., Ingvaldsen, R., Ivanov, V. V., Janout, M., Lind, S., Padman, L., Pnyushkov, A. V., and Rember, R.: Weakening of cold halocline layer exposes sea ice to oceanic heat in the eastern arctic ocean, J. Climate, 33, 8107–8123, https://doi.org/10.1175/JCLI-D-19-0976.1, 2020b.
Polyakov, I. V., Ingvaldsen, R. B., Pnyushkov, A. V., Bhatt, U. S., Francis, J. A., Janout, M., Kwok, R., and Skagseth, Ø.: Fluctuating Atlantic inflows modulate Arctic atlantification, Science, 381, 972–979, https://doi.org/10.1126/science.adh5158, 2023.
Polyakov, I. V., Pnyushkov, A. V., Carmack, E. C., Charette, M., Cho, K.-H., Dykstra, S., Haapala, J., Jung, J., Kipp, L., Yang, E. J., and Molodtsov, S.: Role of sea ice, stratification, and near-inertial oscillations in shaping the upper Siberian Arctic Ocean currents, Ocean Sci., 21, 3105–3122, https://doi.org/10.5194/os-21-3105-2025, 2025.
Rawlins, M. A. and Karmalkar, A. V.: Regime shifts in Arctic terrestrial hydrology manifested from impacts of climate warming, The Cryosphere, 18, 1033–1052, https://doi.org/10.5194/tc-18-1033-2024, 2024.
Rawlins, M. A., Steele, M., Holland, M. M., Adam, J. C., Cherry, J. E., Francis, J. A., Groisman, P. Y., Hinzman, L. D., Huntington, T. G., Kane, D. L., Kimball, J. S., Kwok, R., Lammers, R. B., Lee, C. M., Lettenmaier, D. P., McDonald, K. C., Podest, E., Pundsack, J. W., Rudels, B., Serreze, M. C., Shiklomanov, A., Skagseth, Ø., Troy, T. J., Vörösmarty, C. J., Wensnahan, M., Wood, E. F., Woodgate, R., Yang, D., Zhang, K., and Zhang, T.: Analysis of the Arctic System for Freshwater Cycle Intensification: Observations and Expectations, J. Climate, https://doi.org/10.1175/2010JCLI3421.1, 2010.
Serreze, M. C., Barrett, A. P., Slater, A. G., Woodgate, R. A., Aagaard, K., Lammers, R. B., Steele, M., Moritz, R., Meredith, M., and Lee, C. M.: The large-scale freshwater cycle of the Arctic, J. Geophys. Res.-Oceans, 111, https://doi.org/10.1029/2005JC003424, 2006.
Shiklomanov, A., Déry, S., Tretiakov, M., Yang, D., Magritsky, D., Georgiadi, A., and Tang, W.: River Freshwater Flux to the Arctic Ocean, Arctic Hydrology, Permafrost and Ecosystems, 703–738, https://doi.org/10.1007/978-3-030-50930-9_24, 2021.
Shiklomanov, A. I., Yakovleva, T. I., Lammers, R. B., Karasev, I. Ph., Vörösmarty, Charles. J., and Linder, E.: Cold region river discharge uncertainty – estimates from large Russian rivers, J. Hydrol., 326, 231–256, https://doi.org/10.1016/j.jhydrol.2005.10.037, 2006.
Spielhagen, R. F. and Bauch, H. A.: The role of Arctic Ocean freshwater during the past 200 ky, Arktos, 1, 18, https://doi.org/10.1007/s41063-015-0013-9, 2015.
Stadnyk, T. A., Tefs, A., Broesky, M., Déry, S. J., Myers, P. G., Ridenour, N. A., Koenig, K., Vonderbank, L., and Gustafsson, D.: Changing freshwater contributions to the Arctic: A 90-year trend analysis (1981–2070), Elementa: Science of the Anthropocene, 9, 00098, https://doi.org/10.1525/elementa.2020.00098, 2021.
Stroeve, J. C., Markus, T., Boisvert, L., Miller, J., and Barrett, A.: Changes in Arctic melt season and implications for sea ice loss, Geophys. Res. Lett., 41, 1216–1225, https://doi.org/10.1002/2013GL058951, 2014.
Thurnherr, A. M., Goszczko, I., and Bahr, F.: Improving LADCP Velocity with External Heading, Pitch, and Roll, J. Atmos. Ocean. Tech., https://doi.org/10.1175/JTECH-D-16-0258.1, 2017.
Timmermans, M.-L. and Marshall, J.: Understanding Arctic Ocean Circulation: A Review of Ocean Dynamics in a Changing Climate, J. Geophys. Res.-Oceans, 125, e2018JC014378, https://doi.org/10.1029/2018JC014378, 2020.
Torrence, C. and Compo, G. P.: A Practical Guide to Wavelet Analysis, B. Am. Meteorol. Soc., 79, 61–78, https://doi.org/10.1175/1520-0477(1998)079<0061:APGTWA>2.0.CO;2, 1998.
Whitmore, L., Kaufman, M., Pnuyshkov, A., and Polyakov, I.: Nansen and Amundsen Basins Observational System II (NABOS II) – Seawater macronutrient observations in the eastern Eurasian and Makarov Basins, Arctic Ocean, 2021, https://doi.org/10.18739/A25T3G17R, 2023.
Yamamoto-Kawai, M., McLaughlin, F., and Carmack, E.: Ocean acidification in the three oceans surrounding northern North America, J. Geophys. Res.-Oceans, 118, 6274–6284, https://doi.org/10.1002/2013JC009157, 2013.
Zhang, H., Bai, X., and Wang, K.: Response of the Arctic sea ice–ocean system to meltwater perturbations based on a one-dimensional model study, Ocean Sci., 19, 1649–1668, https://doi.org/10.5194/os-19-1649-2023, 2023.
Zuo, H., Balmaseda, M. A., Tietsche, S., Mogensen, K., and Mayer, M.: The ECMWF operational ensemble reanalysis–analysis system for ocean and sea ice: a description of the system and assessment, Ocean Sci., 15, 779–808, https://doi.org/10.5194/os-15-779-2019, 2019.