the Creative Commons Attribution 4.0 License.
the Creative Commons Attribution 4.0 License.
 | 03 Jun 2026
Sea ice melt drives vertical pCO2 variability modulating air–sea gas exchange
Henry C. Henson
Dorte H. Søgaard
Bjarne Jensen
Kunuk Lennert
Tim Papakyriakou
Mikael K. Sejr
Jakob Sievers
Søren Rysgaard
Lise Lotte Sørensen
Strong spatial and temporal gradients in salinity, temperature, and carbonate chemistry in Arctic coastal surface waters complicate the estimation of air-sea carbon dioxide (CO2) exchange, particularly during sea ice breakup. The present study evaluates the applicability of the widely used bulk flux model under such conditions. This approach assumes homogeneous surface conditions and no vertical pCO2 gradients in the bulk seawater. However, our observations in a stratified Arctic fjord reveal pronounced vertical variability in pCO2 within the upper water column, including non-linear gradients near the air-sea interface. This results in, widely varying flux estimates depending upon the depth of the pCO2 measurement used to establish air-sea disequilibrium. Importantly, similarly structured nonlinear pCO2 profiles were observed across distinct fjord systems and years, suggesting that this vertical heterogeneity may be a characteristic feature of Arctic stratification during sea ice breakup. We recommend incorporating both micrometeorological techniques and high-resolution vertical profiling in Arctic fjords to improve flux estimates of CO2 in this rapidly changing region.
- Article
(2754 KB) - Full-text XML
-
Supplement
(1085 KB) - BibTeX
- EndNote


-
Spring melting of sea ice and snow introduces distinct heterogeneity in surface water conditions within coastal Arctic oceans.
-
Standard bulk parameterizations for air-sea CO2 flux calculations, based on subsurface pCO2 measurements, may misrepresent flux magnitude during melt periods.
-
Vertical near-surface CO2 and temperature gradients must be considered to improve flux estimates in stratified Arctic fjords.
High latitude coastal oceans are strong sinks for atmospheric carbon dioxide (CO2), absorbing more CO2 per unit area than lower latitude regions (Dai et al., 2022; Roobaert et al., 2019). This strong uptake results from both the high solubility of gases in cold water and the intense biological activity typical of these regions. However, climate change is rapidly transforming this carbon sink. The Arctic is warming more than twice as fast as the global average, and sea ice extent has been shrinking by over 13 % per decade (Perovich et al., 2020). The loss of sea ice increases CO2 uptake by exposing larger areas of open water for longer periods, which can further stimulate biological productivity (Arrigo and van Dijken, 2015; Bates and Mathis, 2009; Perovich et al., 2020). However, at the same time, melting sea ice freshens the surface layer and strengthens stratification, limiting vertical mixing with deeper water. Freshwater from melting sea ice and terrestrial run-off creates pronounced gradients in physical properties such as salinity and temperature, as well as chemical properties like dissolved inorganic carbon (DIC) and total alkalinity (TA) (e.g. Henson et al., 2025a). As a result, the partial pressure of CO2 (pCO2) can vary markedly with depth under melt conditions (Miller et al., 2019).
This vertical variability in pCO2 poses a challenge for air-sea CO2 flux estimation. The transfer of gases between the atmosphere and ocean depends on the difference in concentration between the two as well as the efficiency of the transfer process. Therefore, the bulk flux of CO2 across the air-sea interface is commonly described as the product of the gas transfer velocity, k (m s1), CO2 solubility s (), and the partial pressure gradient (µatm) across the air-sea interface (Wanninkhof et al., 2009):
While widely applied, this formulation simplifies a complex process influenced by surfactants on the water surface, bubble-mediated gas exchange, and turbulence (Wanninkhof et al., 2009). Furthermore, surface water heterogeneity, driven by sea ice melt and freshwater runoff from land, complicates the physical and chemical processes governing air-sea CO2 exchange. As a result, simplified parameterizations commonly used in global carbon flux estimates may be inadequate in these settings.
In most studies, pCO2 is measured several meters below the surface, assuming vertical homogeneity under well-mixed conditions (Jørgensen et al., 2020). However, in stratified waters, where temperature, salinity, and pH can vary with depth, this assumption may lead to substantial errors in flux estimates (Ahmed et al., 2020; Dong et al., 2021; Miller et al., 2019; Watts et al., 2022). In this study, we distinguish between the air-sea interface, the near-surface freshwater lens (approximately the upper 0–0.5 m), and subsurface bulk waters (>1 m depth), as these layers may exhibit substantially different physical and carbonate chemistry conditions during sea ice melt. Previous work in Young Sound demonstrated that snow and sea ice melt can substantially reduce under-ice pCO2 through dilution and enhanced stratification during the melt season (Verdugo et al., 2025). However, these observations were conducted at a fixed depth below the ice, leaving unresolved how pCO2 variability evolves vertically during sea ice breakup.
Although Arctic surface waters are often undersaturated with respect to atmospheric CO2 levels and act as CO2 sinks (e.g. Burgers et al., 2017; Dai et al., 2022; Henson et al., 2024; Laruelle et al., 2014; Roobaert et al., 2019), such assessments typically rely on sparse data collected from 0.5–5 m depth during limited periods. Dong et al. (2021) illustrate that high latitude fluxes of CO2 calculated using the bulk method (based on measurements sampled at 6 m depth) differ significantly from those measured using direct eddy covariance in sea ice melt regions.
Gas transfer velocity (k) is often parameterized as a function of wind speed. However, the true driver is mixing in the surface waters, which governs k. Fick's first law of diffusion, which underlies Eq. (1), assumes a linear concentration gradient within the diffusive sublayer (Fig. 1) and steady-state conditions (Garbe et al., 2014). Jørgensen et al. (2020) argued that, due to seawater's high buffer capacity, chemical gradients do not significantly affect CO2 equilibration, supporting the use of measurements at 3–4 m depth. However, this conclusion relies on the assumption of horizontal and vertical homogeneity and neglects the effects of shallow surface stratification, particularly when alkalinity dilution is involved.
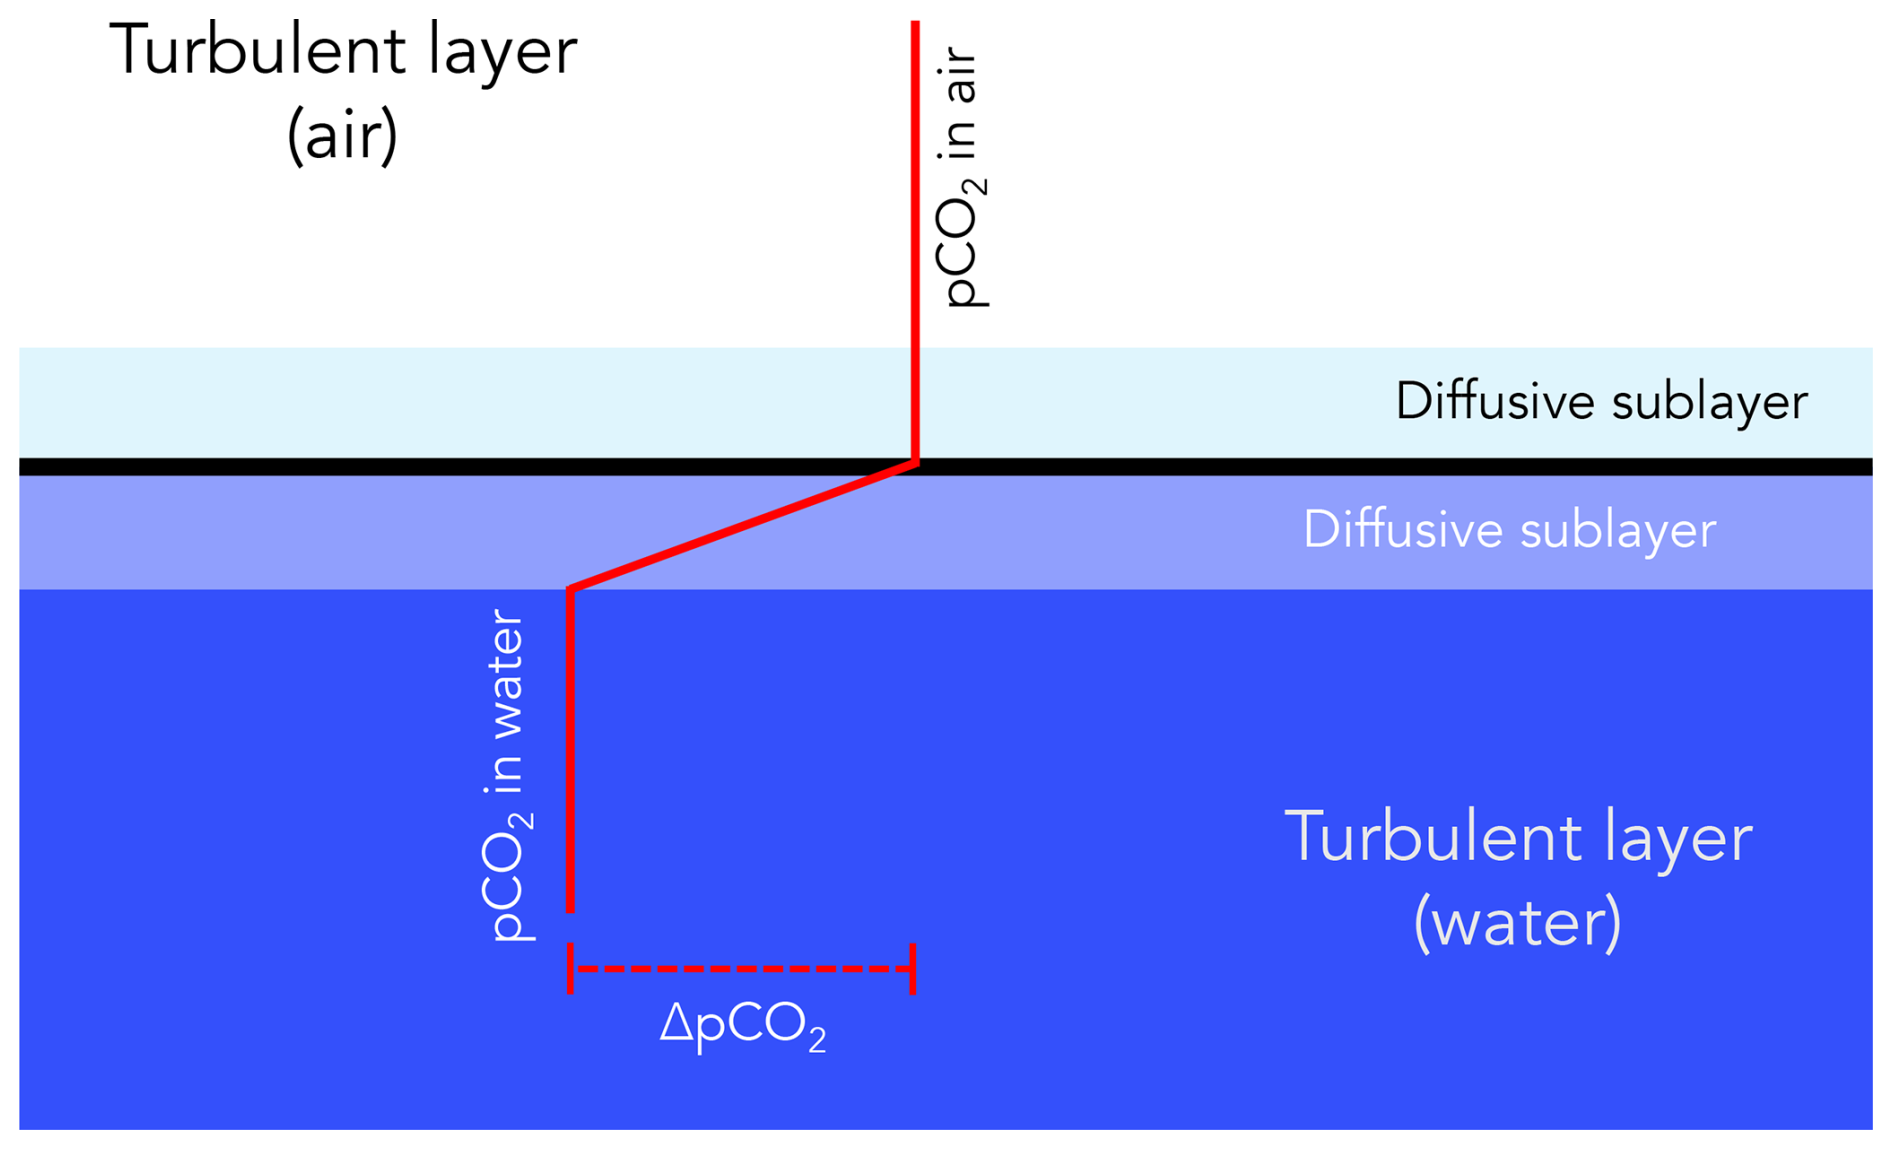
Figure 1Schematic illustrating the interface between the air and the water in conjunction with pCO2 concentration gradients. In Eq. (1), the concentration gradient is assumed to occur in the diffusive layer between the air and water, and the concentrations are assumed to be vertically constant in the turbulent layers (Adapted from Liss and Slater, 1974; Wanninkhof et al., 2009).
In Arctic spring, the upper ocean is often strongly stratified due to freshwater input from glacier melt, snowmelt, river runoff, and sea ice meltwater (Ahmed et al., 2020; Granskog et al., 2011; Meire et al., 2017; Miller et al., 2019). These inputs can extend vertical CO2 gradients beyond the diffusive sublayer, complicating flux estimates during ice breakup and early open-water periods. Several studies have demonstrated strong vertical heterogeneity in pCO2 in Arctic coastal waters, with implications for air-sea flux calculations (Ahmed et al., 2020; Dong et al., 2021; Miller et al., 2019).
Surface freshening from ice melt and runoff strongly influences carbonate chemistry in Arctic coastal waters, which can either suppress or enhance oceanic CO2 uptake. For example, Burgers et al. (2017) reported large horizontal variability in surface pCO2 (144–364 µatm) linked to riverine input in the Eastern Canadian Arctic. Similarly, Sejr et al. (2011) observed strong surface pCO2 gradients associated with salinity and temperature in Young Sound, and later documented a long-term decline in surface salinity (Sejr et al., 2017). Freshwater-induced stratification has also been shown to create vertical gradients in pCO2 and pH with important implications for flux calculations (Miller et al., 2019). Finally, Bates et al. (2014) demonstrated that sea ice meltwater and melt ponds exhibit extreme variability in pCO2 (<10 to >1500 µatm) and pH (6.1 to >10.8), highlighting the complex chemical landscape of ice-influenced waters. Together, these studies underscore the high spatial and temporal variability of carbonate chemistry in freshened waters across the Arctic.
To project future CO2 uptake or outgassing in the Arctic, we must better understand the physical and chemical drivers of near-surface carbonate variability. In this study, we investigate the vertical and temporal variations in pCO2 in a stratified Arctic fjord during sea ice breakup. By examining water-column pCO2 profiles across the transition from ice-covered to open water, we evaluate usage of the bulk flux model under Arctic seasonal transitions.
2.1 Study Site
This study was conducted in Young Sound, a high Arctic fjord system located near the Daneborg Research Station in Northeast Greenland (Fig. 2). The fjord system comprises the Tyrolerfjord (inner fjord) and Young Sound (outer fjord), extending approximately 90 km from Tyroler River to the Greenland Sea. A sill at about 45 m depth separates Young Sound from the open ocean. Young Sound is 2 to 7 km wide, with an average depth of 100 m (maximum 350 m), and a total surface area of ∼ 390 km2. Tidal amplitudes range from 0.8 to 1.5 m, with mean current velocities of approximately 2 cm s−1 (Rysgaard et al., 2003). Freshwater inputs are primarily derived from Greenland Ice Sheet runoff, local glaciers, precipitation, and snowmelt from adjacent ice-free terrain. The drainage basin of the Tyrolerfjord-Young Sound system spans 2846 km2, of which 33 % is glaciated.
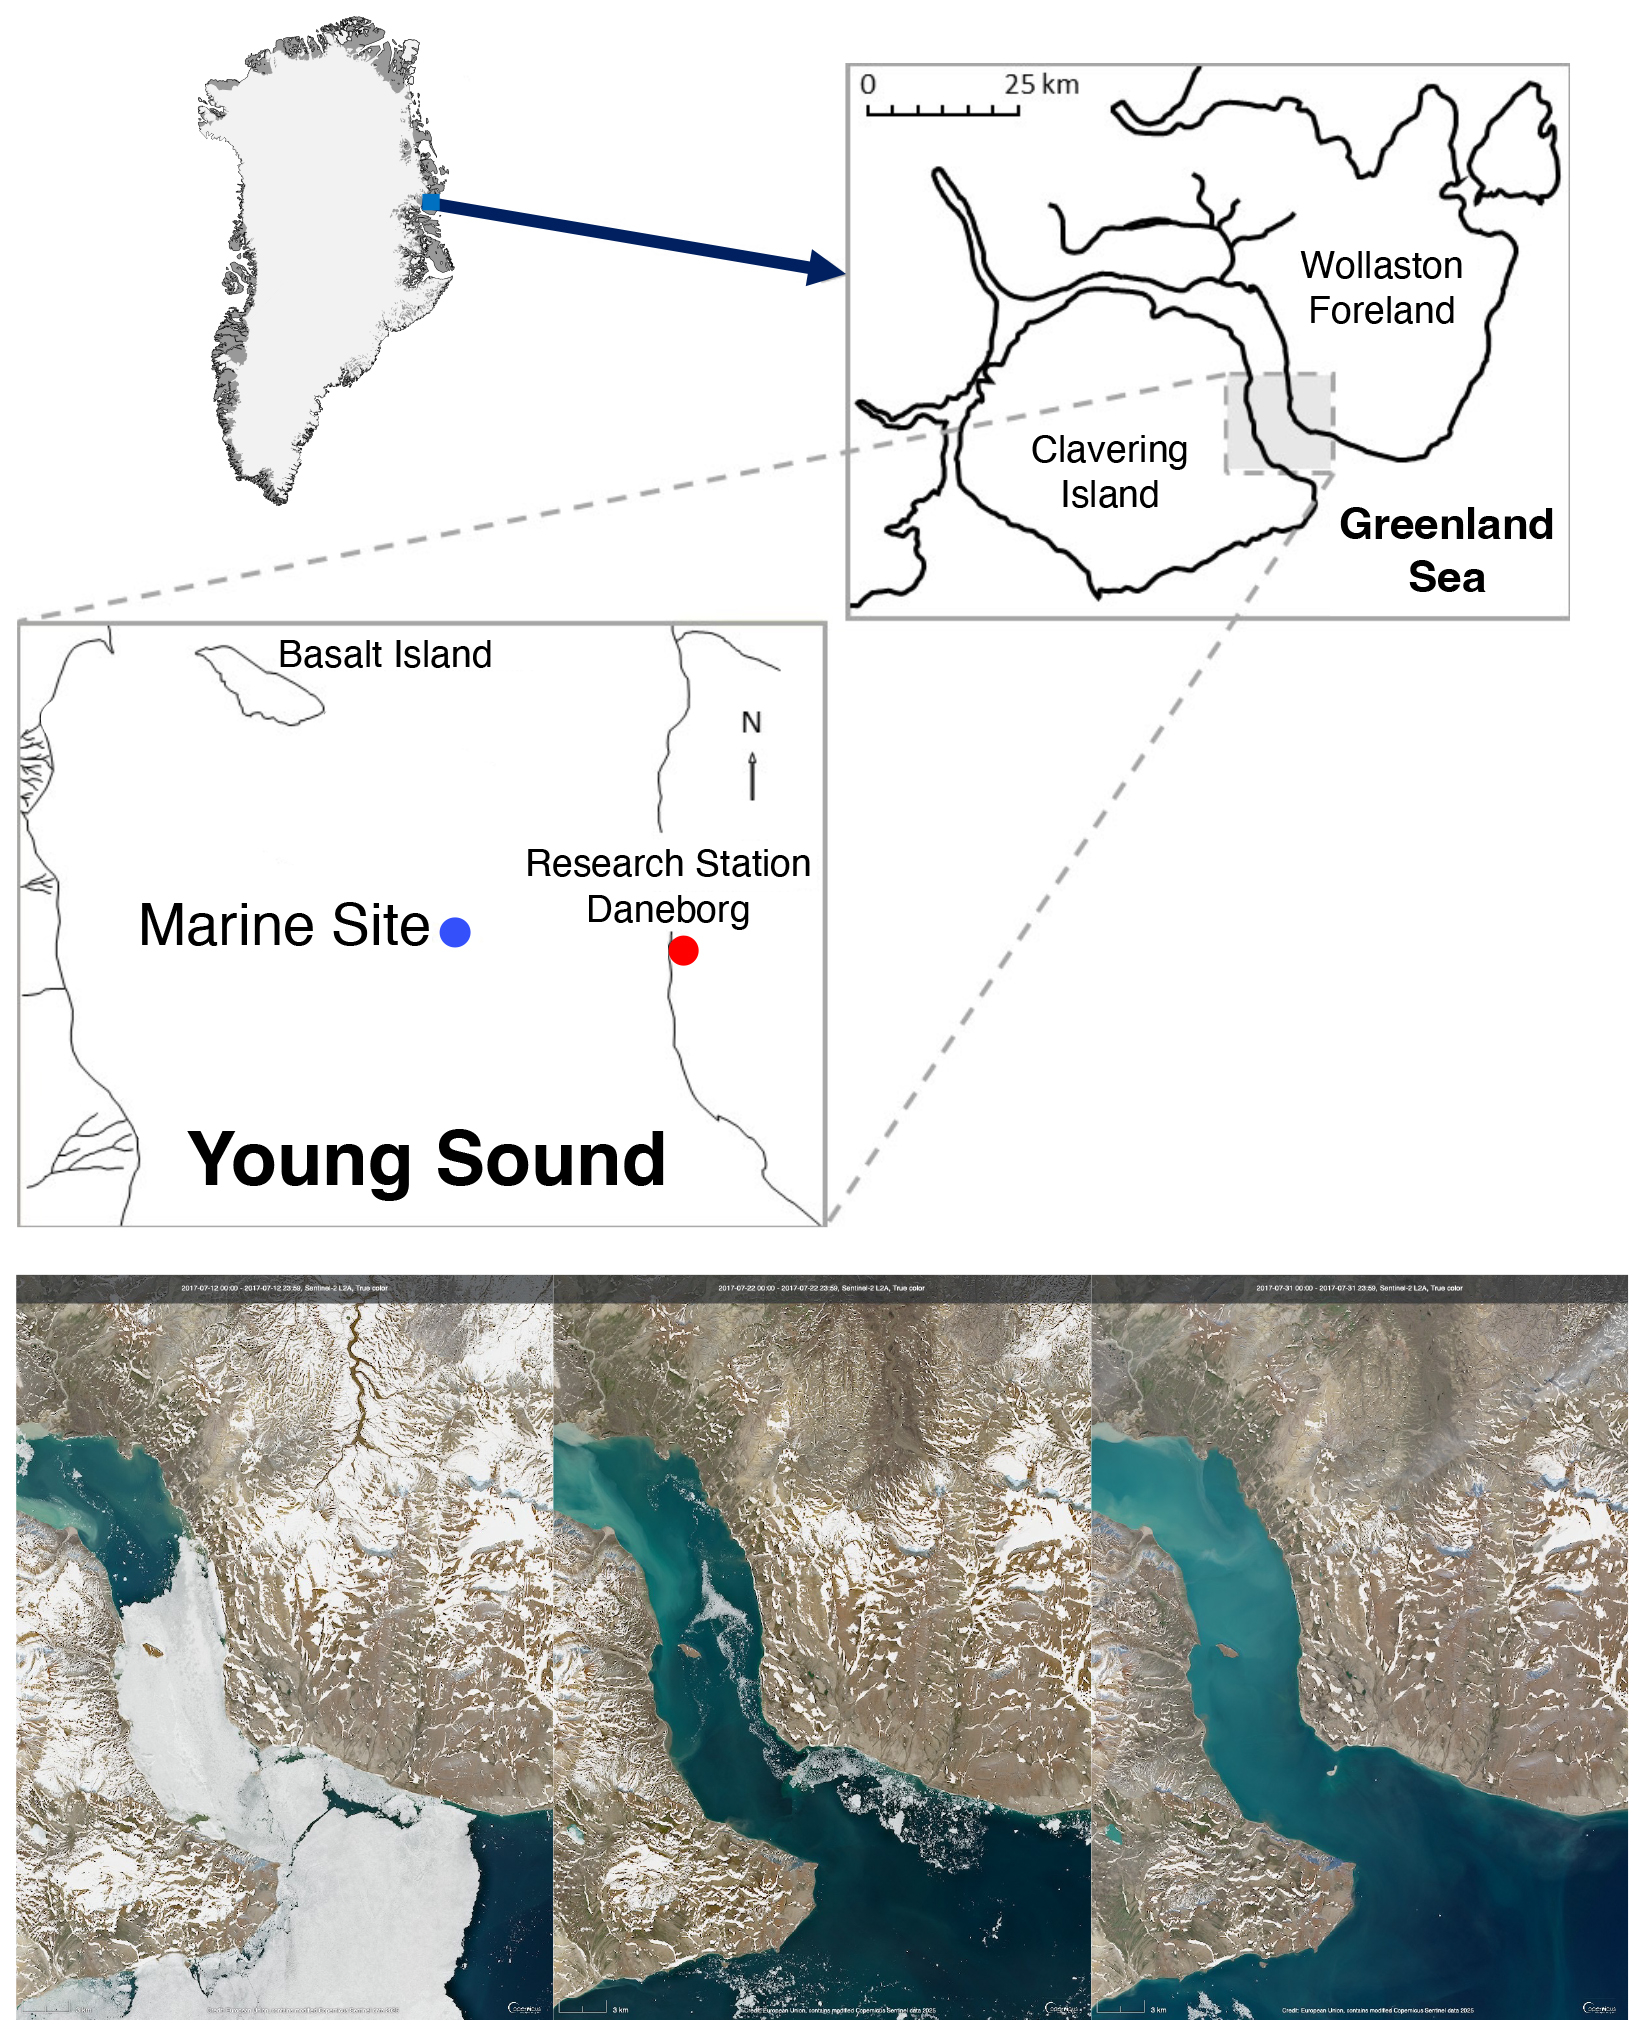
Figure 2Map of Greenland and the sampling area at the coast of Young Sound in Northeast Greenland. The red circle indicates the location of the micrometeorological measurement tower at research station Daneborg while the marine sampling site (Standard Station in the Greenland Ecosystem Monitoring program) is indicated as a blue circle (74.310, −20.300). Three Copernicus Sentinel true-color images of the fjord on 12, 22, and 31 July illustrate the transition between sea ice cover and open water.
Sampling was conducted from 12 to 31 July 2017. Sampling occurred during and immediately after a period of sea ice breakup. On 15 July, ice coverage was approximately 30 %, decreasing to less than 10 % by 16 July. Water sampling was conducted both from an inflatable boat and via sea ice leads, all in close proximity to the Greenland Ecosystem Monitoring (GEM) program's standard station (Fig. 2).
2.2 pCO2 Measurements Using the HydroC Sensor
Surface water pCO2 was measured with a CONTROS® HydroC CO2 sensor, which utilizes a membrane equilibrator coupled with a non-dispersive infrared detector (Henson et al., 2025b). The instrument is equipped with a built-in water pump that provides flow rate of 35 mL s−1 across the membrane. At each sampling depth, the sensor was allowed to equilibrate for 10 to 20 min, and values were recorded once stable for at least 2 min. The sensor operates over a range of 200–1000 µatm and temperatures of −2 to 35 °C. Annual calibration has been conducted using a certified 400 ± 2 % ppm CO2 gas that was traceable to WMO standards. The sensor showed remarkable stability (397–401 ppm), supporting a measurement uncertainty of ±2 µatm.
2.3 pCO2 Estimation from TA and DIC
In addition to direct measurements, pCO2 was calculated from total alkalinity (TA) and dissolved inorganic carbon (DIC) using the Seacarb package (Gattuso et al., 2021) in R. Due to the low salinity and cold temperatures characteristic of Arctic coastal waters, no universally accepted set of equilibrium constants (K1 and K2) exists. For consistency with previous studies in the region (Henson et al., 2023), we used the refitted constants from Lueker et al. (2000). The selection of equilibrium constants introduces assumptions regarding seawater composition. Raimondi et al. (2019) showed that different constants can lead to discrepancies between measured and calculated pCO2 values, ranging from −3.1 to −35.8 µatm, with Lueker et al. (2000) demonstrating the best internal consistency under polar conditions. Still, Sulpis et al. (2020) found that the calculation of pCO2 from DIC and TA can lead to uncertainty up to 15 % under cold conditions, which is far greater than when pCO2 is measured directly.
2.4 Sea Ice TA and DIC Sampling
TA and DIC in sea ice were assessed using three ice cores. Each core was sectioned into 5–10 cm segments and sealed in gas-tight NEN/PE bags with sampling valves (Hansen et al., 2000). Samples were transported in thermally insulated boxes to a nearby field laboratory. Cold (1 °C) deionized water of known mass and carbonate composition (10–30 mL) was added to each bag, which was then resealed after removing air and weighted.
The samples were melted in the dark over ∼ 48 h. Meltwater was transferred to 12 mL Exetainer vials (Labco, UK) pre-dosed with 20 µL of saturated HgCl2 solution (5 % ) to prevent microbial alteration. DIC was measured by on Apollo SciTech®'s AS-C3 analyzer while TA was determined via potentiometric titration on an Apollo SciTech AS-ALK2 total alkalinity titrator (Haraldsson et al., 1997).
2.5 Physical Parameters
Vertical profiles of conductivity, temperature, and depth (CTD) were obtained using a Seabird® SBE19plus CTD. On 16 July 2017, additional surface conductivity measurements were taken using a Thermo Orion-Star® instrument with an Orion 013610MD conductivity cell. Surface water temperatures were independently measured with a Testo® thermometer.
2.6 Historical Data
For contextual comparison, pCO2 time series data (Greenland Ecosystem Monitoring, 2020) from the Greenland Ecosystem Monitoring program are also included in the analysis. pCO2 data from 2007–2023 was measured using the same HydroC CO2 sensor in August each year.
2.7 Eddy Covariance
Sensible and latent heat fluxes were estimated using micrometeorological instrumentation mounted on a 3 m mast positioned approximately 0.5 m from the waterline. Three-dimensional wind vectors were recorded using a METEK® uSonic-Scientific sonic anemometer. To enhance reliability, we applied complementary analysis techniques for flux estimation: (1) the standard eddy covariance (EC) method using EddyPro software (Version 7.0.6, LI-COR Inc., 2019); (2) the ogive optimization method (OGM) (Sievers et al., 2015). Among these, the OGM was deemed most robust due to its ability identify and filter out low-frequency noise, sensor dampening, and large-scale turbulent motions that can bias flux measurements. These issues often introduce large relative bias associated with flux measurement over Arctic marine surfaces (Sievers et al., 2015). OGM's superior ability to isolate relevant turbulent scales and reduce contamination from mesoscale variability is based on the accumulation and modelling of each cospectra over each 20 min averaging period (Figs. S1 and S2 in the Supplement). Uncertainty in sensible and latent heat fluxes was estimated directly from the OGM procedure. The reported values correspond to the standard error associated with the fitted ogive tail and reflect random uncertainty in flux integration.
Vertical profiles of surface water pCO2 were measured using the CONTROS® HydroC CO2 sensor across three distinct periods in July 2017 (Fig. 3a–c). Each observational period corresponded to different sea ice conditions: before, during and after sea ice breakup (Fig. 2). These high-resolution profiles revealed substantial vertical variability within the upper 2 to 3 m of the water column. Under ice-covered conditions, pCO2 measurements were taken through an open melt pond. At this time, elevated CO2 concentrations were observed at the very surface (0.1 m), followed by a sharp decrease to approximately 1 m depth, coinciding with the ice-water interface. Below this depth, pCO2 increased again, though remained well below atmospheric concentrations (Fig. 3a).
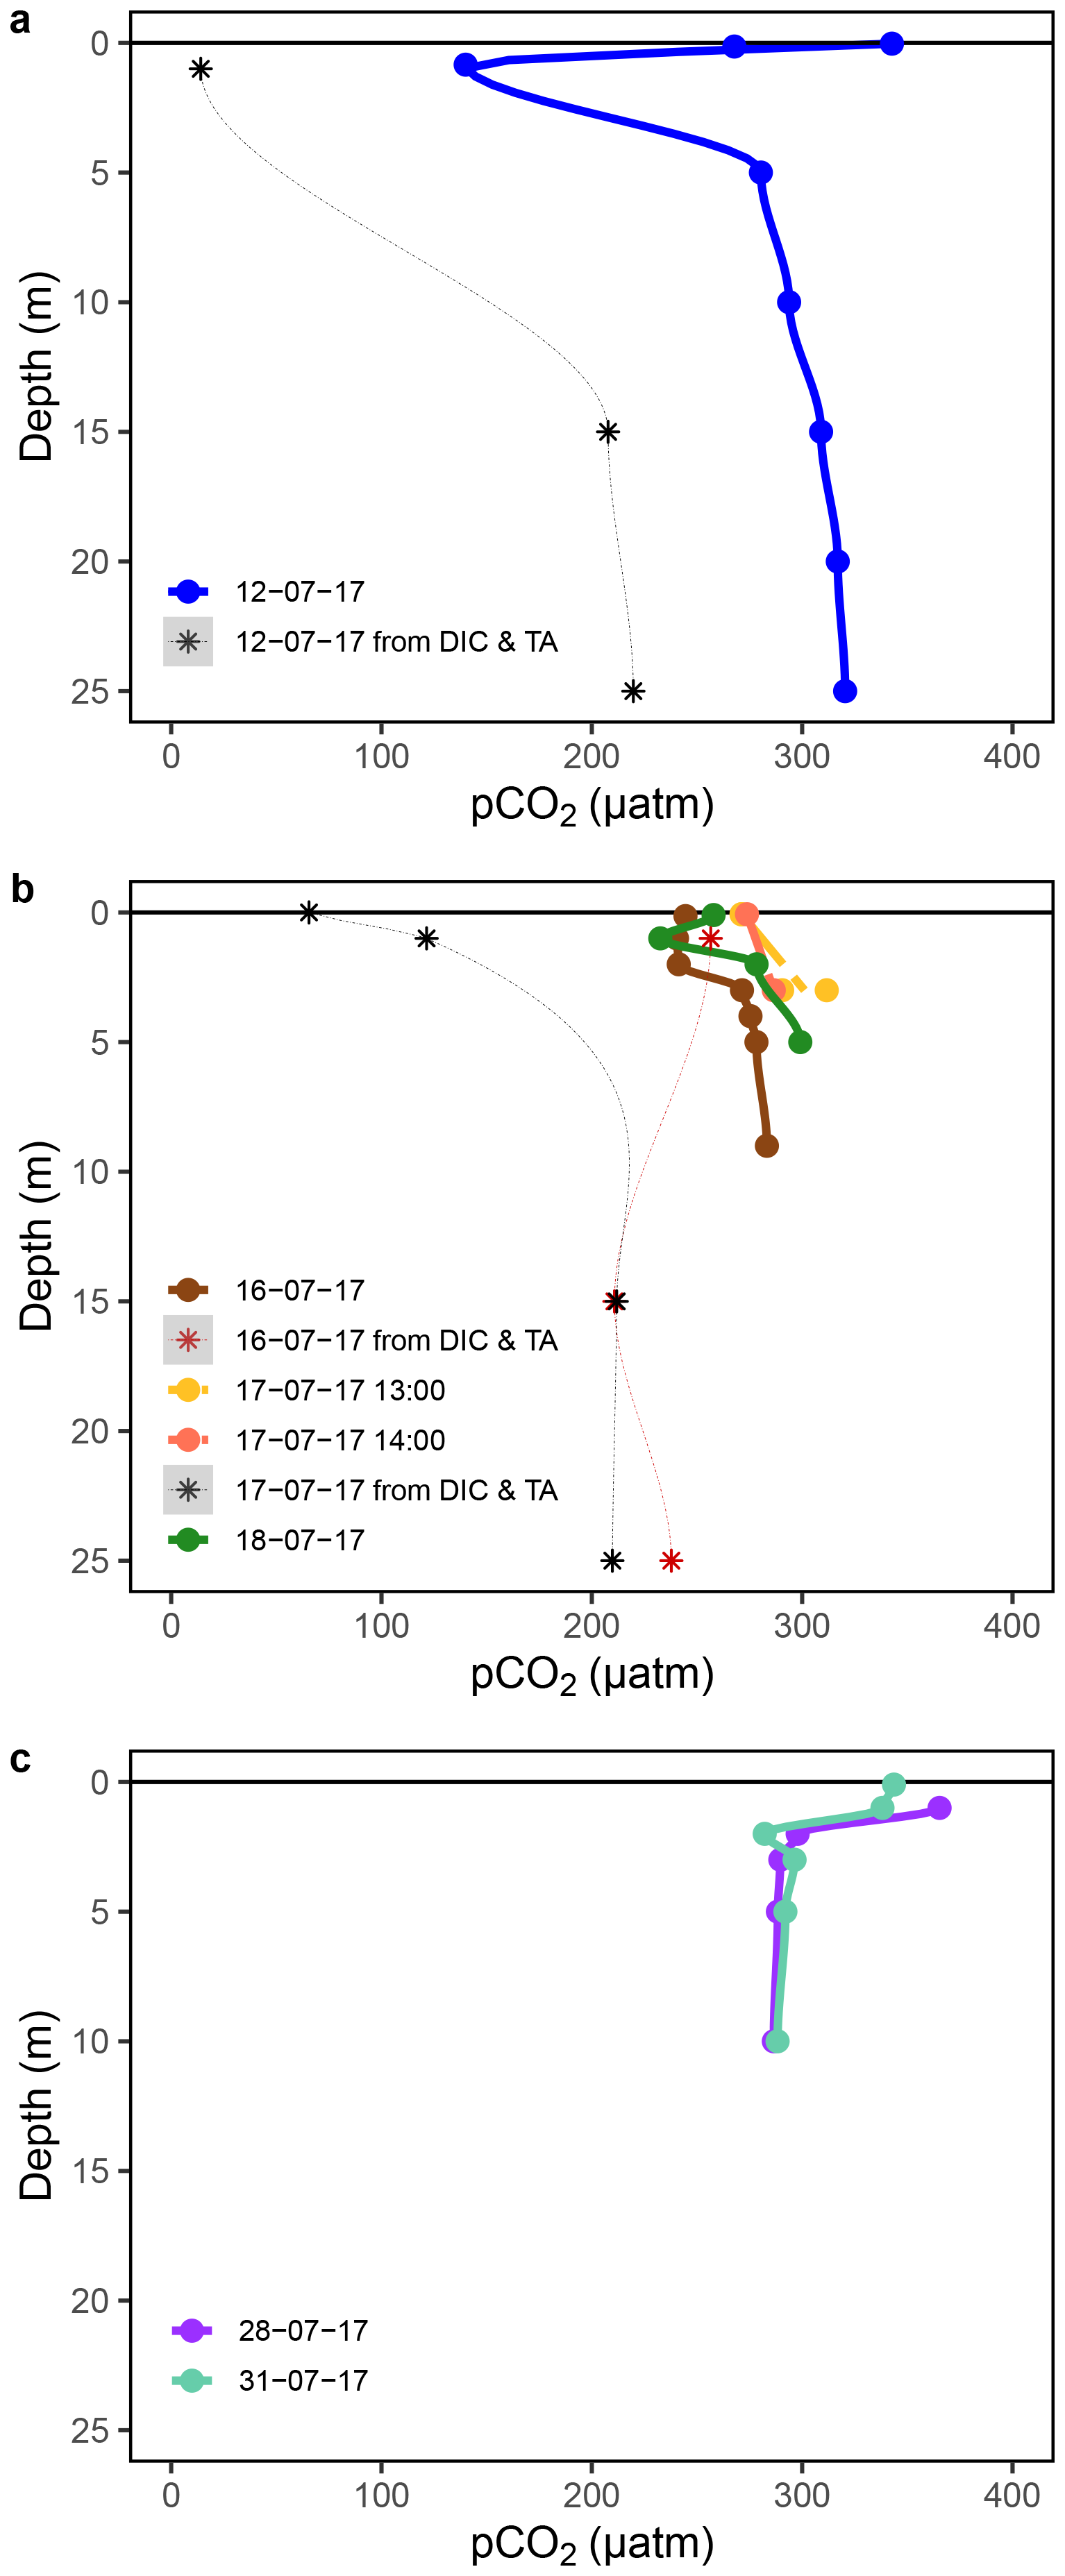
Figure 3Measured Young Sound pCO2 profiles (a) prior to sea ice breakup (measured through open melt pond), (b) during sea ice breakup and (c) after sea ice break up measured through CO2 equilibration and calculation from carbonate chemistry parameters (DIC & TA).
During the period of sea ice breakup, when ice coverage ranged from approximately 30 % to 10 %, the vertical distribution of pCO2 exhibited a similar structure. Concentrations were highest near the surface, declined to a local minimum at 1 to 2 m, and then stabilized below 3 m (Fig. 3b). Following the complete breakup of sea ice, pCO2 showed a more gradual decrease from the surface down to about 3 m, beneath which concentrations remained relatively constant (Fig. 3c). Across all three observational periods, a shallow surface layer approximately 5 m thick was identified, within which most of the pCO2 variability occurred. Below this depth, pCO2 remained relatively constant.
These vertical structures are consistent with strong physical stratification, likely driven by freshwater input from glacial melt and surface heating. Temperature and salinity profiles collected concurrently support the presence of sharp vertical gradients in the upper water column, with salinity ranging from 1.4 to 29.6 PSU and temperature from −0.4 to 6.2 °C. These physical profiles, shown in Fig. 4, confirm that vertical mixing was strongly suppressed during the observational period. The small tides present in Young Sound, combined with the continued input of freshwater from first sea ice and then glacial melt, lead to a fjord system with distinct surface stratification throughout the months of July and August.
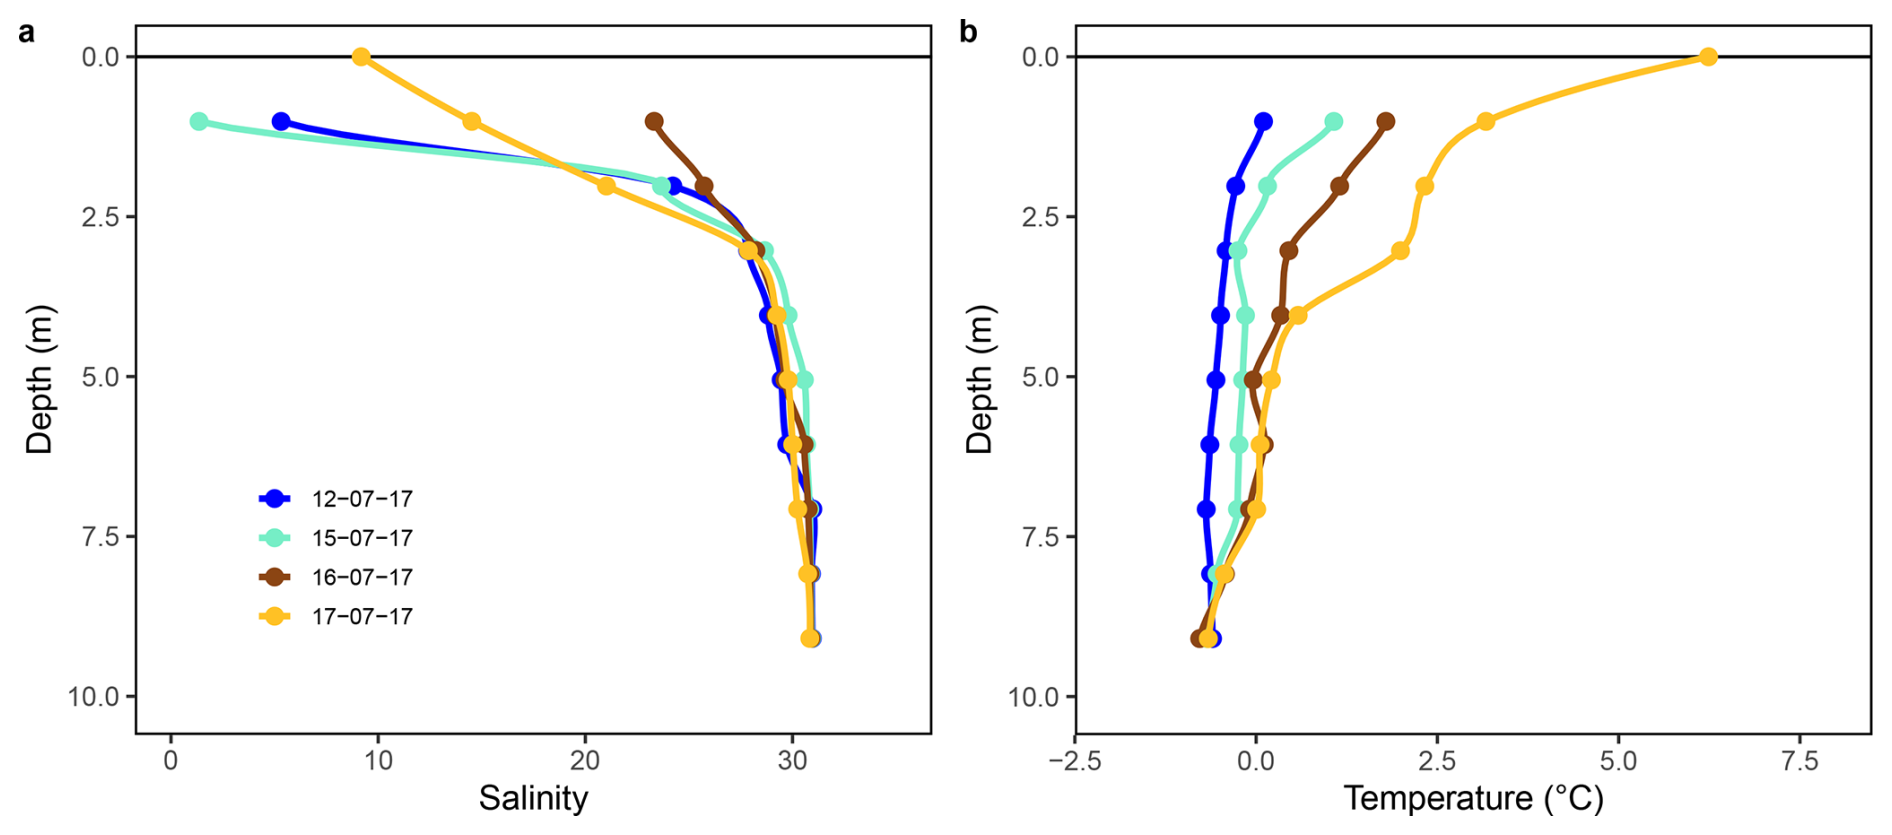
Figure 4Measured Young Sound profiles of under-ice water and open water salinity and temperature.
Measurements from a different fjord (Henson et al., 2025b) in East Greenland on 4 June 2025, revealed strikingly similar vertical pCO2 heterogeneity (Fig. 5). Elevated pCO2 at 0.1 m decreased to a minimum around 1–1.5 m before increasing again and stabilizing near 3 m depth. Extreme stratification in the upper few meters caused pCO2 levels in each profile to vary by more than 100 µatm between the surface and 1 m. This repeated observation of similarly structured nonlinear pCO2 profiles, measured 8 years later and in a different fjord system, suggests that this heterogeneity is not an isolated phenomenon. Instead, these C-shaped vertical pCO2 distributions may represent a characteristic response of strongly stratified Arctic surface waters during sea ice breakup. Indeed, Arctic surface stratification during sea ice breakup induces chemical changes that may influence the way we estimate air-sea exchange of CO2.
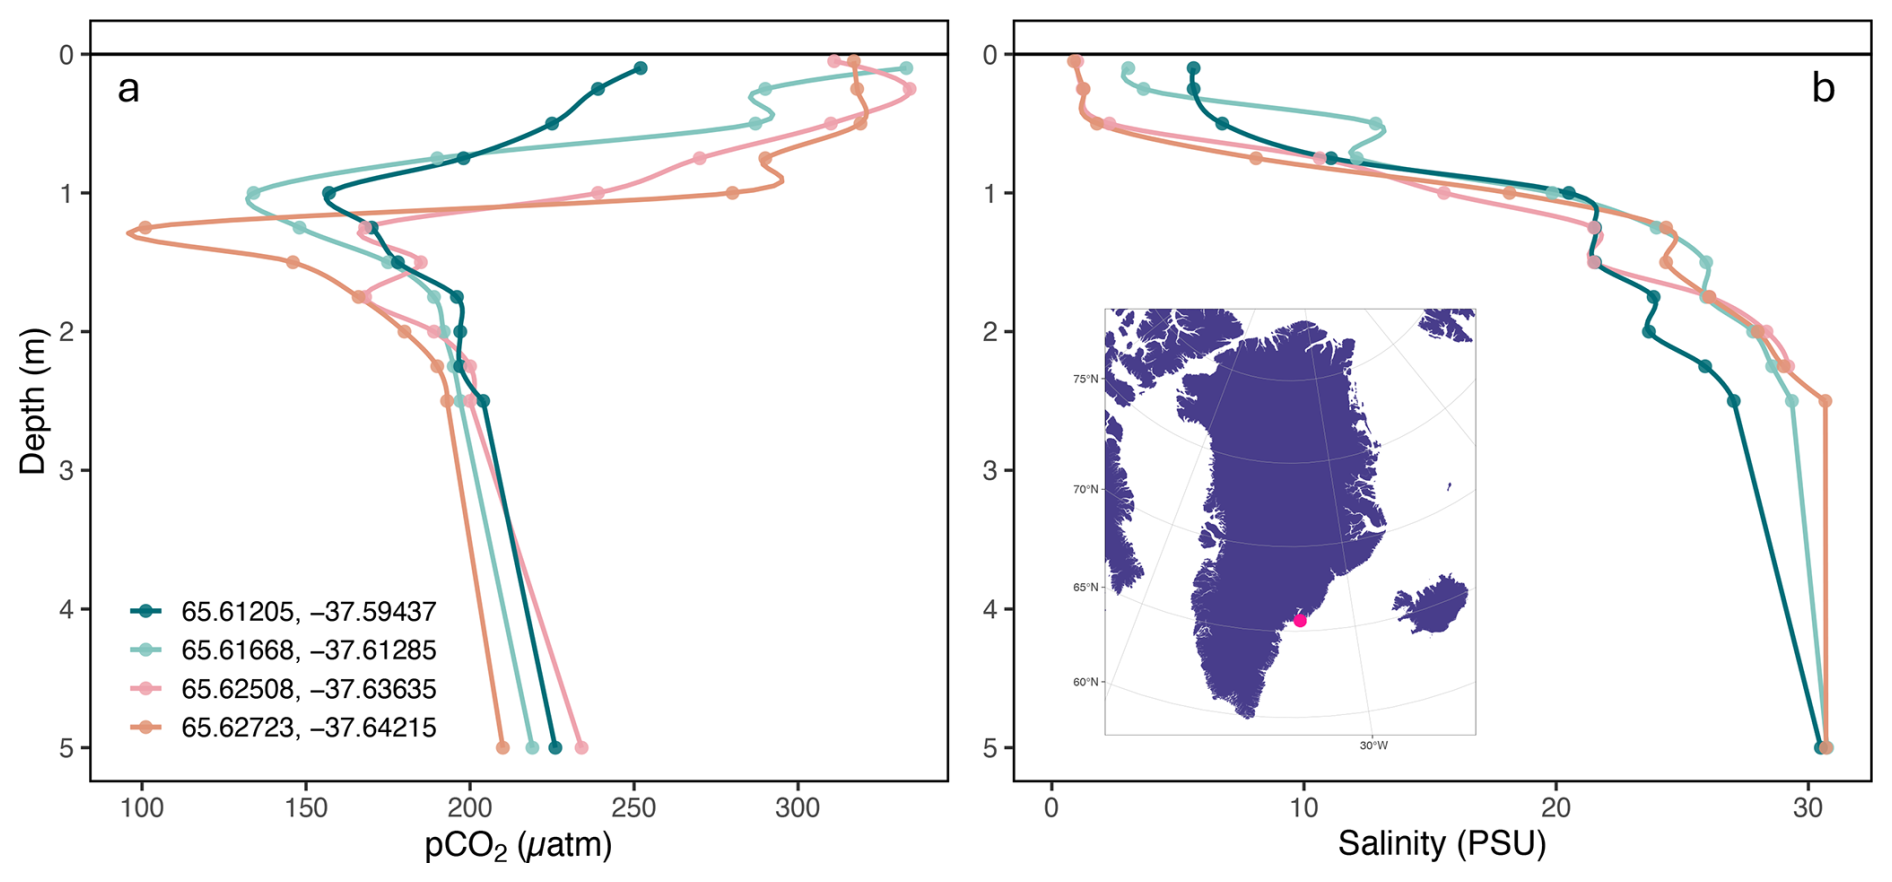
Figure 5Measured pCO2 (a) and salinity (b) profiles at 4 locations in Tasiilaq Bay. Profiles were measured on 4 June 2025 during the period of sea ice breakup following the method in Sejr et al. (2011).
Air-sea CO2 fluxes in Arctic coastal areas are generally estimated using bulk parameterization models (Henson et al., 2024; Meire et al., 2015; Roobaert et al., 2019; Sejr et al., 2011). These models rely on several key assumptions, including unstratified surface conditions, a linear pCO2 gradient within the diffusive boundary layer, and a vertically uniform pCO2 profile within the mixed layer. Our observations challenge the applicability of these assumptions in Arctic coastal waters in several important ways. We observe distinct vertical heterogeneity in both physical and chemical parameters, which leads to distinct differences in flux estimates based on the depth of the measurements used.
4.1 Stratified conditions in the marine CO2 system
Vertical pCO2 profiles collected during July 2017 revealed pronounced non-linear behavior in the upper 3 to 5 m of the water column (Fig. 3). This directly contradicts the assumption that the ΔpCO2 accurately represents the difference between the atmosphere and the “well-mixed bulk fluid” below the diffusive layer (Wanninkhof et al., 2009). Under ice-covered conditions, the lowest pCO2 values (∼ 150 ppm) were consistently observed just beneath the sea ice, with concentrations increasing with depth and stabilizing around 5 m (Fig. 3a). During the ice breakup stage, a similar pattern emerged, although the minimum pCO2 was higher (∼ 250 ppm).
More recent measurements from Tasiilaq Bay in June 2025 demonstrate very similar vertical pCO2 profiles. Indeed, 4 high-resolution profiles with measurements every 0.25 m reveal the same C-shaped pCO2 variation. Like in Young Sound, the most elevated pCO2 levels were observed near the surface, and pCO2 minima occurred near 1–2 m depth before increasing and becoming stable. This repeated observation in a different fjord system, but during the period of sea ice breakup indicates this vertical variability may be representative during stratified Arctic conditions.
Several interacting processes influence surface water chemistry during ice breakup. Low surface water pCO2 values reflect the influence of low-salinity meltwater from snow and sea ice or glacial meltwater found in freshened Arctic waters (Geilfus et al., 2015; Henson et al., 2025a). However, surface water chemistry during the ice breakup period is further complicated by processes such as ikaite (CaCO3⋅6H2O) dissolution (Miller et al., 2011; Rysgaard et al., 2013; Søgaard et al., 2013) and high under-ice primary production (Søgaard et al., 2021; Verdugo et al., 2025). Additionally, snowmelt, characterized by low pH and ionic strength (de Caritat et al., 2005), may further alter carbonate system dynamics in the upper water column.
Two mechanisms may explain the nonlinear C-shaped trend in pCO2 observed in the top few meters. First, as demonstrated by Henson et al. (2025a) mixing between glacial meltwater and seawater can result in nonlinear behavior in pCO2, even when DIC and TA mix conservatively. In such cases, initial freshwater dilution leads to dramatically reduced pCO2, but at very low salinities, the diminished buffering capacity can cause acidification to occur and pCO2 to increase again. In fact, Henson et al. (2025a) present a U-shaped pCO2 curve along a salinity gradient that appears extraordinarily similar to the C-shaped pCO2 curve we observe with depth. Indeed, the salinity gradient created in their mixing experiments can be observed vertically in the highly stratified surface waters during sea ice breakup (Figs. 3a and 5a). Although, Henson et al. (2025a) focused on the influence of glacial meltwater, our results suggest similar processes could occur in systems influenced by sea ice and snowmelt.
Both glacial meltwater and sea ice have low DIC concentrations and act to dilute the inorganic carbon of the surface ocean (Fig. S4). However, changes in alkalinity can also impact the buffering capacity of the water mixture, leading to nonlinear effects. If the meltwater has a lower TA : DIC ratio than seawater, due to the absence of ikaite, acidification and a shift in carbonate equilibria at very low salinities could lead to higher pCO2 values at the surface. During July 2017, Young Sound showed both diluted DIC and TA levels in upper few meters, suggesting pH change during sea ice break up could occur more easily (Fig. S4). Indeed, calculated pH profiles indicated variable surface conditions between periods of sea ice cover and sea ice breakup (Fig. S5). In this very fresh surface layer, diminished pH may elevate pCO2 relative to waters around 1 m depth, where freshwater-seawater mixing ratios are more moderate and seawater buffering leads to very low CO2 concentrations.
A second, but less likely, explanation involves atmospheric equilibration of sea ice melt ponds before draining into open leads. The relatively elevated pCO2 observed at ∼ 0.1 m depth could reflect such partial equilibration. While chamber-based studies (e.g. Geilfus et al., 2012, 2015; Nomura et al., 2010; Semiletov et al., 2004) have demonstrated both uptake and efflux of CO2 in melt ponds, equilibrium times between melt-pond water and atmosphere depend upon pond depth, wind speed, and carbonate chemistry. For example, a 0.1 m deep pond under low wind conditions (∼ 2 m s−1) may reach atmospheric equilibrium in 1–4 d. However, in our case, pCO2 values calculated from TA and DIC in melt ponds did not indicate equilibrium with the atmosphere, making this explanation less likely than the freshwater mixing mechanism. Furthermore, Verdugo et al. (2025) demonstrate that melt pond drainage in Young Sound was responsible for reducing pCO2 levels. Though this is conclusion relies on measurements from 2.5 m depth. Nevertheless, atmospheric equilibration may play a role after the sea ice barrier is removed. Elevated pCO2 levels at the surface (0.1 m) post sea ice breakup may result from the combination of the chemical changes described above, heating from solar radiation, and from atmospheric CO2 uptake (partial equilibration) in the limited volume of this freshwater lens.
As melt progresses and sea ice recedes, riverine input and vertical mixing become more influential. Yet even after ice breakup, surface waters often remain fresh due to glacial meltwater runoff, and the resulting low salinities help maintain stratification. In August 2017, vertical structure remained pronounced even after sea ice breakup, with elevated pCO2 at 0.1 m which stabilized below ∼ 3 m. In other words, near-surface conditions remained decoupled from deeper waters. This persistent shallow layer, characterized by low salinity, higher temperature, and elevated pCO2, suppresses gas exchange with the colder, more undersaturated water below, consistent with observations by Dong et al. (2021). In such environments, bulk flux models that assume homogeneity and linear gradients are likely to yield biased or inaccurate estimates.
To place these 2017 measurements in historical context, we examined long-term surface water pCO2 data collected at 0.5–1 m depth by the Greenland Ecosystem Monitoring (GEM) program between 2007 and 2023. These data, measured using consistent protocols, are presented in Fig. 6 alongside our open-water profiles. Over the 17-year record, August pCO2 concentrations at ∼ 1 m depth had ranged from 220 to 408 µatm and had consistently remained below atmospheric levels. This apparent stability has contributed to the perception of sustained CO2 uptake throughout the summer season. However, the high-resolution vertical profiles obtained during the 2017 field campaign add nuance to this assumption. Elevated pCO2 levels confined to the uppermost meter of the water column may go undetected in standard monitoring approaches that rely on fixed-depth sampling. These results suggest that the dynamic changes during sea ice melt can induce episodes of slowed uptake, air-sea equilibrium, or CO2 outgassing. Consequently, existing sampling protocols may underestimate surface variability and bias flux estimates, especially in stratified conditions where near-surface chemistry is decoupled from subsurface layers.
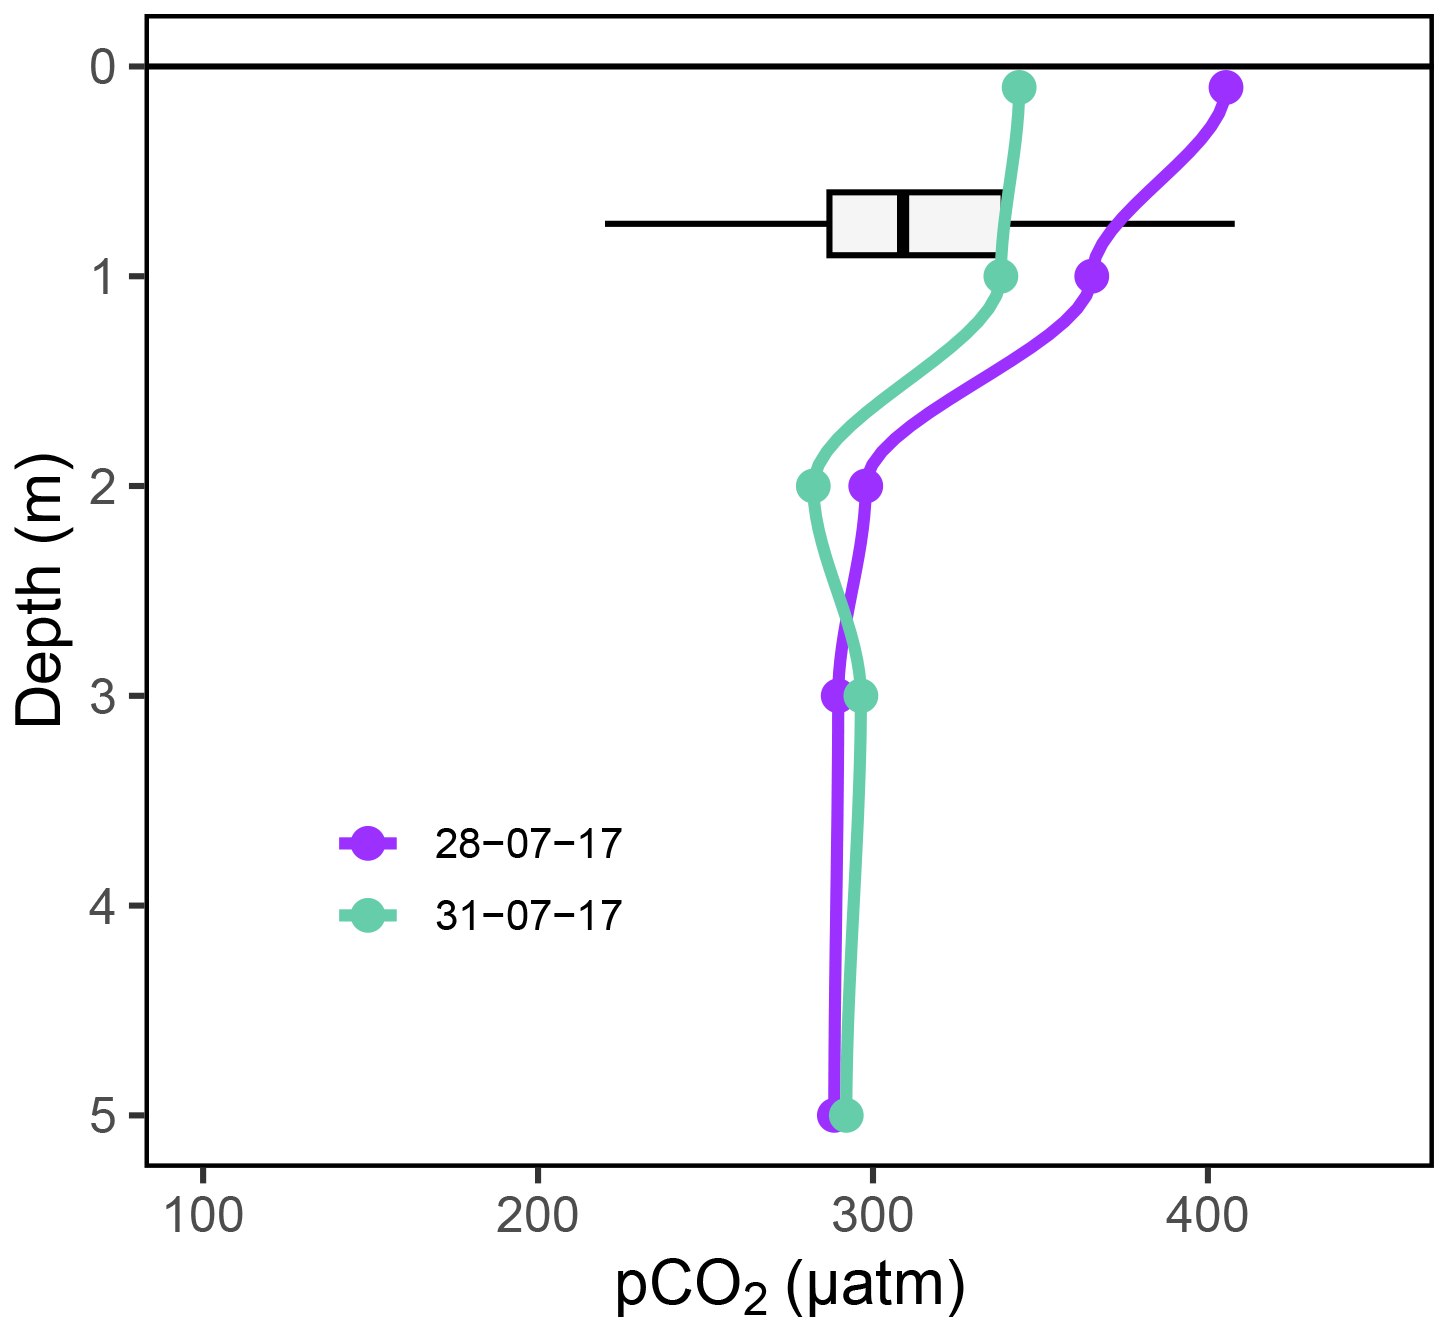
Figure 6Measured Young Sound pCO2 profile after ice break up in 2017 compared with historical variation in pCO2 at 1 m depth in the same location.
4.2 Influence of surface stratification on fluxes
To assess how bulk models function when estimating CO2 fluxes in an Arctic fjord influenced by sea ice and snow melt, we calculated fluxes using seawater pCO2 measurements from multiple depths and two gas transfer velocity parameterizations. Specifically, we computed fluxes throughout July using pCO2 measured at 0.1, 1, 2, and 4 m. To estimate the surface (interface) pCO2 at 0 m, we adjusted the 1 m pCO2 measurements to a derived skin temperature (Table 1), estimated from sensible heat fluxes (Fig. S6) following the parameterization of Smedman et al. (2007). Accounting for this skin layer correction is critical, as Woolf et al. (2016) demonstrated that neglecting the thermal skin and relying only on bulk sea surface temperature can introduce significant errors in flux estimates.
Table 1CO2 fluxes calculated based on pCO2 measured at the different depth. The fluxes are calculated using the bulk model of Ho et al. (2006) and Nightingale et al. (2000). We have used locally measured wind speeds for the calculations to match flux measurements captured by eddy covariance.
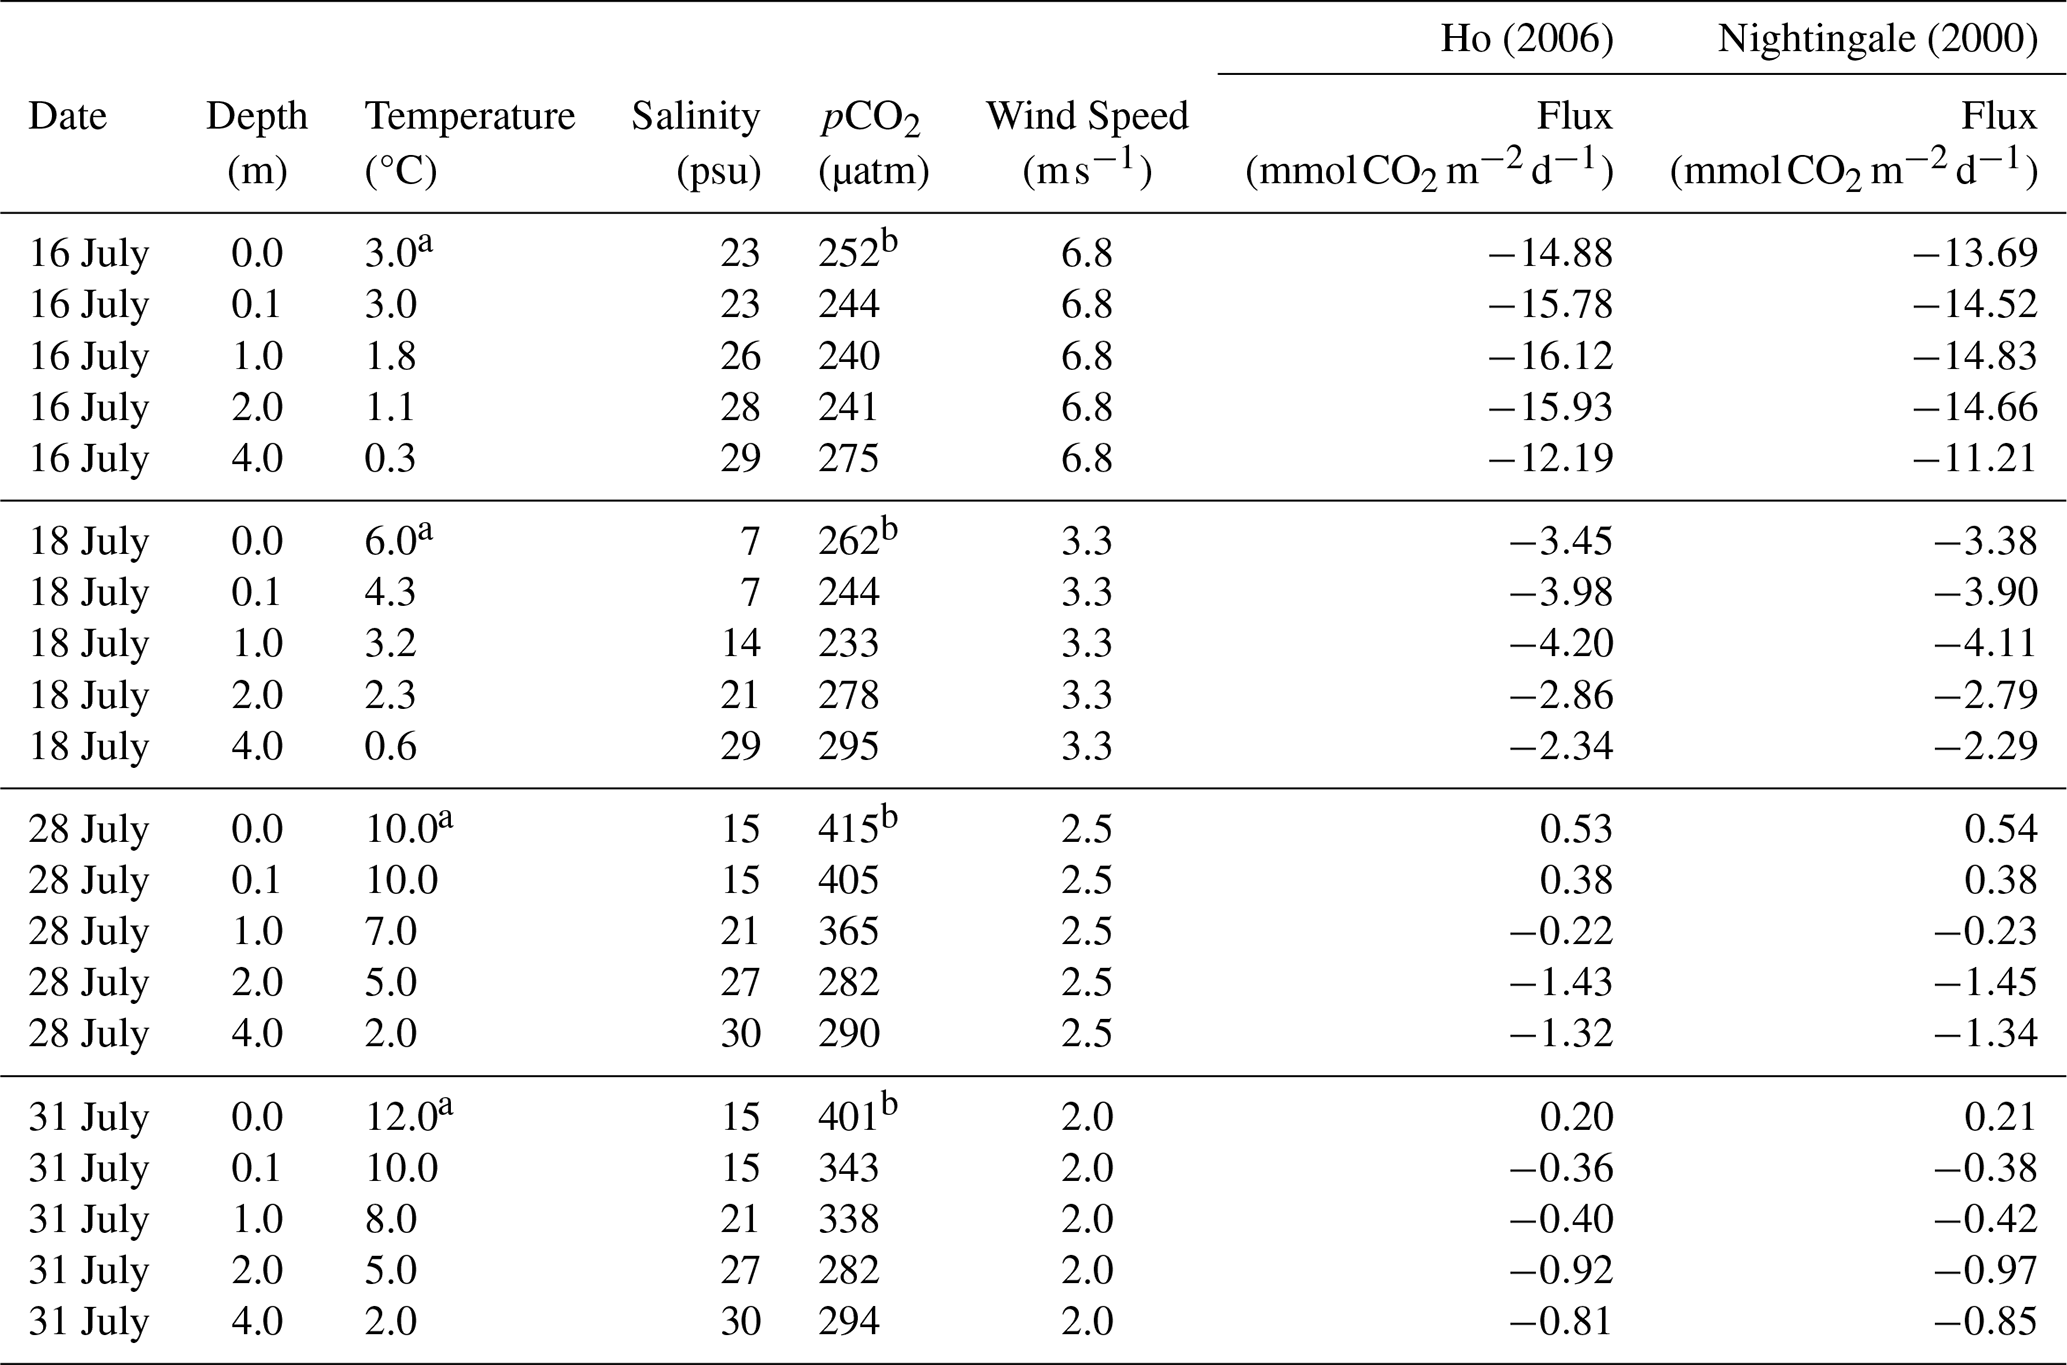
a Denotes skin temperatures derived from heat fluxes. b Denotes pCO2 values estimated from measurements at 1 m depth and adjusted to derived skin temperatures.
The resulting calculations (Table 1) show that estimated CO2 fluxes vary significantly depending on the depth of the pCO2 measurement. Notably, fluxes derived from 0.1 m differ markedly from those based on deeper values. Since many studies rely on pCO2 measured at a fixed depth (often at 1 m or at a ship's seawater intake below 5 m), these results underscore the potential for misrepresentation of flux magnitude and direction due to vertical heterogeneity in surface water chemistry.
Measurements from both Young Sound and Tasiilaq demonstrate that during sea ice breakup, pCO2 levels are most elevated at the surface. This may be linked to acidification of the most freshened 0.5 m and a shift in the marine carbonate system, or partial equilibration due to air-sea gas transfer. If this acidified freshwater lens warms, for instance, due to solar radiation, pCO2 may rise leading to oversaturation relative to atmospheric concentrations. Indeed, when pCO2 measurements on 31 July were corrected for skin temperature, to estimate pCO2 at the boundary layer, they suggested a transition from undersaturation to oversaturation (Table 1). While we did not directly observe this oversaturation in the vertical profiles, this likely reflects the inability to sample at the sea surface. Nevertheless, the occurrence of stratification-related vertical pCO2 heterogeneity, with levels most elevated at the surface, will slow air-sea gas transfer compared to when conditions are well mixed. Meanwhile, warming or acidification of the thin surface layer may periodically induce a reversal of flux direction, as seen in some micrometeorological studies in Arctic coastal environments during sea ice breakup (e.g. Butterworth et al., 2025).
Overall, these findings echo those of Miller et al. (2019), who reported pronounced spatial heterogeneity in Arctic coastal pCO2 and large differences in estimated fluxes depending on the sampling depth. The broader implications of this heterogeneity for seasonal or regional flux estimates remain unclear. However, if fluxes are upscaled from sparse, single-point measurements (e.g., once per month, as in Laruelle et al., 2014), substantial errors may result due to unrecognized spatial and temporal variability. Thus, our results emphasize the need for continuous, high-resolution observations of air-sea CO2 fluxes, particularly in Arctic coastal systems affected by stratification and meltwater input. These observations will be essential for refining flux parameterizations, reducing uncertainty in carbon budget estimates, and improving the representation of Arctic shelf systems in global carbon models.
During the summer thaw, carbon chemistry and pCO2 dynamics in Arctic coastal surface waters are significantly altered by the combined effects of snow and sea ice melt, terrestrial runoff, and biological activity. These influences lead to substantial variability in surface temperature, pH, dissolved inorganic carbon (DIC), and total alkalinity (TA), ultimately disrupting carbonate system equilibrium in the upper water column. As a result, estimating air-sea CO2 fluxes using traditional bulk models becomes highly uncertain during this period.
The sea ice breakup period, typically lasting 2–4 weeks, represents a particularly dynamic and complex phase in the annual cycle. Despite its brevity, this phase may have a disproportionate influence on total summer CO2 uptake, given that open-water conditions in high Arctic fjords are limited to only 80–120 d yr−1 (Sejr et al., 2011).
Air-sea gas exchange rates depend not only on the pCO2 gradient between the atmosphere and surface water, but also on rapid, nonlinear changes in surface water chemistry driven by the composition and volume of meltwater and runoff. Accurate flux estimation will therefore require knowledge of the depth at which surface water pCO2 becomes vertically homogeneous, combined with gas exchange parameterizations tailored to highly stratified and ice-affected conditions. Profiling pCO2 in the upper water column is therefore essential to identify this depth and to constrain surface flux estimates reliably.
Several eddy covariance studies in other arctic environments report variable uptake and efflux of CO2 during the sea ice breakup period (e.g. Butterworth et al., 2025). Building on these findings, our data provides the first step in understanding potential drivers behind this variability. Though, proper quantification of the mechanisms driving nonlinear pCO2 profiles and the resulting uncertainty of flux estimates will require observations spanning the air-sea boundary. The current lack of these datasets underscores the need for studies that integrate continuous, direct CO2 flux measurements with detailed observations of surface water carbonate chemistry, atmospheric forcing, skin temperature, and turbulence at the air-ice-water interface.
Such integrated measurements are critical to improving our understanding of the drivers and net effect of sea ice melt-driven changes on CO2 fluxes in Arctic coastal systems. Ultimately, this knowledge is essential to accurately quantify the seasonal and regional uptake of atmospheric CO2 in the rapidly changing Arctic.
Vertical profiles from both Greenlandic fjords can be found in the Zenodo data repository at https://doi.org/10.5281/zenodo.17471918 (Henson et al., 2025b). Long-term data from the Greenland ecosystem monitoring program in Young sound can be accessed at https://doi.org/10.17897/A8J4-AF12 (Greenland Ecosystem Monitoring, 2020).
The supplement related to this article is available online at https://doi.org/10.5194/os-22-1781-2026-supplement.
Conceptualization: LLS. Formal analysis, writing – original draft preparation: HCH. Funding acquisition: LLS, SR, MKS, TP. Investigation: DHS, BJ, KL, TP, MKS, JS, SR, LLS. Writing – review and editing: DHS, TP, MKS, SR, LLS. All the authors have read and agreed to the published version of the paper.
The contact author has declared that none of the authors has any competing interests.
Publisher's note: Copernicus Publications remains neutral with regard to jurisdictional claims made in the text, published maps, institutional affiliations, or any other geographical representation in this paper. The authors bear the ultimate responsibility for providing appropriate place names. Views expressed in the text are those of the authors and do not necessarily reflect the views of the publisher.
This study represents a contribution to the Horizon Europe GreenFeedback project. Financial and logistic support was provided by the Arctic Research Centre, Aarhus University, and the Greenland Climate Research Centre, Greenland Institute of Natural Resources. Specifically, the authors wish to thank Egon Frandsen, who assisted with the logistics and the additional measurements in Young Sound. Additionally, the authors would like to recognize the students in the EnCHil Nordic master program, who participated in taking the Tasiilaq measurements. This work is also a contribution to the Arctic Science Partnership (ASP) and the MarineBasis component of the Greenland Ecosystem Monitoring Program.
This research has been supported by the HORIZON EUROPE European Research Council (grant nos. 101056921 and 101136875), Villum Foundation grant no. 50110, the Aarhus Universitets Forskningsfond (grant no. AUFF-F-2021-7-7), the Aage V. Jensens Fonde (grant no. AVJF21-3012), the Danmarks Grundforskningsfond (grant no. DNRF 185), and the Energi-, Forsynings- og Klimaministeriet (grant no. ObsArktis).
This paper was edited by Damian Leonardo Arévalo-Martínez and reviewed by Yuanxu Dong and one anonymous referee.
Ahmed, M. M. M., Else, B. G. T., Capelle, D., Miller, L. A., and Papakyriakou, T.: Underestimation of surface pCO2 and air-sea CO2 fluxes due to freshwater stratification in an Arctic shelf sea, Hudson Bay, Elementa: Science of the Anthropocene, 8, 084, https://doi.org/10.1525/elementa.084, 2020.
Arrigo, K. R. and van Dijken, G. L.: Continued increases in Arctic Ocean primary production, Prog. Oceanogr., 136, 60–70, https://doi.org/10.1016/j.pocean.2015.05.002, 2015.
Bates, N. R. and Mathis, J. T.: The Arctic Ocean marine carbon cycle: evaluation of air-sea CO2 exchanges, ocean acidification impacts and potential feedbacks, Biogeosciences, 6, 2433–2459, https://doi.org/10.5194/bg-6-2433-2009, 2009.
Burgers, T. M., Miller, L. A., Thomas, H., Else, B. G. T., Gosselin, M., and Papakyriakou, T.: Surface Water CO2 Variations and Sea-Air CO2 Fluxes During Summer in the Eastern Canadian Arctic, J. Geophys. Res.-Oceans, 122, 9663–9678, https://doi.org/10.1002/2017jc013250, 2017.
Butterworth, B. J., Else, B. G. T., Brown, K. A., Mundy, C. J., Williams, W. J., Rotermund, L. M., and de Boer, G.: Annual carbon dioxide flux over seasonal sea ice in the Canadian Arctic, The Cryosphere, 19, 5317–5335, https://doi.org/10.5194/tc-19-5317-2025, 2025.
Dai, M., Su, J., Zhao, Y., Hofmann, E. E., Cao, Z., Cai, W.-J., Gan, J., Lacroix, F., Laruelle, G. G., Meng, F., Müller, J. D., Regnier, P. A. G., Wang, G., and Wang, Z.: Carbon Fluxes in the Coastal Ocean: Synthesis, Boundary Processes, and Future Trends, Annu. Rev. Earth Pl. Sc., 50, 593–626, https://doi.org/10.1146/annurev-earth-032320-090746, 2022.
de Caritat, P., Hall, G., Gìslason, S., Belsey, W., Braun, M., Goloubeva, N. I., Olsen, H. K., Scheie, J. O., and Vaive, J. E.: Chemical composition of arctic snow: concentration levels and regional distribution of major elements, Sci. Total Environ., 336, 183–199, https://doi.org/10.1016/j.scitotenv.2004.05.031, 2005.
Dong, Y., Yang, M., Bakker, D. C. E., Liss, P. S., Kitidis, V., Brown, I., Chierici, M., Fransson, A., and Bell, T. G.: Near-Surface Stratification Due to Ice Melt Biases Arctic Air-Sea CO2 Flux Estimates, Geophys. Res. Lett., 48, https://doi.org/10.1029/2021GL095266, 2021.
Garbe, C. S., Rutgersson, A., Boutin, J., de Leeuw, G., Delille, B., Fairall, C. W., Gruber, N., Hare, J., Ho, D. T., Johnson, M. T., Nightingale, P. D., Pettersson, H., Piskozub, J., Sahlée, E., Tsai, W., Ward, B., Woolf, D. K., and Zappa, C. J.: Transfer Across the Air-Sea Interface, in: Ocean-Atmosphere Interactions of Gases and Particles, edited by: Liss, P. S. and Johnson, M. T., Springer, Berlin, Heidelberg, 55–112, https://doi.org/10.1007/978-3-642-25643-1_2, 2014.
Gattuso, J.-P., Orr, J., Epitalon, J.-M., Baldry, K., Hoshijima, U., and Abulos: jpgattuso/seacarb-git: Numerous updates since first release, Version v3.2.16, Zenodo [code], https://doi.org/10.5281/zenodo.4600014, 2021.
Geilfus, N.-X., Carnat, G., Papakyriakou, T., Tison, J.-L., Else, B., Thomas, H., Shadwick, E., and Delille, B.: Dynamics of pCO2 and related air-ice CO2 fluxes in the Arctic coastal zone (Amundsen Gulf, Beaufort Sea), J. Geophys. Res., 117, https://doi.org/10.1029/2011JC007118, 2012.
Geilfus, N.-X., Galley, R. J., Crabeck, O., Papakyriakou, T., Landy, J., Tison, J.-L., and Rysgaard, S.: Inorganic carbon dynamics of melt-pond-covered first-year sea ice in the Canadian Arctic, Biogeosciences, 12, 2047–2061, https://doi.org/10.5194/bg-12-2047-2015, 2015.
Granskog, M. A., Kuzyk, Z. Z. A., Azetsu-Scott, K., and Macdonald, R. W.: Distributions of runoff, sea-ice melt and brine using δ18O and salinity data – A new view on freshwater cycling in Hudson Bay, J. Marine Syst., 88, 362–374, https://doi.org/10.1016/j.jmarsys.2011.03.011, 2011.
Greenland Ecosystem Monitoring: MarineBasis Zackenberg - Water column - Water pCO2, Version 1.0, Greenland Ecosystem Monitoring [data set], https://doi.org/10.17897/A8J4-AF12, 2020.
Hansen, J. W., Thamdrup, B., and Jørgensen, B. B.: Anoxic incubation of sediment in gas-tight plastic bags: a method for biogeochemical process studies, Mar. Ecol. Prog. Ser., 208, 273–282, 2000.
Haraldsson, C., Anderson, L. G., Hassellöv, M., Hulth, S., and Olsson, K.: Rapid, high-precision potentiometric titration of alkalinity in ocean and sediment pore waters, Deep-Sea Res. Pt. I, 44, 2031–2044, https://doi.org/10.1016/S0967-0637(97)00088-5, 1997.
Henson, H. C., Holding, J. M., Meire, L., Rysgaard, S., Stedmon, C. A., Stuart-Lee, A., Bendtsen, J., and Sejr, M.: Coastal freshening drives acidification state in Greenland fjords, Sci. Total Environ., 855, 158962, https://doi.org/10.1016/j.scitotenv.2022.158962, 2023.
Henson, H. C., Sejr, M., Meire, L., Sørensen, L. L., Winding, M. H. S., and Holding, J. M.: Resolving Heterogeneity in CO2 Uptake Potential in the Greenland Coastal Ocean, J. Geophys. Res.-Biogeo., 129, e2024JG008246, https://doi.org/10.1029/2024JG008246, 2024.
Henson, H. C., Puts, I. C., Sejr, M. K., Sørensen, L. L., and Holding, J. M.: Glacial meltwater increases coastal carbon dioxide uptake and sensitivity to biogeochemical change, Commun. Earth Environ., 6, 687, https://doi.org/10.1038/s43247-025-02685-4, 2025a.
Henson, H. C., Schrøder, D. S., Jensen, B., Lennert, K., Papakyriakou, T., Sejr, M. K., Sievers, J., and Sørensen, L. L.: High-resolution vertical pCO2 profiles from two Greenlandic fjords during sea-ice breakup, Version v1, Zenodo [data set], https://doi.org/10.5281/zenodo.17471918, 2025b.
Jørgensen, H. E., Sørensen, L. L., and Larsen, S. E.: A Simple Model of Chemistry Effects on the Air-Sea CO2 Exchange Coefficient, J. Geophys. Res.-Oceans, 125, e2018JC014808, https://doi.org/10.1029/2018JC014808, 2020.
Laruelle, G. G., Lauerwald, R., Pfeil, B., and Regnier, P.: Regionalized global budget of the CO2 exchange at the air-water interface in continental shelf seas, Global Biogeochem. Cy., 28, 1199–1214, https://doi.org/10.1002/2014GB004832, 2014.
Liss, P. S. and Slater, P. G.: Flux of Gases across the Air-Sea Interface, Nature, 247, 181–184, https://doi.org/10.1038/247181a0, 1974.
Lueker, T. J., Dickson, A. G., and Keeling, C. D.: Ocean pCO2 calculated from dissolved inorganic carbon, alkalinity, and equations for K1 and K2: validation based on laboratory measurements of CO2 in gas and seawater at equilibrium, Mar. Chem., 70, 105–119, https://doi.org/10.1016/s0304-4203(00)00022-0, 2000.
Meire, L., Søgaard, D. H., Mortensen, J., Meysman, F. J. R., Soetaert, K., Arendt, K. E., Juul-Pedersen, T., Blicher, M. E., and Rysgaard, S.: Glacial meltwater and primary production are drivers of strong CO2 uptake in fjord and coastal waters adjacent to the Greenland Ice Sheet, Biogeosciences, 12, 2347–2363, https://doi.org/10.5194/bg-12-2347-2015, 2015.
Meire, L., Mortensen, J., Meire, P., Juul-Pedersen, T., Sejr, M. K., Rysgaard, S., Nygaard, R., Huybrechts, P., and Meysman, F. J. R.: Marine-terminating glaciers sustain high productivity in Greenland fjords, Glob. Change Biol., 23, 5344–5357, https://doi.org/10.1111/gcb.13801, 2017.
Miller, L. A., Papakyriakou, T. N., Collins, R. E., Deming, J. W., Ehn, J. K., Macdonald, R. W., Mucci, A., Owens, O., Raudsepp, M., and Sutherland, N.: Carbon dynamics in sea ice: A winter flux time series, J. Geophys. Res., 116, C02028, https://doi.org/10.1029/2009JC006058, 2011.
Miller, L. A., Burgers, T. M., Burt, W. J., Granskog, M. A., and Papakyriakou, T. N.: Air-Sea CO2 Flux Estimates in Stratified Arctic Coastal Waters: How Wrong Can We Be?, Geophys. Res. Lett., 46, 235–243, https://doi.org/10.1029/2018gl080099, 2019.
Nomura, D., Yoshikawa-Inoue, H., Toyota, T., and Shirasawa, K.: Effects of snow, snowmelting and refreezing processes on air–sea-ice CO2 flux, J. Glaciol., 56, 262–270, https://doi.org/10.3189/002214310791968548, 2010.
Perovich, D., Meier, W., Tschudi, M., Hendricks, S., Petty, A. A., Divine, D., Farrell, S., Gerland, S., Haas, C., Kaleschke, L., Pavlova, O., Ricker, R., Tian-Kunze, X., Webster, M., and Wood, K.: Arctic Report Card 2020: Sea Ice, NOAA, https://doi.org/10.25923/n170-9h57, 2020.
Raimondi, L., Matthews, J. B. R., Atamanchuk, D., Azetsu-Scott, K., and Wallace, D. W. R.: The internal consistency of the marine carbon dioxide system for high latitude shipboard and in situ monitoring, Mar. Chem., 213, 49–70, https://doi.org/10.1016/j.marchem.2019.03.001, 2019.
Roobaert, A., Laruelle, G. G., Landschützer, P., Gruber, N., Chou, L., and Regnier, P.: The Spatiotemporal Dynamics of the Sources and Sinks of CO2 in the Global Coastal Ocean, Global Biogeochem. Cy., 33, 1693–1714, https://doi.org/10.1029/2019GB006239, 2019.
Rysgaard, S., Vang, T., Stjernholm, M., Rasmussen, B., Windelin, A., and Kiilsholm, S.: Physical Conditions, Carbon Transport, and Climate Change Impacts in a Northeast Greenland Fjord, Arct. Antarct. Alp. Res., 35, 301–312, https://doi.org/10.1657/1523-0430(2003)035[0301:PCCTAC]2.0.CO;2, 2003.
Rysgaard, S., Søgaard, D. H., Cooper, M., Pućko, M., Lennert, K., Papakyriakou, T. N., Wang, F., Geilfus, N. X., Glud, R. N., Ehn, J., McGinnis, D. F., Attard, K., Sievers, J., Deming, J. W., and Barber, D.: Ikaite crystal distribution in winter sea ice and implications for CO2 system dynamics, The Cryosphere, 7, 707–718, https://doi.org/10.5194/tc-7-707-2013, 2013.
Sejr, Krause-Jensen, D., Rysgaard, S., Sørensen, L. L., Christensen, P. B., and Glud, R. N.: Air–sea flux of CO2 in arctic coastal waters influenced by glacial melt water and sea ice, Tellus B, 63, 815–822, https://doi.org/10.1111/j.1600-0889.2011.00540.x, 2011.
Sejr, M. K., Stedmon, C. A., Bendtsen, J., Abermann, J., Juul-Pedersen, T., Mortensen, J., and Rysgaard, S.: Evidence of local and regional freshening of Northeast Greenland coastal waters, Sci. Rep.-UK, 7, 13183, https://doi.org/10.1038/s41598-017-10610-9, 2017.
Semiletov, I., Makshtas, A., Akasofu, S., and L Andreas, E.: Atmospheric CO2 balance: The role of Arctic sea ice, Geophys. Res. Lett., 31, 2003GL017996, https://doi.org/10.1029/2003GL017996, 2004.
Sievers, J., Papakyriakou, T., Larsen, S. E., Jammet, M. M., Rysgaard, S., Sejr, M. K., and Sørensen, L. L.: Estimating surface fluxes using eddy covariance and numerical ogive optimization, Atmos. Chem. Phys., 15, 2081–2103, https://doi.org/10.5194/acp-15-2081-2015, 2015.
Smedman, A., Högström, U., Sahlée, E., and Cecilia, J.: Critical re-evaluation of the bulk transfer coefficient for sensible heat over the ocean during unstable and neutral conditions, Q. J. Roy. Meteor. Soc., 133, 227–250, https://doi.org/10.1002/qj.6, 2007.
Søgaard, D. H., Thomas, D. N., Rysgaard, S., Glud, R. N., Norman, L., Kaartokallio, H., Juul-Pedersen, T., and Geilfus, N.-X.: The relative contributions of biological and abiotic processes to carbon dynamics in subarctic sea ice, Polar Biol., 36, 1761–1777, https://doi.org/10.1007/s00300-013-1396-3, 2013.
Søgaard, D. H., Sorrell, B. K., Sejr, M. K., Andersen, P., Rysgaard, S., Hansen, P. J., Skyttä, A., Lemcke, S., and Lund-Hansen, L. C.: An under-ice bloom of mixotrophic haptophytes in low nutrient and freshwater-influenced Arctic waters, Sci. Rep.-UK, 11, 2915, https://doi.org/10.1038/s41598-021-82413-y, 2021.
Sulpis, O., Lauvset, S. K., and Hagens, M.: Current estimates of and appear inconsistent with measured CO2 system parameters in cold oceanic regions, Ocean Sci., 16, 847–862, https://doi.org/10.5194/os-16-847-2020, 2020.
Verdugo, J., Ruiz-Castillo, E., Rysgaard, S., Boone, W., Papakyriakou, T., Geilfus, N.-X., and Sørensen, L. L.: Snow and Sea Ice Melt Enhance Under-Ice pCO2 Undersaturation in Arctic Waters, Journal of Marine Science and Engineering, 13, 2257, https://doi.org/10.3390/jmse13122257, 2025.
Wanninkhof, R., Asher, W., Ho, D., Sweeney, C., and McGillis, W.: Advances in Quantifying Air-Sea Gas Exchange and Environmental Forcing, Annu. Rev. Mar. Sci., 1, 213–44, https://doi.org/10.1146/annurev.marine.010908.163742, 2009.
Watts, J., Bell, T. G., Anderson, K., Butterworth, B. J., Miller, S., Else, B., and Shutler, J.: Impact of sea ice on air-sea CO2 exchange – A critical review of polar eddy covariance studies, Prog. Oceanogr., 201, 102741, https://doi.org/10.1016/j.pocean.2022.102741, 2022.
Woolf, D. K., Land, P. E., Shutler, J. D., Goddijn-Murphy, L. M., and Donlon, C. J.: On the calculation of air-sea fluxes of CO2 in the presence of temperature and salinity gradients, J. Geophys. Res.-Oceans, 121, 1229–1248, https://doi.org/10.1002/2015JC011427, 2016.
Sea ice melt adds less-saline water to the surface ocean. This creates vertical gradients in salinity, temperature, and partial pressures of carbon dioxide (pCO2). The concentration difference of pCO2 across the air-ocean boundary is used to estimate gas transfer. Thus, the depth that we measure will impact our estimates. Similar patterns were observed in multiple Arctic fjords years apart, suggesting these vertical gradients may be common during the spring melt season.
Sea ice melt adds less-saline water to the surface ocean. This creates vertical gradients in...