the Creative Commons Attribution 4.0 License.
the Creative Commons Attribution 4.0 License.
 | 20 Apr 2026
Nordic overturning increases as AMOC weakens in response to global warming
Sasha Roewer
Lukas Fiedler
Marius Årthun
Willem Huiskamp
Stefan Rahmstorf
The Atlantic Meridional Overturning Circulation (AMOC) is weakening in response to global warming, while the Nordic Seas Overturning Circulation (NOC) is projected to strengthen. So far, the causal link between these two opposing trends has been little explored. Using an idealized box model of the Atlantic Ocean and the Nordic Seas and a high resolution climate model, we propose that a density reduction in the subpolar North Atlantic might weaken the AMOC by reducing the density difference with lighter waters further south, while at the same time strengthening the NOC by increasing the density difference with the heavier waters further north. The box model shows that the NOC initially increases moderately as the AMOC weakens in response to combined global warming and freshwater input, while a tipping point may be reached later if deep convection in the Nordic Seas shuts down and the NOC collapses together with the AMOC. These results are supported by GCM simulations.
- Article
(6157 KB) - Full-text XML
- BibTeX
- EndNote


The Atlantic Meridional Overturning Circulation (AMOC) is an important feature of the Earth's climate system. The one petawatt of energy it transports northward (Trenberth and Fasullo, 2017) warms the entire Northern Hemisphere, in particular around the northern Atlantic mid to high latitudes. The northward branch of the current system extends across the Greenland-Scotland Ridge (GSR), which separates the North Atlantic Ocean from the Nordic Seas and the Arctic Ocean. Warm, saline water is transported into the Nordic Seas, where it loses heat to the atmosphere (Bosse et al., 2018; Mauritzen, 1996), leading to the formation of dense overflow waters that return to the North Atlantic across the GSR, contributing significantly to the deep limb of the AMOC (Dickson and Brown, 1994; Hansen and Østerhus, 2000). In the following, we will call the branch of the circulation north of and flowing across the GSR the Nordic Overturning Circulation (NOC) and the part south of the GSR the AMOC for clarity.
A primary source of North Atlantic Deep Water (NADW) and key driver of the AMOC is convection in the subpolar North Atlantic and Nordic Seas (Kuhlbrodt et al., 2007; Dickson and Brown, 1994). The main convection sites are located in the Irminger Sea, Labrador Sea and Nordic Seas. In the subpolar North Atlantic, heat loss to the atmosphere due to strong winds and low winter surface air temperatures increases the density of surface waters (Marshall and Schott, 1999; Pickart et al., 2003), while in the Nordic Seas, specifically the Greenland Sea, brine rejection during sea ice formation plays an additional role in the triggering of deep convection (Roach et al., 1993; Rudels, 1990). It has been argued that in response to buoyancy changes in the subpolar North Atlantic (e.g. because of surface warming in combination with reduced northward salt advection under a weakened AMOC, Drijfhout et al., 2025), convection in the northern Atlantic might weaken or shut down, reducing the volume transport of the AMOC.
Although direct observations remain inconclusive about any long-term AMOC trend since they don't go back far enough in time (Worthington et al., 2021; Latif et al., 2022; McCarthy et al., 2025), there is indirect evidence that the AMOC has weakened since the mid-twentieth century (Dima and Lohmann, 2010; Drijfhout et al., 2012; Rahmstorf et al., 2015; Caesar et al., 2018; Zhu and Liu, 2020; Caesar et al., 2021; Zhu et al., 2023; Ren et al., 2025; Li and Liu, 2025) due to anthropogenic emissions (Chemke et al., 2020; Dagan et al., 2020; Qasmi, 2023). Observations reveal a statistically significant decline in density in the Irminger Sea, exceeding the 90 % confidence level and approaching 95 %, despite pronounced internal variability. This corresponds dynamically to a 13 % AMOC weakening (Chafik et al., 2022), in line with other estimates, e.g. Caesar et al. (2018). In several freshwater hosing (Stouffer et al., 2006; Jackson et al., 2023; van Westen et al., 2025a) or CO2 (Gregory et al., 2005; Weaver et al., 2007; Weijer et al., 2020; Drijfhout et al., 2025) forcing experiments, the AMOC slows or even shuts down completely on centennial time scales, with consequences for both regional and global climate. If the AMOC were to shut down, the temperature in Europe could cool by several degrees, with more extreme cold events in winter (van Westen et al., 2024), particularly in northern Europe and Scandinavia. In contrast, the Southern Hemisphere would warm over multi-decadal timescales due to reduced northward heat transport (Vellinga and Wood, 2002; Diamond et al., 2025; van Westen et al., 2025a). Additional impacts include a southward shift of the Intertropical Convergence Zone (Vellinga and Wood, 2002; van Westen et al., 2024), large-scale sea level rise in the North Atlantic (Levermann et al., 2005), wide-ranging impacts between ocean basins such as a strengthening of the Walker circulation (Orihuela-Pinto et al., 2022), a strengthening of the North Atlantic storm tracks, a decrease in summer precipitation across much of Europe as well as a decrease in vegetation and crop productivity (Jackson et al., 2015; van Westen et al., 2025b).
The NOC has been stable over the past century (Rossby et al., 2020; Årthun, 2023; Larsen et al., 2024). For the future, climate models predict a strengthening of the NOC (Årthun et al., 2023; Gou et al., 2024) in contrast to the AMOC's response to buoyancy changes forced by surface warming or increased freshwater input. This increased overturning takes place as anomalously warm and salty surface waters translate into changes in water mass transformation and horizontal circulation. Surface density changes in the Nordic Seas also affect the NOC by altering the pressure gradient across the GSR, and, hence, the exchanges between the subpolar North Atlantic and the Nordic Seas (Olsen et al., 2008; Chafik et al., 2025). Similarly, density changes south of the GSR can also drive changes in the NOC. Specifically, Chafik et al. (2025) demonstrated that on multi-year timescales AMOC-driven temperature anomalies in the subpolar North Atlantic modulate the pressure gradient and overturning across the GSR; a stronger AMOC leading to a stronger NOC. But how then does this coherent connection between large-scale circulation changes (i.e., the AMOC) and Nordic Seas overturning variability, relate to the opposing future trajectories of the AMOC and the NOC?
The causal link between the opposing trends in AMOC and NOC has been little explored. Investigating the response to meltwater release from the Greenland and Antarctic ice sheet in a coupled climate model, Berk et al. (2021) found an increase in Nordic Seas convection concurrent with a decrease in convection in the subpolar North Atlantic as a result of changes in surface buoyancy fluxes and winds. Here, we suggest an additional mechanism. We investigate the hypothesis that, since the NOC, similarly to the AMOC, is impacted by the density difference across the GSR, increased freshwater forcing in the northern Atlantic could increase the NOC by increasing the density gradient between the northern Atlantic and the Nordic Seas. This would in turn enhance the heat transport into the Nordic Seas and Arctic Ocean, consistent with future projections (Shu et al., 2022; Dörr et al., 2024). This study aims to investigate the increase of heat transport into the Nordic Seas and overturning, and its possible connection to a weakening AMOC under global warming conditions. Using high resolution climate model data and an idealized box model, we isolate the density-driven dynamics and feedbacks connecting the AMOC and NOC.
2.1 Climate Model Simulations With CM2.6
This study employs the GFDL CM2.6 climate model, a high-resolution Coupled General Circulation Model (CGCM) developed by the Geophysical Fluid Dynamics Laboratory (GFDL) (Griffies et al., 2015; Saba et al., 2016). CM2.6 consists of the AM2 atmosphere, LM3 land model, MOM5 ocean model, and SIS sea ice model. The atmosphere and land models have a lateral resolution of nominally 0.5° with AMS utilising 32 vertical layers. MOM5, as implemented in CM2.6, features a refined ocean resolution varying from 11 km at the equator to 4 km at high latitudes, allowing for an eddy-permitting representation of ocean dynamics (Delworth et al., 2012). The model includes 50 vertical layers in re-scaled geopotential height (z*) coordinates, over 5500 m.
This model was selected for several reasons. Griffies et al. (2015) demonstrated that CM2.6 realistically captures transient mesoscale eddy heat transport in the northern Atlantic, allowing a clear separation between the contributions of mean advection and eddy processes. This leads to a more accurate representation of how heat converges within the ocean interior and results in smaller temperature drifts and more stable global heat budgets over long integrations. Similarly, Saba et al. (2016) showed that CM2.6 reproduces the pathways and interactions of the Northwest Atlantic circulation with much greater fidelity compared to coarser resolved climate models, yielding more realistic regional climate change projections. In the Arctic context, Decuypère et al. (2022) found that CM2.6 provides the best agreement with observed ocean heat transport and represents inter-basin heat transport more accurately than medium- and low-resolution models from the same model suite. In summary, these findings indicate that CM2.6 offers a robust framework for investigating northern Atlantic ocean heat transport processes and their evolution under elevated CO2 concentrations.
The model is initialized with preindustrial boundary conditions, including atmospheric CO2 concentration of 280 ppm as well as observed present-day ocean-conditions (Steele et al., 2001), followed by a spin-up simulation of 100 years into quasi-equilibrium. Two experiments are performed subsequently derived from this initial simulation. In the preindustrial control run (PIC), atmospheric CO2 concentrations are kept constant at 280 ppm for 80 years, maintaining stable preindustrial climate conditions. In the CO2 doubling experiment (2 × CO2), atmospheric CO2 is increased by 1 % yr−1 over a period of 70 model years, reaching a final concentration of 560 ppm. The simulation is then extended for an additional 10 years with CO2 levels held constant, allowing the system to adjust under the increased greenhouse gas forcing (Delworth et al., 2012). Owing to data storage limitations, we had to restrict the analysis to 20-year periods drawn from the last 20 years of each simulation. Nonetheless, this experimental design allows us to diagnose the responses to increased atmospheric CO2 forcing.
2.2 Calculating Meridional Heat Transport
To calculate the meridional heat transport (MHT) across a desired latitude, a net zero volume transport is required (Bryden and Imawaki, 2001). Hence, the zero-velocity reference is utilised to estimate the geostrophic velocities. The section-averaged velocity is then subtracted from the velocity field. Similar to Msadek et al. (2013), we compute MHT as follows:
where ρ0 is the density, which is assumed to be constant at 1025 kg m−3, Cp is the specific heat capacity of 4000 kJ kg−1 K−1, Θ is the potential temperature, v is the meridional velocity and being the mean velocity over the cross section for the full basin depth, which ensures that MHT is associated with a net zero volume transport and therefore independent of a reference temperature (Bryden and Imawaki, 2001).
2.3 Decomposing Meridional Heat Transport
2.3.1 Dynamic-Thermodynamic Decomposition
To analyse the meridional heat transport (MHT) anomalies, we compute the differences in MHT between the two CM2.6 simulations (MHT′). These anomalies are decomposed following the methodology of Bony et al. (2004), attributing changes to thermodynamic effects (associated with anomalous temperature variations), dynamic effects (related to changes in circulation), and non-linear interactions between the two. We set up the dynamic-thermodynamic decomposition as:
Here, bars denote variables from the PIC simulation, while primes indicate anomalies from the 2 × CO2 run relative to the PIC run, such that , , and . Following the approach of Oldenburg et al. (2018), the thermodynamic component of MHT′ represents the advection of anomalous heat by the mean circulation, the dynamic component corresponds to the advection of mean heat by anomalous currents, and the non-linear contribution arises from simultaneous changes in both temperature and circulation.
2.3.2 Overturning-Gyre Decomposition
Following Bryan (1982), MHT in the northern Atlantic can be decomposed into contributions from the two dominant gyre systems, the subpolar gyre south of Greenland and the weaker gyre in the Nordic Seas, as well as from the overturning circulation. We compute the gyre contribution to MHT as:
and the overturning contribution to MHT as:
Here, 〈⋅〉 denotes zonal average of the variable and represents the anomaly from that zonal average.
We acknowledge that at high latitudes a substantial fraction of the overturning occurs through horizontal or gyre circulation across sloping isopycnals, rather than purely vertical exchange. Consequently, the physical interpretation of the overturning and gyre terms in these regions differs from that at lower latitudes (Zhang and Thomas, 2021), even though the mathematical decomposition itself remains valid.
2.4 Box Model
The box model used for the following analysis consists of eight boxes (Fig. 2). Box 0 represents the Southern Atlantic and the connection to other ocean basins. Boxes 1, 7, and 6 represent the tropical surface waters, intermediate waters, and deep water regions, respectively. Boxes 2 and 5 cover the surface and deep waters of the northern Atlantic while boxes 3 and 4 represent the Nordic Seas. Convection is active between the surface and bottom waters of the Nordic and northern Atlantic boxes as long as the density stratification is unstable, that is if ρ2>ρ5 or ρ3>ρ4. The overturning rates, m0 and m1, are governed by the density gradients between boxes 0 and , and and , respectively. m0 represents the AMOC, and m1 the Nordic Overturning Circulation (NOC). We use a non-linear approximation for the equation of state (EOS) analogous to Nycander et al. (2015) to account for the non-linear effects of the temperature on the density at temperatures close to or below zero. Furthermore, all surface boxes lose or gain heat, governed by the temperature difference between the boxes and a respective restoring temperature multiplied by the restoring rates λi. This exchange can be interpreted as heat exchange with the atmosphere. The values for the restoring rates are calculated as follows
where γ is the thermal coupling constant (10 kg K−1 s−3), Cp is the specific heat capacity (4000 J kg−1 K−1), ρ the density of water (1025 kg m−3) and di the depth of box i. The restoring temperatures are fitting parameters. Note that the model in Fig. 2 is only valid for positive m0 and m1 and that the arrow pointing from box 2 to box 5 flips if m1>m0. The salinity and temperature values in the box model are fitted to sea surface temperature data from the World Ocean Atlas (winter averages between 1971–2000) (Reagan et al., 2024a). The winter period was chosen because convection is active during that time. All stacked boxes add to depth of 3000 m except for boxes 3 and 4 that add to 1500 m because the Nordic Seas have a shallower average depth than the Atlantic. The regions for the Nordic Seas and the subpolar North Atlantic are shown in Fig. 1. Only the western Nordic Seas and the Labrador Sea are considered because this is where the main convection sites are located (Fig. 1). While the Labrador Sea dominates the contributions to the North Atlantic Deep Waters (Fröhle et al., 2022), the western Nordic Seas are also known to contribute significantly to the dense overflows that feed the lower limb of the AMOC (Huang et al., 2020; Brakstad et al., 2023). Furthermore, most of the freshwater input in the northern Atlantic is being focused towards the Labrador Sea due to the counter clockwise rotation of the ocean currents around Greenland (Yang et al., 2016), which favours this region for hosing experiments. Lastly, the water in the Labrador Sea is colder, which facilitates the onset of convection in the model. In the following we will refer to these regions simply as the Nordic Seas and northern Atlantic for simplicity.
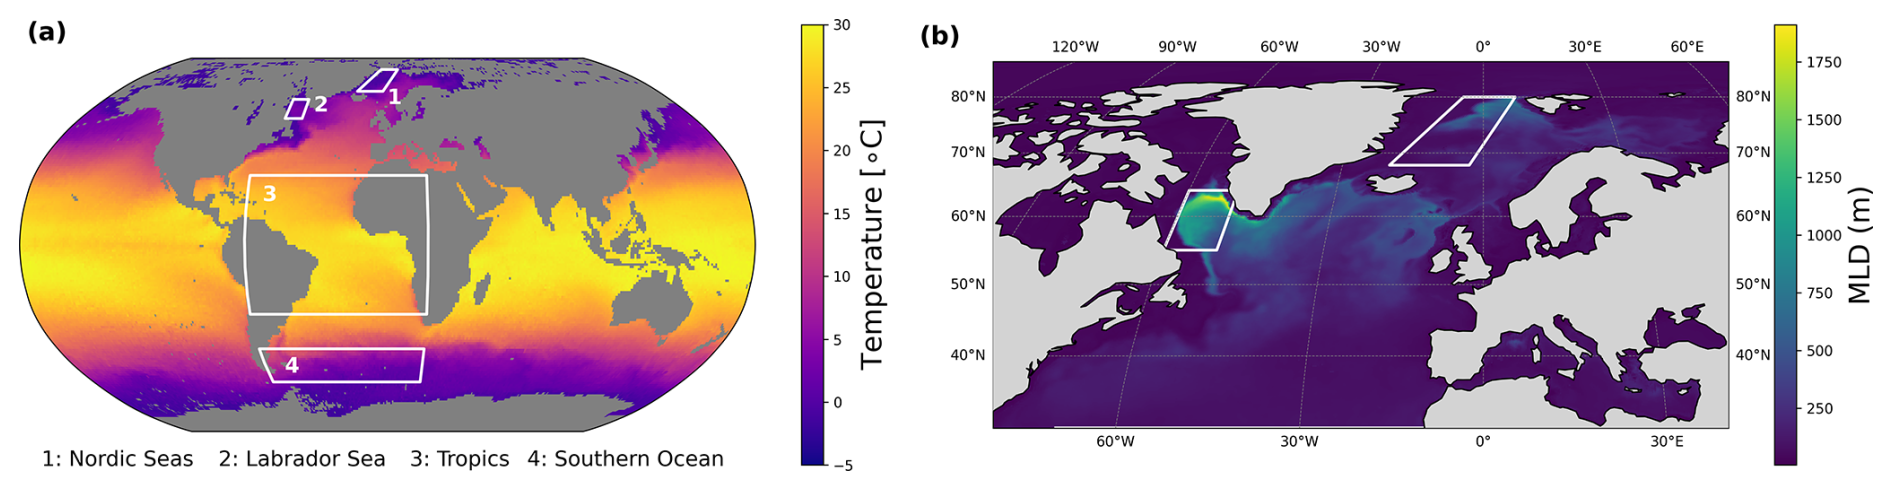
Figure 1(a) Mean sea surface temperature during winter 1971–2000 (January to March) from WOA23 (Reagan et al., 2024a). The temperatures used for the tuning process were averaged across the outlined regions. (b) ORAS5 mixed layer depth (MLD) data (Copernicus Climate Change Service, 2021) for the subpolar North Atlantic and Nordic Seas. The region used for averaging temperature include the convection sites. The coordinates for the areas are: Southern Ocean: 70–45° S, 60° W–20° E; Tropics: 30° S–30° N, 70° W–20° E; Labrador Sea: 55–64° N, 50–60° W; Nordic Seas: (20° W, 68° N), (3° W, 68° N), (8° E, 80° N), (5° W, 80° N).
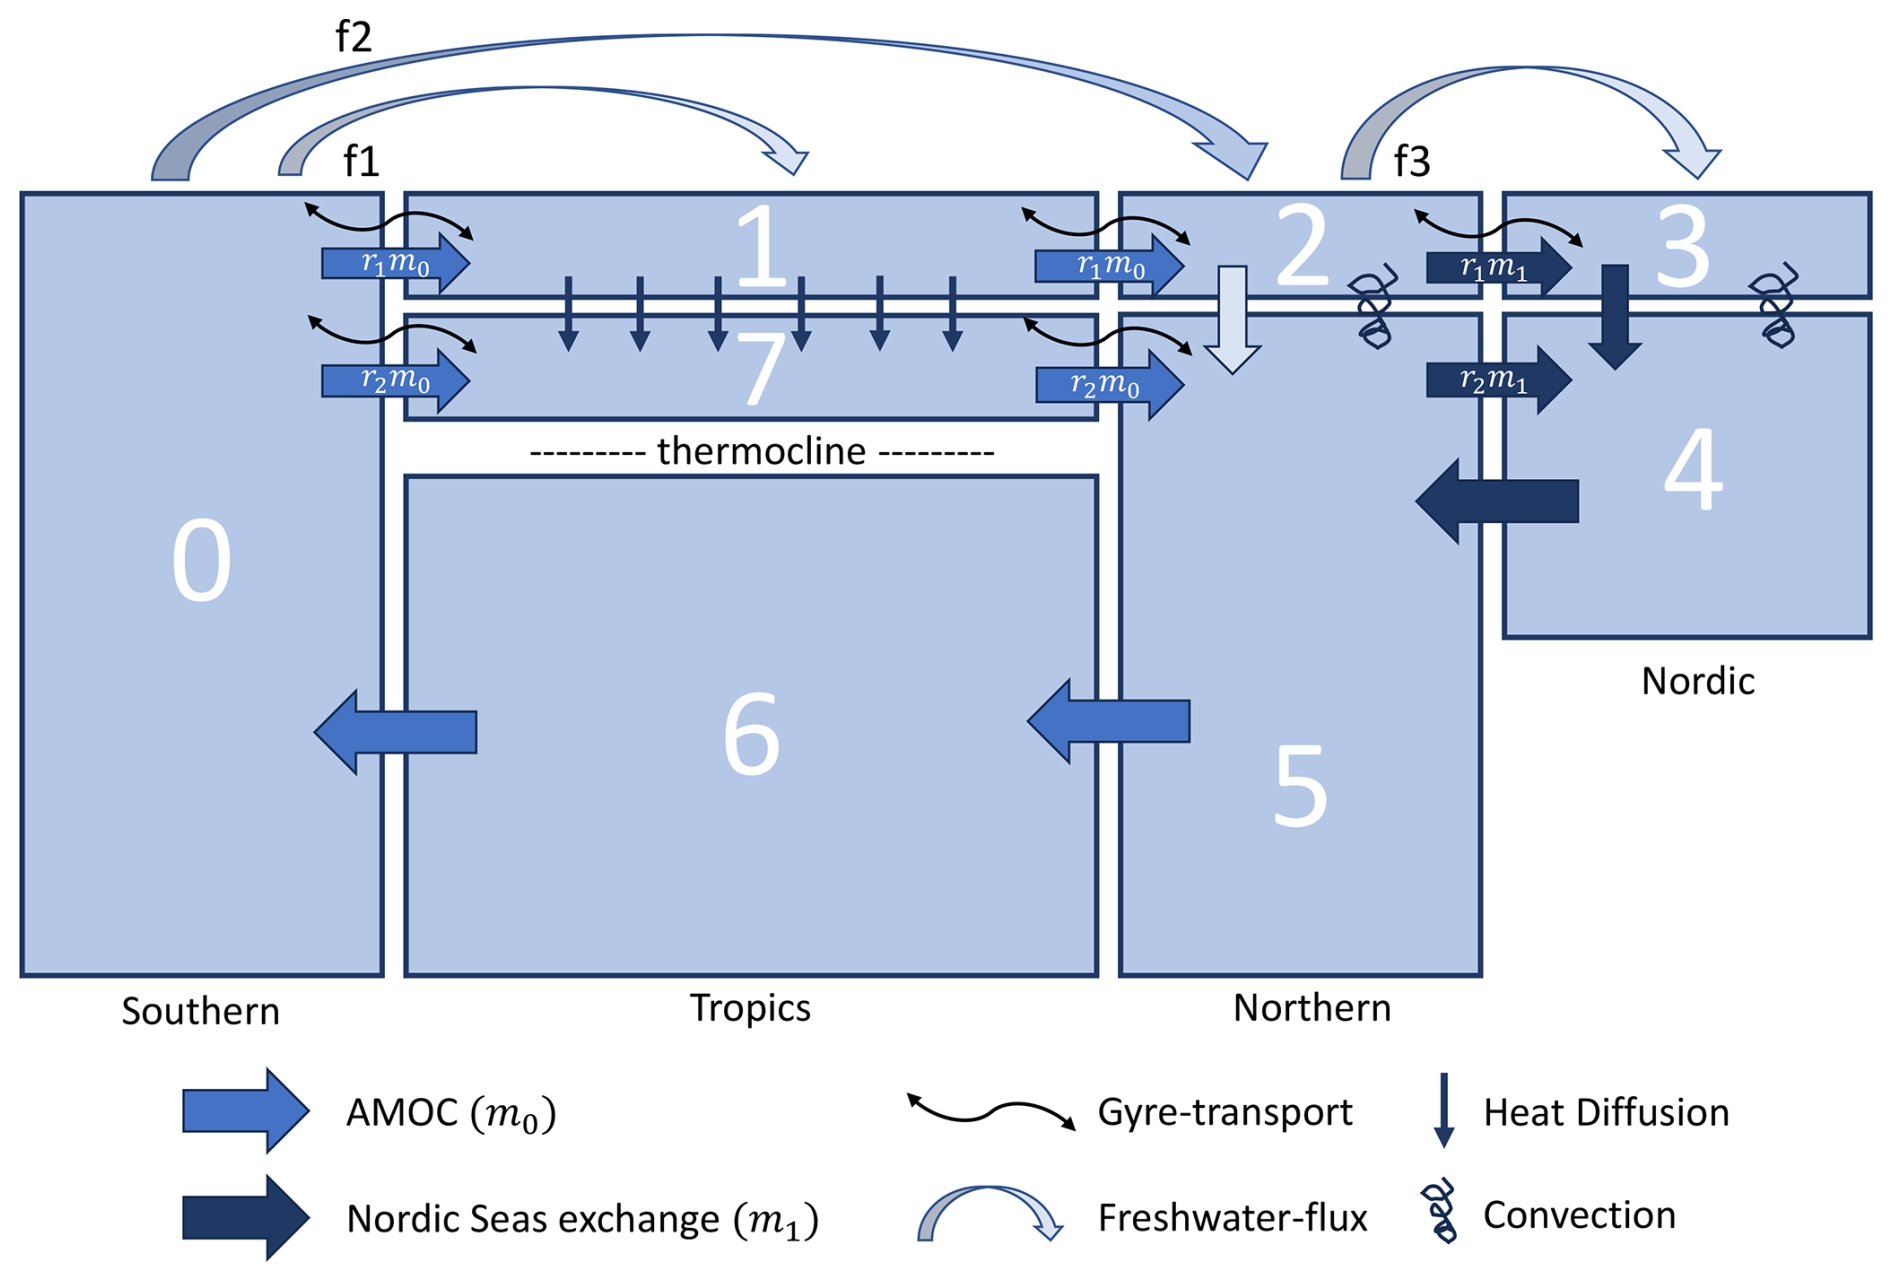
Figure 2Schematic representation of the box model of the Atlantic Ocean. f1–f3 are the freshwater fluxes between the boxes. The wavy arrows indicate gyre transport. The solid large arrows represent AMOC (medium blue) and NOC (dark blue) respectively, while the small solid arrows indicate diffusive heat transport. The coils mark convection.
We also implement a diffusion process between the tropical surface and intermediate waters to regulate the temperature in box 7. The full model equations for positive m0 and m1, as well as m0>m1, can be found in Appendix A. For the convection parameter ci
applies. The exact value of c is not critical, as long as it is large enough to guarantee that the surface box and deep water box are sufficiently mixed. The parameters Ks, Kn, and Knn are constant and take into account the gyre transport between the respective boxes. The values of Ks and Kn are 3.4 Sv respectively, and were estimated using the results of Wood et al. (2019). The value of Knn was chosen to be 1 Sv.
η determines the rate of diffusion. η, f1, k0, k1 and the restoring temperatures are fitted by minimizing the loss function
where k is the box number and the overlined letters are the present day values according to WOA23 data and, in case of AMOC (m0, 17 Sv) and NOC (m1, 6 Sv), current meter observations (Wett et al., 2023; Hansen and Østerhus, 2000). The last term is added to guarantee convection in the Nordic Seas. The weights for the salinity and temperature differences are the values of α and β (in orders of magnitude of 10−4) in the linear EOS, because a difference in salinity impacts the density scaling with β, while the impact of a temperature difference scales with α. While these hyperparameters could potentially be tuned, this choice already yields satisfactory results. We divide by 8 to average over the 8 boxes.
A value of 0.07 Sv for f2 is chosen according to Yang et al. (2016). They mention 20–30 mSv precipitation in the northern Atlantic region and about 40 mSv of freshwater influx from Arctic Sea Ice, Greenland Ice Sheet and the Canadian Arctic Archipelago combined. f3 is chosen to be smaller than but in the same order of magnitude as f2 since in the model freshwater is transported directly from the northern Atlantic into the Nordic Seas. The data is averaged from 0–100 m for the surface layers and from 100 m to a maximum depth of 3000 m/1500 m, according to the depth of the boxes.
The same data was used to calculate the order of magnitude of the increase in f2 per year. An approximate increase rate of 0.75 mSv yr−1 was obtained from Yang et al. (2016) for the influx from the Arctic Sea Ice, Greenland Ice Sheet and the Canadian Arctic Archipelago (calculated between 2000 and 2020). The net precipitation increased by a factor of three in about 25 years (Josey and Marsh, 2005), so about 8 % yr−1. Multiplying this with the 20–30 mSv measured by Yang et al. (2016) one gets a crude estimate of the increase which is 2 mSv yr−1. Prior to the global warming and hosing experiments, the model was spun up for 3000 years to achieve equilibrium. The beginning of the experiments is designated as model year 2000, aligning with the period of the fitting data.
3.1 Increased Heat Flow Into the Nordic Seas in CM2.6 Simulations
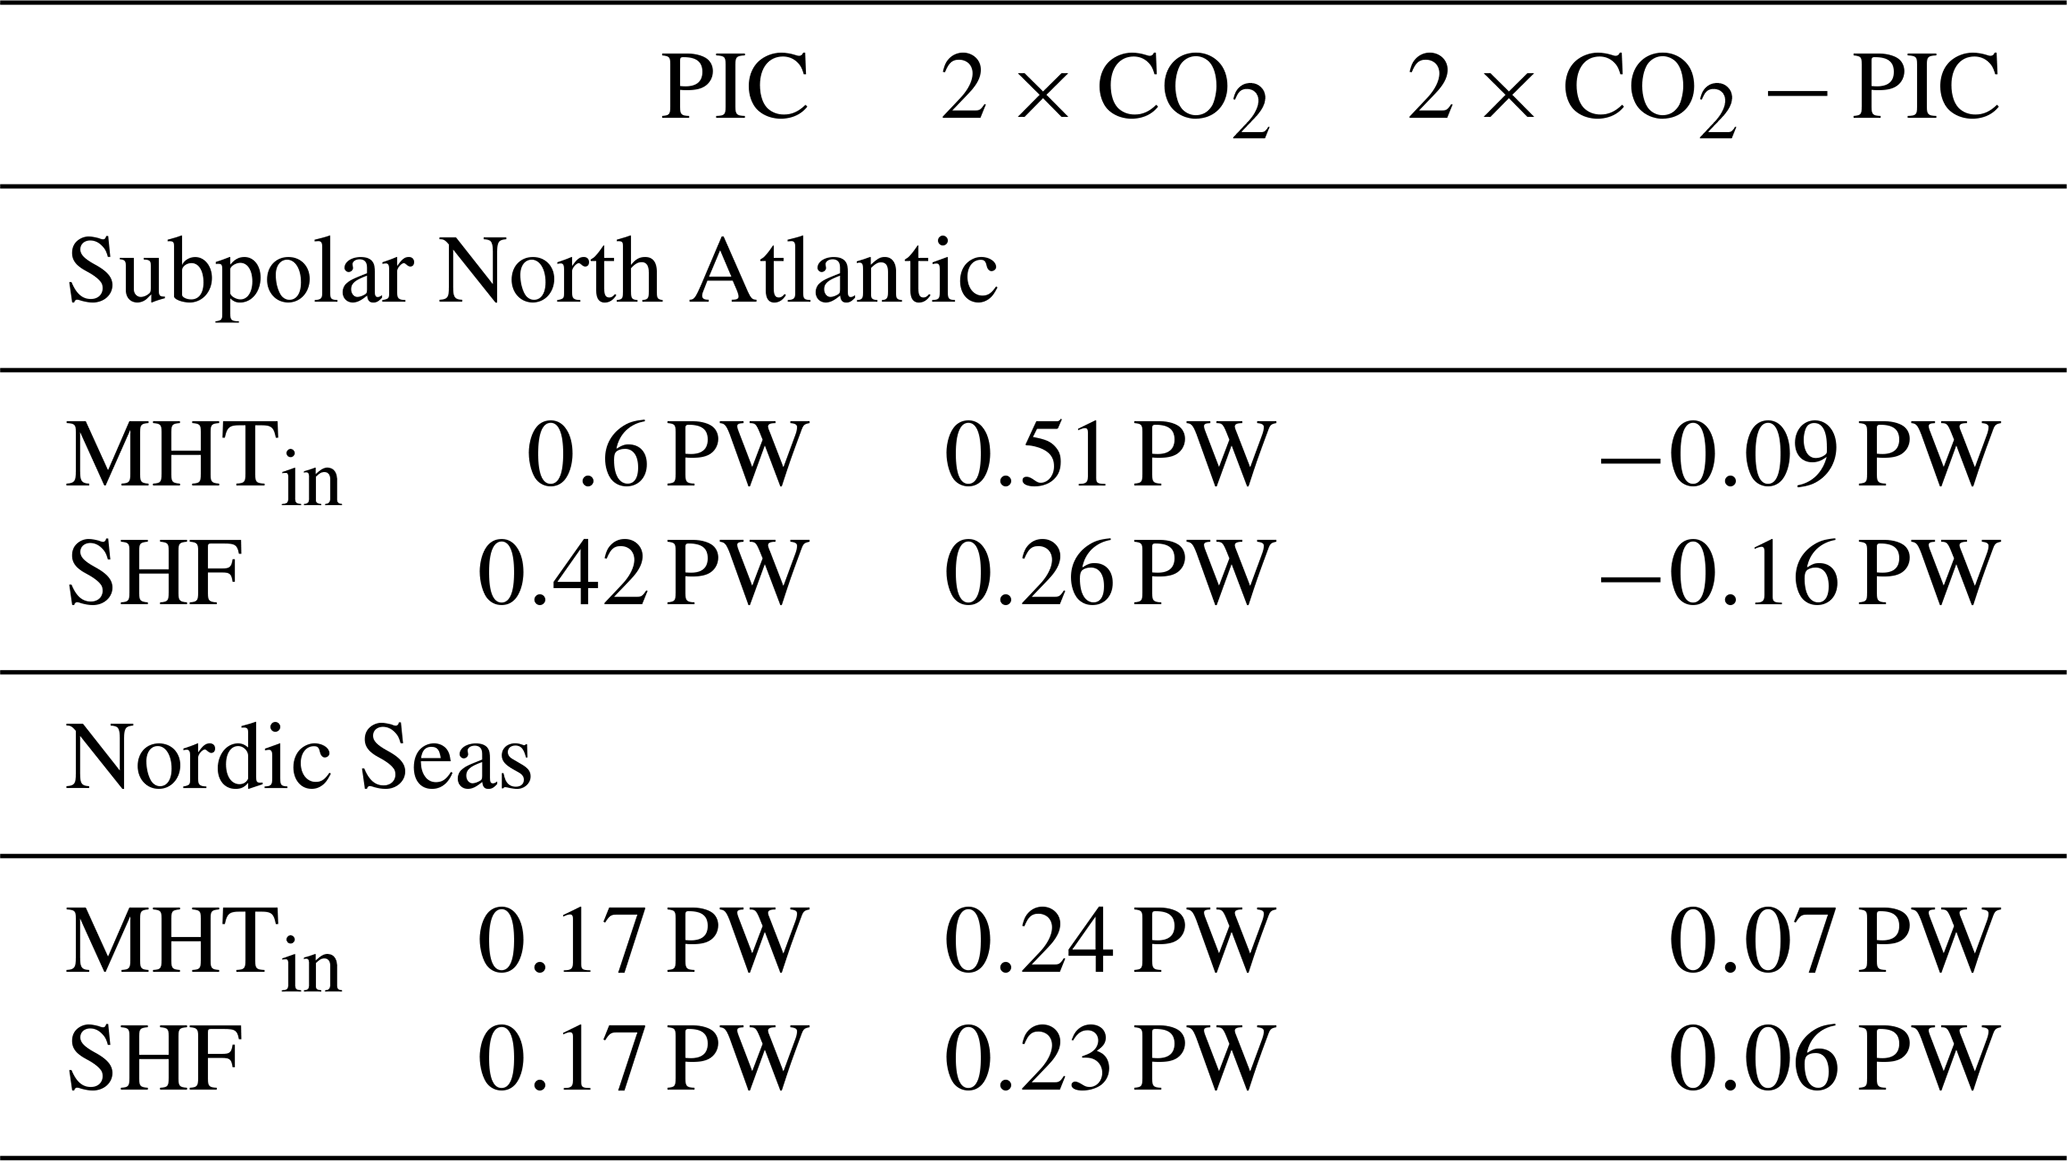
Comparing the CM2.6 preindustrial control (PIC) and 2 × CO2 simulations, we find a reduction of −0.09 PW in MHT into the subpolar North Atlantic and the Labrador Sea following a doubling of atmospheric CO2. In contrast to this reduced MHT into the subpolar North Atlantic, there is an increase of 0.07 PW into the Nordic Seas over the same period. A heat budget analysis further reveals that in 2 × CO2, this divergence in MHT is balanced by a substantial reduction in surface heat flux (SHF; defined as positive entering into the ocean) of −0.16 PW (SHF − SHFPIC) over the subpolar North Atlantic. A detailed presentation of the CM2.6 heat budget results is given in Table 1.
Table 1Meridional heat transport into the subpolar North Atlantic and the Nordic Seas under PIC and 2 × CO2 Forcing. We present the results from a subpolar North Atlantic and Nordic Seas heat budget analysis in both CM2.6 simulations. We calculate the heat inflow (MHTin) as well as the surface heat flux (SHF) of both regions and under both forcings. Changes in ocean heat content as a budget residual are neglected. Furthermore, we show the changes of MHTin and SHF when doubling the atmospheric CO2 concentration in CM2.6.
3.1.1 Heat Flow Decomposition
Dynamic-Thermodynamic Decomposition
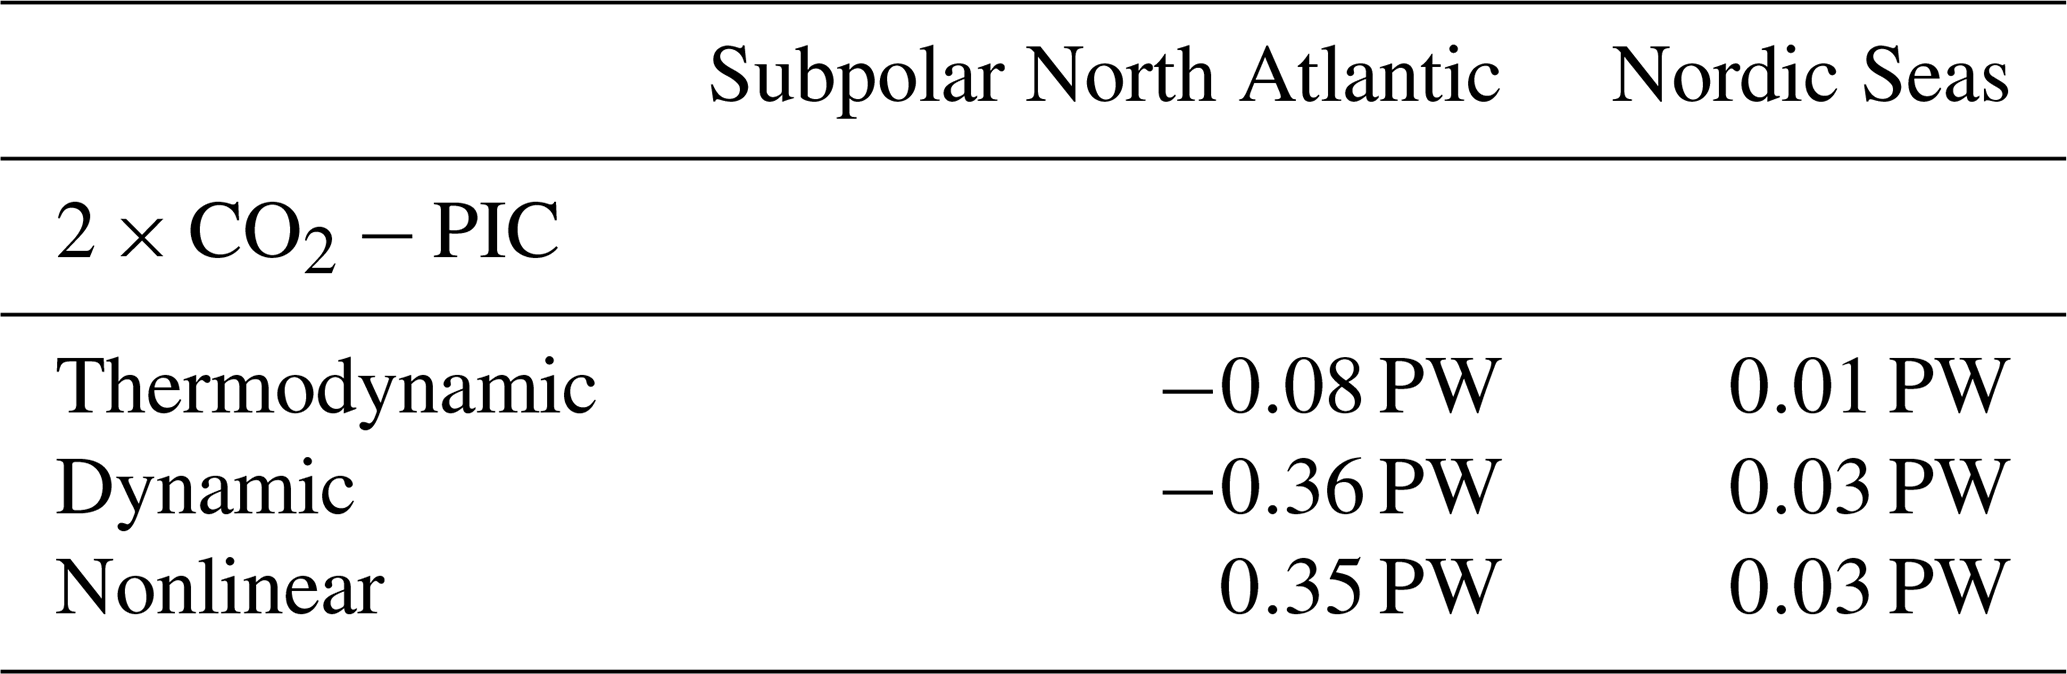
To assess the drivers of MHT anomalies, we decompose them into dynamic, thermodynamic, and nonlinear contributions. This allows us to determine whether changes in MHT are primarily driven by changes in the mass transport of the flow or its temperature under a two-fold CO2 forcing. For the subpolar North Atlantic, the decomposition reveals large but compensating circulation-related contributions: dynamic changes in ocean circulation contribute −0.36 PW, while the nonlinear term contributes +0.35 PW (see Table 2). This strong compensation results in a comparatively small net MHT anomaly. The thermodynamic contribution is considerably smaller in magnitude (−0.08 PW). While no single term dominates the net MHT change, the largest individual contributions are associated with circulation-related processes, indicating that changes in ocean circulation and its interaction with temperature anomalies primarily control the response. Results in the Nordic Seas are similar. The dynamic component remains the primary driver (0.03 PW) of MHT′, with its magnitude exceeding that of the thermodynamic contribution (0.01 PW, see Table 2). Additionally, a strong non-linear term is present, reflecting the covariation of velocity and temperature anomalies representing the eddy-mediated heat transport. The results indicate that, analogous to the subpolar North Atlantic, variations in circulation patterns dominate the differences in MHT under PIC and 2 × CO2 forcing in CM2.6. Hence, the findings imply opposing responses of AMOC- and NOC-driven MHT changes under increased CO2 forcing in CM2.6.
Table 2Results from the Dynamic-Thermodynamic-Decomposition of Meridional Heat Transport into the subpolar North Atlantic and the Nordic Seas. We present MHT anomalies when decomposed into thermodynamic, dynamic and non-linear contributions. The sum for each region matches the MHT changes presented in Table 1.
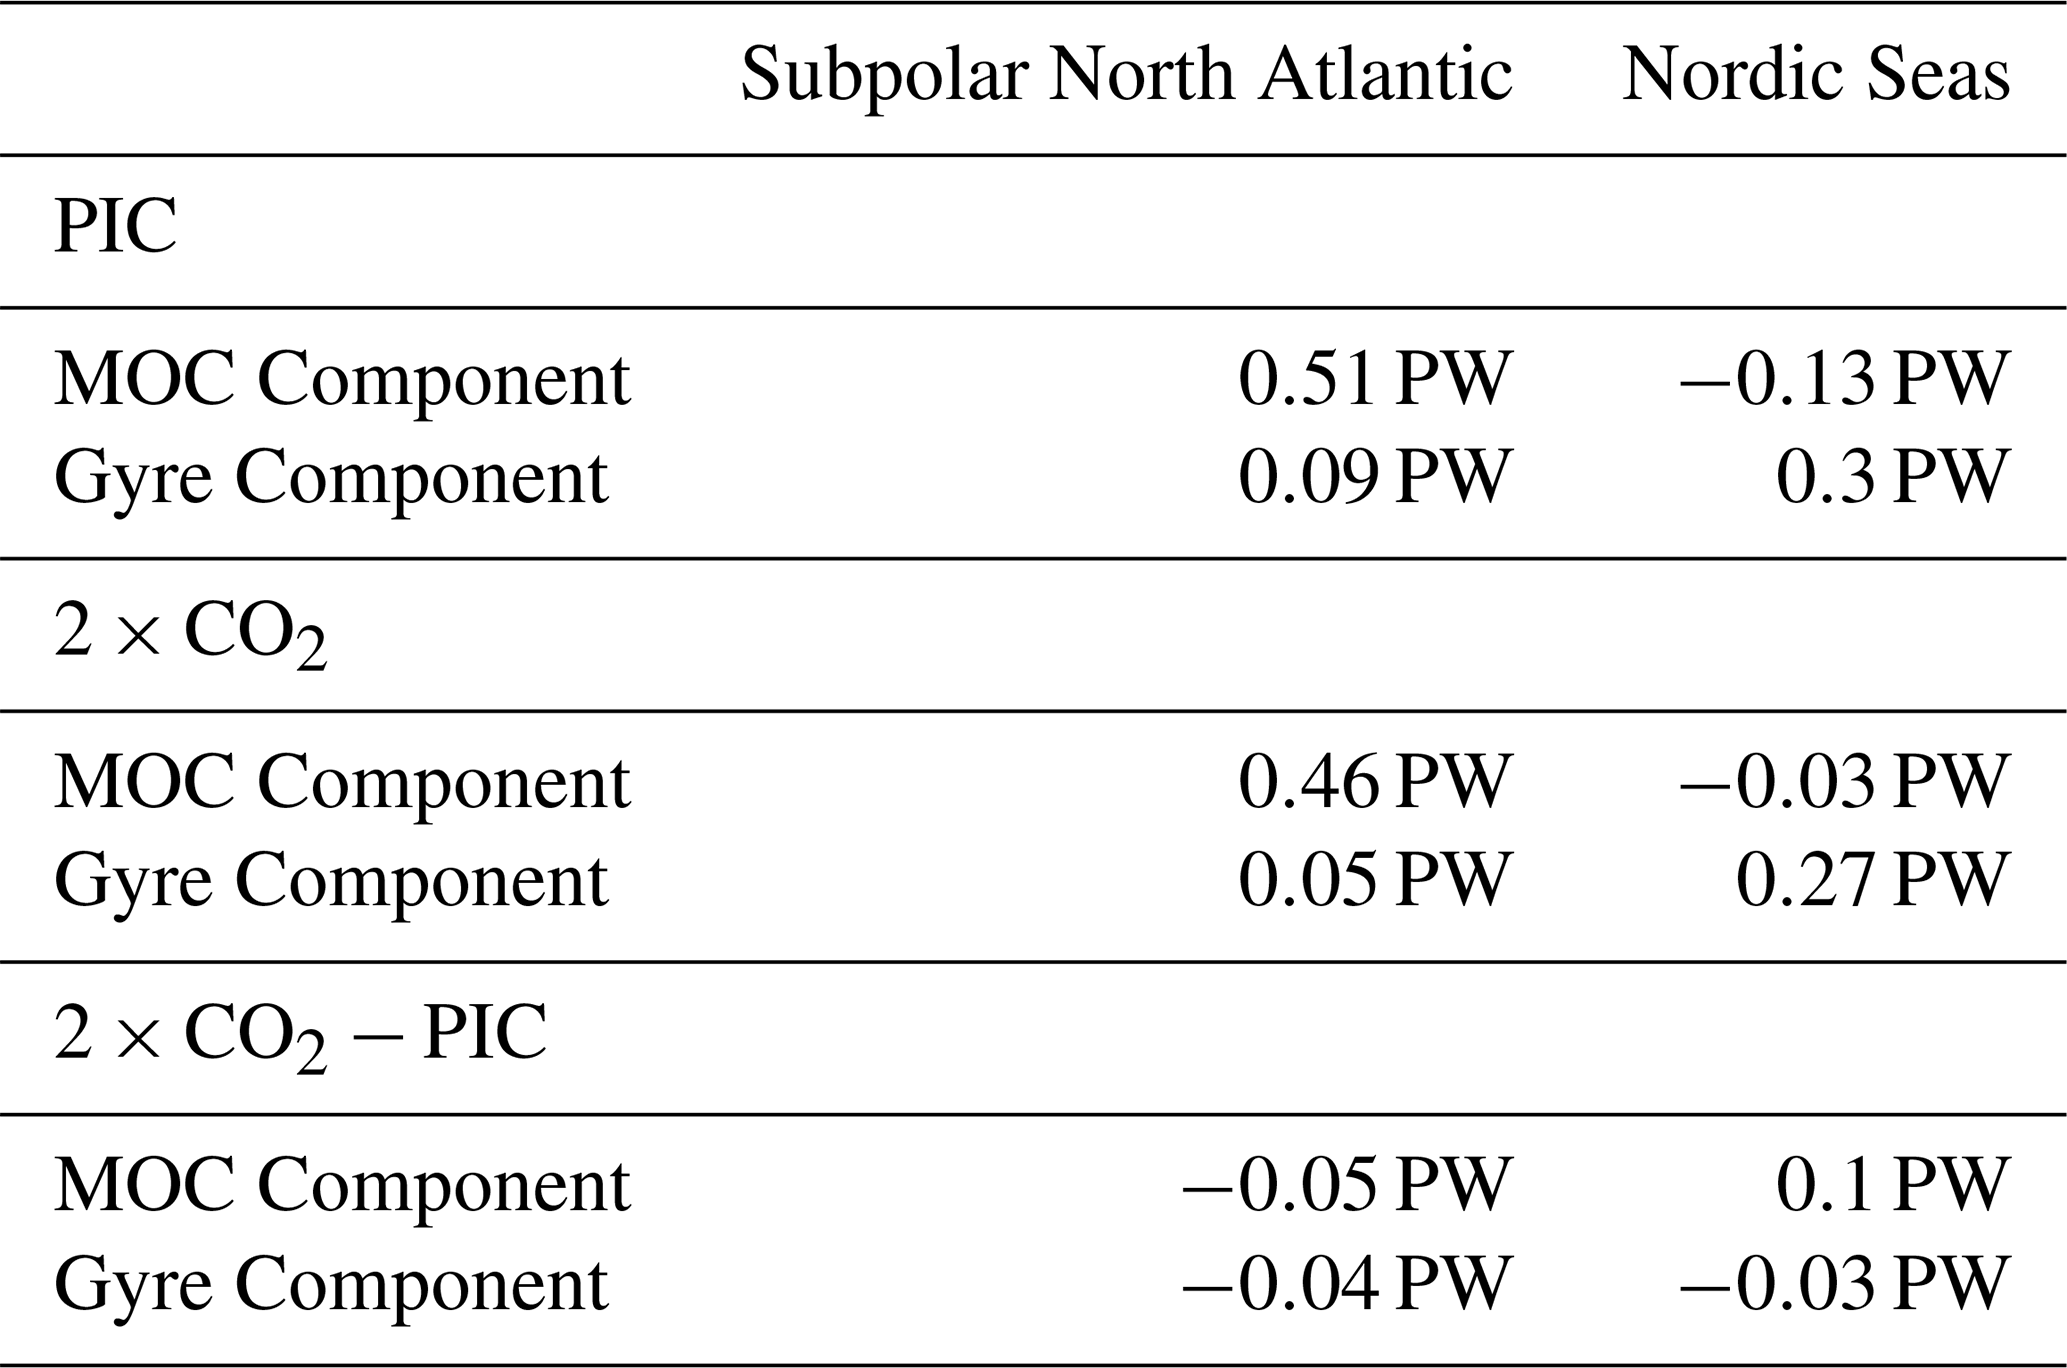
Overturning-Gyre Decomposition
To further investigate the mechanisms driving MHT anomalies, we decompose MHT into contributions from the wind-driven gyre circulation and the meridional overturning circulation (see Sect. 2.3.2). Since this decomposition focuses on total MHT, we first examine the dominant contributors to northward heat transport into the subpolar North Atlantic and the Nordic Seas before evaluating how changes in these components drive MHT anomalies under increased CO2 forcing in CM2.6. The results are summarized in Table 3. For the subpolar North Atlantic, the decomposition reveals that MHT is primarily driven by the overturning circulation. In both simulations, the MOC component dominates, accounting for 86 % of MHT in the PIC run and increasing to 91 % under 2 × CO2 forcing (see Table 3).
Investigating changes to MHT entering the subpolar North Atlantic under increased CO2 forcing, the MOC component accounts for 57.5 % of the total MHT anomalies, indicating that the weakening of the overturning circulation accounts for the largest individual contribution to the diagnosed reduction in MHT, while the gyre component provides a substantial additional contribution. For the Nordic Seas, the decomposition of MHT anomalies reveals that the changes in MHT due to increased atmospheric CO2 forcing are primarily driven by changes in the MOC component. The gyre contribution exhibits a slight weakening effect on MHT′, but its influence is minor compared to the dominant MOC-driven increase (see Table 3).
Table 3Results from the Overturning-Gyre-Decomposition of Meridional Heat Transport into the subpolar North Atlantic and the Nordic Seas. We present MHT estimates from the PIC simulation as well as the 2 × CO2 simulation in CM2.6 decomposed into contributions from MOC and the gyre circulation. Contributions to MHT anomalies when increasing the atmospheric CO2 concentration in CM2.6 are given as well.
In summary, the CM2.6 simulations indicate a contrasting response of heat transport in the subpolar North Atlantic and the Nordic Seas under increased atmospheric CO2 forcing. While meridional heat transport into the subpolar North Atlantic decreases, heat transport into the Nordic Seas increases. Decomposition of the MHT anomalies shows that circulation-related processes (dynamic and nonlinear terms) provide the largest individual contributions in both regions, although substantial compensation between these terms occurs, particularly in the subpolar North Atlantic, resulting in a comparatively small net anomaly. Thermodynamic contributions are smaller in magnitude. An overturning-gyre decomposition further indicates that changes in the overturning circulation account for the largest individual contribution to the diagnosed MHT anomalies, with gyre-related changes providing a substantial additional contribution. Together, these results suggest that changes in large-scale circulation, rather than temperature anomalies alone, control the opposing responses of heat transport in the two regions under sustained CO2 forcing in CM2.6.
3.2 Box Model Results
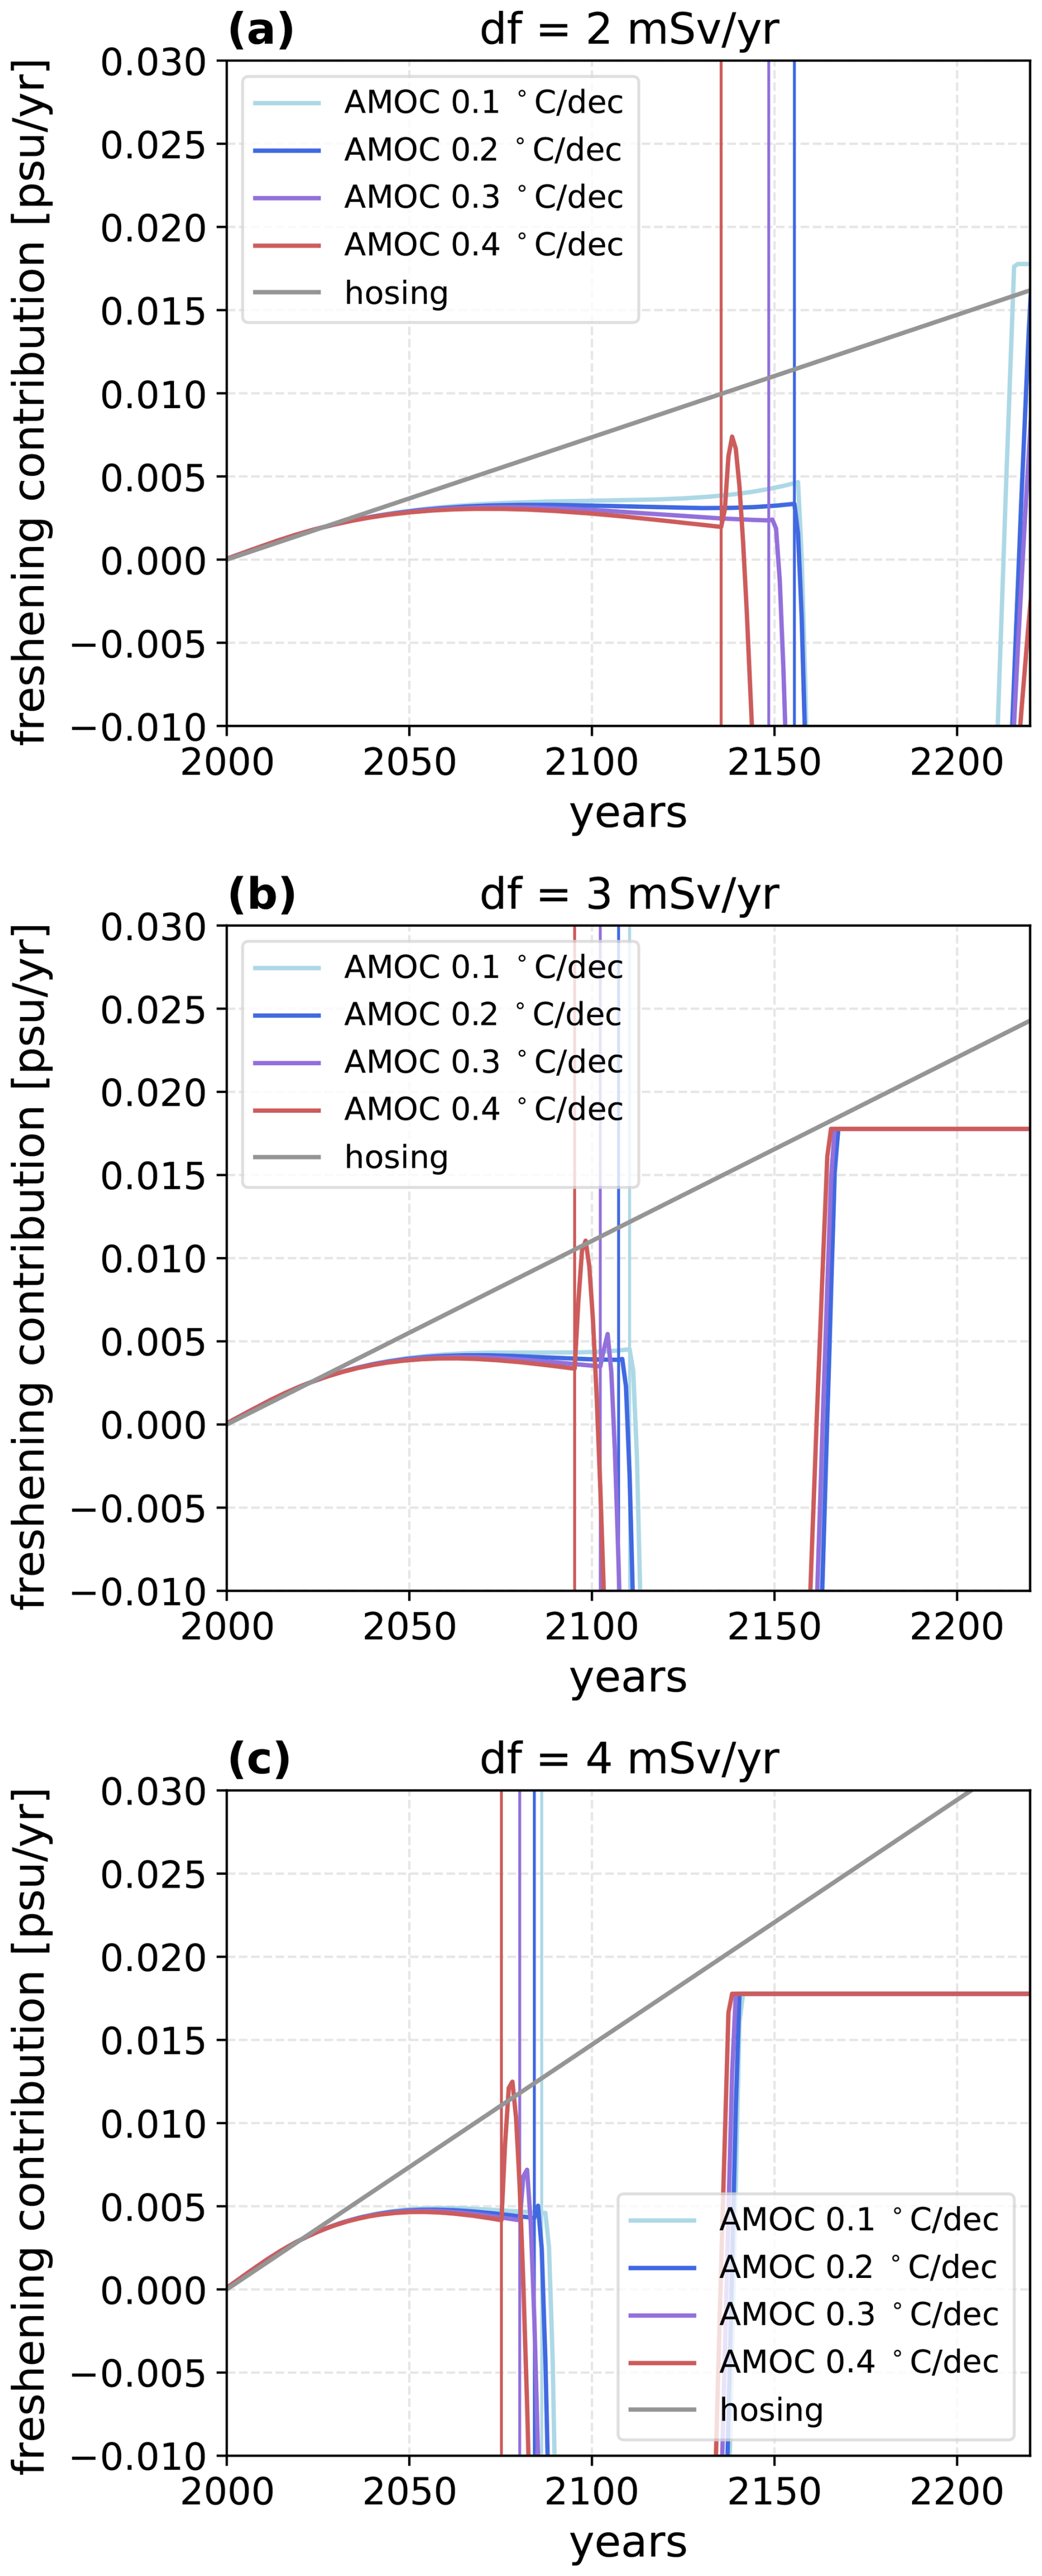
In the previous section it was shown that the increased heat transport into the Nordic Seas in 2 × CO2 simulations with GFDL CM2.6 is associated with a strengthening of Nordic Overturning. In the following, we will use our box model to conceptually explore the possible reasons behind this increase by doing hosing and global warming experiments under the assumption that both, AMOC and NOC, are driven by density gradients. We compared different hosing rates ranging from 2 to 4 mSv yr−1 and global warming scenarios from 0.1 to 0.4 °C per decade. We combined each hosing rate with each global warming scenario. The results are shown in Fig. 3. The warming was imposed on the restoring temperatures T*.
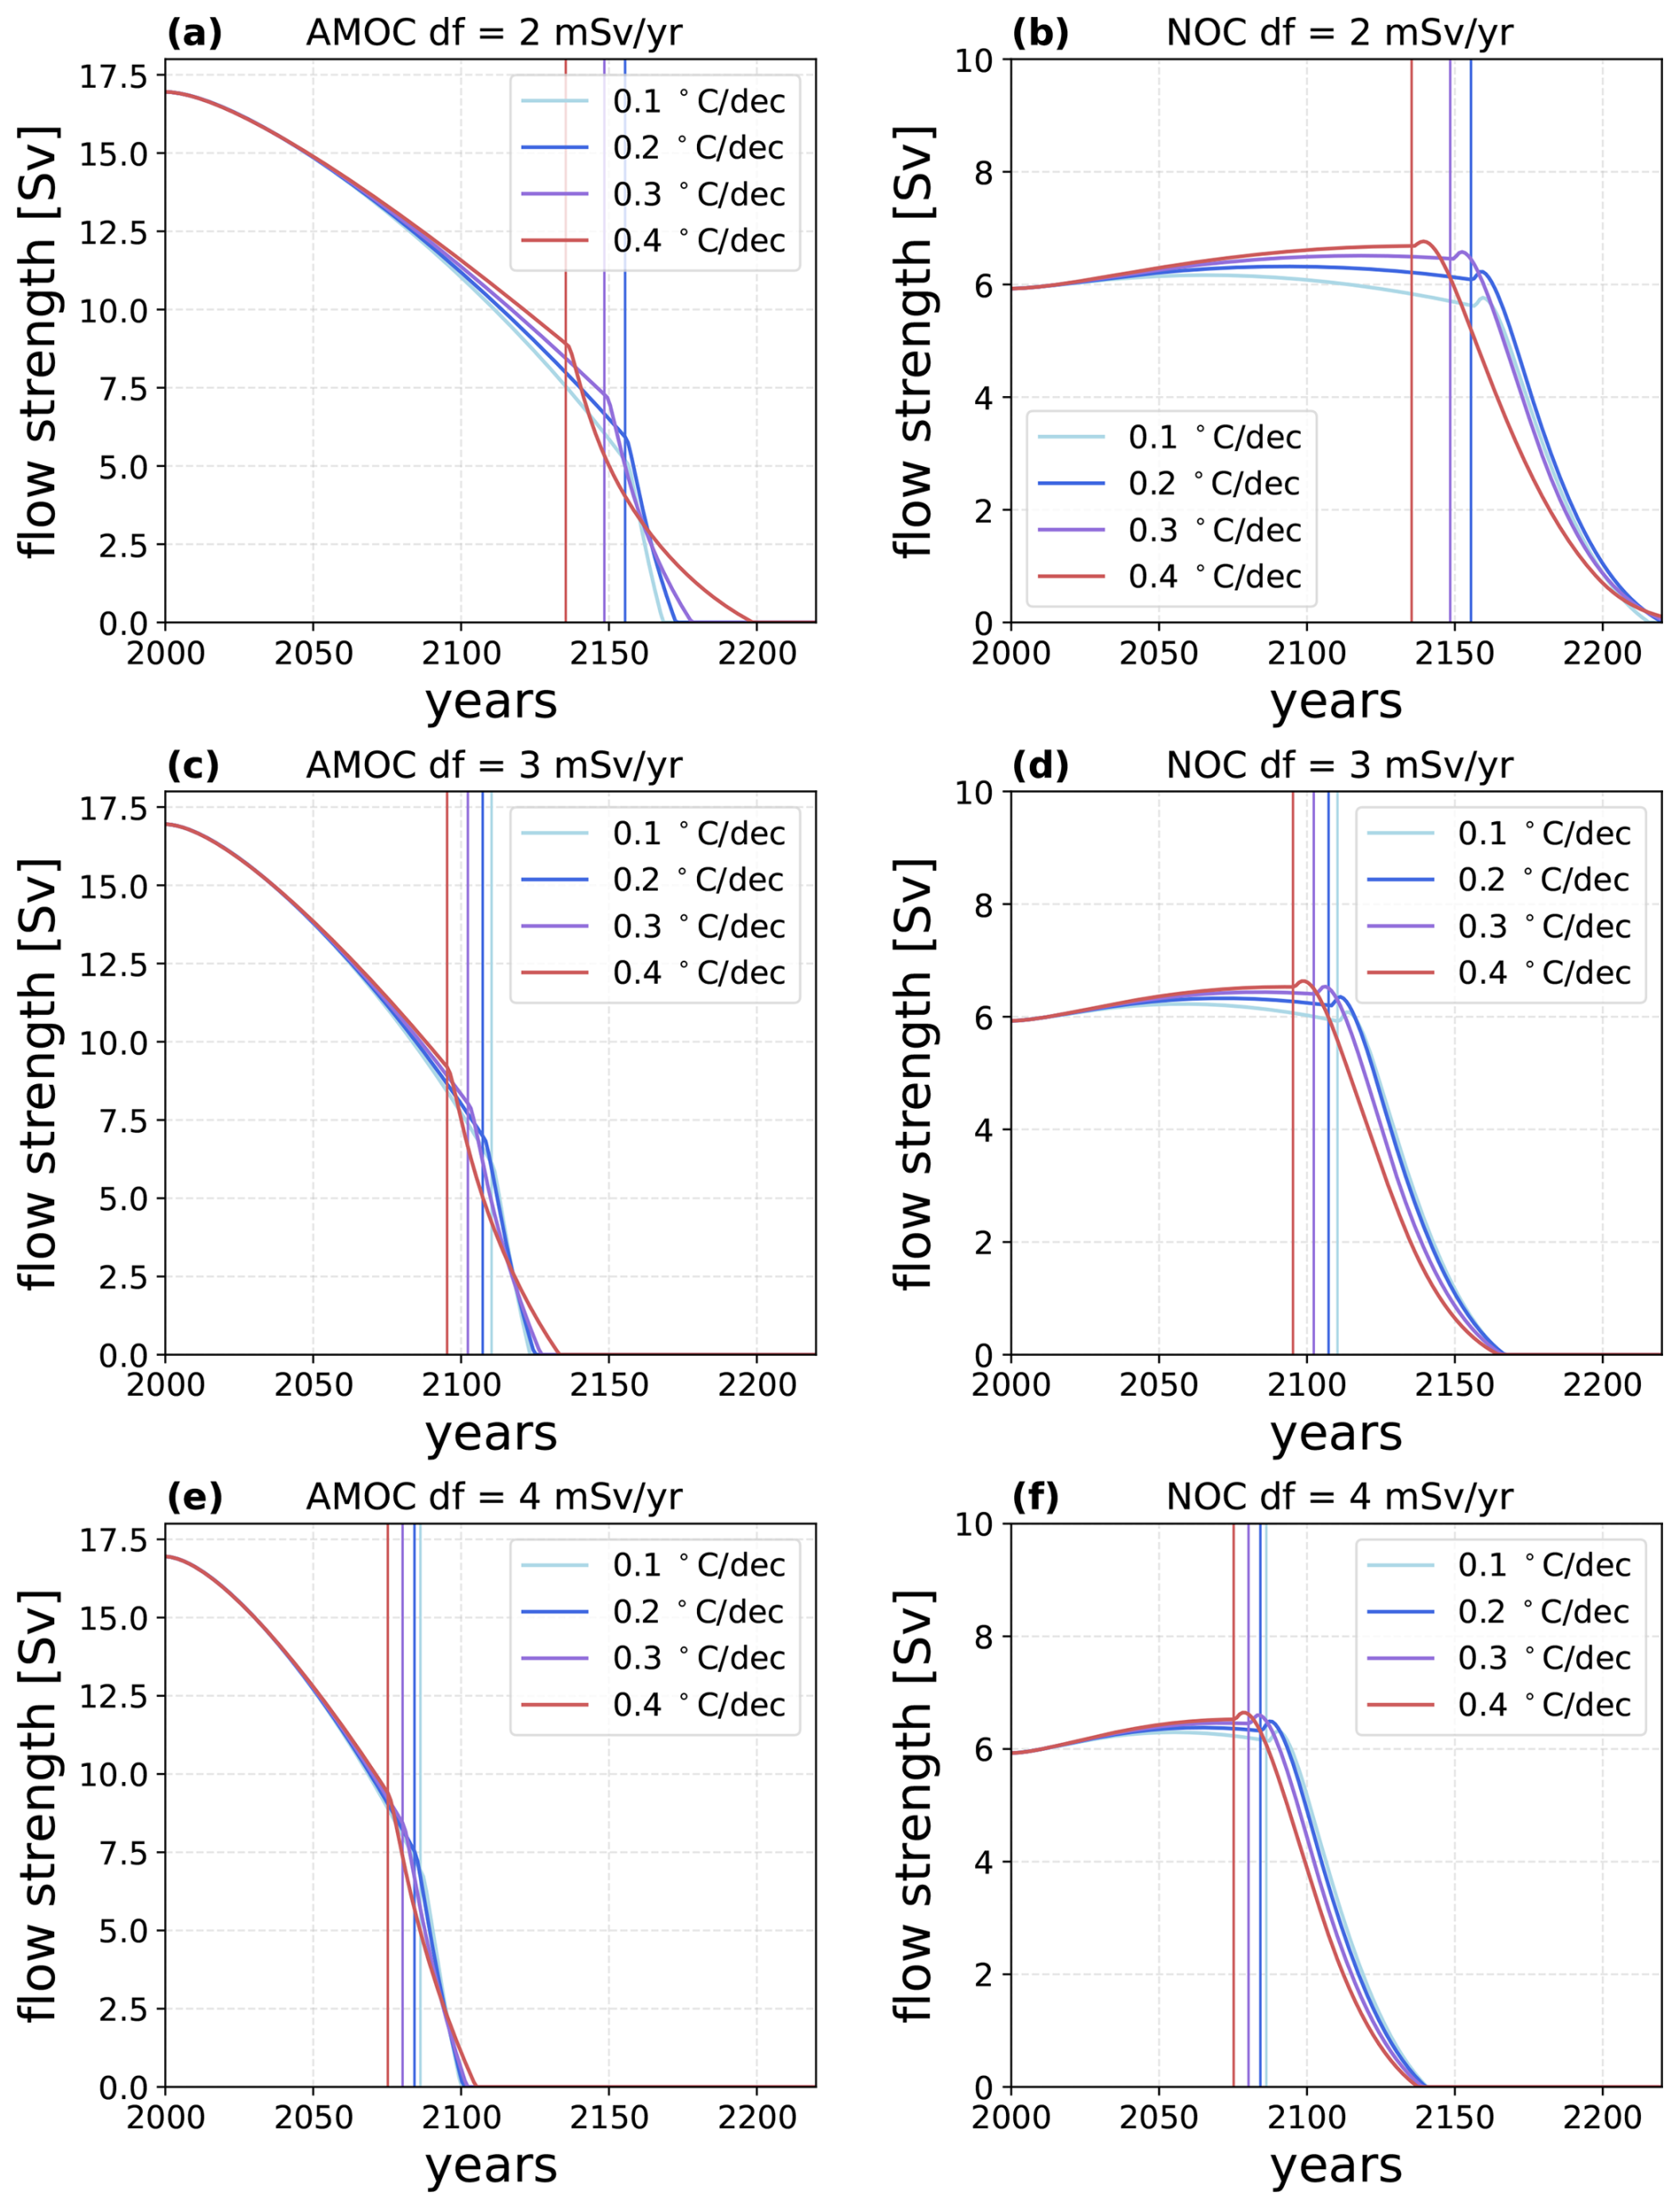
Figure 3Comparison of AMOC and NOC hysteresis for different hosing rates and global warming scenarios in the box model. Grey lines represent the time of convection shut down in the northern Atlantic (AMOC) and Nordic Seas (NOC).
The AMOC exhibits a non-linear response to freshwater hosing (Fig. 3a, c, e). The hosing rate determines the steepness of the trajectory while the imposed warming initiates earlier convection shutdown due to decreasing surface buoyancy. Under 2 mSv yr−1 of hosing and 0.1 °C per decade warming, convection ceases around year 2155 followed by a steep AMOC decline and final shutdown around 2170. For a warming rate of 0.4 °C per decade, however, convection already stops around 2130 – several decades earlier.
The increase in NOC as a response to a weakening AMOC is clearly visible in the box model and limited to about 1 Sv over 100 years (Fig. 3f), equivalent to a rate of 0.1 Sv per decade. This order of magnitude agrees well with climate model projections (Årthun et al., 2023). Even though the hosing still appears to be the dominant factor, the warming steepens the NOC's trajectory, due to the temperature difference between the northern Atlantic and the Nordic Seas. Warming impacts the density in the northern Atlantic more than in the Nordic Seas because of the temperature-dependent thermal expansion coefficient in the equation of state, causing a nonlinear response of density to temperature changes. This increases the density gradient between the two ocean basins.
Due to the weakening of the AMOC, more freshwater accumulates in the northern Atlantic, decreasing the surface density and continuing to steepen the density gradient between the Nordic Seas and the northern Atlantic. The contributions of AMOC weakening and freshwater hosing to the freshening are initially comparable. However, as the hosing intensifies, the AMOC contribution eventually levels off, because the growing salinity contrast between the North Atlantic and the tropics begins to compensate for the weakened circulation (Fig. B1). The freshening increases exchange between the northern Atlantic and Nordic Seas, causing the NOC to increase. This anticorrelation only breaks down when convection in the northern Atlantic shuts off because the freshwater at the surface layer can no longer be mixed downward at a sufficient rate. This causes more freshwater to be transported into the Nordic Seas via gyre transport and increased NOC, shutting down Nordic Sea convection in turn. This marks the crossing of the NOC's tipping point, which is followed by a steep decline in overturning strength. Additionally, we find that the decline of the AMOC is mitigated by an increase in NOC, as more cold, dense water is supplied to the northern Atlantic, counteracting the decrease in density.
To decompose the response of AMOC and NOC to the combined forcing, we conducted experiments with isolated global warming and hosing scenarios (Fig. 4). Under isolated global warming the AMOC initially stays stable, while the NOC shows an accelerating increase until 2050 after which the rate of increase stays constant. The temperature difference between the northern Atlantic and the Southern Ocean is not as large as between the northern Atlantic and Nordic Seas, which explains the weak change in AMOC strength, since the thermal expansion coefficient is similar in both boxes.
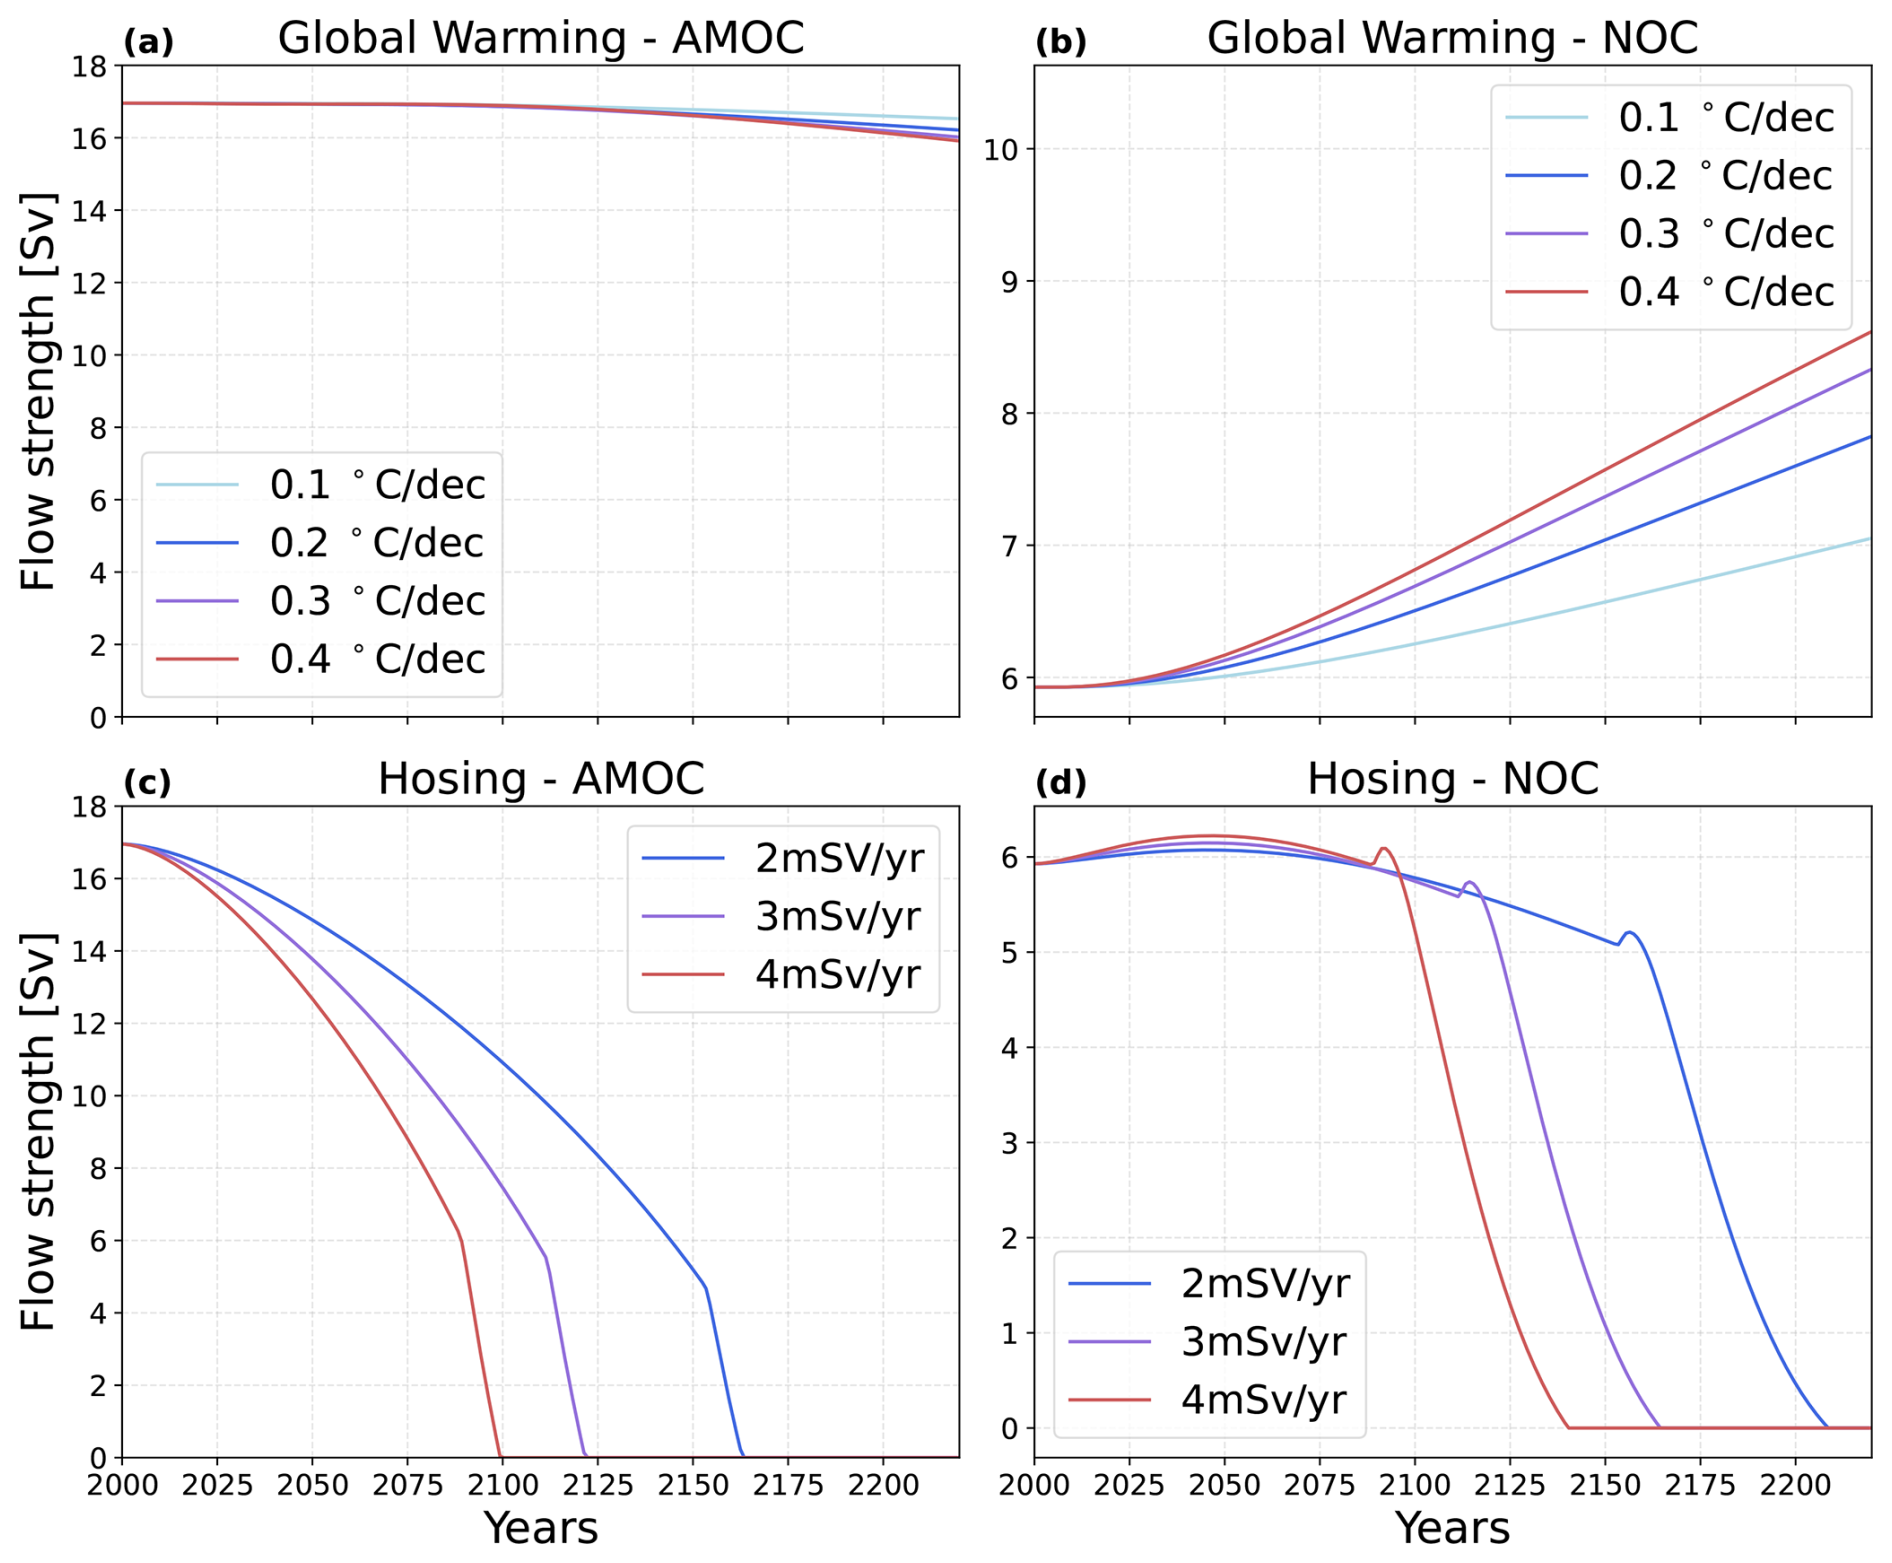
Figure 4(a) AMOC under global warming (b) NOC under global warming (c) AMOC under hosing (d) NOC under hosing.
Under hosing, the AMOC decreases steeply, while the NOC shows an increase in the short-term response due to the same mechanisms explained above, and then begins to decline around 2050 until convection shuts off and both currents cease. The decrease in NOC under isolated hosing, is explained by the continuous freshwater transport into the Nordic Seas via gyre transport and increased NOC which weakens the density gradient between the subpolar North Atlantic and Nordic Seas.
These results imply a short-term and long-term response under combined forcing: The short-term response of the current system is characterised by a negative feedback loop: Hosing weakens the AMOC by decreasing the water density in the northern Atlantic. This, in turn, increases the NOC and thus the transport of cold, dense water into the northern Atlantic which mitigates the AMOC's decline, but does not prevent it.
In the long term, warming delays the decline of the NOC (Fig. 4b), but accelerates the breakdown of convection (Fig. 3) which causes an earlier AMOC shut-down. For very high hosing rates, the distances between the break-off points begin to diminish. This is because the accumulation of freshwater is so strong that it outweighs the effect of increasing temperature (Fig. 3).
In order to compare with the box model results, we analyse density changes between the two forcing scenarios in CM2.6. The results in Fig. 5 support the findings of the box model by illustrating how the density gradients between the northern Atlantic and the Nordic Seas strengthen under elevated CO2 concentrations. The subpolar North Atlantic exhibits a pronounced density decrease, while the Nordic Seas show a localized density increase, particularly along the Greenland–Scotland Ridge and the western Nordic Seas. This pattern indicates that warming and freshening in the subpolar North Atlantic under increased CO2 reduce surface density there, whereas the Nordic Seas experience comparatively smaller density reductions or even densification, consistent with the nonlinear thermal response in the equation of state discussed earlier. The resulting enhanced meridional density gradient aligns with the box model mechanism, where a weakening AMOC and surface buoyancy changes drive increased Nordic Overturning (NOC). A latitude–depth cross-section of the red box in Fig. 5a, further highlights this contrast: the upper ocean in the subpolar North Atlantic becomes significantly lighter, while the intermediate and deep layers toward the Nordic Seas show minor density increases, pointing to shoaling of isopycnals in the subpolar region and deepening in the Nordic Seas. Together, these patterns confirm that under increased CO2, density-driven contrasts between the two basins intensify, as the box model predicts.
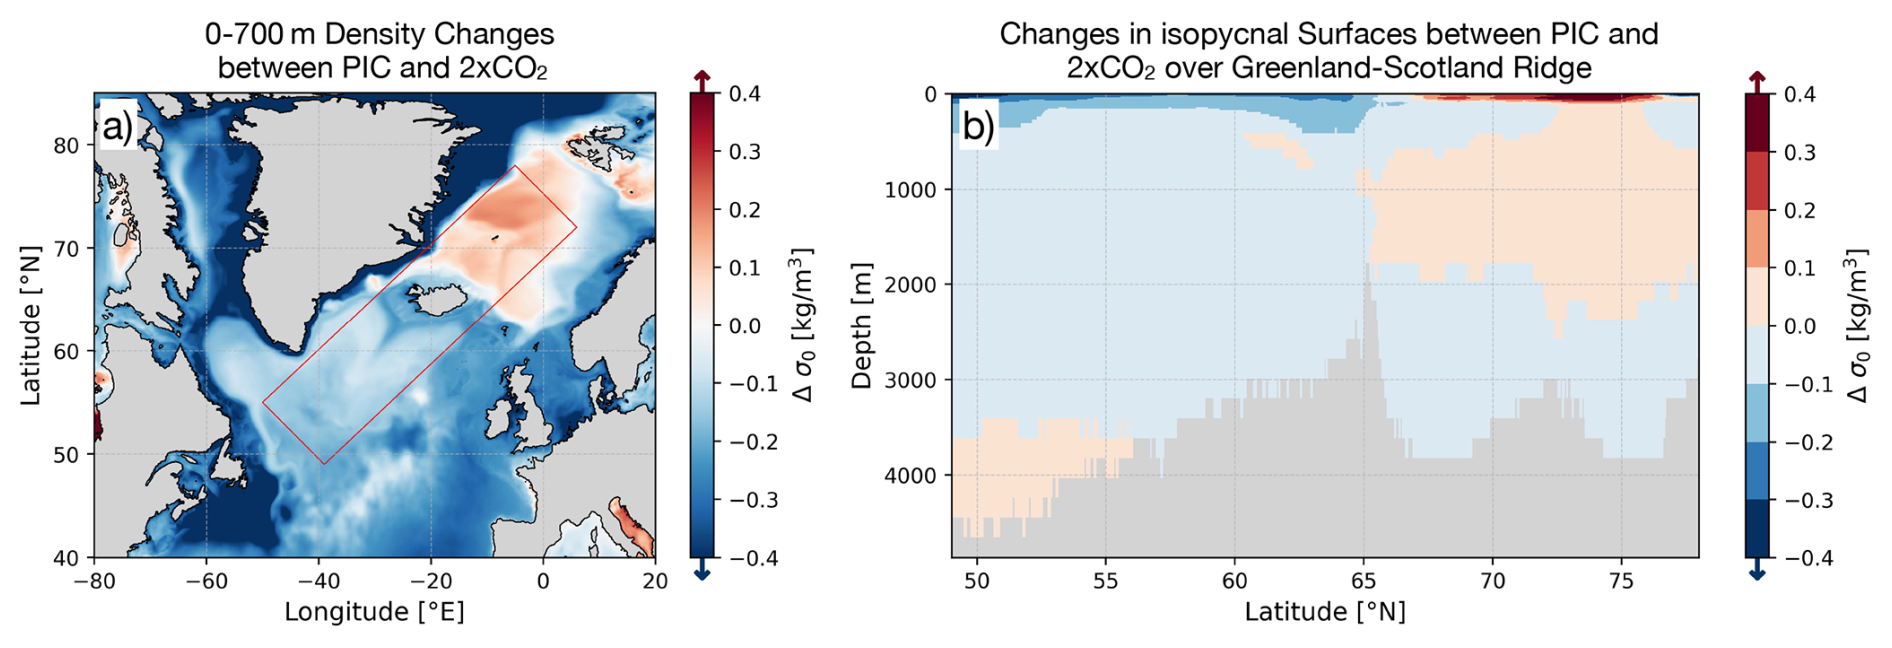
Figure 5Density changes under elevated atmospheric CO2 concentration averaged over 20 model years. Panel (a) is depicting density changes in the upper 700 m between the CM2.6 PIC run and the 2 × CO2 scenario. Panel (b) is showing the latitude-depth cross section of the red box in (a).
Our results showing a stable or slightly increasing NOC under warming conditions appear to be in agreement with observational data (Chafik et al., 2025; Larsen et al., 2024), alongside a future increase in NOC predicted in GCMs (Årthun et al., 2023). The density decline in the subpolar gyre in the CM2.6 model and the box model is consistent with the declining density since 1950 found there in observed data (Chafik et al., 2022), as well as with the fact that salinity there is now at its lowest in 120 years of measurements (Holliday et al., 2020). Li and Liu (2025) compare CMIP ensembles with and without a weakened AMOC and find that the warming hole in the subpolar North Atlantic is directly correlated with a weaker AMOC state; however, their Fig. 3 also reveals statistically significant warming in the Nordic Seas in models with a weakened AMOC. Our results indicate that the reason for this correlation is an increase in the meridional density gradient between the northern Atlantic and the Nordic Seas. In CM2.6 we observe an increase in heat transport towards the Nordic seas and the steepening of the North Atlantic-Nordic Seas density gradient. This is in line with the findings of Keil et al. (2020) who identified increased heat transport towards the Nordic Seas as one of the drivers of the North Atlantic Warming Hole.
Nonetheless, the CM2.6 results are based on a single realization, such that no formal uncertainty estimates or confidence intervals can be provided for the values reported in Tables 1–3. Internal climate variability, which is known to be substantial in the subpolar North Atlantic and the Nordic Seas, may therefore influence both the magnitude of the simulated heat transport changes and their decomposition into dynamic, thermodynamic, and nonlinear components. As a result, statements regarding the relative importance of individual processes should be interpreted as representative of the CM2.6 response rather than as statistically robust estimates of the forced signal. Nevertheless, the consistent dominance of circulation-driven contributions across regions and decomposition frameworks suggests that the underlying physical mechanism identified here is robust within this model configuration. Quantifying the spread of these responses and assessing their generality across models would require multi member ensembles or inter-model comparisons, which are left for future work.
Simple conceptual box models are not intended for quantitative predictions but rather to qualitatively examine basic physical mechanisms. The box model used in this study is simplified and several factors that contribute to the behaviour of the AMOC, Nordic Overturning, and convection, are not considered here. For example, the model lacks variations in surface heat and moisture fluxes due to both the seasonal cycle and internal climate variability even though both are important for the convective process. If convection is e.g. shut off due to increased surface heating, fresh water can accumulate at the convection site, inhibiting the re-initiation of deep mixing (Kuhlbrodt et al., 2001).
Another limitation of the box model is the way in which convection is parametrised. While the strength of convection scales with the temperature gradient between the surface and the deep water, it changes the temperature of the entire box, when in reality convection is localised and can vary in depth. The model can therefore not accurately represent how much exchange takes place between the surface and the deep water, potentially affecting the density gradient between the North Atlantic and Nordic Seas. The lack of localised convection might also lead to a premature shutdown of convection in our model: Once the surface water is lighter than the deep water, convection switches off. In reality, however, e.g. winds might trigger localised convection events that mix freshwater into the deep ocean and thus mitigate the surface freshening. Additionally, the gyre strengths in this model are constant as is the surface layer depth, which is of course not the case in the real world. Given that the gyre transport exhibits substantial decadal variability (Böning et al., 2006), and that its magnitude influences water-mass exchange between and transformation within the boxes (e.g. Årthun et al., 2023), both the strength of the AMOC and the timing of convection shutdown may be affected by this variability, which is itself modulated by the North Atlantic Oscillation (NAO) (Böning et al., 2006). Potential impacts of AMOC/NOC changes on the NAO, and consequently the gyre transport are not accounted for in this analysis. Nevertheless, such feedbacks would likely not impact the link between AMOC and NOC discussed here.
The box model also assumes fixed domains (regions), implying that convection and overturning are not allowed to move geographically. It has, for example, been shown that reduced overturning in the Nordic Seas can be compensated by increased overturning in the Arctic Ocean (Bretones et al., 2022; Årthun et al., 2025). This process could add resilience to the northern overturning circulation, but would, however, likely not alter the fundamental mechanism discussed here (i.e., the link between AMOC and NOC) in the long term.
Finally, our box model does not consider other ocean basins. While it has been shown by Wood et al. (2019) that the hosing rate needed to switch off the AMOC is sensitive to the gyre transport from the Indo-Pacific thermocline into the Southern Ocean, this does not impact the fundamental relationship between the AMOC and NOC we describe in our results, only potentially impacting where the tipping point due to hosing lies.
This study aims to investigate the increase of heat transport into the Nordic Seas and overturning, and its possible connection to a weakening AMOC under global warming conditions. Results from the high resolution climate model CM2.6 suggest that the surface cooling in the northern Atlantic is primarily caused by a weakening of the AMOC and an associated reduction in northward heat transport. However, overturning in the Nordic Seas also transports more heat northward, driving positive SST anomalies there. Our box model suggests that this increase in OHT into the Nordic Seas is driven by increased Nordic overturning linked to the weakening of the AMOC. We compare different hosing rates ranging from 2 to 4 mSv yr−1 and global warming scenarios from 0.1 to 0.4 °C per decade, both separately and in combination, to investigate the impact of increased freshwater forcing and global warming on the AMOC-NOC current system. When combined, the stability of the system is determined primarily by the freshwater flux, with the temperature forcing determining only the timing of the tipping. In the first 50 years, the increased freshwater input weakens the AMOC, leading to freshwater accumulation in the northern Atlantic and an increase in the density gradient between the Nordic Seas and the northern Atlantic, strengthening the NOC. In the long-term (>50 years), the NOC might continue to strengthen (Fig. 3) because the response to an increase in temperature (Fig. 4b) counteracts the weakening of the NOC by freshening of the Nordic Seas due to gyre transport and enhanced NOC (Fig. 4c). The anticorrelation between AMOC and NOC only stops when convection breaks down (Fig. 3), leading to rapid freshwater accumulation in both ocean surfaces and thus to a breakdown of AMOC and NOC.
In summary, we propose a mechanism that links the strength and stability of NOC and AMOC via the density gradient between the subpolar North Atlantic and Nordic seas. Initially, the NOC is strengthened by an increased meridional density gradient due to warming, and a freshening of the northern Atlantic caused by an AMOC slow-down until both currents collapse following the shutdown of convection. The stronger NOC causes an enhanced heat transport into the Nordic Seas, which potentially explains the positive Nordic Seas SST trend observed over the last century by e.g. Caesar et al. (2018). This implies that the future increase in Nordic Overturning might be a direct effect of the AMOC weakening and that the AMOC-NOC system could potentially be steering towards a shutdown of convection.
with
and
where Di is the depth of box i. All surface boxes have a depth of 100 m. This depth is chosen according to the MLD in the Labrador Sea without convection (Gillard et al., 2022).
The figure shows the freshening contributions of AMOC (fMOC) and hosing to the North Atlantic (boxes 2 and 5). The AMOC's contribution was calculated by subtracting the AMOC contribution to the salinity equations during the combined hosing-warming experiments from the AMOC contribution in equilibrium without hosing and global warming:
where
according to Eqs. (A11) and (A14). In the beginning, the AMOC's contribution to the freshening is the same as that of the hosing, but as the hosing strengthens, the salinity difference between the North Atlantic and the Tropics increases, counteracting the weakening of the AMOC. Once convection breaks down, the salinity in the North Atlantic decreases so fast that fAMOC becomes negative.
The AMOC response to elevated CO2 forcing in CM2.6 is characterized by a significant weakening at both 26 and 45° N relative to PIC (Fig. C1). Concurrently, the NOC shows no comparable decline. The vertical structure reveals that the weakening at mid-latitudes is primarily associated with a reduction in upper-to mid-depth overturning.
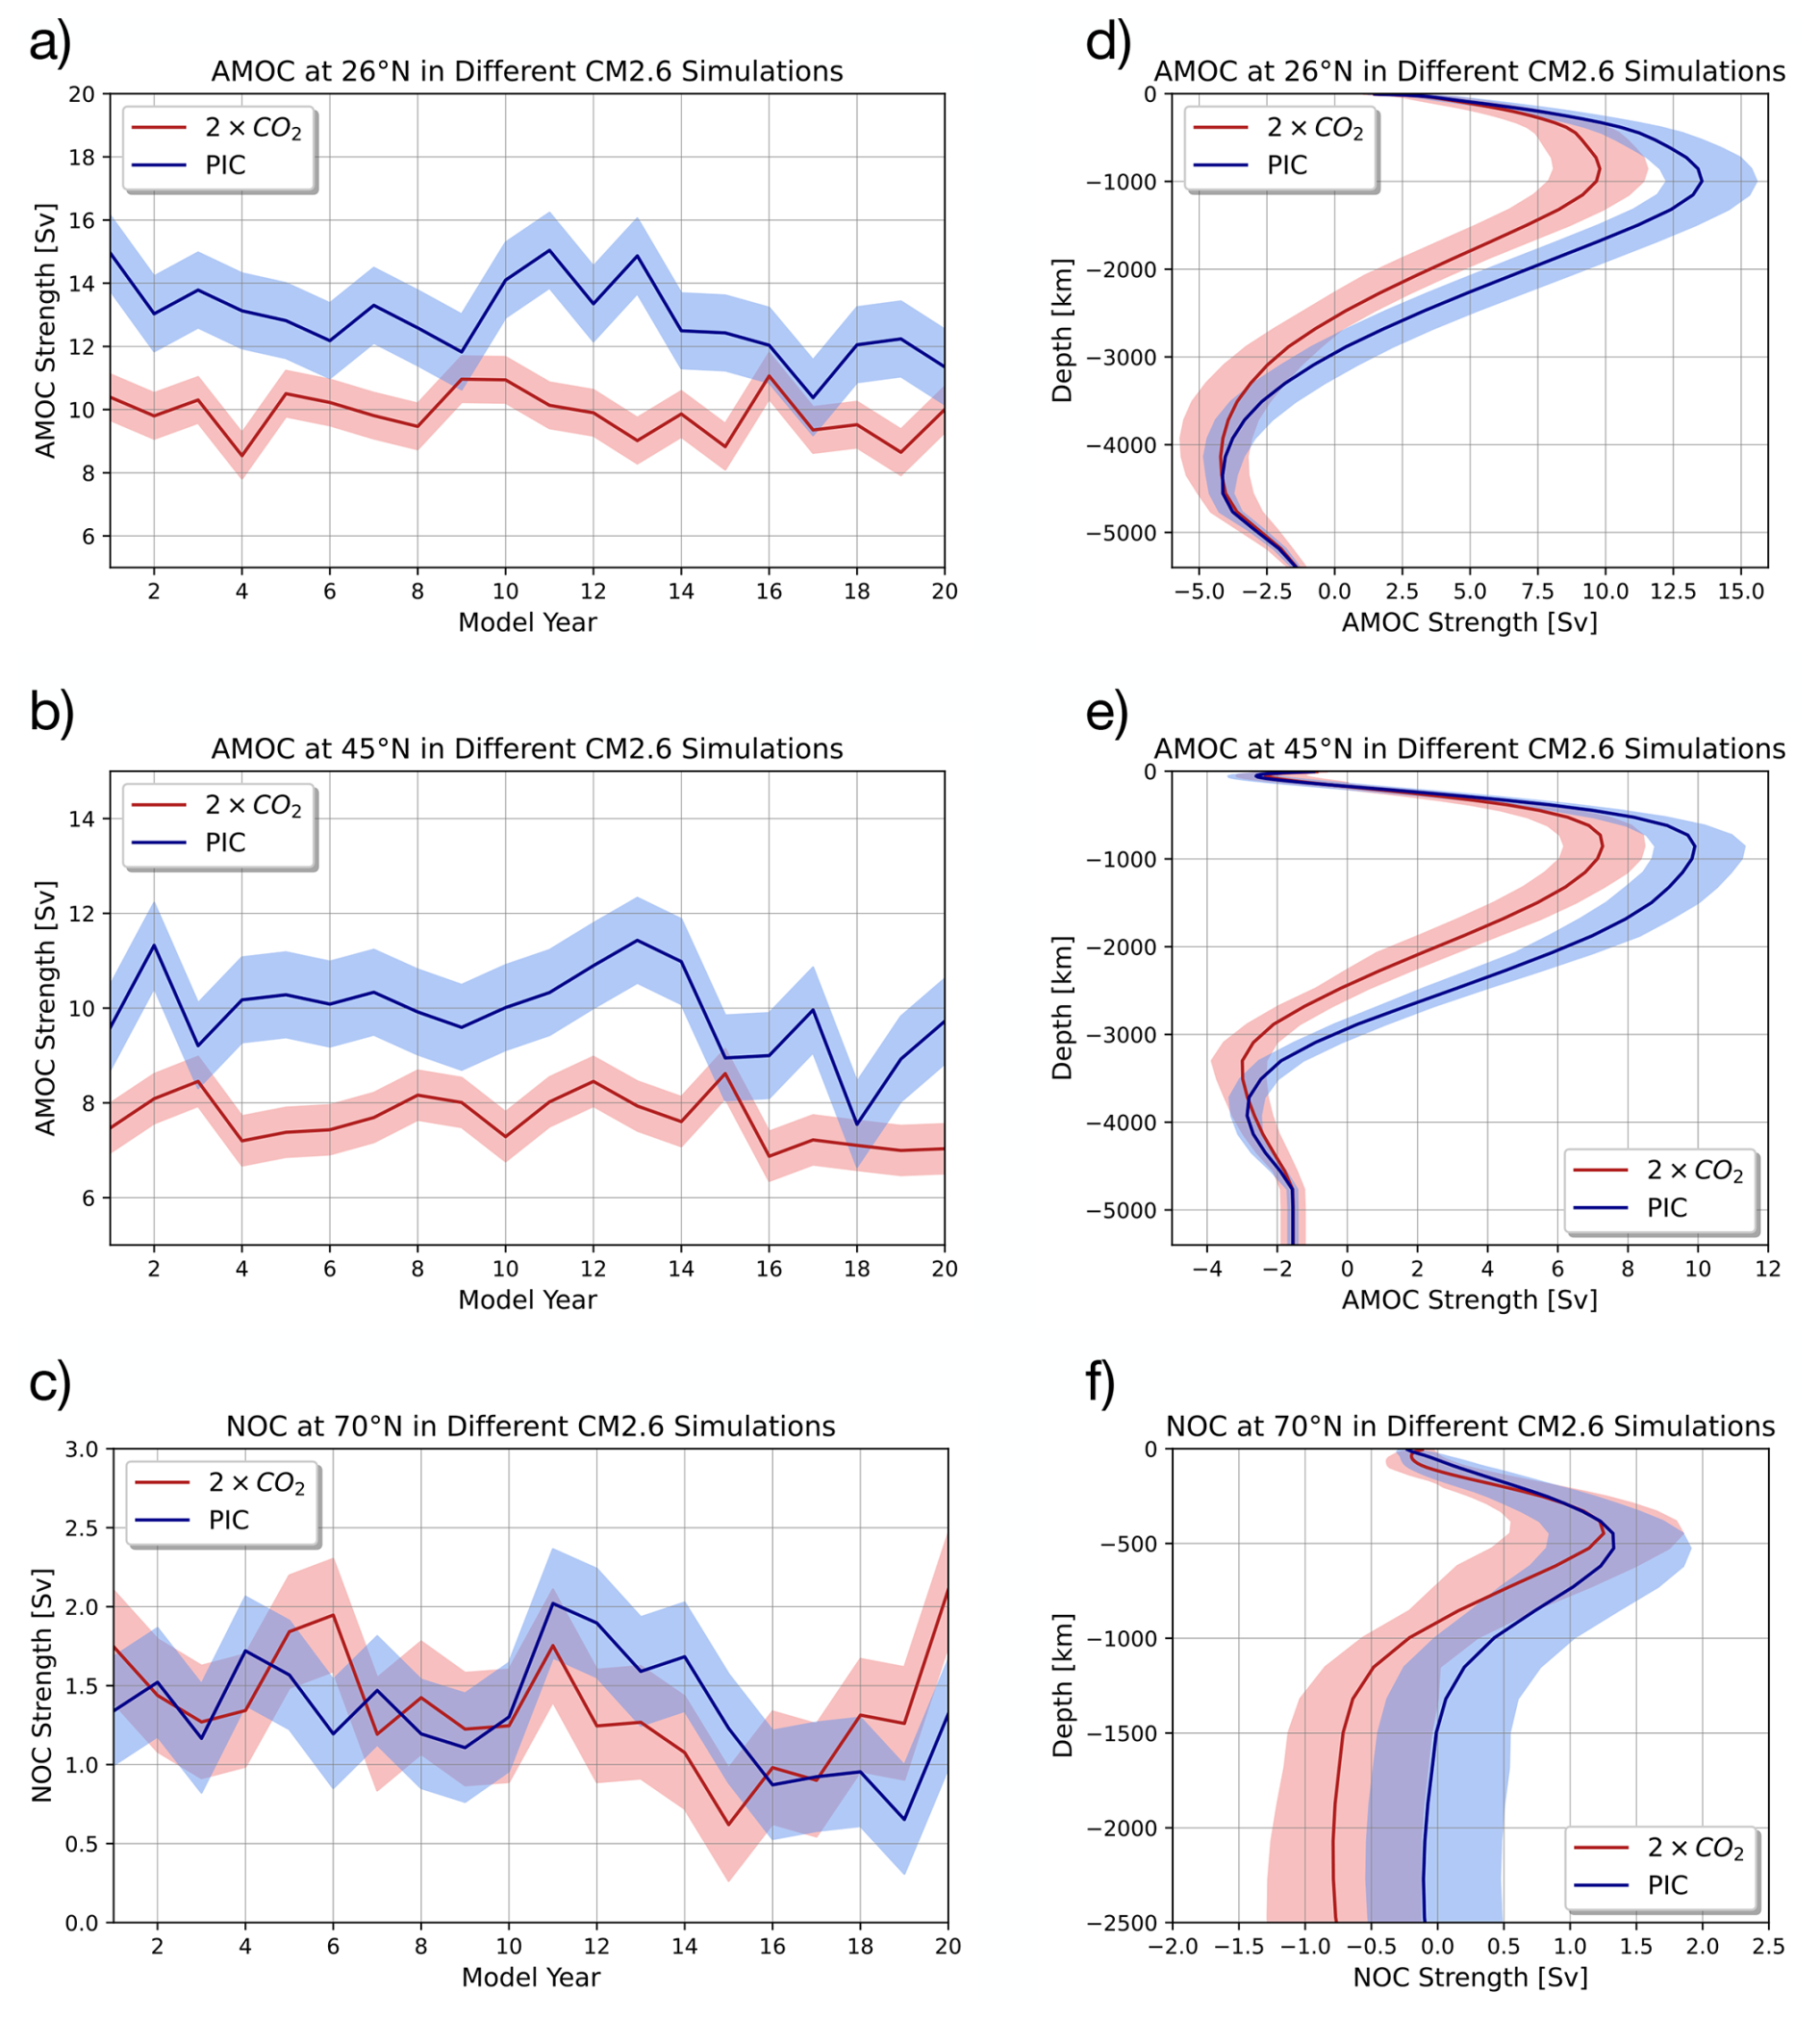
Figure C1We show the AMOC at 26 and 45° N, together with Nordic Seas overturning (NOC) estimates at 70° N. Panels (a)–(c) display annual mean time series for the last 20 years of the CM2.6 pre-industrial control (PIC) and 2 × CO2 simulations, while (d)–(f) show the corresponding overturning estimates at different depth levels (shading represents ±1 standard deviation).
The preindustrial control (PIC) simulation exhibits March mixed layer depths exceeding 2000–3000 m in the Labrador Sea and parts of the Nordic Seas (Fig. C2a). Under CO2 doubling (2 × CO2), the Labrador Sea remains a site of deep mixing, with the extent and intensity reducing relative to the control simulation. In contrast, parts of the Nordic Seas show localized deepening (Fig. C2b). The anomaly field (2 × CO2 − PIC) highlights this dipole-like response: pronounced shoaling in the Labrador Sea and subpolar western North Atlantic, accompanied by regional deepening in the eastern Nordic Seas (Fig. C2c).
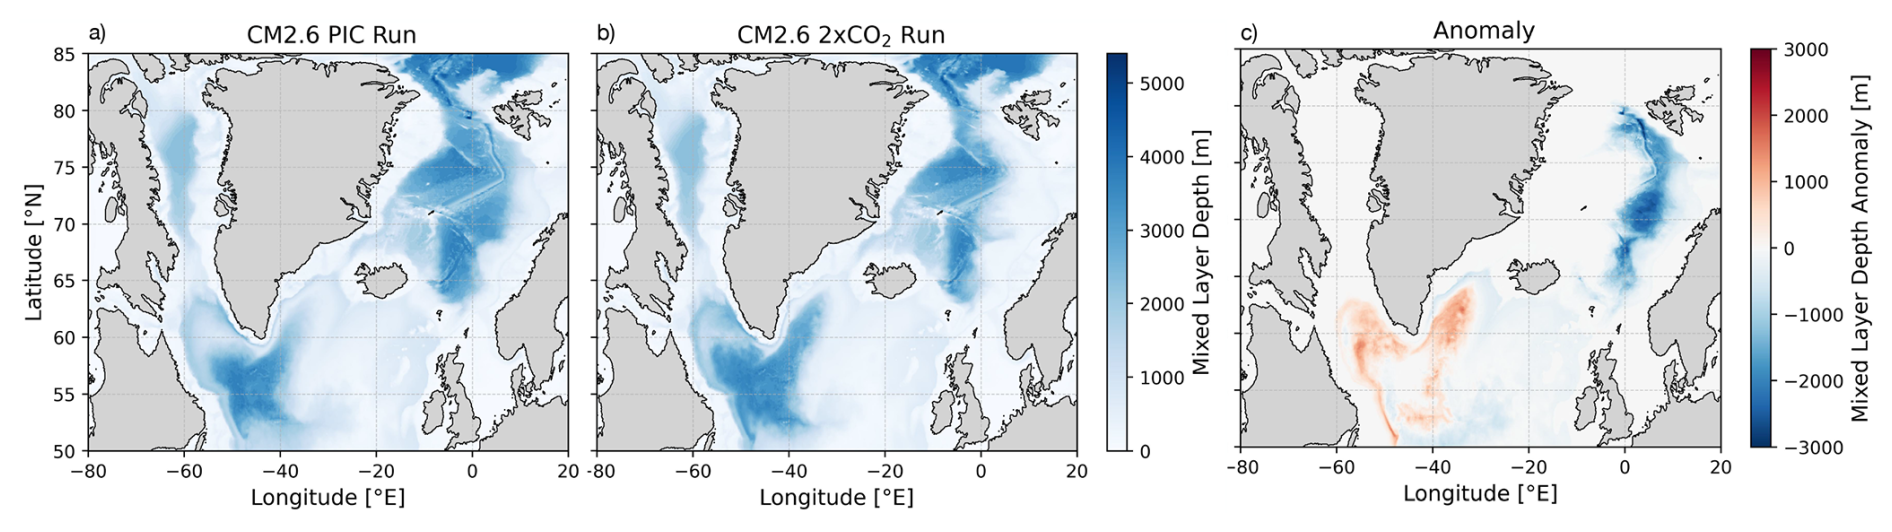
Figure C2We show 20-year mean March mixed layer depth (MLD) from the (a) preindustrial control (PIC) simulation as well as (b) the 2 × CO2 experiment. (c) shows the anomaly in March MLD, computed as the difference between the 2 × CO2 and PIC simulations. MLD and the respective anomalies are shown in meters (m).
The code for the box model, Figs. 1, 3 & 4, as well as for the spatial averaging (including all data) is available under: https://doi.org/10.5281/zenodo.19589770 (Roewer, 2026). The utilised CM2.6 model output is available from L.F. (lukas.fiedler@uni-hamburg.de) upon reasonable request. Scripts for analysing CM2.6 model output are available from L.F. (lukas.fiedler@uni-hamburg.de) upon reasonable request. WOA23 datasets are available at https://doi.org/10.25923/54bh-1613 (Temperature, Locarnini et al., 2024) and https://doi.org/10.25923/70qt-9574 (Salinity, Reagan et al., 2024b).
Sasha R. conducted the box model simulation and analysis and wrote the manuscript with help from all co-authors. L.F. conducted the CMIP2.6 heat transport analysis and wrote the pursuant results. M.Å. contributed knowledge on the Nordic Seas and wrote a part of the introduction, also contributing to the refinement of the manuscript. W.H. helped refine and structure the manuscript. Stefan R. conceived of and supervised the project, also contributing to the analysis of the heat transport and box model results, and writing of the manuscript.
The contact author has declared that none of the authors has any competing interests.
Publisher's note: Copernicus Publications remains neutral with regard to jurisdictional claims made in the text, published maps, institutional affiliations, or any other geographical representation in this paper. The authors bear the ultimate responsibility for providing appropriate place names. Views expressed in the text are those of the authors and do not necessarily reflect the views of the publisher.
The Authors acknowledge the generosity of NOAA/GFDL in supplying the CM2.6 model output. For the analysis of the CM2.6 model output, we acknowledge the usage of the Python packages shapely (Gillies, 2013) and xarray (Hoyer and Hamman, 2017).
Willem Huiskamp is part of PIK's Planetary Boundaries Science Lab and is funded by Virgin Unite. Marius Årtun was funded by the Research Council of Norway project Overturning circulation in the new Arctic (Grant 335255).
The article processing charges for this open-access publication were covered by the Potsdam Institute for Climate Impact Research (PIK).
This paper was edited by Sjoerd Groeskamp and reviewed by two anonymous referees.
Årthun, M.: Surface-Forced Variability in the Nordic Seas Overturning Circulation and Overflows, Geophys. Res. Lett., 50, e2023GL104158, https://doi.org/10.1029/2023GL104158, 2023. a
Årthun, M., Asbjørnsen, H., Chafik, L., Johnson, H. L., and Våge, K.: Future strengthening of the Nordic Seas overturning circulation, Nat. Commun., 14, 2065, https://doi.org/10.1038/s41467-023-37846-6, 2023. a, b, c, d
Årthun, M., Brakstad, A., Dörr, J., Johnson, H. L., Mans, C., Semper, S., and Våge, K.: Atlantification drives recent strengthening of the Arctic overturning circulation, Sci. Adv., 11, eadu1794, https://doi.org/10.1126/sciadv.adu1794, 2025. a
Berk, J. van den, Drijfhout, S. S., and Hazeleger, W.: Circulation adjustment in the Arctic and Atlantic in response to Greenland and Antarctic mass loss, Clim. Dynam., 57, 1689–1707, https://doi.org/10.1007/s00382-021-05755-3, 2021. a
Böning, C. W., Scheinert, M., Dengg, J., Biastoch, A., and Funk, A.: Decadal variability of subpolar gyre transport and its reverberation in the North Atlantic overturning, Geophys. Res. Lett., 33, https://doi.org/10.1029/2006GL026906, 2006. a, b
Bony, S., Dufresne, J.-L., Treut, H. L., Morcrette, J.-J., and Senior, C.: On dynamic and thermodynamic components of cloud changes, Clim. Dynam., 22, 71–86, https://doi.org/10.1007/s00382-003-0369-6, 2004. a
Bosse, A., Fer, I., Søiland, H., and Rossby, T.: Atlantic water transformation along its poleward pathway across the Nordic Seas, J. Geophys. Res.-Oceans, 123, 6428–6448, https://doi.org/10.1029/2018JC014147, 2018. a
Brakstad, A., Gebbie, G., Våge, K., Jeansson, E., and Ólafsdóttir, S. R.: Formation and pathways of dense water in the Nordic Seas based on a regional inversion, Prog. Oceanogr., 212, 102981, https://doi.org/10.1016/j.pocean.2023.102981, 2023. a
Bretones, A., Nisancioglu, K. H., Jensen, M. F., Brakstad, A., and Yang, S.: Transient Increase in Arctic Deep-Water Formation and Ocean Circulation under Sea Ice Retreat, J. Climate, 35, 109–124, https://doi.org/10.1175/JCLI-D-21-0152.1, 2022. a
Bryan, K.: Poleward Heat Transport by the Ocean: Observations and Models, Annu. Rev. Earth Pl. Sc., 10, 15–38, https://doi.org/10.1146/annurev.ea.10.050182.000311, 1982. a
Bryden, H. L. and Imawaki, S.: Ocean heat transport, Int. Geophys., 77, 455–474, 2001. a, b
Caesar, L., Rahmstorf, S., Robinson, A., Feulner, G., and Saba, V.: Observed fingerprint of a weakening Atlantic Ocean overturning circulation, Nature, 556, 191–196, https://doi.org/10.1038/s41586-018-0006-5, 2018. a, b, c
Caesar, L., McCarthy, G. D., Thornalley, D. J. R., Cahill, N., and Rahmstorf, S.: Current Atlantic Meridional Overturning Circulation Weakest in Last Millennium, Nat. Geosci., 14, 118–120, https://doi.org/10.1038/s41561-021-00699-z, 2021. a
Chafik, L., Holliday, N. P., Bacon, S., and Rossby, T.: Irminger Sea Is the Center of Action for Subpolar AMOC Variability, Geophys. Res. Lett., 49, https://doi.org/10.1029/2022GL099133, 2022. a, b
Chafik, L., Årthun, M., Langehaug, H. R., Nilsson, J., and Rossby, T.: The Nordic Seas overturning is modulated by northward-propagating thermohaline anomalies, Commun. Earth Environ., 6, 573, https://doi.org/10.1038/s43247-025-02557-x, 2025. a, b, c
Chemke, R., Zanna, L., and Polvani, L. M.: Identifying a Human Signal in the North Atlantic Warming Hole, Nat. Commun., 11, 1540, https://doi.org/10.1038/s41467-020-15285-x, 2020. a
Copernicus Climate Change Service: ORAS5 global ocean reanalysis monthly data from 1958 to present, Copernicus Climate Change Service (C3S) Climate Data Store (CDS), https://doi.org/10.24381/cds.67e8eeb7, 2021. a
Dagan, G., Stier, P., and Watson-Parris, D.: Aerosol Forcing Masks and Delays the Formation of the North Atlantic Warming Hole by Three Decades, Geophys. Res. Lett., 47, e2020GL090778, https://doi.org/10.1029/2020GL090778, 2020. a
Decuypère, M., Tremblay, L. B., and Dufour, C. O.: Impact of Ocean Heat transport on Arctic Sea Ice variability in the GFDL CM2-O model suite, J. Geophys. Res.-Oceans, 127, e2021JC017762, https://doi.org/10.1029/2021JC017762, 2022. a
Delworth, T. L., Rosati, A., Anderson, W., Adcroft, A. J., Balaji, V., Benson, R., Dixon, K., Griffies, S. M., Lee, H.-C., Pacanowski, R. C., Vecchi, G. A., Wittenberg, A. T., Zeng, F., and Zhang, R.: Simulated climate and climate change in the GFDL CM2.5 high-resolution coupled climate model, J. Climate, 25, 2755–2781, https://doi.org/10.1175/JCLI-D-11-00316.1, 2012. a, b
Diamond, R., Sime, L. C., Schroeder, D., Jackson, L. C., Holland, P. R., Alastrué de Asenjo, E., Bellomo, K., Danabasoglu, G., Hu, A., Jungclaus, J., Montoya, M., Meccia, V. L., Saenko, O. A., and Swingedouw, D.: A weakened AMOC could cause Southern Ocean temperature and sea-ice change on multidecadal timescales, J. Geophys. Res.-Oceans, 130, e2024JC022027, https://doi.org/10.1029/2024JC022027, 2025. a
Dickson, R. R. and Brown, J.: The production of North Atlantic Deep Water: Sources, rates, and pathways, J. Geophys. Res.-Oceans, 99, 12319–12341, https://doi.org/10.1029/94JC00530, 1994. a, b
Dima, M. and Lohmann, G.: Evidence for Two Distinct Modes of Large-Scale Ocean Circulation Changes over the Last Century, J. Climate, 23, 5–16, https://doi.org/10.1175/2009JCLI2867.1, 2010. a
Drijfhout, S., van Oldenborgh, G. J., and Cimatoribus, A.: Is a Decline of AMOC Causing the Warming Hole above the North Atlantic in Observed and Modeled Warming Patterns?, J. Climate, 25, 8373–8379, https://doi.org/10.1175/JCLI-D-12-00490.1, 2012. a
Drijfhout, S., Angevaare, J. R., Mecking, J., van Westen, R. M., and Rahmstorf, S.: Shutdown of northern Atlantic overturning after 2100 following deep mixing collapse in CMIP6 projections, Environ. Res. Lett., 20, 094062, https://doi.org/10.1088/1748-9326/adfa3b, 2025. a, b
Dörr, J., Årthun, M., Eldevik, T., and Sandø, A. B.: Expanding influence of Atlantic and Pacific Ocean heat transport on winter sea-ice variability in a warming Arctic, J. Geophys. Res.-Oceans, 129, e2023JC019900, https://doi.org/10.1029/2023JC019900, 2024. a
Fröhle, J., Handmann, P. V. K., and Biastoch, A.: Major sources of North Atlantic Deep Water in the subpolar North Atlantic from Lagrangian analyses in an eddy-rich ocean model, Ocean Sci., 18, 1431–1450, https://doi.org/10.5194/os-18-1431-2022, 2022. a
Gillard, L. C., Pennelly, C., Johnson, H. L., and Myers, P. G.: The Effects of Atmospheric and Lateral Buoyancy Fluxes on Labrador Sea Mixed Layer Depth, Ocean Model., 171, 101974, https://doi.org/10.1016/j.ocemod.2022.101974, 2022. a
Gillies, S: The shapely user manual, https://pypi.org/project/Shapely (last access: 15 April 2026), 2013. a
Gou, R., Lohmann, G., and Wu, L.: Atlantic Meridional Overturning Circulation Decline: Tipping Small Scales under Global Warming, Phys. Rev. Lett., 133, 034201, https://doi.org/10.1103/PhysRevLett.133.034201, 2024. a
Gregory, J. M., Dixon, K. W., Stouffer, R. J., Weaver, A. J., Driesschaert, E., Eby, M., Fichefet, T., Hasumi, H., Hu, A., Jungclaus, J. H., Kamenkovich, I. V., Levermann, A., Montoya, M., Murakami, S., Nawrath, S., Oka, A., Sokolov, A. P., and Thorpe, R. B.: A model intercomparison of changes in the Atlantic thermohaline circulation in response to increasing atmospheric CO2 concentration, Geophys. Res. Lett., 32, https://doi.org/10.1029/2005GL023209, 2005. a
Griffies, S. M., Winton, M., Anderson, W. G., Benson, R., Delworth, T. L., Dufour, C. O., Dunne, J. P., Goddard, P., Morrison, A. K., Rosati, A., Wittenberg, A. T., Yin, J., and Zhang, R.: Impacts on ocean heat from transient mesoscale eddies in a hierarchy of climate models, J. Climate, 28, 952–977, https://doi.org/10.1175/JCLI-D-14-00353.1, 2015. a, b
Hansen, B. and Østerhus, S.: North Atlantic–Nordic Seas exchanges, Prog. Oceanogr., 45, 109–208, 2000. a, b
Holliday, N. P., Bersch, M., Berx, B., Chafik, L., Cunningham, S., Florindo-López, C., Hátún, H., Johns, W., Josey, S. A., Larsen, K. M. H., Mulet, S., Oltmanns, M., Reverdin, G., Rossby, T., Thierry, V., Valdimarsson, H., and Yashayaev, I.: Ocean circulation causes the largest freshening event for 120 years in eastern subpolar North Atlantic, Nat. Commun., 11, 585, https://doi.org/10.1038/s41467-020-14474-y, 2020. a
Hoyer, S. and Hamman, J.: xarray: N-D labeled arrays and datasets in Python, J. Open Res. Softw., 5, https://doi.org/10.5334/jors.148, 2017. a
Huang, J., Pickart, R. S., Huang, R. X., Lin, P., Brakstad, A., and Xu, F.: Sources and upstream pathways of the densest overflow water in the Nordic Seas, Nat. Commun., 11, 5389, https://doi.org/10.1038/s41467-020-19143-8, 2020. a
Jackson, L. C., Kahana, R., Graham, T., Ringer, M., A., Woollings, T., Mecking, J. V., and Wood, R., A.: Global and European climate impacts of a slowdown of the AMOC in a high resolution GCM, Clim. Dynam., 45, 3299–3316, https://doi.org/10.1007/s00382-015-2540-2, 2015. a
Jackson, L. C., Alastrué de Asenjo, E., Bellomo, K., Danabasoglu, G., Haak, H., Hu, A., Jungclaus, J., Lee, W., Meccia, V. L., Saenko, O., Shao, A., and Swingedouw, D.: Understanding AMOC stability: the North Atlantic Hosing Model Intercomparison Project, Geosci. Model Dev., 16, 1975–1995, https://doi.org/10.5194/gmd-16-1975-2023, 2023. a
Josey, S. A. and Marsh, R.: Surface freshwater flux variability and recent freshening of the North Atlantic in the eastern subpolar gyre, J. Geophys. Res.-Oceans, 110, https://doi.org/10.1029/2004JC002521, 2005. a
Keil, P., Mauritsen, T., Jungclaus, J., Hedemann, C., Olonscheck, D., and Ghosh, R.: Multiple drivers of the North Atlantic warming hole, Nat. Clim. Change, 10, 667–671, https://doi.org/10.1038/s41558-020-0819-8, 2020. a
Kuhlbrodt, T., Titz, S., Feudel, U., and Rahmstorf, S.: A simple model of seasonal open ocean convection, Ocean Dynam., 52, 36–49, https://doi.org/10.1007/s10236-001-8175-3, 2001. a
Kuhlbrodt, T., Griesel, A., Montoya, M., Levermann, A., Hofmann, M., and Rahmstorf, S.: On the driving processes of the Atlantic meridional overturning circulation, Rev. Geophys., 45, https://doi.org/10.1029/2004RG000166, 2007. a
Larsen, K. M. H., Hansen, B., Hátún, H., Johansen, G. E., Østerhus, S., and Olsen, S. M.: The Coldest and Densest Overflow Branch Into the North Atlantic is Stable in Transport, But Warming, Geophys. Res. Lett., 51, e2024GL110097, https://doi.org/10.1029/2024GL110097, 2024. a, b
Latif, M., Sun, J., Visbeck, M., and Bordbar, M., H.: Natural variability has dominated Atlantic Meridional Overturning Circulation since 1900, Nat. Clim. Change, 12, 455–460, https://doi.org/10.1038/s41558-022-01342-4, 2022. a
Levermann, A., Griesel, A., Hofmann, M., Montoya, M., and Rahmstorf, S.: Dynamic sea level changes following changes in the thermohaline circulation, Clim. Dynam., 24, 347–354, 2005. a
Li, K. Y. and Liu, W.: Weakened Atlantic Meridional Overturning Circulation Causes the Historical North Atlantic Warming Hole, Commun. Earth Environ., 6, 416, https://doi.org/10.1038/s43247-025-02403-0, 2025. a, b
Locarnini, R. A., Mishonov, A. V., Baranova, O. K., Reagan, J. R., Boyer, T. P., Seidov, D., Wang, Z., Garcia, H. E., Bouchard, C., Cross, S. L., Paver, C. R., and Dukhovskoy, D.: World Ocean Atlas 2023, Volume 1: Temperature, NOAA Atlas NESDIS; 89, National Centers for Environmental Information (U.S.) [data set], https://doi.org/10.25923/54bh-1613, 2024. a
Marshall, J. and Schott, F.: Open‐ocean convection: Observations, theory and models, Rev. Geophys., 37, 1–64, https://doi.org/10.1029/98RG02739, 1999. a
Mauritzen, C.: Production of dense overflow waters feeding the North Atlantic across the Greenland–Scotland Ridge. Part 1: Evidence for a revised circulation scheme, Deep-Sea Res. Pt. I, 43, 769–806, https://doi.org/10.1016/0967-0637(96)00037-4, 1996. a
McCarthy, G. D., Hug, G., Smeed, D., Morris, K. J., and Moat, B.: Signal and Noise in the Atlantic Meridional Overturning Circulation at 26° N, Geophys. Res. Lett., 52, e2025GL115055, https://doi.org/10.1029/2025GL115055, 2025. a
Msadek, R., Johns, W. E., Yeager, S. G., Danabasoglu, G., Delworth, T. L., and Rosati, A.: The Atlantic meridional heat transport at 26.5 N and its relationship with the MOC in the RAPID array and the GFDL and NCAR coupled models, J. Climate, 26, 4335–4356, 2013. a
Nycander, J., Hieronymus, M., and Roquet, F.: The nonlinear equation of state of sea water and the global water mass distribution, Geophys. Res. Lett., 42, 7714–7721, https://doi.org/10.1002/2015GL065525, 2015. a
Oldenburg, D., Armour, K. C., Thompson, L., and Bitz, C. M.: Distinct Mechanisms of Ocean Heat Transport Into the Arctic Under Internal Variability and Climate Change, Geophys. Res. Lett., 45, 7692–7700, https://doi.org/10.1029/2018gl078719, 2018. a
Olsen, S. M., Hansen, B., Quadfasel, D., and Østerhus, S.: Observed and modelled stability of overflow across the Greenland–Scotland ridge, Nature, 455, 519–522, https://doi.org/10.1038/nature07302, 2008. a
Orihuela-Pinto, B., England, M. H., and Taschetto, A. S.: Interbasin and interhemispheric impacts of a collapsed Atlantic Overturning Circulation, Nat. Clim. Change, 12, 558–565, https://doi.org/10.1038/s41558-022-01380-y, 2022. a
Pickart, R. S., Spall, M. A., Ribergaard, M. H., Moore, G. W. K., and Milliff, R. F.: Deep convection in the Irminger Sea forced by the Greenland tip jet, Nature, 424, 152–156, https://doi.org/10.1038/nature01729, 2003. a
Qasmi, S.: Past and future response of the North Atlantic warming hole to anthropogenic forcing, Earth Syst. Dynam., 14, 685–695, https://doi.org/10.5194/esd-14-685-2023, 2023. a
Rahmstorf, S., Box, J. E., Feulner, G., Mann, M. E., Robinson, A., Rutherford, S., and Schaffernicht, E. J.: Exceptional twentieth-century slowdown in Atlantic Ocean overturning circulation, Nat. Clim. Change, 5, 475–480, https://doi.org/10.1038/nclimate2554, 2015. a
Reagan, J. R., Boyer, T. P., García, H. E., Locarnini, R. A., Baranova, O. K., Bouchard, C., Cross, S. L., Mishonov, A. V., Paver, C. R., Seidov, D., Wang, Z., and Dukhovskoy, D.: World Ocean Atlas 2023, dataset: NCEI Accession 0270533, https://www.ncei.noaa.gov/products/world-ocean-atlas (last access: 22 November 2024), 2024a. a, b
Reagan, J. R., Seidov, D., Wang, Z., Dukhovskoy, D., Boyer, T. P., Locarnini, R. A., Baranova, O. K., Mishonov, A. V., Garcia, H. E., Bouchard, C., Cross, S. L., and Paver, C. R.: World Ocean Atlas 2023, Volume 2: Salinity, NOAA Atlas NESDIS; 90, National Centers for Environmental Information (U.S.) [data set], https://doi.org/10.25923/70qt-9574, 2024b. a
Ren, Q., Xie, S.-P., Peng, Q., Li, Y., and Wang, F.: Equatorial Atlantic mid-depth warming indicates Atlantic meridional overturning circulation slowdown, Commun. Earth Environ., 6, 819, https://doi.org/10.1038/s43247-025-02793-1, 2025. a
Roach, A., Aagaard, K., and Carsey, F.: Coupled ice‐ocean variability in the Greenland Sea, Atmos. Ocean, 31, 319–337, https://doi.org/10.1080/07055900.1993.9649474, 1993. a
Roewer, S.: sasharoewer/AMOC-NOC-BOX-MODEL: AMOC-NOC Box model (AMOC-NOC), Zenodo [code, data set], https://doi.org/10.5281/zenodo.19589770, 2026. a
Rossby, T., Chafik, L., and Houpert, L.: What can Hydrography Tell Us About the Strength of the Nordic Seas MOC Over the Last 70 to 100 Years?, Geophys. Res. Lett., 47, e2020GL087456, https://doi.org/10.1029/2020GL087456, 2020. a
Rudels, B.: Haline convection in the Greenland Sea, Deep-Sea Res. Pt. A, 37, 1491–1511, https://doi.org/10.1016/0198-0149(90)90139-M, 1990. a
Saba, V. S., Griffies, S. M., Anderson, W. G., Winton, M., Alexander, M. A., Delworth, T. L., Hare, J. A., Harrison, M. J., Rosati, A., Vecchi, G. A., and Zhang, R.: Enhanced warming of the Northwest Atlantic Ocean under climate change, J. Geophys. Res.-Oceans, 121, 118–132, https://doi.org/10.1002/2015JC011346, 2016. a, b
Shu, Q., Årthun, M., Wang, S., Song, Z., Zhang, M., and Qiao, F.: Arctic Ocean Amplification in a warming climate in CMIP6 models, Sci. Adv., 8, eabn9755, https://doi.org/10.1126/sciadv.abn9755, 2022. a
Steele, M., Morley, R., and Ermold, W.: PHC: A global ocean hydrography with a high-quality Arctic Ocean, J. Climate, 14, 2079–2087, https://doi.org/10.1175/1520-0442(2001)014<2079:PAGOHW>2.0.CO;2, 2001. a
Stouffer, R. J., Yin, J., Gregory, J. M., Dixon, K. W., Spelman, M. J., Hurlin, W., Weaver, A. J., Eby, M., Flato, G. M., Hasumi, H., Hu, A., Jungclaus, J. H., Kamenkovich, I. V., Levermann, A., Montoya, M., Murakami, S., Nawrath, S., Oka, A., Peltier, W. R., Robitaille, D. Y., Sokolov, A., Vettoretti, G., and Weber, S. L.: Investigating the Causes of the Response of the Thermohaline Circulation to Past and Future Climate Changes, J. Climate, 19, 1365–1387, https://doi.org/10.1175/JCLI3689.1, 2006. a
Trenberth, K. E. and Fasullo, J. T.: Atlantic meridional heat transports computed from balancing Earth's energy locally, Geophys. Res. Lett., 44, 1919–1927, https://doi.org/10.1002/2016GL072475, 2017. a
van Westen, R. M., den Toom, M., and Dijkstra, H. A.: Physics-based early warning signal shows that AMOC is on tipping course, Sci. Adv., 10, eadk1189, https://doi.org/10.1126/sciadv.adk1189, 2024. a, b
van Westen, R. M., Kliphuis, M., and Dijkstra, H. A.: Collapse of the Atlantic Meridional Overturning Circulation in a Strongly Eddying Ocean‐Only Model, Geophys. Res. Lett., 52, e2024GL114532, https://doi.org/10.1029/2024GL114532, 2025a. a, b
van Westen, R. M., van der Wiel, K., Falkena, S. K. J., and Selten, F.: Changing European hydroclimate under a collapsed AMOC in the Community Earth System Model, Hydrol. Earth Syst. Sci., 29, 6607–6630, https://doi.org/10.5194/hess-29-6607-2025, 2025b. a
Vellinga, M. and Wood, R. A.: Global Climatic Impacts of a Collapse of the Atlantic Thermohaline Circulation, Climatic Change, 54, 251–267, https://doi.org/10.1023/A:1016168827653, 2002. a, b
Weaver, A. J., Eby, M., Kienast, M., and Saenko, O. A.: Response of the Atlantic meridional overturning circulation to increasing atmospheric CO2: Sensitivity to mean climate state, Geophys. Res. Lett., 34, https://doi.org/10.1029/2006GL028756, 2007. a
Weijer, W., Cheng, W., Garuba, O. A., Hu, A., and Nadiga, B. T.: CMIP6 Models Predict Significant 21st Century Decline of the Atlantic Meridional Overturning Circulation, Geophys. Res. Lett., 47, e2019GL086075, https://doi.org/10.1029/2019GL086075, 2020. a
Wett, S., Rhein, M., Kieke, D., Mertens, C., and Moritz, M.: Meridional Connectivity of a 25-Year Observational AMOC Record at 47° N, Geophys. Res. Lett., 50, e2023GL103284, https://doi.org/10.1029/2023GL103284, 2023. a
Wood, R. A., Rodríguez, J. M., Smith, R. S., Jackson, L. C., and Hawkins, E.: Observable, low-order dynamical controls on thresholds of the Atlantic meridional overturning circulation, Clim. Dynam., 53, 6815–6834, https://doi.org/10.1007/s00382-019-04956-1, 2019. a, b
Worthington, E. L., Moat, B. I., Smeed, D. A., Mecking, J. V., Marsh, R., and McCarthy, G. D.: A 30-year reconstruction of the Atlantic meridional overturning circulation shows no decline, Ocean Sci., 17, 285–299, https://doi.org/10.5194/os-17-285-2021, 2021. a
Yang, Q., Dixon, T. H., Myers, P. G., Bonin, J., Chambers, D., van den Broeke, M. R., Ribergaard, M. H., and Mortensen, J.: Recent increases in Arctic freshwater flux affects Labrador Sea convection and Atlantic overturning circulation, Nat. Commun., 7, 10525, https://doi.org/10.1038/ncomms10525, 2016. a, b, c, d
Zhang, R. and Thomas, M.: Horizontal circulation across density surfaces contributes substantially to the long-term mean northern Atlantic Meridional Overturning Circulation, Commun. Earth Environ., 2, 112, https://doi.org/10.1038/s43247-021-00182-y, 2021. a
Zhu, C. and Liu, Z.: Weakening Atlantic Overturning Circulation Causes South Atlantic Salinity Pile-up, Nat. Clim. Change, 10, 998–1003, https://doi.org/10.1038/s41558-020-0897-7, 2020. a
Zhu, C., Liu, Z., Zhang, S., and Wu, L.: Likely accelerated weakening of Atlantic overturning circulation emerges in optimal salinity fingerprint, Nat. Commun., 14, 1245, https://doi.org/10.1038/s41467-023-36288-4, 2023. a
- Abstract
- Introduction
- Methods
- Results
- Discussion
- Conclusions
- Appendix A: Box model Equations
- Appendix B: Salt-Advection Feedback Contribution
- Appendix C: CM2.6 Overturning and Convection Responses to 2 × CO2 Forcing
- Code and data availability
- Author contributions
- Competing interests
- Disclaimer
- Acknowledgements
- Financial support
- Review statement
- References