the Creative Commons Attribution 4.0 License.
the Creative Commons Attribution 4.0 License.
 | 26 Mar 2026
Advances in monitoring the Black Sea: a new regional multidecadal ocean reanalysis at 1∕40° resolution
Diana Azevedo
Mehmet Ilicak
Eric Jansen
Filipe Costa
Adil Sozer
Pietro Miraglio
Emanuela Clementi
The Black Sea regional reanalysis serves as an essential tool for understanding the Black Sea's response to climate variability and advancing regional ocean monitoring efforts. In particular, the Black Sea reanalysis (BLK-REA) is built with high spatial resolution, ° horizontal grid and incorporating 121 vertical levels. The model implementation includes lateral open boundary conditions (LOBC) at the Marmara Sea, allowing more accurate inflow/outflow dynamics through the Bosphorus Strait. BLK-REA assimilates sea level anomaly (SLA) and in-situ observations and applies a heat flux correction via sea surface temperature relaxation. The data assimilation system uses a background error covariance matrix evaluated through monthly EOFs over decadal periods to capture seasonal and decadal variability, and an observation-based mean dynamic topography is used for SLA assimilation. When compared to available observations, the numerical results show high accuracy, with the largest temperature errors observed in the upper layers, primarily linked to the formation of the seasonal thermocline during the summer months. The SLA anomaly error is consistently around 0.02 m from the year 2000 onwards, and regions with elevated SLA errors are closely associated with the Rim Current and its mesoscale variability. These results highlight the added value of a dedicated high-resolution regional reanalysis, as BLK-REA shows superior skill compared to a state-of-the-art global reanalysis in representing sea level, temperature, and salinity, particularly in the upper and intermediate layers of the Black Sea. Furthermore, BLK-REA plays a crucial role in generating Ocean Monitoring Indicators, which are essential for tracking and assessing long-term physical changes in the Black Sea. For example, temperature data indicate ongoing warming in the 25 to 150 m layer, where the Cold Intermediate Layer is located. The system is regularly updated, with the next version expected to improve both the model and DA components. For a future perspective, the next BLK-REA will expand the domain to include the Azov Sea and will feature an enhanced Bosphorus LOBC.
- Article
(11711 KB) - Full-text XML
- BibTeX
- EndNote


The Black Sea is a semi-enclosed basin linked to the Marmara Sea through the Bosphorus Strait, the narrowest part of the Turkish Strait System (TSS). The TSS continues through the Dardanelles Strait, which connects the Marmara Sea to the Mediterranean. Salty waters originating from the Mediterranean Sea flow into the Black Sea through the TSS, serving as its main source of salinity. Despite this influx of saltier waters, the Black Sea is mainly considered a freshwater basin, characterized by a negative balance between evaporation (E), precipitation (P), and runoff (R): . This imbalance is compensated by a two-layer exchange through the Bosphorus Strait, where a stronger flow of the fresher upper layer moves southward toward the Marmara Sea (Beşiktepe et al., 1994; Altiok and Kayişoğlu, 2015). The surface circulation in the Black Sea is primarily driven by the Rim Current, a semi-permanent cyclonic (counterclockwise) jet that flows along the edges of the basin. Along its path, this current interacts with multiple cyclonic gyres within its core and anticyclonic (clockwise) eddies along its peripheries, such as the Batumi and Sevastopol eddies (Oguz et al., 1993; Korotaev et al., 2003).
An important feature of the Black Sea is the Cold Intermediate Layer (CIL), a cold water mass generated each winter through surface cooling and convective mixing. The CIL helps the ventilation of the sub-surface of the Black Sea (Özsoy and Ünlüata, 1997) and is typically defined by water temperatures below 8 °C and extends between depths of 30 to 80 m (Ivanov et al., 2001). The formation of the CIL in the Black Sea is primarily driven by convective processes during cold winters, where cool surface waters become denser and sink to intermediate depths. Recent studies have emphasized that CIL variability is not solely controlled by local winter conditions but is the result of a complex interplay between atmospheric forcing, lateral advection, and oceanic circulation (Korotaev et al., 2014; Miladinova et al., 2018; Capet et al., 2020). For example, the Rim Current and associated mesoscale eddies create localized upwelling and downwelling regions, influencing the CIL distribution (Podymov et al., 2023).
Understanding the circulation and physical processes of the Black Sea from the past to recent years can be supported by ocean reanalyses. These products use state-of-the-art models driven by atmospheric forcing and data assimilation, which integrates high-quality multi-year satellite and in situ datasets to reconstruct historical ocean conditions (Haines, 2018; Yang et al., 2025). They are crucial for monitoring, as they provide insight into the ocean's evolution in response to external forcing, and they allow for the assessment of how environmental changes may affect marine biota, ecosystems, and activities dependent on the health of marine environments.
This work presents a new high-resolution Black Sea reanalysis (hereafter referred to as BLK-REA), developed within the Copernicus Marine Service, which updates the model components and the variational data assimilation system, assimilating both in situ and satellite observations to provide a consistent reconstruction of the Black Sea's physical state. BLK-REA incorporates improved lateral open boundary conditions (LOBCs) to better represent exchange flows through the Bosphorus Strait, an improved freshwater budget, and a high-resolution model configuration that allows better representation of mesoscale and submesoscale processes. Assimilation of satellite and in situ datasets ensures that the reconstructed historical ocean state is physically consistent and captures the evolution of key monitoring indicators for the Black Sea. Previous Black Sea reanalyses, also developed within the framework of the Copernicus Marine Service, have served as valuable tools for understanding the Black Sea's physical variability and supporting assessments of long-term oceanic changes. For example, they revealed a recent warming of the Black Sea's surface, observed in both sea surface temperature (SST) and subsurface temperature (Mulet et al., 2018; Lima et al., 2021). An ocean monitoring indicator (OMI) based on ocean heat content (OHC) in the upper 300 m has also shown warming in the Black Sea. This increasing trend, as indicated by both reanalysis data and temperature measurements from Argo floats (Lima et al., 2020; Stanev et al., 2019), has contributed to the reduced presence of the CIL in the Black Sea in recent years.
Beyond OHC, Black Sea reanalysis has served as the foundation for other OMIs also produced within the scope of the Copernicus Marine Service. Using its velocity fields, Peneva et al. (2021) created an index for the Rim Current, showing that the annual mean current speed fluctuated by approximately 30 % between 1993 and 2019, with a positive trend of about 0.1 m s−1 per decade. Ilicak et al. (2022) analyzed the meridional overturning circulation in the Black Sea and identified a strong correlation between the CIL and a newly proposed index representing the maximum overturning circulation in density space. Gunduz et al. (2022) proposed an index to characterize the upwelling system along the Turkish coast. Their study revealed significant year-to-year variations in upwelling intensity and duration, driven primarily by wind patterns. In addition, they also found that recent declines in the CIL may have further influenced the properties of the upwelled waters.
Additionally, Black Sea reanalysis has played an important role in the practical development of the Black Sea physics forecast system (Ciliberti et al., 2022) and, more recently, in generating hourly datasets of velocity components and sea surface height (SSH) for driving wave reanalysis within the framework of the Black Sea Monitoring and Forecasting Centre (BLK-MFC) under the Copernicus Marine Service (Ciliberti et al., 2021). One of the main challenges in developing a reanalysis for the Black Sea is the scarcity of in-situ observational data to be assimilated, particularly in certain periods, such as the 1990s. This data scarcity is even more pronounced in deeper layers. The absence of observational data requires the use of a robust model capable of accurately simulating the physical processes involved in the Black Sea. Thus, significant progress has been made in improving the quality of the BLK-REA model component with respect to its previous version, including the implementation of a new configuration with LOBCs to better simulate exchange flows through the Bosphorus Strait, such as the inflow of saltwater from the Marmara Sea. Also, the freshwater balance in the model has been refined by incorporating atmospheric forcing with hourly precipitation data, alongside monthly measurements of the Danube River discharge.
These improvements emphasize the importance of developing a regional reanalysis that integrates specific configurations and physical parameterizations tailored to accurately represent the unique characteristics of the Black Sea, which is challenging to achieve with global reanalyses. The latter often rely on fixed parameter adjustments optimized for other regions in the global ocean. In addition, a regional reanalysis typically utilizes higher-resolution models, allowing for a more accurate representation of mesoscale and submesoscale processes, which are often unresolved or only partially captured by the coarse resolution of current global reanalyses. A quantitative comparison between BLK-REA and a state-of-the-art global reanalysis (GLORYS12; Lellouche et al., 2021) over the Black Sea, presented in Appendix A, further illustrates these differences and highlights the added value of maintaining a dedicated regional reanalysis for this basin.
This article is organized as follows: Sect. 2 provides a detailed description of BLK-REA configuration, which was released in December 2024. Section 3 presents the main BLK-REA results and their validation, as well as the updated OMIs for the Black Sea based on BLK-REA. Section 4 summarizes the key findings and outlines improvements and data needs for future versions. Appendix A provides a comparison between BLK-REA and GLORYS12 in the Black Sea, presenting quantitative evaluations of key ocean variables, including SST, sea level anomaly (SLA), temperature, and salinity.
Most of the methodology and configurations follow the previous Black Sea Reanalysis version (Lima et al., 2021), such that this section focuses on the main changes and enhancements present in the newly released version.
2.1 Ocean Model
The BLK-REA model component is the Nucleus for European Modelling of the Ocean (NEMO version 4.0, Madec and the NEMO team, 2019) configured for the domain (Azov and Marmara Seas are not included). NEMO is implemented at a horizontal resolution of ° and 121 vertical geopotential levels. This horizontal resolution provides a spatial discretization of approximately 2.5 km, which conforms to the mesoscale eddy-resolving scale; the Rossby radius of deformation in the Black Sea is approximately 20 km. The model is driven by atmospheric fluxes derived from ECMWF ERA5 reanalysis with spatial and temporal resolutions of ° and 1 h, respectively. The atmospheric forcing considers the following variables: components of 10 m wind, total cloud cover, 2 m air temperature, 2 m dew point temperature, mean sea level pressure and precipitation. The system computes momentum, heat, and water fluxes at the air-sea interface using bulk formulae originally developed for the Mediterranean Sea (Castellari et al., 1998; Pettenuzzo et al., 2010), which have also been employed in other Black Sea systems (Ciliberti et al., 2022; Lima et al., 2021). Additionally, the system applies daily SST relaxation for heat flux corrections based on the ESA-CCI SST-L4 product (Good et al., 2020).
2.1.1 Lateral open boundary conditions
One of the key challenges in modeling the Black Sea dynamics is accurately simulating the outflow and inflow through the Bosphorus Strait. This is essential for correctly representing the surface and intermediate depth salinity patterns and sea surface height (SSH) trends, as the Bosphorus acts as the sole passage for saltwater entering the Black Sea, and the only exit of the surface Black Sea water. The previous Black Sea reanalysis approach applied closed boundary conditions, requiring temperature and salinity restoration to achieve more accurate results. Additionally, SSH was controlled by treating the Bosphorus as an inverse river with a controlled flow to prevent artificial SSH trends. The present version incorporates open boundaries, using results from the Unstructured Turkish Straits System (U-TSS) model (Ilicak et al., 2021), leading to a more accurate representation of these dynamics. U-TSS is built upon the Shallow Water Hydrodynamic Finite Element Model (SHYFEM; Micaletto et al., 2022). SHYFEM employs an unstructured finite element grid in the horizontal dimension and assumes hydrostatic approximation, solving depth-integrated shallow water equations in the vertical. The model features a horizontal resolution ranging from 500 m in deeper regions to 50 m in shallower areas, enabling a detailed representation of the Turkish Straits: Dardanelles and Bosphorus. Additionally, it incorporates 93 geopotential coordinate levels in the vertical dimension. The current reanalysis simulation utilizes LOBCs from monthly-averaged fields of temperature, salinity, U and V velocity components, and SSH from a 4-year U-TSS simulation covering the period 2016–2019. Flather's boundary condition is applied to the barotropic component, while the flow relaxation scheme is utilized for tracers and baroclinic components, as implemented in NEMO. Custom interfaces between U-TSS and BLK-REA have been developed to adapt the U-TSS model outputs for the BDY module in NEMO (Chanut, 2005).
Due to computational constraints, the LOBCs at the Bosphorus Strait were derived from monthly-averaged outputs of a U-TSS simulation covering the period 2016–2019. A monthly climatology from this period was applied consistently over the full reanalysis timeline (1993–2022) to represent seasonal variability. Although this approach does not capture interannual signals at the boundary, the internal dynamics of the Black Sea, combined with the data assimilation of satellite and in situ observations, help maintain physical consistency throughout the basin.
2.2 Observations
The system assimilates sea level anomaly (SLA) data from the dataset European Seas Along-Track L3 Sea Surface Heights Reprocessed, Tailored for Data Assimilation, available in the Copernicus Marine Service catalog (SEALEVEL_EUR_PHY_L3_MY_008_061, https://doi.org/10.48670/moi-00139; Faugère et al., 2022). To maximize the number and spatial coverage of in-situ observations assimilated into the model, we combine multiple datasets using a predefined priority order, ensuring that duplicate profiles are excluded, as follows:
-
Global Ocean CORA In-situ Observations – Yearly Delivery in Delayed Mode from Copernicus Marine Service (INSITU_GLO_PHY_ TS_ DISCRETE_MY_013_001; https://doi.org/10.17882/46219) (Szekely et al., 2019; Szekely et al., 2024).
-
Global Ocean In-situ Near-Real-Time Observations from Copernicus Marine Service (INSITU_GLO_PHYBGCWAV_DISCRETE_ MYNRT_ 013_030; https://doi.org/10.48670/moi-00036, E.U. Copernicus Marine Service Information (CMEMS), 2024).
-
SeaDataNet historical in-situ data collections (Myroshnychenko and Simoncelli, 2018; Myroshnychenko, 2020).
In addition to the standard quality-control procedures applied by the data providers, several supplementary screening steps are implemented to minimize the impact of spurious observations. Only measurements explicitly flagged as good are retained for all variables, and basic physical range checks are applied to temperature and salinity. For CTD profiles, only downcasts are used. For Argo floats and gliders, a vertical-resolution criterion is applied in the upper ocean, excluding profiles with data gaps larger than 40 m in the first 300 m to ensure adequate representation of the thermocline. Finally, in rare cases where the assimilation of specific observations (e.g., profiles or along-track SLA) induces instabilities in the model solution, targeted visual inspection is performed to identify and exclude the problematic data prior to rerunning the assimilation, as neglecting these cases may lead to a model blow-up.
In data assimilation, the in situ instrumental errors assume different values for T and S and vary in the vertical dimension based on statistics derived from Ingleby and Huddleston (2007). The in-situ representation errors are defined as a multiplicative factor applied to the depth-dependent instrumental errors and vary horizontally on the model grid according to previous model–observation statistics. In this component, the same spatially varying factor is applied to T and S, which is a simplification justified by the similar spatial sampling patterns and statistical structure of the in situ observational datasets. Representation errors account for unresolved physical processes, subgrid-scale variability, and model errors that are not part of instrumental uncertainties. Both components of in situ errors are kept constant over time. For SLA observations, the instrumental error is set to 4 cm, and the representation errors vary spatially and monthly following Oke and Sakov (2008). Similar to the previous version, a background quality check is implemented in the data assimilation system to reject observations that deviate significantly from the model prior solution. Rejection by background quality control does not necessarily indicate erroneous data, but often reflects large innovations that would otherwise introduce undesirable shocks in the model state. The quality control procedures and data rejection thresholds are applied as described in Lima et al. (2021), with no changes introduced in BLK-REA.
In contrast to the previous version of the reanalysis (Lima et al., 2021), which used a model-derived mean dynamic topography (MDT), an enhancement in the present version is the use of an observation-based mean dynamic topography MDT to compute the model-equivalent SLA in data assimilation. Sensitivity tests indicated that this choice improves the assimilation skill of SLA, leading to systematically reduced RMSD values. The observation-based MDT field is available in the Copernicus Marine Service catalog: https://doi.org/10.48670/moi-00138 (E.U. Copernicus Marine Service Information (CMEMS), 2024).
2.3 Data Assimilation
The data assimilation system, OceanVar, utilizes a three-dimensional variational (3D-Var) assimilation algorithm. OceanVar was initially developed for the Mediterranean Sea (Dobricic and Pinardi, 2008) and subsequently extended to the global ocean (Storto et al., 2011) and Black Sea (Ciliberti et al., 2022; Lima et al., 2021). The new system utilizes OceanVar, following the same equations outlined in Lima et al. (2021), with particular emphasis on the cost function (J) equation presented as follows:
where is the increment, i.e., the difference between the analysis (xa) and background (xb), ) is the misfit between an observation vector y and its modeled correspondent (in the observation space) where H, the observation operator, maps the model fields to the observation locations. OceanVar is a multivariate scheme, i.e., the state vector x can contain the following model state variables: T, S, SLA, and horizontal velocities (u and v). However, only the first three variables are employed in the present BLK-REA implementation. B and R are respectively the background and observation covariance matrices. R is diagonal in the observation space and includes the sum of instrumental and representation errors, along with an additional error component that depends on the time difference between each observation and the analysis time. The latter component is weighted according to this temporal distance.
In OceanVar, the variational cost function is solved using the incremental formulation (Courtier, 1997), with preconditioning of the cost function minimization achieved through a change-of-variable transformation. Thus, to avoid inverting the B matrix and to precondition the minimization of the cost function, the B matrix is defined as B=VVT where V is decomposed into a sequence of linear operators: V=VηVhVv. The V operator represents the background error covariance matrix, capturing the interdependencies among variables. Furthermore, a new control variable, (and thereby δx=Vv), is introduced for the minimization process through the application of a transformation. Thus Eq. (1) becomes:
In the present version, the linear operators Vη and Vh follow the same formulation described by Lima et al. (2021). The dynamic height operator in Vη imposes local hydrostatic and geostrophic balance among SLA, temperature, and salinity increments, following Storto et al. (2011), with a level of no motion assumed at 1000 m, where this balance is valid. This restricts SLA assimilation to deep-water regions. Vh represents horizontal correlations, modeled with a first-order recursive filter (Farina et al., 2015) and a fixed correlation length-scale of 20 km. Instead, Vv incorporates background-error T and S vertical covariances that are modelled through 45-mode multivariate Empirical Orthogonal Functions (EOFs) and derives from a previous integration including the assimilation of SLA, T and S profiles, using the full model resolution. In addition, the new approach is non-stationary and a different set of EOFs are applied considering the following decades: 1984–1993, 1994–2003, 2004–2013, and 2011–2020. EOFs are calculated for each month from anomalies estimated from daily T, S and SSH fields with respect to the long-term monthly mean of the corresponding decade.
2.4 Strategies and experiment setup
The experiment is initialized in 1991 with a rest state of temperature and salinity fields derived from the World Ocean Atlas climatology (WOA 2018, Garcia et al., 2019). Following a spin-up of 2 years (1991–1992), the BLK-REA starts in 1993. The data assimilation is applied every 2 d, i.e., if the model initializes at time t, the next data assimilation cycle is performed at the time t+2. The observation window is 4 d centered at the analysis time, so that each cycle assimilates observations from 2 d before until 2 d after the analysis time. Figure 1 shows SST increments (in °C) over the Black Sea on 9 January 2020, overlapped with along-track SLA and in situ profile data assimilated during a single DA cycle in the BLK-REA. The subplot highlights the Marmara Box and its bathymetry, where boundary conditions from U-TSS are applied along faces A, B, and C. In the Black Sea, the limited availability of in-situ observations for assimilation leads to systematic errors in certain variables during specific periods, particularly in the deeper layers. To mitigate this bias, large-scale bias correction (LSBC) toward WOA2018 decadal climatologies is applied below 700 m. The formulation and additional details on the LSBC scheme are described in Lima et al. (2021).
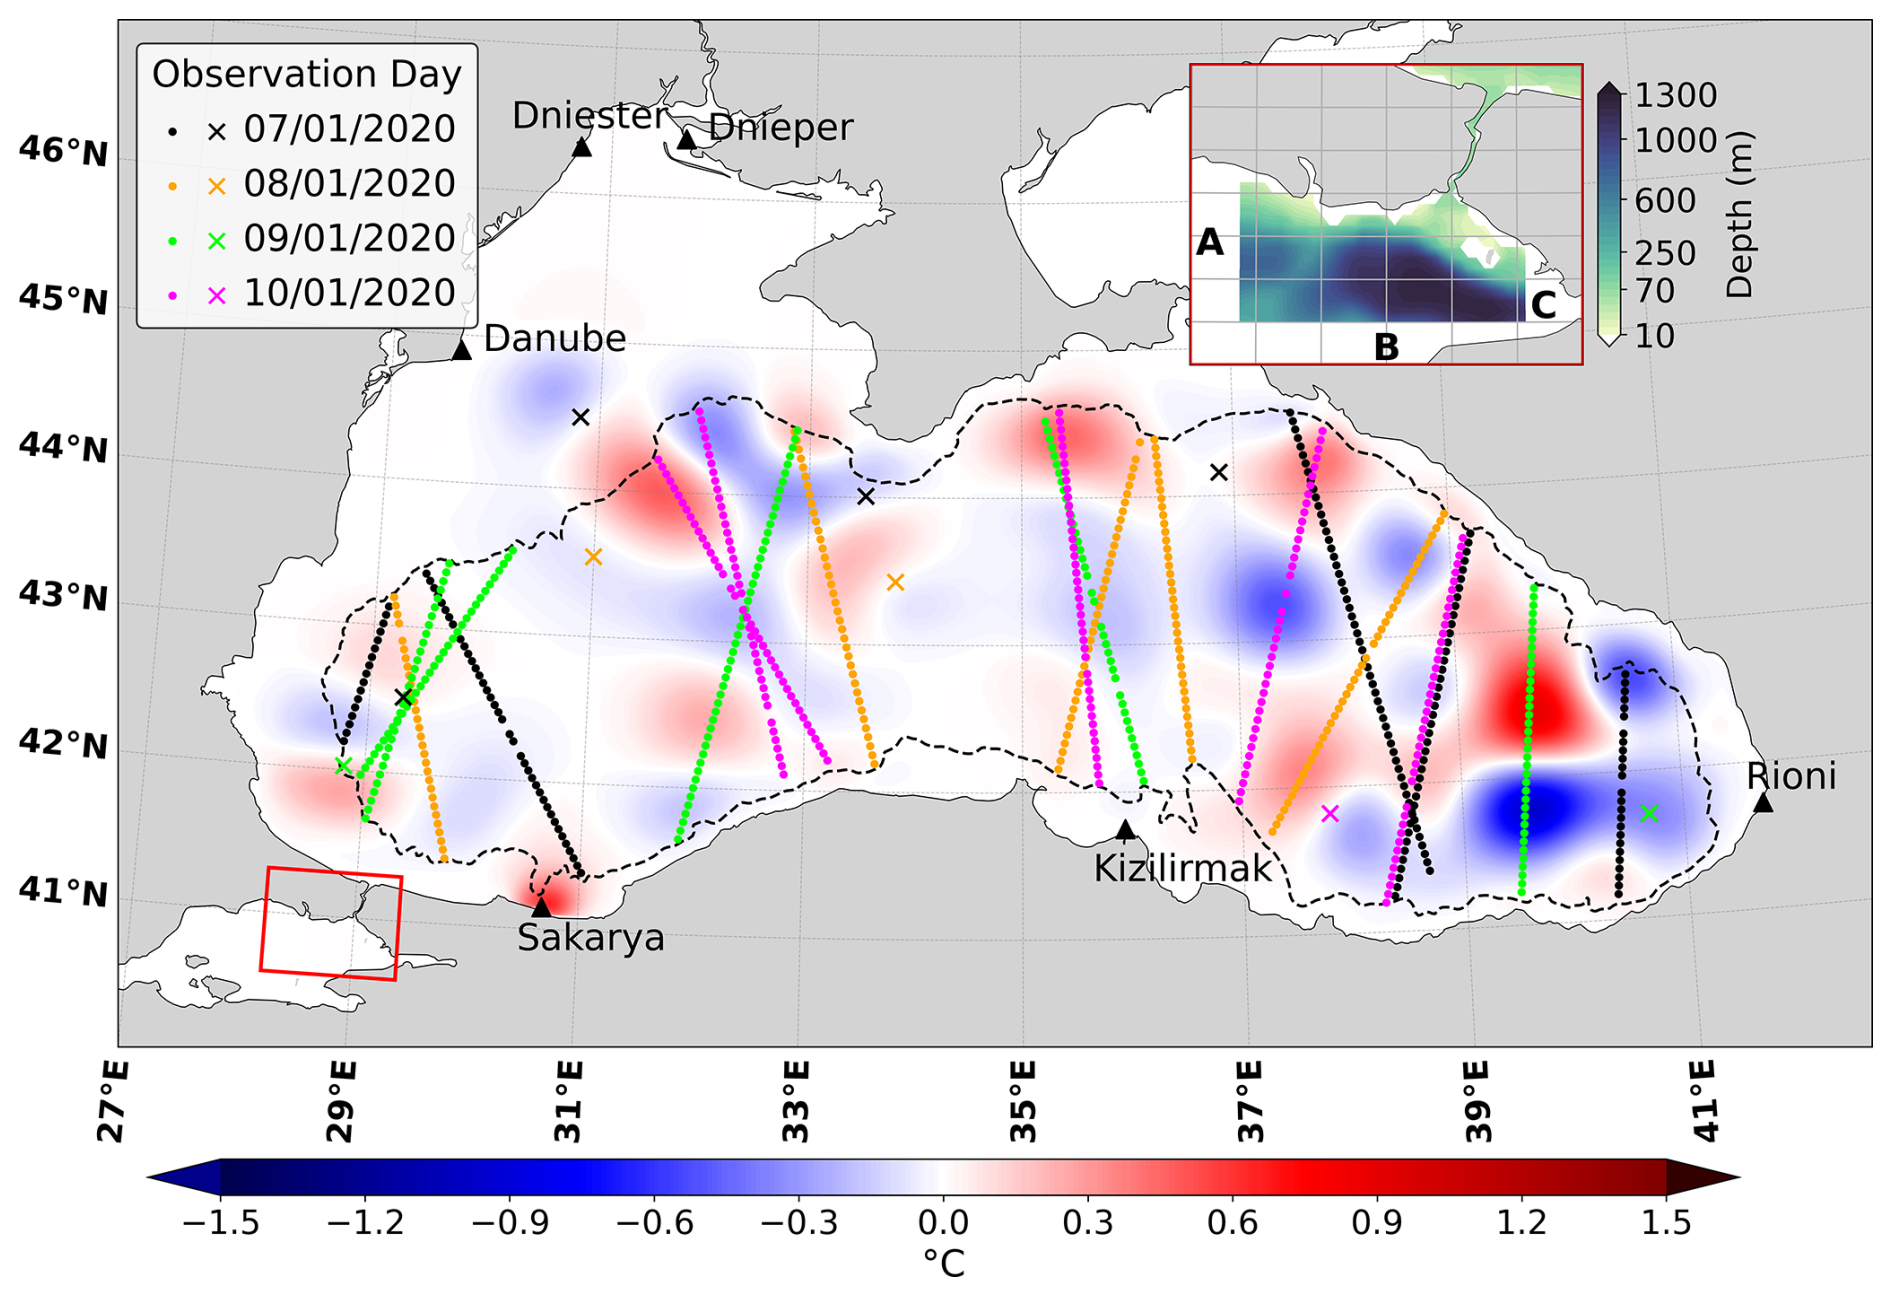
Figure 1SST increments (in °C) over the Black Sea on 9 January 2020, shown with a blue–white–red color scale. Triangles mark the positions of the main river inflows, while along-track SLA observations and in situ profile data (mostly Argo floats during this period; showing their positions as ×) are also displayed. Each color corresponds to a different day within a 4 d observation window centered at 00:00 UTC on 9 January 2020. The subplot highlights the Marmara Box (red rectangle) and its corresponding bathymetry, where boundary conditions from U-TSS are prescribed along faces A, B, and C. No assimilation is performed inside the Marmara Sea, and thus the SST increments there are zero.
This section presents validations of key variables from the BLK-REA. The validations are quasi-independent, as they consider both assimilated observations and those excluded during the data assimilation process due to specific adjustments (e.g., background quality control). However, fully independent observational datasets, in the sense of being completely separate from the assimilated data, were not available, which should be taken into account when interpreting the validation results. In addition, this section presents results for a set of OMIs derived primarily from the BLK-REA, whose evaluation is discussed in a dedicated subsection.
Additional analyses comparing BLK-REA with GLORYS12 over the Black Sea are presented in Appendix A. These analyses provide supporting quantitative evidence of the added value of BLK-REA over the Black Sea, complementing the results presented in this section, with the SST evaluation based on fully independent observations.
3.1 Validation
Spatial seasonal maps of reanalysis SST are compared to satellite data in the period 1993–2022 and their difference shows a predominance of model negative biases in winter and spring, and positive biases in summer and fall, with a few exceptions as follows (Fig. 2; left). Positive values of 0.1 up to 0.3 °C are visible in some regions during winter, such as close to the Danube river mouth and along the southwest coast. Negative biases are present adjacent to the Kerch Strait, and the lowest negative biases, of more than 1.0 °C, are exhibited in the upwelling region along the western Anatolian coast in summer. Most of the central-eastern area is covered by negative bias in fall. SST RMSD (Root Mean Squared Difference) maps indicate that errors are generally lower in spring and higher in fall (Fig. 2; right). In general, larger values can be seen close to large river mouths such as near the Dnieper in winter and Danube in winter, spring, and summer. The highest errors, exceeding 1 °C, are observed along the western Anatolian Turkish coast in both summer and fall. In this region, a similar overestimation of upwelling phenomena was observed in the results of the previous Black Sea reanalysis, which was attributed to the influence of stronger winds (Lima et al., 2021). Recent analyses have indicated that the air-sea bulk formulation may be responsible for the intensified upwelling, and we plan to refine this model component in future releases of the Black Sea reanalysis.
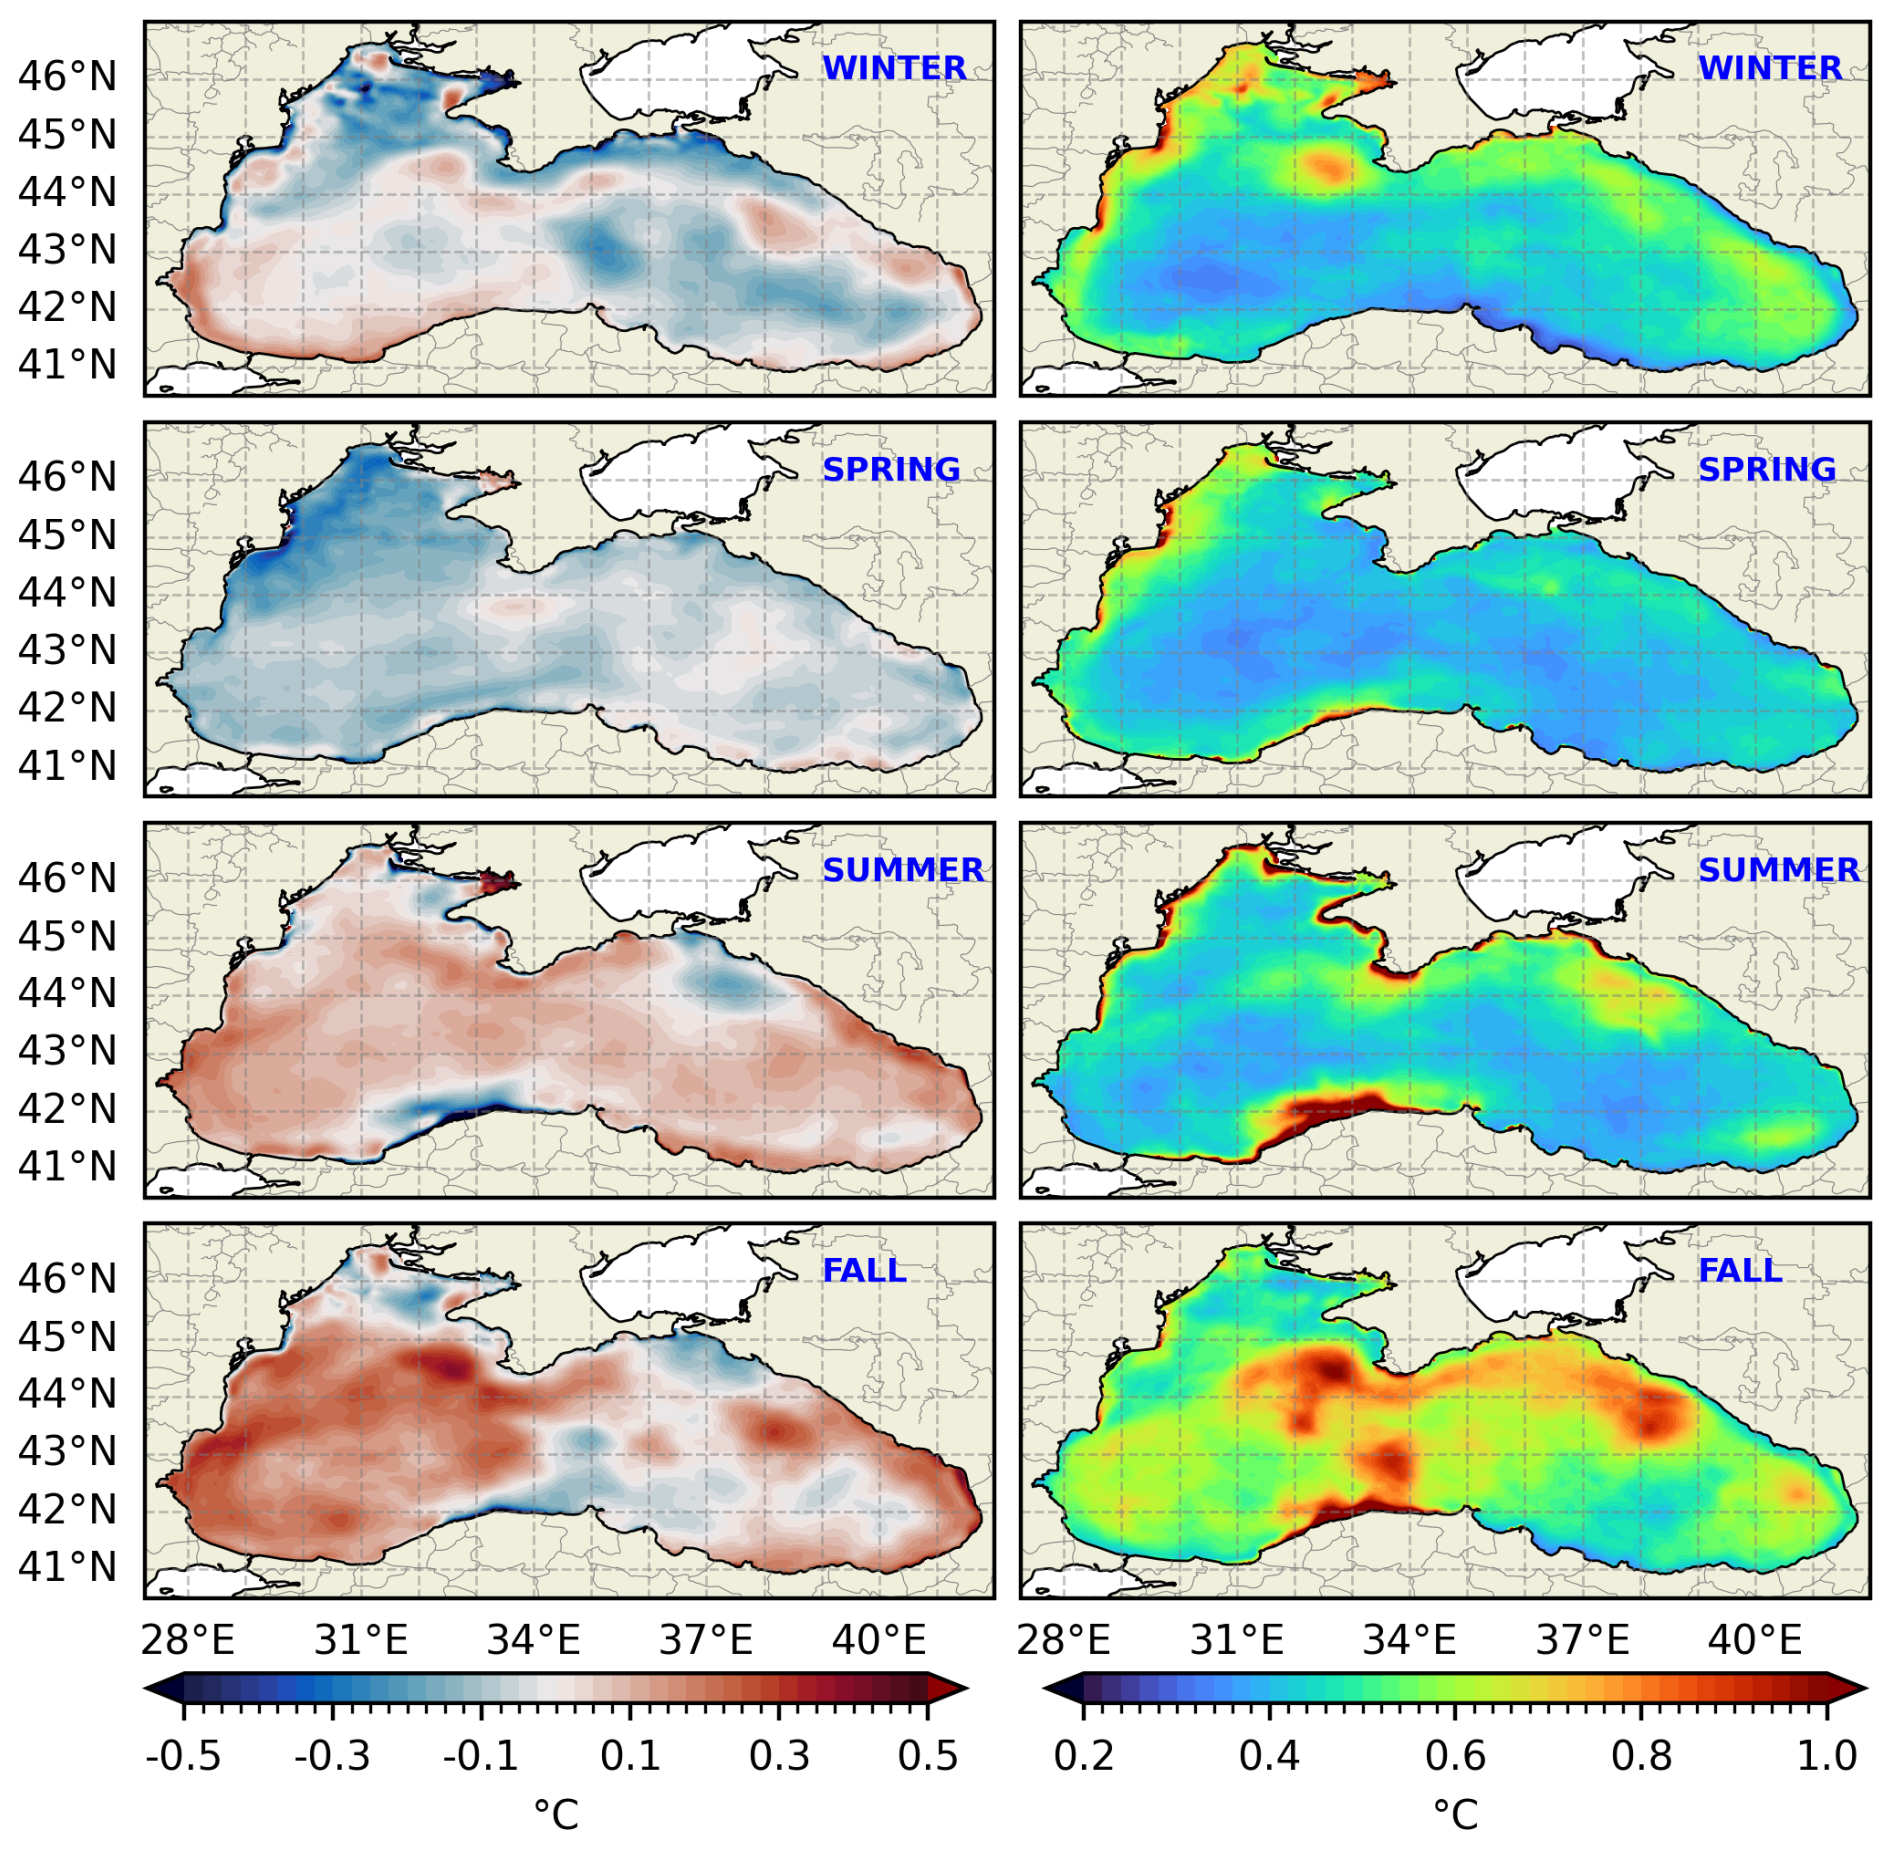
Figure 2Seasonal maps of the mean bias (left) and RMSD (right) of the SST (°C) with respect to the satellite ESA-CCI product over the period between 1993 and 2022. From top to bottom: winter, spring, summer, and fall.
The Hovmöller diagram (time-depth) of RMSD for temperature computed as a lateral average, reveals a distinct seasonal cycle in the upper water column (Fig. 3), with lower errors in winter that increase during summer, exceeding 2 °C in the upper 50 m. This summer increase is associated with the model's misrepresentation of the seasonal thermocline, which is partially corrected through data assimilation. Below 100 m, errors remain low, staying below 0.25 °C for almost the whole period. Before the Argo floats era (mid-to-late 2000s), the scarcity of in-situ data limited the effectiveness of data assimilation, compromising both the model correction and the validation process.
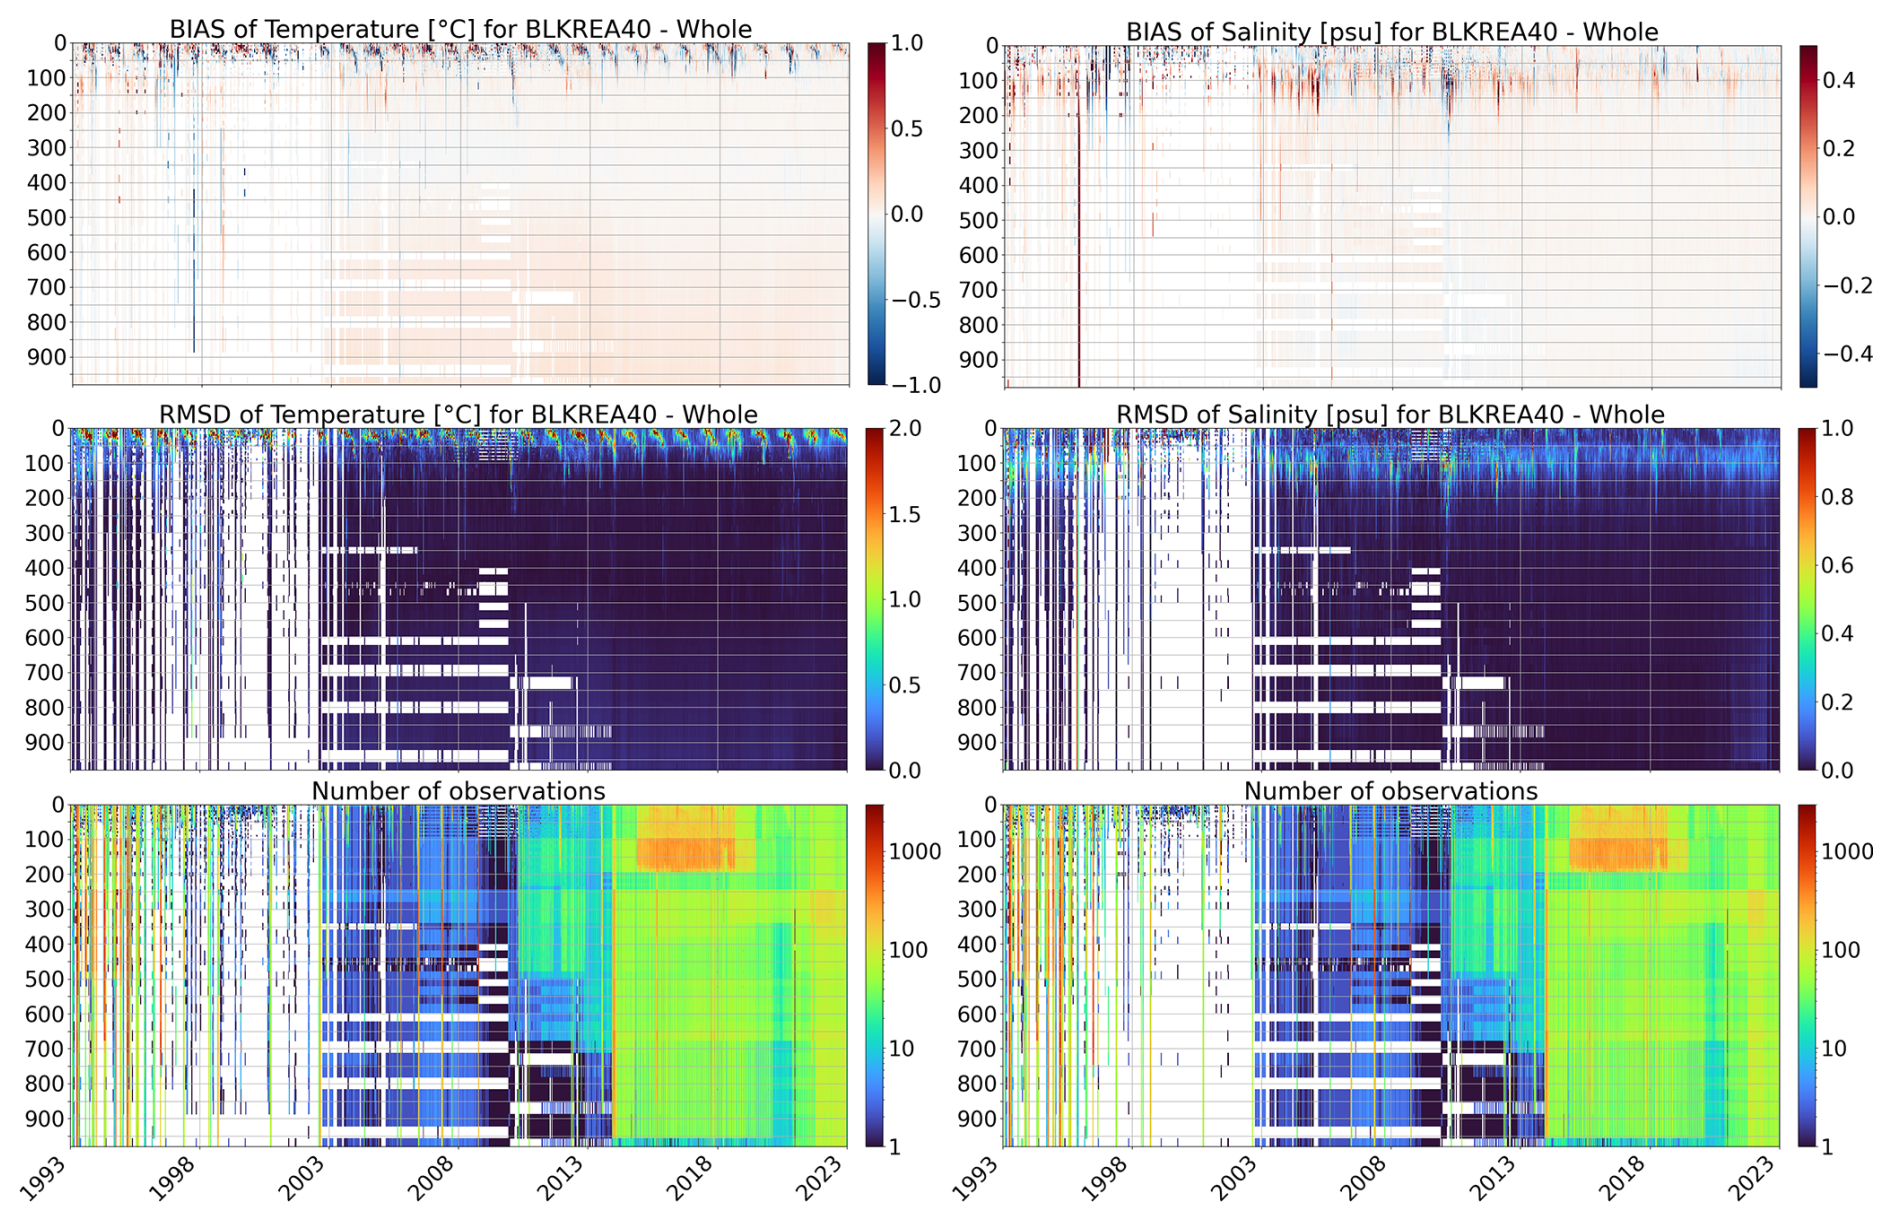
Figure 3Hovmöller (time–depth) diagrams of temperature (left) and salinity (right) in the Black Sea from 1 January 1993 to 31 December 2022. Rows show bias (top), RMSD (middle), and number of observations (bottom). Temperature is in °C and salinity in PSU.
The Hovmöller diagram of temperature biases predominantly shows positive values, occasionally exceeding 1 °C near the surface, with intermittent periods of negative biases (Fig. 3). The most pronounced discrepancies are observed within the seasonal thermocline depths. There is a tendency for biases to shift from positive in upper layers to negative values at deeper layers, down to 100 m. This may be related to the misrepresentation of the vertical position of the seasonal thermocline in the BLK-REA results compared to observations over time.
Unlike temperature, the Hovmöller diagram of RMSD for salinity does not exhibit a clear seasonal cycle. Errors exceed 1 psu during short periods (Fig. 3), particularly in the upper layers, where high uncertainties are likely derived from precipitation biases in ERA5, simplified river runoff forcing, and the internal freshwater budget computed via the model's bulk formulae. Apart from these peak values, errors are relatively higher between 50 and 100 m. Within this layer, errors tend to decrease over time, reaching values below 0.25 psu in the most recent years of validation. Once again, the scarcity of observations compromises the validation process before 2004. Below 200 m, errors remain very low, with values consistently below 0.1 psu.
Salinity biases show a predominance of positive values (Fig. 3). The Hovmöller diagram reveals two main characteristics: BLK-REA diverges more from observations in the upper 200 m, with values alternating between positive and negative biases. Below 200 m, biases approach zero and remain predominantly positive. Since 2014, the values tend to be closer to zero, with biases showing a relative reduction in the upper 200 m.
During the validation stage, the elevated errors around 1996 (salinity) and 1998 (temperature) in the Hovmöller diagrams (Fig. 3) may be linked to observations that were not assimilated but included in the quasi-independent validation. These peaks are likely due to such observations, but also sparse coverage, and local model biases.
Figure 4 presents the temporal and spatial averaged RMSD and biases for temperature, comparing the reanalysis results with in-situ observations. For a better spatial analysis, we divide the Black Sea into three different regions: western, central, and eastern. The largest temperature errors occur in the upper layers and are primarily associated with the formation of the seasonal thermocline in summer, as previously shown in the Hovmöller diagrams for temperature (Fig. 3). In this layer, RMSD reaches a maximum of approximately 1.5 °C in the western and eastern regions, and about 1.25 °C in the central region. In the upper water column, temperature biases are negative in the eastern and central regions. In the western region, the bias is positive from the surface down to 50 m, reaching values of up to 0.1 °C, and becomes negative between 50 and 100 m, aligning with the values observed in the central region. The largest errors are observed in the eastern region. Errors gradually decrease with depth, with RMSD reaching values lower than 0.25 °C at 150 m, biases becoming closer to zero.
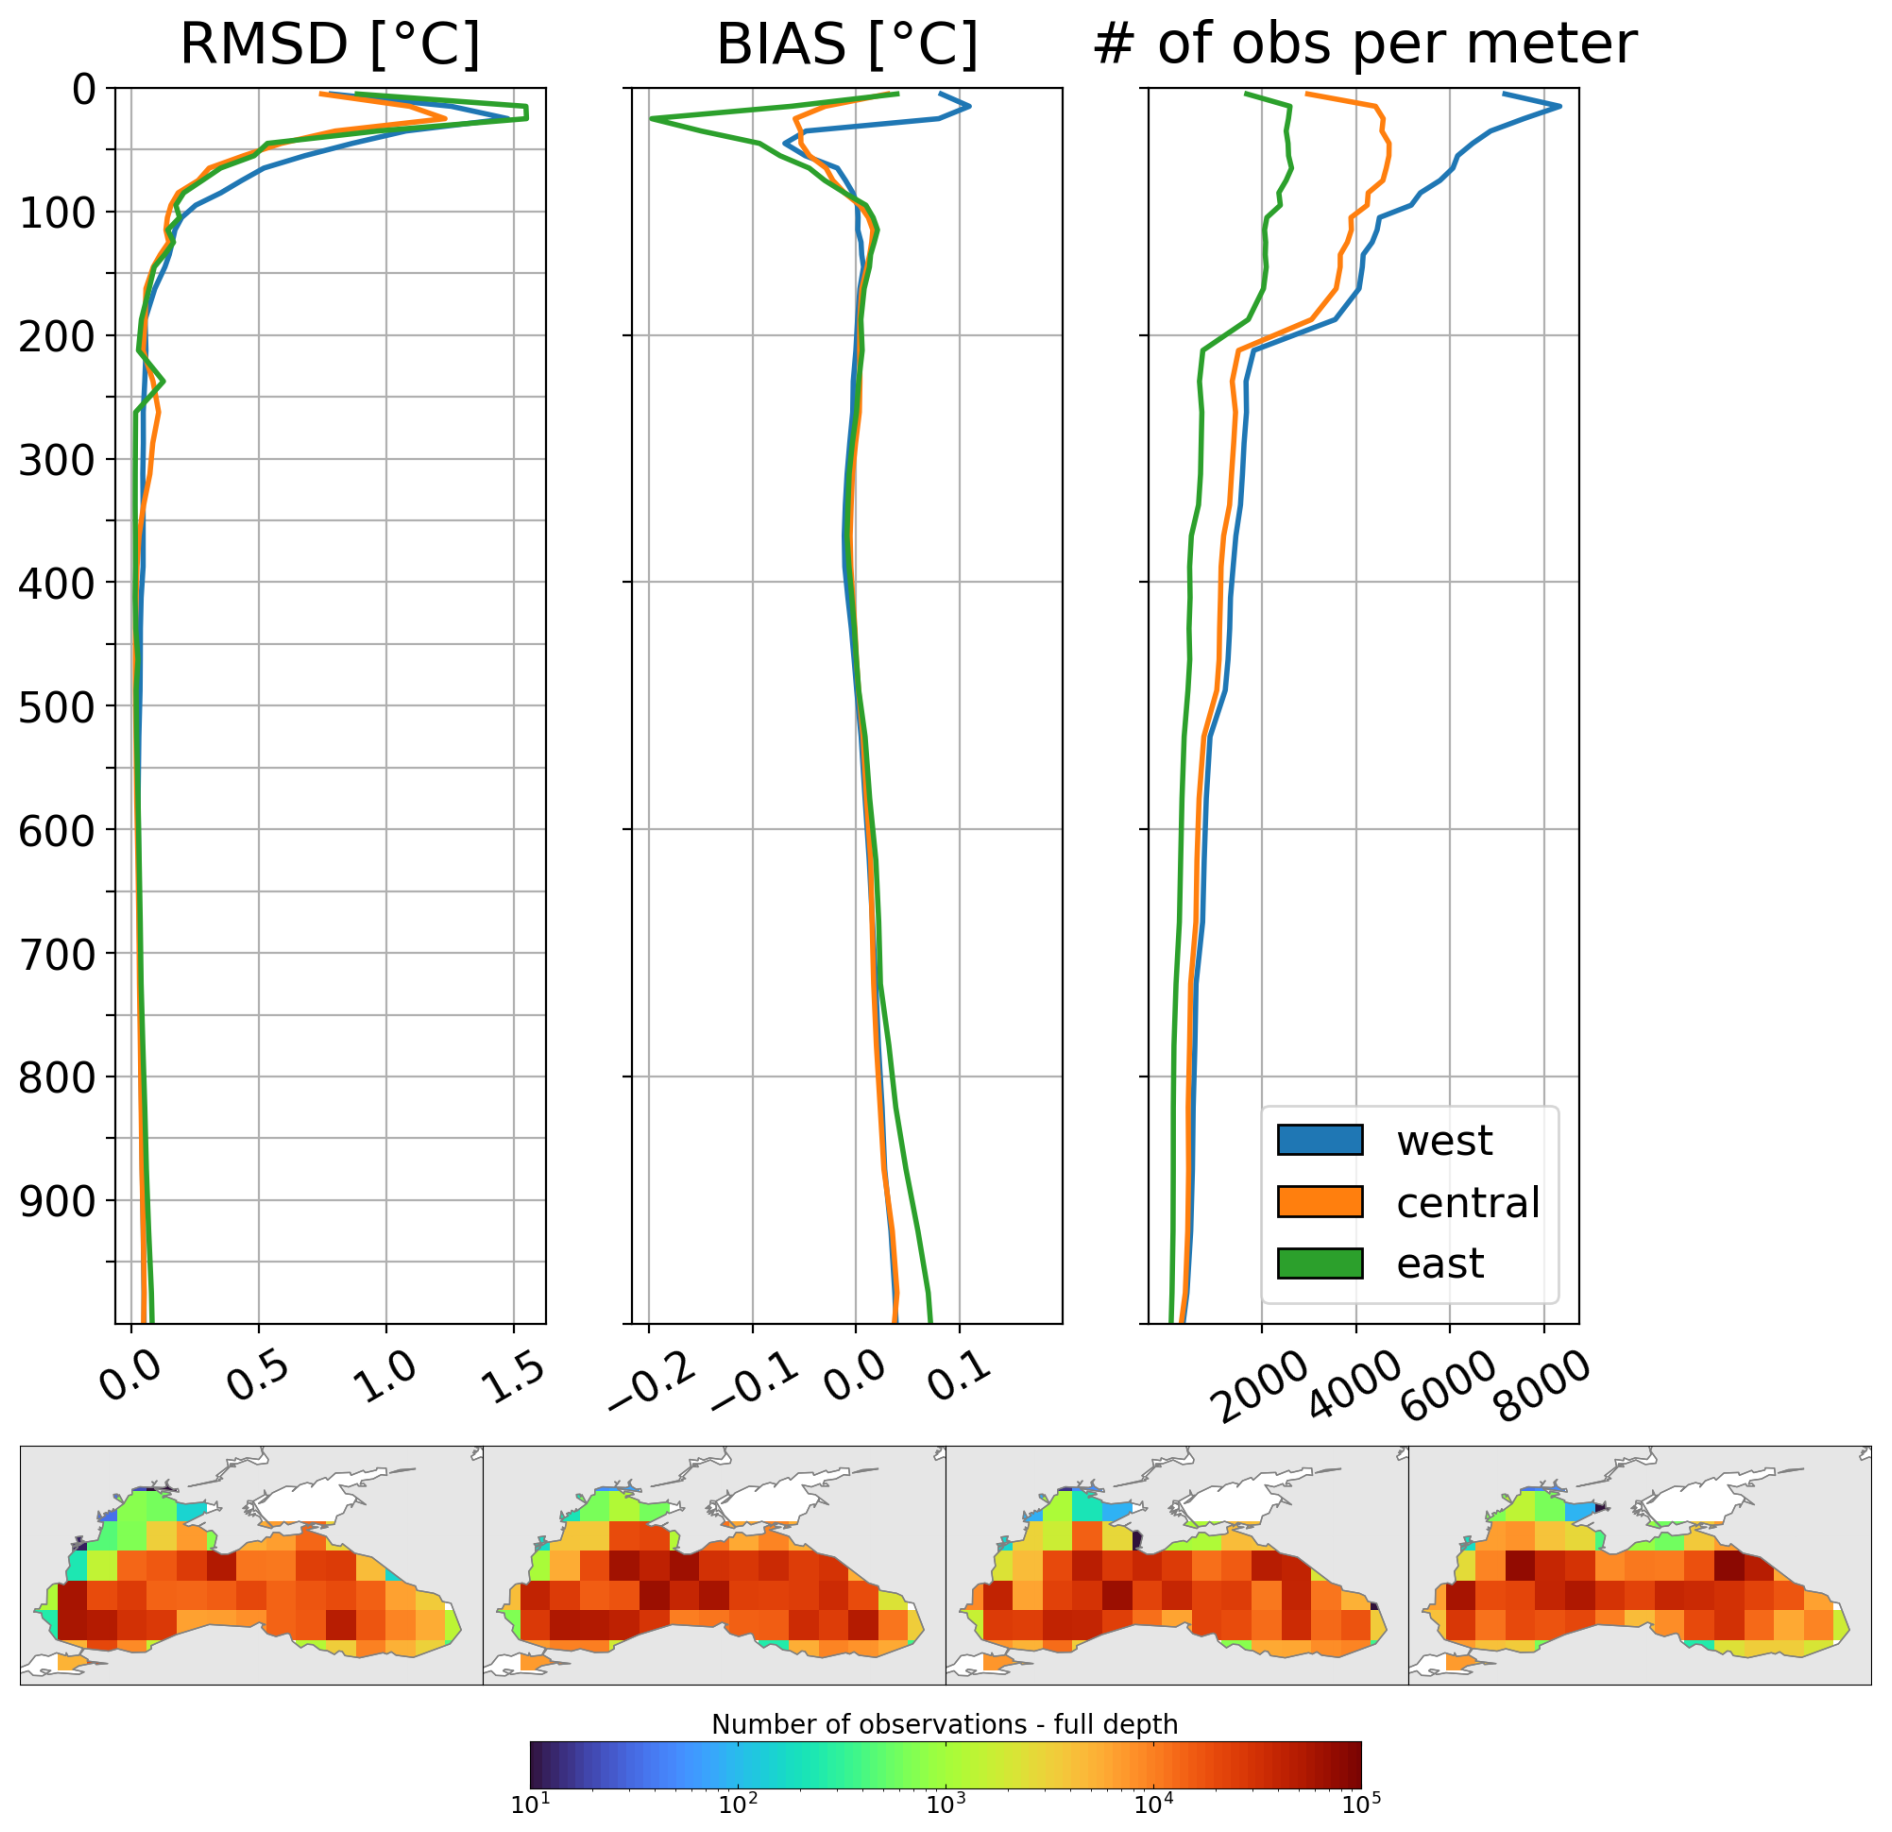
Figure 4Vertical profiles of the RMSD (left panel), bias (middle panel) and number of observations (right panel) for temperature (in °C), by comparing the reanalysis results against in-situ profilers in three areas (West, Central and East) of the Black Sea domain from 1 January 1993 to 31 December 2022. Seasonal spatial maps at the bottom show the total number of temperature observations throughout the entire water column, from left to right: winter, spring, summer, and fall.
The same analysis for salinity is shown in Fig. 5. The western region exhibits the highest near-surface RMSD, with values reaching over 0.8 psu in the upper 100 m, despite high observational coverage. In contrast, RMSD values are lower in the central and eastern regions, remaining below 0.2 psu in the upper layers. These high values in the western region are mainly due to limitations in freshwater inputs from major rivers: only the Danube uses monthly varying discharge, while other rivers follow climatologies without intra-annual variability, producing persistent local biases. Prescribed boundary conditions near the Bosphorus Strait improve the physical representation but also introduce uncertainties. Data assimilation can partially improve model representation under these circumstances by incorporating observations with strict quality control, but some errors can still persist. Salinity biases show regional differences. In the western region, positive biases are pronounced near the surface, rapidly transitioning to negative values and reaching about −0.04 psu between 25 and 50 m. In contrast, biases in the surface layers of the central and eastern regions remain closer to zero but increase in the subsurface starting at 50 m, following the pattern observed in the western region. At a depth of around 100 m, all regions exhibit relatively high salinity biases, with the eastern region showing the highest values, reaching up to 0.04 psu. In general, salinity biases decrease beneath 100 m and approach zero at depths greater than 200 m.
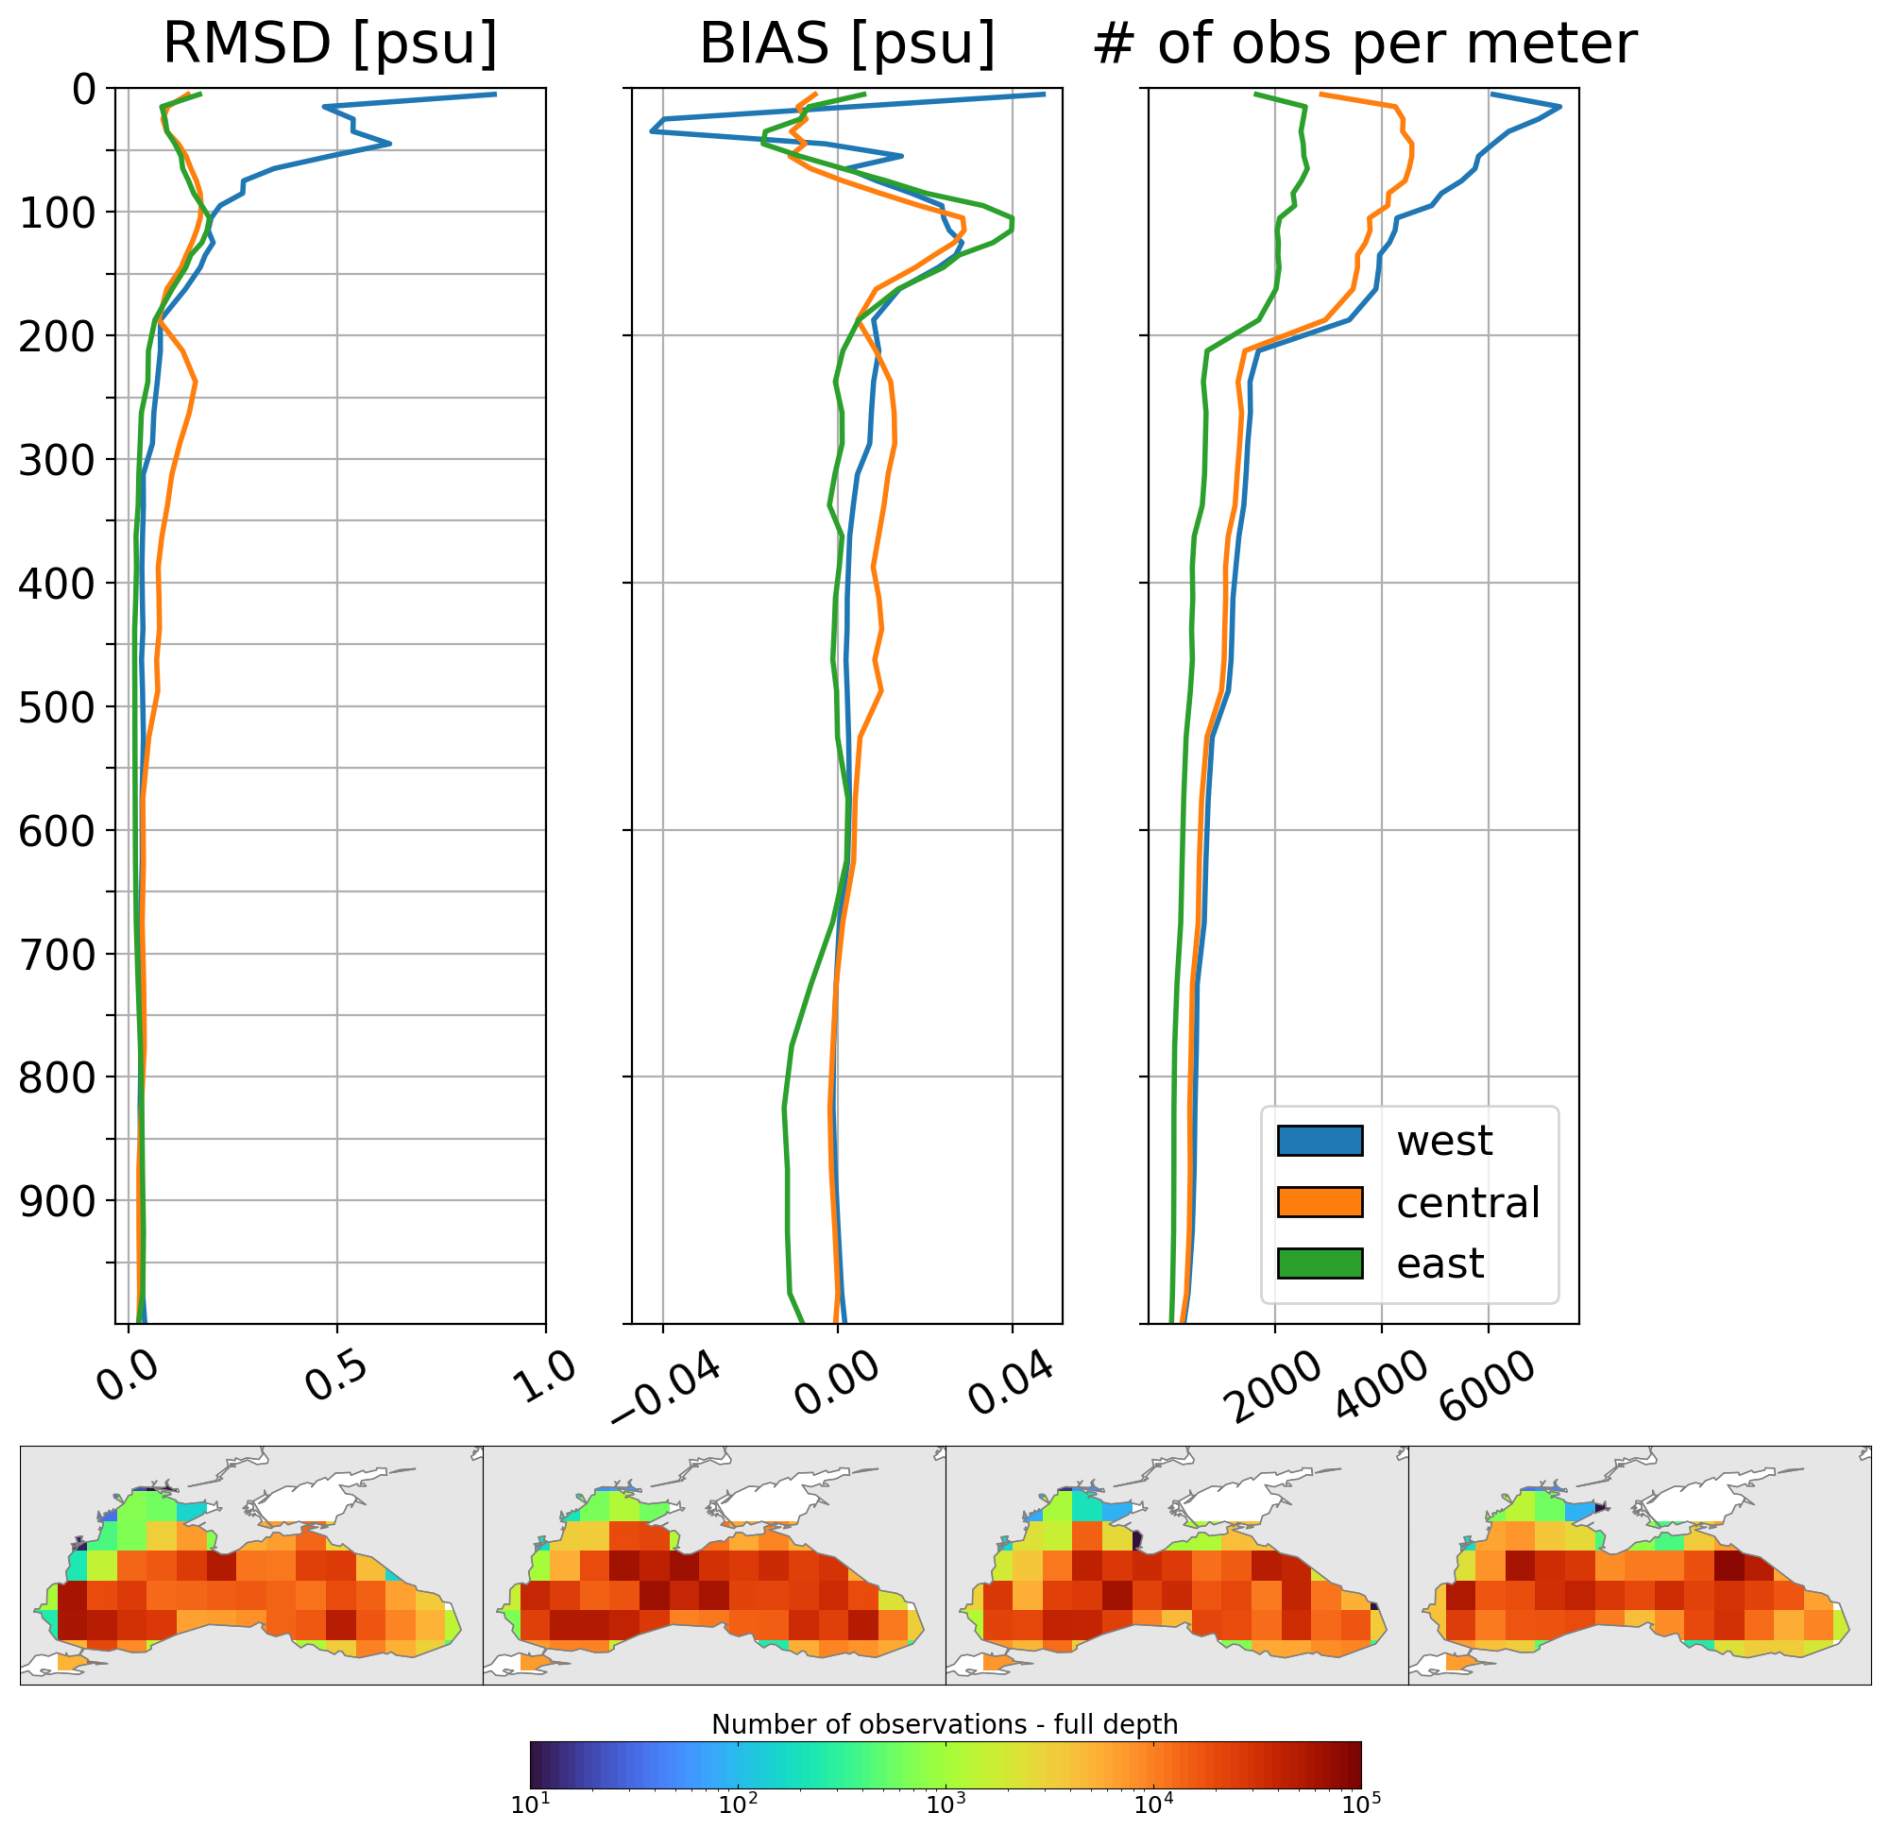
Figure 5Vertical profiles of the RMSD (left panel), bias (middle panel) and number of observations (right panel) for salinity (psu), by comparing the reanalysis results against in-situ profilers in three areas (West, Central and East) of the Black Sea domain from 1 January 1993 to 31 December 2022. Seasonal spatial maps at the bottom show the total number of salinity observations throughout the entire water column, from left to right: winter, spring, summer, and fall.
In the eastern region, a slight increase in temperature and salinity biases occurs below 700 m (Figs. 4 and 5). This pattern likely arises from sparse deep-layer observations prior to 2003 (as shown in the Hovmöller diagrams, Fig. 3), limitations in model initialization, and unresolved physical processes within the model. The introduction of Argo profiling floats from 2003 increased deep data coverage, revealing biases that were previously undetected and never corrected; below 700 m, LSBC toward WOA2018 climatology is not sufficient to constrain the model. In addition, some observations excluded from assimilation were still included in validation, further contributing to the apparent increase in errors. Even with strict quality control, some measurement errors or inconsistencies may have persisted.
Spatial maps of the SLA RMSD reveal the highest values, ranging from 2.5 to 4 cm, with occasional peaks exceeding 4 cm, predominantly along the basin's periphery (Fig. 6). These elevated deviations are closely linked to the Rim Current and its inherent mesoscale variability. In contrast, SLA RMSD values in the central basin are generally lower, around 2 cm. Notably, areas with large RMSD values align with regions of strong eddy kinetic energy (EKE), which we use to assess mesoscale activity (Fig. 7). This pattern is particularly evident along the Anatolian, Caucasian, and Crimean coasts, where well-known mesoscale characteristics are present (Korotaev et al., 2003). SLA errors show slight variations across seasons, with particular attention given to high values along the Caucasian coast. These values extend further offshore in winter. Additionally, higher SLA errors occupy a larger area around the Batumi eddy region during fall. Error values are relatively high along the Crimean coast, particularly in the western region, where the persistent influence of the Sevastopol eddy contributes to elevated mesoscale variability. However, these errors tend to decrease during summer. Kubryakov and Stanichny (2015) reported that the total number of detected eddies exhibits local maxima in both the Sevastopol and Batumi eddy regions, reflecting the dynamic nature of coastal circulation in these areas. These complex dynamics may not be adequately resolved by the model, potentially contributing to elevated SLA errors in these areas.
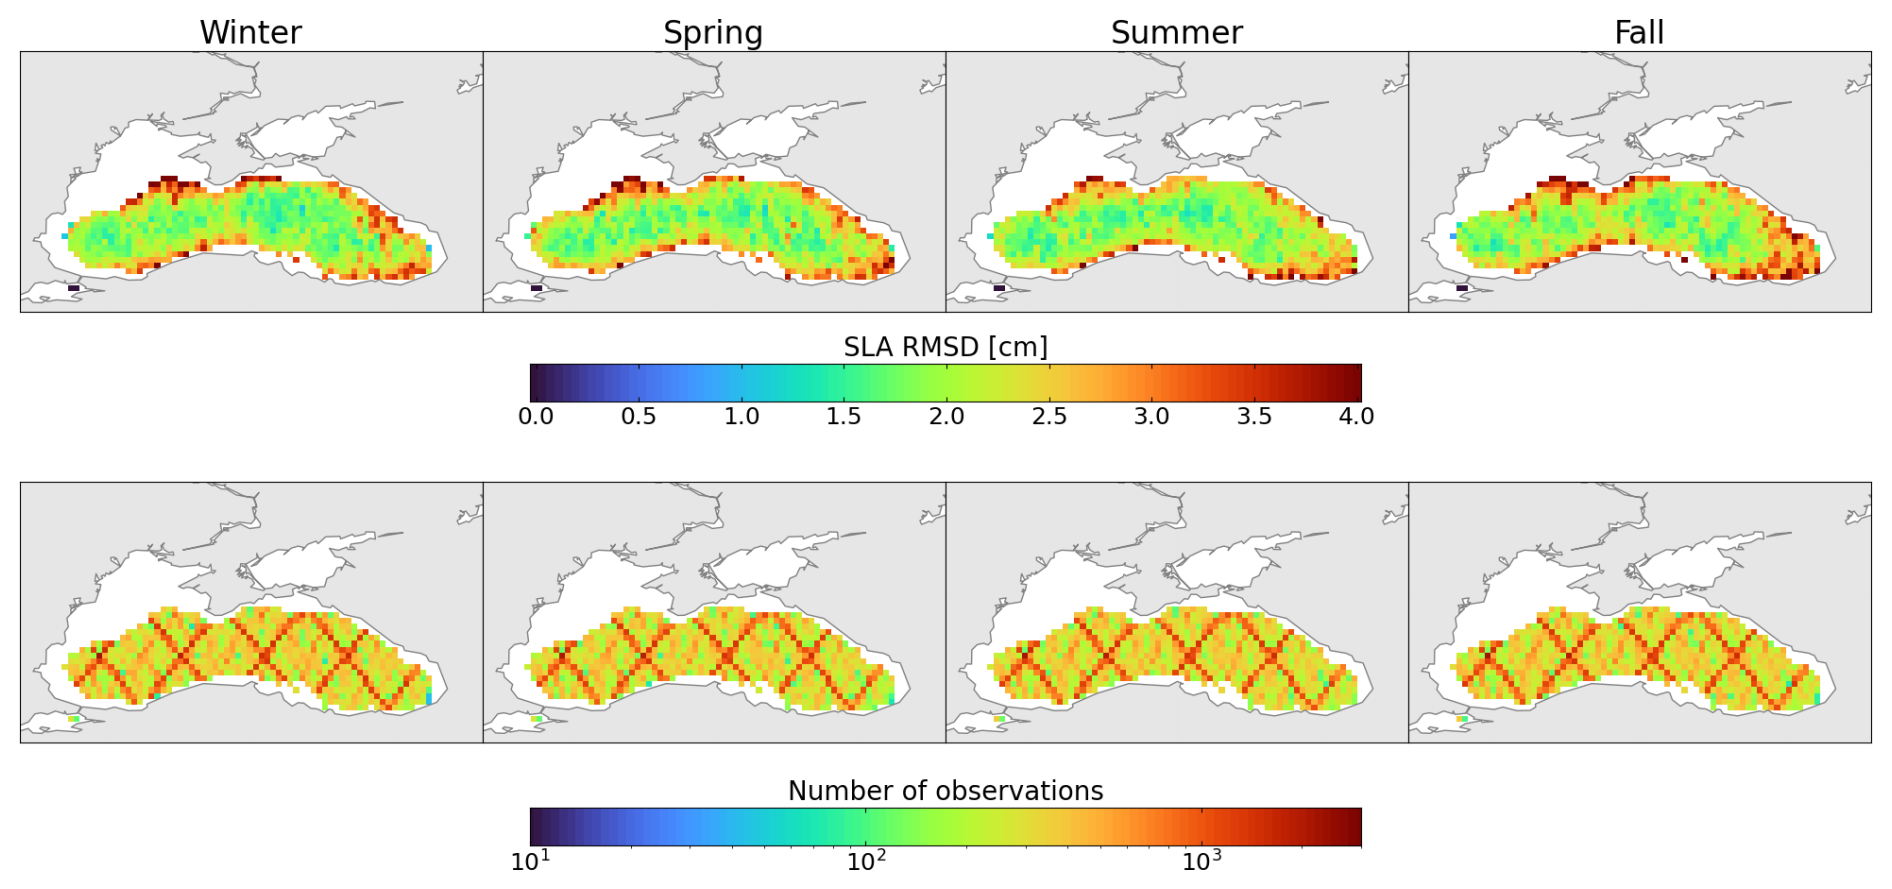
Figure 6Seasonal maps of the mean RMSD (top) of the SLA (cm) with respect to the satellite along-track SLA product over the period between 1993 and 2022. Bottom maps indicate the number of observations for each season.
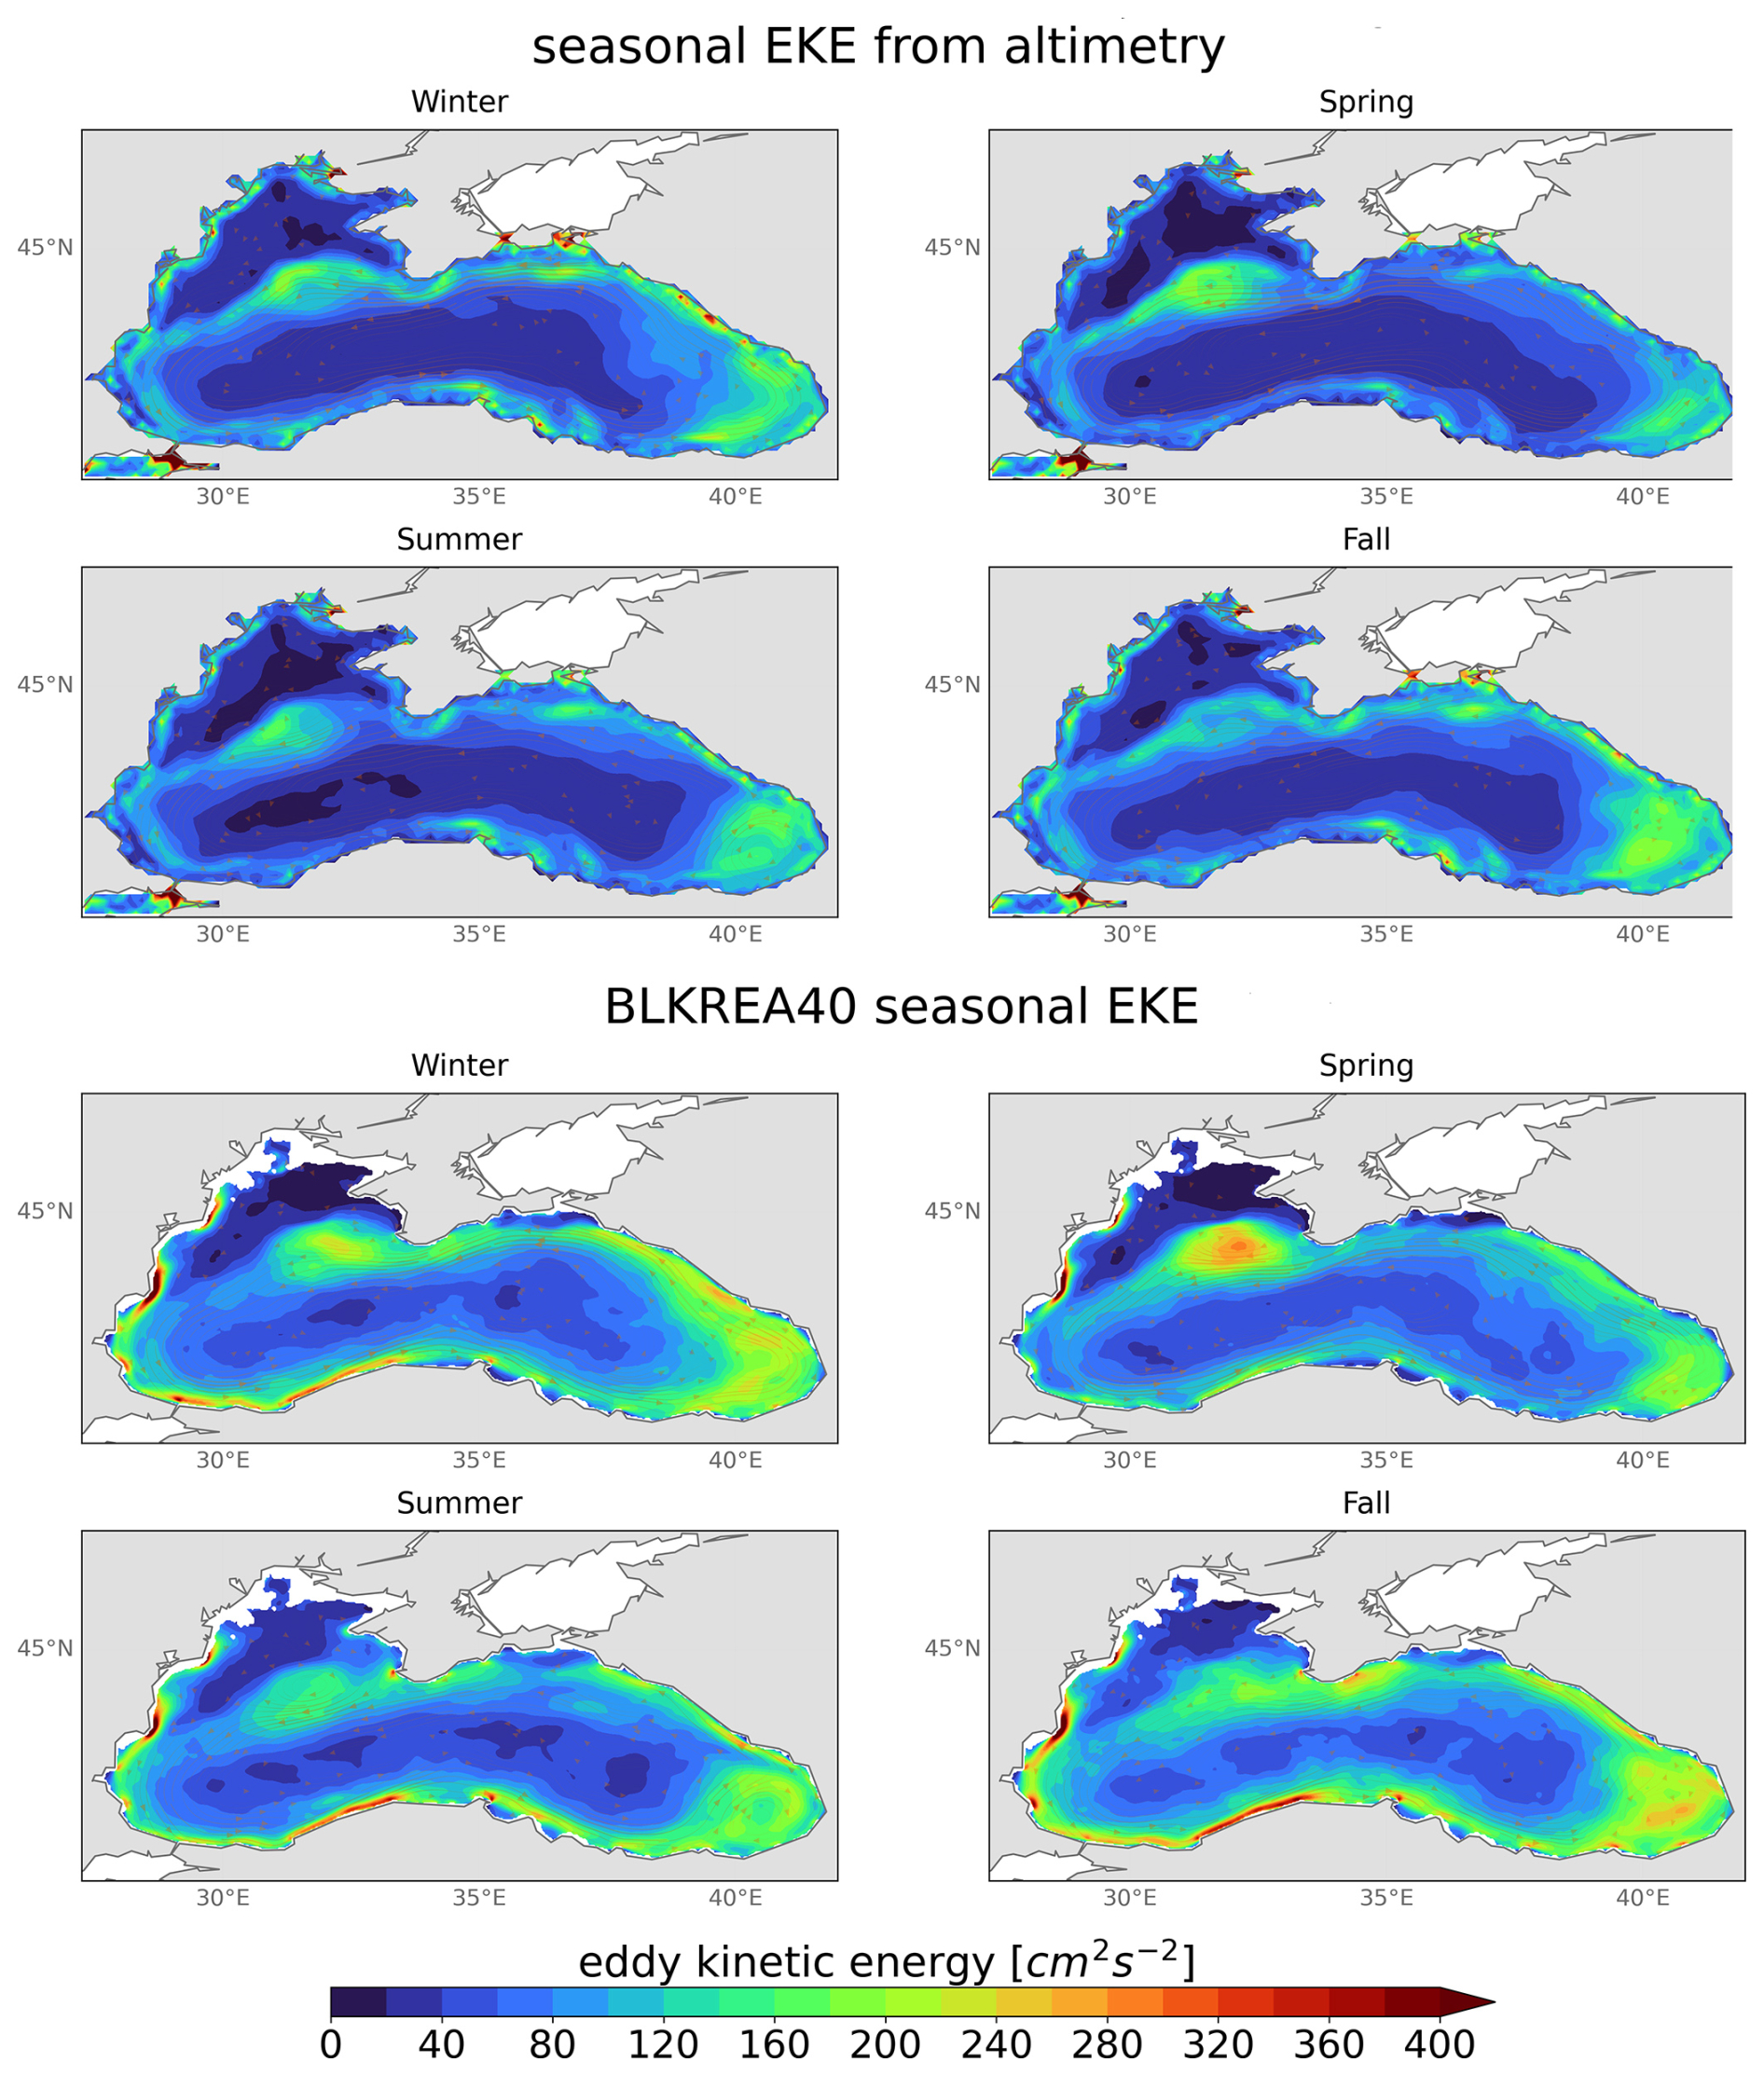
Figure 7Seasonal maps of eddy kinetic energy (EKE) (cm2 s−2) from satellite SLA L4-product and BLK-REA over the period between 1993 and 2022, based on the surface geostrophic velocity component.
This interpretation is further supported by EKE maps (Fig. 7), which consistently show high energy levels in these regions, indicating intense mesoscale activity that aligns with the SLA discrepancies viewed in Fig. 6. EKE maps show elevated values along the Rim Current, particularly along the Caucasian coast. To ensure a clean comparison with altimetry-derived estimates, BLK-REA EKE was computed from the geostrophic component only, using SSH from the model. BLK-REA EKE values generally exceed those derived from altimetry, especially in the Batumi and Sevastopol eddies, where peak values reach about 300 cm2 s−2 in fall and spring, respectively, compared to altimetry-based estimates of around 220 cm2 s−2. This difference likely reflects multiple factors, including the spatial smoothing inherent to the 0.25° Level-4 altimetry product, the reduced capability of altimetry to capture smaller-scale variability due to mapping and interpolation procedures, and possible over-energetic behaviour of the model arising from its higher resolution, physical parameterizations, and potentially insufficient dissipation of mesoscale energy.
3.2 Ocean monitoring indicators
We present a set of OMIs computed from the BLK-REA: OHC anomalies, Rim Current interannual variability, and meridional overturning circulation. These indicators are used to monitor key aspects of the Black Sea state and its variability. For the OHC OMI, the evaluation is further supported by a multi-product ensemble analysis combining BLK-REA, GLORYS12, ARMOR3D (Greiner et al., 2025), and CORA5.2 (Szekely et al., 2019), enabling quantitative comparison and uncertainty estimation using independent products. For the remaining indicators, such as the Rim Current index and meridional overturning circulation, ensemble-based analyses are not feasible due to the limited availability of high-resolution velocity data for the Black Sea. Assessments are therefore based on comparisons with studies using earlier versions of the Black Sea reanalysis.
3.2.1 Ocean heat content
Figure 8 illustrates the time evolution of basin-averaged temperature, with the 8 °C isotherm selected to track the Black Sea CIL over time. The formation of the CIL is mainly associated with water cooling during the winter season, and its presence is consistently observed until 2008. From 1993 to 2008, the CIL extends from the surface to approximately 100 m in depth. After 2008, this pattern exhibits a significant shift, as temperatures rise, leading to the frequent disappearance of the CIL. Nevertheless, instances of CIL formation are also observed in 2012, with a reduced extent in 2017, consistent with Argo float measurements (Stanev et al., 2019). More recently, a very weak CIL formed in March 2022, as documented by Çokacar et al. (2024), who attributed this event to intense cold-air masses that caused severe weather conditions across southern Europe, including the Black Sea, and influenced CIL formation.
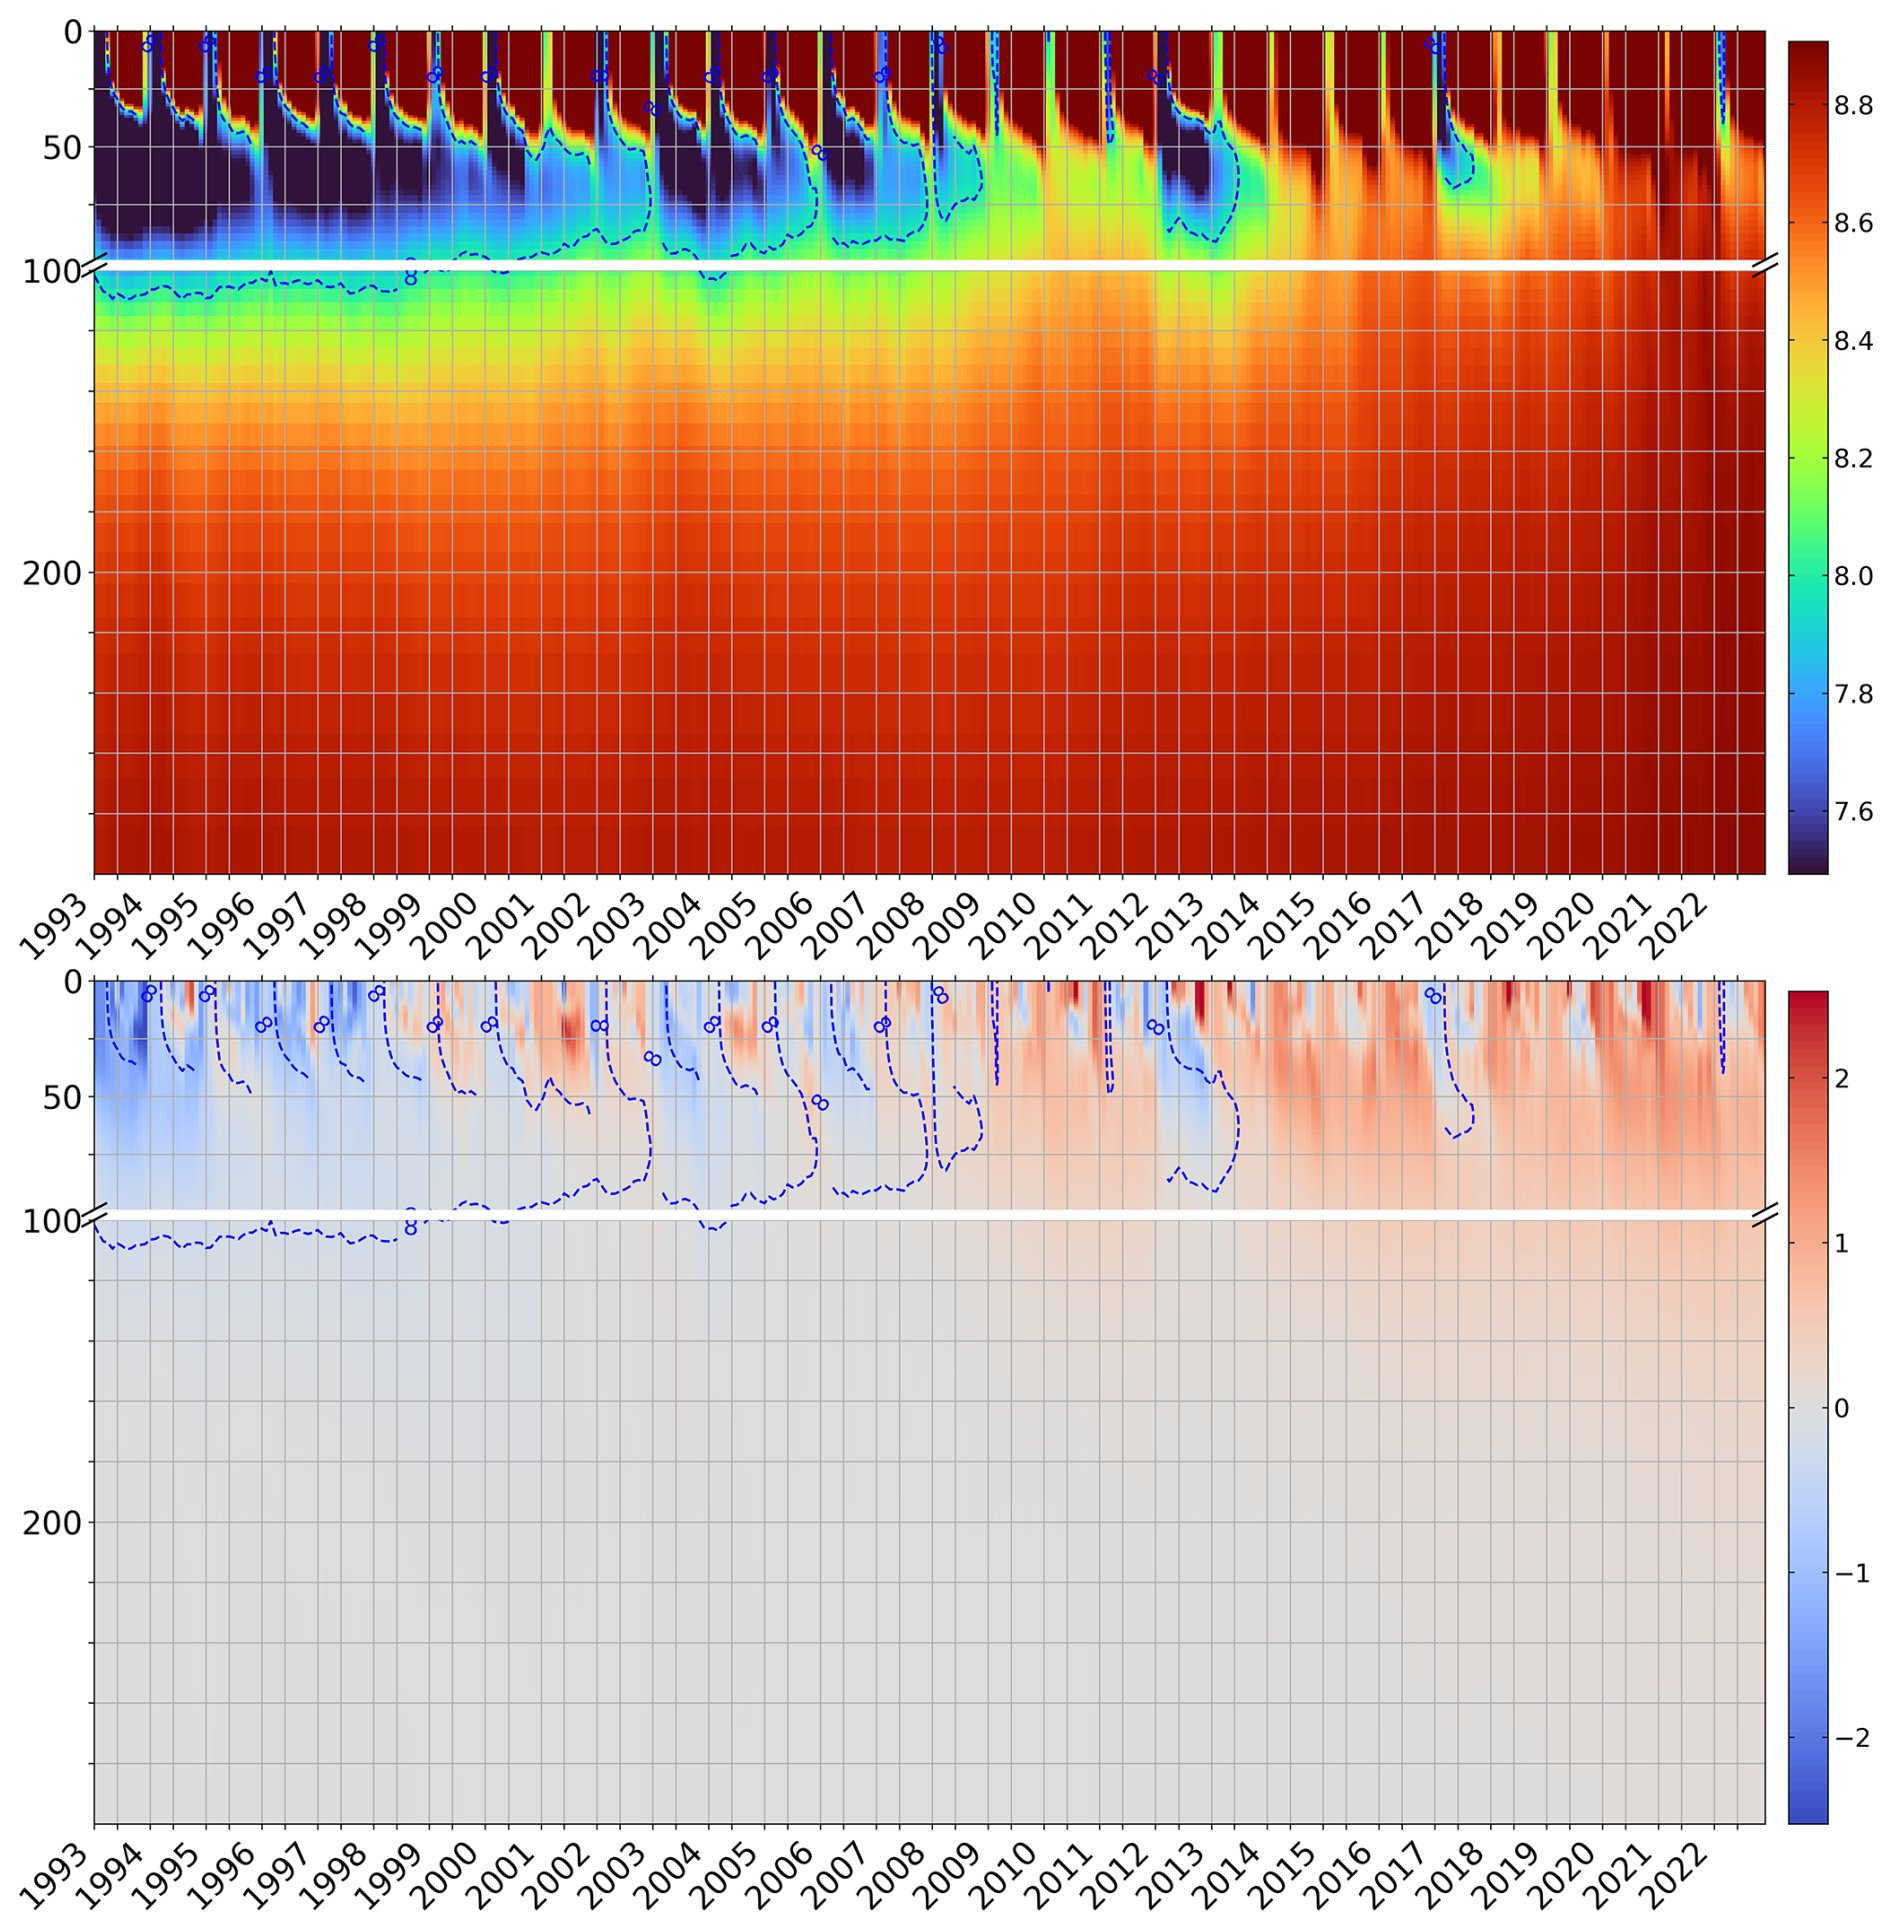
Figure 8Hovmoller (time-depth) diagrams of monthly basin-averaged temperature in °C (top) and anomaly of temperature in °C (bottom). The monthly anomaly estimates considered the climatological period 1993–2014 of each corresponding month. The blue dashed line indicates the mean position of the 8 °C isotherm (top).
The warming signal is evident in the Hovmöller diagram of temperature anomalies, which shows a predominance of positive values starting in 2009. Occasionally, positive values are interrupted by negative anomalies in the upper layers, as seen in years with the presence of the CIL: 2012, 2017, and 2022.
The analysis of ocean heat content in the Black Sea follows the formulation outlined by Lima et al. (2020), as described by the equation below:
with ρ0 equal to 1020 kg m−3 and cp equal to 3980 J kg−1 °C−1 are, respectively, the density and specific heat capacity; and dz indicates a certain ocean layer limited by the depths z1 and z2; Tm corresponds to the monthly averaged temperature and Tclim is the climatological temperature of the corresponding month. In this study, OHC is calculated as the deviation from the reference period of 1993–2014. Following Lima et al. (2020), a multi-product ensemble analysis is used to support the evaluation of OHC variability. The ensemble mean and spread are computed from BLK-REA, GLORYS12, ARMOR3D, and CORA5.2, while individual BLK-REA OHC values are shown separately. The temporal evolution of the ensemble mean and the BLK-REA OHC is presented in Fig. 9. For BLK-REA, the analysis covers the period 1993–2022, whereas the ensemble analysis is restricted to 2005–2022, corresponding to the period of increased and more consistent Argo float coverage in the Black Sea, which ensures improved temporal sampling and comparability across products.
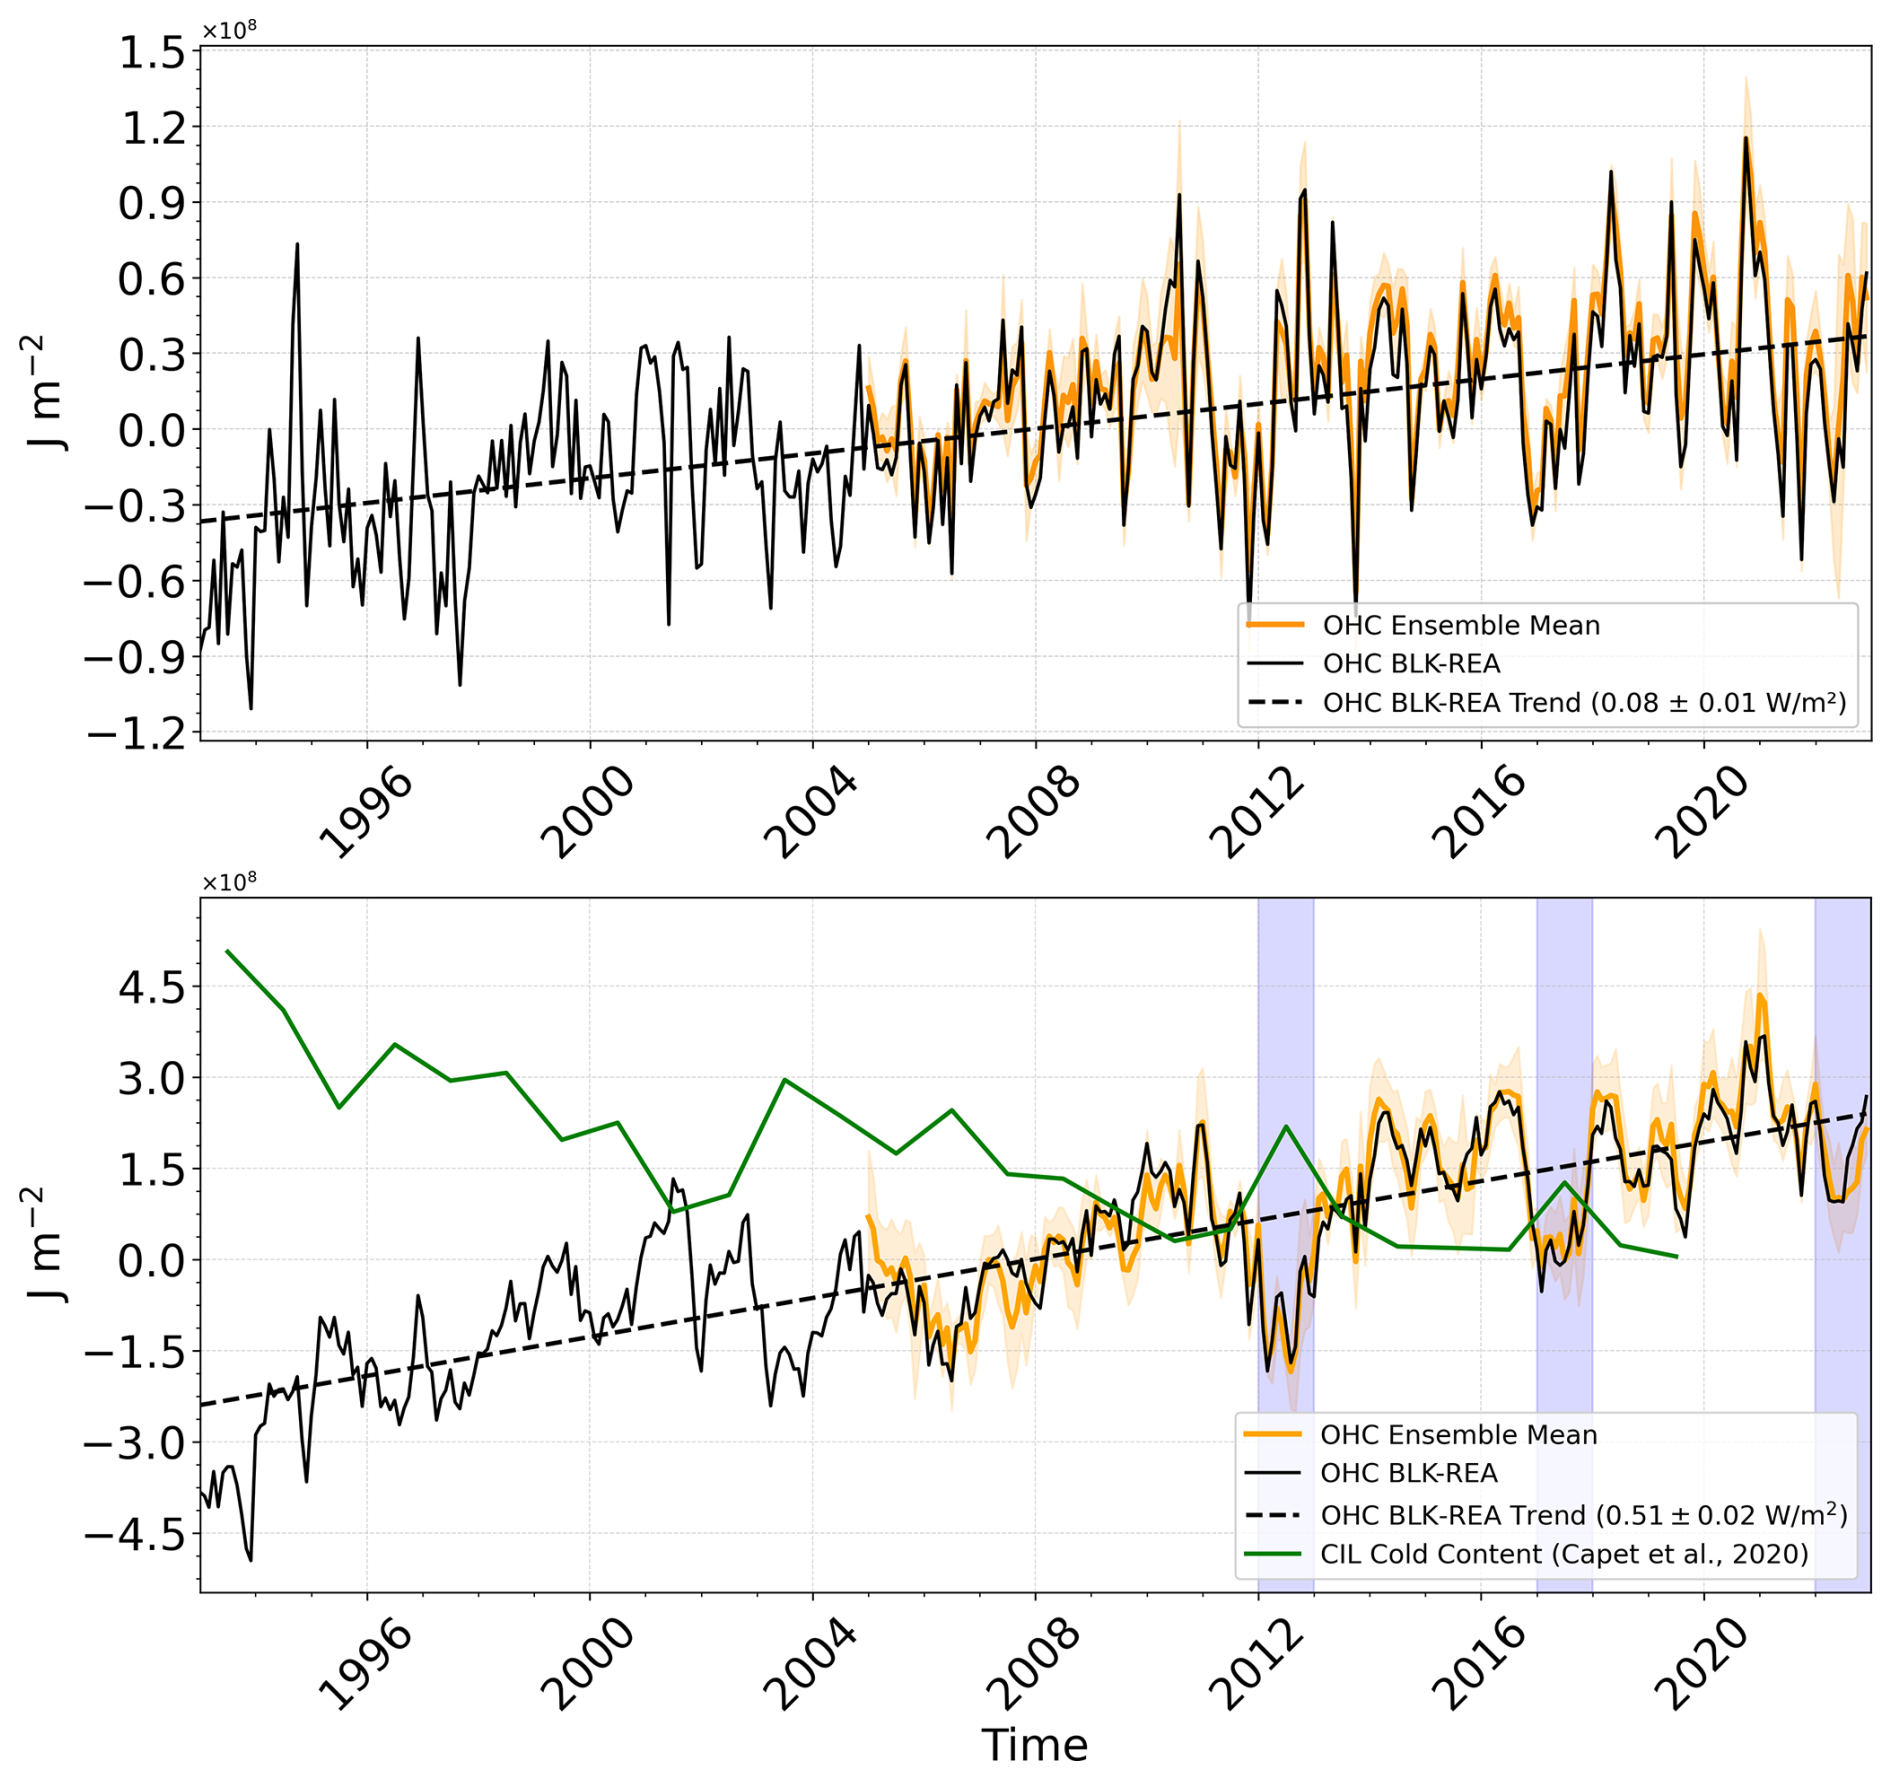
Figure 9Monthly basin-averaged of the OHC anomalies (in J m−2) in 0–10 m (top) and 0–100 m (bottom). The anomalies are defined as the deviation from the climatological OHC mean (1993–2014) of each corresponding month. The black curve represents the basin-averaged values estimated from the BLK-REA for the period 1993–2022, and the mean trend values are indicated by dashed black lines for each layer (bottom right corner). The orange curve shows the ensemble mean for the period 2005–2022, with the shaded envelope around the curve representing the ensemble spread over time. In 0–100 m (bottom), the green curve corresponds to the CIL cold content from Capet et al. (2020). The blue shades highlight the recent years when the CIL is present: 2012, 2017 and 2022.
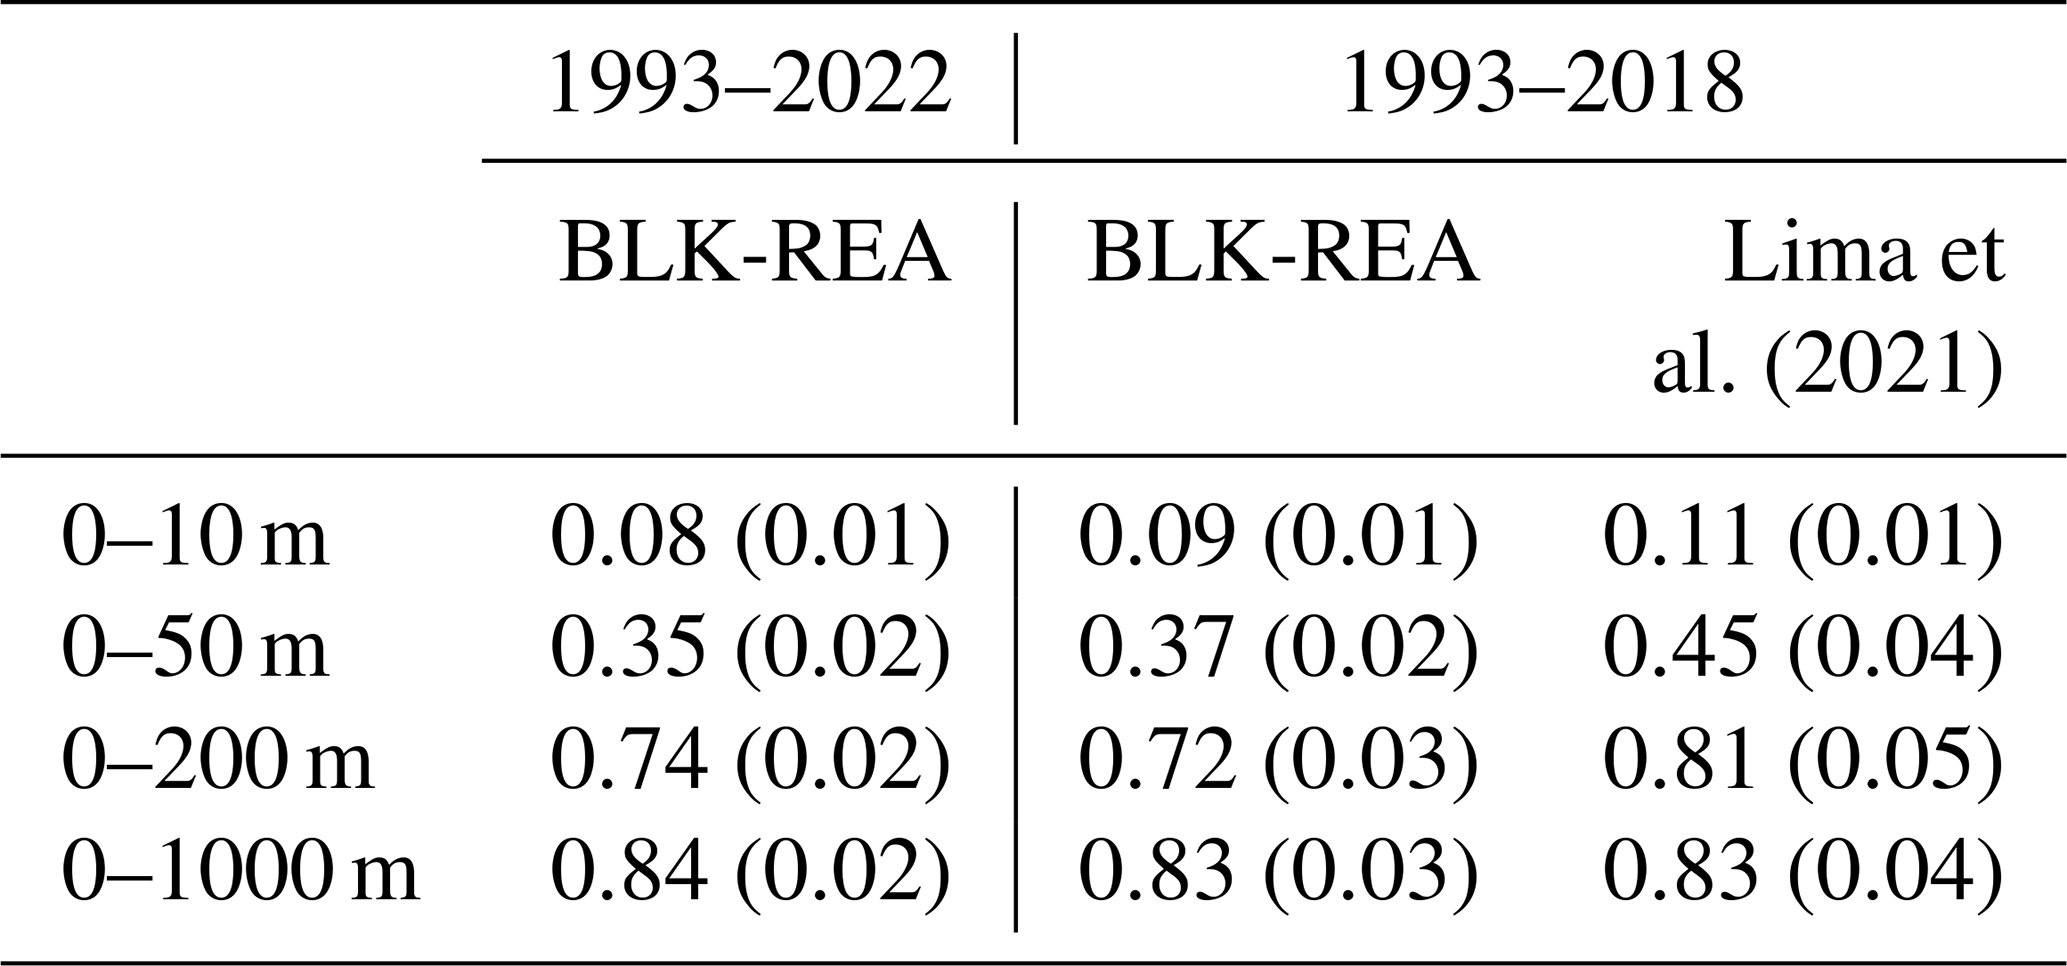
The OHC in both the 0–10 and 0–100 m layers shows an overall warming trend, with values of 0.08 and 0.51 W m−2, respectively (Fig. 9). Table 1 shows OHC trends within other layers to compare the values with those reported by Lima et al. (2021), who analyzed OHC trends using the previous Black Sea reanalysis during the period 1993–2018. In general, the newest BLK-REA shows lower OHC trends. In the 0–10 m layer, the OHC curve shows several positive peaks around 1 × 10⁸ J m−2 in 2010, 2012, 2018, and 2020. In contrast, negative peaks are observed in 1993, 1997, and 2001. An interesting observation is that although the CIL is present in 2012, there are positive anomalies in the upper layers that year. This suggests that colder waters from the upper layers, which subducted in 2011, may have reached the CIL levels in 2012. These features are visible in the Hovmöller diagrams of basin-averaged temperature anomalies (Fig. 8). The CIL signal is clearly present in the 0–100 m layer in 2012. Additionally, the OHC shows a clear agreement with the CIL cold content observed in the data, which was estimated by Capet et al. (2020) using temperature observations from various platforms. Specifically, years of higher heat content correspond to a reduction in CIL cold content, while years of lower heat content coincide with an increase in CIL cold content. In more recent years, the CIL cold content values are nearly zero, except for 2012 and 2017, when the values exceeded 1.5 × 10⁸ J m−2 in 2012 and were slightly below this threshold in 2017; see the green curve in Fig. 9. Correspondingly, both years show a decrease in OHC, reinforcing the relationship between CIL cold content and heat content variability. The BLK-REA and ensemble-mean time series exhibit a similar temporal evolution, while the relatively stable ensemble spread suggests overall agreement among the products throughout the analysis period.
Table 1Trends estimations together with the 95 % confidence interval (in brackets) for the ocean heat content anomaly (W m−2) from BLK-REA for the periods 1993–2022 and 1993–2018, and from the previous Black Sea reanalysis (Lima et al., 2021) for the period 1993–2018.
3.2.2 The Black Sea overturning circulation
We follow the methodology of Ilicak et al. (2022), computing the meridional overturning circulation (MOC) in density space to better represent water mass transport in the Black Sea. We divide the water mass structure of the Black Sea in 50 different σ2 (σ2; potential density anomaly with [kg m−3] respect to a reference pressure of 2000 dbar) density bins and compute the MOC using the formula:
where ℋ is the Heaviside function and ν is the meridional velocity. We used 100 σ2 density bins to remap the mass flux fields.
A very narrow cell with positive values (clockwise circulation) of approximately 0.03–0.04 Sv is observed just below 26 kg m−3 around 43° N (Fig. 10). However, at densities higher than 26 kg m−3, the MOC structure predominantly exhibits negative values (indicative of anticlockwise circulation), exceeding −0.03 Sv. At a density of approximately 25.5 kg m−3, the MOC forms a dipole pattern, with slightly positive values between 42 and 44.5° N and negative values south of 42° N. Above this, the circulation remains anticlockwise until approximately 23.75 kg m−3, where a clockwise pattern re-emerges between 23.75 and 22 kg m−3 , with positive transport exceeding 0.02 Sv. Nonetheless, within this layer, localized negative values are observed, particularly around 45° N. In general, below 23.75 kg m−3, there is a predominance of anticlockwise circulation, especially in the southern part of the basin, likely associated with the inflow of Mediterranean Water into the Black Sea. Above this isopycnal, positive values indicate a clockwise circulation, which is linked to the formation of the CIL. These findings are consistent with the results of Ilicak et al. (2022).
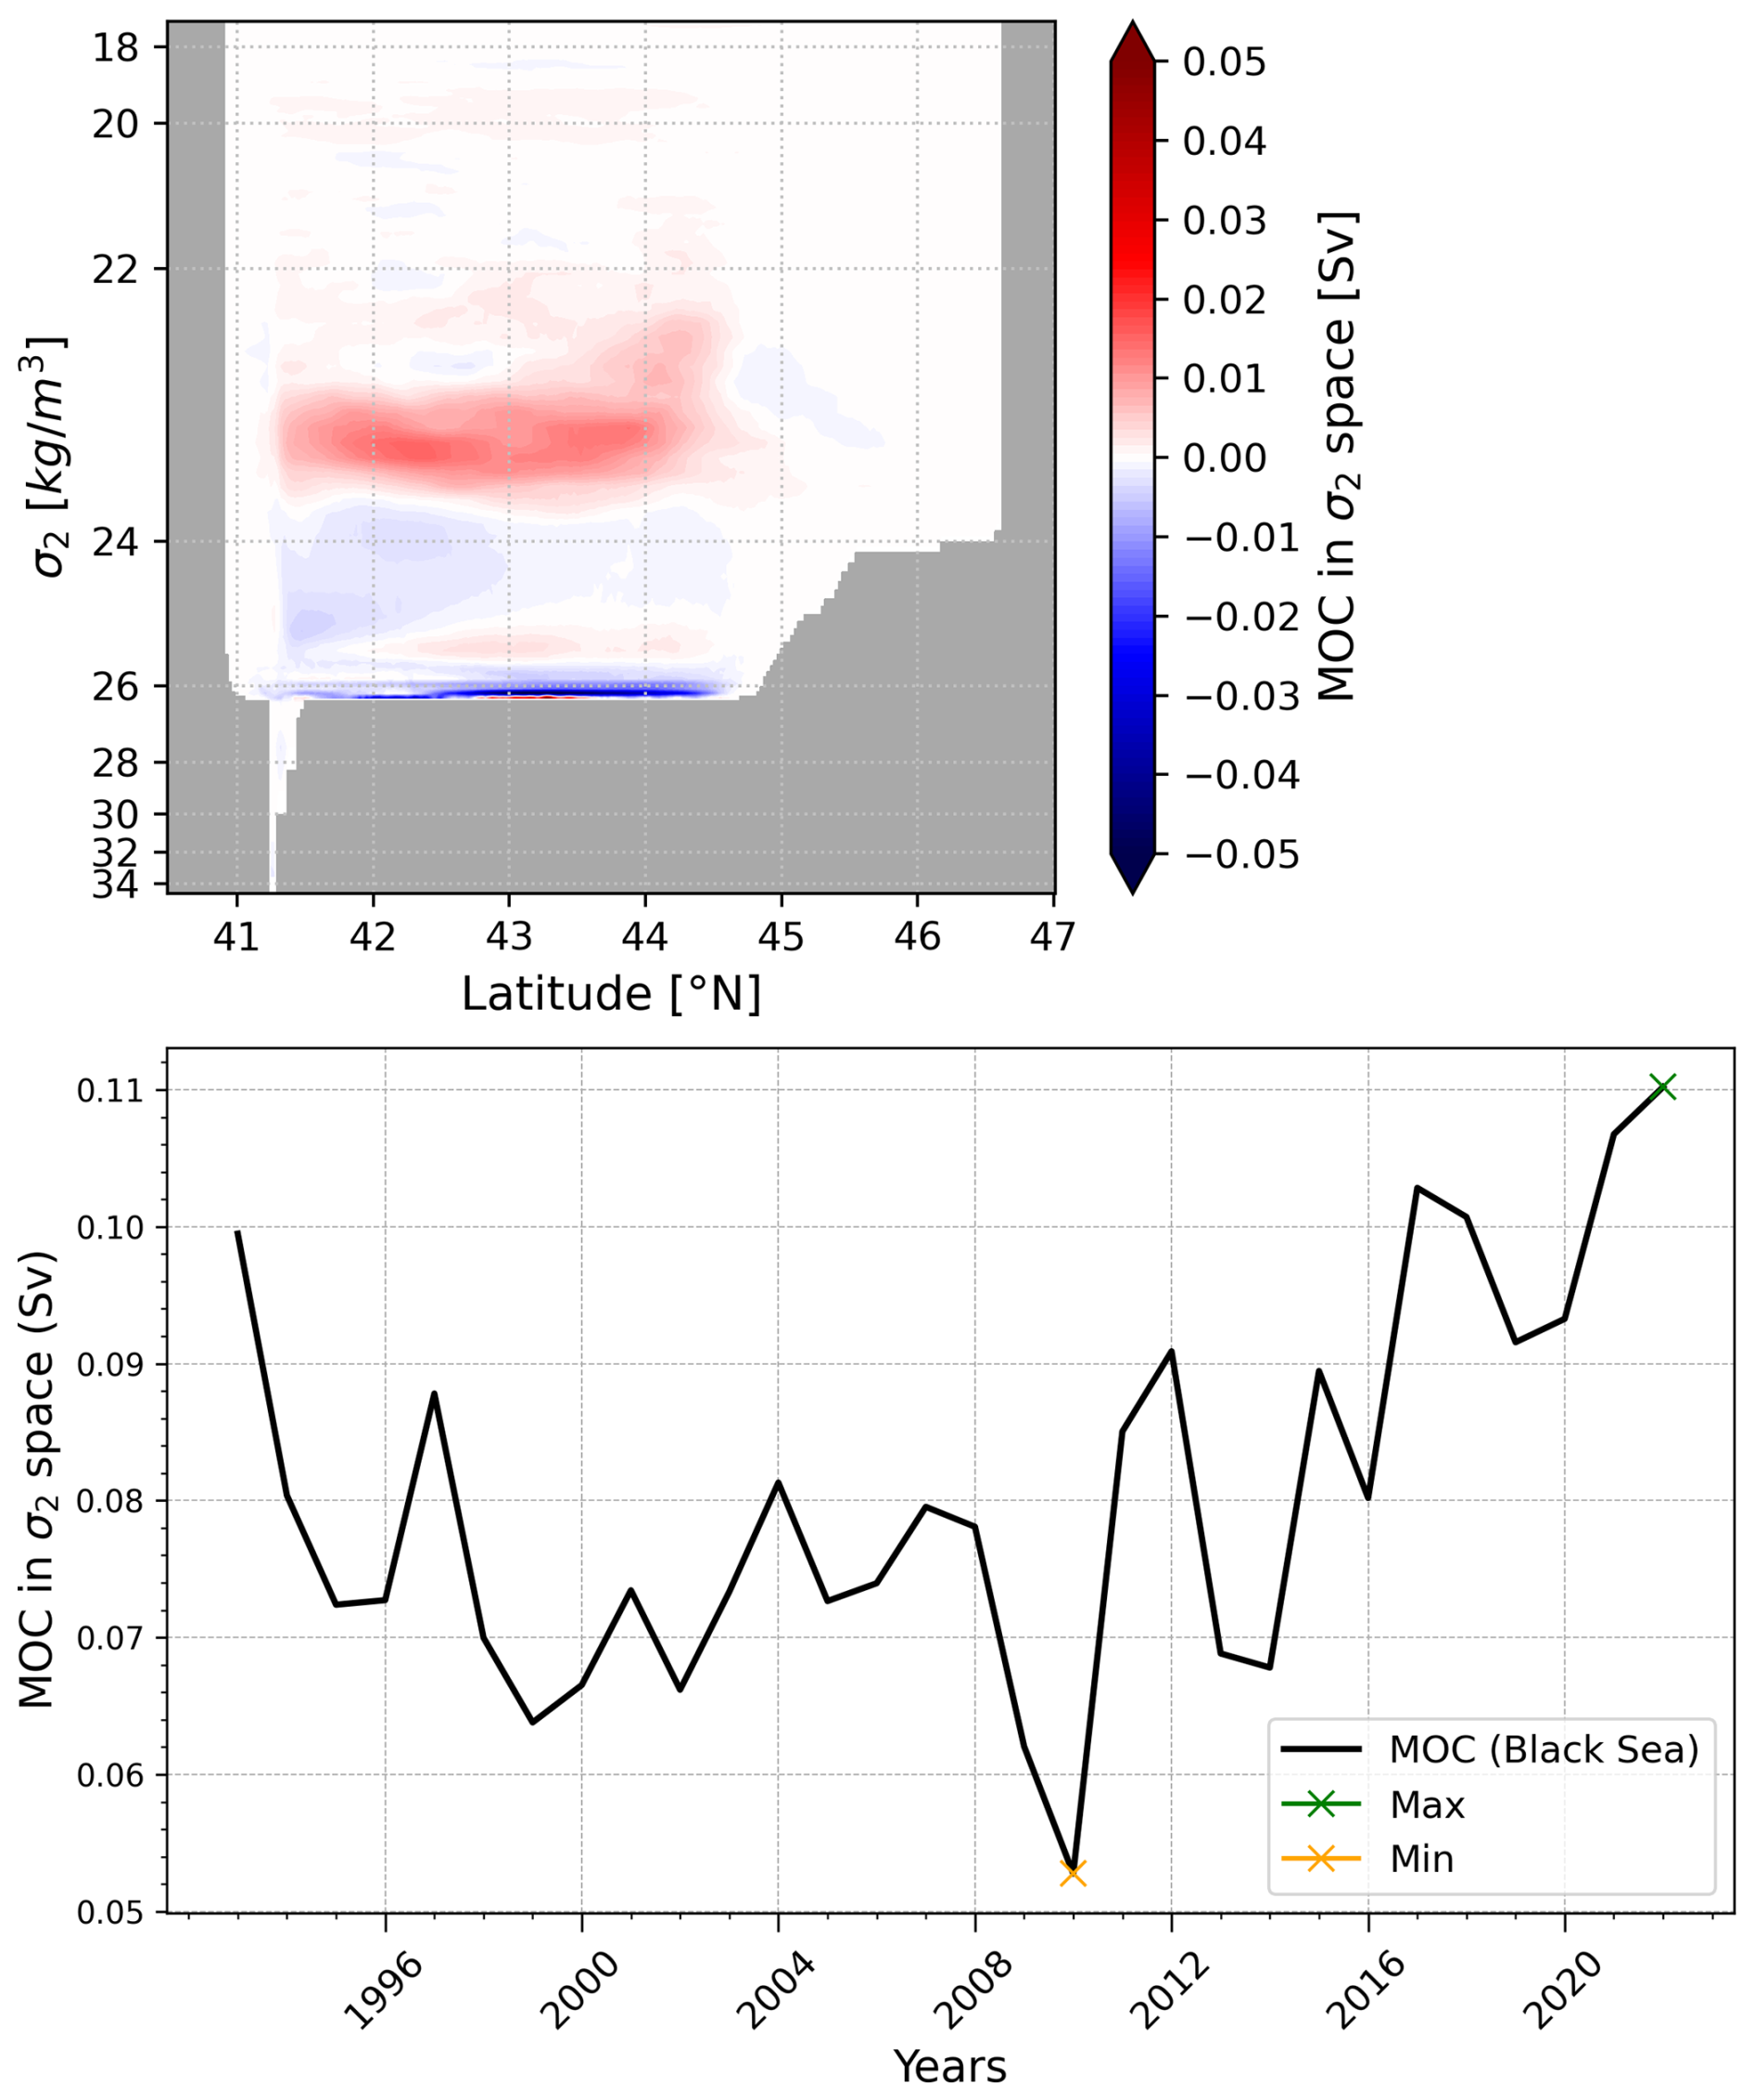
Figure 10Time-mean overturning transport in density space (top); Time evolution of the maximum BLK-MOC in density space between 22.45 and 23.85 kg m−3 (bottom). Green crosses indicate the maximum in 2022 and orange crosses indicate the minimum in 2010.
Next, we identify the maximum MOC in density space for the Black Sea between 22.45 and 23.85 kg m−3, corresponding to depths of approximately 25 to 80 m (Ilicak et al., 2022). The MOC declined from 0.1 Sv in 1993 to a minimum of nearly 0.01 Sv in 2010. After 2010, the MOC exhibited alternating periods of increase and decrease, but with an overall upward trend, reaching its highest values of almost 0.12 Sv in 2022. Stanev et al. (2019) reported that the Black Sea MOC has weakened over the past 30 years, possibly due to anthropogenic global warming. In recent years, the CIL has nearly disappeared, as shown by observational data and reanalysis results (Stanev et al., 2019; Lima et al., 2021; Capet et al., 2020), as also discussed in the OHC section (Figs. 8 and 9). Ilicak et al. (2022) associated the decline in MOC with the loss of CIL cold content between 1993 and 2010. However, since 2010, the MOC has started to increase, while the CIL is only present in 2012 and remains very weak in 2017 and 2022. Different water mass transformations could be the potential mechanisms behind an increase in the MOC. Specifically, an increase in salinity could compensate for the decrease in the formation of cold, dense water, which would otherwise weaken the circulation. Reanalysis model results show that there is an upward trend of sea surface salinity (SSS) in the Black Sea. In addition, running multiple cycles of decadal reanalysis simulations is likely necessary to achieve a more accurate spin-up of the deep ocean. However, to investigate the detailed dynamics of the MOC in the Black Sea, further research is required. This should involve using multi-cycle reanalysis model simulations combined with passive tracers, such as ideal age, to better understand the circulation patterns and timescales.
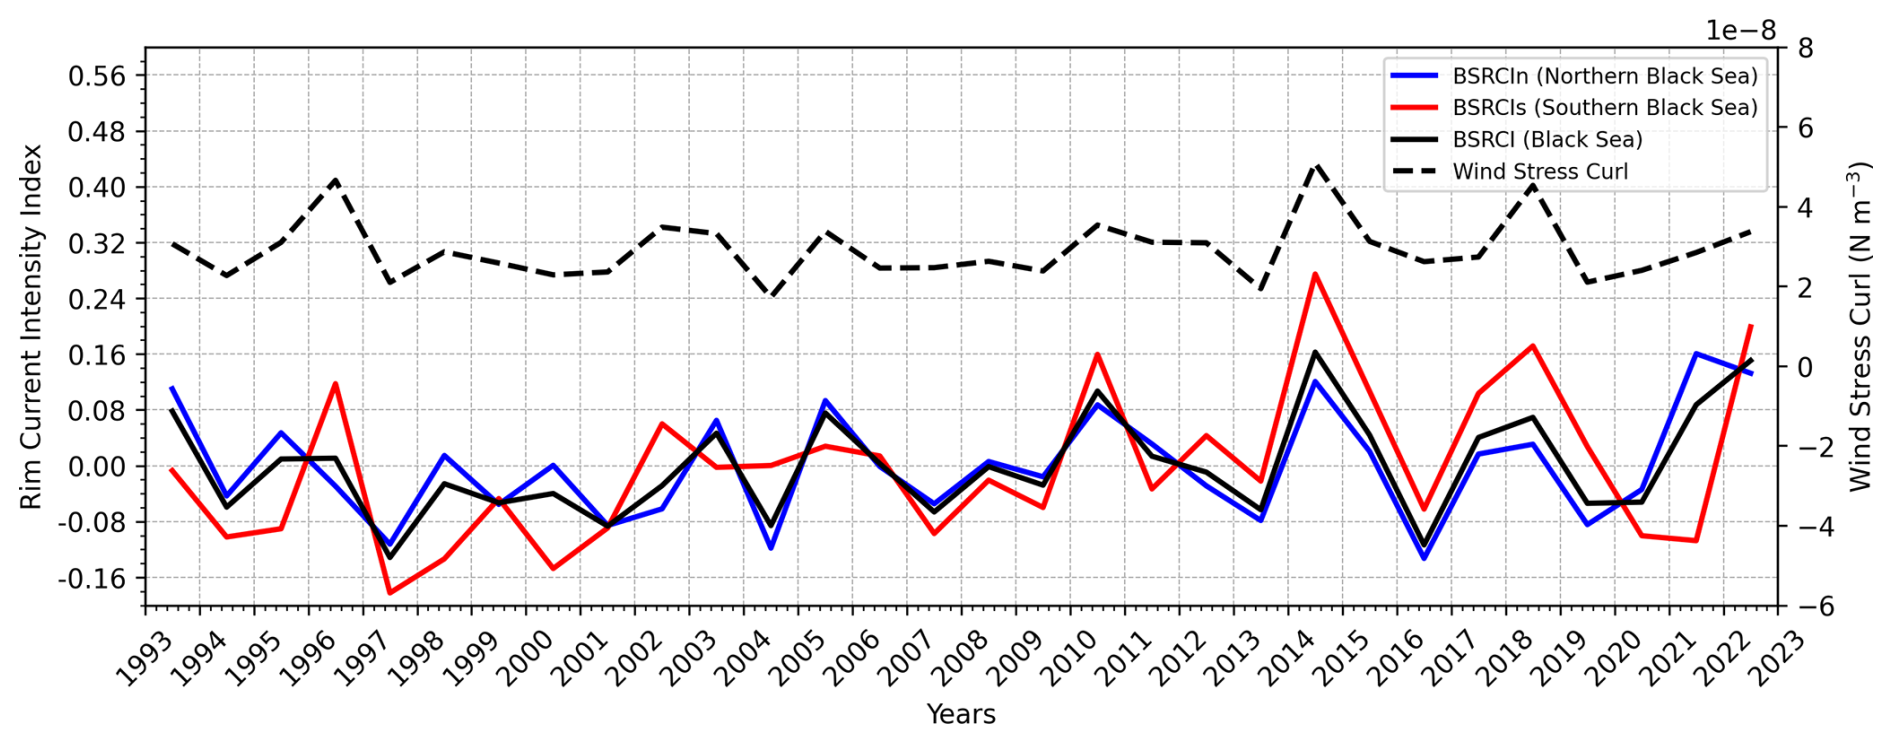
Figure 11Time series of the Black Sea Rim Current Index (BSRCI; black) at the north section (BSRCIn; blue), south section (BSRCIs; red), the average (BSRCI) and its tendency for the period 1993–2020. The black dashed curve represents the annual mean wind stress curl (N m−3) averaged for the Black Sea based on the ERA5 reanalysis.
3.2.3 The Rim Current interannual variability
The Rim Current is the dominant cyclonic gyre that defines the general circulation of the Black Sea. The Black Sea Rim Current Intensity Index (BSRCI) measures the strength of this current in a given year relative to the multi-year average. It is based on the average surface current velocity in the Rim area confined by the isobaths of 200 and 1800 m. Two sections are chosen as representative for the Rim current: a northern section between 33–39° E, and a southern section between 31.5–35° E. For each section, the BSRCI is defined as:
with the annual average surface current speed in the respective area and the long-term average over the period 1993–2022. In this way, the index is close to zero when the annual mean state is near normal, while positive values indicate a stronger Rim Current, and negative values represent a weaker one (Peneva et al., 2021). The BSRCI OMI provides the intensity of the Rim Current in both the Northern and Southern Black Sea. In this study, we present updated results based on the latest data from the Black Sea reanalysis. The values are predominantly negative before 2010, with a notable negative peak below −0.2 in 1997 (Fig. 11). After 2010, the values alternate between negative and positive, with positive peaks observed in 2014, 2017, 2020, and 2022. The BSRCI peak in 2014 exceeds 0.15 and reaches a maximum of over 0.25 in the southern branch. The intensity in both branches generally coincides, though the southern branch typically exhibits higher values. Peneva et al. (2021) also identified a peak in 2014 using results from the previous Black Sea reanalysis. The current analysis reveals a trend of +2.9 % per decade, which is a value compatible with Peneva et al. (2021) as well.
We also present the wind stress curl (Fig. 11), diagnosed using the NEMO bulk formulation at the model's native resolution, based on ERA5 wind data. As previously suggested by Stanev et al. (2000) and further examined by Peneva et al. (2021), the wind stress curl plays a key role in modulating the Rim Current. Our results support this relationship, showing strong agreement between years of enhanced mean wind stress curl and increased intensity of the Black Sea Rim Current Index (BSRCI), particularly in 2014 and 2018. This correspondence is especially evident in the southern section of the basin.
The new BLK-REA features a higher model resolution, providing a more consistent and accurate representation of Black Sea physics. The updated configurations include the use of LOBCs, allowing improved water exchange through the Bosphorus Strait. This enabled further refinements in the freshwater balance to be implemented, such as incorporating hourly precipitation data and monthly runoff for the Danube River. These improvements were not possible in the previous Black Sea reanalysis, as its closed boundaries required a controlled freshwater balance to prevent drifts in SSH. The comparison with a state-of-the-art global reanalysis further emphasizes the importance of maintaining a dedicated regional reanalysis for the Black Sea (see Appendix A), as the higher spatial resolution and region-specific configurations of BLK-REA lead to superior skill in representing sea level, temperature, and salinity, particularly in the upper and intermediate layers where regional processes dominate.
Overall, the BLK-REA results are highly satisfactory for key ocean variables, including T, S, SLA. T accuracy exhibits strong seasonality, with the basin-averaged RMSD of SST reaching its lowest value in spring (0.43 °C) and its highest in fall (0.61 °C). At depths within the seasonal thermocline, BLK-REA shows high RMSD errors for T in fall and summer, while errors are lower in winter and spring. In contrast, salinity shows less seasonal variation, with the highest errors consistently occurring in the 50–200 m layer throughout most of the period (Fig. 3). Occasionally, salinity errors are also elevated at the surface. SLA errors do not exhibit clear seasonality and have remained around 0.02 m since 2000; an acceptable level considering that the SLA observation error used in data assimilation is approximately 0.04 m. Across all seasons, the highest SLA errors are observed along the Rim Current, primarily due to high mesoscale activity along its pathway.
The reanalysis has proven to be an important tool for investigating the warming trend in the Black Sea, highlighting the recent disappearance of the CIL. Both T and OHC exhibit a warming signal. In the 0–100 m layer, the warming trend is occasionally interrupted, with decreases in OHC coinciding with periods of CIL presence, as observed in 2012, 2017 and 2022 (Fig. 9). Between 1993 and 2010, the decline in CIL formation may have influenced the MOC in the Black Sea. However, further investigations are needed to understand the recent increase in MOC and its relation with the CIL formation. Our results also reveal the significant influence of wind stress curl on the interannual variability of the Rim Current, with a particularly strong signal observed in its southern branch.
The BLK-REA dataset presented in this manuscript has been available online in the Copernicus Marine Service catalog since December 2024 and is extended monthly in Interim mode, which applies less refined configurations for preliminary processing. The Interim results are replaced annually with an extension of the reanalysis produced using optimal configurations and the assimilation of reprocessed data, which is considered the highest quality of observations. In alignment with the Black Sea near-real-time analysis and forecasting system, preparations for the next BLK-REA are already underway. Planned improvements include the integration of the Azov Sea in the model domain and the inclusion of runoff data from the European Flood Awareness System (Thielen et al., 2009). The plan also includes extending the reanalysis to cover previous decades, starting from 1980. This will allow for the extension of the existing OMIs and the preparation of new ones. In fact, tracking the warming signal in the Black Sea is essential, and our plan is to expand the analysis of the impacts of this warming, including monitoring marine heatwaves.
However, a major challenge is the limited availability of observations from 1980 onward. To address this gap, it may be necessary to integrate additional in-situ datasets beyond those available from SeaDataNet and Copernicus. Therefore, continuous monitoring of the Black Sea – particularly by enhancing observation systems – is crucial for maintaining the quality of reanalysis. In recent years, ongoing advancements in observation technologies and data integration have become increasingly important to further improve reanalysis accuracy and support long-term environmental studies.
Appendix A presents a quantitative assessment of the performance of the regional reanalysis BLK-REA over the Black Sea, in comparison with the state-of-the-art global reanalysis GLORYS12, which features a coarser horizontal resolution of ° with 50 vertical levels, assimilates in situ observations, along-track SLA, and SST data, and is forced with ERA-Interim atmospheric reanalysis (Dee et al., 2011) until 2018 and ERA5 thereafter. Additional details on GLORYS12 can be found in Lellouche et al. (2021). The evaluation focuses on key oceanographic variables, including SST, subsurface temperature and salinity, and SLA, using skill metrics to objectively quantify model performance. This comparison demonstrates the improved accuracy achieved by the regional BLK-REA, largely attributable to its higher horizontal resolution (°), basin-specific model configuration, and tailored parameterizations. Overall, these analyses emphasize the added value of maintaining a dedicated regional reanalysis system for the Black Sea, complementing and supporting the results discussed in the main text.
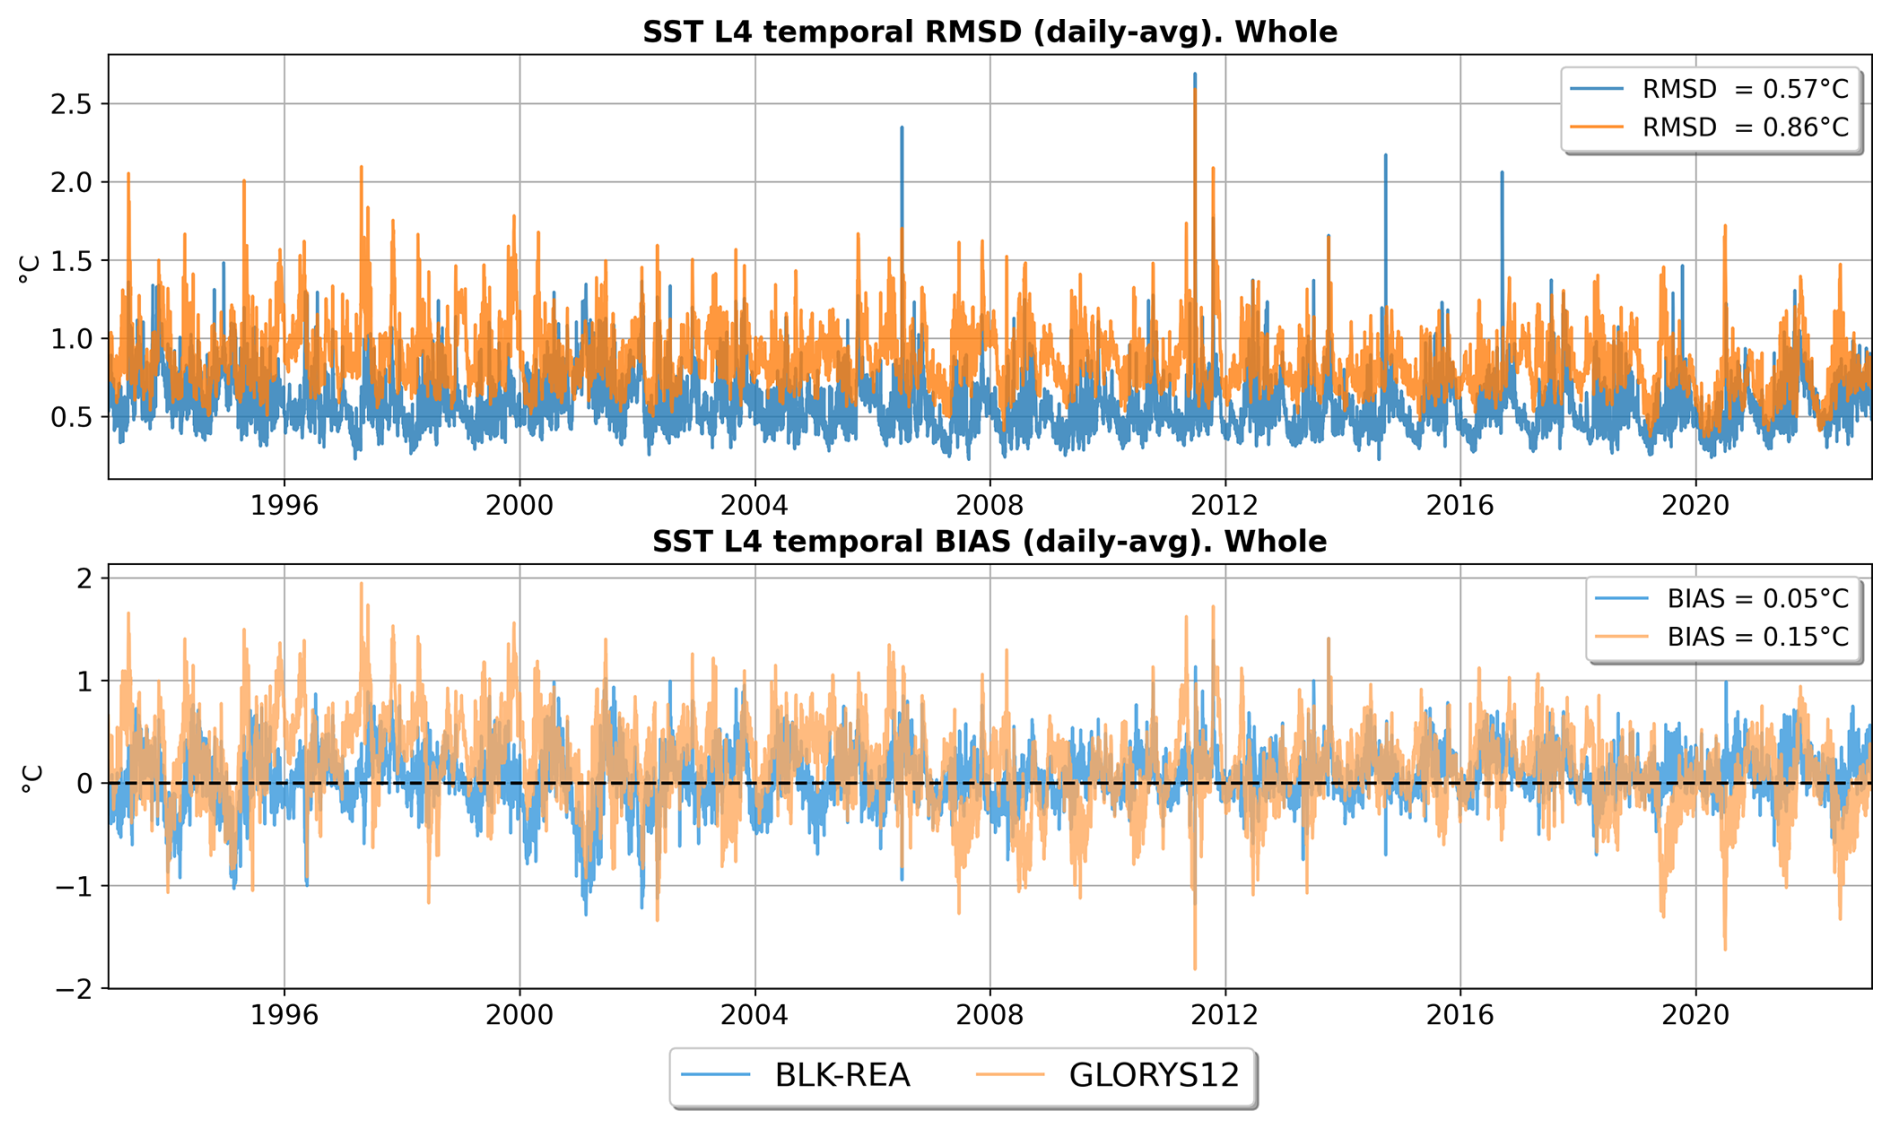
Figure A1Time series of SST RMSD (top) and SST bias (bottom), comparing the BLK-REA (in blue) and GLORYS12 (in orange) against a high-resolution reprocessed Level-4 satellite SST product (Pisano et al., 2016; Embury et al., 2024).
The SST evaluation is based on fully independent observations (Fig. A1), namely a high-resolution reprocessed Level-4 satellite SST product specifically developed for the Black Sea at ° spatial resolution (Pisano et al., 2016; Embury et al., 2024). The results show a consistently better performance of BLK-REA over most of the analyzed period, with a mean root-mean-square difference (RMSD) of 0.57 °C, compared to a higher mean RMSD of 0.86 °C for GLORYS12. Regarding the bias, BLK-REA values fluctuate around zero throughout the time series, while both products tend to exhibit more positive bias values during summer. The mean SST bias is 0.05 °C for BLK-REA and 0.15 °C for GLORYS12.
Until 2000, BLK-REA and GLORYS12 exhibit very similar SLA skill, with RMSD values decreasing from levels occasionally exceeding 4.5 cm in early 1993 to approximately 3 cm by the end of 2000 (Fig. A2). After 2000, BLK-REA exhibits a clear improvement, with spatially averaged SLA RMSD stabilizing around 2 cm for most of the time until 2022, well below the 4 cm instrumental error assumed in the assimilation. This improvement reflects the increased availability of satellite altimetry, which represents the main observational constraint of the system, given the scarcity of in situ profiles during most of the period. In contrast, GLORYS12 generally maintains higher RMSD values, remaining above 3 cm for most of the time and exceeding 4 cm during some time intervals. A slight increase in BLK-REA RMSD around 2016 coincides with the larger availability of Argo profiles; their joint assimilation with SLA may have marginally affected SLA performance due to the multivariate nature of the system. Nevertheless, RMSD values remain well within acceptable limits, and the comparison is intended to provide a general overview of SLA skill rather than a detailed attribution of small temporal fluctuations. For consistency, SLA assimilation and validation are performed only in regions deeper than 1000 m, which are arbitrarily assumed to represent the level of no motion in the configuration of the dynamic height operator.
Figure A3 presents the temperature skill over the entire basin for BLK-REA and GLORYS12. Overall, BLK-REA clearly exhibits better performance than GLORYS12 in terms of both RMSD and bias. Regarding RMSD, in the depth range of poorest skill – largely associated with the seasonal thermocline – BLK-REA shows RMSD values below 1.5 °C, whereas GLORYS12 exceeds 2.5 °C. BLK-REA also demonstrates improved performance in the upper layers, from the surface down to 500 m, where errors tend to converge toward subsurface depths. In terms of bias, BLK-REA maintains values close to zero throughout the water column, with a slightly negative bias in the 20–80 m layer. In contrast, GLORYS12 exhibits a much larger positive bias in the upper layers between 0 and 140 m, which compromises the representation of the Black Sea, reaching values close to 0.8 °C in the 20–40 m layer.
Figure A4 shows the salinity skill for BLK-REA and GLORYS12 over the entire basin. As for temperature, BLK-REA again exhibits substantially better performance than GLORYS12. Both reanalyses display their largest RMSD values in the near-surface layers; however, BLK-REA outperforms GLORYS12 in terms of overall accuracy, with RMSD values decreasing below 0.2 psu at greater depths. In contrast, GLORYS12 maintains higher RMSD values of around 0.5 psu from the surface down to approximately 80 m. With respect to bias, BLK-REA remains close to zero throughout the entire water column. Conversely, GLORYS12 shows a positive salinity bias in the upper layers, reaching values of about 0.2 psu in the upper 60 m, which may adversely affect the representation of near-surface and intermediate water masses. At deeper levels, GLORYS12 still exhibits slightly positive biases, which can reach values close to 0.05 psu in depth ranges below 300 m.
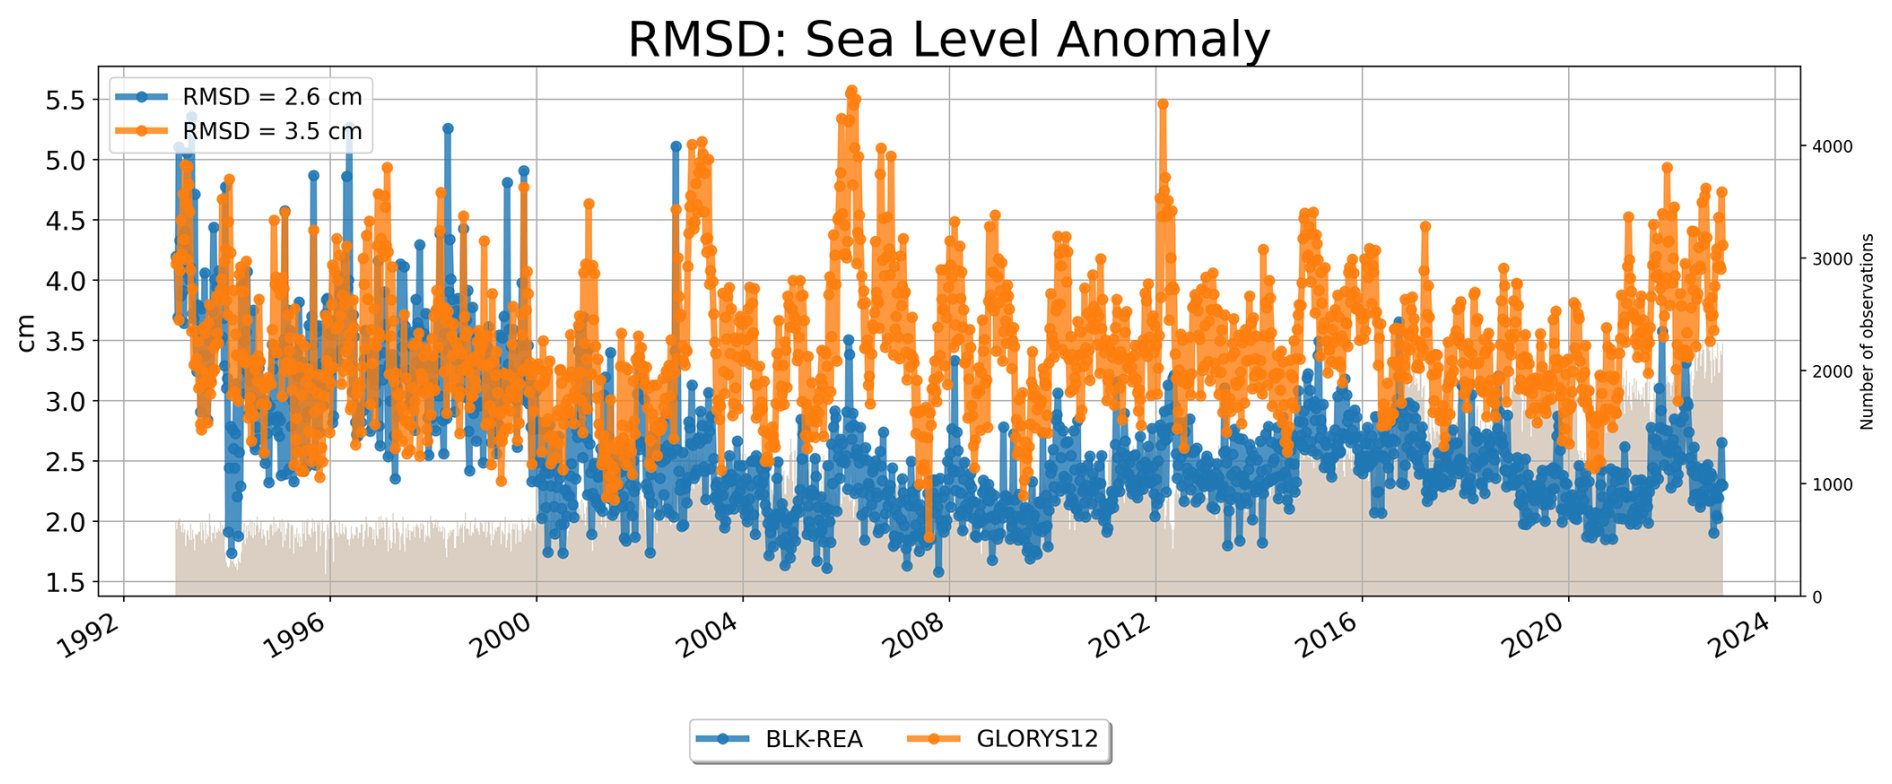
Figure A2Time series of SLA RMSD (in cm) for the Black Sea, showing the BLK-REA (in blue) and GLORYS12 (in orange) compared with along-track observations.
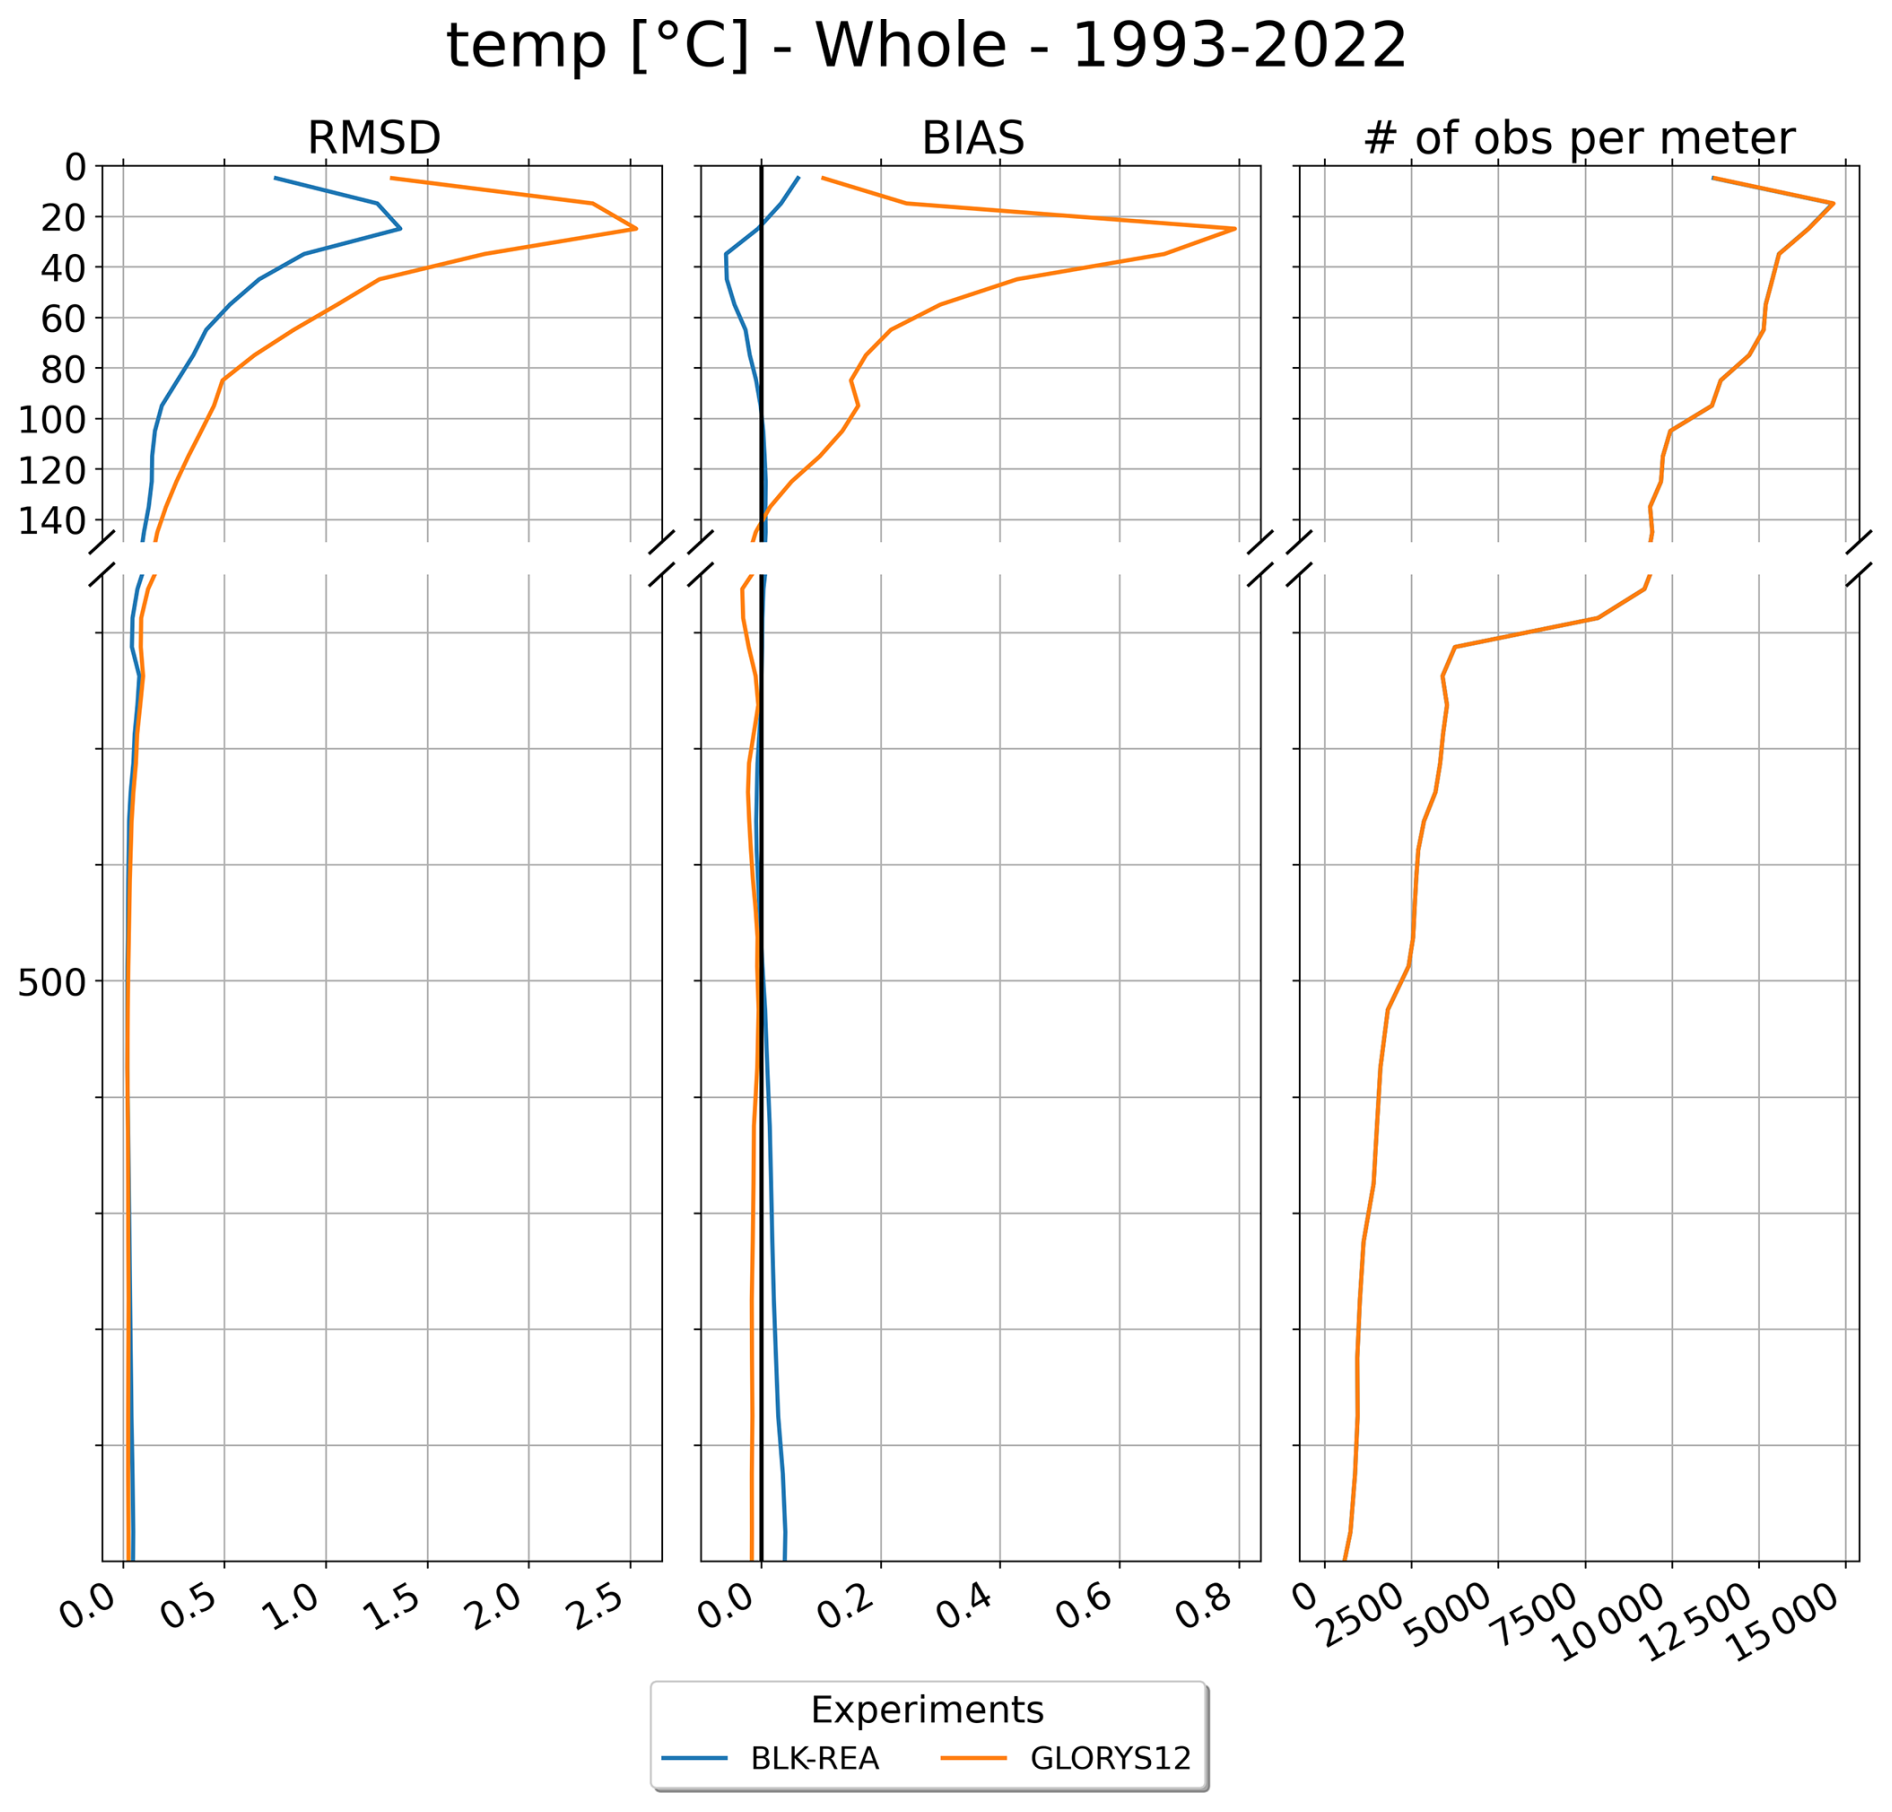
Figure A3Vertical profiles of RMSD (left), bias (middle), and number of observations (right) for temperature (°C), comparing BLK-REA (in blue) and GLORYS12 (in orange) against in-situ profiler data in the Black Sea from 1 January 1993 to 31 December 2022.
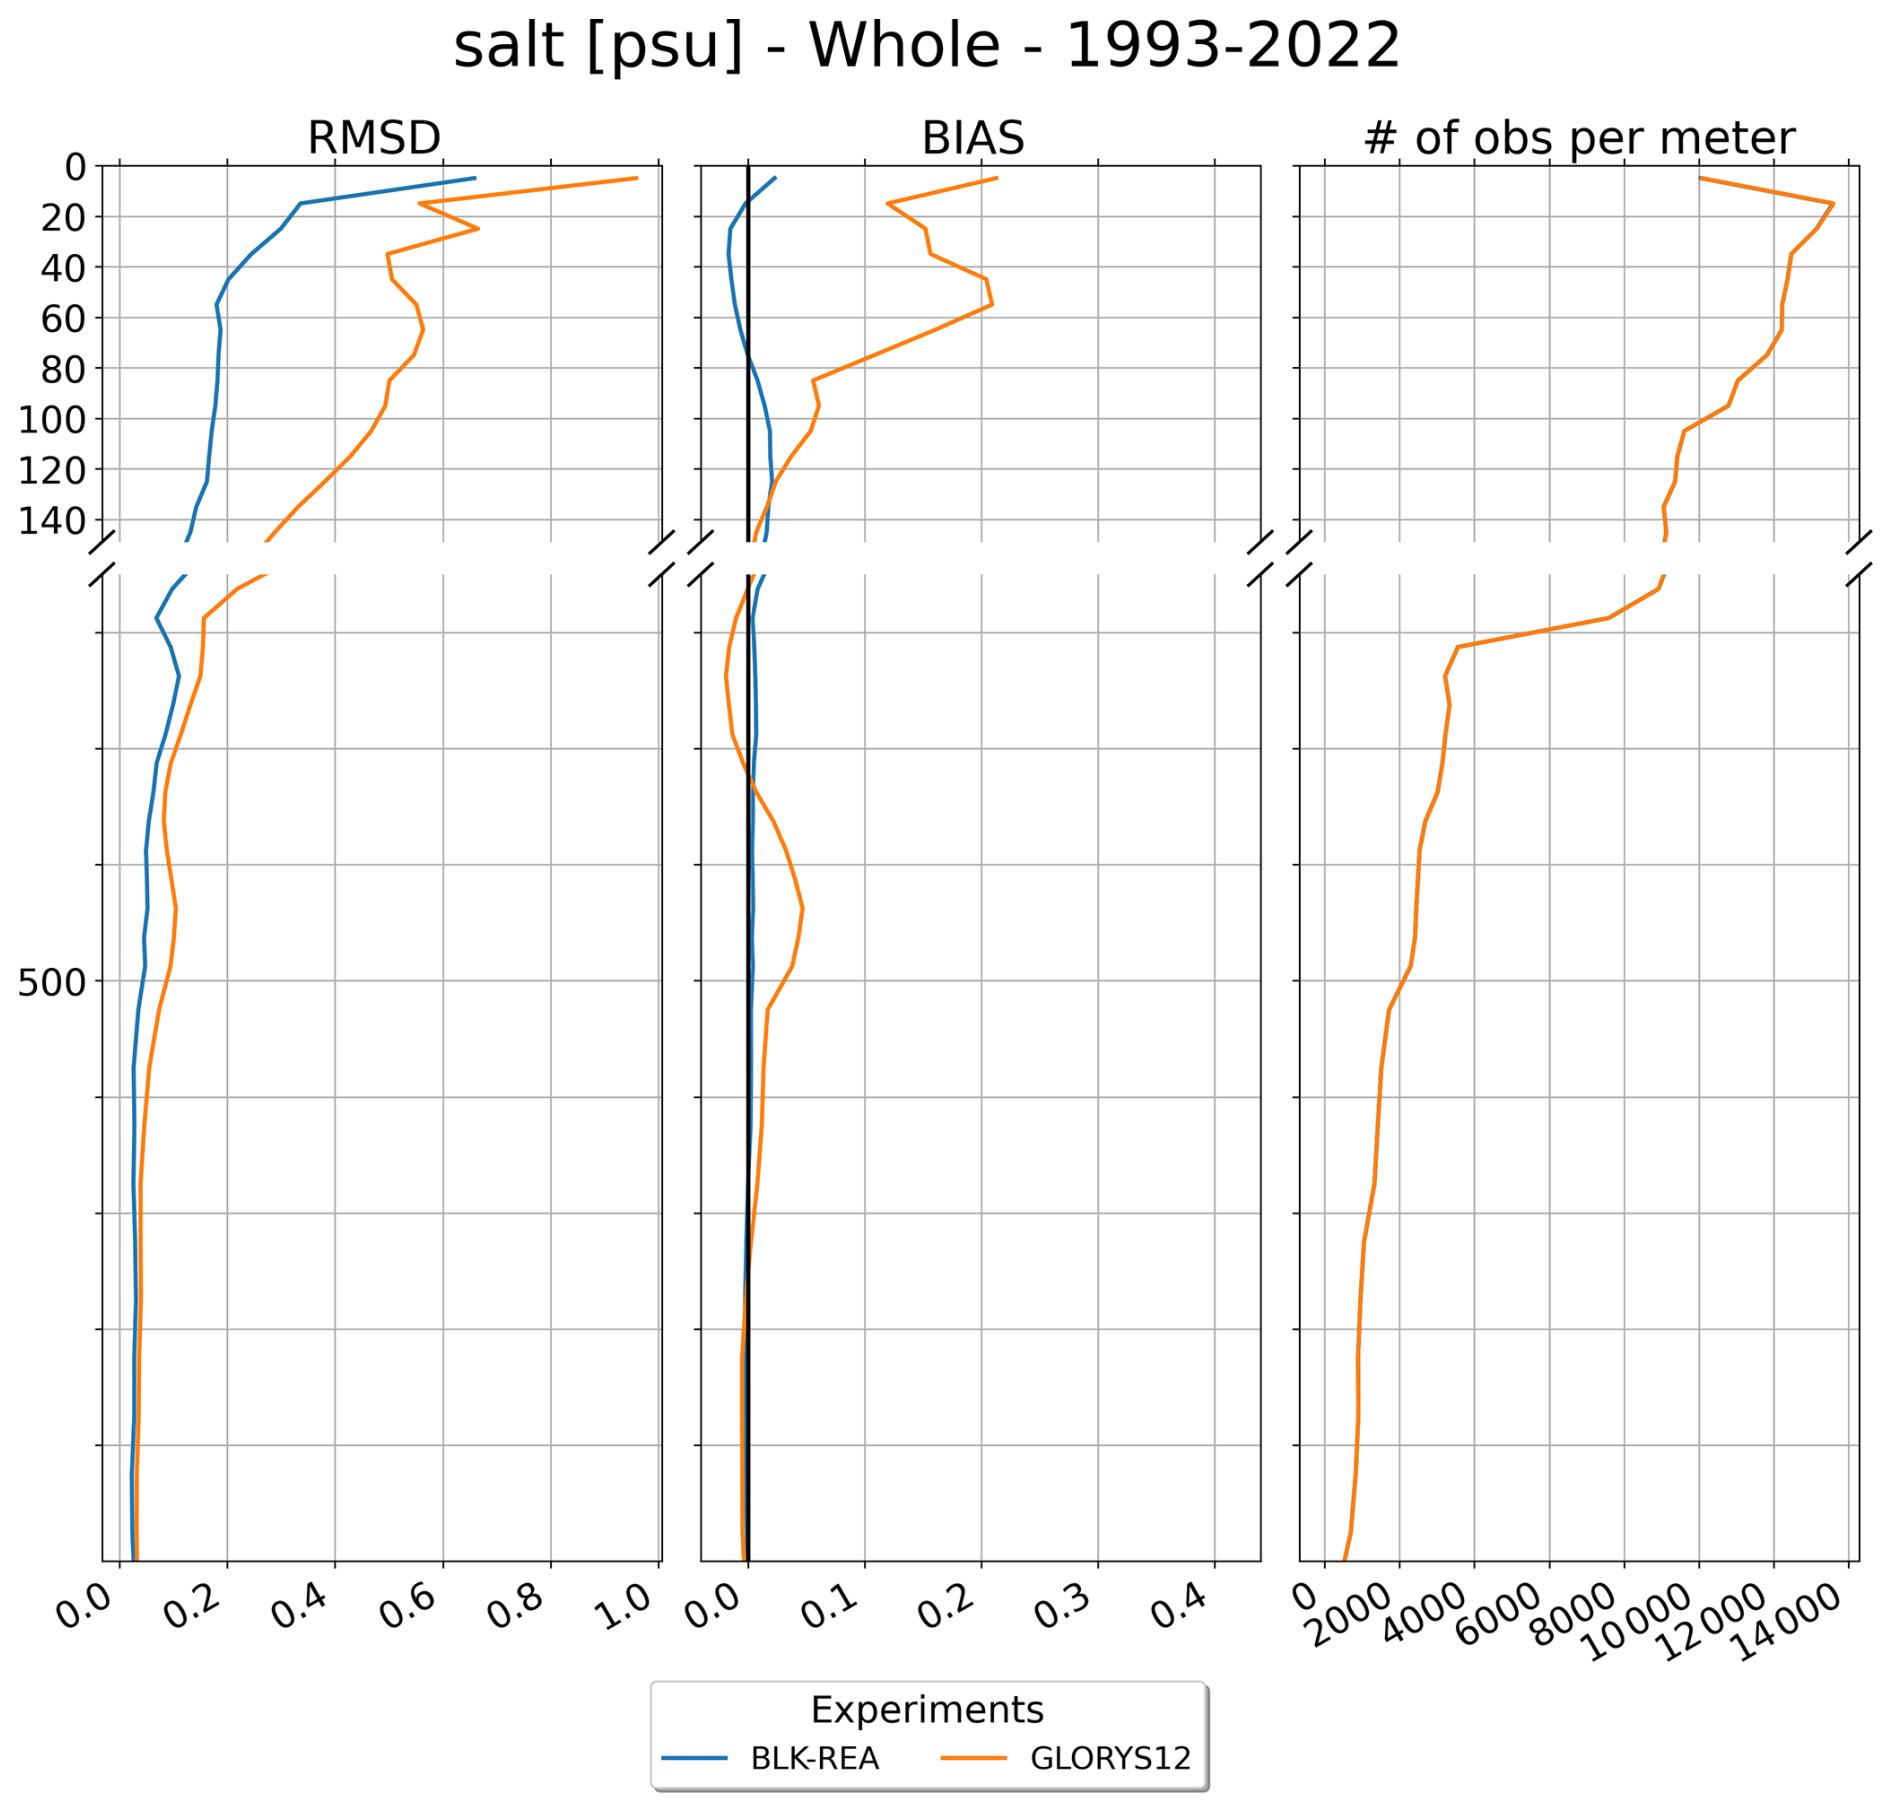
Figure A4Vertical profiles of RMSD (left), bias (middle), and number of observations (right) for salinity (psu), comparing BLK-REA (in blue) and GLORYS12 (in orange) against in-situ profiler data in the Black Sea from 1 January 1993 to 31 December 2022.
The BLK-REA dataset presented in this study can be found in online repositories. The names of the repository/repositories and accession number(s) can be found below: https://doi.org/10.48670/mds-00356 (E.U. Copernicus Marine Service Information (CMEMS), 2025).
The Copernicus Marine Service offering is regularly updated to ensure it remains at the forefront of user requirements. In this process, some products may undergo replacement or renaming, leading to the removal of certain product IDs from the catalogue. If readers have any questions or require assistance regarding these modifications, please feel free to reach out to the Copernicus Marine Service user support team for further guidance. They will be able to provide the necessary information to address concerns and find suitable alternatives.
LL led the study, built the reanalysis system, and was involved in all parts of the work. DA and MI contributed to the development of the hydrodynamical model. They also shared useful ideas that improved the study in many ways. EJ helped set up the data assimilation strategies and also gave important suggestions to improve the work. FC helped with the validation of the reanalysis results. AS gave helpful comments that guided the research. PM supported the preparation of the in-situ observation data for the data assimilation and helped with the validation step. EC also gave useful suggestions that helped improve the work. All authors contributed to writing the article and approved the final version.
The contact author has declared that none of the authors has any competing interests.
Publisher's note: Copernicus Publications remains neutral with regard to jurisdictional claims made in the text, published maps, institutional affiliations, or any other geographical representation in this paper. The authors bear the ultimate responsibility for providing appropriate place names. Views expressed in the text are those of the authors and do not necessarily reflect the views of the publisher.
The authors thank YoungHo Kim and one anonymous referee for their constructive comments that improved the manuscript.
This research was funded by the Copernicus Marine Service for the Black Sea Monitoring and Forecasting Centre (contract no. 21002L4-COP-MFC-BS-5400).
This paper was edited by Anne Marie Treguier and reviewed by two anonymous referees.
Altiok, H. and Kayişoğlu, M.: Seasonal and interannual variability of water exchange in the Strait of Istanbul, Mediterr. Mar. Sci., 16, 644–655, 2015.
Beşiktepe, Ş. T., Sur, H. I., Özsoy, E., Latif, M. A., Oguz, T., and Ünlüata, Ü.: The circulation and hydrography of the Marmara Sea, Prog. Oceanogr., 34, 285–334, 1994.
Capet, A., Vandenbulcke, L., and Grégoire, M.: A new intermittent regime of convective ventilation threatens the Black Sea oxygenation status, Biogeosciences, 17, 6507–6525, https://doi.org/10.5194/bg-17-6507-2020, 2020.
Castellari, S., Pinardi, N., and Leaman, K.: A model study of air-sea interactions in the Mediterranean Sea, J. Mar. Syst., 18, 89–114, https://doi.org/10.1016/s0924-7963(98)90007-0, 1998.
Chanut, J.: Nesting code for NEMO, Tech. rep., European Union: Marine Environment and Security for the European Area (MERSEA) Integrated Project, MERSEA-WP09-MERCA-TASK-9.1.1, Zenodo, https://doi.org/10.5281/zenodo.3243409, 2005.
Ciliberti, S. A., Grégoire, M., Staneva, J., Palazov, A., Coppini, G., Lecci, R., Peneva, E., Matreata, M., Marinova, V., Masina, S., Pinardi, N., Jansen, E., Lima, L., Aydoğdu, A., Creti’, S., Stefanizzi, L., Azevedo, D., Causio, S., Vandenbulcke, L., Capet, A., Meulders, C., Ivanov, E., Behrens, A., Ricker, M., Gayer, G., Palermo, F., Ilicak, M., Gunduz, M., Valcheva, N., and Agostini, P.: Monitoring and Forecasting the Ocean State and Biogeochemical Processes in the Black Sea: Recent Developments in the Copernicus Marine Service, J. Mar. Sci. Eng., 9, 1146, https://doi.org/10.3390/jmse9101146, 2021.
Ciliberti, S. A., Jansen, E., Coppini, G., Peneva, E., Azevedo, D., Causio, S., Stefanizzi, L., Creti', S., Lecci, R., Lima, L., Ilicak, M., Pinardi, N., and Palazov, A.: The Black Sea Physics Analysis and Forecasting System within the Framework of the Copernicus Marine Service, J. Mar. Sci. Eng., 10, 48, https://doi.org/10.3390/jmse10010048, 2022.
Çokacar, T.: Cold Intermediate Water Formation in the Black Sea Triggered by March 2022 Cold Intrusions, J. Mar. Sci. Eng., 12, 2027, https://doi.org/10.3390/jmse12112027, 2024.
Courtier, P.: Variational methods, J. Meteor. Soc. Japan, 75, 211–218, 1997.
Dee, D. P., Uppala, S. M., Simmons, A. J., Berrisford, P., Poli, P., Kobayashi, S., Andrae, U., Balmaseda, M. A., Balsamo, G., Bauer, P., Bechtold, P., Beljaars, A. C. M., van de Berg, L., Bidlot, J., Bormann, N., Delsol, C., Dragani, R., Fuentes, M., Geer, A. J., Haimberger, L., Healy, S. B., Hersbach, H., Hólm, E. V., Isaksen, L., Kållberg, P., Köhler, M., Matricardi, M., McNally, A. P., Monge-Sanz, B. M., Morcrette, J.-J., Park, B.-K., Peubey, C., de Rosnay, P., Tavolato, C., Thépaut, J.-N., and Vitart, F.: The ERA-Interim reanalysis: configuration and performance of the data assimilation system, Q. J. Roy. Meteor. Soc., 137, 553–597, https://doi.org/10.1002/qj.828, 2011.
Dobricic, S. and Pinardi, N.: An oceanographic three-dimensional variational data assimilation scheme, Ocean Model., 22, 89–105, https://doi.org/10.1016/j.ocemod.2008.01.004, 2008.
Embury, O., Merchant, C. J., Good, S. A., Rayner, N. A., Høyer, J. L., Atkinson, C., Block, T., Alerskans, E., Pearson, K. J., Worsfold, M., McCarroll, N., and Donlon, C.: Satellite-based time-series of sea-surface temperature since 1980 for climate applications, Sci. Data, 11, 326, https://doi.org/10.1038/s41597-024-03147-w, 2024.
E.U. Copernicus Marine Service Information (CMEMS): Global Ocean In-situ Near-Real-Time Observations, Marine Data Store (MDS) [data set], https://doi.org/10.48670/moi-00036, 2024.
E.U. Copernicus Marine Service Information (CMEMS): Observation-based Mean Dynamic Topography, Marine Data Store (MDS) [data set], https://doi.org/10.48670/moi-00138, 2024.
E.U. Copernicus Marine Service Information (CMEMS): Black Sea Physics Reanalysis, Marine Data Store (MDS) [data set], https://doi.org/10.48670/mds-00356, 2025.
Farina, R., Dobricic, S., Storto, A., Masina, S., and Cuomo, S.: A revised scheme to compute horizontal covariances in an oceanographic 3D-VAR assimilation system, J. Comput. Phys., 284, 631–647, https://doi.org/10.1016/j.jcp.2015.01.003, 2015.
Faugère, Y., Taburet, G., Ballarotta, M., Pujol, I., Legeais, J. F., Maillard, G., Durand, C., Dagneau, Q., Lievin, M., Sanchez Roman, A., and Dibarboure, G.: DUACS DT2021: 28 years of reprocessed sea level altimetry products, EGU General Assembly 2022, Vienna, Austria, 23–27 May 2022, EGU22-7479, https://doi.org/10.5194/egusphere-egu22-7479, 2022.
Garcia, H. E., Boyer, T. P., Baranova, O. K., Locarnini, R. A., Mishonov, A. V., Grodsky, A., Paver, C. R., Weathers, K. W., Smolyar, I. V., Reagan, J. R., Seidov, D., and Zweng, M. M.: World Ocean Atlas 2018: Product Documentation, edited by: Mishonov, A., https://doi.org/10.25923/tzyw-rp36, 2019.
Good, S., Fiedler, E., Mao, C., Martin, M. J., Maycock, A., Reid, R., Roberts-Jones, J., Searle, T., Waters, J., While, J., and Worsfold, M.: The Current Configuration of the OSTIA System for Operational Production of Foundation Sea Surface Temperature and Ice Concentration Analyses, Remote Sens., 12, 720, https://doi.org/10.3390/rs12040720, 2020.
Greiner, E., Verbrugge, N., and Zunino, P.: EU Copernicus Marine Service Quality Information Document for the Multi Observation Global Ocean 3D Temperature, Salinity, Geopotential Heights, Geostrophic Currents and Mixed Layer Depth Product, MULTIOBS_GLO_PHY_TSUV_3D_MYNRT_015_012, Mercator Ocean International, https://documentation.marine.copernicus.eu/QUID/CMEMS-MOB-QUID-015-012.pdf (last access: 12 December 2025), 2025.
Gunduz, G., Causio, S., Bonino, G., Vandenbulcke, L., Grégoire, M., Lima, L., Ciliberti, S., Ilicak, M., Aydogdu, A., Masina, S., Coppini, G., and Pinardi, N.: Coastal upwelling along the Turkish coast of the Black Sea: Its role in the distribution of the hydrographic properties, J. Oper. Oceanogr., 15, s205–s211, https://doi.org/10.1080/1755876X.2022.2095169, 2022.
Haines, K.: Ocean reanalyses, in: New Frontiers in Operational Oceanography, edited by: Chassignet, E., Pascual, A., Tintoré, J., and Verron, J., Liguria: GODAE OceanView, 545–562, https://doi.org/10.17125/gov2018.ch19, 2018.
Ilicak, M., Federico, I., Barletta, I., Mutlu, S., Karan, H., Ciliberti, S. A., Clementi, E., Coppini, G., and Pinardi, N.: Modeling of the Turkish Strait system using a high resolution unstructured grid ocean circulation model, J. Mar. Sci. Eng., 9, 769, https://doi.org/10.3390/jmse9070769, 2021.
Ilicak, M., Causio, S., Ciliberti, S., Coppini, G., Lima, L., Aydogdu, A., Azevedo, D., Lecci, R., Cetin, D. U., Masina, S., Peneva, E., Gunduz, M., and Pinardi, N.: The Black Sea overturning circulation and its indicator of change, J. Oper. Oceanogr., 15, s64–s71, https://doi.org/10.1080/1755876X.2022.2095169, 2022.
Ingleby, B. and Huddleston, M.: Quality control of ocean temperature and salinity profiles – Historical and real-time data, J. Mar. Syst., 65, 158–175, https://doi.org/10.1016/j.jmarsys.2005.11.019, 2007.
Ivanov, L. I., Backhaus, J. O., Özsoy, E., and Wehde, H.: Convection in the Black Sea during cold winters, J. Mar. Syst., 31, 65–76, https://doi.org/10.1016/S0924-7963(01)00047-1, 2001.
Korotaev, G., Oguz, T., Nikiforov, A., and Koblinsky, C.: Seasonal, interannual, and mesoscale variability of the Black Sea upper layer circulation derived from altimeter data, J. Geophys. Res.-Oceans, 108, 3122, https://doi.org/10.1029/2002JC001508, 2003.
Korotaev, G. K., Knysh, V. V., and Kubryakov, A. I.: Study of formation process of cold intermediate layer based on reanalysis of Black Sea hydrophysical fields for 1971–1993, Izv. Atmos. Ocean. Phys., 50, 35–48, https://doi.org/10.1134/S0001433813060108, 2014.
Kubryakov, A. A. and Stanichny, S. V.: Mesoscale eddies in the Black Sea from satellite altimetry data, Oceanology, 55, 56–67, https://doi.org/10.1134/S0001437015010105, 2015.
Lellouche, J.-M., Greiner, E., Bourdallé-Badie, R., Garric, G., Melet, A., Drévillon, M., Bricaud, C., Hamon, M., Le Galloudec, O., Regnier, C., Candela, T., Testut, C.-E., Gasparin, F., Ruggiero, G., Benkiran, M., Drillet, Y., and Le Traon, P.-Y.: The Copernicus Global ° oceanic and sea ice GLORYS12 reanalysis, Front. Earth Sci., 9, 698876, https://doi.org/10.3389/feart.2021.698876, 2021.
Lima, L., Peneva, E., Ciliberti, S., Masina, S., Lemieux, B., Storto, A., and Chtirkova, B.: Copernicus marine service ocean state report, issue 4, J. Oper. Oceanogr., 13, s41–s47, https://doi.org/10.1080/1755876X.2020.1785097, 2020.
Lima, L., Ciliberti, S. A., Aydoğdu, A., Masina, S., Escudier, R., Cipollone, A., Azevedo, D., Causio, S., Peneva, E., Lecci, R., Clementi, E., Jansen, E., Ilicak, M., Cretì, S., Stefanizzi, L., Palermo, F., and Coppini, G.: Climate Signals in the Black Sea From a Multidecadal Eddy-Resolving Reanalysis, Front. Mar. Sci., 8, 710973, https://doi.org/10.3389/fmars.2021.710973, 2021.
Madec, G. and the NEMO team: NEMO Ocean Engine Reference Manual, Zenodo [code], https://doi.org/10.5281/zenodo.1464816, 2019.
Micaletto, G., Barletta, I., Mocavero, S., Federico, I., Epicoco, I., Verri, G., Coppini, G., Schiano, P., Aloisio, G., and Pinardi, N.: Parallel implementation of the SHYFEM (System of HydrodYnamic Finite Element Modules) model, Geosci. Model Dev., 15, 6025–6046, https://doi.org/10.5194/gmd-15-6025-2022, 2022.
Miladinova, S., Stips, A., Garcia-Gorriz, E., and Macias Moy, D.: Formation and changes of the Black Sea cold intermediate layer, Prog. Oceanogr., 167, 11–23, https://doi.org/10.1016/j.pocean.2018.07.002, 2018.
Mulet, S., Buongiorno Nardelli, B., Good, S., Pisano, A., Greiner, E., Monier, M., Autret, E., Axell, L., Boberg, F., Ciliberti, S., Drévillon, M., Droghei, R., Embury, O., Gourrion, J., Høyer, J., Juza, M., Kennedy, J., Lemieux-Dudon, B., Peneva, E., Reid, R., Simoncelli, S., Storto, A., Tinker, J., von Schuckmann, K., and Wakelin, S. L.: Ocean temperature and salinity, in: Copernicus Marine Service Ocean State Report, J. Oper. Oceanogr., 11, s5–s13, https://doi.org/10.1080/1755876X.2018.1489208, 2018.
Myroshnychenko, V.: SeaDataCloud Temperature and Salinity Historical Data Collection for the Black Sea (Version 2), Ref. Prod. Info. Doc., ARCHIMER [data set], https://doi.org/10.13155/77211, 2020.
Myroshnychenko, V. and Simoncelli, S.: SeaDataCloud Temperature and Salinity Historical Data Collection for the Black Sea (Version 1), Ref. Prod. Info. Doc., ARCHIMER [data set], https://doi.org/10.13155/56683, 2018.
Oguz, T., Latun, V. S., Latif, M. A., Vladimirov, V. V., Sur, H. I., Makarov, A. A., Özsoy, E., Kotovshchikov, B. B., Eremeev, V., and Unluata, U.: Circulation in the surface and intermediate layers of the Black Sea, Deep Sea Res. Part I, 40, 1597–1612, 1993.
Oke, P. R. and Sakov, P.: Representation error of oceanic observations for data assimilation, J. Atmos. Oceanic Technol., 25, 1004–1017, https://doi.org/10.1175/2007jtecho558.1, 2008.
Özsoy, E. and Ünlüata, Ü.: Oceanography of the Black Sea: a review of some recent results, Earth Sci. Rev., 42, 231–272, https://doi.org/10.1016/s0012-8252(97)81859-4, 1997.
Peneva, E., Stanev, E., Ciliberti, S., Lima, L., Aydogdu, A., Marinova, V., and Valcheva, N.: Interannual variations of the Black Sea Rim Current, J. Oper. Oceanogr., 14, s53–s59, https://doi.org/10.1080/1755876X.2021.1946240, 2021.
Pettenuzzo, D., Large, W. G., and Pinardi, N.: On the correction of ERA-40 surface flux products consistent with the Mediterranean heat and water budgets and the connection between basin surface total heat flux and NAO, J. Geophys. Res., 115, C06022, https://doi.org/10.1029/2009JC005631, 2010.
Pisano, A., Buongiorno Nardelli, B., Tronconi, C., and Santoleri, R.: The new Mediterranean optimally interpolated Pathfinder AVHRR SST dataset (1982–2012), Remote Sens. Environ., 176, 107–116, https://doi.org/10.1016/j.rse.2016.01.019, 2016.
Podymov, O. I., Ocherednik, V. V., Silvestrova, K. P., and Zatsepin, A. G.: Upwellings and Downwellings Caused by Mesoscale Water Dynamics in the Coastal Zone of Northeastern Black Sea, J. Mar. Sci. Eng., 11, 1628, https://doi.org/10.3390/jmse11081628, 2023.
Stanev, E. V., Le Traon, P.-Y., and Peneva, E. L.: Sea level variations and their dependency on meteorological and hydrological forcing: analysis of altimeter and surface data for the Black Sea, J. Geophys. Res., 105, 17203–17216, https://doi.org/10.1029/1999JC900318, 2000.
Stanev, E. V., Peneva, E., and Chtirkova, B.: Climate change and regional ocean water mass disappearance: case of the Black Sea, J. Geophys. Res.-Oceans, 124, 4803–4819, https://doi.org/10.1029/2019JC015076, 2019.
Storto, A., Dobricic, S., Masina, S., and Di Pietro, P.: Assimilating along-track altimetric observations through local hydrostatic adjustment in a global ocean variational assimilation system, Mon. Weather Rev., 139, 738–754, https://doi.org/10.1175/2010mwr3350.1, 2011.
Szekely, T., Gourrion, J., Pouliquen, S., and Reverdin, G.: The CORA 5.2 dataset for global in situ temperature and salinity measurements: data description and validation, Ocean Sci., 15, 1601–1614, https://doi.org/10.5194/os-15-1601-2019, 2019.
Szekely, T., Gourrion, J., Pouliquen, S., and Reverdin, G.: CORA, Coriolis Ocean Dataset for Reanalysis, SEANOE [data set], https://doi.org/10.17882/46219, 2024.
Thielen, J., Bartholmes, J., Ramos, M.-H., and de Roo, A.: The European Flood Alert System – Part 1: Concept and development, Hydrol. Earth Syst. Sci., 13, 125–140, https://doi.org/10.5194/hess-13-125-2009, 2009.
Yang, C., Bourdallé-Badie, R., Drévillon, M., Amaya, D., Aouf, L., Aydogdu, A., Barton, B., Bell, M., Boyer, T., Blauw, A., Carton, J., Candela, T., Cossarini, G., Dabrowski, T., de Boisseson, E., de Mora, L., Fablet, R., Forget, G., Fujii, Y., Garric, G., Giunta, V., Salamon, P., Hersbach, H., Juza, M., Le Sommer, J., Martin, M., McAdam, R., Menendez Garcia, M., Morim, J., Nicolì, D., Reppucci, A., Samuelsen, A., Sauzède, R., Slivinski, L., Specq, D., Storto, A., Tuomi, L., Vandenbulcke, L., Aznar, R., Beuvier, J., Cipollone, A., Clementi, E., Di Biagio, V., Escudier, R., Giesen, R., Greiner, E., Guihou, K., Korabel, V., Lamouroux, J., Law Chune, S., Lellouche, J.-M., Levier, B., Lima, L., Mangin, A., Mayer, M., Melet, A., Miraglio, P., Oikonomou, C., Pfeffer, J., Renshaw, R., Ringgaard, I., Thual, S., Titaud, O., Tonani, M., van Gennip, S., von Schuckmann, K., Drillet, Y., and Le Traon, P.-Y.: Gathering Users and Developers to Shape Together the Next-Generation Ocean Reanalyses, B. Am. Meteorol. Soc., 106, E419–E429, https://doi.org/10.1175/BAMS-D-24-0034.1, 2025.