the Creative Commons Attribution 4.0 License.
the Creative Commons Attribution 4.0 License.
 | 28 Feb 2024
Predictability of marine heatwaves: assessment based on the ECMWF seasonal forecast system
Eric de Boisséson
Magdalena Alonso Balmaseda
Marine heatwaves (MHWs), defined as prolonged period of extremely warm sea surface temperature (SST), have been receiving a lot of attention in the past decade as their frequency and intensity increase in a warming climate. This paper investigates the extent to which the seasonal occurrence and duration of MHWs can be predicted with the European Centre for Medium-Range Weather Forecast (ECMWF) operational seasonal forecast system. The prediction of the occurrence of MHW events, the number of MHW days per season, and their intensity and spatial extent are derived from seasonal SST forecasts and evaluated against an observation-based SST analysis using both deterministic and probabilistic metrics over the 1982–2021 period. Forecast scores show useful skill in predicting the occurrence of MHWs globally for the two seasons following the starting date. The skill is the highest in the El Niño region, the Caribbean, the wider tropics, the north-eastern extra-tropical Pacific, and southwest of the extra-tropical basins. The skill is not as good for other midlatitude eastern basins nor for the Mediterranean, with the forecast system being able to represent the low-frequency modulation of MHWs but showing poor skill in predicting the interannual variability of the MHW characteristics. Linear trend analysis shows an increase in MHW occurrence at a global scale, which the forecasts capture well.
- Article
(3265 KB) - Full-text XML
- BibTeX
- EndNote


Marine heatwaves (MHWs) are defined as prolonged periods of anomalously warm sea surface temperature (SST) that can be characterised by, e.g. their duration, intensity, and spatial extent (Hobday et al., 2016). Due to their potential impact on marine ecosystems and the associated marine economy (Smith et al., 2021), MHW events have received wide coverage over the past few years. High-resolution operational SST analysis products covering the whole satellite period, from the early 1980s to near-real time, allow us to monitor the real-time evolution of such events and inventory and describe events from the past 4 decades. Darmaraki et al. (2019), Bonino et al. (2023), Juza et al. (2022), and Dayan et al. (2023), for example, looked in details at MHWs in the Mediterranean Sea, describing their duration, intensity, and frequency but also long-term trends and possible future evolution. Iconic MHW events such as “the Blob” and its successor (“the Blob 2.0”) in the north-eastern extra-tropical Pacific have been described and investigated in depth in terms of attribution (Bond et al., 2015; Gentemann et al., 2017; Amaya et al., 2020; de Boisséson et al., 2022) but also of impacts on the ecosystems (McCabe et al., 2016; Laurel and Rogers, 2020; Barbeaux et al., 2020; Michaud et al., 2022).
The ability to predict MHWs in advance would allow actors of the marine industries to make decisions to limit the impact on ecosystems. For example, the return of “the Blob” in 2019 and the 2020 outlook led the US federal cod fishery in the Gulf of Alaska to close for the 2020 season as a precautionary measure as the number of cod in the area was deemed too low (Earl, 2019). As a response to extreme events in the Tasman Sea (Oliver et al., 2017) and the Coral Sea (Kajtar et al., 2021), MHW forecasts on both sub-seasonal and seasonal timescales have been investigated in Australian seas (Hobday et al., 2018; Benthuysen et al., 2021). More recently, Jacox et al. (2022) investigated the predictability of MHWs on a global scale from an ensemble of six climate models. Their results showed that forecast skill was mostly region dependent, with the eastern equatorial Pacific region being predictable with the longest lead time. Seasonal forecasts of SST are routinely conducted by major forecasting centres mainly to predict the evolution of climate modes such as the El Niño–Southern Oscillation (ENSO). Seasonal MHW forecasts can be inferred as byproduct of such SST forecasts, as shown by Jacox et al. (2022).
The present study follows a similar approach using the SST outputs from the ECMWF ensemble seasonal forecast system (Johnson et al., 2019) to evaluate its ability to predict MHW events on a global scale in both a deterministic and a probabilistic sense. A selection of regions will be investigated in more detail. The main purpose of this work is to present a functional way to routinely characterise MHWs in an operational seasonal forecast system and to evaluate the forecast skill. Section 2 provides a description of the forecasting system, the verification datasets, and the methods for MHW detection and skill assessment. Section 3 presents the results regarding the spatial distribution of the skill, regional aspects, and trends. The paper finishes with a brief summary and outlook.
2.1 The seasonal forecasting system
The ECMWF seasonal forecast system 5 (SEAS5; Johnson et al., 2019) is used to assess the skill in predicting MHWs over the 1982–2021 period. SEAS5 is a state-of-the-art seasonal forecast system, with a particular strength in ENSO prediction, and a member of the Copernicus Climate Change Service (C3S) multi-model seasonal forecast product. SEAS5 is based on the ECMWF Earth System model that couples atmosphere, land, wave, ocean, and sea ice. The atmospheric, land, and wave components are embedded in the ECMWF Integrated Forecast System (IFS) model cycle 43r1. The atmosphere in the IFS uses a TCo319 spectral cubic octahedral grid (approximately 36 km horizontal resolution) with a 20 min time step. There are 91 levels in the vertical, with a model top in the mesosphere at 0.01 hPa or around 80 km. Initial conditions for the IFS are taken from ERA-Interim (Dee et al., 2011) prior to 2017 and ECMWF operational analyses from 2017 onwards. The physical ocean model component is based on the NEMO3.4 framework (Madec et al., 2008) at a ° horizontal resolution and 75 vertical levels with level spacing increasing from 1 m at the surface to 200 m in the deep ocean. Ocean initial conditions for hindcasts over the 1982–2021 period are taken from the Ocean ReAnalysis System 5 (ORAS5, Zuo et al., 2019). SEAS5 ocean forecast fields are archived at both daily and monthly frequencies. SEAS5 produces a 51-member ensemble of 7-month forecasts initialised on the first day of each month.
Here we explore the seasonal skill of SEAS5 in predicting the occurrence of MHW events on a global scale for forecasts starting on 1 February, 1 May, 1 August, and 1 November. For each starting date, the forecast skill is estimated for the two following seasons corresponding to forecast range months 2–3–4 and 5–6–7 so that our study equally covers MHW happening in spring (March–April–May, MAM), summer (June–July–August, JJA), autumn (September–October–November, SON), and winter (December–January–February, DJF). The first 25 members of each forecast date are used for this assessment.
2.2 Verification dataset
The SST forecasts from SEAS5 are evaluated against the global SST reprocessed product from the European Space Agency Climate Change Initiative (ESA-CCI) and C3S available on the Copernicus Marine Service catalogue (referred to as ESA-CCI SST in the following). ESA-CCI SST provides daily L4 SST fields at 20 cm depth on a 0.05° horizontal grid resolution, using satellite data from the (Advanced) Along-Track Scanning Radiometer ((A)ATSRs), the Sea and Land Surface Temperature Radiometer (SLSTR) and the Advanced Very High Resolution Radiometer (AVHRR) sensors (Merchant et al., 2019) and produced by running the Operational Sea Surface Temperature and Sea Ice Analysis (OSTIA) system (Good et al., 2020). Daily SEAS5 SST forecast fields are retrieved on a regular 1 × 1° on the Copernicus Data Store (CDS) and compared to ESA-CCI SST fields interpolated on the same regular grid.
2.3 Marine heatwave detection
MHW events in SST time series from both SEAS5 forecasts and ESA-CCI are detected over the 1982–2021 period loosely following the definition by Hobday et al. (2016). For both SEAS5 SST and ESA-CCI SST, a daily time series of the SST 90th percentile is computed over the common reference period of 1993–2016, the same reference period used by the C3S multi-model seasonal forecast charts (https://climate.copernicus.eu/charts/packages/c3s_seasonal/, last access: January 2024). Although the 90th percentile threshold is estimated from the 1993–2016 climate, the MHW detection is applied for the whole 1982–2021 period. A 5 d running mean is applied to the daily ESA-CCI SST time series to filter out freak anomalies that would not fit the “extended period” criterion of the MHW definition. We then count the number of days per season where the SST exceeds the 90th percentile over the 1982–2021 period. This is what we refer as the number of MHW days in the following. The maximum SST anomaly with respect to the 1993–2016 climatology during the MHW days is taken as the peak temperature of the MHW occurring during a given season. For SST forecasts, the detection method is similar to ESA-CCI SSTs. The daily forecast SST 90th percentile time series is computed from 25 members of the SEAS5 ensemble over the 1993–2016 reference period. The number of MHW days and the maximum MHW temperature anomalies are then estimated for seasons corresponding to months 2–3–4 and 5–6–7 of the SST forecasts following the same procedure as for the ESA-CCI product. The probability of forecasting a MHW event in a given season is estimated at each grid point as the percentage of ensembles in which the number of MHW days is greater than five.
2.4 Skill scores
2.4.1 Mean square skill score
To estimate the mean square skill score (MSSS), the following two components are needed: (i) the mean square error (MSE) of the MHW forecasts with respect to MHW as captured in ESA-CCI and (ii) the standard deviation from the mean of a given MHW characteristic as captured in ESA-CCI. The MSSS is estimated for the forecast ensemble mean at every grid point for the period 1982–2021 as follows:
where
and
where Fi is the forecast ensemble mean anomaly for a given verification time, Oi is the corresponding verifying observation anomaly, and N is the total number of verification instances over the 1982–2021 period. MSSS is here estimated for the number of MHW days.
2.4.2 Multiyear trend and correlation maps and area-averaged time series
The long-term linear trend of the number of MHW days is computed for both SEAS5 ensemble mean and ESA-CCI. Reports of a trend toward more frequent and longer MHWs over the recent decades (Oliver et al., 2018; Collins et al., 2019) indicate a distinctive multi-year signal in observation-based SST analyses such as the ESA-CCI product. Here, the aim is to assess how well (or not) SEAS5 represents such multi-year trend. Trend errors will potentially degrade forecast scores and indicate deficiencies in either the model or the initialisation. Maps of temporal correlation (with 95 % significance, following DelSole and Tippett, 2016) between MHW ensemble mean forecast and observations over the 1982–2021 period are also produced for every start date and their corresponding two verifying seasons. These maps will give additional insights into the ability of the forecast to represent the multi-year signal. Area-averaged time series of MHW characteristics are also used to evaluate the forecast system performance for individual events in regions of interest and will complete the trend and correlation diagnostics. MHW characteristics are estimated at grid points where the number of MHW days is greater than or equal to five. Such characteristics include the number of MHW days per season, the maximum amplitude during that period and the spatial extent. The spatial extent is estimated as the percentage of grid points in the considered area where the number of MHW days per season is at least five.
2.4.3 Relative operator characteristic
The relative (or receiver) operating characteristic (ROC, Swets, 1973; Mason, 1982; Mason and Graham, 1999) is a way of assessing the skill of a forecasting system by comparing the hit (true-positive) rate and the false-alarm (false-negative) rate that is commonly used for weather forecasting (Stanski et al., 1989; Buizza and Palmer, 1998). The ROC is computed here at every grid point using (i) the forecast probabilities for MHW for a given start date and verifying season inferred from the SEAS5 SST forecasts (as defined in Sect. 2.3) and (ii) the MHW occurrence (at least 5 MHW days) in the ESA-CCI product for the corresponding season. Both the true- and false-positive rates are estimated for a comprehensive range of forecasts probabilities based on the forecast ability to capture MHW events as detected in the ESA-CCI SST fields over the 1982–2021 period. From there, ROC curves can be plotted and potentially used to select the trigger MHW probability threshold for an event that provides the best trade-off between true-positive rate and false-alarm rate. The ROC score is computed from the ROC curve as the normalised area under the curve (AUC, Stanski et al., 1989), where an AUC close to 0.5 indicates little to no skill, while an AUC close to 1 indicate high skill. In this study both the ROC curve and score are computed over a selection of regions of interest but also at every grid point to give insight into the spatial distribution of seasonal MHW forecast skill.
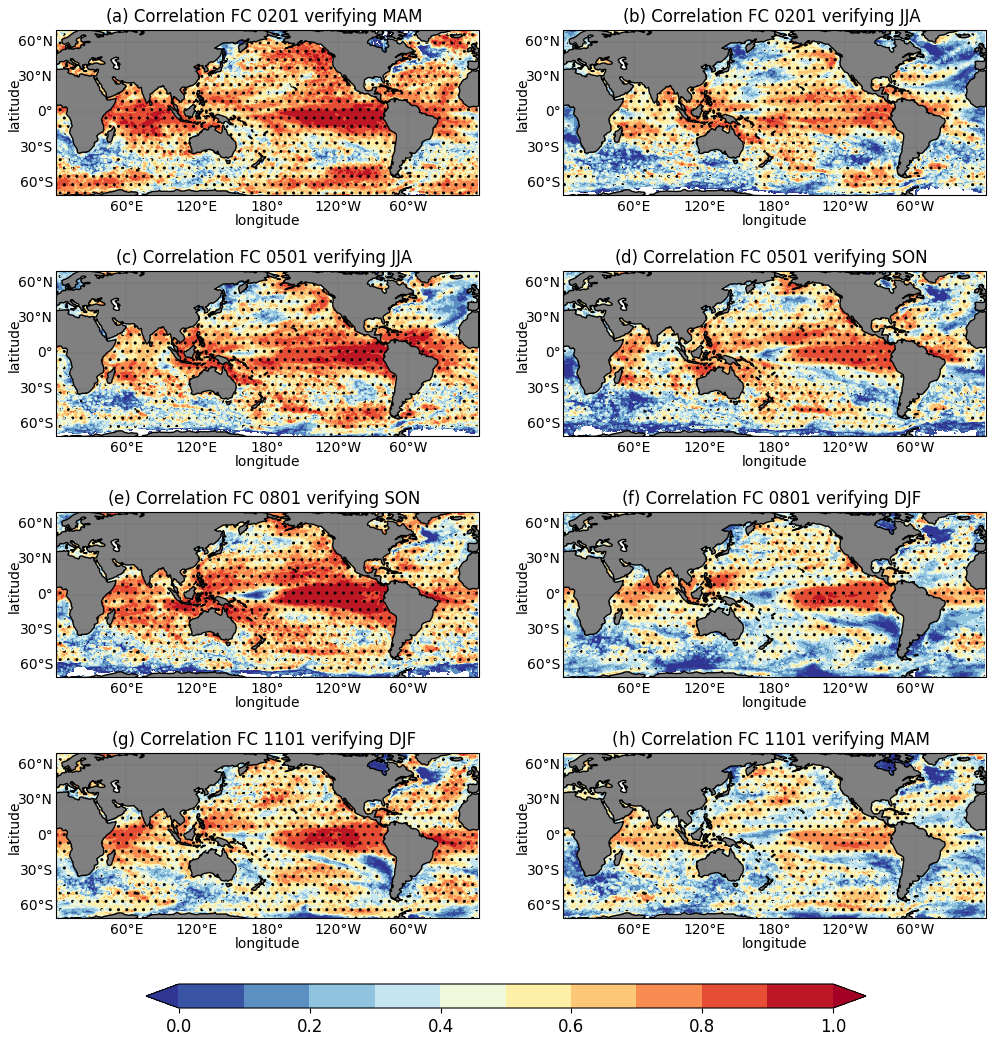
Figure 1Maps of interannual correlation between the number of MHW days forecasted in season one (months 2–3–4) and two (months 2–3–4) and the observed number of MHW days for starting dates on 1 February, verifying (a) MAM (March–April–May) and (b) JJA (June–July–August); 1 May, verifying (c) JJA and (d) SON (September–October–November); 1 August, verifying (e) SON and (f) DJF (December–January–February); and 1 November, verifying (g) DJF and (h) MAM. Forecasts for the period 1982–2021 are verified against ESA-CCI SST product. The hatches indicate the area in which the scores are significant. Significance for both MSSS and correlation is estimated following DelSole and Tippett (2016).
3.1 Seasonal forecast skill for marine heatwaves: spatial distribution
Both correlation and MSSS of the number of MHW days per season are computed with respect to the reference dataset from ESA CCI. These scores are deterministic in that they are inferred from the ensemble mean of the seasonal forecasts. The correlation estimates the ability of the seasonal system to reproduce the time evolution of the ESA CCI data in terms of number of MHW days. In all seasons, the highest correlations are found over the Pacific Cold Tongue where El Niño events occur and in the wider tropics (Fig. 1). Correlations remain relatively high in the eastern tropical Pacific and in the equatorial Atlantic and Indian oceans in the second season for SON and DJF (Fig. 1e, f), reflecting the ability of the seasonal system to predict and persist El Niño conditions over autumn and winter. The drop in skill for JJA in the second season (Fig. 1b) in these areas is likely related to the spring predictability barrier (Webster and Yang, 1992; Balmaseda et al., 1995). High and significant correlations are seen in extra-tropical areas such as the north-eastern Pacific and the Southern Ocean (particularly over the Pacific sector in MAM and JJA, Fig. 1a, c) where MHW occurrence is influenced on longer timescales by climate modes like the Pacific Decadal Oscillation (PDO), the North Pacific Subpolar Gyre Oscillation (NPGO; Di Lorenzo et al., 2008), and the Interdecadal Pacific Oscillation (IPO) (Holbrook et al., 2019).
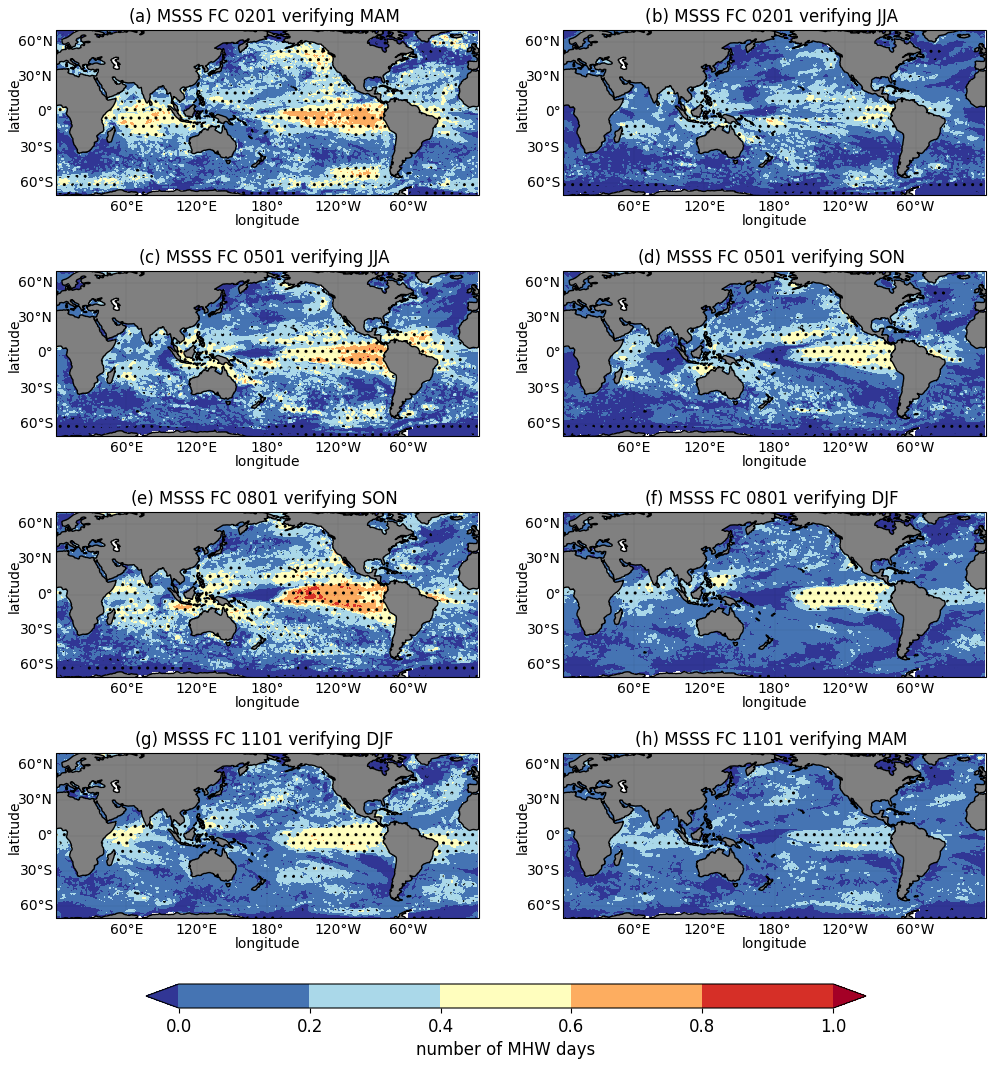
Figure 2Maps of mean square skill score of the number of MHW days for season one (months 2–3–4) and two (months 5–6–7) of the forecast starting on the following dates: 1 February, verifying (a) MAM (March–April–May) and (b) JJA (June–July–August); 1 May, verifying (c) JJA and (d) SON (September–October–November); 1 August, verifying (e) SON and (f) DJF (December–January–February); and 1 November, verifying (g) DJF and (h) MAM. Forecasts for the period 1982–2021 are verified against ESA-CCI SST product. The hatches indicate the area in which the scores are significant. Significance for both MSSS and correlation are estimated following DelSole and Tippett (2016).
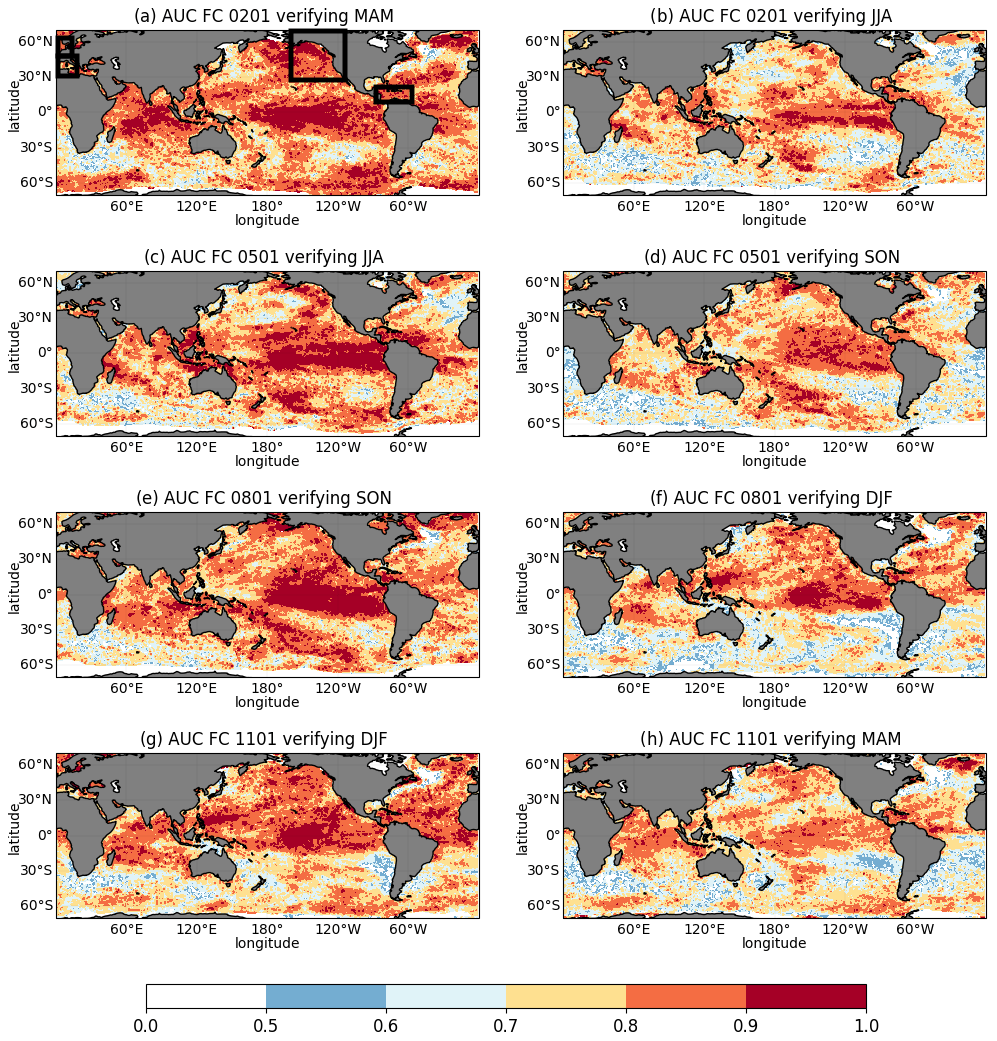
Figure 3Maps of the area under the curve (AUC) forecasted in season one (months 2–3–4) and two (months 2–3–4) for the following starting dates: 1 February, verifying (a) MAM and (b) JJA; 1 May, verifying (c) JJA and (d) SON; 1 August, verifying (e) SON and (f) DJF; and 1 November, verifying (g) DJF and (h) MAM. The AUC is derived from the ROC curves estimated from the probability of predicting at least 5 d of SST in the 90th percentile during a season. The boxes in (a) indicate the four areas (north-eastern extra-tropical Pacific Ocean, Caribbean Sea, western Mediterranean Sea, and North Sea) used to produce Figs. 4, 5, and 6.
The MSSS indicates how close to the observed quantity the forecast gets in terms of number of MHW days. In all seasons, the highest score is again over the Pacific Cold Tongue where El Niño events occur (Fig. 2). The footprint of ENSO is partly visible in both the tropical Indian basin and tropical Atlantic basin, where MHW occurrence and predictability is also likely to be influenced by climate modes such as the Indian Ocean Dipole (IOD) and the North Atlantic Oscillation (NAO), respectively (Holbrook et al., 2019). The north-eastern extra-tropical Pacific is one of the only midlatitude regions with significant MSSS values from spring to autumn (in the first forecast season only, Fig. 2a, c, e). As expected, MSSS degrades in the second season of the forecast and most of the skill is concentrated over the Pacific Cold Tongue in SON and DJF (Fig. 2d, f), strongly suggesting links between MHW and ENSO predictability. Overall, MSSS and correlation values larger than zero are widespread and mostly significant (especially correlations), indicating that, even at these long lead times, the seasonal forecasts are more skilful than climatology.
The ROC allows us to evaluate the seasonal forecasts in terms of ability to detect the presence of a MHW event within a season. Such a score can help decision-making to prepare for or mitigate the impact of a likely MHW event when the forecast probability exceeds a certain threshold. Maps of AUC provide indications of the area where there is MHW forecast skill. For forecast ranges of 2–4 months (season one) values of AUC over 0.5 are found almost everywhere (Fig. 3a, c, e, g). The largest values are found in both the Niño 3.4 and 4 regions, reflecting once more the ability of SEAS5 to predict and persist El Niño conditions. Overall, AUC is high over the tropics and subtropics in all basins. The north-eastern extra-tropical Pacific, where “the Blob” happened, shows high skill in all seasons. Skilful MHW predictions are seen in the western tropical Atlantic Ocean mainly for MAM and JJA (Fig. 3a, c); the tropical Indian Ocean for MAM, SON, and DJF (Fig. 3a, e, g); and over the Maritime Continent mainly for JJA (Fig. 3c). The skill decreases overall in the forecast range 5–7 months (season 2, Fig. 3b, d, f, h), with the highest values of AUC in the tropical regions of both the Pacific and Indian oceans, the north-eastern extra-tropical Pacific, and the Pacific sector of the southern extra-tropics. The ROC score complements and confirms the results from both MSSS and correlation. The ROC maps indicate the areas where the forecast system can predict observed MHW events on seasonal timescales. MSSS and correlation show the accuracy of such predictions in terms of length and interannual variability of extreme SST events. This set of skills indicates that even at long lead times the seasonal forecasts from SEAS5 show useful skill in predicting the occurrence of MHW events.
3.2 Seasonal forecast skill for marine heatwaves: regional aspects
Looking at areas outside of the Niño region brings more nuance. The ROC is estimated for a selection of regions where MHWs could impact marine sectors such as fisheries or aquaculture. Figure 4 shows the ROC curve for seasonal forecasts starting on 1 February and 1 May and verified for JJA. The ROC curve shows very high skill in the north-eastern extra-tropical Pacific (Fig. 4a) and even higher skill in the Caribbean (Fig. 4b) for JJA. There is, however, a substantial reduction in the AUC in JJA for the February forecast. The skill is much lower in the western Mediterranean and rather poor in the North Sea whatever the forecast range (Fig. 4c, d). This disparity in skill reflects the known difference in the performance of seasonal forecasting systems between the tropics and extra-tropics (especially over Europe).
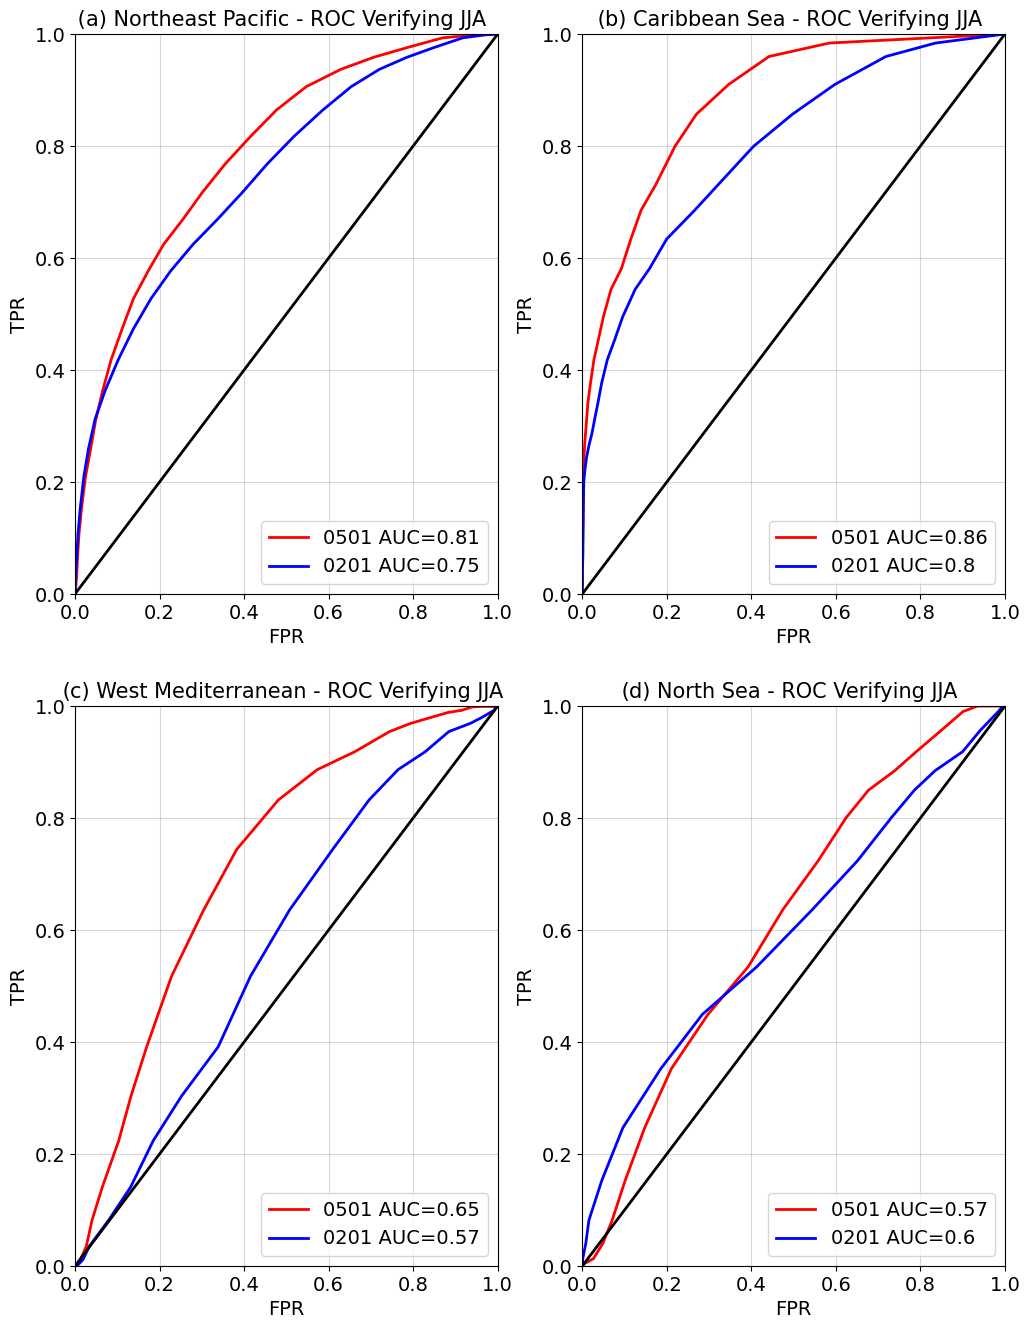
Figure 4ROC curve for the JJA MHW forecast starting on 1 February (blue) and 1 May (red) in (a) the north-eastern extra-tropical Pacific Ocean, (b) the Caribbean Sea, (c) the western Mediterranean Sea, and (d) the North Sea. The areas are defined in Fig. 3a.
Time series of MHW characteristics for these areas complement the ROC curves showing to which extent specific MHW events are captured by the seasonal forecasts. Figures 5 and 6 show the number of MHW days, the maximum amplitude, and the spatial extent (in terms of proportion of the area affected by a MHW) in JJA over the period 1982–2021 in the February and May forecasts and the ESA-CCI product. In the north-eastern extra-tropical Pacific (Fig. 5a, c, e), the seasonal forecast can capture the major JJA events of 1997, 2004, 2013–2015 (a.k.a. the “Blob”), and 2019, although the severity of the events was underestimated in 2004. The range of maximum amplitude of the events is mostly similar to observations from 1982 to 2010 and then slightly underestimated from 2010–onwards. The time evolution of the spatial extent of MHWs is well captured (albeit the large spread), suggesting the seasonal forecast system can represent the correct spatial patterns. Both forecast starting dates show similar ability in predicting JJA MHW characteristics. The thermal memory of the ocean has been shown to impact the predictability of MHW and improved seasonal skill in the north-eastern Pacific from 2017 has been linked to an increase in the ocean stratification preconditioning the ocean to the occurrence of extremely warm events at the surface (de Boisséson et al., 2022). The state of the north-eastern extra-tropical Pacific Ocean is influenced on synoptic to seasonal timescale by local variations in atmospheric conditions (Holbrook et al., 2019) that show relatively low predictability in SEAS5 (Johnson et al., 2019), hence impacting the accuracy of the MHW forecast. Jacox et al. (2022) showed that the skill of seasonal MHW prediction in the north-eastern Pacific (close to the North American coast) is relatively improved when ENSO is an active state with respect to a neutral state. This link to ENSO could partly explain the better performances in 1997 and 2015 (strong El Niño years) with respect to 2004 (a moderate to neutral ENSO year) for example. Aside from these modes of interannual variability, the time series, the number of MHW days, and spatial extent appear dominated by low-frequency variability or trends, which will influence the predictability. We will return to this point later in the next section.
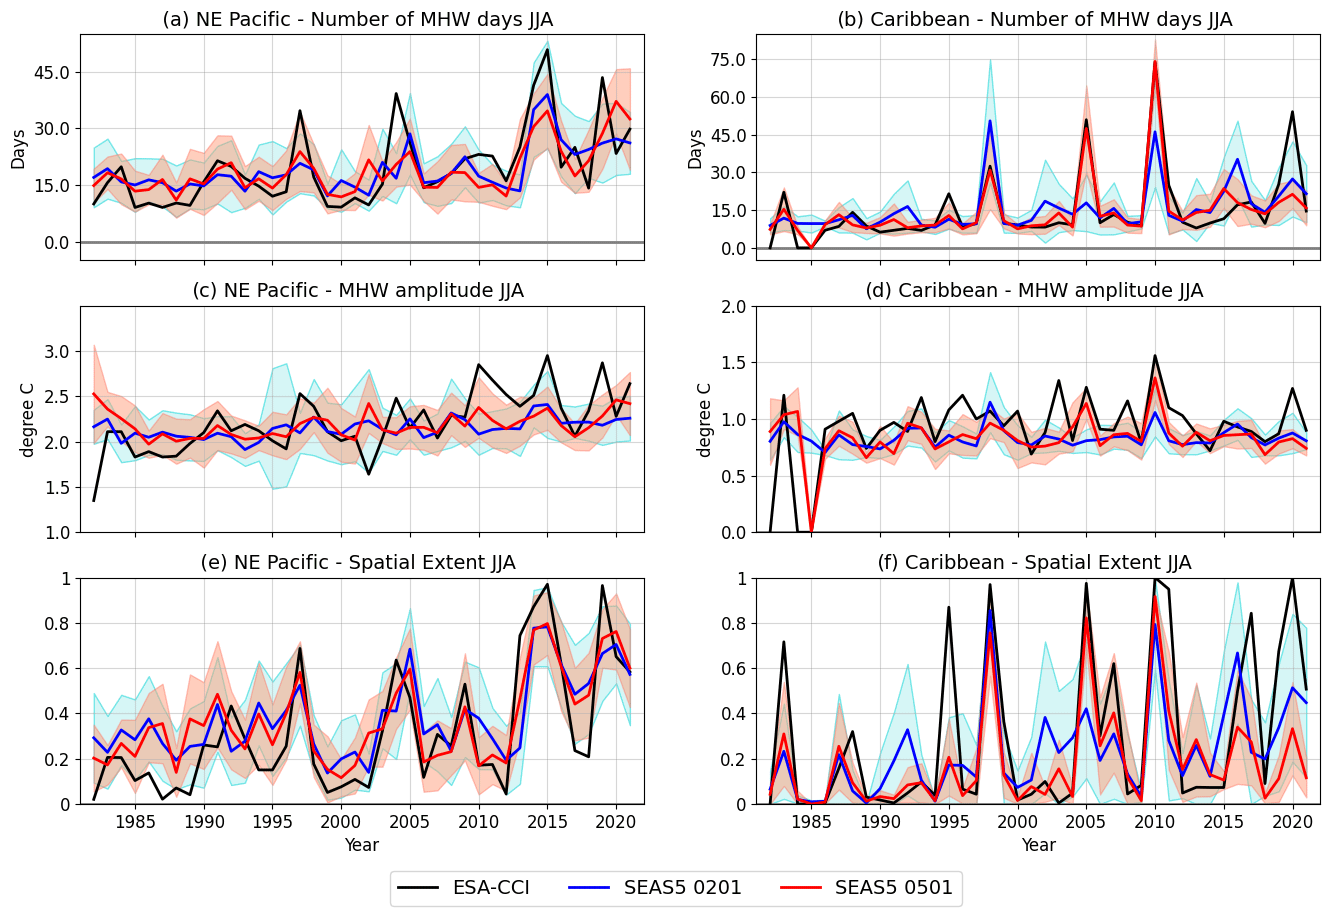
Figure 5Time series of MHW characteristics for JJA 1982–2021 in both forecasts and observations in both the north-eastern extra-tropical Pacific (a, c, e) and the Caribbean (b, d, f): (a, b) number of MHW days, (c, d) maximum amplitude of the MHW, and (e, f) spatial extent expressed as the proportion of the full area seeing a MHW event during the season. The seasonal forecasts starting on 1 February and 1 May are in blue and red, respectively, with the solid line representing the ensemble mean and the shaded area the ensemble spread. The MHW characteristics as given in the ESA-CCI product are in black.
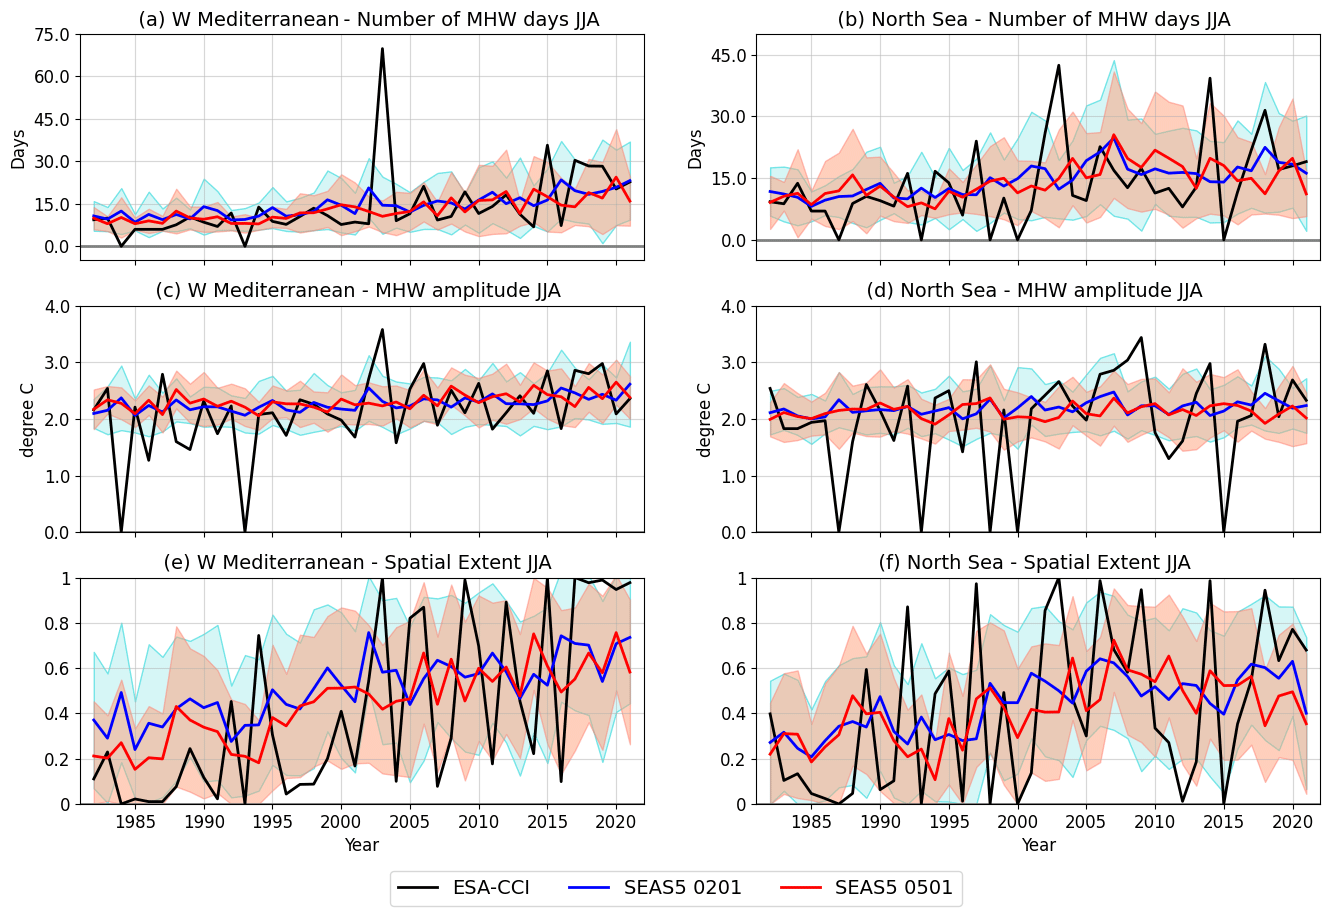
Figure 6The same as Fig. 5 for the western Mediterranean Sea (a, c, e) and the North Sea (b, d, f).
In the Caribbean (Fig. 5b, d, f), the prediction of both the number of MHW days and the spatial extent is quite accurate, especially for JJA 1998, 2005, and 2010 in the May forecast. This forecast looks confident with relatively low spread. The amplitude of the events is relatively low in both the forecasts and the observations. The forecasts, however, do not perform well in 1995, 2011, 2017, and 2020 for events that cover most of the region. The February forecast is less skilful in capturing the length of the 1998, 2005, and 2010 MHW events. Cetina-Heredia and Allende-Arandía (2023) linked the development of MHW in the Caribbean in 1998 and 2010 to predictable El Niño conditions. MHW in the Caribbean is also heavily influenced by the seasonal fluctuations in the Intertropical Convergence Zone (ITCZ) that usually come with weaker surface winds and weaker heat loss from the ocean to the atmosphere over the boreal summer (Fordyce et al., 2019). The well-predicted 2005 MHW event coincides with atmospheric conditions including particularly weak easterlies and anomalous shortwave radiation (Foltz and McPhaden, 2006) that started in winter and persisted over the summer. MHW occurrence in the Caribbean have also been linked to modes of variability such as the NAO (Holbrook et al., 2019) and the East Atlantic Pattern (EAP) that are less predictable (Dunstone et al., 2023) and could affect MHW forecast performances.
In both the western Mediterranean Sea and the North Sea (Fig. 6), the performance is not as good for both starting dates. Although the forecast system tends to capture the low-frequency modulation of MHW (trend in the western Mediterranean Sea and decadal modulation in the North Sea), especially in term of spatial extent (Fig. 6e, f), it does not appear skilful at predicting the interannual variability, producing false alarms and missing major events such as the one following the 2003 European heatwave. The low performance in the western Mediterranean agrees with Jacox et al. (2022), who show consistently low forecast probabilities for MHW in the area over the 1991–2020 period. McAdam et al. (2023) also show poor forecast skill in the Mediterranean (albeit in the eastern basins) at the ocean surface but argue that predictability can be found at the subsurface. The low skill in the North Sea is also in agreement with these two publications. There is little surprise in such lack of skill given the well-documented difficulties of SEAS5 in these regions (Calì Quaglia et al., 2022) that poorly predicts both NAO and SSTs in the north-western Atlantic (Johnson et al., 2019) and shows little skill in capturing some major atmospheric heatwave events that would impact the ocean surface (Prodhomme et al., 2021).
3.3 Observed and predicted trends for marine heatwaves
The number of MHW days has been increasing since the first decades of the 20th century (Oliver et al., 2018) and is expected to increase further in the context of global warming (Oliver et al., 2019). Global warming has already been identified as a factor contributing to MHW occurrence, leading to severe coral bleaching in the Caribbean (Donner et al., 2007). The trend in MHW days in the seasonal forecast is evaluated against observations as another assessment metric for the forecast system. Figure 7a and b display the trends in JJA for both the ensemble mean forecast starting on 1 May and the ESA-CCI product over the 1982–2021 period. The number of MHW days in the ESA-CCI product increases in most ocean regions, the Pacific Cold Tongue and parts of the Southern Ocean being the exceptions. The forecast is able to capture most of the observed features, with hot spots over the Pacific Warm Pool, in the tropical Indian Ocean, and in the southwestern Pacific off New Zealand. The forecasted trends are, however, often weaker than the observed ones, especially in the tropics, the north-eastern extra-tropical Pacific and the north-western subtropical Atlantic. Conclusions are similar for trends in MAM, SON, and DJF for forecasts starting on 1 February, 1 August, and 1 November (not shown).
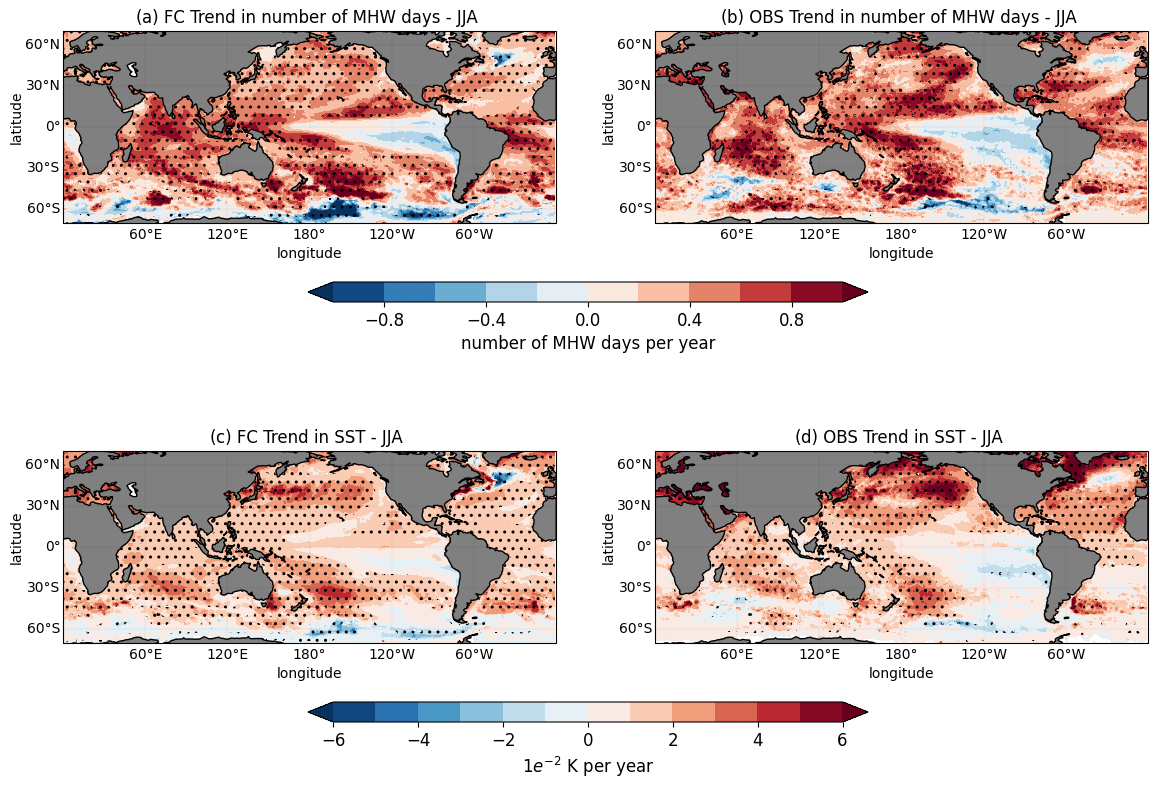
Figure 7Maps of the trend in number of MHW days (in number of days per year) over the 1982–2021 period in JJA for the ensemble mean seasonal forecast and the ESA-CCI SST analysis, respectively. (c, d) Maps of the trend in mean SST (in K yr−1) over the 1982–2021 period in JJA for the ensemble mean seasonal forecast and the ESA-CCI SST analysis, respectively. The hatches indicate the areas in which the trends are significant. Significance is estimated following DelSole and Tippett (2016).
Figure 7c and d display the trends in mean SST in JJA for both forecast and observation. The forecast trends mostly capture the observed ones in the tropics but are underestimated (overestimated) in the northern (southern) extra-tropics. Both forecast and observations show different spatial patterns in the trends of seasonal means of SST and number of MHW days. In the tropical Indian Ocean, northern subtropical eastern Pacific, and Caribbean and north-western subtropical Atlantic, the trends in number of MHW days appear more intense than the trends in seasonal mean SST. The colder high-latitude regions bordering the Arctic, by contrast, show more pronounced trends in seasonal SST means than in number of MHW days. These results illustrate the non-linear nature of the climate change (e.g. in that over warm convective areas it is difficult to increase the mean SST but still possible to increase the occurrence of MHW events) and highlights the importance of dedicated diagnostics to detect changes in extremes.
Global daily seasonal SST forecasts are or can be routinely output by operational forecasting centres. Predicted MHW characteristics can be derived from such forecasts and could eventually be delivered to stakeholders from the marine economy and management communities. This study evaluates the skill of the ECMWF SEAS5 system in predicting the occurrence of MHWs on seasonal timescales. This work comes after a series of recent publications on seasonal MHW predictions (Spillman et al., 2021; Jacox et al., 2022; McAdam et al., 2023) that are based on different seasonal prediction systems. In these studies, methods are different, with Jacox et al. (2022) using monthly forecast time series, while McAdam et al. (2023) focus more on forecasts of the ocean subsurface. Both Spillman et al. (2021) and Jacox et al. (2022) also investigate the predictability of more sophisticated aspects such as the onset of MHW events. In all of these studies, the MHW detection is based on the widely accepted definition from Hobday et al. (2016). Here, we proposed a slightly simpler definition to make it easily applicable to a wide range of forecasting systems and allow flexibility according to the use one wants to make of a seasonal MHW forecast. In forecasts from the SEAS5 system, we counted the number of days per season in which the SST is in the 90th percentile. Focusing on a specific area, this method can provide seasonal forecasts of the number of MHW days, the maximum amplitude of the MHWs over a season, and the proportion of the area affected by MHWs. Skill evaluation in this study is mostly based on the number of MHW days. Both deterministic (MSSS, correlation, and trend) and probabilistic (ROC) methods complement each other by assessing different aspects of the forecast skill.
Results presented here suggest that MHW prediction skill is very much area dependent in the current state of the SEAS5 system, confirming conclusions from previous studies (Spillman et al., 2021; Jacox et al., 2022). The largest skill is found in the tropics with a clear footprint of El Niño in the eastern Pacific, highly predictable at interannual timescales (Figs. 1 and 3) for both season 1 and 2 of the forecast and consistent with the predictability of ocean and atmospheric conditions linked to ENSO (L'Heureux et al., 2020). The signature of the PDO is apparent over the north-eastern Pacific, with high predictability skill in the first season consistent with both Jacox et al. (2022) and McAdam et al. (2023). This is consistent with processes highly conditioned by the ocean mixed layer but affected by the more unpredictable variability of local atmospheric circulation (Gasparin et al., 2020; de Boisséson et al., 2022). MHW occurrence in warm pool areas such as the western Pacific Ocean, the Indian Ocean, and the Caribbean Sea (Figs. 4b and 5b, d, f) is well predicted by SEAS5. These areas are affected by long-term trends (Bai et al., 2022; Donner et al., 2007) that slowly and consistently warm and deepen the warm pool and favour the onset of MHW. Climate modes such as the IOD and ENSO also impact the predictability of MHW in such regions, with location-dependent skill (Mayer et al., 2024). The MHWs in the North Atlantic and the northern European seas are influenced by the NAO and the Arctic Oscillation (Holbrook et al., 2019; She et al., 2020) that have limited and fast-decaying season-dependent skill (Scaife et al., 2014; Dunstone et al., 2023). The low skill in capturing major events in the Mediterranean showed in this study agrees with both Jacox et al. (2022) and McAdam et al. (2023) and is probably due to the impact of unresolved atmospheric variability (Ardilouze et al., 2017; Patterson et al., 2022). This is an area that would require further investigation with higher-resolution models. That said, even at long lead times, the low-frequency modulation of MHW characteristics is captured, and some level of skill in detecting the occurrence of MHW is found (Figs. 3 and 6).
Biases, limited representation of teleconnections and climate modes, atmospheric noise and model resolution all limit the predictability of MHW, in particular in the northern Extra-tropics. With record global atmospheric temperatures being reached in both 2022 and 2023, the current El Niño expected to lead to another hot year, and the recent intense and long-lasting MHW events already reported in various basins (Marullo et al., 2023; Oh et al., 2023; Berthou et al., 2023), accurate seasonal predictions could rapidly become very valuable for decision-making to alleviate the socio-economic impacts of such extreme events (Smith et al., 2021). Extracting more MHW prediction skill from seasonal predictions could be achieved using a multi-model ensemble (Jacox et al., 2022). The MHW forecast produced for SEAS5 could be, for example, generalised to the multi-model ensemble from the Copernicus Climate Change service (C3S), and seasonal predictions of MHW parameters could be a product released on a regular basis to be used as additional information by potential stakeholders. Given the nature of this study, the detection method is very general, and more prediction skill could be found devising targeted MHW indicators and thresholds according to a specific location, activity, or ecosystem. While MHW events are mostly detected at the surface, impacts on ecosystems and populations happen in the subsurface. Seasonal forecasts of ocean variables other than SST have so far received little attention, but recent work hints that forecast skill for the ocean heat content in the upper 300 m is comparable to the skill for SST in the tropics and even exceeds it in the extra-tropics (McAdam et al., 2022). The recent study by McAdam et al. (2023) actually showed that forecasting skill for MHW can be found in the 0–40 m layer depending on the region of interest and the type of MHW event. Further analysing the seasonal forecast of relevant ocean variables might be another avenue toward providing useful skill for predicting extreme marine events such as MHW.
This study used the following European Union (EU) Copernicus service datasets:
-
https://doi.org/10.48670/moi-00169 (EU Copernicus Marine Service Information, 2023),
-
https://doi.org/10.24381/cds.181d637e (Copernicus Climate Change Service, 2018).
Both EdB and MAB contributed to the formal analysis, investigation, software, visualisation, and writing necessary for the production of this paper.
The contact author has declared that neither of the authors has any competing interests.
Publisher's note: Copernicus Publications remains neutral with regard to jurisdictional claims made in the text, published maps, institutional affiliations, or any other geographical representation in this paper. While Copernicus Publications makes every effort to include appropriate place names, the final responsibility lies with the authors.
This article is part of the special issue “Extremes in the marine environment: analysis of multi-temporal and multi-scale dynamics using observations, models, and machine learning techniques”. It is a result of the EGU General Assembly 2023, session OS4.6, Vienna, Austria, 26 April 2023.
This study was partially funded by the European Union's Horizon 2020 Research and Innovation Framework Programme under grant agreement no. 862626.
This paper was edited by Milena Menna and reviewed by two anonymous referees.
Amaya, D. J., Miller, A. J., Xie, S. P., and Kosaka, Y.: Physical drivers of the summer 2019 North Pacific marine heatwave, Nat. Commun., 11, 1903, https://doi.org/10.1038/s41467-020-15820-w, 2020.
Ardilouze, C., Batté, L., Bunzel, F., Decremer, D., Déqué, M., Doblas-Reyes, F. J., Douville, H., Fereday, D., Guemas, V., MacLachlan, C., and Müller, W.: Multi-model assessment of the impact of soil moisture initialization on mid-latitude summer predictability, Clim. Dynam., 49, 3959–3974, https://doi.org/10.1007/s00382-017-3555-7, 2017.
Bai, W., Liu, H., Lin, P., Hu, S., and Wang, F.: Indo-Pacific warm pool present warming attribution and future projection constraint, Environ. Res. Lett., 17, 054026, https://doi.org/10.1088/1748-9326/ac5edf, 2022.
Balmaseda, M. A., Davey, M. K., and Anderson, D. L. T.: Decadal and Seasonal Dependence of ENSO Prediction Skill, J. Climate, 8, 2705–2715, https://doi.org/10.1175/1520-0442(1995)008<2705:DASDOE>2.0.CO;2, 1995.
Barbeaux, S. J., Holsman, K., and Zador, S.: Marine heatwave stress test of ecosystem-based fisheries management in the Gulf of Alaska Pacific cod fishery, Front. Mar. Sci., 7, 703, https://doi.org/10.3389/fmars.2020.00703, 2020.
Benthuysen, J. A., Smith, G. A., Spillman, C. M. and Steinberg, C. R.: Subseasonal prediction of the 2020 Great Barrier Reef and Coral Sea marine heatwave, Environ. Res. Lett., 16, 124050, https://doi.org/10.1088/1748-9326/ac3aa1, 2021.
Berthou, S., Renshaw, R., Smyth, T., Tinker, J., Grist, J., Wihsgott, J., Jones, S., Inall, M., Nolan, G., Arnold, A., and Castillo, J. M.: June 2023 marine heatwave over the Northwest European shelf: origins, weather feedback and future recurrence, Version 1, Research Square [preprint], https://doi.org/10.21203/rs.3.rs-3417023/v1, 23 October 2023.
Bond, N. A., Cronin, M. F., Freeland, H., and Mantua, N.: Causes and impacts of the 2014 warm anomaly in the NE Pacific, Geophys. Res. Lett., 42, 3414–3420, https://doi.org/10.1002/2015GL063306, 2015.
Bonino, G., Masina, S., Galimberti, G., and Moretti, M.: Southern Europe and western Asian marine heatwaves (SEWA-MHWs): a dataset based on macroevents, Earth Syst. Sci. Data, 15, 1269–1285, https://doi.org/10.5194/essd-15-1269-2023, 2023.
Buizza, R. and Palmer, T. N.: Impact of Ensemble Size on Ensemble Prediction, Mon. Weather Rev., 126, 2503–2518, https://doi.org/10.1175/1520-0493(1998)126<2503:IOESOE>2.0.CO;2, 1998.
Calì Quaglia, F., Terzago, S., and von Hardenberg, J.: Temperature and precipitation seasonal forecasts over the Mediterranean region: added value compared to simple forecasting methods, Clim. Dynam., 58, 2167–2191, https://doi.org/10.1007/s00382-021-05895-6, 2022.
Cetina-Heredia, P. and Allende-Arandía, M. E.: Caribbean marine heatwaves, marine cold spells, and co-occurrence of bleaching events, J. Geophys. Res.-Oceans, 128, e2023JC020147, https://doi.org/10.1029/2023JC020147, 2023.
Collins, M., Sutherland, M., Bouwer, L., Cheong, S.-M., Frölicher, T., Jacot Des Combes, H., Koll Roxy, M., Losada, I., McInnes, K., Ratter, B., Rivera-Arriaga, E., Susanto, R. D., Swingedouw, D., and Tibig, L.: Extremes, Abrupt Changes and Managing Risk, in: IPCC Special Report on the Ocean and Cryosphere in a Changing Climate, edited by: Pörtner, H.-O., Roberts, D. C., Masson-Delmotte, V., Zhai, P., Tignor, M., Poloczanska, E., Mintenbeck, K., Alegría, A., Nicolai, M., Okem, A., Petzold, J., Rama, B., and Weyer, N. M., Cambridge University Press, Cambridge, UK and New York, NY, USA, 589–655, https://doi.org/10.1017/9781009157964.008, 2019.
Copernicus Climate Change Service: Seasonal forecast daily and subdaily data on single levels, Copernicus Climate Change Service (C3S) Climate Data Store (CDS) [data set], https://doi.org/10.24381/cds.181d637e (last access: 22 March 2023), 2018.
Darmaraki, S., Somot, S., Sevault, F., Nabat, P., Cabos Narvaez, W. D., Cavicchia, L., Djurdjevic, V., Li, L., Sannino, G., and Sein, D. V.: Future evolution of Marine Heatwaves in the Mediterranean Sea, Clim. Dynam., 53, 1371–1392, https://doi.org/10.1007/s00382-019-04661-z, 2019.
Dayan, H., McAdam, R., Juza, M., Masina, S., and Speich, S.: Marine heat waves in the Mediterranean Sea: An assessment from the surface to the subsurface to meet national needs, Front. Mar. Sci., 10, 1045138, https://doi.org/10.3389/fmars.2023.1045138, 2023.
de Boisséson, E., Balmaseda, M. A., Mayer, M., and Zuo, H.: Section 4.3 of Copernicus Ocean State Report, issue 6, J. Oper. Oceanogr., 15, 1–220, https://doi.org/10.1080/1755876X.2022.2095169, 2022.
Dee, D. P., Uppala, S. M., Simmons, A. J., Berrisford, P., Poli, P., Kobayashi, S., Andrae, U., Balmaseda, M. A., Balsamo, G., Bauer, P., Bechtold, P., Beljaars, A. C. M., van de Berg, L., Bidlot, J., Bormann, N., Delsol, C., Dragani, R., Fuentes, M., Geer, A. J., Haimberger, L., Healy, S. B., Hersbach, H., Hólm, E. V., Isaksen, L., Kållberg, P., Köhler, M., Matricardi, M., McNally, A. P., Monge-Sanz, B. M., Morcrette, J.-J., Park, B.-K., Peubey, C., de Rosnay, P., Tavolato, C., Thépaut, J.-N., and Vitart, F.: The ERA-Interim reanalysis: configuration and performance of the data assimilation system, Q. J. Roy. Meteor. Soc., 137, 553–597, https://doi.org/10.1002/qj.828, 2011.
DelSole, T. and Tippett, M. K.: Forecast Comparison Based on Random Walks, Mon. Weather Rev., 144, 615–626, https://doi.org/10.1175/MWR-D-15-0218.1, 2016
Di Lorenzo, E., Schneider, N., Cobb, K. M., Chhak, K., Franks, P. J. S., Miller, A. J., McWilliams, J. C., Bograd, S. J., Arango, H., Curchister, E., Powell, T. M., and Rivere, P.: North Pacific Gyre Oscillation links ocean climate and ecosystem change, Geophys. Res. Lett., 35, L08607, https://doi.org/10.1029/2007GL032838, 2008.
Donner, S., Knutson, T. R., and Oppenheimer, M.: Model-based assessment of the role of human-induced climate change in the 2005 Caribbean coral bleaching event, P. Natl. Acad. Sci. USA, 104, 5483–5488, https://doi.org/10.1073/pnas.0610122104, 2007.
Dunstone, N., Smith, D. M., Hardiman, S. C., Hermanson, L., Ineson, S., Kay, G., Li, C., Lockwood, J. F., Scaife, A. A., Thornton, H., and Ting, M.: Skilful predictions of the Summer North Atlantic Oscillation, Commun. Earth Environ., 4, 409, https://doi.org/10.1038/s43247-023-01063-2, 2023.
Earl, E.: Stock decline leads to historic shutdown for Gulf P-cod, Alaska Journal of Commerce, https://www.alaskajournal.com/ (last access: 21 February 2024), 2019.
E.U. Copernicus Marine Service Information (CMEMS): ESA SST CCI and C3S reprocessed sea surface temperature analyses, Marine Data Store (MDS) [data set], https://doi.org/10.48670/moi-00169, last access: 14 March 2023.
Foltz, G. R. and McPhaden, M. J.: Unusually warm sea surface temperatures in the tropical North Atlantic during 2005, Geophys. Res. Lett., 33, L19703, https://doi.org/10.1029/2006GL027394, 2006.
Fordyce, A. J., Ainsworth, T. D., Heron, S. F., and Leggat, W.: Marine heatwave hotspots in coral reef environments: Physical drivers, ecophysiological outcomes and impact upon structural complexity, Front. Mar. Sci., 6, 498, https://doi.org/10.3389/fmars.2019.00498, 2019.
Gasparin, F., Mignot, A., and Perruche, C.: Section 4.3 of Copernicus Ocean State Report, issue 4, J. Oper. Oceanogr., 13, S1–S172, https://doi.org/10.1080/1755876X.2020.1785097, 2020.
Gentemann, C. L., Fewings, M. R., and García-Reyes, M.: Satellite sea surface temperatures along the West Coast of the United States during the 2014–2016 northeast Pacific marine heat wave, Geophys. Res. Lett., 44, 312–319, https://doi.org/10.1002/2016GL071039, 2017.
Good, S., Fiedler, E., Mao, C., Martin, M. J., Maycock, A., Reid, R., Roberts-Jones, J., Searle, T., Waters, J., While, J., and Worsfold, M.: The Current Configuration of the OSTIA System for Operational Production of Foundation Sea Surface Temperature and Ice Concentration Analyses, Remote Sens., 12, 720, https://doi.org/10.3390/rs12040720, 2020.
Hobday, A. J., Alexander, L. V., Perkins, S. E., Smale, D. A., Straub, S. C., Oliver, E. C., Benthuysen, J. A., Burrows, M. T., Donat, M. G., Feng, M., and Holbrook, N. J.: A hierarchical approach to defining marine heatwaves, Prog. Oceanogr., 141, 227–238, https://doi.org/10.1016/j.pocean.2015.12.014, 2016.
Hobday, A. J., Spillman, C. M., Eveson, J. P., Hartog, J. R., Zhang, X., and Brodie, S.: A framework for combining seasonal forecasts and climate projections to aid risk management for fisheries and aquaculture, Front. Mar. Sci., 5, 137, https://doi.org/10.3389/fmars.2018.00137, 2018.
Holbrook, N. J., Scannell, H. A., Sen Gupta, A., Benthuysen, J. A., Feng, M., Oliver, E. C., Alexander, L. V., Burrows, M. T., Donat, M. G., Hobday, A. J., and Moore, P. J.: A global assessment of marine heatwaves and their drivers, Nat. Commun., 10, 2624, https://doi.org/10.1038/s41467-019-10206-z, 2019.
Jacox, M. G., Alexander, M. A., Amaya, D., Becker, E., Bograd, S. J., Brodie, S., Hazen, E. L., Pozo Buil, M., and Tommasi, D.: Global seasonal forecasts of marine heatwaves, Nature, 604, 486–490, https://doi.org/10.1038/s41586-022-04573-9, 2022.
Johnson, S. J., Stockdale, T. N., Ferranti, L., Balmaseda, M. A., Molteni, F., Magnusson, L., Tietsche, S., Decremer, D., Weisheimer, A., Balsamo, G., Keeley, S. P. E., Mogensen, K., Zuo, H., and Monge-Sanz, B. M.: SEAS5: the new ECMWF seasonal forecast system, Geosci. Model Dev., 12, 1087–1117, https://doi.org/10.5194/gmd-12-1087-2019, 2019.
Juza, M., Fernández-Mora, À., and Tintoré, J.: Sub-Regional marine heat waves in the Mediterranean Sea from observations: Long-term surface changes, Sub-surface and coastal responses, Front. Mar. Sci., 9, 785771, https://doi.org/10.3389/fmars.2022.785771, 2022.
Kajtar, J. B., Holbrook, N. J., and Hernaman, V.: A catalogue of marine heatwave metrics and trends for the Australian region, Journal of Southern Hemisphere Earth Systems Science, 71, 284–302, https://doi.org/10.1071/ES21014, 2021.
Laurel, B. J. and Rogers, L. A.: Loss of spawning habitat and prerecruits of Pacific cod during a Gulf of Alaska heatwave, Can. J. Fish. Aquat. Sci., 77, 644–650, https://doi.org/10.1139/cjfas-2019-0238, 2020.
L'Heureux, M. L., Levine, A. F. Z., Newman, M., Ganter, C., Luo, J.-J., Tippett, M. K., and Stockdale, T. N.: ENSO Prediction, in: El Niño Southern Oscillation in a Changing Climate, edited by: McPhaden, M. J., Santoso, A., and Cai, W., American Geophysical Union, https://doi.org/10.1002/9781119548164.ch10, 2020.
Madec, G., Bourdallé-Badie, R., Bouttier, P.-A., Bricaud, C., Bruciaferri, D., Calvert, D., Clementi, E., Coward, A., Delrosso, D., Ethé, C., Flavoni, S., Graham, T., Harle, J., Iovino, D., Lea, D., Lévy, C., Lovato, T., Martin, N., Masson, S., Mocavero, S., Paul, J., Rousset, C., Storkey, D., Storto, A., and Vancoppenolle, M.: NEMO ocean engine: version 3.6 stable, Note du Pole de modelisation, Institut Pierre-Simon Laplace, No. 27, Zenodo, https://doi.org/10.5281/zenodo.3248739, 2017.
Marullo, S., Serva, F., Iacono, R., Napolitano, E., di Sarra, A., Meloni, D., Monteleone, F., Sferlazzo, D., De Silvestri, L., de Toma, V., and Pisano, A.: Record-breaking persistence of the 2022/23 marine heatwave in the Mediterranean Sea, Environ. Res. Lett., 18, 114041, https://doi.org/10.1088/1748-9326/ad02ae, 2023.
Mason, I.: A model for assessment of weather forecasts, Aust. Meteorol. Mag., 30, 291–303, 1982.
Mason, S. J. and Graham, N. E.: Conditional Probabilities, Relative Operating Characteristics, and Relative Operating Levels, Wea. Forecast., 14, 713–725, https://doi.org/10.1175/1520-0434(1999)014<0713:CPROCA>2.0.CO;2, 1999.
Mayer, M., Balmaseda, M. A., Johnson, S., and Vitar, F.: Assessment of seasonal forecasting errors of the ECMWF system in the eastern Indian Ocean, Clim. Dynam., 62, 1391–1406, https://doi.org/10.1007/s00382-023-06985-3, 2024.
McAdam, R., Masina, S., Balmaseda, M., Gualdi, S., Senan, R., and Mayer, M.: Seasonal forecast skill of upper-ocean heat content in coupled high-resolution systems, Clim. Dynam., 58, 3335–3350, https://doi.org/10.1007/s00382-021-06101-3, 2022.
McAdam, R., Masina, S., and Gualdi, S.: Seasonal forecasting of subsurface marine heatwaves, Commun. Earth Environ., 4, 225, https://doi.org/10.1038/s43247-023-00892-5, 2023.
McCabe, R. M., Hickey, B. M., Kudela, R. M., Lefebvre, K. A., Adams, N. G., Bill, B. D., Gulland, F. M. D., Thomson, R. E., Cochlan, W. P., and Trainer, V. L.: An unprecedented coastwide toxic algal bloom linked to anomalous ocean conditions, Geophys. Res. Lett., 43, 10366–10376, https://doi.org/10.1002/2016GL070023, 2016.
Merchant, C. J., Embury, O., Bulgin, C. E., Block, T., Corlett, G. K., Fiedler, E., Good, S. A., Mittaz, J., Rayner, N. A., Berry, D., and Eastwood, S.: Satellite-based time-series of sea-surface temperature since 1981 for climate applications, Sci. Data, 6, 223, https://doi.org/10.1038/s41597-019-0236-x, 2019.
Michaud, K. M., Reed, D. C., and Miller, R. J.: The Blob marine heatwave transforms California kelp forest ecosystems, Commun. Biol., 5, 1143, https://doi.org/10.1038/s42003-022-04107-z, 2022.
Oh, H., Kim, G. U., Chu, J. E., Lee, K., and Jeong, J. Y.: The record-breaking 2022 long-lasting marine heatwaves in the East China Sea, Environ. Res. Lett., 18, 064015, https://doi.org/10.1088/1748-9326/acd267, 2023.
Oliver, E. C. J., Benthuysen, J. A., Bindoff, N. L., Hobday, A. J., Holbrook, N. J., Mundy, C. N., and Perkins-Kirkpatrick, S. E.: The unprecedented 2015/16 Tasman Sea marine heatwave, Nat. Commun., 8, 16101, https://doi.org/10.1038/ncomms16101, 2017.
Oliver, E. C. J., Donat, M. G., Burrows, M. T., Moore, P. J., Smale, D. A., Alexander, L. V., Benthuysen, J. A., Feng, M., Sen Gupta, A., Hobday, A. J., and Holbrook, N. J.: Longer and more frequent marine heatwaves over the past century, Nat. Commun., 9, 1324, https://doi.org/10.1038/s41467-018-03732-9, 2018.
Oliver, E. C. J., Burrows, M. T., Donat, M. G., Sen Gupta, A., Alexander, L. V., Perkins-Kirkpatrick, S. E., Benthuysen, J. A., Hobday, A. J., Holbrook, N. J., Moore, P. J., and Thomsen, M. S.: Projected marine heatwaves in the 21st century and the potential for ecological impact, Front. Mar. Sci., 6, 734, https://doi.org/10.3389/fmars.2019.00734, 2019.
Patterson, M., Weisheimer, A., Befort, D. J., and O'Reilly, C. H.: The strong role of external forcing in seasonal forecasts of European summer temperature, Environ. Res. Lett., 17, 104033, https://doi.org/10.1088/1748-9326/ac9243, 2022.
Prodhomme, C., Materia, S., Ardilouze, C., White, R. H., Batté, L., Guemas, V., Fragkoulidis, G., and García-Serrano, J.: Seasonal prediction of European summer heatwaves, Clim. Dynam., 58, 2149–2166, https://doi.org/10.1007/s00382-021-05828-3, 2021.
Scaife, A. A., Arribas, A., Blockley, E., Brookshaw, A., Clark, R. T., Dunstone, N., Eade, R., Fereday, D., Folland, C. K., Gordon, M., and Hermanson, L.: Skillful long-range prediction of European and North American winters, Geophys. Res. Lett., 41, 2514–2519, https://doi.org/10.1002/2014GL059637, 2014.
She, J., Su, J., and Zinck, A. S.: Section 4.4 of Copernicus Ocean State Report, issue 4, J. Oper. Oceanogr., 13, S1–S172, https://doi.org/10.1080/1755876X.2020.1785097, 2020.
Smith, K. E., Burrows, M. T., Hobday, A. J., Sen Gupta, A., Moore, P. J., Thomsen, M., Wernberg, T., and Smale, D. A.: Socioeconomic impacts of marine heatwaves: Global issues and opportunities, Science, 374, eabj3593, https://doi.org/10.1126/science.abj3593, 2021.
Spillman, C. M., Smith, G. A., Hobday, A. J., and Hartog, J. R.: Onset and decline rates of marine heatwaves: Global trends, seasonal forecasts and marine management, Front. Clim., 3, 801217, https://doi.org/10.3389/fclim.2021.801217, 2021.
Stanski, H. R., Wilson, L. J., and Burrows, W. R.: Survey of common verification methods in meteorology, WMO World Weather Watch Tech. Rep. 8, WMO TD 358, 114 pp., https://library.wmo.int/idurl/4/39578 (last access: 19 February 2024), 1989.
Swets, J. A.: The Relative Operating Characteristic in Psychology, Science, 182, 990–1000, https://doi.org/10.1126/science.182.4116.990, 1973.
Webster, P. J. and Yang, S.: Monsoon and Enso: Selectively Interactive Systems, Q. J. Roy. Meteor. Soc., 118, 877–926, https://doi.org/10.1002/qj.49711850705, 1992.
Zuo, H., Balmaseda, M. A., Tietsche, S., Mogensen, K., and Mayer, M.: The ECMWF operational ensemble reanalysis–analysis system for ocean and sea ice: a description of the system and assessment, Ocean Sci., 15, 779–808, https://doi.org/10.5194/os-15-779-2019, 2019.