the Creative Commons Attribution 4.0 License.
the Creative Commons Attribution 4.0 License.
 | 12 Feb 2026
Eddy kinetic energy variability from 30 years of altimetry in the Mediterranean Sea
Vincent Combes
Bàrbara Barceló-Llull
Ananda Pascual
Mesoscale activity plays a central role in ocean variability, substantially influencing the mixing of biogeophysical tracers, such as heat and carbon, and driving changes in ecosystems. Eddy Kinetic Energy (EKE), a metric used for studying the intensity of mesoscale processes, has recently been shown to increase in regions of intense EKE worldwide. Strong EKE positive trends are observed, for example, in the principal western boundary current regions, such as the Gulf Stream, Kuroshio Extension, and the Brazil/Malvinas Confluence. In this study, we assess whether the Mediterranean Sea, known to be a hotspot for climate change impacts, also exhibits such intensification. Despite the high number of observational data and modeling experiments, there is a gap in understanding the long-term evolution of mesoscale dynamics and EKE trends in the Mediterranean Sea. This study investigates EKE trends in the Mediterranean Sea using daily geostrophic currents derived from satellite altimetric data. To test the robustness of the results, we compare EKE trends computed from three different gridded altimetric products: a global product derived from a stable two-satellite constellation (two-sat) and two other products (global and European) incorporating all available satellites (all-sat). While all products reveal a general increase in EKE in the Mediterranean Sea over the last three decades, the trends calculated from the two-sat product are significantly smaller than those computed from the all-sat products. We show that this discrepancy is strongly linked to the increasing number of satellites over time used to construct the all-sat data sets, which enhances both spatial and temporal coverage, and hence, their capacity to detect higher energy levels. To evaluate the fidelity of these gridded products in capturing EKE trends, we compare them with along-track data in high-energy regions of the Mediterranean Sea: the Alboran Sea and the Ierapetra area. These regions exhibit contrasting EKE trends: positive in the Alboran Sea and negative in the Ierapetra area. These findings highlight the importance of using altimetric products with a stable number of satellites constructed for climate applications when addressing long-term ocean variability analysis.
- Article
(6232 KB) - Full-text XML
-
Supplement
(43891 KB) - BibTeX
- EndNote


The ocean is a central component of the Earth's climate system, playing a key role in distributing heat and absorbing carbon. Since the beginning of the industrial era, the ocean is estimated to have absorbed more than 90 % of the excess heat generated by human activity and nearly one-third of anthropogenic carbon emissions (Abram et al., 2019). This massive uptake directly contributes to rising ocean temperatures, with consequences for sea level, thermohaline circulation, and overall climate dynamics. In a climate change context, a deeper understanding of the response of the ocean is necessary.
A large part of the transport of water properties such as heat and nutrients in the ocean occurs at spatial scales ranging from 10 to 100 km, commonly referred to as the mesoscale (Chelton et al., 2011; Gaube et al., 2019; Becker et al., 2025). Mesoscale features (such as eddies, fronts, and meanders) are ubiquitous in the ocean and possess distinct physical and dynamical characteristics that enable them to efficiently transport these properties. A widely used metric to characterize mesoscale activity and evaluate its intensity and variability is the Eddy Kinetic Energy (EKE) (Wilkin and Morrow, 1994), which quantifies the energy associated with time-varying flow. Recent studies have reported a robust global intensification of EKE, particularly in high-energy regions such as the western boundary currents, based on satellite observations (Martínez-Moreno et al., 2021; Barceló-Llull et al., 2025) and model simulations (Hu et al., 2020). These studies consistently identify positive trends in EKE within western boundary currents since 1993, year marking the beginning of the altimetry era. To evaluate the robustness of satellite-based EKE trends, Barceló-Llull et al. (2025) compared two different satellite altimetry products and highlighted substantial differences in the derived trends. Barceló-Llull et al. (2025) compared a satellite product that merges all available satellite missions (all-sat) with another product based on a consistent two-satellite constellation and built for climate applications (two-sat), revealing that EKE trends derived from the two-sat product are significantly smaller than those obtained from the all-sat product.
Here, we focus on the Mediterranean Sea, a hotspot for climate change and an ideal miniature ocean for studying climate change impacts (Bethoux et al., 1999; Escudier et al., 2021). It is a semi-enclosed basin characterized by relatively low EKE levels compared to the global ocean (Pujol and Larnicol, 2005), yet still rich in mesoscale eddies, filaments, and fronts (Barral et al., 2021; Mason et al., 2023; Zodiatis et al., 2023). The Mediterranean is also distinguished by a first baroclinic Rossby deformation radius, ranging from about 10 to 20 km (Beuvier et al., 2012; Kurkin et al., 2020), indicating that mesoscale features are smaller and challenging to observe from satellite data. The regional circulation is shaped by the inflow at the surface of Atlantic water through the Strait of Gibraltar to compensate for the high evaporation (Schroeder et al., 2012), forming the Atlantic Jet (Renault et al., 2012). These Atlantic waters progress counterclockwise in the Mediterranean (Fig. 1), mixing with resident Mediterranean water. The water input from the Atlantic becomes saltier, warmer and denser, during its journey before exiting through the Strait of Gibraltar, in depth. A more detailed description of surface currents is provided by Poulain et al. (2012) and Escudier et al. (2021). The Atlantic Jet drives anticyclonic gyres in the Alboran Sea (Renault et al., 2012) (Fig. 1). These features, along with other recurrent structures such as the Ierapetra eddy (Fig. 1) in the eastern basin (Ioannou et al., 2017), play a central role in the Mediterranean's mesoscale dynamics. A key question is whether these energetic features have intensified over the altimetry period, in line with the increasing EKE observed in several regions worldwide (Martínez-Moreno et al., 2021; Barceló-Llull et al., 2025).
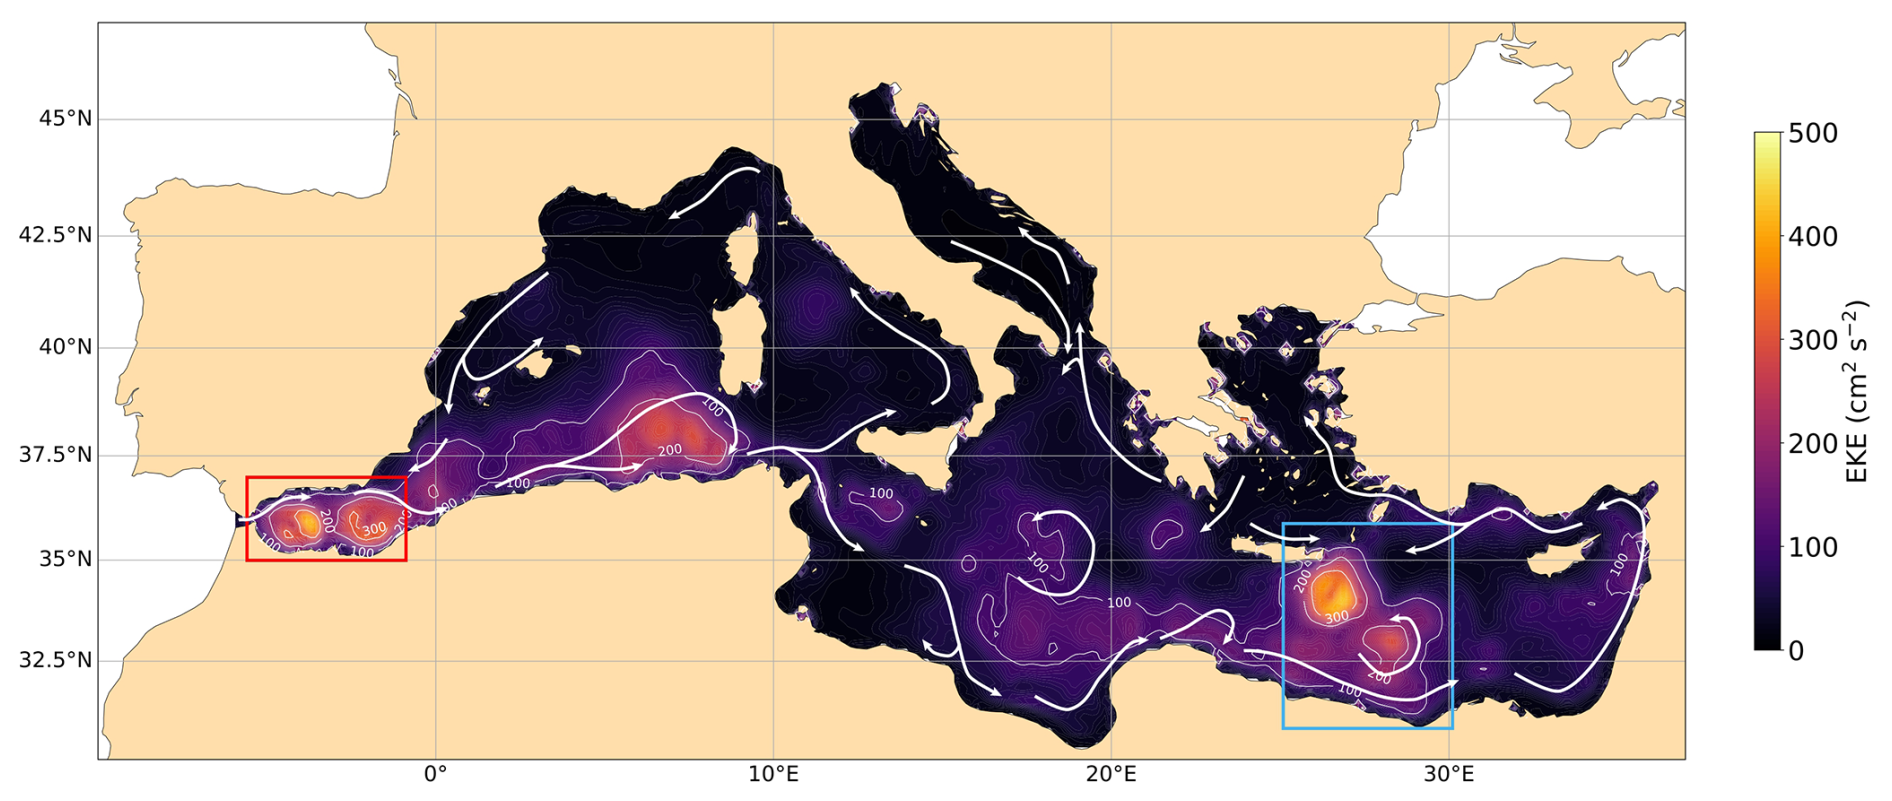
Figure 1Temporal average of EKE in the Mediterranean Sea over 1993–2023, from all-sat European product. White arrows represent the circulation of Atlantic waters, adapted from Millot and Taupier-Letage (2005). Boxes represent the regions analyzed in Fig. 7, the Alboran Sea in red and Ierapetra area in blue.
The objective of this study is to investigate the spatial distribution and temporal evolution of EKE across the Mediterranean basin. To assess the robustness of the EKE variability, we compare three gridded altimetric products which differ in their satellite constellation configurations and resolution, highlighting the role of observational coverage in detecting mesoscale activity. We evaluate the fidelity of these products in capturing EKE trends by comparing them with along-track data (L3). Our results reveal spatial heterogeneity in EKE trends, with contrasting behaviors in energetic regions such as the Alboran Sea and the Ierapetra area.
2.1 Altimetry data derived products
2.1.1 Level 4
We rely on three gridded Level 4 (L4) satellite altimetry products provided by the EU Copernicus Marine Service (CMEMS: https://marine.copernicus.eu/, last access: 23 July 2024, Le Traon et al., 2019). These products include gap-free daily zonal and meridional geostrophic velocity anomalies derived from gridded Sea Level Anomaly (SLA) fields:
-
“all-sat-glo”: a global 1/4° resolution product based on all available altimeter missions, ranging from two in 1993 to up to seven in 2023 (Fig. 2);
-
“all-sat-euro”: using all available altimeter missions as all-sat-glo, but interpolated onto a 1/8° resolution grid of the European region;
-
“two-sat-glo”: a global 1/4° resolution product derived from a two-satellite constellation. This configuration ensures temporal stability and homogeneity, making it particularly suitable for climate studies.
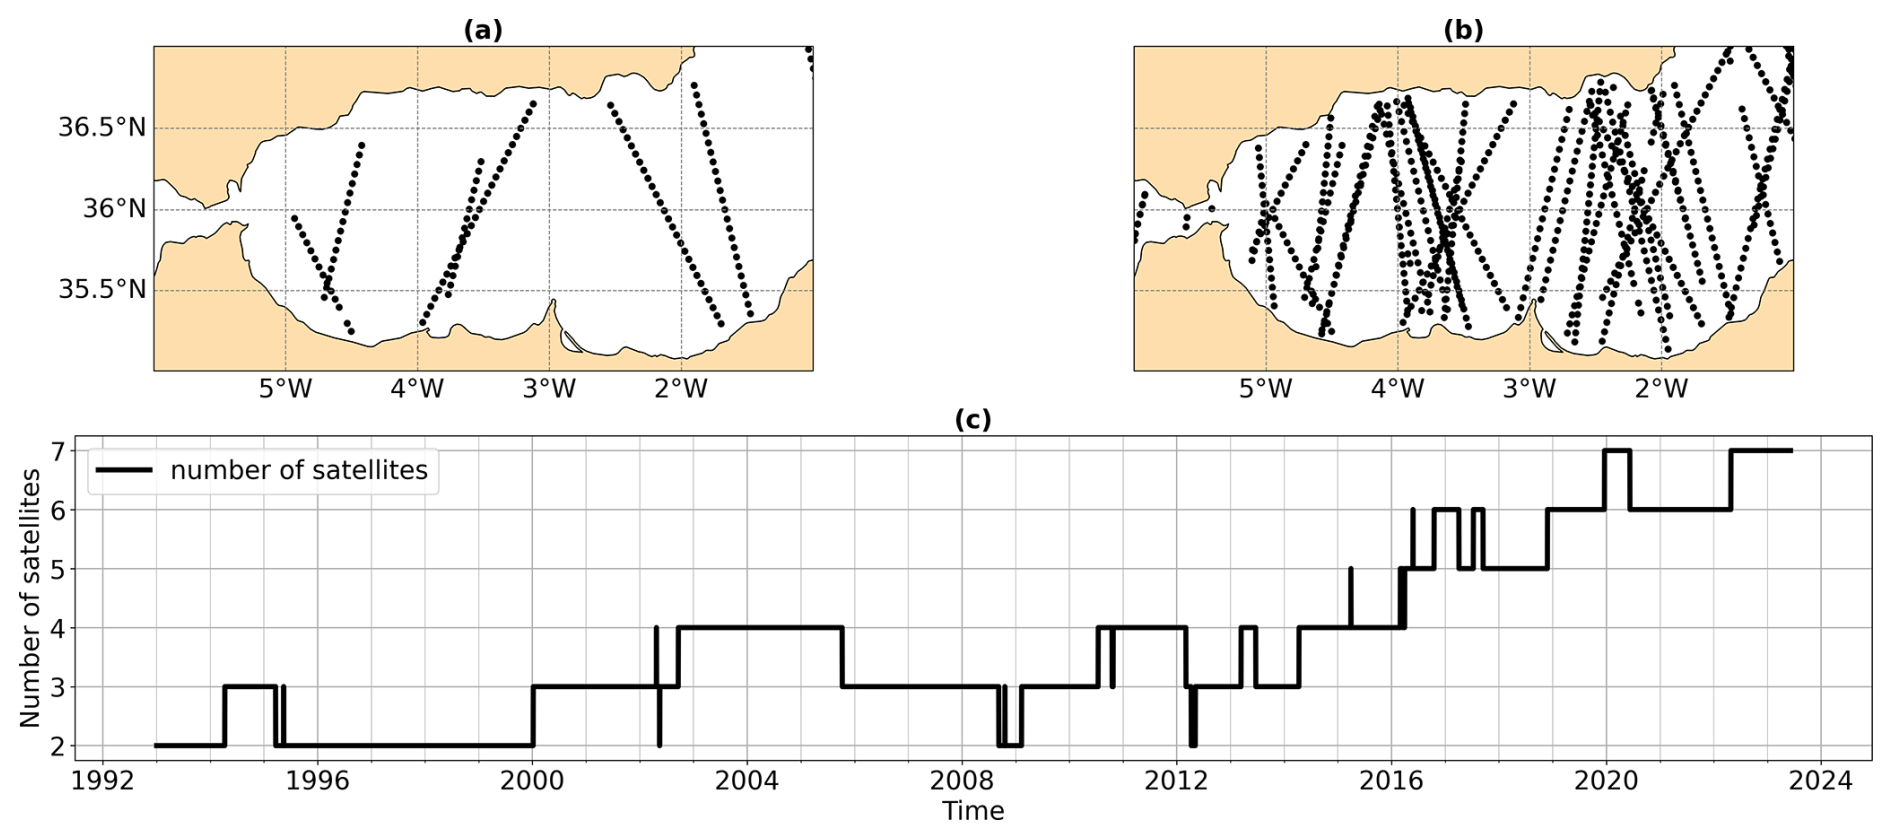
Figure 2(a) Ground tracks from the two satellites used in two-sat-glo over 20 d (from 1–20 May 2022) in the Alboran Sea. (b) Same as in (a) for all-sat products (7 satellites between 1–20 May 2022). (c) Evolution of the number of altimetry missions used to build the all-sat products.
2.1.2 Level 3
Level 3 (L3) along-track data is also used for comparison with the L4 products. Also available from CMEMS, we specifically select tracks corresponding to the reference altimetry missions (TOPEX, Jason series, Sentinel-6). This selection ensures spatial and temporal consistency of the tracks throughout the 1993–2023 period. This data set provides along-track SLA measurements with a temporal resolution of 10 d, and approximately 7 km for the along-track spatial resolution. In the remainder of this manuscript, this dataset will be referred to as L3-ref.
2.1.3 Eddy Atlas
We use the all-sat and two-sat altimetric Mesoscale Eddy Trajectories Atlas (META3.2 DT) (Pegliasco et al., 2022), produced by SSALTO/DUACS and distributed by AVISO+ (https://aviso.altimetry.fr, last access: 1 July 2025). These atlas identify all anticyclonic and cyclonic eddies detected from the gridded all-sat-glo and two-sat-glo data sets, and provide key eddy characteristics including location, closed contours, radius, and rotational speed. The detection algorithm used to generate this atlas was developed in collaboration between IMEDEA (Mason et al., 2014) and CLS, is freely available under GNU General Public License https://github.com/AntSimi/py-eddy-tracker (last access: 1 July 2025). The META eddy atlases are constructed from gridded Absolute Dynamic Topography (ADT) fields (i.e. SLA + MDT, Mean Dynamic Topography) from DUACS. A high-pass filter removes large-scale signals to isolate mesoscale variability and eddies are then identified from closed ADT contours using strict geometric and amplitude criteria. Finally, eddies are tracked in time by overlapping their effective contours between consecutive days to build trajectories. In this study, no lifetime threshold is applied and all detected eddies are considered, including short-lived eddies (lifetime < 10 d), long-lived eddies (>10 d), and untracked eddies, which are detected features not associated with any other eddy in time.
2.2 Methods
2.2.1 Eddy kinetic energy
Throughout the manuscript the EKE is defined as:
where uga and vga refer to the components of geostrophic velocity anomalies in the zonal and meridional directions, respectively. Note that in the original CMEMS products, geostrophic velocity anomalies (uga, vga) are computed relative to the reference period 1993–2012. For consistency with the full duration of the altimetric record, we recalculated these anomalies using an extended reference period of 1993–2023, so that they now reflect deviations from the mean over the entire altimetry era. The time series of spatially averaged EKE were obtained by computing the area-weighted mean EKE:
where Ai,j denotes the area of the grid cell at longitude and latitude indices i and j, respectively. The grid-cell areas were estimated using distances derived from the Haversine formula.
2.2.2 Cross-track velocities
For the L3-ref product, we use the component of the cross-track geostrophic velocity (uga⟂) derived from the SLA along-track data (η). uga⟂ is computed using a central finite difference method with a 5-point stencil width as follow (in the horizontal plane):
where l is the distance between two successive nadir measurements, α is the angle between the north direction and the satellite track, g is the gravitational acceleration, and f is the Coriolis parameter. The EKE computed from L3 data is thus based solely on the cross-track component of the geostrophic velocity anomalies and therefore represents a portion of the total EKE. For comparison, we also calculated EKE⟂ from the L4 data by interpolating the gridded SLA field onto the along-track positions (both in space and time).
2.2.3 Mann–Kendall test
All calculated trends presented in this study are assessed using the Mann–Kendall test (MK test). MK test is a non-parametric method commonly used to detect monotonic trends in time series. However, serial autocorrelation in the data affects the significant level of the MK test. To address this, we adopted the correction proposed by Yue and Wang (2004) implemented in the Pymannkendall Python package (https://pypi.org/project/pymannkendall/, last access: 23 July 2024). Moreover, the standards errors (SE) associated with the different trends estimates were evaluated as the residual standard error, considering the effective sample size (Stan Development Team, 2021), and normalized by the temporal spread of the data points (James et al., 2023):
with yi the observations, the predictions, neff the effective sample size, xi the independent variable (i.e. time), and its mean. Trends were considered statistically significant when the associated p value was below 0.05.
3.1 Mean eddy kinetic energy in the Mediterranean Sea
The mean EKE in the Mediterranean Sea exhibits a heterogeneous spatial distribution, with most of the basin characterized by relatively low values of EKE (Fig. 1). The overall spatiotemporal mean is 66.10 cm2 s−2. In the western Mediterranean, the Alboran Sea stands out with intense eddy activity around the two semi-permanent anticyclonic gyres (Renault et al., 2012), reaching a spatiotemporal mean EKE of 235.58 cm2 s−2. This vigorous eddy activity, up to 400 cm2 s−2 (Mason et al., 2023), plays a key role in modulating heat and salt transport through the Strait of Gibraltar (Bryden et al., 1994; Tsimplis and Bryden, 2000; Sánchez-Román et al., 2009). In the eastern Mediterranean, the most energetic feature is the Ierapetra eddy, a long-lived anticyclonic structure that forms southeast of Crete (Larnicol et al., 2002; Ioannou et al., 2017; Pegliasco et al., 2021), with a spatiotemporal mean EKE of 319.63 cm2 s−2, up to 500 cm2 s−2 (Mason et al., 2023). For comparison, EKE values over the Gulf Stream and the Kuroshio Extension can exceed 3000 cm2 s−2 (Renault et al., 2017; Barceló-Llull et al., 2025).
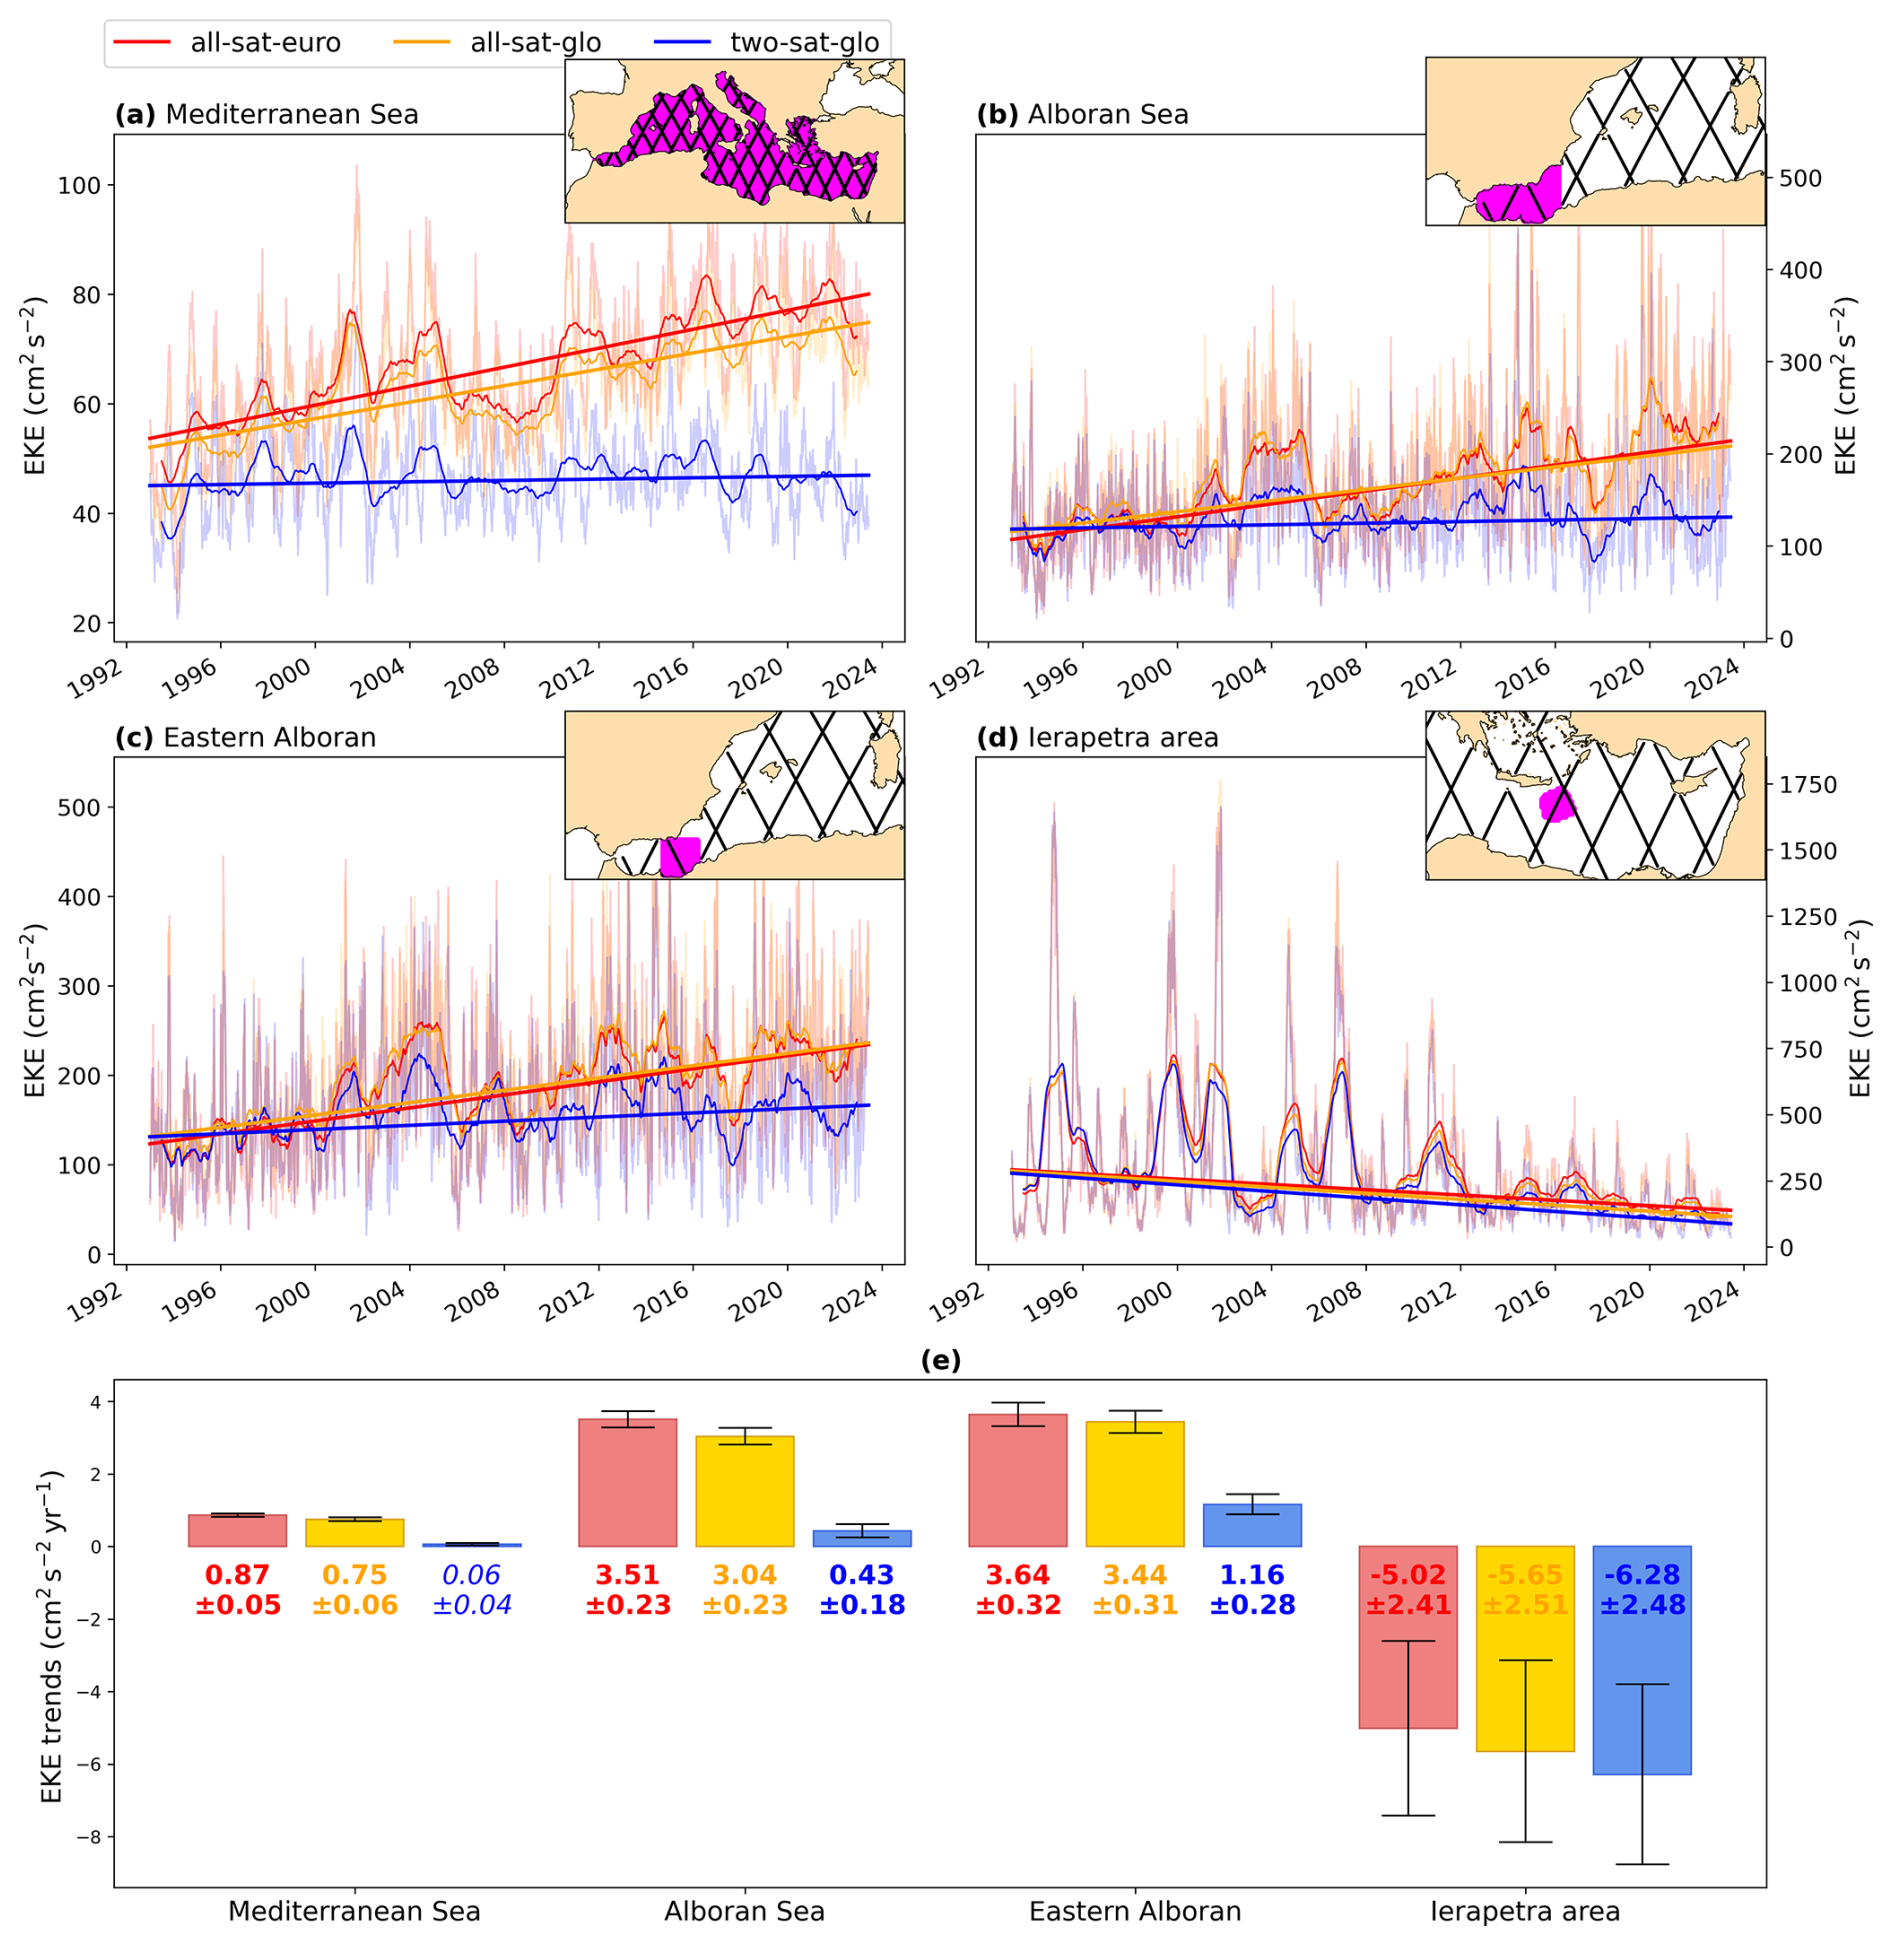
Figure 3Area-weighted mean EKE over (a) the Mediterranean Sea, (b) the Alboran Sea, (c) the eastern Alboran Sea and (d) the Ierapetra area for the different L4 products. Thinner lines are the raw daily data while thicker lines represent the yearly-rolling mean. Straight lines correspond to the trends of the raw data. The time series are calculated by averaging the EKE over the regions indicated in the insets, where the black lines are the reference altimeter tracks. (e) EKE trends and their associated error for the different L4 products in the four studied regions. Statistically non-significant trends are indicated in italics (only two-sat-glo in the Mediterranean Sea).
3.2 Influence of altimeter coverage: all-sat versus two-sat
The EKE averaged over the Mediterranean Sea (Fig. 3a) from all-sat-glo shows a significant increase during the altimetric era, from a mean of 44.91 cm2 s−2 in 1993 to 68.04 cm2 s−2 in 2022. The computed trend is 0.75±0.06 cm2 s−2 yr−1 (Fig. 3e) and is statistically significant. This result is consistent with all-sat-euro which exhibits a similar trend of 0.87±0.05 cm2 s−2 yr−1 (Fig. 3e). Although comparable, the all-sat-euro trend is slightly stronger as it has a higher spatial resolution (1/8° compared to 1/4° for all-sat-glo), which allows for better representation of mesoscale eddies and their associated energy (Wang et al., 2022). However, the two-sat-glo product shows a markedly weaker and not statistically significant trend of 0.06±0.04 cm2 s−2 yr−1 over the Mediterranean Sea (Fig. 3a and e). The larger trend detected in the all-sat products can be explained by the fact that they estimate nearly twice as much EKE as the two-sat-glo product in recent years. Despite these notable differences in trends magnitude, all three L4 products show strong agreement on seasonal cycles and interannual variability (r=0.98 between all-sat-glo and all-sat-euro and r=0.79 between all-sat-glo and two-sat-glo after removing their linear trends).

Figure 4(a) Time series of the difference between all-sat-glo and two-sat-glo EKE and the number of altimetry missions. (b) Time series of the area-weighted mean EKE over the Mediterranean Sea for two-sat-glo and all-sat-glo-corrected.
In the Alboran Sea region (Fig. 3b and e), all three products exhibit positive and statistically significant EKE trends, in contrast to the Mediterranean basin as a whole where the two-sat-glo trend is not significant. The trends are also higher in magnitude than those observed for the whole Mediterranean, with a particularly pronounced gap between all-sat-glo (3.04±0.23 cm2 s−2 yr−1) and two-sat-glo (0.43±0.18 cm2 s−2 yr−1). This indicates that the impact of the increasing number of satellites is especially evident in energetic regions such as the Alboran, where all-sat products capture much stronger EKE levels than the two-sat product. A focus on the eastern Alboran gyre (Fig. 3c) reveals similar trends to those observed across the broader Alboran Sea for all-sat products (3.64±0.32 cm2 s−2 yr−1 for all-sat-euro and 3.44±0.31 cm2 s−2 yr−1 for all-sat-glo), while revealing a net increase for the two-sat-glo product: 1.16±0.28 cm2 s−2 yr−1. This suggests that the alignment of altimeter tracks relative to energetic features (Fig. 2) plays a significant role in capturing variability accurately.
Unlike the other regions, the Ierapetra region displays strong statistically significant negative trends (Fig. 3d and e, the boundary of the Ierapetra area was defined as an EKE-isoline of the 30 years mean of all-sat-euro product in order to have the same region for all the products, value of the isoline at 200 cm2 s−2). In addition, the EKE time series reveal intense peaks compared to the rest of the basin. The Ierapetra eddy itself is not a permanent feature (Ioannou et al., 2017), but rather a seasonal anticyclonic structure with peak intensity in late summer (Fig. 3d). We notice a marked decrease in peak intensity, with EKE maxima reaching ∼1500 cm2 s−2 before 2007 but only ∼500 cm2 s−2 after 2012. In this region, all products capture similar trends, likely because the spatial coverage of the two-sat product is already good near a crossover point of the reference altimeter tracks, which enhances the accuracy of the gridded fields and reduces interpolation errors (Pascual et al., 2007). Additionally, the lower short-term variability in this region (compared to the Alboran Sea) means that the temporal resolution of the two-sat product is sufficient to capture the SLA signal accurately, thereby narrowing the difference with the all-sat products.
For robustness, similar analysis were performed in more dynamically complex regions, such as the Ionian Sea and the eastern Algerian basin. The corresponding EKE time series and trends are provided in the Supplement (Fig. S1), where larger short-term variability makes the interpretation of long-term trends more challenging.
Part of the differences observed between EKE trends computed with all-sat and two-sat altimetric products over the Mediterranean Sea could be explained by the increasing number of merged altimeters in the all-sat products, which may amplify EKE signals over time. To further explore this hypothesis, we examined the temporal evolution of EKE differences between products in relation to the number of satellites incorporated in all-sat. The evolution of the difference in the area-weighted mean EKE over the Mediterranean Sea between all-sat-glo and two-sat-glo exhibits a marked increase over time (Fig. 4a). This increase is strongly correlated with the temporal evolution of the number of altimetry missions merged into the all-sat-glo product, with a Pearson correlation coefficient of 0.85. As more altimeters are included into the all-sat product, spatial and temporal sampling improve, which enhance the detection of mesoscale signals (Ballarotta et al., 2019). This improved observational capability introduces an artificial positive trend of EKE. This strong correlation suggests that a significant portion of the observed trend in all-sat products seems to arise from the increasing number of satellites, rather than from changes in oceanic variability. Note that once more than five altimeters are operational, the rate of increase in the EKE difference slows down. To isolate this artificial trend, we performed a second degree polynomial regression between the signal difference and the number of satellites. By subtracting this fitted signal from the original all-sat-glo time series, we obtained a version of the product without the artificial trend, shown in green in Fig. 4b. This new signal, denoted as all-sat-glo-corrected, represents the all-sat-glo EKE with the artificial satellite-driven trend removed. The resulting trend for all-sat-glo-corrected is 0.12 cm2 s−2 yr−1, and statistically significant, which is slightly higher than the trend of two-sat-glo of 0.06 cm2 s−2 yr−1.

Figure 5Spatial correlation map between all-sat-glo and two-sat-glo EKE differences and the number of altimetry missions. Black dots indicate non-significant correlations. A one-month low-pass filter was applied to the time series at each grid point.
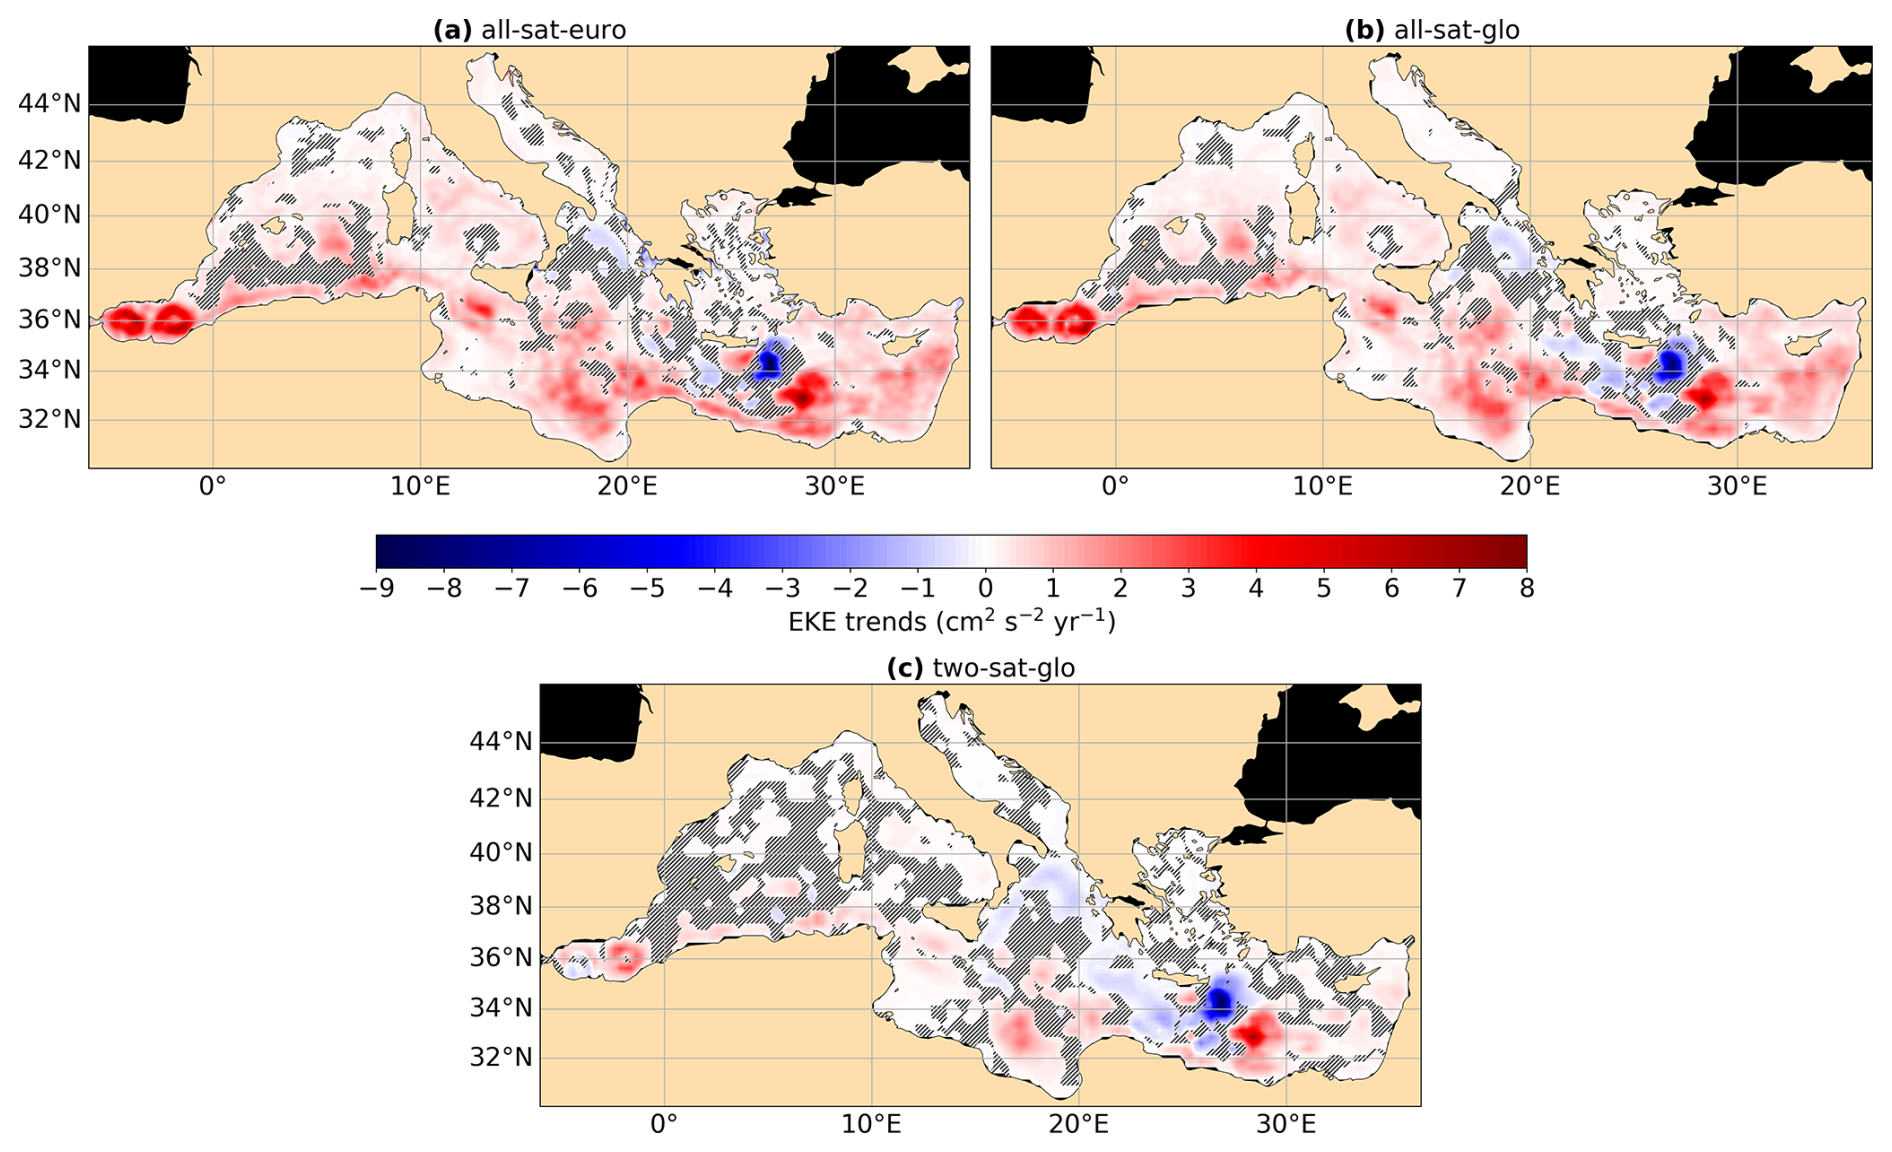
Figure 6EKE trends in the Mediterranean Sea for (a) all-sat-euro, (b) all-sat-glo and (c) two-sat-glo. Gray-hatched areas are statistically non-significant trends.
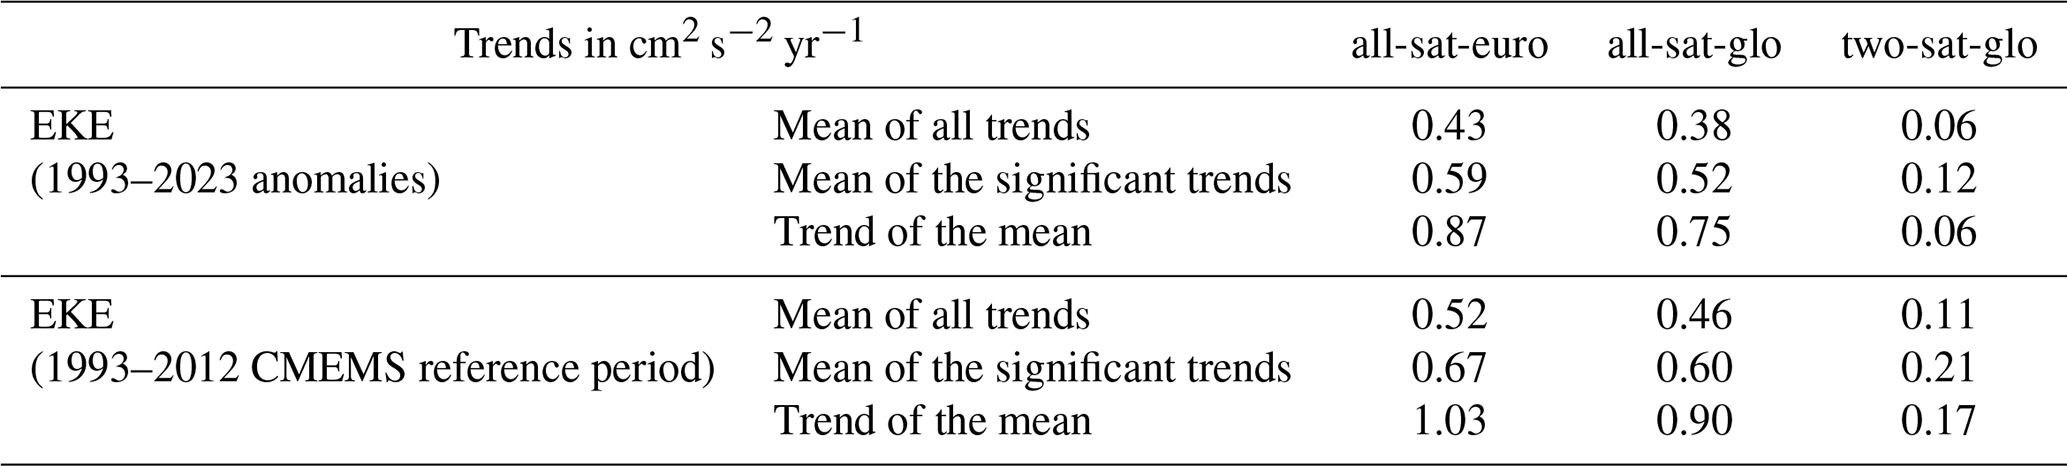
Table 1Different trends depending on the data set and the method. EKE in the first raw: the anomalies were computed using 1993–2023 as the reference period. EKE in the second raw: the EKE was computed using raw geostrophic velocity anomalies from the CMEMS data sets (1993–2012 reference period for the SLA).
To identify the regions that are more likely to be affected by the impact of an increasing number of satellites, we computed the Pearson correlation coefficient between the all-sat-glo and two-sat-glo differences and the number of altimetry missions at each grid point (Fig. 5). High correlations are especially pronounced in low-energy areas (Fig. 1) such as the Adriatic Sea, Tyrrhenian Sea, eastern Levantine basin, and along the Libyan coast. These areas coincide with zones where all-sat-glo trends are statistically significant while two-sat-glo trends are not (Fig. 6). This spatial coherence highlights that, in these low-energy regions, the trends observed in the all-sat products are most likely driven by the increasing number of merged satellite altimeters. In such regions, the signal-to-noise ratio is lower, making it more sensitive to observational changes. Moreover, the Alboran Sea, although a high-energy area, also presents a high correlation. High correlation values are found mainly in the western Alboran gyre, while the eastern gyre exhibits lower correlations. This contrast is likely linked to the orientation of the two-satellite tracks relative to the surface currents. In the eastern gyre, one of the two-sat tracks crosses close to the gyre center, providing better sampling of the geostrophic velocities. In the western gyre, however, the tracks mostly sample the edges of the gyre, leading to limited representation of its surface geostrophic velocities. This uneven sampling is further exacerbated by the highly dynamic nature of the western Alboran gyre, located at the entry point of the Atlantic Jet (Renault et al., 2012), where the circulation evolves rapidly and is not fully captured by the two-sat configuration. Consequently, the additional spatial and temporal coverage provided by multiple satellites substantially improves the reconstruction of the dynamics in this region, thereby increasing the observed correlation.
These spatial correlations between EKE differences and satellite coverage offer insight into where artificial amplification of EKE trends is most likely to occur. To place these findings in a broader spatial context, we now examine the full two-dimensional distribution of EKE trends across the Mediterranean Sea. These maps (Fig. 6) reveal that most of the Mediterranean Sea exhibits positive EKE trends along the main southern surface currents, especially pronounced in regions such as the Alboran Sea, along the north African coast, and in the vicinity of the Mersa–Matruh area (southeast of the Ierapetra eddy). In contrast, the Ierapetra eddy is the only region showing strong statistically significant negative EKE trends. The northern Ionian Sea also shows negative trends, whereas the central Ionian displays positive trends, a pattern that may be linked to shifts in the basin's circulation between anticyclonic and cyclonic states (Gačić et al., 2010; Bessières et al., 2013; Kalimeris and Kassis, 2020). All products present a similar pattern with stronger trends for all-sat products. What differs substantially is the spatial coverage of statistically significant trends between the all-sat and two-sat products (Fig. 6). Although 72.40 % and 71.27 % of the Mediterranean have significant trends for all-sat-euro and all-sat-glo, respectively, only 48.70 % is significant for two-sat-glo.
To understand how these regional differences influence basin-scale assessments of EKE variability, we compare trends as the spatial average of local trends with trends derived from the area-weighted mean EKE time series (Table 1). “Mean of all trends” corresponds to the spatial average of all grid-point trends. “Trend of the mean” represents the linear trend computed from the area-weighted EKE time series averaged over the whole Mediterranean basin, the one shown in Fig. 3. This comparison highlights the influence of high-energy regions on basin-wide trends. In all-sat products, the trend of the area-weighted mean EKE time series is higher than the mean of the trends because high-energy regions, though spatially limited, dominate the average time series due to their strong EKE values and pronounced trends. In contrast, this behavior is not observed for two-sat because of weaker trends in energetic regions. These energetic areas are better resolved in all-sat, leading to greater influence on the overall trend. We also distinguish these trends in two categories with different reference periods to compute the anomalies: the entire period (1993–2023) that are the results presented in this manuscript (first raw in Table 1) and 1993–2012 which is the reference period used in the CMEMS products (second raw in Table 1). We systematically observe higher trends for the shorter reference period, suggesting an increase in kinetic energy in recent years and highlighting the need to compute geostrophic anomalies with respect to the full time period when computing eddy kinetic energy.
3.3 Eddy kinetic energy trends in high-energy regions
To evaluate the fidelity of the gridded products in capturing mesoscale variability, we compared the L3 and L4 data sets in two high-energy regions of the Mediterranean Sea (Fig. 7), the Alboran Sea and the Ierapetra area, assessing how well the gridded fields reproduce the observed variability.
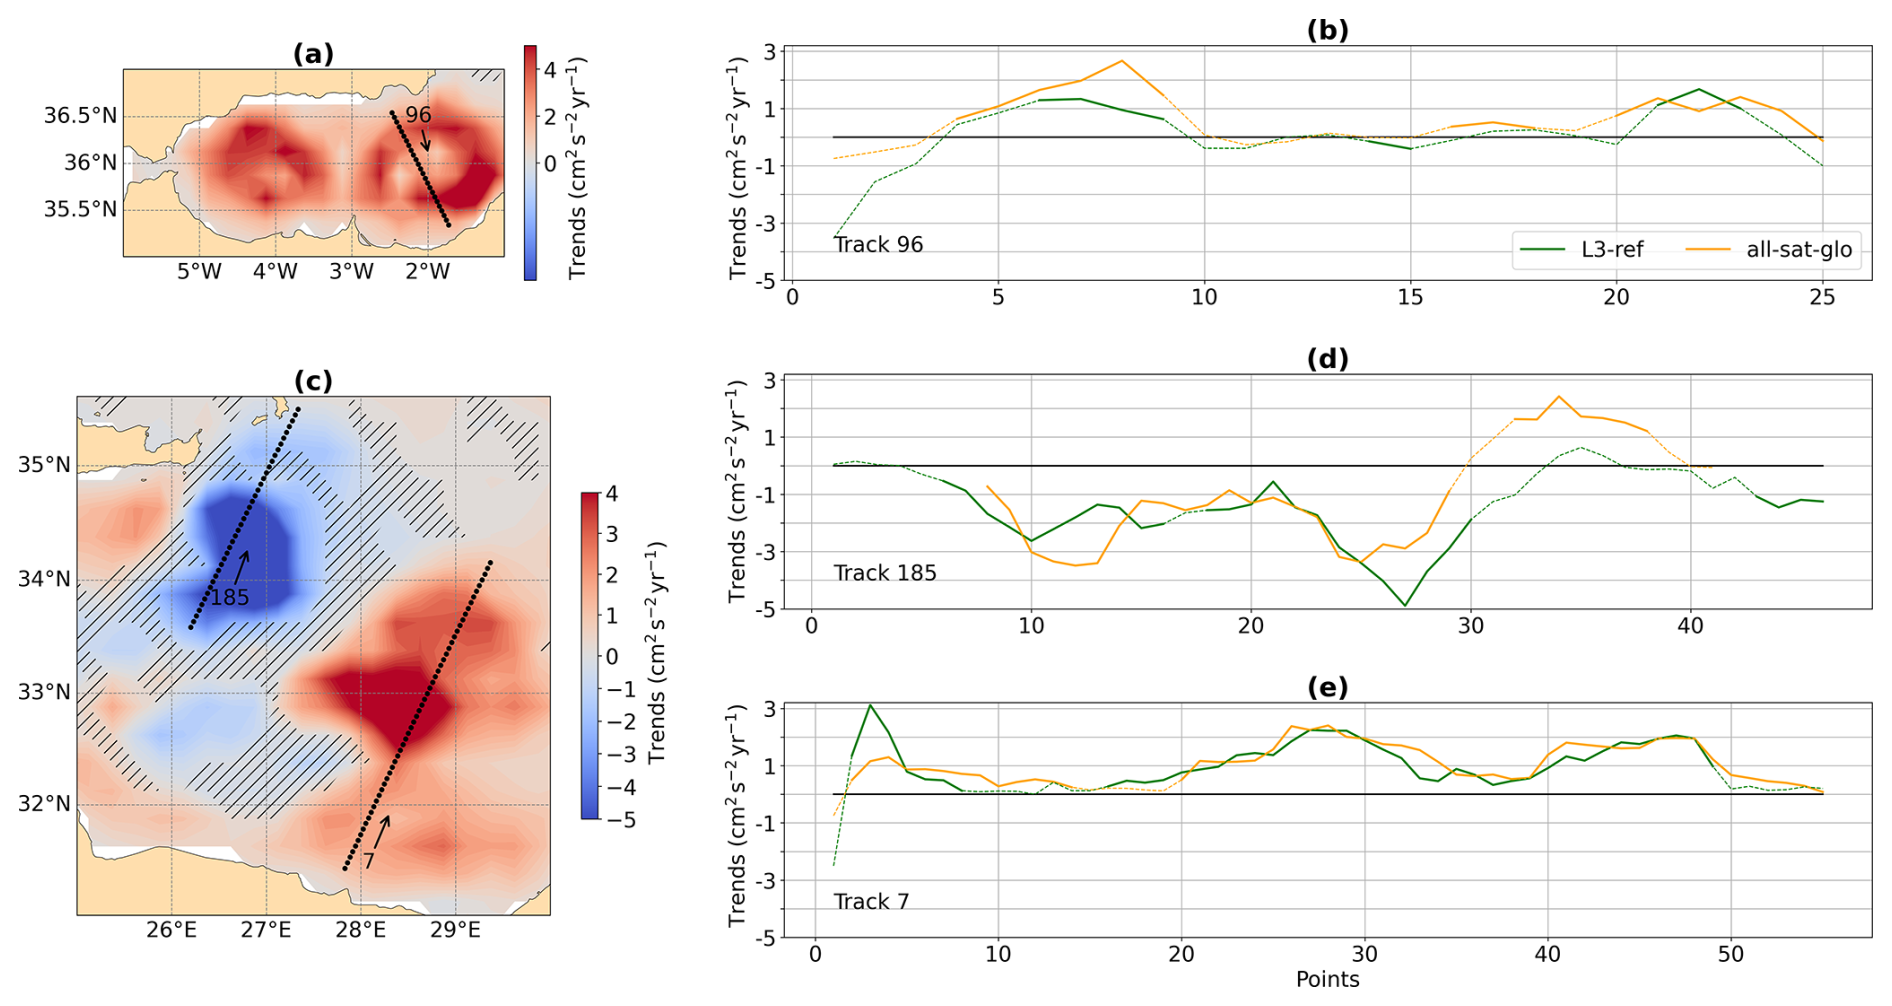
Figure 7(a) EKE trends in Alboran Sea (1993–2023), red box in Fig. 1. Background colors represent the gridded EKE trends from all-sat-glo. Gray-hatched areas highlight regions where trends are not statistically significant. The overlaid dots depict reference altimeters tracks with arrows indicating the direction of the satellite tracks and the number indicating their name. (b) Along-track EKE⟂ trends in Alboran Sea for track 96. Dotted lines correspond to non-significant trends while solid lines to the significant trends. Green corresponds to L3-ref trends and yellow to all-sat-glo ones. (c) Same as in (a) but for the Ierapetra region (Ierapetra eddy and Mersa–Matruh), blue box in Fig. 1. (d, e) Same as in (b) but for the Ierapetra region, respectively track 185 and track 7.
In addition to exhibiting high EKE values, the Alboran Sea region displays strong, positive, and statistically significant trends in EKE over the studied period (Fig. 7a and b). Notably, one of the reference satellite altimetry mission tracks nearly crosses the center of the eastern Alboran gyre (track 96; Fig. 7a). In this configuration, the geostrophic velocity component along the track is close to zero, while the cross-track component dominates the total geostrophic velocity. Therefore, the cross-track EKE along this track (EKE⟂) is expected to be very close to the total EKE, and thus enhances the reliability of the observed trend. In fact, we note the similarity of the trends of EKE⟂ between the L3-ref and all-sat-glo products for this track (Fig. 7b). This result indicates that the processing used to produce gridded L4 products does not introduce significant errors in EKE estimates along-tracks, supporting the suitability of L4 data for studying mesoscale variability in regions with dense track coverage. A closer examination reveals that the strongest positive and significant trends are located at the edges of the gyre rather than at its core (Fig. 7a and b), where geostrophic velocity variability is typically greater (Pujol and Larnicol, 2005; Barceló-Llull et al., 2017), leading here to enhanced positive EKE⟂ trends.
In contrast, the Ierapetra eddy area, crossed by track 185, shows a negative trend in EKE (Fig. 7c and d). As observed in the Alboran region, the EKE⟂ trends are consistent between the L3 and L4 products. Southeast of the Ierapetra eddy lies the Mersa–Matruh area, characterized by episodic rather than persistent eddy activity (Pujol and Larnicol, 2005; Barboni et al., 2021) and reveals an increase in mesoscale activity (track 7, Fig. 7c and e). The agreement in EKE⟂ trends across products further confirms the robustness of the results.
3.4 Comparison of eddy characteristics
EKE captures the overall intensity of oceanic mesoscale variability, integrating contributions from a variety of dynamical processes, including frontal instabilities, current meandering, and coherent mesoscale eddies. Among these, ocean coherent eddies are of particularly interest as they are long-lived, rotating water masses that trap and transport heat, salt, and nutrients across vast distances (Barceló-Llull et al., 2017; Barboni et al., 2023; Barabinot et al., 2024).
In this section, we use the META Atlas to analyze the statistics of these mesoscale eddies derived from the all-sat-glo and two-sat-glo satellite products, distinguishing cyclonic from anticyclonic eddies, including their number, size, spatial extent, and rotational speed (Fig. 8). A representative snapshot of detected eddies from each dataset on 4 January 2020 illustrates clear differences with the all-sat-glo product capturing a larger number of eddies and finer-scale structures compared to two-sat-glo (Fig. 8a).
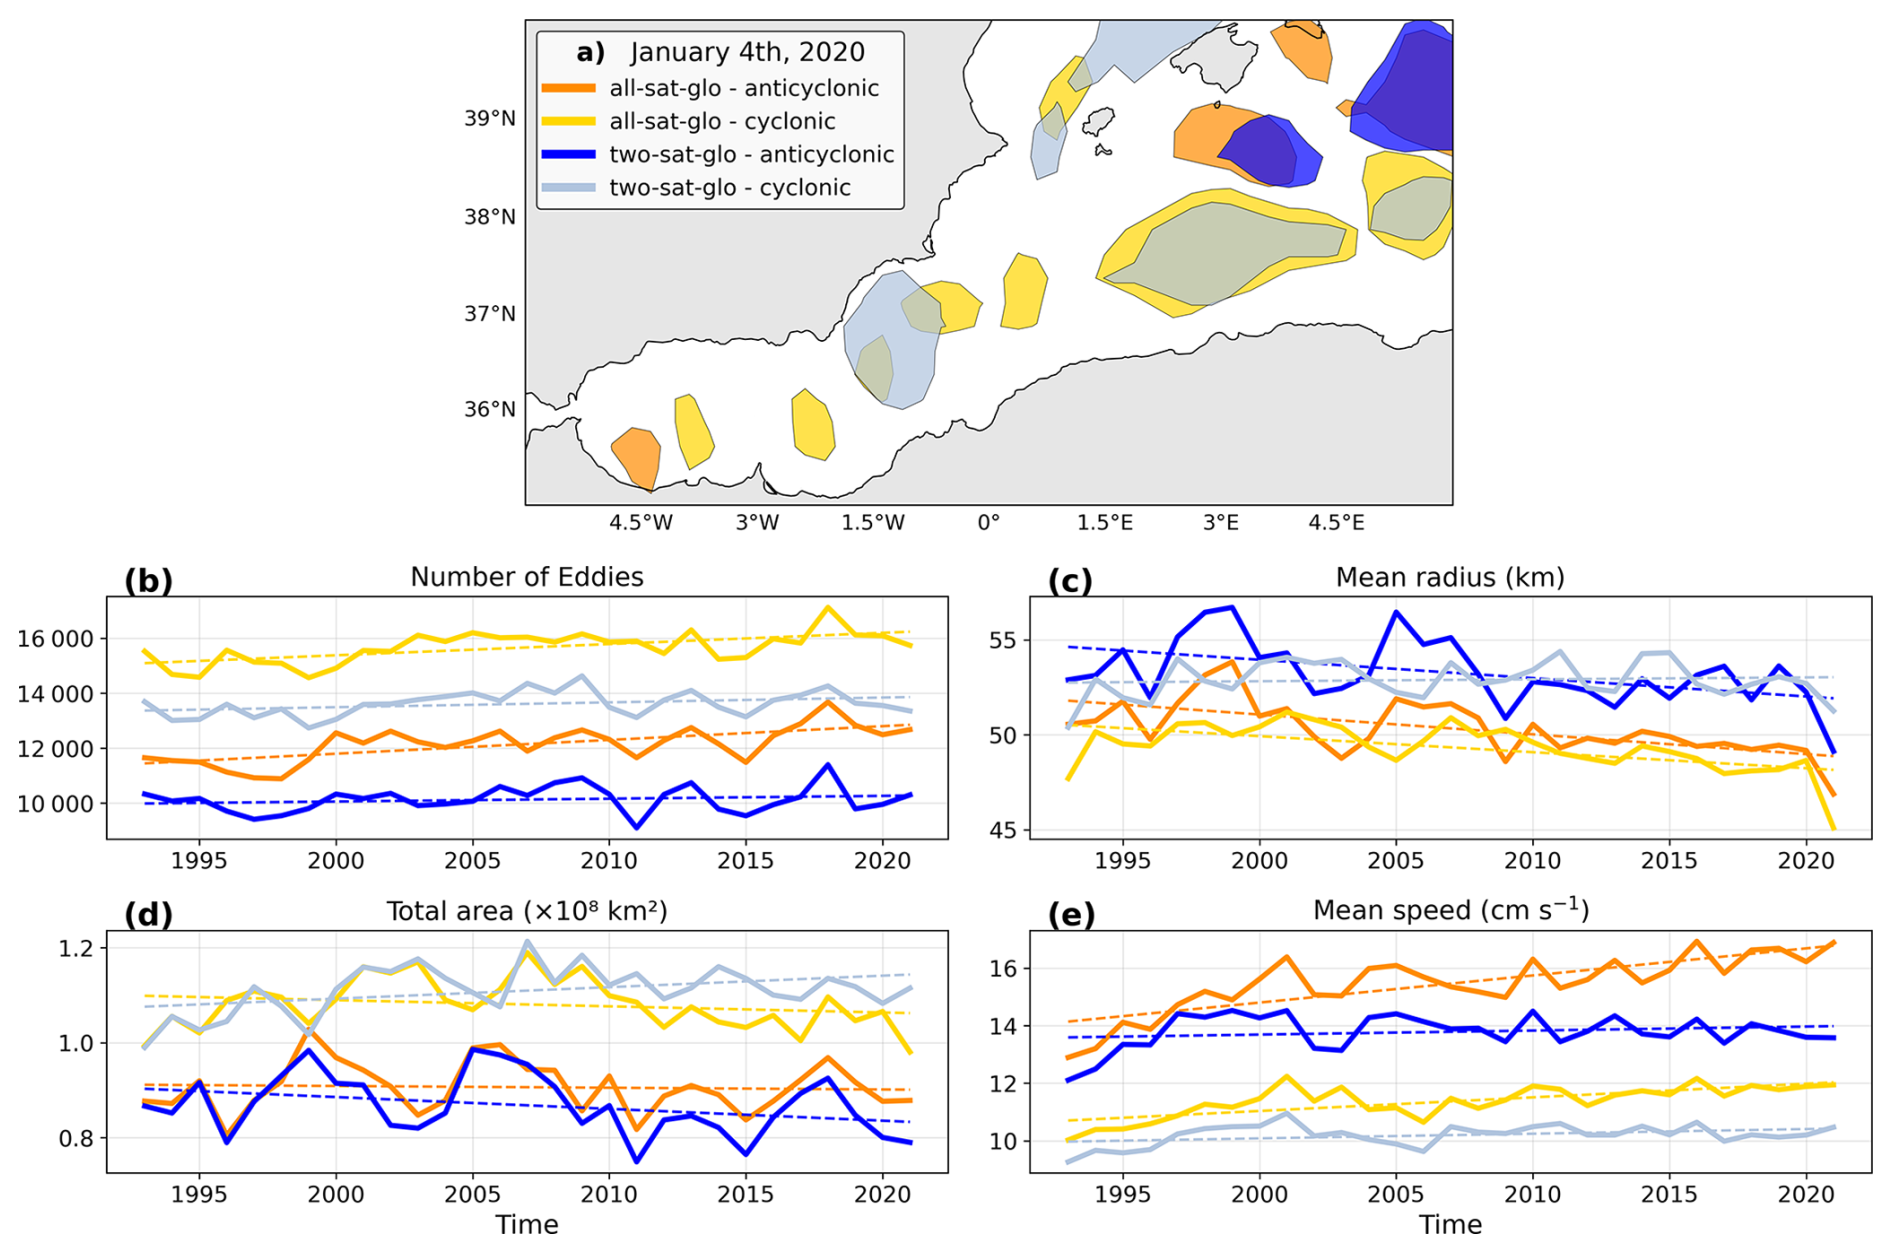
Figure 8(a) Eddies detected on 4 January 2020 using all-sat-glo (blue) and two-sat-glo (yellow). (b) Annual number of detected eddies. (c) Annual mean eddy radius. (d) Total annual eddy-covered area. (e) Annual mean eddy speed. Dark-blue and dark-yellow are for anticyclones and light blue and light yellow for cyclones.
Over the altimetric era, the total number of eddies detected per year shows a stronger increasing trend in all-sat-glo (27 812 per year on average) than in two-sat-glo (23 744 per year). Figure 8b further differentiates between anticyclonic and cyclonic eddies. For both products, a higher number of cyclones than anticyclones is detected with 57 % of the eddies being cyclonic, in agreement with Pegliasco et al. (2021). In parallel, the decreasing trend in the eddy radius size in the all-sat-glo product for both cyclonic and anticyclonic structures (Fig. 8c) reflects its improved ability to detect smaller-scale features (Amores et al., 2018). In contrast, in the two-sat-glo product only anticyclones show a decrease in radius, while cyclones do not display any detectable trend (Fig. 8c).
Despite these negative trends for the mean radius, when eddies are not separated by polarity, the total eddy area remains approximately constant and similar between the two products. However, separating cyclones from anticyclones reveals opposite tendencies in the two-sat-glo product (Fig. 8d): the total area covered by anticyclones decreases, while the area associated with cyclones increases. No marked polarity-dependent trends are observed in the all-sat product.
Finally, the average eddy rotational velocity (Fig. 8e), highly relevant to local biogeochemical variability, shows significant increasing trends in the all-sat-glo data, with a stronger increase for anticyclones, while no such trend is evident in two-sat.
In general, these results indicate that the progressive increase in the number of altimetric satellites has enhanced the detection of mesoscale activity (Amores et al., 2019), leading to more numerous, smaller, and faster eddies in the all-sat-glo product, while the total eddy-covered area remains unchanged. These discrepancies also mirror the EKE results and further highlights the limitations of the two-satellite configuration in resolving the diversity of mesoscale processes in the Mediterranean Sea, consistent with earlier work by Pascual et al. (2007).
4.1 Regional variability and changes in EKE
The Alboran gyres and the Mersa–Matruh area confirm a general intensification of EKE in high-energy areas, consistent with patterns observed in global high-energy regions (Martínez-Moreno et al., 2021; Barceló-Llull et al., 2025). However, trends over the Mediterranean Sea are not spatially uniform and the Ierapetra area is a high-energy region showing negative EKE trends.
The literature describing Alboran gyres is abundant (Heburn and La Violette, 1990; Renault et al., 2012; Sánchez-Garrido et al., 2013; Juza et al., 2016; Sánchez-Garrido and Nadal, 2022). Although transient events have been observed (Viúdez et al., 1998; Vélez-Belchí et al., 2005; Peliz et al., 2013), they are mainly persistent gyres with strong seasonal variability (stronger in summer) and are one of the most important signals observed in the Mediterranean Sea. The strong positive trends highlighted at their edges (Figs. 6 and 7a) reflect their interannual modulation (Iudicone et al., 1998; Vargas-Yáñez et al., 2002; Pujol and Larnicol, 2005; Sánchez-Garrido and Nadal, 2022). As seen in Fig. 3b the variability in EKE increases during the altimetric record (standard deviation of 44.24 cm2 s−2 for the period 1993–2008 and 59.04 cm2 s−2 for the period 2013–2023 for the Alboran Sea). There is still a gap in understanding the drivers of this variability in the circulation of the Alboran Sea, which include variations in the flow through the Strait of Gibraltar, local winds, and background stratification (Peliz et al., 2013; Sánchez-Garrido and Nadal, 2022). For example, previous studies have indicated that the eastern gyre is less stable and may disappear or shift under specific conditions, such as during winter and spring when its kinetic energy decreases to nearly zero and it is replaced by the central cyclonic gyre under moderate Atlantic inflow, or through interactions with the western gyre (Vargas-Yáñez et al., 2002; Peliz et al., 2013). In terms of EKE, the most energetic scenario in the area is the eastward migration of the western Alboran gyre before its fusion with the eastern Alboran gyre (Peliz et al., 2013). Peliz et al. (2013) noted that these migration events were associated with instabilities of the Atlantic Jet, more precisely south shifts of the Atlantic Jet along the Moroccan coasts, which appear to be related to the establishment of easterlies (Bolado-Penagos et al., 2021).
In the Levantine basin, the Ierapetra eddy is the only clear seasonal signal (Larnicol et al., 2002; Menna et al., 2012), although it does not appear every year (Mkhinini et al., 2014; Ioannou et al., 2017). Studies have highlighted the role of the interaction of Etesian winds (persistent northerly summer winds over the Aegean Sea) with Crete's orography in its formation and intensification (Horton et al., 1997; Amitai et al., 2010; Ioannou et al., 2020). The Ierapetra eddy region is associated with a strong negative EKE trend (Fig. 6). Figure 3d shows a net decrease also in the intensity of the EKE peaks. The analysis of the formation of anticyclonic eddies in this area reveals smaller and shorter-lived eddies (Fig. S2). In fact, Gandham et al. (2025) have observed a decline in Etesian wind episodes across the eastern Mediterranean and we surmise that this decrease in wind episodes could damp the development of the Ierapetra eddy.
Concerning the Mersa–Matruh area, this region acts as an attractor (Menna et al., 2012; Barboni et al., 2021) of transient eddies without clear boundaries, but characterized by a relatively high EKE activity (Fig. 1 and Pujol and Larnicol, 2005). Ierapetra eddies tend to go west along the Libyo-Egyptian current (Sutyrin et al., 2009). Previous studies have suggested that some Ierapetra eddies may deviate south-eastward toward the Mersa–Matruh area (Ioannou et al., 2017), potentially contributing to the regional eddy activity. We investigated this behavior using the META atlas (see Supplement), which shows that such deviations are relatively isolated events. This indicates that the EKE trend dipole observed in the area (Fig. 7c) does not reflect a systematic shift of the same mesoscale structure.
In addition to the regional patterns discussed above, the Ionian Sea is known to exhibit pronounced decadal oscillations in its surface and intermediate circulation, commonly referred to as the BiOS (Bimodal Oscillating System; Gačić et al., 2010; Bessières et al., 2013). These recurrent transitions between cyclonic and anticyclonic circulation regimes can substantially modulate the intensity and position of the Mid-Mediterranean Jet (MMJ). During cyclonic phases, the MMJ tends to strengthen and shift southward, enhancing mesoscale activity along its path, whereas anticyclonic phases are associated with a weakening and northward shift of the jet (Bessières et al., 2013). Such regime shifts can therefore imprint decadal variability on EKE in the Ionian Sea. This is consistent with the spatially heterogeneous trend patterns apparent in Fig. 6. In all three products, the Ionian region displays strong spatial contrasts, with negative EKE trends south of the Peloponnese and west of Greece, while positive trends emerge in the central and southern Ionian. The gray-hatched regions, indicating non-significant trends, are also more prevalent in the central Ionian, reinforcing the idea that this area is subject to decadal variability rather than a monotonic long-term change (Fig. S1). Taken together, these patterns are compatible with a transition from anticyclonic to cyclonic circulation in the Ionian Sea. In particular, Gačić et al. (2010) reported a marked regime shift in 1997, when the circulation flipped from anticyclonic to cyclonic.
4.2 Influence of altimetry products and methods
A central finding of this study is the discrepancy in the magnitude of the EKE trend between altimetry products based on different satellite constellations (Fig. 3). In high-energy regions we showed that the intensification in the Alboran Sea and the decline in the Ierapetra area are supported by robust and statistically significant trends (Figs. 3 and 6). However, when extending the analysis to the entire Mediterranean basin, the trend obtained with two-sat-glo is statistically not significant (0.06±0.04 cm2 s−2 yr−1). While the all-sat products exhibit positive trends over the whole basin, the inconsistency between products and the limited significance of two-sat-glo trend make it difficult to confidently assert a basin-scale increase in EKE. Moreover, the EKE values derived from all-sat products show a strong correlation with the increasing number of merged satellite altimeters (Figs. 4 and 5). This increase in merged satellites improves spatial and temporal resolution (Ballarotta et al., 2019) with time, introducing an artificial trend, especially in low-energy areas.
Eddy characteristics shown in Fig. 8 have also highlighted this artificial trend: the number of detected eddies increases with time for all-sat-glo, whereas the total area they occupy remains approximately constant. This suggests that the enhanced temporal and spatial sampling of all-sat products, arising from the growing number of satellites, enables the detection of smaller eddies that were previously unresolved.
Moreover, the distinction between cyclonic and anticyclonic eddies reveals several polarity-dependent differences in the long-term evolution of eddy statistics (Fig. 8), pointing out intrinsic differences in their detectability and dynamical behavior. Overall, more cyclones are detected (57 % Fig. 8 and Pegliasco et al., 2021). This asymmetry is fully consistent with the known differences in the reliability of eddy detection in gridded altimetric products. Stegner et al. (2021) have shown that anticyclones in the Mediterranean are detected with high positional accuracy and moderate radius biases, while cyclones, particularly large ones, are substantially less reliable, with larger position errors, stronger overestimation of radius (only category without negative trend in Fig. 8c), and greater sensitivity to interpolation artifacts. These detection biases arise from fundamental dynamical differences: large anticyclones tend to be more coherent and longer-lived, whereas cyclones are more unstable and prone to splitting into smaller, fast-evolving sub-mesoscale structures that are poorly resolved by altimetric gridding. The two-sat product, which maintains a stable configuration over time, further supports this interpretation. While it shows no significant trends in eddy number or speed, separating polarities reveals a positive trend in cyclones total eddy area. This pattern is consistent with the “coarsening artifact” described in Stegner et al. (2021), where small structures are smoothed into larger, spurious cyclonic features during interpolation.
These polarity-dependent behaviors have direct implications for the interpretation of EKE trends in gridded altimetric products. The stronger increase in mean rotational speed for anticyclones than for cyclones in all-sat suggests that the positive EKE trends reported in multi-mission products are driven by anticyclonic intensification, as observed in the semi-permanent Alboran gyres.
As a result, long-term EKE trends in all-sat configurations should be interpreted with caution, as they may reflect improved sampling of anticyclones rather than energetic changes in the mesoscale field. Nonetheless, part of the differences in EKE trends can also be attributed to the two-sat product being derived from a two-satellite constellation and, as demonstrated by Pascual et al. (2007), a minimum of three concurrent altimeter missions are required to adequately monitor mesoscale variability in the Mediterranean Sea.
We have analyzed three decades of satellite altimetry data (1993–2023) to assess whether surface ocean dynamics in the Mediterranean Sea is intensifying over time, focusing on the temporal evolution of Eddy Kinetic Energy (EKE). We have computed EKE trends from three gridded altimetric products: a global product derived from a stable two-satellite constellation (two-sat) and two others (global and European) incorporating all available satellites (all-sat). The robustness of the trends computed from the gridded products has been tested by comparing them with original along-track measurements in high-energy areas. These high-energy areas revealed significant positive (Alboran Sea, Mersa–Matruh) and negative (Ierapetra area) EKE trends for all products. However, the increasing number of satellite altimeter missions merged into all-sat products influences the magnitude of EKE trends, as does the relative to tracks position of the structures studied. In fact, the correlation found between the all-sat-glo/two-sat-glo EKE difference and the evolution of the number of satellite altimetry missions merged in all-sat-glo suggests an artificial trend in all-sat products caused by this increasing number of missions incorporated. Moreover, in regions of low-energy, the trends are not significant in two-sat product but are significant in all-sat suggesting that, in these regions, trends are mainly artificial and due to the merging of new satellites in all-sat products. It is important when studying long-term ocean variability analysis to use data set built for climate applications such as the two-sat product. Finally, the study of eddy characteristics raises the difficulty of two-sat to capture the mesoscale in the Mediterranean Sea. Pascual et al. (2007) concluded that at least three altimeters are necessary to accurately monitor mesoscale activity in the Mediterranean Sea due to the smaller typical size of the structures. Building on this, we suggest that a three-sat product available since 2000 would be a valuable tool to further assess EKE variability in the Mediterranean Sea. As altimetric products evolve, differences between climate-oriented and multi-mission data sets require caution when interpreting long-term trends in EKE and mesoscale eddy parameters. While the Surface Water and Ocean Topography mission (SWOT, Morrow et al., 2019; Fu et al., 2024) will enhance mesoscale observations (Wang et al., 2025; Verger-Miralles et al., 2025), sustained altimetric continuity remains essential to understand the drivers and impacts of ocean energetics in the Mediterranean Sea and the global ocean.
The altimetric data products used in this study are publicly available on the EU Copernicus Marine Service Information website (CMEMS: https://marine.copernicus.eu/, last access: 23 July 2024, Le Traon et al., 2019). The gridded products were downloaded in July 2024, their version is “vDT2021”, and is described in their respective QUality Information Document (QUID) (Pujol et al., 2023). The vDT2021 all-sat-euro product is available with product ID: SEALEVEL_EUR_PHY_L4_MY_008_068, https://doi.org/10.48670/moi-00141 (CMEMS, 2024a). The vDT2021 all-sat-glo product is available with product ID: SEALEVEL_GLO_PHY_L4_MY_008_047, https://doi.org/10.48670/moi-00148 (CMEMS, 2024b). The vDT2021 two-sat-glo product is available with product ID: SEALEVEL_GLO_PHY_CLIMATE_L4_MY_008_057, https://doi.org/10.48670/moi-00145 (CMEMS, 2024c). Along-track data are also available via the CMEMS website with product ID: SEALEVEL_EUR_PHY_L3_MY_008_061 and https://doi.org/10.48670/moi-00139 (CMEMS, 2024d). The altimetric Mesoscale Eddy Trajectories Atlas (META3.2 DT), is produced by SSALTO/DUACS and distributed by AVISO+ (https://aviso.altimetry.fr, last access: 1 July 2025) with support from CNES, in collaboration with IMEDEA (https://doi.org/10.24400/527896/a01-2022.005.220209 (Mason et al., 2014; Pegliasco et al., 2022) for the META3.2 DT all-sat-glo version and https://doi.org/10.24400/527896/a01-2022.006.220209 (Mason et al., 2014; Pegliasco et al., 2022) for the META3.2 DT two-sat-glo version).
The supplement related to this article is available online at https://doi.org/10.5194/os-22-549-2026-supplement.
All of the authors conceptualized the study. PH performed the data analysis and wrote the first draft. All of the authors contributed to the preparation of the final draft.
The contact author has declared that none of the authors has any competing interests.
Publisher's note: Copernicus Publications remains neutral with regard to jurisdictional claims made in the text, published maps, institutional affiliations, or any other geographical representation in this paper. The authors bear the ultimate responsibility for providing appropriate place names. Views expressed in the text are those of the authors and do not necessarily reflect the views of the publisher.
The present research was carried out within the framework of the activities of the Spanish Government through the “María de Maeztu Centre of Excellence” accreditation to IMEDEA (CSIC-UIB) (CEX2021-001198). The authors thank the reviewers for their constructive feedbacks, which improved the paper. We are grateful to Erik van Sebille for discussions during a workshop in February 2019 that motivated the study of Eddy Kinetic Energy (EKE) variability and trends in the Mediterranean Sea.
ObsSea4Clim “Ocean observations and indicators for climate and assessments” is funded by the European Union, Horizon Europe Funding Programme for Research and Innovation under grant agreement no. 101136548. ObsSea4Clim contribution no. 25. Paul Hargous is funded by ObsSea4Clim. Vincent Combes acknowledges the support from the Spanish Ramón y Cajal Program (RYC2020-029306-I) through Grant AEI/UIB – 10.13039/501100011033. Bàrbara Barceló-Llull is funded by the Balearic Government Vicenç Mut program (grant no. PD/008/2022).
The article processing charges for this open-access publication were covered by the CSIC Open Access Publication Support Initiative through its Unit of Information Resources for Research (URICI).
This paper was edited by Anne Marie Treguier and reviewed by Pierre-Marie Poulain and two anonymous referees.
Abram, N., Gattuso, J.-P., Prakash, A., Cheng, L., Chidichimo, M., Crate, S., Enomoto, H., Garschagen, M., Gruber, N., Harper, S., Holland, E., Kudela, R., Rice, J., Steffen, K., and von Schuckmann, K.: Framing and Context of the Report, in: IPCC Special Report on the Ocean and Cryosphere in a Changing Climate, edited by: Pörtner, H.-O., Roberts, D. C., Masson-Delmotte, V., Zhai, P., Tignor, M., Poloczanska, E., Mintenbeck, K., Alegría, A., Nicolai, M., Okem, A., Petzold, J., Rama, B., and Weyer, N. M., Cambridge University Press, Cambridge, UK and New York, NY, USA, 73–129, https://doi.org/10.1017/9781009157964.003, 2019. a
Amitai, Y., Lehahn, Y., Lazar, A., and Heifetz, E.: Surface circulation of the eastern Mediterranean Levantine basin: Insights from analyzing 14 years of satellite altimetry data, J. Geophys. Res.-Oceans, 115, https://doi.org/10.1029/2010JC006147, 2010. a
Amores, A., Jordà, G., Arsouze, T., and Le Sommer, J.: Up to What Extent Can We Characterize Ocean Eddies Using Present-Day Gridded Altimetric Products?, J. Geophys. Res.-Oceans, 123, 7220–7236, https://doi.org/10.1029/2018JC014140, 2018. a
Amores, A., Jordà, G., and Monserrat, S.: Ocean Eddies in the Mediterranean Sea From Satellite Altimetry: Sensitivity to Satellite Track Location, Front. Mar. Sci., 6, https://doi.org/10.3389/fmars.2019.00703, 2019. a
Ballarotta, M., Ubelmann, C., Pujol, M.-I., Taburet, G., Fournier, F., Legeais, J.-F., Faugère, Y., Delepoulle, A., Chelton, D., Dibarboure, G., and Picot, N.: On the resolutions of ocean altimetry maps, Ocean Sci., 15, 1091–1109, https://doi.org/10.5194/os-15-1091-2019, 2019. a, b
Barabinot, Y., Speich, S., and Carton, X.: Defining Mesoscale Eddies Boundaries From In-Situ Data and a Theoretical Framework, J. Geophys. Res.-Oceans, 129, https://doi.org/10.1029/2023JC020422, 2024. a
Barboni, A., Lazar, A., Stegner, A., and Moschos, E.: Lagrangian eddy tracking reveals the Eratosthenes anticyclonic attractor in the eastern Levantine Basin, Ocean Sci., 17, 1231–1250, https://doi.org/10.5194/os-17-1231-2021, 2021. a, b
Barboni, A., Coadou-Chaventon, S., Stegner, A., Le Vu, B., and Dumas, F.: How subsurface and double-core anticyclones intensify the winter mixed-layer deepening in the Mediterranean Sea, Ocean Sci., 19, 229–250, https://doi.org/10.5194/os-19-229-2023, 2023. a
Barceló-Llull, B., Sangrà, P., Pallàs-Sanz, E., Barton, E. D., Estrada-Allis, S. N., Martínez-Marrero, A., Aguiar-González, B., Grisolía, D., Gordo, C., Ángel Rodríguez-Santana, Ángeles Marrero-Díaz, and Arístegui, J.: Anatomy of a subtropical intrathermocline eddy, Deep-Sea Res. Pt. I, 124, 126–139, https://doi.org/10.1016/j.dsr.2017.03.012, 2017. a, b
Barceló-Llull, B., Rosselló, P., Combes, V., Sánchez-Román, A., Pujol, M. I., and Pascual, A.: Kuroshio Extension and Gulf Stream dominate the Eddy Kinetic Energy intensification observed in the global ocean, Sci. Rep.-UK, 15, https://doi.org/10.1038/s41598-025-06149-9, 2025. a, b, c, d, e, f
Barral, Q.-B., Zakardjian, B., Dumas, F., Garreau, P., Testor, P., and Beuvier, J.: Characterization of fronts in the Western Mediterranean with a special focus on the North Balearic Front, Prog. Oceanogr., 197, https://doi.org/10.1016/j.pocean.2021.102636, 2021. a
Becker, K. W., Devresse, Q., Prieto-Mollar, X., Hinrichs, K.-U., and Engel, A.: Mixed-layer lipidomes suggest offshore transport of energy-rich and essential lipids by cyclonic eddies, Commun. Earth Environ., 6, https://doi.org/10.1038/s43247-025-02152-0, 2025. a
Bessières, L., Rio, M. H., Dufau, C., Boone, C., and Pujol, M. I.: Ocean state indicators from MyOcean altimeter products, Ocean Sci., 9, 545–560, https://doi.org/10.5194/os-9-545-2013, 2013. a, b, c
Bethoux, J., Gentili, B., Morin, P., Nicolas, E., Pierre, C., and Ruiz-Pino, D.: The Mediterranean Sea: a miniature ocean for climatic and environmental studies and a key for the climatic functioning of the North Atlantic, Prog. Oceanogr., 44, 131–146, https://doi.org/10.1016/S0079-6611(99)00023-3, 1999. a
Beuvier, J., Béranger, K., Lebeaupin Brossier, C., Somot, S., Sevault, F., Drillet, Y., Bourdallé-Badie, R., Ferry, N., and Lyard, F.: Spreading of the Western Mediterranean Deep Water after winter 2005: Time scales and deep cyclone transport, J. Geophys. Res.-Oceans, 117, https://doi.org/10.1029/2011JC007679, 2012. a
Bolado-Penagos, M., Sala, I., Gomiz-Pascual, J. J., Romero-Cózar, J., González-Fernández, D., Reyes-Pérez, J., Vázquez, A., and Bruno, M.: Revising the Effects of Local and Remote Atmospheric Forcing on the Atlantic Jet and Western Alboran Gyre Dynamics, J. Geophys. Res.-Oceans, 126, https://doi.org/10.1029/2020JC016173, 2021. a
Bryden, H. L., Candela, J., and Kinder, T. H.: Exchange through the Strait of Gibraltar, Prog. Oceanogr, 33, 201–248, https://doi.org/10.1016/0079-6611(94)90028-0, 1994. a
Chelton, D., Schlax, and Samelson, R.: Global observations of nonlinear mesoscale eddies, Prog. Oceanogr., 91, https://doi.org/10.1016/j.pocean.2011.01.002, 2011. a
CMEMS: European Seas Gridded L 4 Sea Surface Heights And Derived Variables Reprocessed 1993 Ongoing, EU Copernicus Marine Service Information (CMEMS), Marine Data Store (MDS) [data set], https://doi.org/10.48670/moi-00141, 2024a. a
CMEMS: Global Ocean Gridded L 4 Sea Surface Heights And Derived Variables Reprocessed 1993 Ongoing, EU Copernicus Marine Service Information (CMEMS), Marine Data Store (MDS) [data set], https://doi.org/10.48670/moi-00148, 2024b. a
CMEMS: Global Ocean Gridded L 4 Sea Surface Heights And Derived Variables Reprocessed Copernicus Climate Service, EU Copernicus Marine Service Information (CMEMS), Marine Data Store (MDS) [data set], https://doi.org/10.48670/moi-00145, 2024c. a
CMEMS: European Seas Along Track L 3 Sea Surface Heights Reprocessed 1993 Ongoing Tailored For Data Assimilation, EU Copernicus Marine Service Information (CMEMS), Marine Data Store (MDS) [data set], https://doi.org/10.48670/moi-00139, 2024d. a
Escudier, R., Clementi, E., Cipollone, A., Pistoia, J., Drudi, M., Grandi, A., Lyubartsev, V., Lecci, R., Aydogdu, A., Delrosso, D., Omar, M., Masina, S., Coppini, G., and Pinardi, N.: A High Resolution Reanalysis for the Mediterranean Sea, Front. Earth Sci., https://doi.org/10.3389/feart.2021.702285, 2021. a, b
Fu, L.-L., Pavelsky, T., Cretaux, J.-F., Morrow, R., Farrar, J. T., Vaze, P., Sengenes, P., Vinogradova-Shiffer, N., Sylvestre-Baron, A., Picot, N., and Dibarboure, G.: The Surface Water and Ocean Topography Mission: A Breakthrough in Radar Remote Sensing of the Ocean and Land Surface Water, Geophys. Res. Lett., 51, https://doi.org/10.1029/2023GL107652, 2024. a
Gačić, M., Borzelli, G. L. E., Civitarese, G., Cardin, V., and Yari, S.: Can internal processes sustain reversals of the ocean upper circulation? The Ionian Sea example, Geophys. Res. Lett., 37, https://doi.org/10.1029/2010GL043216, 2010. a, b, c
Gandham, H., Dasari, H. P., Luong, T. M., Attada, R., Hassan, W. U., Gopinathan, P. A., Saharwardi, M. S., and Hoteit, I.: Declining summer circulation over the Eastern Mediterranean and Middle East, Clim. Atmos. Sci., 8, https://doi.org/10.1038/s41612-025-01072-2, 2025. a
Gaube, P., J. McGillicuddy Jr., D., and Moulin, A. J.: Mesoscale Eddies Modulate Mixed Layer Depth Globally, Geophys. Res. Lett., 46, 1505–1512, https://doi.org/10.1029/2018GL080006, 2019. a
Heburn, G. W. and La Violette, P. E.: Variations in the structure of the anticyclonic gyres found in the Alboran Sea, J. Geophys. Res.-Oceans, 95, 1599–1613, https://doi.org/10.1029/JC095iC02p01599, 1990. a
Horton, C., Clifford, M., Schmitz, J., and Kantha, L. H.: A real-time oceanographic nowcast/forecast system for the Mediterranean Sea, J. Geophys. Res.-Oceans, 102, 25123–25156, https://doi.org/10.1029/97JC00533, 1997. a
Hu, S., Sprintall, J., Guan, C., McPhaden, M. J., Wang, F., Hu, D., and Cai, W.: Deep-reaching acceleration of global mean ocean circulation over the past two decades, Sci. Adv., 6, https://doi.org/10.1126/sciadv.aax7727, 2020. a
Ioannou, A., Stegner, A., Le Vu, B., Taupier-Letage, I., and Speich, S.: Dynamical Evolution of Intense Ierapetra Eddies on a 22 Year Long Period, J. Geophys. Res.-Oceans, 122, 9276–9298, https://doi.org/10.1002/2017JC013158, 2017. a, b, c, d, e
Ioannou, A., Stegner, A., Dubos, T., Le Vu, B., and Speich, S.: Generation and Intensification of Mesoscale Anticyclones by Orographic Wind Jets: The Case of Ierapetra Eddies Forced by the Etesians, J. Geophys. Res.-Oceans, 125, e2019JC015810, https://doi.org/10.1029/2019JC015810, 2020. a
Iudicone, D., Santoleri, R., Marullo, S., and Gerosa, P.: Sea level variability and surface eddy statistics in the Mediterranean Sea from TOPEX/POSEIDON data, J. Geophys. Res.-Oceans, 103, 2995–3011, https://doi.org/10.1029/97JC01577, 1998. a
James, G., Witten, D., Hastie, T., Tibshirani, R., and Taylor, J.: An Introduction to Statistical Learning, Springer, https://doi.org/10.1007/978-3-031-38747-0, 2023. a
Juza, M., Escudier, R., Pascual, A., Pujol, M.-I., Taburet, G., Troupin, C., Mourre, B., and Tintoré, J.: Impacts of reprocessed altimetry on the surface circulation and variability of the Western Alboran Gyre, Adv. Space Res., 58, 277–288, https://doi.org/10.1016/j.asr.2016.05.026, 2016. a
Kalimeris, A. and Kassis, D.: Sea surface circulation variability in the Ionian-Adriatic Seas, Prog. Oceanogr., 189, 102454, https://doi.org/10.1016/j.pocean.2020.102454, 2020. a
Kurkin, A., Kurkina, O., Rybin, A., and Talipova, T.: Comparative analysis of the first baroclinic Rossby radius in the Baltic, Black, Okhotsk, and Mediterranean seas, Russ. J. Earth. Sci., 20, https://doi.org/10.2205/2020ES000737, 2020. a
Larnicol, G., Ayoub, N., and Le Traon, P.: Major changes in Mediterranean Sea level variability from 7 years of TOPEX/Poseidon and ERS-1/2 data, J. Mar. Syst., 33-34, 63–89, https://doi.org/10.1016/S0924-7963(02)00053-2, 2002. a, b
Le Traon, P. Y., Reppucci, A., Alvarez Fanjul, E., Aouf, L., Behrens, A., Belmonte, M., Bentamy, A., Bertino, L., Brando, V. E., Kreiner, M. B., Benkiran, M., Carval, T., Ciliberti, S. A., Claustre, H., Clementi, E., Coppini, G., Cossarini, G., De Alfonso Alonso-Muñoyerro, M., Delamarche, A., Dibarboure, G., Dinessen, F., Drevillon, M., Drillet, Y., Faugère, Y., Fernández, V., Fleming, A., Garcia-Hermosa, M. I., Sotillo, M. G., Garric, G., Gasparin, F., Giordan, C., Gehlen, M., Grégoire, M. L., Guinehut, S., Hamon, M., Harris, C., Hernandez, F., Hinkler, J. B., Hoyer, J., Karvonen, J., Kay, S., King, R., Lavergne, T., Lemieux-Dudon, B., Lima, L., Mao, C., Martin, M. J., Masina, S., Melet, A., Buongiorno Nardelli, B., Nolan, G., Pascual, A., Pistoia, J., Palazov, A., Piolle, J. F., Pujol, M. I., Pequignet, A. C., Peneva, E., Pérez Gómez, B., Petit de la Villeon, L., Pinardi, N., Pisano, A., Pouliquen, S., Reid, R., Remy, E., Santoleri, R., Siddorn, J., She, J., Staneva, J., Stoffelen, A., Tonani, M., Vandenbulcke, L., von Schuckmann, K., Volpe, G., Wettre, C., and Zacharioudaki, A.: From Observation to Information and Users: The Copernicus Marine Service Perspective, Front. Mar. Sci., 6, https://doi.org/10.3389/fmars.2019.00234, 2019. a, b
Martínez-Moreno, J., Hogg, A. M., England, M. H., Constantinou, N. C., Kiss, A. E., and Morrison, A. K.: Global changes in oceanic mesoscale currents over the satellite altimetry record, Nat. Clim. Change, 11, 397–403, https://doi.org/10.1038/s41558-021-01006-9, 2021. a, b, c
Mason, E., Pascual, A., and McWilliams, J. C.: A New Sea Surface Height-Based Code for Oceanic Mesoscale Eddy Tracking, J. Atmos. Ocean Tech., 31, 1181–1188, https://doi.org/10.1175/JTECH-D-14-00019.1, 2014. a, b, c
Mason, E., Barceló-Llull, B., Sánchez-Román, A., Rodríguez-Tarry, D., Cutolo, E., Delepoulle, A., Ruiz, S., and Pascual, A.: Chapter 8 – Fronts, eddies and mesoscale circulation in the Mediterranean Sea, in: Oceanography of the Mediterranean Sea, edited by: Schroeder, K. and Chiggiato, J., Elsevier, 263–287, ISBN 978-0-12-823692-5, https://doi.org/10.1016/B978-0-12-823692-5.00003-0, 2023. a, b, c
Menna, M., Poulain, P.-M., Zodiatis, G., and Gertman, I.: On the surface circulation of the Levantine sub-basin derived from Lagrangian drifters and satellite altimetry data, Deep-Sea Res. Pt. I, 65, 46–58, https://doi.org/10.1016/j.dsr.2012.02.008, 2012. a, b
Millot, C. and Taupier-Letage, I.: Circulation in the Mediterranean Sea, Springer, Berlin, Heidelberg, 29–66, ISBN 978-3-540-31492-9, https://doi.org/10.1007/b107143, 2005. a
Mkhinini, N., Coimbra, A. L. S., Stegner, A., Arsouze, T., Taupier-Letage, I., and Béranger, K.: Long-lived mesoscale eddies in the eastern Mediterranean Sea: Analysis of 20 years of AVISO geostrophic velocities, J. Geophys. Res.-Oceans, 119, 8603–8626, https://doi.org/10.1002/2014JC010176, 2014. a
Morrow, R., Fu, L.-L., Ardhuin, F., Benkiran, M., Chapron, B., Cosme, E., d'Ovidio, F., Farrar, J. T., Gille, S. T., Lapeyre, G., Le Traon, P.-Y., Pascual, A., Ponte, A., Qiu, B., Rascle, N., Ubelmann, C., Wang, J., and Zaron, E. D.: Global Observations of Fine-Scale Ocean Surface Topography With the Surface Water and Ocean Topography (SWOT) Mission, Front. Mar. Sci., 6, https://doi.org/10.3389/fmars.2019.00232, 2019. a
Pascual, A., Pujol, M.-I., Larnicol, G., Le Traon, P.-Y., and Rio, M.-H.: Mesoscale mapping capabilities of multisatellite altimeter missions: First results with real data in the Mediterranean Sea, J. Mar. Syst., 65, 190–211, https://doi.org/10.1016/j.jmarsys.2004.12.004, 2007. a, b, c, d
Pegliasco, C., Chaigneau, A., Morrow, R., and Dumas, F.: Detection and tracking of mesoscale eddies in the Mediterranean Sea: A comparison between the Sea Level Anomaly and the Absolute Dynamic Topography fields, Adv. Space Res., 68, 401–419, https://doi.org/10.1016/j.asr.2020.03.039, 2021. a, b, c
Pegliasco, C., Delepoulle, A., Mason, E., Morrow, R., Faugère, Y., and Dibarboure, G.: META3.1exp: a new global mesoscale eddy trajectory atlas derived from altimetry, Earth Syst. Sci. Data, 14, 1087–1107, https://doi.org/10.5194/essd-14-1087-2022, 2022. a, b, c
Peliz, A., Boutov, D., and Teles-Machado, A.: The Alboran Sea mesoscale in a long term high resolution simulation: Statistical analysis, Ocean Model., 72, 32–52, https://doi.org/10.1016/j.ocemod.2013.07.002, 2013. a, b, c, d, e
Poulain, P.-M., Menna, M., and Mauri, E.: Surface Geostrophic Circulation of the Mediterranean Sea Derived from Drifter and Satellite Altimeter Data, J. Phys. Oceanogr., 42, 973–990, https://doi.org/10.1175/JPO-D-11-0159.1, 2012. a
Pujol, M.-I. and Larnicol, G.: Mediterranean sea eddy kinetic energy variability from 11 years of altimetric data, J. Mar. Syst., 58, 121–142, https://doi.org/10.1016/j.jmarsys.2005.07.005, 2005. a, b, c, d, e
Pujol, M.-I., Taburet, G., and team SL-TAC: Quality Information Document for Sea Level TAC DUACS products, https://documentation.marine.copernicus.eu/QUID/CMEMS-SL-QUID-008-032-068.pdf (last access: 23 July 2024), 2023. a
Renault, L., Oguz, T., Pascual, A., Vizoso, G., and Tintoré, J.: Surface circulation in the Alborán Sea (western Mediterranean) inferred from remotely sensed data, J. Geophys. Res.-Oceans, 117, https://doi.org/10.1029/2011JC007659, 2012. a, b, c, d, e
Renault, L., McWilliams, J. C., and Masson, S.: Satellite Observations of Imprint of Oceanic Current on Wind Stress by Air-Sea Coupling, Sci. Rep.-UK, 7, https://doi.org/10.1038/s41598-017-17939-1, 2017. a
Sánchez-Garrido, J. C. and Nadal, I.: The Alboran Sea circulation and its biological response: A review, Front. Mar. Sci., 9, https://doi.org/10.3389/fmars.2022.933390, 2022. a, b, c
Sánchez-Garrido, J. C., García Lafuente, J., Álvarez Fanjul, E., Sotillo, M. G., and de los Santos, F. J.: What does cause the collapse of the Western Alboran Gyre? Results of an operational ocean model, Prog. Oceanogr., 116, 142–153, https://doi.org/10.1016/j.pocean.2013.07.002, 2013. a
Sánchez-Román, A., Sannino, G., García-Lafuente, J., Carillo, A., and Criado-Aldeanueva, F.: Transport estimates at the western section of the Strait of Gibraltar: A combined experimental and numerical modeling study, J. Geophys. Res.-Oceans, 114, https://doi.org/10.1029/2008JC005023, 2009. a
Schroeder, K., Lafuente, J., Josey, S., Artale, V., Buongiorno Nardelli, B., Carrillo, A., Gacic, M., Gasparini, G., Herrmann, M., Lionello, P., Ludwig, W., Millot, C., Özsoy, E., Pisacane, G., Sánchez-Garrido, J., Sannino, G., Santoleri, R., Somot, S., Struglia, M., and Zodiatis, G.: Circulation Of The Mediterranean Sea And Its Variability, Elsevier, 187–256, ISBN 9780124160422, https://doi.org/10.1016/B978-0-12-416042-2.00003-3, 2012. a
Stan Development Team: Stan Reference Manual, stan Reference Manual, Version 2.36, https://mc-stan.org/docs/2_36/reference-manual-2_36.pdf (last access: 12 December 2024), 2021. a
Stegner, A., Le Vu, B., Dumas, F., Ghannami, M. A., Nicolle, A., Durand, C., and Faugere, Y.: Cyclone-Anticyclone Asymmetry of Eddy Detection on Gridded Altimetry Product in the Mediterranean Sea, J. Geophys. Res.-Oceans, 126, https://doi.org/10.1029/2021JC017475, 2021. a, b
Sutyrin, G., Stegner, A., Taupier-Letage, I., and Teinturier, S.: Amplification of a Surface-Intensified Eddy Drift along a Steep Shelf in the Eastern Mediterranean Sea, J. Phys. Oceanogr., 39, 1729–1741, https://doi.org/10.1175/2009JPO4106.1, 2009. a
Tsimplis, M. and Bryden, H.: Estimation of the transports through the Strait of Gibraltar, Deep-Sea Res. Pt. I, 47, 2219–2242, https://doi.org/10.1016/S0967-0637(00)00024-8, 2000. a
Vargas-Yáñez, M., Plaza, F., Lafuente, J., Sarhan, T., Vargas, J., and Vélez-Belchí, P.: About the seasonal variability of the Alboran Sea circulation, J. Mar. Syst., 35, 229–248, https://doi.org/10.1016/S0924-7963(02)00128-8, 2002. a, b
Vélez-Belchí, P., Vargas-Yáñez, M., and Tintoré, J.: Observation of a western Alborán gyre migration event, Prog. Oceanogr., 66, 190–210, https://doi.org/10.1016/j.pocean.2004.09.006, 2005. a
Verger-Miralles, E., Mourre, B., Gómez-Navarro, L., Barceló-Llull, B., Casas, B., Cutolo, E., Díaz-Barroso, L., d'Ovidio, F., Tarry, D. R., Zarokanellos, N. D., and Pascual, A.: SWOT Enhances Small-Scale Eddy Detection in the Mediterranean Sea, Geophys. Res. Lett., 52, https://doi.org/10.1029/2025GL116480, 2025. a
Viúdez, A., Pinot, J.-M., and Haney, R. L.: On the upper layer circulation in the Alboran Sea, J. Geophys. Res.-Oceans, 103, 21653–21666, https://doi.org/10.1029/98JC01082, 1998. a
Wang, Y., Chen, X., Han, G., Jin, P., and Yang, J.: From 1/4° to 1/8°: Influence of Spatial Resolution on Eddy Detection Using Altimeter Data, Remote Sens., 14, 149, https://doi.org/10.3390/rs14010149, 2022. a
Wang, Y., Zhang, S., and Jia, Y.: Enhanced resolution capability of SWOT sea surface height measurements and their application in monitoring ocean dynamics variability, Ocean Sci., 21, 931–944, https://doi.org/10.5194/os-21-931-2025, 2025. a
Wilkin, J. L. and Morrow, R. A.: Eddy kinetic energy and momentum flux in the Southern Ocean: Comparison of a global eddy-resolving model with altimeter, drifter, and current-meter data, J. Geophys. Res.-Oceans, 99, 7903–7916, https://doi.org/10.1029/93JC03505, 1994. a
Yue, S. and Wang, C.: The Mann-Kendall test modified by effective sample size to detect trend in serially correlated hydrological series, Water. Resour. Manage., 18, 201–218, https://doi.org/10.1023/B:WARM.0000043140.61082.60, 2004. a
Zodiatis, G., Brenner, S., Gertman, I., Ozer, T., Simoncelli, S., Ioannou, M., and Savva, S.: Twenty years of in-situ monitoring in the south-eastern Mediterranean Levantine basin: Basic elements of the thermohaline structure and of the mesoscale circulation during 1995–2015, Front. Mar. Sci., 9, https://doi.org/10.3389/fmars.2022.1074504, 2023. a