
the Creative Commons Attribution 4.0 License.
the Creative Commons Attribution 4.0 License.
 | 13 Nov 2026
Recent thermohaline shifts in the Adriatic Sea and their potential consequences

Ivica Vilibić
The Adriatic Sea has warmed and salinified rapidly over the past two decades, and the changes are not uniform with depth. We combine 33 664 quality-controlled shipboard and Argo temperature and salinity casts from 1950–2025 into two climatologies, test the individual casts for regime shifts, and use the Argo profiles from the Southern Adriatic Pit to quantify the vertical structure of the changes. Between the 1950–1999 and 2000–2025 climatologies the southern Adriatic salinified at every depth and season, by 0.11–0.53, and warmed by up to 1.6 °C everywhere except at the uppermost levels in summer and autumn, where the sampling differs between the two periods. Amplification relative to the rest of the Mediterranean is strongly depth-dependent: below 700 m the southern Adriatic warms at 6.2 times the median rate of the other Mediterranean sub-basins, whereas above 200 m its warming is not amplified. The occurrence of near-surface salinity maxima (“surface saline lakes”) rises abruptly after 2014, in both ship and float records, from a few per cent of warm-season casts to about 40 %; this regime shift is only provable if vertical resolution and platform are accounted for. The intermediate salinity maximum has lost its dominant band: the detected maxima no longer cluster in one depth interval. Where two maxima coexist they have moved apart and diverged in density, so they are not one migrating core. Over 2014–2024 the steric contribution in the Southern Adriatic Pit is negative, dominated by halosteric contraction, so that local sea level rise must be mass-driven. Salt fingering has intensified below the classical intermediate core, allowing salt transport towards deeper layers.
Three consequences follow, set out here as hypotheses. First, deep ventilation may persist under milder winters, because water that is already saline needs less cooling to sink, but each ventilation event may then deliver less oxygen, because the water that sinks is warmer. Second, exchange of oxygen, nutrients and carbon between the surface and intermediate layers may be either suppressed or enhanced beneath more frequent surface saline lakes, depending on whether stratification or double diffusion prevails. Third, Adriatic ecosystems, in which warming-linked mortality and species redistribution are already documented, face a basin changing faster at depth than at the surface. Testing these hypotheses requires sustained high-resolution observations.
- Article
(5217 KB) - Full-text XML
- BibTeX
- EndNote


Coastal and marginal seas respond to climate forcing faster than the open ocean, whether the forcing arrives from the atmosphere, from land, or across lateral boundaries (Holt et al., 2025; Richardson et al., 2025; Wagawa and Igeta, 2025). The Mediterranean Sea is the archetype, changing at rates above the global ocean mean (Schroeder et al., 2017; Juza et al., 2022), and within it the Adriatic Sea is a particularly sensitive sub-basin: semi-enclosed, 800 km long, 200 km wide and up to 1230 m deep, strongly influenced by riverine input, and subject to orographically shaped air–sea forcing.
Several Adriatic processes are directly relevant here. North Adriatic Dense Water forms on the shallow northern shelf and cascades along the bottom into the Jabuka and Southern Adriatic Pits, bringing oxygen to the deep layers (Zore-Armanda, 1963; Marini et al., 2006; Vilibić et al., 2023). Open-ocean convection in the Southern Adriatic Pit additionally supplies deep water to the Eastern Mediterranean (Gačić et al., 2002; Schlitzer et al., 1991). The inflow of saline Levantine and Cretan Intermediate Water (LIW/CIW) is modulated on decadal scales by the Adriatic–Ionian Bimodal Oscillating System (Gačić et al., 2010; Civitarese et al., 2023), shaping the thermohaline properties and the nutrient budget of the basin (Civitarese et al., 2010). The small internal Rossby radius of the Adriatic makes its dynamics fast and spatially fine-grained (Cushman-Roisin and Korotenko, 2007; Pranić et al., 2023). The Eastern Mediterranean Transient of the early 1990s is the precedent for an abrupt reorganisation of these processes. The Aegean then replaced the Adriatic as the dominant source of eastern Mediterranean deep water (Roether et al., 1996), and the Transient also altered Adriatic properties directly (Vilibić et al., 2012).
Since the early 2010s these processes appear to have moved outside their historical range. Salinity rose sharply after 2017 (Mihanović et al., 2021; Beg Paklar et al., 2020), the dense waters of 2017, 2018 and 2022 were produced by weak cooling of very saline water rather than by strong cooling (Terzić et al., 2025a; Amorim et al., 2024; Le Meur et al., 2025), and near-surface salinity maxima were documented for the first time (Mihanović et al., 2021; Terzić et al., 2025b). Whether these are genuinely abrupt departures, or the visible part of a gradual trend sampled by a rapidly improving observing system, has not been tested formally. That distinction is important because the observing system changed at almost exactly the time the signal appeared: Argo entered the Adriatic in 2010 and now dominates the deep observations (Tintoré et al., 2019).
Three developments make a quantitative reassessment timely. First, the Adriatic in situ record has been consolidated across archives, so historical shipborne casts and modern autonomous profiles can be processed through a single pipeline. Second, Argo now provides more than a decade of deep profiling in the Southern Adriatic Pit, enough to resolve the vertical structure of the change rather than only its surface expression. Third, that single pipeline can also be applied to every Mediterranean sub-basin, which turns the recurring claim that the Adriatic changes faster than the rest of the Mediterranean from a qualitative impression into a testable ratio of rates.
This research article is organised as follows. Section 2 describes the observational dataset and the methods. Section 3 addresses four questions. How large are the Adriatic changes, and are they distinguishable from sampling variability (Sect. 3.1–3.2)? Is the amplification relative to the rest of the Mediterranean general, or confined to particular depths (Sect. 3.3)? Did the vertical distribution of salinity in the intermediate layer change over time (Sect. 3.4)? Is the increase in near-surface salinity maxima (surface saline lakes) an abrupt shift, or an artefact of vertical resolution and platform (Sect. 3.5)? Section 3.6–3.7 quantify the steric and double-diffusive consequences. Section 4 discusses the implications as hypotheses and identifies the observations and model experiments that would test them.
The analyses are of three kinds, each with its own requirements on the data, and the methods are organised accordingly: comparisons of pooled casts (Sect. 2.1–2.4), detections on individual profiles (Sect. 2.5–2.7) and diagnostics on Argo profiles alone (Sect. 2.8–2.9). The climatological comparison (Sect. 2.1–2.3; Figs. 1 and 2) pools casts by region, period, season and depth so that two periods can be contrasted level by level, and needs an uncertainty estimate that accounts for the fact that casts from the same cruise are not independent. The rate comparison with the rest of the Mediterranean (Sect. 2.4) uses the same casts, averaged into monthly series, to fit trends. The two feature detections – surface saline lakes (Sect. 2.5–2.6) and the intermediate salinity maxima (Sect. 2.7) – work on individual profiles rather than on the climatologies, so their main requirement is vertical resolution: a feature a few metres thick cannot be found in a cast sampled every ten metres, and both detections are therefore checked against the resolution of the record. Figure 3 shows the two detection criteria on measured profiles. The steric and double-diffusive analyses (Sect. 2.8–2.9) need the thermodynamic coefficients resolved through the full water column and only use Argo profiles.
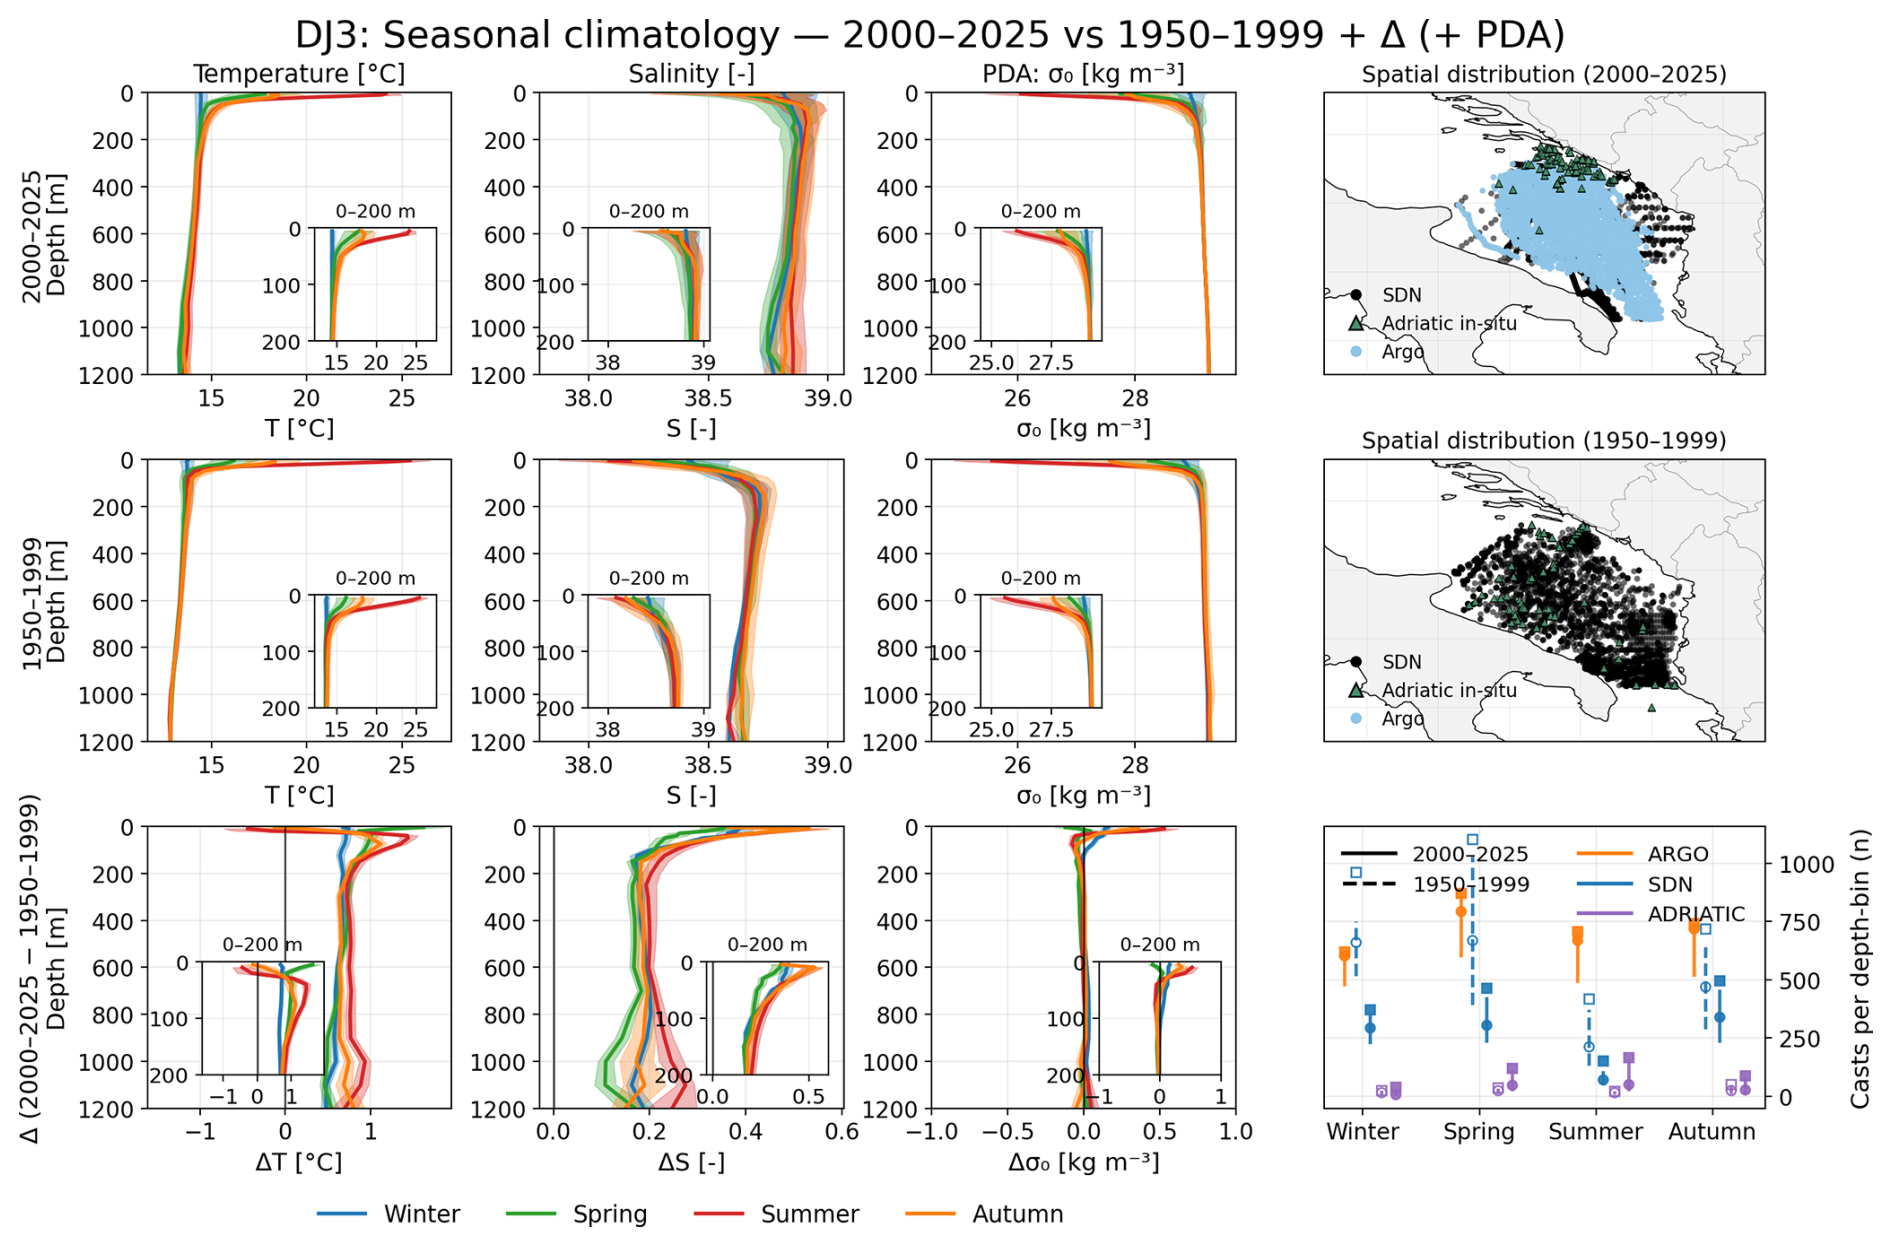
Figure 1Seasonal climatology of the southern Adriatic (DJ3). Rows: 2000–2025, 1950–1999 and their difference; columns: temperature, salinity, potential density anomaly and the sampling behind them. Colours denote seasons; insets expand the upper 200 m. Shading is ±1 standard deviation in the period rows and the 95 % confidence interval in the difference row (Sect. 2.3). The 5 m summer bin is omitted from the difference row (Sect. 3.1). Right column: cast positions by source for each period (top two rows) and casts per depth bin by source and season (bottom row; for SeaDataNet its CTD, bottle and bathythermograph casts): maxima over the depth bins as squares, medians as circles, interquartile ranges as vertical lines; solid for 2000–2025, dashed for 1950–1999.
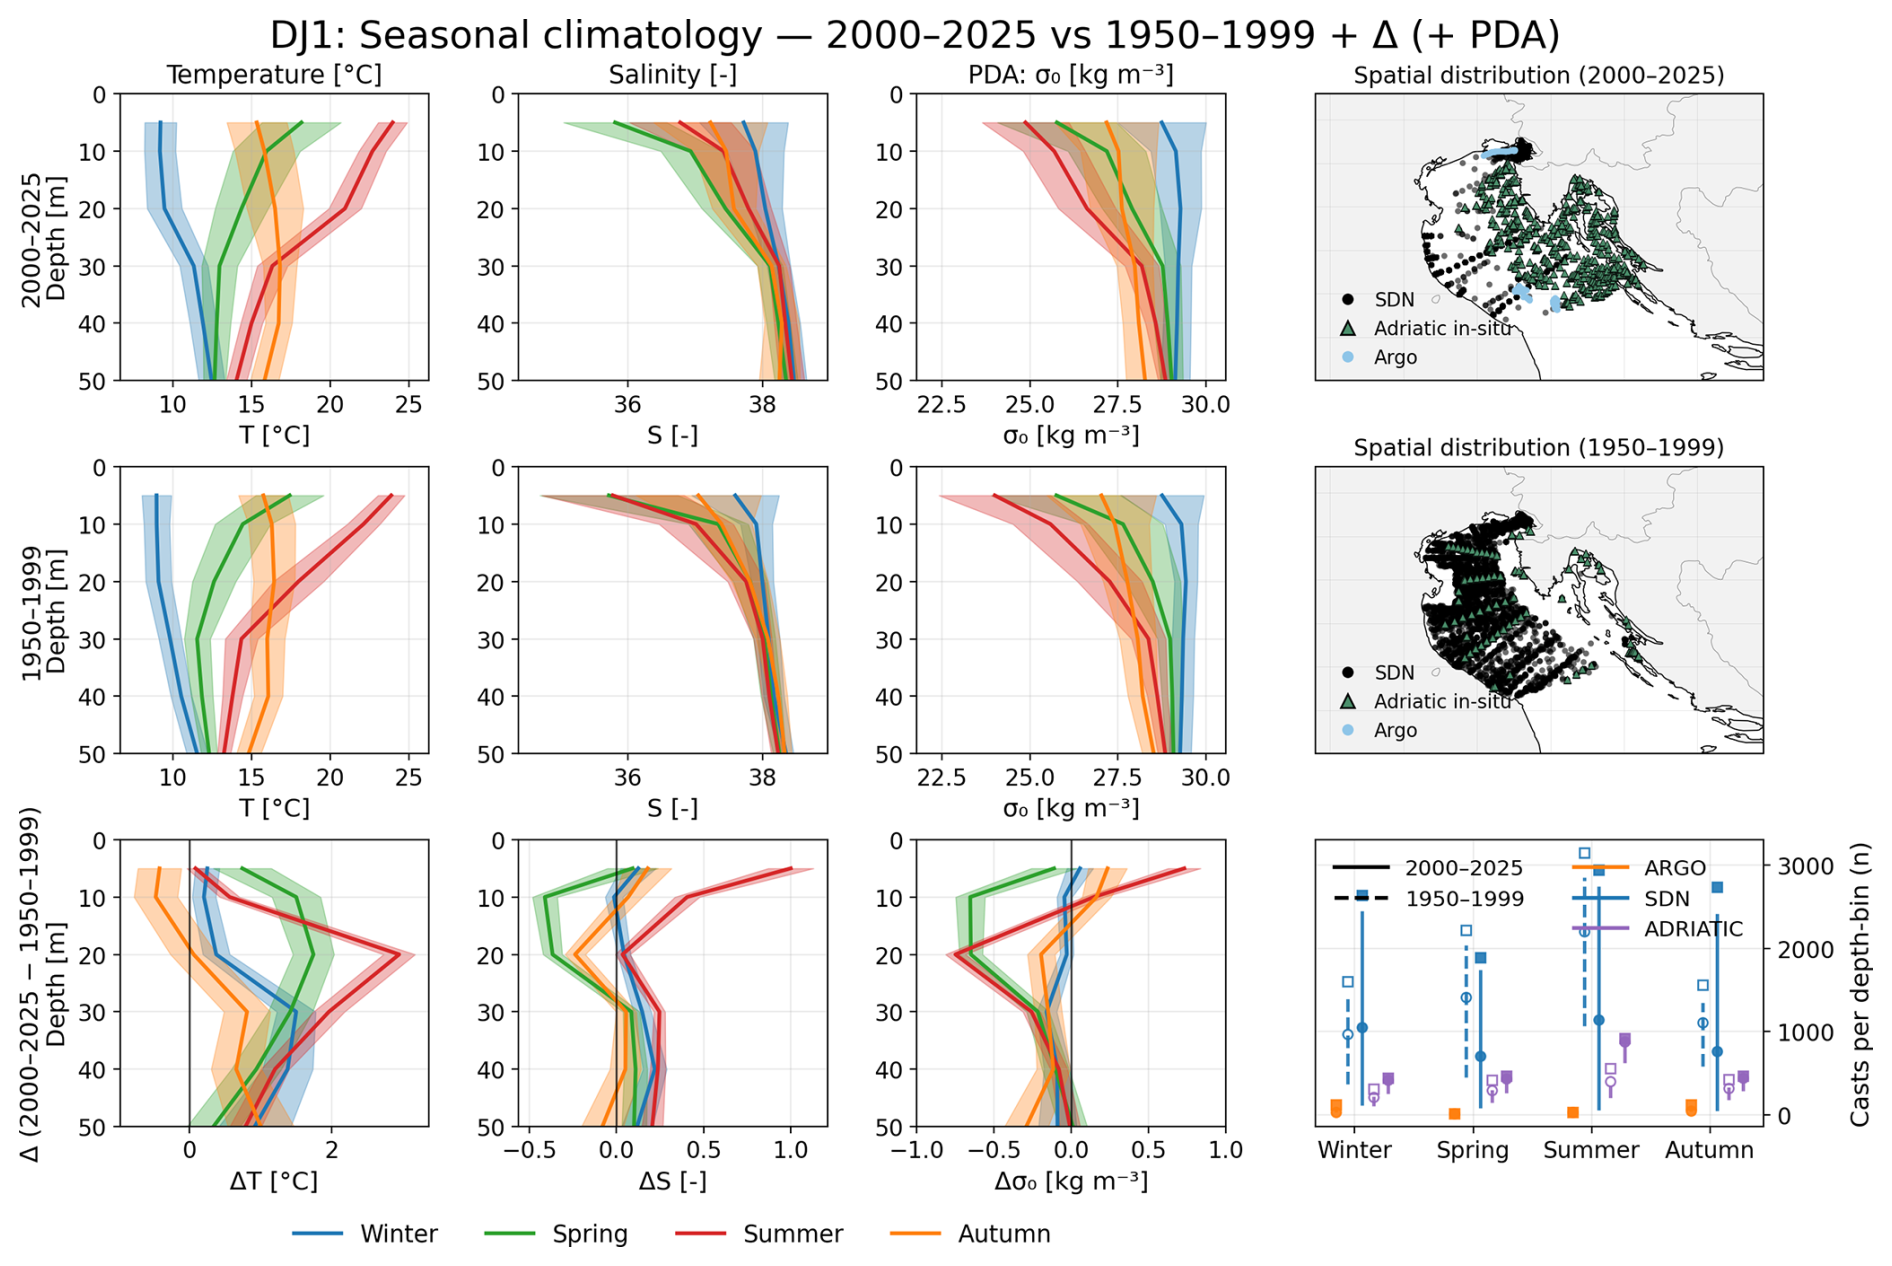
Figure 2As Fig. 1, for the northern Adriatic (DJ1), restricted to 0–50 m (Sect. 2.3).
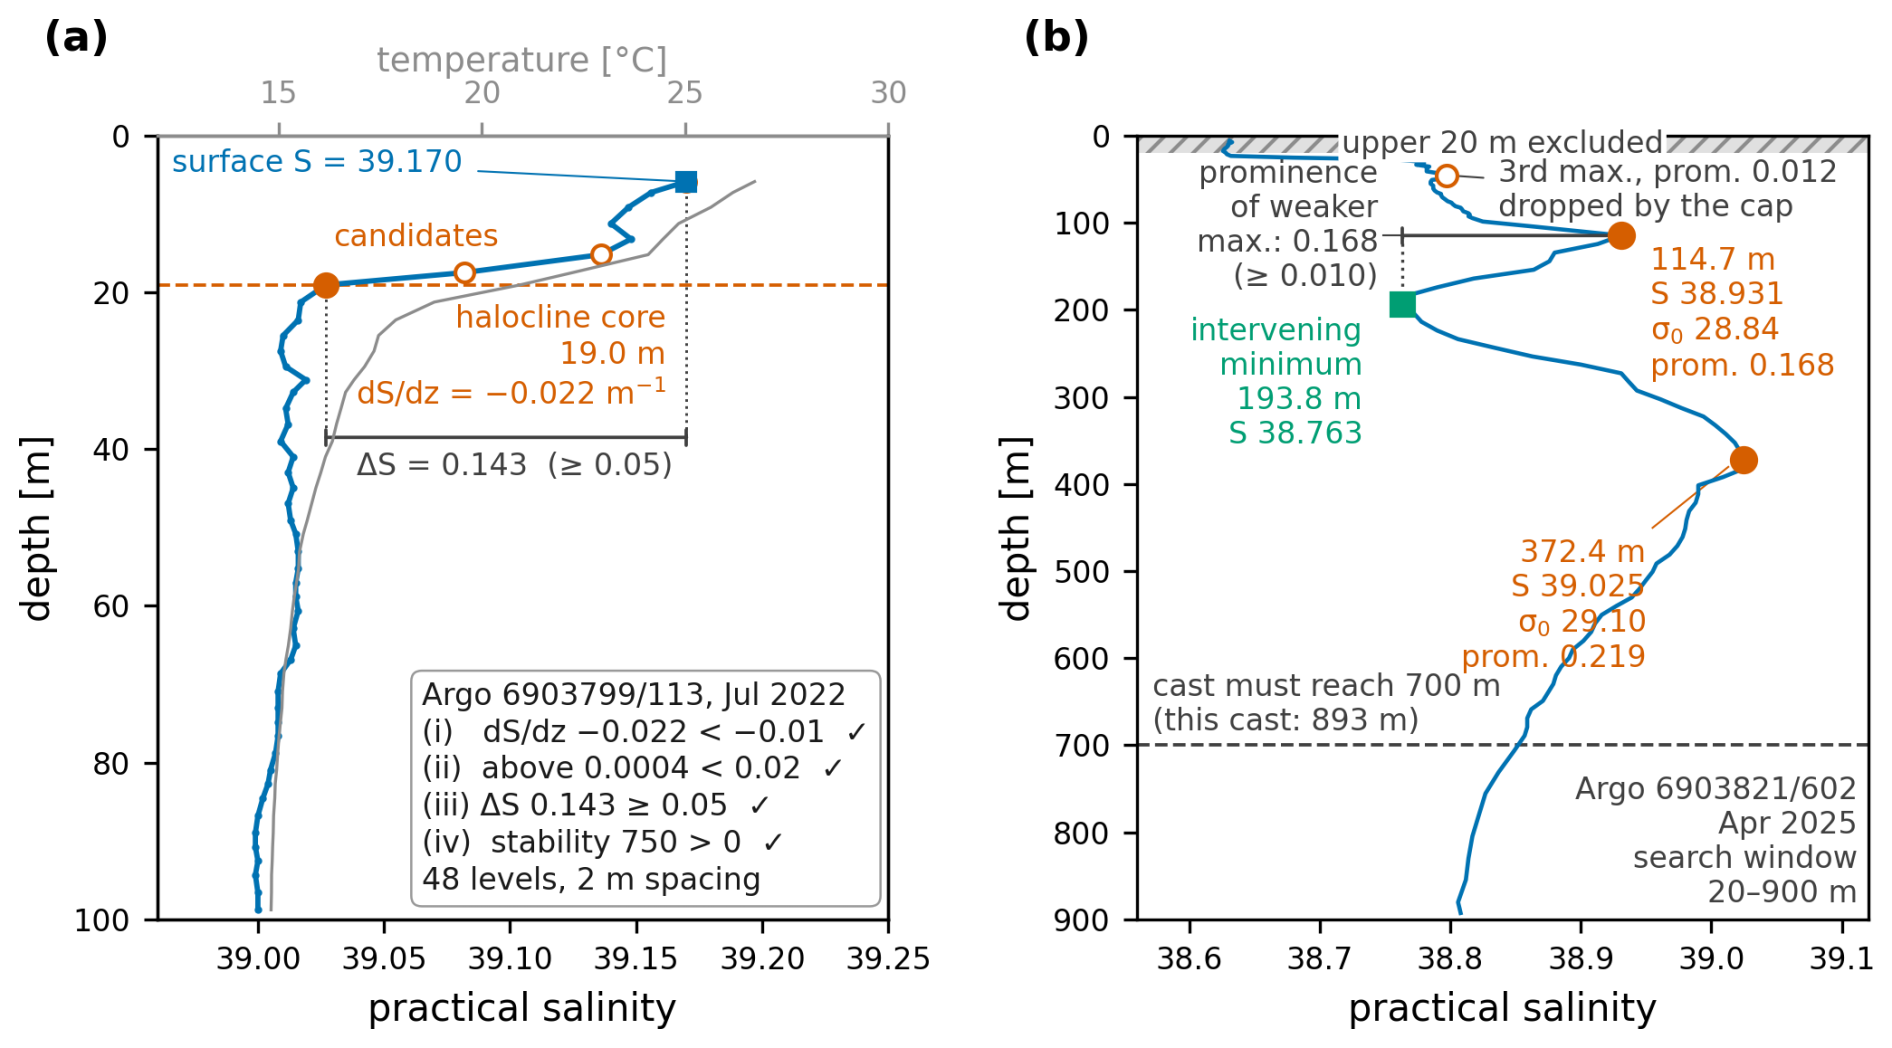
Figure 3The two detection criteria of Sect. 2.6 and 2.7 on measured profiles. (a) Surface saline lake: Argo float 6903799, cycle 113, 26 July 2022, practical salinity (blue) and temperature (grey) over 0–100 m. Open circles mark the levels at which the salinity gradient falls below −0.01 m−1; the halocline core (filled circle and dashed line) is the candidate nearest 100 m, here at 19.0 m; the bracket is the salinity contrast between the first sampled level (5.9 m) and the core, 0.143 against the threshold of 0.05. (b) Double salinity maximum: Argo float 6903821, cycle 602, 11 April 2025, practical salinity over 0–900 m. Filled circles are the two maxima retained, at 114.7 and 372.4 m; the square is the minimum between them, down to which the prominence of the weaker maximum (0.168, bracket) is measured; the open circle is a third maximum (prominence 0.012) removed by the two-per-cast cap. The upper 20 m are excluded (hatched); only casts reaching 700 m (dashed line) enter the frequency statistics.
2.1 Observational dataset
Climatologies are built from the quality-controlled in situ temperature and salinity casts available in the Adriatic for 1950–1999 and 2000–2025, after the coastal and river-mouth exclusion of Terzić and Vilibić (2026c). Three archives are combined: the SeaDataNet aggregation, the local Adriatic databases and Argo. The SeaDataNet Pan-European infrastructure supplies the Mediterranean aggregated dataset SDC_MED_DATA_TS_V2 (Simoncelli et al., 2020), retrieved in December 2025, which archives observations from 1911 to 2019. The local Adriatic databases are contributed by the Institute of Oceanography and Fisheries (IOR; Adriatic database 1987–2019) and the Ruđer Bošković Institute (RBI; northern Adriatic transect 1979–2017), together with the conductivity–temperature–depth (CTD) casts of the Croatian national monitoring programme under the Marine Strategy Framework Directive (MSFD, 2019–2023). The data collected in the Croatian Adriatic between 1952 and 1983 are published by Buljan and Zore-Armanda (1966, 1979) and Zore-Armanda et al. (1991). Argo profiles, the third archive, were retrieved in January 2026 through argopy (Maze and Balem, 2020) from the Argo Global Data Assembly Centre; the first Adriatic profile of the set dates from February 2010. The Adriatic casts used here are the Adriatic subset of the Mediterranean-wide multiplatform dataset assembled and described by Terzić and Vilibić (2026c), processed through the same chain, so the Adriatic and Mediterranean sides of the comparison in Sect. 2.4 rest on one dataset rather than on two independently curated ones. The cleaned Adriatic in situ files are archived on Zenodo by Terzić and Vilibić (2026a) (https://doi.org/10.5281/zenodo.20345373), the Mediterranean-wide processing pipeline by Terzić and Vilibić (2026b) (https://doi.org/10.5281/zenodo.20410481) and the analysis code specific to this paper by Terzić and Vilibić (2026d) (https://doi.org/10.5281/zenodo.23016822).
Table 1 reports retained cast counts by source, region, period, season and maximum depth. These are the counts entering Figs. 1–2, not the raw archive totals. Quality control follows the originating infrastructure: SeaDataNet procedures (SeaDataNet, 2010) and Argo real-time and delayed-mode procedures (Wong et al., 2023), with only flags 1 and 2 accepted in both. Casts from national and international cruises held by neither SeaDataNet nor Argo were quality controlled following SeaDataNet procedures during the assessment described by Pranić et al. (2023). Within each source a cast is identified by its archive identifier, so no cast enters twice. Duplicates can still arise between sources: the SeaDataNet aggregation also archives Argo float profiles as casts of its own. Of these, 642 southern Adriatic profiles of 2010–2019 are also in the Argo set; their SeaDataNet copies are left out of every analysis, so that each profile is counted once. The aggregation further contains 1020 underway thermosalinograph records in the southern Adriatic, which are counted as casts and enter the 5 m bin only.
Table 1Observational dataset inventory: retained casts entering the climatologies behind Figs. 1–2. DJ1 and DJ3 are the northern and southern Adriatic polygons (Sect. 2.2); (d) gives their bounding boxes. SeaDataNet counts exclude the float profiles held by the Argo set and include the thermosalinograph records (Sect. 2.1). Sources: RBI, Ruđer Bošković Institute; IOR, Institute of Oceanography and Fisheries; MSFD, conductivity–temperature–depth (CTD) casts of the Croatian national monitoring programme under the Marine Strategy Framework Directive; Argo, profiling floats. Seasons: JFM, January–March; AMJ, April–June; JAS, July–September; OND, October–December.
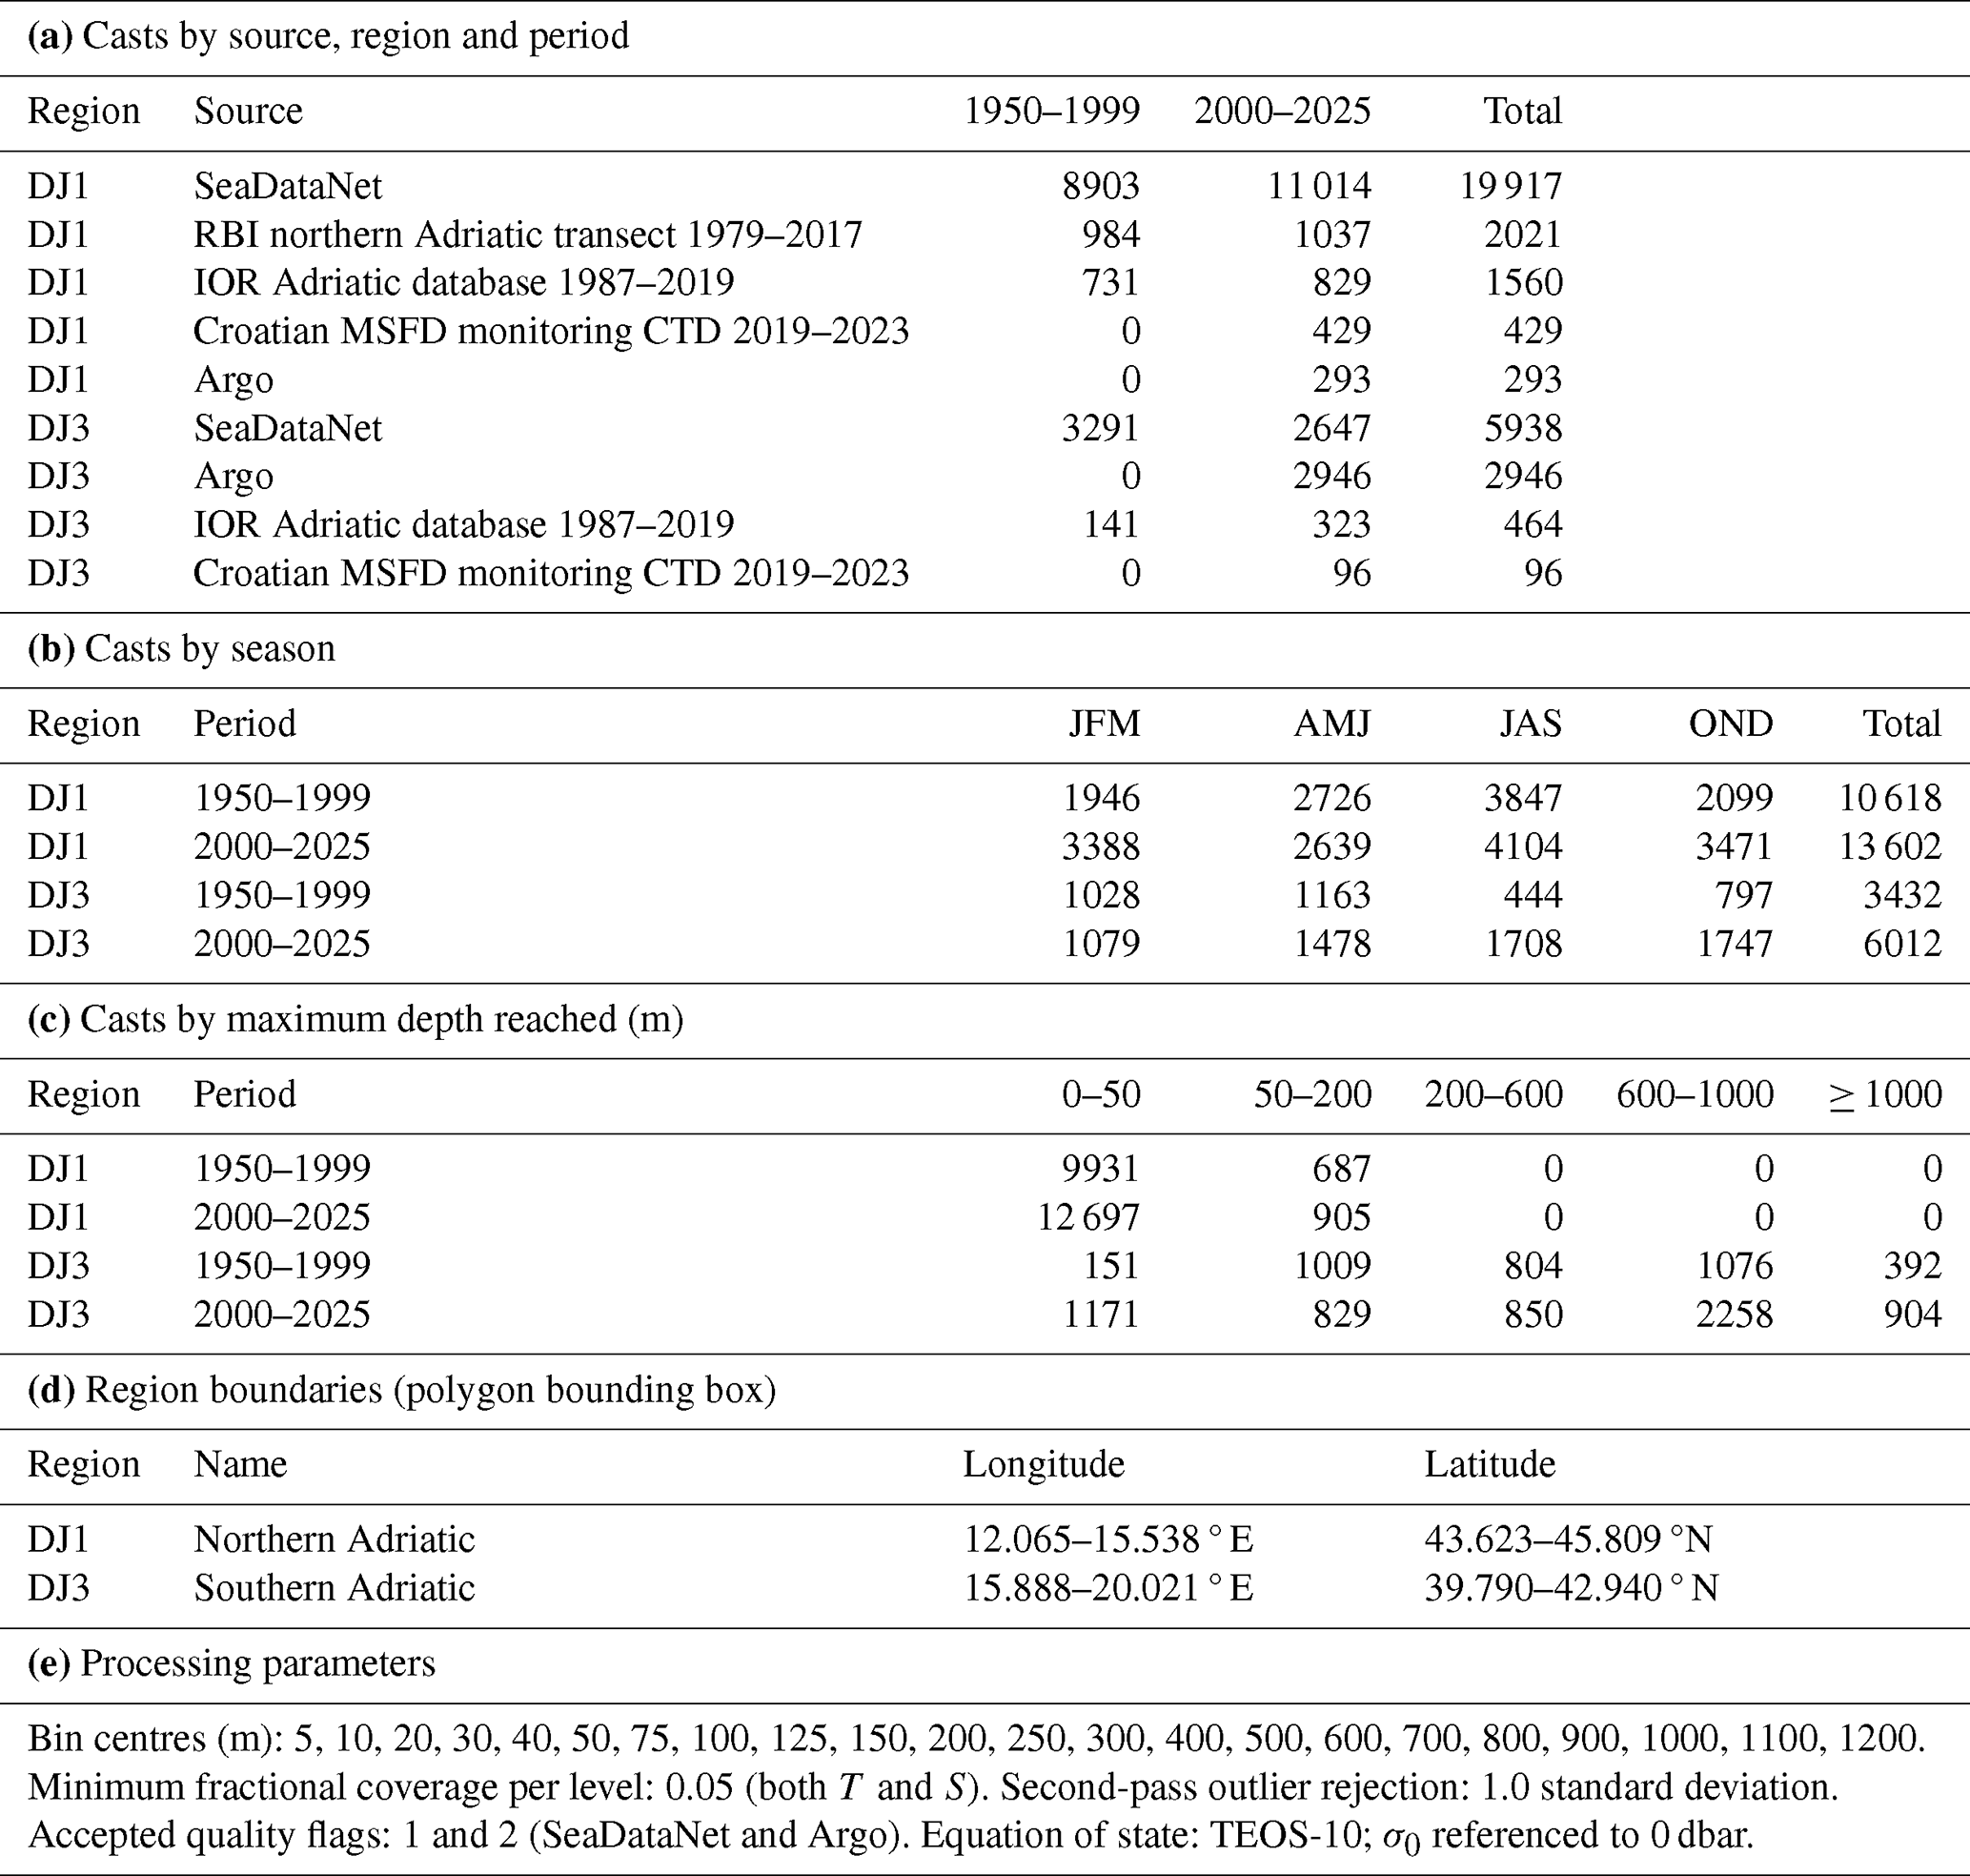
All analyses use the record to 2025. The climatological comparison (Figs. 1–2 and Table 1) contrasts 1950–1999 with 2000–2025, and the 33 664 casts are drawn from those two windows.
The two periods are not sampled alike. Argo supplies 49.0 % of the 21st-century southern Adriatic casts and none of the 20th-century ones. Argo profiles also do not reach the top few metres: their median first sampled depth in the southern Adriatic is 5.5 m, against 3.1 m for the 21st-century casts of all platforms together. The shallowest bins are therefore the least comparable between periods (Sect. 3.1).
2.2 Regions, binning and climatologies
The northern and southern Adriatic are delimited by two polygons, labelled DJ1 and DJ3 after the Mediterranean sub-basin nomenclature of Manca et al. (2004). The labels follow that nomenclature but the boundaries do not: instead of straight lines of latitude, they follow the coastline and the bathymetry. The Zadar–Ancona line separates the northern shelf from the middle Adriatic, and the Gargano–Pelješac line separates the southern from the middle Adriatic. Bounding boxes are given in Table 1 and the polygon files are archived with the analysis code. Seasons are three-month bins, JFM, AMJ, JAS and OND. Casts are binned onto 22 standard levels between 5 and 1200 m. Each cast contributes one value per level, the mean of its measurements within the bin around that level, but only where it has a finite, flag-1 or flag-2 value. No vertical interpolation across gaps is performed, and casts that do not reach the full depth simply stop contributing below their deepest level. A level is retained when at least 5 % of the casts whose depth range spans it have a valid value there. The period mean at each level is the average of these cast values, computed in two passes: the second pass rejects cast values more than one standard deviation from the first-pass mean. Argo profiles report pressure rather than depth; for the binning, pressure is taken as depth, since the difference is about 1 % and small against the bin widths. The profile-by-profile detection of Sect. 2.7 instead converts pressure to depth (TEOS-10, IOC et al., 2010), so that floats and ship casts are read on one scale.
Temperature and salinity are binned as measured, that is as in situ temperature and practical salinity; practical salinity is a ratio and is therefore reported without units. Potential density anomaly referenced to the surface (σ0) is derived from them through TEOS-10, which converts practical salinity to absolute salinity and in situ to conservative temperature internally, using the gsw implementation. The Argo-based analyses of Sect. 2.8 and 2.9 work directly in absolute salinity and conservative temperature, since they require the thermodynamic coefficients. The binning and pooling procedure is described in more detail by Terzić and Vilibić (2026c), who apply it Mediterranean-wide.
2.3 Uncertainty of climatological differences
Counting casts as independent measurements would overstate how much information the climatologies contain. A research cruise typically occupies a region for a few days and takes many casts in that time, so those casts largely repeat one synoptic state rather than sampling the climate independently: 200 casts from four cruises contain far less information than 200 casts taken on 200 separate occasions.
The uncertainty is therefore computed by counting all casts of one data source taken on one cruise day as a single independent observation. In practice, the variance of each period mean at each level is multiplied by the mean number of casts per cruise day in that region, period and season. This factor, the variance inflation factor, is at least one, so clustering always widens the interval: a value of 6 means the casts contain the information of about one sixth as many independent observations. Across the four seasons, the factor for 2000–2025 is 1.9–2.4 in the southern Adriatic and 5.5–6.2 in the northern Adriatic; for 1950–1999, when sampling was still more cruise-bound, it is 3.6–5.7 in the south and 6.7–7.6 in the north. The northern shelf is far more strongly clustered in both periods because its cruises are denser and more repetitive. The 95 % confidence intervals on the differences between the periods follow from these inflated variances. The density differences of Figs. 1–2 are those of the potential density computed from the period means of temperature and salinity at each level. Potential density is a non-linear function of temperature and salinity, so its interval is obtained by recomputing it for 20 000 random combinations of the two drawn within their uncertainties. Shaded envelopes in the difference rows of Figs. 1–2 are these intervals; those in the period rows are ±1 standard deviation of the observations contributing to each level.
Northern Adriatic results are reported only to 50 m, because below that depth the region is barely sampled. Only 905 of the 13 602 casts of 2000–2025 reach 50 m or deeper; over 90 % of those stop between 50 and 75 m, and only 12 reach 100 m, against 2 in 1950–1999 (Table 1). The 50–200 m column of that table therefore describes a layer that in practice spans only 50–75 m.
2.4 Adriatic–Mediterranean rate comparison
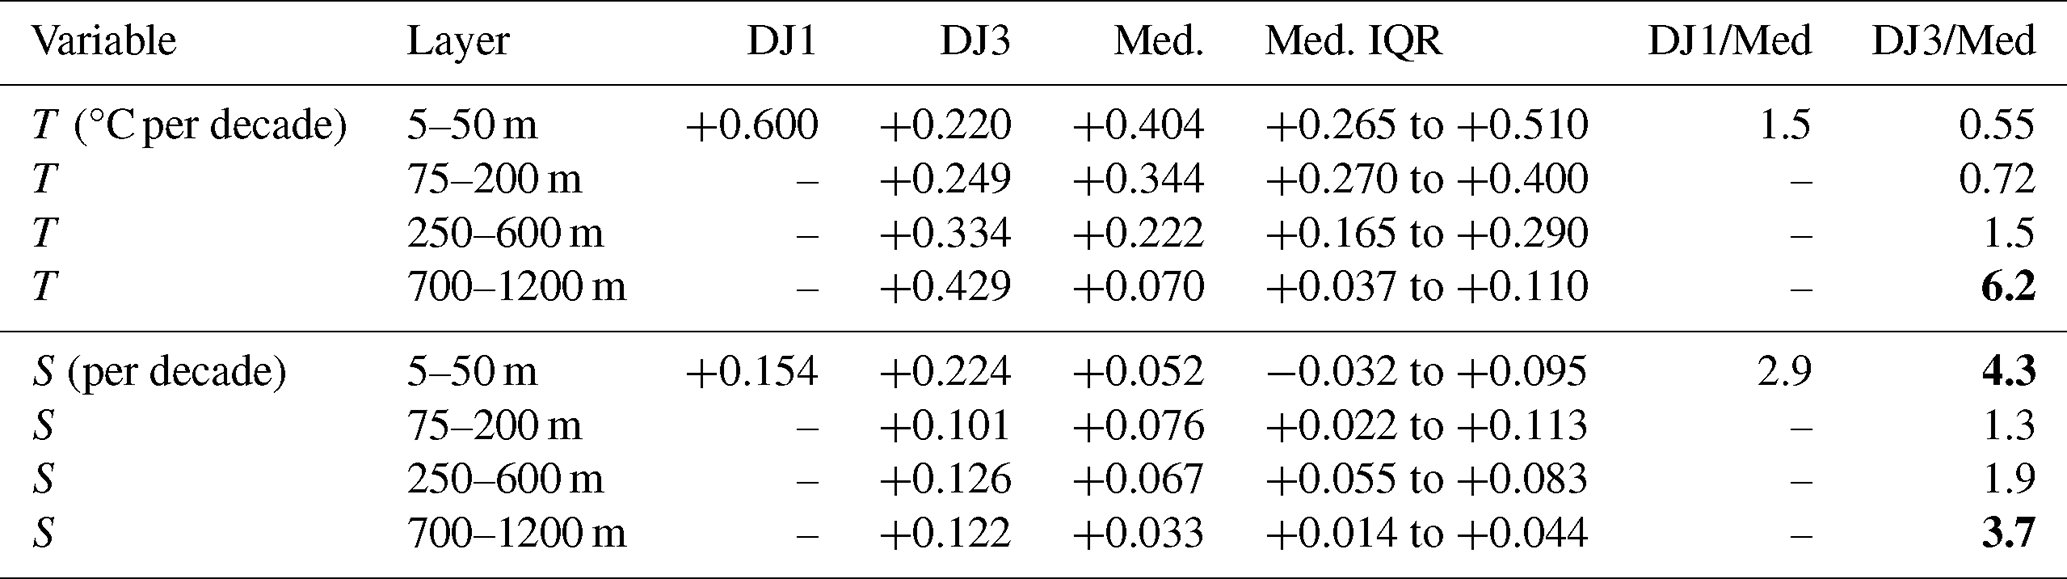
Adriatic rates of change are compared with those of the rest of the Mediterranean. Deseasonalised linear trends per decade are computed for each of the 28 Mediterranean sub-basins used by Terzić and Vilibić (2026c), labelled after Manca et al. (2004) (Sect. 2.2). Three of them (DJ1–DJ3) are Adriatic; of these, the northern and southern Adriatic, DJ1 and DJ3, are reported (Table 2). All 28 are processed with the same pipeline, bins, quality control and estimator, so that the Adriatic and Mediterranean rates are directly comparable. The monthly basin-by-depth series are built as in Terzić and Vilibić (2026c) and deseasonalised with annual and semi-annual harmonics fitted to the whole 1950–2025 series. A linear trend is then fitted to the deseasonalised values of 2000–2025, and is reported only where the whole series has at least 36 monthly values and the 2000–2025 window at least 24, a stricter floor than the 12 monthly values that Terzić and Vilibić (2026c) require for their period-wise trends. The rates are compared in four layers (5–50, 75–200, 250–600 and 700–1200 m), which separate the seasonally mixed surface layer, the layer between the seasonal thermocline and the LIW/CIW horizon, the intermediate-water core, and the deep layers renewed episodically by cascading. For each layer, the Mediterranean value of Table 2 is the median, with the interquartile range, of the trends of all depth bins of that layer in the 25 sub-basins outside the Adriatic, taken together. The value for DJ1 or DJ3 is the median over the depth bins of the layer in that sub-basin alone, and the ratio is the Adriatic value over the Mediterranean one. The deep-layer result (Sect. 3.3) does not depend on these boundaries: the temperature ratio exceeds three at every level from 700 to 1200 m.
Table 2Warming and salinification rates for 2000–2025 in the Adriatic and in the rest of the Mediterranean (Med.; Sect. 2.4). Med. is the median over the depth bins of the layer in the 25 sub-basins outside the Adriatic, with the interquartile range (IQR); DJ1 and DJ3 are the median over the depth bins of the layer. Ratios are computed from the unrounded rates. DJ1 is reported only to 50 m (Sect. 2.3). ratios above 3 are in bold.
To test how far the ratios depend on the cast population, the trends are also computed in every sub-basin from casts taken over water deeper than 800 m only, with the bottom depth at each cast taken from the GEBCO 2024 grid (GEBCO Compilation Group, 2024). Series with fewer than 12 monthly values before 2010 within the 2000–2025 window are left out of this test, so that every open-water trend is fitted over the whole window and not only over the years from 2010, when Argo makes open-water sampling dense. The 95 % intervals on the layer ratios, with and without this restriction to open water, come from a bootstrap: calendar years are drawn at random with replacement, the same years for every sub-basin, and the ratios are recomputed; this is repeated 40 000 times. A depth threshold of 500 or 1000 m instead of 800 m, or a floor of 0 to 36 monthly values before 2010 instead of 12, changes the open-water temperature ratios of the two upper layers by 0.04 at most, whereas the near-surface salinity ratio is more sensitive to the floor (Sect. 3.3).
2.5 Change-point analysis
Whether the change in the occurrence of surface saline lakes (SSLs) is a step rather than a gradual drift is tested on the individual casts, not on a series of annual occurrence rates. The occurrence of an SSL in a cast is modelled as a logistic function of three things: a step after a break year, the season of the cast, and the platform (Argo float or ship cast). Testing on the casts means that a year counts by its casts rather than as one vote, and that the season of each cast is taken into account; the platform term is there because the arrival of Argo floats in 2010 by itself raises the detection rate (Sect. 3.5), so that this rise enters as a separate term rather than as part of the break. The break year is the one for which the model fits the casts best; years whose fit is almost as good, within the 95 % likelihood margin of the best fit, are reported with it. The p-value of the step comes from a permutation test: whole years are shuffled in time 1000 times, the best break is searched for again each time, and the p-value is the fraction of shuffles that produce a step at least as large as the observed one.
The main test uses the casts of June to October, the months in which the feature occurs (Sect. 3.5), from both platforms together. To check that the result depends neither on the months nor on the platform, the test is repeated on the casts of all months and on the summer (July–September) casts alone, and each of the three cast sets is also split into its ship casts and its Argo profiles (Table 5).
Detection of an SSL depends strongly on vertical resolution, as a direct degradation experiment shows, in which Argo profiles are re-sampled onto progressively coarser grids and the identical detection is repeated (Fig. A1; Sect. 3.5). The test is therefore run on a resolution-matched subset: casts with median level spacing ≤ 5 m and at least 8 levels in 0–100 m.
2.6 Detection of surface saline lakes
Detection uses raw profiles rather than the binned climatologies of Sect. 2.2, so the cast set is assembled separately and is larger than the southern Adriatic set of Table 1: 9663 southern Adriatic casts over 1950–2025. Occurrence is shown from 1985 because no earlier cast meets the resolution criteria of Sect. 2.5: of the 313 casts from 1950–1984 whose vertical resolution can be computed, not one does. Before 1975 no cast has a median spacing of 10 m or less, let alone the 5 m required. The 1975–1979 casts are finer, 68 % of them with a median spacing of 10 m or less and 12 % of 5 m or less, but those at 5 m have only three or four levels in the upper 100 m, whereas the detection requires eight; none has both the spacing and the level count (Fig. A1, left).
Following Terzić et al. (2025b), a cast is recorded as an SSL when all four of the following hold (Fig. 3a). (i) The vertical salinity gradient falls below −0.01 m−1 somewhere in 0–100 m. This level is the halocline core, and if there are several candidates the one nearest 100 m is taken. (ii) The maximum salinity gradient above the core stays below 0.02 m−1, so the feature is not simply the lower flank of a shallower feature. (iii) The surface, that is the first sampled level, is at least 0.05 saltier than the core. (iv) The water column above the core is statically stable in density, verified with a stratification index computed across the halocline with a 5 m vertical offset. The salinity inversion is thus temperature-compensated rather than convectively unstable. A cast is evaluated against these four criteria only when it has at least 8 finite levels in the 0–100 m window and a usable temperature. Occurrence among the resolution-matched casts of Sect. 2.5 is shown in Fig. 4.
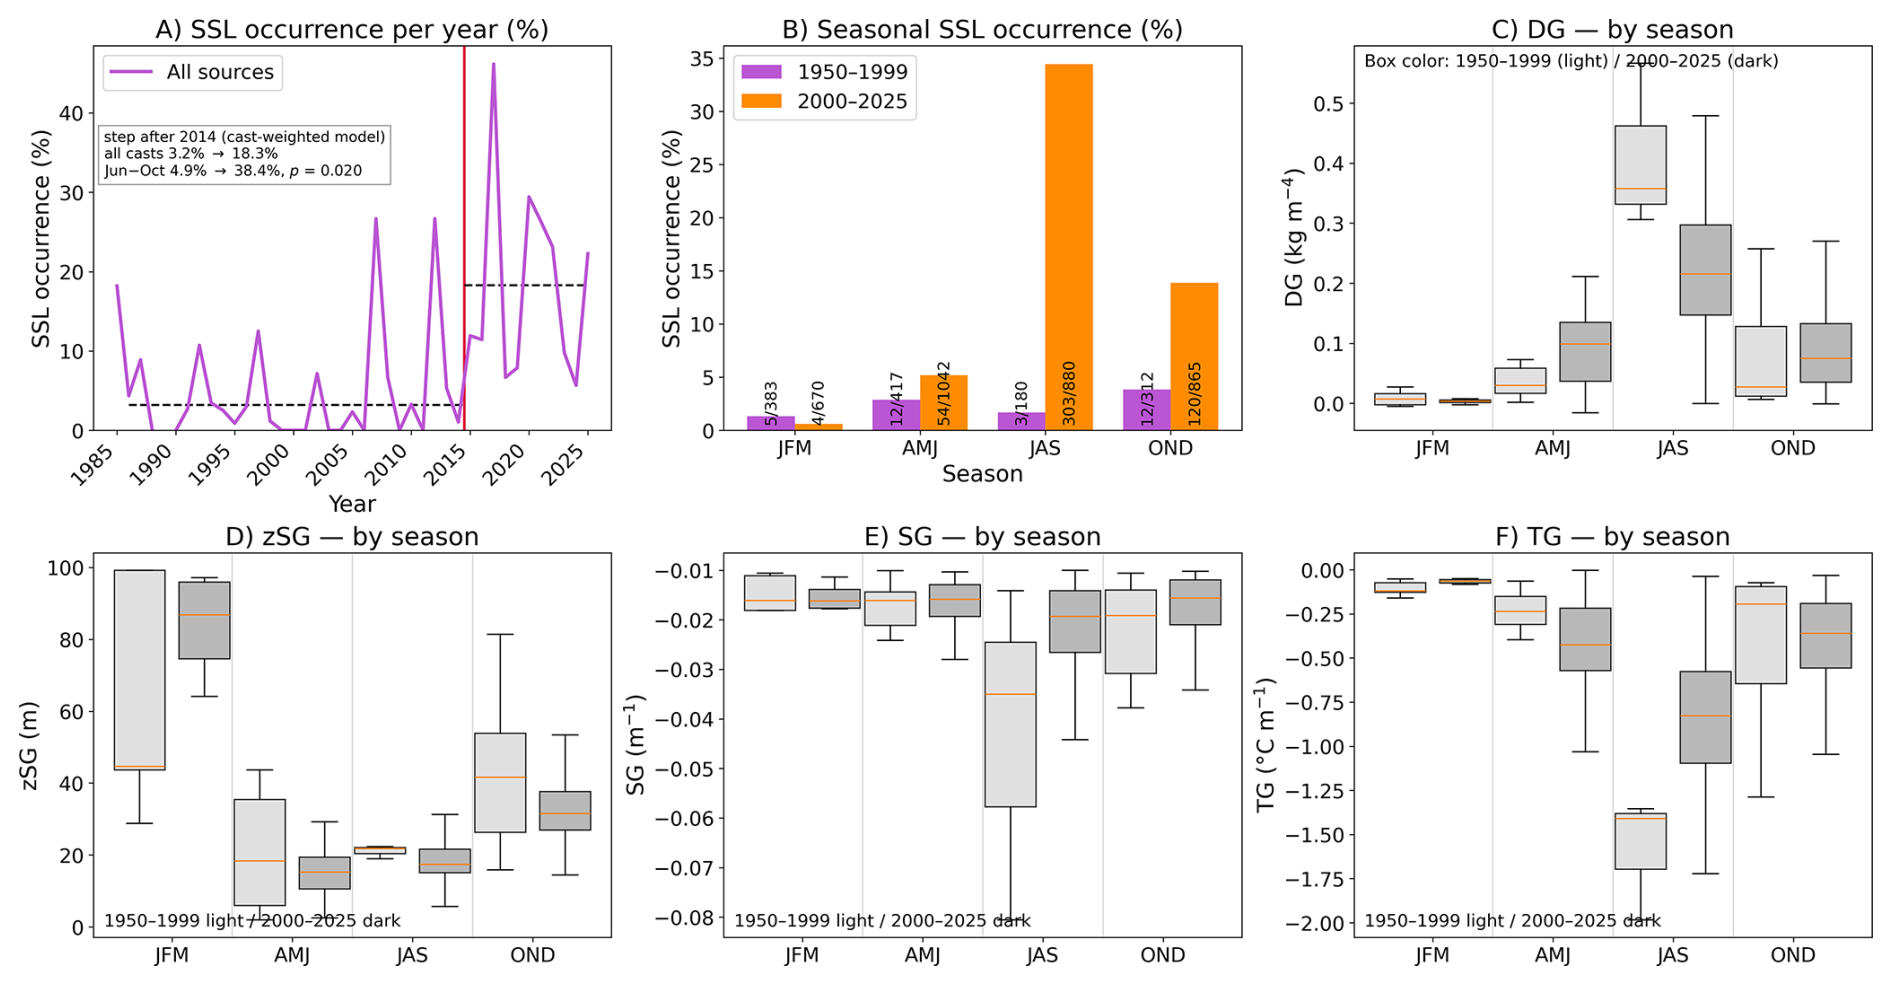
Figure 4Surface saline lakes in the southern Adriatic on resolution-matched casts (Sect. 2.5). (A) Annual occurrence among the matched casts of all months, for years with at least one such cast; the red line marks the step after 2014 found by the change-point model of Sect. 2.5, and the dashed lines give the occurrence pooled over the matched casts of all months before and after it. (B) Seasonal occurrence in the two climatological periods, 1950–1999 and 2000–2025, annotated with the number of detections over the number of matched casts. (C–F) Seasonal distributions of the density gradient (DG), core depth (zSG), salinity gradient (SG) and temperature gradient (TG) of the SSL core, for detected events only; light boxes 1950–1999, dark 2000–2025. The 1950–1999 summer boxes rest on three detections.
2.7 Detection of double salinity maxima
A southern Adriatic salinity profile can have one subsurface salinity maximum or two. Rather than tracking the depth of a single core, we locate every maximum in each cast, so that a cast with two maxima is described by both of them and the distance between them is known.
A maximum is a level saltier than the levels above and below it. Most such levels are small ripples, so each is graded by its prominence: the drop in salinity from the maximum to the lowest value that must be crossed to reach a higher maximum in the same profile (Fig. 3b). Archived salinities have three decimals, and a maximum is retained when its prominence is at least 0.010, i.e., ten times that precision. The three decimals also mean that the flat crest of a salty layer often shows two or more equal maxima separated by a dent of a few thousandths. This is considered as one maximum, so neighbouring maxima are counted as one unless the salinity dips by at least 0.010 between them, the saltier of them being kept. The threshold is a choice, and the detection is repeated for 0.005–0.030 in Appendix A, together with the other settings listed at the end of this section.
Maxima are searched for between 20 and 900 m, with Argo pressures converted to depth (Sect. 2.2). The upper 20 m are excluded so that the near-surface maximum of a surface saline lake is not counted as an intermediate maximum. A cast must also have at least 8 levels in the search range. Of the 5069 SeaDataNet and Argo casts from 1950–2025 that have both temperature and salinity, 479 (9.4 %) fail this and are set aside as too coarse. The IOR and MSFD casts of Table 1 do not enter this detection. Frequency statistics, that is how often maxima occur and at which depths, use only casts reaching 700 m, the depth to which the deep maximum descended in 2015–2016 (Mihanović et al., 2021). These casts fall into two separate groups of years, 1972–1998 (88 % of them from 1990–1998) and 2010–2025 (99 % of them Argo profiles), and none dates from 1999–2009. In SeaDataNet, the casts of those years that reach 700 m are bathythermographs without salinity, or belong to two CTD surveys whose temperature is flagged bad. The IOR database, which does not enter this detection, holds only 16 casts of 2000–2009 that reach 700 m with both variables, too few for a period of their own. The two populations compared are therefore ship casts of the 1970s to 1990s and float profiles of 2010–2025.
Within each cast only the two most prominent maxima are kept, because a few very finely resolved historical profiles contain instrumental noise that the peak search reads as hundreds of maxima: in 15 expendable-CTD casts of one cruise in May 1995 it returns 162–266 maxima each, and without the cap these casts alone would supply 59 % of all 1950–1999 detections among casts reaching 700 m. The cap affects both periods alike: 38.8 % of those casts in 1950–1999 and 39.2 % in 2000–2025 have more than two maxima.
The density of each maximum is recorded as well, because it shows whether a maximum that has changed depth is the same water moved along its isopycnal, with its density unchanged, or different water with a different density. The periods compared are 1950–1999 and 2000–2025, as for the climatologies, and the detection runs at the original vertical resolution of each profile. Vertical sampling, however, differs between the two periods: a quarter of the 1950–1999 casts reaching 700 m are bottle casts at 25 m spacing or coarser and most of the rest 1 m CTD profiles, whereas the floats sample every 2 m from 2019 on and every 10 m in most earlier profiles. The detection is therefore repeated with every profile re-sampled to the historical standard depths (20, 30, 40, 50, 75, 100, 125, 150, 200, 250, 300, 400, 500, 600, 700, 800 and 900 m), and both results are reported in Sect. 3.4. Medians are given with 95 % confidence intervals from resampling whole cruise days (3000 replicates); for floats, whose successive profiles are days apart, each profile is a resampling unit of its own. Distributions are compared between the periods with a two-sided Mann–Whitney test, and the share of casts with two maxima with a χ2 test, which asks whether two proportions differ by more than their sample sizes allow. The exclusion depth, the prominence threshold (0.005–0.030), the number of maxima kept, the depth a cast must reach and the treatment of crest noise are settings of our choice, so the analysis is repeated with each of them varied in turn in Appendix A.
2.8 Steric decomposition
Thermosteric and halosteric height are computed from ascending Argo profiles reaching at least 1000 dbar in the Southern Adriatic Pit, following Wang et al. (2017), as
where primes denote anomalies about the period-mean profile and α,β are the TEOS-10 thermal expansion and haline contraction coefficients. The integrand must be the anomaly Θ′ rather than Θ itself: integrating αΘ instead of αΘ′ makes the result, and its trend, depend on the temperature scale used, because Θ is measured from an arbitrary origin while α varies with depth. Anomalies remove that origin.
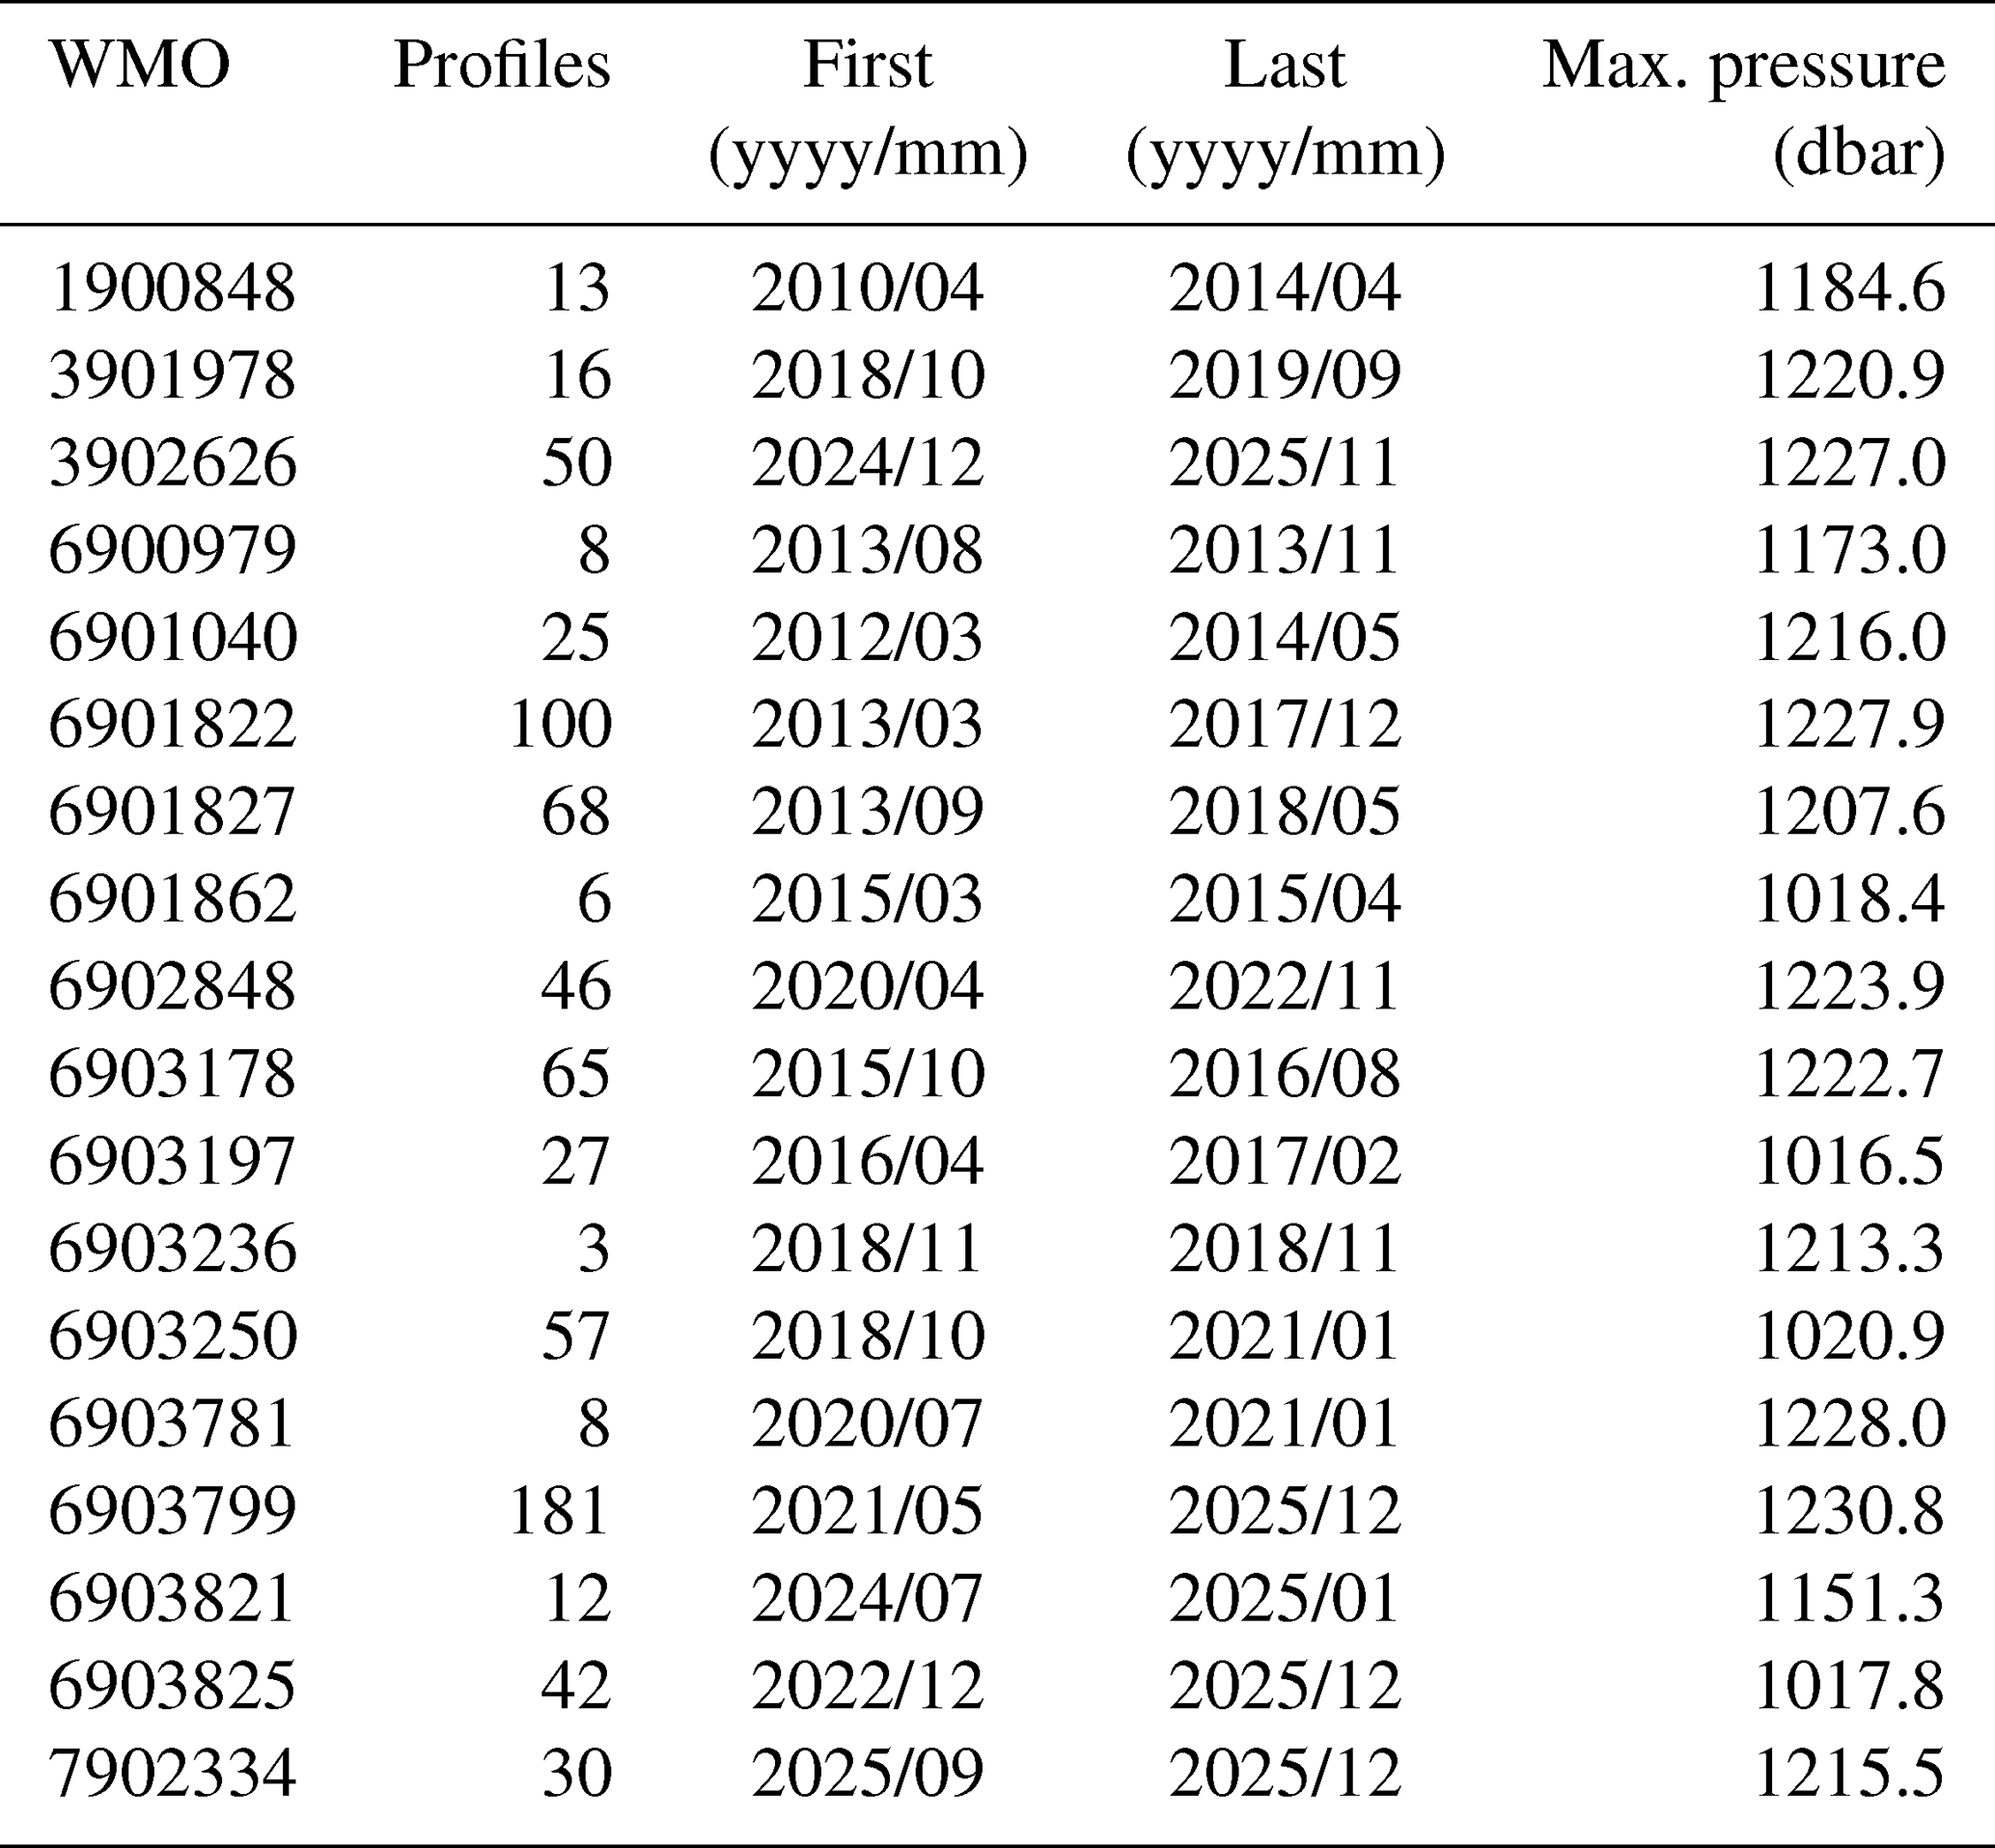
Eighteen floats contribute 757 profiles from April 2010 to December 2025; their WMO identifiers are listed in Table 4. Two further floats, 6903805 and 6901865, are left out as a whole, because only 6 of the 33 profiles of the first and 1 of the 78 of the second reach 1000 dbar. Profiles are interpolated onto a common 0–1000 dbar grid at 5 dbar spacing, and because Argo does not sample the top few metres (median first sampled pressure 5.8 dbar for the profiles used here), the shallowest observation is extrapolated as a constant to the surface. Each profile thus yields one thermosteric and one halosteric height. These are averaged into monthly means, the annual and semi-annual harmonics are removed from the monthly series, and the trends are least-squares fits to the deseasonalised monthly values (Table 3).
Table 3Steric sea level trends in the Southern Adriatic Pit over 2014–2024 from deseasonalised monthly means of Argo profiles, with 95 % confidence intervals corrected for the autocorrelation of the monthly values (Sect. 2.8). Eastern Mediterranean values are from Mohamed and Skliris (2022) for 1993–2019, on their own integration layer. The 0–1000 m row (bold) is the main estimate discussed in the text.
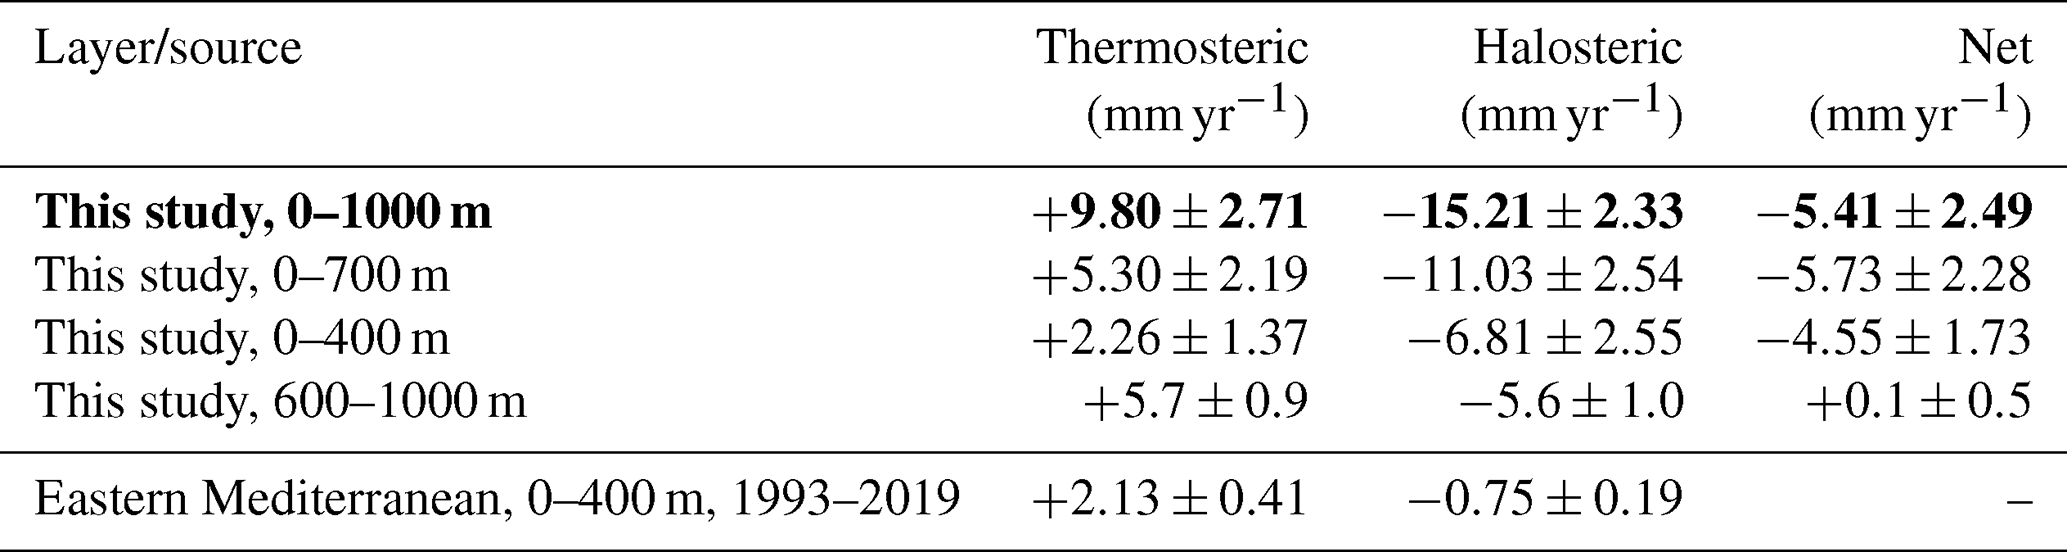
Table 4Argo floats contributing to the Southern Adriatic Pit analyses (steric decomposition and double-diffusive diagnostics, Sect. 2.8–2.9), restricted to ascending profiles reaching at least 1000 dbar.
The trends are fitted on the window January 2014 to June 2024 (hereafter 2014–2024), the most recent decade with near-continuous float coverage (Sect. 3.6). Two features of the monthly series govern how the trends and their confidence intervals are computed. First, successive months are correlated, so the window contains less information than its 116 monthly values suggest. The confidence intervals therefore rest on an effective sample size , with r1 the lag-one correlation of the residuals of the trend fit (Bretherton et al., 1999) (Fig. A2). For the 0–1000 m series that correlation is 0.7–0.8, which leaves 10–21 effectively independent values, so the intervals are correspondingly wide. Second, the thermosteric and halosteric components vary in opposite directions: the same month-to-month fluctuation raises one and lowers the other, so much of the uncertainty of each cancels in their sum. Fitting the two trends separately and adding them would lose that cancellation and inflate the uncertainty on the net, so the net is instead computed for each profile as the sum of its thermosteric and halosteric heights, and the trend is fitted to that net series directly.
2.9 Double-diffusive diagnostics
Two quantities are distinguished: the Turner angle determines whether the water column is in the salt-finger regime (), and the density ratio Rρ determines whether fingering there is dynamically effective. They are computed from vertical gradients of conservative temperature and absolute salinity on the 5 dbar grid of Sect. 2.8 as
with the four-quadrant arctangent, alongside the squared buoyancy frequency , which measures how strongly the water column is stratified. All are evaluated with the gsw implementation of TEOS-10 (IOC et al., 2010). The density ratio matters because it sets the growth time of the fingers (Kunze, 1987), which transport salt only if they reach full amplitude before internal-wave shear disrupts them: the transport is appreciable for Rρ<2, marginal to about 4, and negligible beyond about 10 (Schmitt, 1994). A water column can therefore be entirely finger-favourable by the Turner angle and still transport nothing, so two statistics are computed for each profile in each of the depth layers defined below, and reported separately. The first is the extent of the regime: the fraction of the profile's levels in the layer that are in the salt-finger regime. The second is its vigour: the fraction of those levels with Rρ<2. Both use the same 757 Argo profiles as the steric decomposition (Sect. 2.8), because they too need the full column resolved, here as vertical gradients, at all times of year. Only Argo provides that here, so neither can be extended into the shipborne record.
Both statistics are evaluated separately in three depth layers, because their changes differ between layers and partly cancel when averaged over the whole column. The layers are 200–400 m, the classical range of the LIW salinity maximum (Artegiani et al., 1997); 400–600 m, immediately below it; and 600–1000 m, the deep layer. A fourth layer, 350–550 m, is computed only for comparison with the EMSO-E2M3A mooring record in Sect. 4.2. Profiles taken before 2017 are compared with those taken from 2017 onward, using a two-sided Mann–Whitney test on the per-profile layer statistics; the split is also moved to every year from 2016 to 2020 (Sect. 3.7). The same test is repeated on annual means of the statistics, so that a year counts once however many profiles it holds. The statistics are also computed with gradients taken over 25 dbar instead of 5, because the float profiles have more levels in the later years (Sect. 3.7) and gradients on the 5 dbar grid therefore resolve finer structure after 2017 than before; 25 dbar is a spacing that the profiles of both periods resolve.
3.1 Southern Adriatic warming and salinification
From the 1950–1999 to the 2000–2025 climatology the southern Adriatic (DJ3) became saltier at every depth from 5 to 1200 m and in every season, and warmer everywhere except near the surface in summer and autumn (Fig. 1), as discussed below. Salinity differences range from +0.108 to +0.531 and are distinguishable from sampling variability at all 88 depth–season combinations (22 levels in four seasons) after cruise day clustering is accounted for. Temperature differences range from −1.27 to +1.63 °C, and 83 of the 88 (94 %) are positive and significant. The summer of 1950–1999 is the sparsest season–period combination, 444 casts against 1708 in 2000–2025 (Table 1), so the summer temperature differences have the widest intervals at most levels and are the ones most exposed to the sampling change discussed next.
The most negative of those differences, −1.27 °C in the 5 m summer bin, is an artefact of how the surface is sampled rather than a cooling, and two sampling differences are involved. The first is the depth of the first sample, which has moved down. In summer 1950–1999, 82 % of southern Adriatic casts began at or above 1 m, and the median first sample was at the surface. Of the summer casts of 2000–2025, only 14 % begin at or above 1 m; their median first sample is at 2.5 m, and that of the Argo profiles among them at 5.8 m. Binning does not remove this bias, because recent casts enter the shallowest bin only through its deeper, colder part. With the 20th-century summer gradient of 0.34 °C m−1 between the 5 and 20 m levels, a sample at 2.5 or 5.8 m instead of the surface is colder by half a degree or more. The second sampling difference acts on the same levels: the summer casts are unevenly spread within the season. Of the 1950–1999 casts in the 5 m bin, 53 % were taken in August and 18 % in September; of the 2000–2025 ones, 18 % in August and 63 % in September. With the month mix of 1950–1999 the modern 5 m bin would be 0.9 °C warmer and the 10 m bin 0.3 °C warmer. Because of these two biases the 5 m summer bin is omitted from the difference row of Fig. 1, and none of the other summer differences above 30 m is interpreted: the 10 m difference (−0.44 °C) is also negative, and the 20 m one (−0.17 °C) is not distinguishable from zero. The two autumn differences that are not distinguishable from zero, −0.12 °C at 5 m and +0.19 °C at 10 m, are not interpreted either. From 30 m down, where the profile is smooth and the platforms overlap, the differences are positive at every level and season. Below 200 m the warming is 0.5–0.9 °C in every season (Fig. 1, bottom row).
Potential density has a weaker signal than either temperature or salinity: 57 % of depth–season combinations show a significant difference, because thermal and haline effects oppose one another. Below 600 m they largely compensate each other, and the residual is within about 0.05 kg m−3. This compensation is the physical basis of the near-zero deep steric trend in Sect. 3.6.
3.2 Northern Adriatic shelf
In the northern Adriatic (DJ1), reported only to 50 m (Fig. 2; Sect. 2.3), the warming between the two climatologies reaches 3.0 °C at 20 m in summer. Surface salinity is higher in every season: by +0.09 to +0.18 in winter, spring and autumn (the spring value is not distinguishable from zero), but by +1.00 in summer, so the seasonal contrast between the fresh summer surface and the winter state is much reduced (Fig. 2). The evidence for these changes is weaker than in the south, and uneven: once clustering is accounted for, 79 % of the depth–season combinations in 0–50 m show a significant warming and 58 % a significant salinity increase. The 2000–2025 climatology is significantly cooler at 5 and 10 m in autumn, and its salinity is significantly lower at 10–20 m in spring and at 20 m in autumn. The autumn cooling is partly the month mix of Sect. 3.1 again, this time towards the coldest month of the season: December supplies 40 % of the 2000–2025 autumn casts at both levels, against 30 % of the 1950–1999 casts at 5 m and 26 % at 10 m. With the historical month mix the modern autumn means at 5 and 10 m would be 0.1 and 0.3 °C warmer, which is a third of the 5 m cooling and two thirds of the 10 m one. The lower spring salinities, by contrast, are not a month-mix effect.
The clustering correction is largest on the northern shelf, with variance inflation factors of 5.5–6.2 for 2000–2025. This is largely because one station at 13.7° E, 45.7° N supplies 54 % of the 2000–2025 northern casts and was sampled several times a day in 1999–2004, so that consecutive casts share one synoptic state (Sect. 2.3). The shelf also has a spatial sampling bias. Its 20th-century sampling is concentrated along the western coastline, whereas salinity is systematically higher along the eastern one (Artegiani et al., 1997; Vilibić et al., 2019), and the 21st-century casts lie farther east than the 20th-century ones (median cast longitude 13.7° E against 13.1° E), on the saltier side of that gradient. This spatial sampling shift thus inflates rather than dampens the apparent salinification, so northern Adriatic salinity differences should be read as indicative upper bounds rather than established values. The temperature differences should be read with the same caution, and DJ1 is not reported below 50 m at all (Sect. 2.3).
3.3 The amplification is depth-dependent
Over the same 2000–2025 window and with an identical pipeline in every sub-basin (Table 2; Sect. 2.4), the ratio of the southern Adriatic warming rate to the Mediterranean median, the median rate of the sub-basins outside the Adriatic, is 0.55 at 5–50 m, 0.72 at 75–200 m, 1.5 at 250–600 m and 6.2 at 700–1200 m. Thermal amplification, a ratio above one, is thus absent above 200 m and grows with depth below about 300 m.
However, the two ratios above 200 m should not be read as slower warming, for two reasons. First, they are medians over depth bins that behave differently. The two shallowest bins keep pace with or exceed the Mediterranean median (at 5 and 10 m the southern Adriatic warms at 0.43 and 0.57 °C per decade against 0.44–0.45), whereas the 30–100 m bins lag well behind it (0.11–0.19 against 0.36–0.39 °C per decade). Second, most of the gap between the two rates at 30–100 m reflects where the casts were taken. In the southern Adriatic series, casts over water deeper than 800 m make up about 40 % of a monthly mean until 2014 and about 75 % from 2015, as Argo floats in the open basin replace ship casts. At 30–100 m the open basin is on average 0.4–0.7 °C colder than the southern Adriatic shelf in the same month, so the shift towards open-basin casts pulls the later monthly means down, and the fitted rate with them. When only such open-water casts are used, in the Adriatic and in every other sub-basin alike (Sect. 2.4), the southern Adriatic rate at 30–100 m rises to 0.29–0.31 °C per decade, whereas the Mediterranean median, recomputed under the same restriction, changes by at most 0.03 °C per decade. The layer ratios then become 0.79 at 5–50 m and 0.86 at 75–200 m (95 % intervals 0.48–1.5 and 0.62–1.2); neither is distinguishable from one. The test removes the change of location but not that of instrument: the southern Adriatic open-water casts are almost all bathythermographs until 2009 and floats from 2010. Whether the upper layers warm more slowly than the Mediterranean median therefore cannot be established. From 250 m down the ratios do not depend on the cast population (1.5 and 6.0 on open-water casts).
Salinity behaves differently: the salinity ratio is 4.3 at 5–50 m, 1.3 at 75–200 m, 1.9 at 250–600 m and 3.7 at 700–1200 m, so haline amplification is present through the whole column. The ratio is lowest at 75–200 m, where on all casts it is not distinguishable from one (95 % interval 0.88–2.5) but on open-water casts it is 2.1 (1.2–3.4). The near-surface ratio also depends on the cast population, because the open basin is 0.2–0.8 saltier than the shelf in the upper 40 m: on open-water casts the southern Adriatic salinification rate falls from 0.22 to 0.16 per decade, and the ratio falls to 3.4 (1.3–18). The southern Adriatic is therefore salinifying faster than the Mediterranean median through the column, but warming faster than it only below about 300 m. These ratios compare mean rates over the window and say nothing about acceleration, which Terzić and Vilibić (2026c) find to peak in the Adriatic–Ionian sector.
3.4 The intermediate salinity maximum has lost its dominant band
The classical description of the southern Adriatic intermediate layer is of a single salinity maximum, associated with the inflow of Levantine Intermediate Water and typically found between 200 and 400 m (Artegiani et al., 1997). We test that description directly: rather than tracking one core depth, we detect every prominent salinity maximum in each cast (Sect. 2.7) and ask where those maxima sit.
The change is in where the maxima lie rather than in how many there are. Two maxima are not a modern feature: among casts deep enough to resolve both (those reaching 700 m), 59.9 % had two in 1950–1999 and 62.6 % in 2000–2025 (p=0.24, χ2). Because this share also depends on the detection settings (between the periods it rises significantly in two of the configurations of Sect. 2.7 and falls significantly in one; Fig. A3c), no trend in it is claimed. What did change is how tightly the detections cluster in depth. In 1950–1999 they cluster in one band: 41 % of them lie within 100–200 m, and 27 % within the single 50 m interval at 100–150 m. This 100–200 m band is not a definition of the core but simply the interval in which the historical detections are concentrated; it lies immediately above the classical 200–400 m range. In 2000–2025 the same band holds only 16 % of the detections, which have instead spread through the column in both directions: the share above 100 m rose from 29 % to 47 % and the share at or below 300 m from 16 % to 27 %, with a second mode at 400–600 m (Fig. 5). The historical profile therefore had a dominant intermediate maximum, which a single-core description represents adequately; the modern profile has no such dominant maximum.
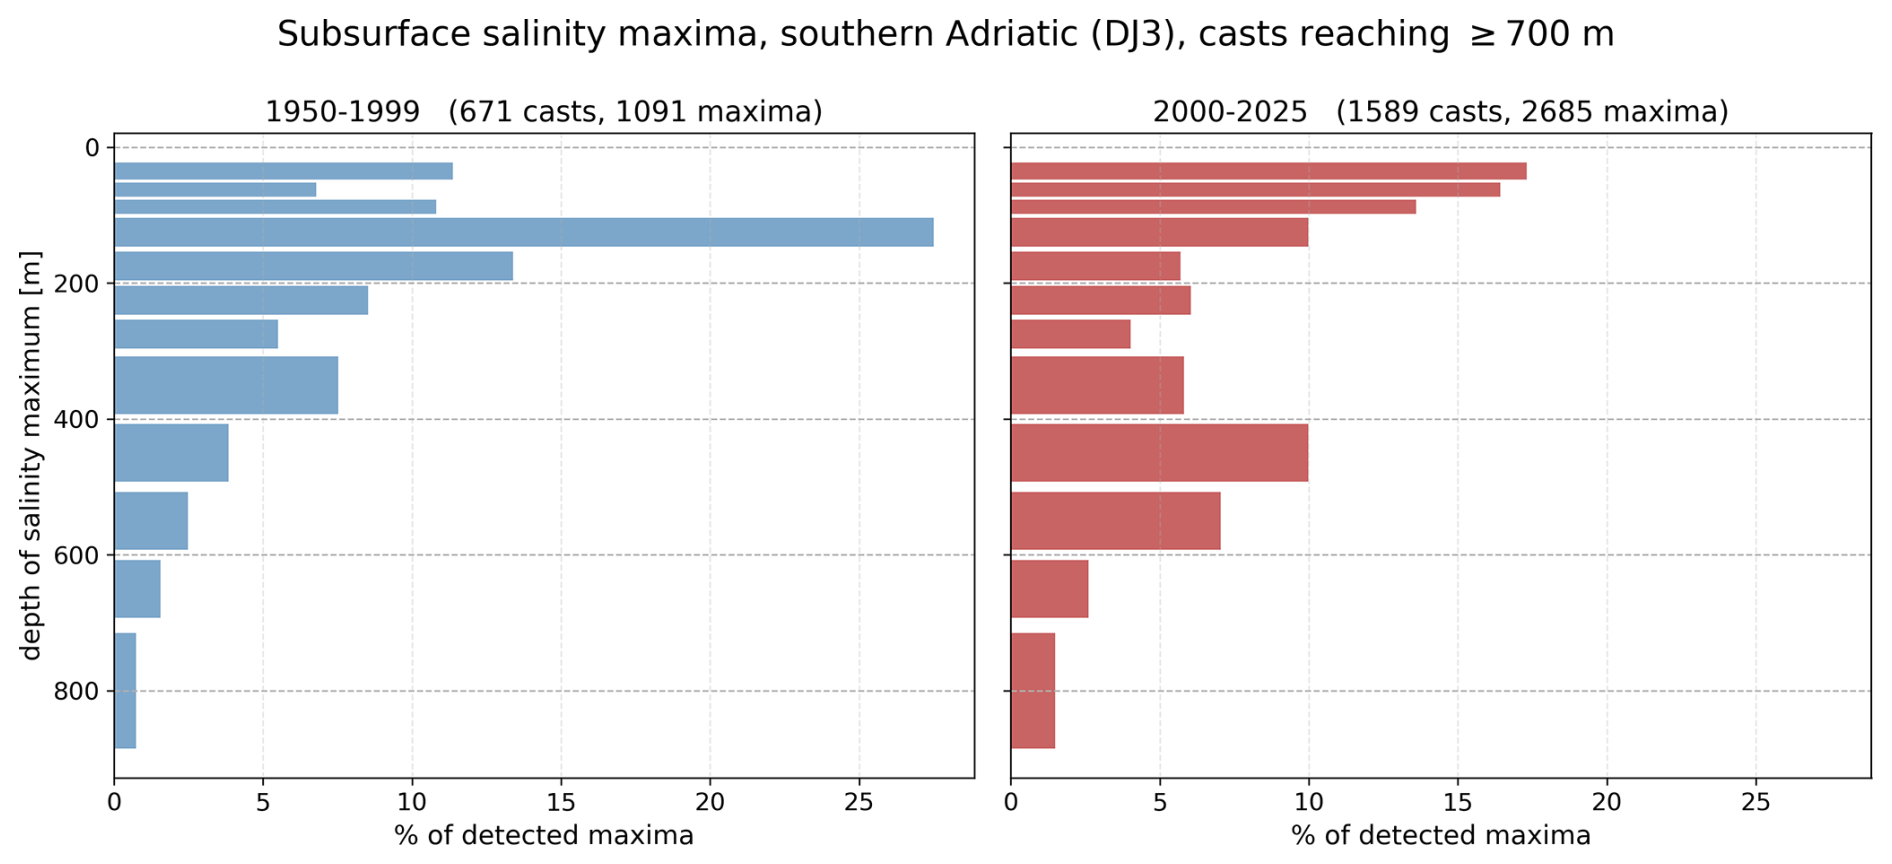
Figure 5Subsurface salinity maxima in the southern Adriatic in casts reaching 700 m, at most two per cast (Sect. 2.7), for 1950–1999 and 2000–2025, at the original vertical resolution. A cast with a single maximum contributes one detection. Depth bins are 20–50, 50–75 and 75–100 m, then 50 m wide to 300 m, 100 m wide to 700 m and a single bin for 700–900 m. Panels share a common horizontal scale.
The two maxima have also moved apart. In casts that have both, the vertical distance between them grew from a median of 122 m in 1950–1999 to 210 m in 2000–2025 (, Mann–Whitney), and its spread widened from an interquartile range of 72–206 to 60–412 m. Pooled over the same casts, the two moved in opposite directions: the shallower maximum rose, from a median depth of 82 m (95 % confidence interval 75–91 m) in 1950–1999 to 64 m (62–67 m) in 2000–2025, while the deeper one sank, from 205 m (185–230 m) to 333 m (312–364 m); for each maximum, the two confidence intervals do not overlap. The difference between these pooled medians need not equal the median within-cast distance, because the two answer different questions: the pooled medians say where each maximum typically lies, whereas the within-cast distance says how far apart the two are in a typical cast. The two maxima also diverged in density: the shallower one became 0.13 kg m−3 lighter as it salinified, while the deeper one changed by only 0.03 kg m−3 and so stayed close to its isopycnal. Water that is at once saltier and markedly lighter must be warmer, so the shallower maximum cannot be the same water pushed upward: the two maxima are not one migrating core.
The pair has not, however, become more distinct. The salinity drop from the weaker maximum to the minimum between the two, which measures how clearly the two stand apart, is unchanged: a median of 0.030 in 1950–1999 and 0.026 in 2000–2025, with overlapping confidence intervals (0.024–0.037 and 0.025–0.028). The maxima are therefore differently placed, not more clearly separated.
Two checks support these results. First, repeating the detection with every profile re-sampled to the historical standard depths gives 41.9 % of detections in the 100–200 m band for 1950–1999 and 20.0 % for 2000–2025, compared with 40.9 % and 15.7 % at the original resolution, so the contrast is not an effect of the difference in vertical sampling between the ship casts and the floats. Second, the share of detections in that band is higher in 1950–1999 than in 2000–2025 under every detection setting and every treatment of profile noise we tested (Fig. A3a): in every configuration that keeps the two-per-cast cap it is 38 %–47 % against 14 %–17 %. Under every one of these settings the shallower maximum also lightened more than the deeper one, by a factor of 3.6 to 5.7 (Fig. A3).
3.5 Surface saline lakes: an abrupt shift
Detection depends first of all on vertical resolution. In the full cast set of Sect. 2.6, before resolution matching, the detection rate differs by a factor of about 27 between the data sources of Table 1, from 0.56 % for SeaDataNet to 14.87 % for Argo. The sources are archives rather than instrument types, and they cover different years, so this spread mixes the effect of period with that of resolution. The degradation experiment separates the two (Fig. A1) by holding the period fixed: one set of Argo profiles is re-sampled onto coarser grids, so that only the resolution changes. The detections are unchanged at 2 m spacing (437 at the original 1–5 m spacing, 439 at 2 m), halved at 5 m (237) and reduced by nine in ten at 10 m (48), because the criterion requires a salinity gradient steeper than −0.01 m−1 across a feature a few metres thick, which a coarse grid cannot resolve. On the standard bottle grid of the older ship casts (0, 10, 20, 30, 50, 75, 100 m) no profile can be evaluated at all, since the grid has seven levels in the upper 100 m against the eight the detection requires. The near-zero occurrence in the coarsely sampled historical casts is therefore partly instrumental, and all results below rest on the resolution-matched casts of Sect. 2.5.
The matched set holds 4749 casts, most of them either shipborne CTD casts of 1985–1999 or Argo profiles from 2010 on. The record reaches back to 1985 because the shipborne CTD casts of that time, archived by SeaDataNet and the IOR database, are mostly sampled every metre, so that 1292 of the 1689 casts of 1985–1999 meet the resolution criteria. The decade between is thinly covered: in 2000–2009 the IOR database supplies most of the 219 matched casts. The shipborne contribution of SeaDataNet ends in 2009, so from 2010 the record rests on Argo, whose 2943 profiles make up 91 % of the matched casts from that year on, with the remaining ship casts from the IOR database to 2019 (172 casts) and from the Croatian monitoring programme from 2019 (96 casts).
On the matched casts the change-point model of Sect. 2.5 places the step after 2014 (Table 5). In the main test, on the June–October casts of both platforms together, no other break year comes within the 95 % likelihood margin of the best fit, and occurrence rises from 4.9 % of the casts before the step (1985–2014) to 38.4 % of those after it (2015–2025), an odds ratio of 9.4 (p=0.02).
Table 5Change-point model of surface saline lake occurrence (Sect. 2.5) on the resolution-matched casts of 1985–2025, by cast subset; the first row is the main test. Casts, With SSL: number of casts in the subset and number of them with a surface saline lake. Break: the year after which the step is placed; where more than one year fits within the 95 % likelihood margin of the best fit, the range of those years follows in parentheses. Before, after: occurrence of surface saline lakes among the casts up to the break year and among those after it. Odds ratio of the step with its 95 % interval; p from the year-block permutation test (1000 shuffles).
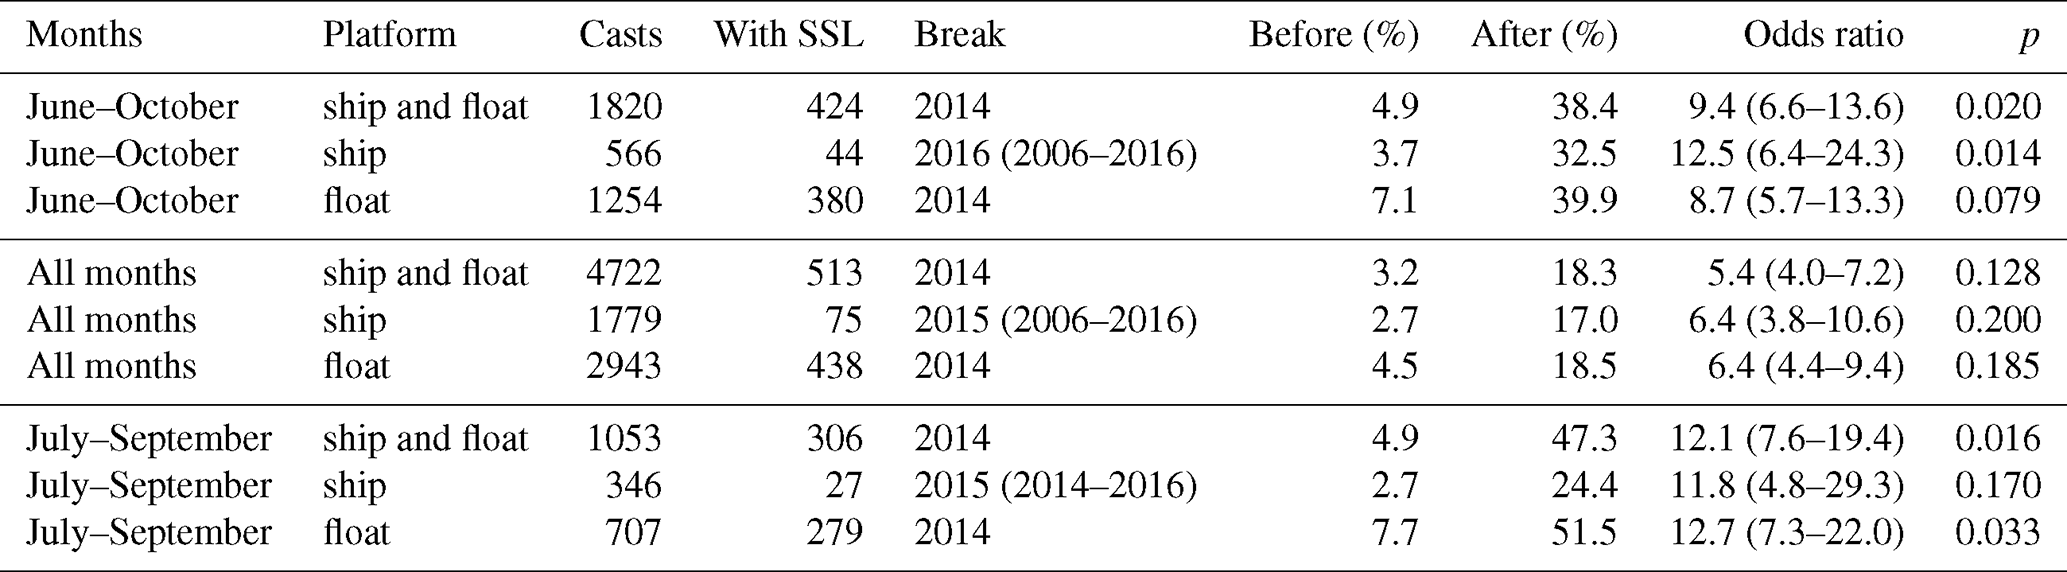
The other rows of Table 5 show that the step depends neither on the platform nor on the months chosen. Within the June–October ship casts alone the break falls after 2016, with three other years between 2006 and 2016 fitting almost as well because few ship casts remain after 2016; within the June–October Argo profiles alone it falls after 2014. In the main test, floats detect more often than ships in the same year and season, by an odds ratio of 2.0 (1.4–2.9), but the step remains after 2014 whether or not the platform is taken into account. On the casts of all months, ship and float together, the break is again after 2014 and the step is smaller, from 3.2 % to 18.3 %, because the winter and spring casts, in which the feature is rare, dilute it; on the July–September casts of both platforms it is larger, from 4.9 % to 47.3 %. With ship and float casts together, the permutation p-value is 0.02 or less in the June–October and July–September tests. It is higher, 0.08 to 0.2, in the all-month tests and in four of the six single-platform subsets, which hold fewer casts or fewer years, but the timing and the direction of the step are the same in every subset. The step also does not coincide with 2017, the year after which salinity rose sharply (Sect. 1): the break falls after 2014, so occurrence rose in the middle of the decade, and 2017 is only the most extreme year within an already elevated regime, with a surface saline lake in 46 % of its matched casts (Fig. 4A).
Figure 4B compares the two climatological periods rather than the years before and after the step, and shows that the change is seasonal. Between 1950–1999 and 2000–2025, summer occurrence rises from 1.7 % (3 of 180 matched casts) to 34.4 % (303 of 880) and autumn occurrence from 3.8 % to 13.9 %, whereas winter occurrence stays at or below 1.3 % in both periods, indicating that winter mixing did not weaken comparably. The properties of the detected cores, pooled over all seasons of each period, differ too (Fig. 4C–F): in 2000–2025 the median core sits at 19 m against 31 m in 1950–1999, with a much stronger temperature gradient (median −0.63 against −0.20 °C m−1) and density step, while the salinity gradient that defines the feature is unchanged. Most of that contrast, however, reflects the shift of the detections into summer, when cores are shallow and sharply capped: summer holds 63 % of the 2000–2025 detections against 9 % of the 1950–1999 ones.
Finally, resolution alone does not explain the historical rarity. The coarser part of the historical archive could not have detected these features at all. However, even among the historical casts that could detect them, the matched casts of the 1990s, occurrence was far rarer: 2.1 %, against 19.0 % of the matched casts of 2016–2025, all months counted. The increase is therefore real, and the resolution-matched casts are the ones that measure its size.
3.6 Steric decomposition: the net contribution is negative
Thermosteric and halosteric height are decomposed separately from the Argo record over the 2014–2024 window of Sect. 2.8, the most recent decade with near-continuous float coverage (116 of 126 months). Over 0–1000 m (Table 3) the thermosteric trend is +9.80 ± 2.71, the halosteric − 15.21 ± 2.33 and the net mm yr−1 (Fig. A2): halosteric contraction dominates, and the steric term acts to lower local sea level rather than to raise it. Whether the net is distinguishable from zero depends on the window. On three longer windows that all run to December 2025, the net over 0–1000 m is negative in the central estimate but not distinguishable from zero: −1.2 mm yr−1 on the whole Argo record from April 2010, −1.4 from January 2012 and −2.2 mm yr−1 from January 2014. The structure of the decomposition is the same on every window tested, a significantly positive thermosteric trend opposed by a halosteric trend of at least comparable size, but the significantly negative net is a property of the well-sampled 2014–2024 decade.
Integration depth explains most of the apparent disagreement with published Mediterranean values. Recomputed on the 0–400 m layer used by Mohamed and Skliris (2022), the thermosteric rate is +2.26 ± 1.37 mm yr−1 against their eastern Mediterranean mean of +2.13 ± 0.41: the rates agree once the layers match, and the 0–1000 m rate is larger because three quarters of the southern Adriatic thermosteric signal lies below 400 m. The halosteric terms do not agree ( in the southern Adriatic against −0.75 ± 0.19 in the eastern Mediterranean), and that difference is real rather than methodological: Adriatic salinification over 2014–2024 far exceeds the eastern Mediterranean mean over 1993–2019.
In the 600–1000 m layer, on the same 2014–2024 window, the thermosteric and halosteric trends are each well determined, +5.7 ± 0.9 and −5.6 ± 1.0 mm yr−1 respectively, and they compensate almost exactly, so that the net, +0.1 ± 0.5 mm yr−1, is consistent with zero. This near-cancellation of two well-determined terms, rather than the small residual, is the steric counterpart of the deep density result of Sect. 3.1, where the thermal and haline effects on density also compensate.
These are decadal rates from Argo floats alone, over a window that spans the post-2017 episode of deep-water renewal (Sect. 4.2), and they are not secular climate trends, since deep renewal is episodic (Fig. 6). For comparison with the longer record, the thermosteric and halosteric differences between the 1950–1999 and 2000–2025 climatologies of Sect. 2.2 are also expressed as rates. The casts entering the two climatologies cluster in the 1990s and the 2010s, with mean years 1993 and 2014, so the effective separation between them is 21 years, not the 50 between the period starts. Divided by those 21 years, the thermosteric difference is +7.4 and the halosteric −7.0 mm yr−1, with a net of +0.4 mm yr−1 whose sign changes with the season and the data source. The halosteric term of 2014–2024 is about 2.2 times its climatological counterpart and the thermosteric term 1.3 times, so the recent decade differs from the longer record mainly in its halosteric term.
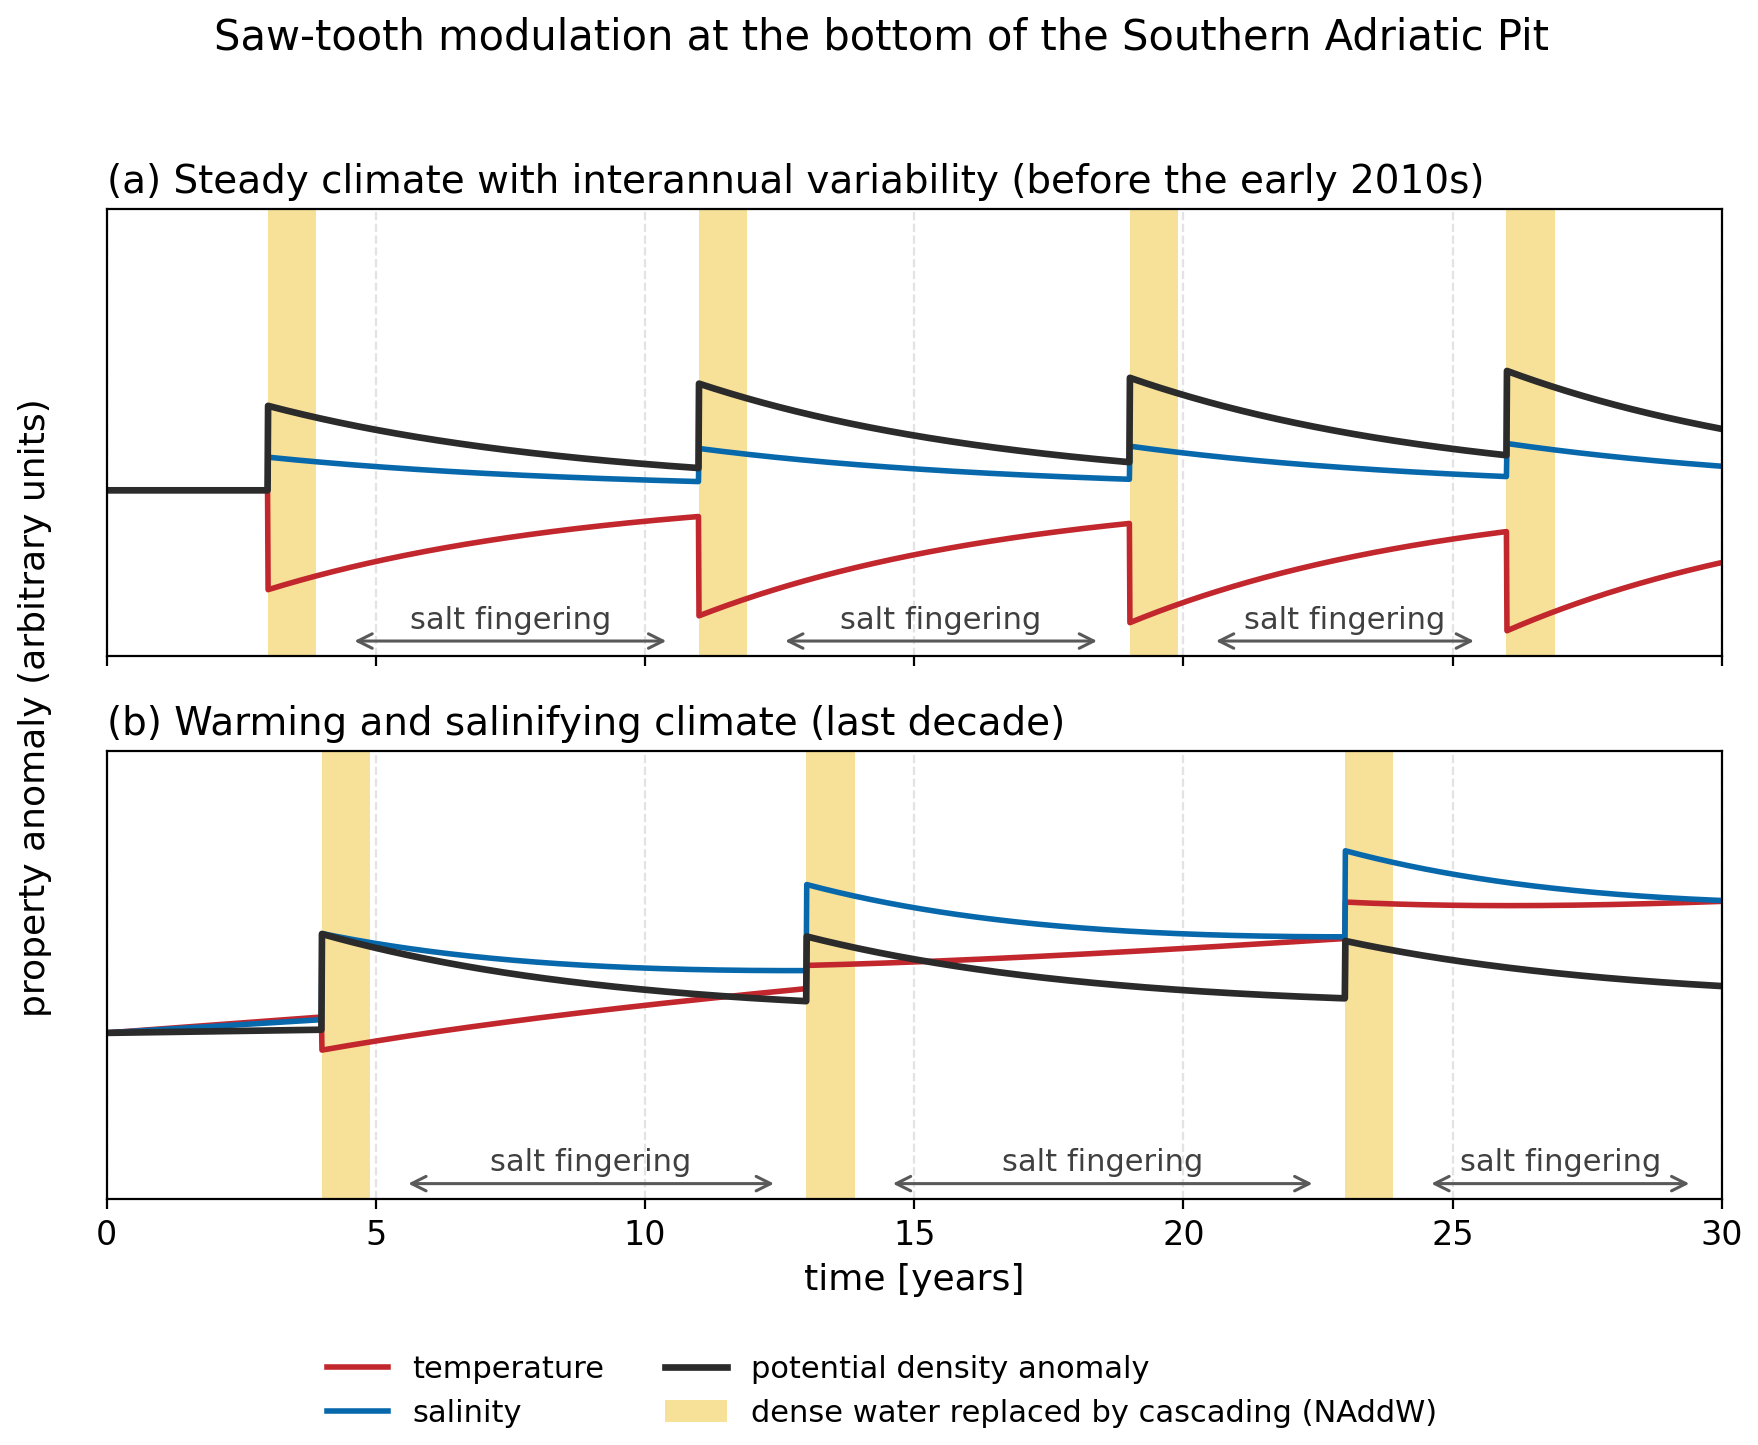
Figure 6Schematic saw-tooth modulation of temperature, salinity and potential density anomaly at the bottom of the Southern Adriatic Pit. (a) Before the early 2010s, after Querin et al. (2016): each cascading event delivers cold water, so density rises mainly through the thermal term. (b) Under the warming and salinifying climate of the last decade (Terzić et al., 2025a): cascading water is only weakly cooled but much saltier, the density step is smaller, and the record has an underlying warming and salinifying drift; the temperature step no longer has a fixed sign. Yellow bars mark the replacement of resident deep water by cascading North Adriatic Dense Water; between them, properties relax under double-diffusive and other mixing. Salt fingering is marked only between events, when the deep layer is not being replaced, and only intermittently, because fingers transport salt only when the density ratio is low (Sect. 3.7).
3.7 Salt fingering: the change is below the LIW core
The double-diffusive diagnostics behave differently above and below the base of the classical LIW core (Table 6, Fig. 7).
Table 6Salt-finger diagnostics by layer in the Southern Adriatic Pit, from 757 Argo profiles taken before 2017 (257) and from 2017 onward (500). Extent: percentage of levels in the salt-finger regime; vigour: percentage of those levels with Rρ<2; both are means across profiles. N2: median across profiles of each profile's median. p: two-sided Mann–Whitney test on the per-profile values; values below 0.05 in bold. The last row (italics) is the 350–550 m layer of the EMSO-E2M3A mooring (Sect. 4.2); it overlaps the layers above and is given for comparison only

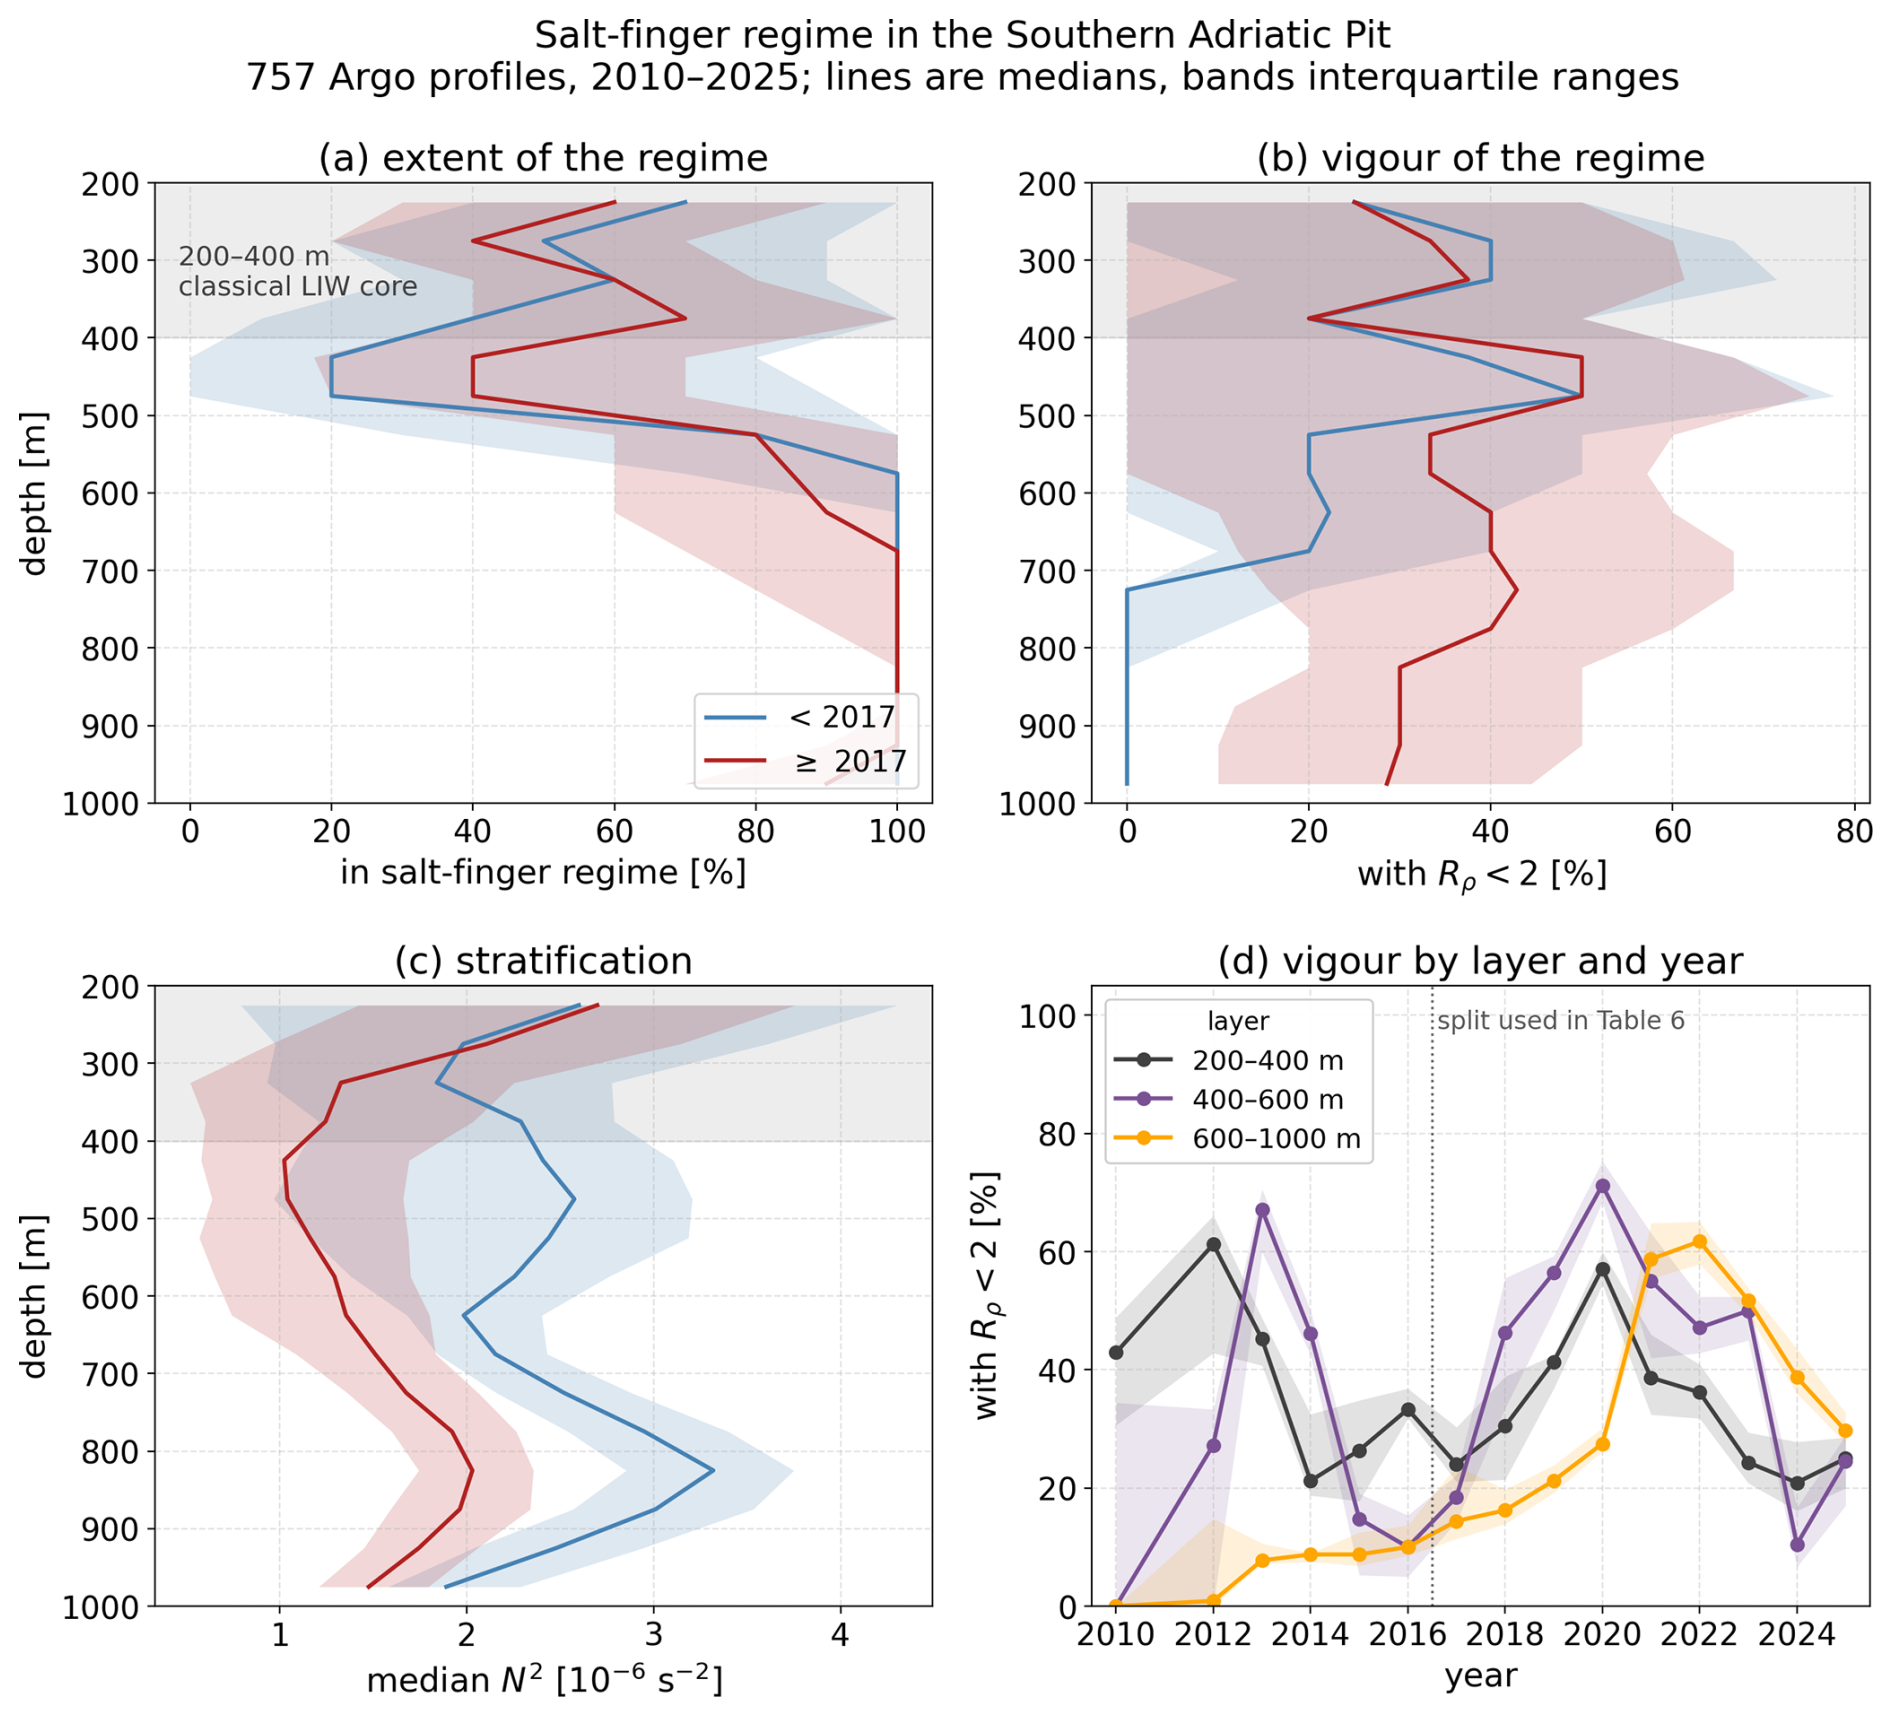
Figure 7Salt-finger regime in the Southern Adriatic Pit from 757 Argo profiles, 2010–2025, before 2017 and from 2017 onward (Sect. 2.9). Lines are medians across profiles in 50 m depth bins, bands the interquartile range. (a) Extent of the regime: fraction of each bin in the salt-finger regime. (b) Vigour: fraction of the finger-regime levels with Rρ<2. (c) Median N2. The grey band is the classical 200–400 m LIW salinity-maximum range. (d) Median per-profile vigour in the three layers of Sect. 2.9, year by year, with 95 % bootstrap bands over profiles; years with fewer than eight profiles are omitted, and the dotted line marks the split used in Table 6.
Within the core itself, over 200–400 m, neither the extent nor the vigour of the regime (Sect. 2.9) shows a change that can be distinguished from sampling variability. The extent is 55.3 % before 2017 and 56.0 % after (p=0.9); the vigour is 34.6 % against 32.3 % (p=0.17). The only significant change within the core is a weakening of the stratification, the median N2 falling by 16 %.
Below the core the picture changes. Over 400–600 m the extent of the regime rises from 56.6 % to 60.3 % (p=0.03) and its vigour from 28.0 % to 39.0 % (), while the median N2 falls by 56 %, from to s−2. In the deep layer, 600–1000 m, the regime already occupied 92.1 % of levels before 2017 and edges down to 87.7 % after; what changes there is vigour, and it changes more than anywhere else, from 10.7 % to 37.4 % (). The deep layer was thus finger-favourable in both periods, but only after 2017 did a large part of it reach the density ratios at which fingers transport salt. The two layers differ in how far their change depends on the split year. At 400–600 m the layer was already vigorous in 2013–2014, with annual median vigour of 67 and 46 % (Fig. 7d), so a split at 2016 shows no change in vigour (36 against 35 %), whereas a split at any year from 2017 to 2020 does. The deep-layer contrast, however, holds for every split year from 2016 to 2020 (), and the core shows no change for any of them.
This depth structure matches that of the salinity maxima in Sect. 3.4. Between the 1950–1999 and 2000–2025 periods the median depth of the deeper salinity maximum increased from 205 to 333 m, that is, from the top of the classical core towards its lower part. The share of deeper maxima lying at 400 m or deeper rose from 16 % to 43 %, and the share at 400–600 m from 11 % to 34 %. Fingering intensified in the layers into which a growing share of the deeper maxima has moved, and did not change in the core, where the share of deeper maxima fell from 37 % to 23 %. The stratification weakened alongside: from the Argo profiles before 2017 to those from 2017 onward, N2 per profile falls significantly in all three layers, by 16 %, 56 % and 32 % at 200–400, 400–600 and 600–1000 m respectively.
The intensification does not coincide with 2017 (Fig. 7d). In the deep layer (600–1000 m) the jump in the median vigour per profile comes only in 2021–2023: the vigour is below 1 % in 2010–2012, 8 %–10 % in 2013–2016, 14 % in 2017 and 28 % in 2020, then 52 %–62 % in 2021–2023, and it relaxes to 30 % in 2025. In the 400–600 m layer the rise comes earlier than in the deep layer, from 18 % in 2017 to 71 % in 2020, so the intensification reaches the layer below the core before the deep layer, which is the order a downward transfer of salt requires. In the core (200–400 m) the extent of the regime, 60 %–83 % in 2017–2020, fell to 30 % in 2025, which is why its post-2017 mean is no higher than the pre-2017 one.
Two additional checks test the robustness of these results. First, the tests of Table 6 treat profiles as independent; when they are repeated on annual means, only the deep layer's increase in vigour and fall of N2 remain significant (both p=0.0004). Second, the float profiles have more levels in the later years (at 600–1000 m the median spacing is 24 dbar before 2017 and 10 dbar from 2017), so the two periods do not resolve the gradients alike; with gradients taken over 25 dbar throughout, coarser than either spacing, the vigour still rises below the core and not within it. The contrast between the core and the layers below it therefore rests on vigour, and the firm result, the one that survives both checks, is the rise in vigour of the deep layer.
4.1 A coupled advective and local mechanism
The results are consistent with remote and local mechanisms acting together, and with neither alone. Eastern Mediterranean source water is becoming progressively warmer and saltier, and it supplies an increasingly saline reservoir at the southern boundary (Skliris et al., 2025; Schroeder et al., 2017). Local preconditioning determines how and where that salt is redistributed within the basin: reduced river discharge lowers the Adriatic freshwater budget (Verri et al., 2024), and Mihanović et al. (2021) document the exceptional salinities of 2017 and their basin-scale preconditioning. We have no observational budget for evaporation or winter mixing, but the seasonal breakdown of Sect. 3.5 places the local preconditioning in the warm season: between the 1950–1999 and 2000–2025 climatologies, surface saline lake occurrence rose sharply in summer and autumn but not in winter, so the local mechanism acts on the summer surface layer rather than on winter convection.
The salinity-maximum result constrains the mechanism further. Between the two climatological periods the deeper maximum stayed near its isopycnal, which is what advection of a denser saline core into a warming basin would produce, while the shallower one became much lighter as it salinified, which requires a different and shallower source. The two maxima are thus two pathways rather than one migrating feature, and a single-core description cannot represent both. Mihanović et al. (2021) see the same split in the 2015–2017 episode: new high-salinity water arrived nearer the surface from 2015, while the saline core deepened. The changes they see are far larger than the shifts in our period medians, however, because they track individual floats through a particular sequence of years, whereas we take medians over multi-decadal periods.
Placing the maxima relative to the LIW core needs a reference depth for that core, and the LIW depths reported for the Mediterranean vary too much between regions to supply one. The intermediate salinity maximum lies at 200–500 m for the Mediterranean as a whole and at 300–800 m in the western basin (Schroeder and Chiggiato, 2022), while Argo places it at 200–600 m Mediterranean-wide (Kubin et al., 2019) and at about 100–250 m in the eastern Mediterranean over 2015–2017 (Fach et al., 2021). The classical southern Adriatic description places it at 200–400 m (Artegiani et al., 1997), and this Adriatic-specific range is the one on which the test of Sect. 3.4 and the depth layers of Sect. 3.7 are based.
One hypothesis follows, consistent with the present data though not established by them: the depth-dependence of the amplification (Sect. 3.3) is the signature of the two salt pathways identified above from the salinity maxima, one at depth and one near the surface. Thermal amplification grows with depth because renewal of the deep layers is episodic, whereas the upper layers exchange heat with the atmosphere fast enough that their warming does not exceed the Mediterranean median; haline amplification is present through the column because salt arrives both at the surface and at depth. Two further results are consistent with this reading: the Adriatic–Ionian sector is also where Terzić and Vilibić (2026c) find acceleration to peak Mediterranean-wide (Sect. 3.3), and the double-diffusive result of Sect. 3.7 has the matching depth structure, with the intensification below the core rather than within it.
4.2 Density, sea level and ventilation
The steric decomposition bears directly on local sea level. With a net steric contribution of −5.4 ± 2.5 mm yr−1 over 0–1000 m in 2014–2024, the steric term opposes rather than drives local sea level rise, so any observed rise in the Southern Adriatic must be mass-driven. This is consistent with Verri et al. (2024), who attribute the recent northern Adriatic sea level decline to a regional water deficit. The result rests on a single Argo decade: the net is significantly negative over 2014–2024, but on windows extending to 2025 it is not distinguishable from zero (Sect. 3.6), so whether the negative net persists cannot be settled from this record.
Deep ventilation of the pit is episodic. From moorings over 2012–2022, Le Meur et al. (2025) identify gravity currents reaching the deep Southern Adriatic in only four years, 2012, 2017, 2018 and 2022; the first followed an exceptionally strong and prolonged bora outbreak that formed very cold, dense water (Mihanović et al., 2013). Deep properties therefore respond as a series of steps rather than as a gradual drift: each event resets them, and they then relax again (Fig. 6). The 600–1000 m thermosteric and halosteric trends of Sect. 3.6 are each significant on their own, but this saw-tooth is why a decade cannot show whether they are secular. The temperature step of each reset has also changed sign: in the earlier regime (Querin et al., 2016) cascading water arrived cold and cooled the deep layer, whereas since 2017 it arrives only weakly cooled but much saltier, and leaves the layer warmer and saltier than it found it (Terzić et al., 2025a). Because saline water needs less cooling to sink, this shift toward haline-driven dense water formation could sustain ventilation under milder winters: dense water would still form and sink. The water that sinks is then warmer and contains less oxygen (Ingrosso et al., 2017; Chiarini et al., 2022), so each event could equally deliver less oxygen to the deep layer and degrade ventilation. Our data do not show which of the two effects prevails.
The double-diffusive diagnostics point to another mechanism, besides cascading, that can carry salt into the deep layer, and it has been active in the recent decade. Salt fingering has intensified below the classical LIW core and not within it, that is, in the layers into which a growing share of the deeper salinity maxima has moved (Sect. 3.7) and in which the stratification has weakened. It has become more effective at 400–600 m, where the salt now arrives, though there the before-and-after contrast depends on the year at which the record is split. In the deep layer below, 600–1000 m, nearly all levels were already finger-favourable before 2017, and the fraction in which fingers actually transport salt has more than tripled since. Salt descending out of the core meets a column newly capable of carrying it further down, though we have not measured a flux.
Amorim et al. (2024) report the same transition from the EMSO-E2M3A mooring in this pit: across the winter of 2016/17, the share of their observations with finger-favourable conditions rose from 27 % to 72 %. Their layer, 350–550 m, straddles the base of the core, which is where we also find the change. Recomputed on that layer, our two diagnostics rise as well, the extent from 48.6 % to 56.9 % and the vigour from 29.1 % to 36.9 % (Table 6), although in our data the rise is significant only when profiles are treated as independent (Sect. 3.7). The agreement cannot be taken further, because a mooring that samples one position continuously and a float array that samples the pit every few days do not measure the same quantity.
4.3 Biogeochemical and ecological implications
The following are plausible pathways by which the changes reported above may affect biogeochemistry and ecosystems; they are not effects quantified here.
A near-surface salinity maximum has two competing effects on vertical exchange and our analysis resolves neither. It stabilises the upper column, which acts to suppress exchange of oxygen, nutrients and carbon with the intermediate layers (Jacox and Edwards, 2011; Breitburg et al., 2018; Bourgeois et al., 2022), with consequences for production, microbial food webs and air–sea exchange of carbon dioxide (Cantoni et al., 2024; Martellucci et al., 2025b). But salinity decreasing with depth beneath the maximum is itself finger-favourable, so the same feature may instead promote downward transport. Our diagnostics begin at 200 m and cannot say which dominates in the surface layer; dedicated observations there are required. Elevated salinity may also affect the organisms directly: the record salinities of 2017 coincided with markedly lower bacterial production and lower abundances of most picoplankton groups than in the preceding decade (Beg Paklar et al., 2020).
Likewise, whether the redistribution of the intermediate maxima promotes or suppresses production depends on the upstream history of the inflowing water: on whether its nutrients were drawn down in the euphotic zone before it entered the basin (Ozer et al., 2022; Reich et al., 2026). Our results do not resolve this.
For ecosystems, documented impacts and projected vulnerabilities should be kept apart. Three effects have been observed in the Adriatic: mass mortality linked to warming (Kružić et al., 2016), mussel mortality in coastal waters (Capriotti et al., 2025), and redistribution of benthic species toward northern coastlines (Matić-Skoko et al., 2022; Bellin and Rossi, 2024). Others remain projections: that further redistribution will be constrained by the basin's semi-enclosed geometry and by the limited cold-water refugia of the middle Adriatic depressions (Chiarini et al., 2022; Carlot et al., 2025), with consequences for the fisheries that exploit those depressions (Martinelli et al., 2023; Kamberi et al., 2025). For aquaculture (Cetinić, 2024; Haberle et al., 2024), the relevant change is the bottom-water warming and salinification documented in Sect. 3.1.
4.4 Limitations
The comparisons between periods rest on a changing observing system, and we have controlled for this where it is testable – by resolution matching and the degradation experiment for SSL detection, by re-sampling to the historical standard depths for the salinity maxima, and by cruise day clustering for the climatological differences – but not everywhere. Northern Adriatic salinity remains the weakest element, because 20th-century sampling is concentrated on the western side of a basin with a strong east–west salinity gradient. The Argo-based steric results describe the Southern Adriatic Pit over 2014–2024, and the Argo-based double-diffusive results over 2010–2025. A decade to a decade and a half cannot separate a long-term climate trend from the episodic cycle of deep renewal.
The larger gap is that this is an ocean-side analysis throughout: we establish when the changes occurred and how they are distributed in the vertical, but not what forced them. Wintertime turbulent heat flux anomalies over the northern Adriatic water mass formation region do not share a common cooling signature across the recent cascading years. Relative to the 1980–2010 baseline, 2018 and 2022 show positive anomalies, that is, weaker heat loss, so the density required for cascading in those years cannot have come from heat loss alone (Terzić et al., 2025a). That is consistent with the mechanism of Sect. 4.1, but the flux estimate is coarse: the reanalysis behind it underestimates the cooling along the bora jets (Denamiel et al., 2021), where much of the relevant heat loss occurs. Establishing how much of the change reported here follows from bora frequency, evaporation and river discharge requires a dedicated surface-flux and freshwater budget over the water mass formation regions, resolved finely enough to capture the jets. Until that is done, the mechanism of Sect. 4.1 remains a hypothesis rather than an attribution.
The analyses presented here support three findings. First, southern Adriatic salinification between 1950–1999 and 2000–2025 is significant at all 88 depth–season combinations, and warming at 94 % of them. The exceptions are the five near-surface summer and autumn levels, where the two periods are sampled differently (Sect. 3.1). The amplification relative to the rest of the Mediterranean (the ratio of the southern Adriatic rate to the median rate of the other Mediterranean sub-basins over 2000–2025; Sect. 3.3) is depth-dependent. For temperature it is absent above 200 m and reaches 6.2-fold at 700–1200 m, whereas for salinity it is present through the whole column, 4.3-fold at the surface and 3.7-fold at 700–1200 m. Second, the increase in near-surface salinity maxima is a genuine level shift after 2014, seen in ship and float records alike: occurrence rises from 5 % to 38 % of warm-season casts, and the shift is only provable if vertical resolution and platform are accounted for. Resolution matters because the coarser part of the historical archive could not have detected these features at all. However, resolution alone does not explain the historical rarity: even among the historical casts that could detect them, occurrence was far rarer than among modern casts of comparable resolution, 2.1 % in the 1990s against 19.0 % in 2016–2025. Third, the intermediate salinity maximum has lost its dominant band: between 1950–1999 and 2000–2025 the share of detected maxima within 100–200 m falls from 41 % to 16 %, while the share of casts with two maxima is unchanged. Where two coexist they move apart in depth: the deeper one descends from a median of 205 to 333 m, while the shallower one rises from 82 to 64 m. In density, the deeper one stays close to its isopycnal, whereas only the shallower one becomes markedly lighter as it salinifies, which points to a different and shallower source.
Two further results concern the consequences of the added salt: one for local sea level, one for the transport of salt to depth. The steric contribution in the Southern Adriatic Pit over 2014–2024 is −5.4 ± 2.5 mm yr−1, negative rather than positive, so local sea level rise over that decade must be mass-driven; on the longer windows extending to 2025 this net steric contribution is not distinguishable from zero. Moreover, salt fingering has intensified below the classical intermediate core and not within it. The change is in vigour more than in extent, is most firmly established at 600–1000 m, and is accompanied by a weakening of stratification measurable in N2. A growing share of the deeper salinity maxima has descended into these same layers below the core (Sect. 3.7), which are therefore also the layers newly able to carry salt further down.
The consequences for ventilation, biogeochemistry and ecosystems remain hypotheses. Testing them requires sustained in situ observing at a vertical resolution able to resolve the features described here, and high-resolution coupled physical–biogeochemical modelling able to represent episodic deep renewal. It would also benefit from an update of the SeaDataNet Mediterranean aggregation, which currently ends in 2019 and holds no shipborne cast in the southern Adriatic after 2015. The six years of shipborne hydrography after 2019 are exactly the years in which the changes reported here developed, and at present only Argo and the Croatian monitoring casts cover them.
This appendix collects three analyses that support choices made in the main text. Figure A1 documents the vertical resolution of the southern Adriatic archive over time and the degradation experiment that justifies restricting the surface saline lake series to resolution-matched casts (Sects. 2.5 and 3.5). Figure A2 shows the steric time series behind Table 3 and the reason its confidence intervals are wide (Sect. 2.8). Figure A3 repeats the double-maximum detection of Sect. 3.4 across its free parameters, to show which conclusions hold under every setting (Sect. 2.7).
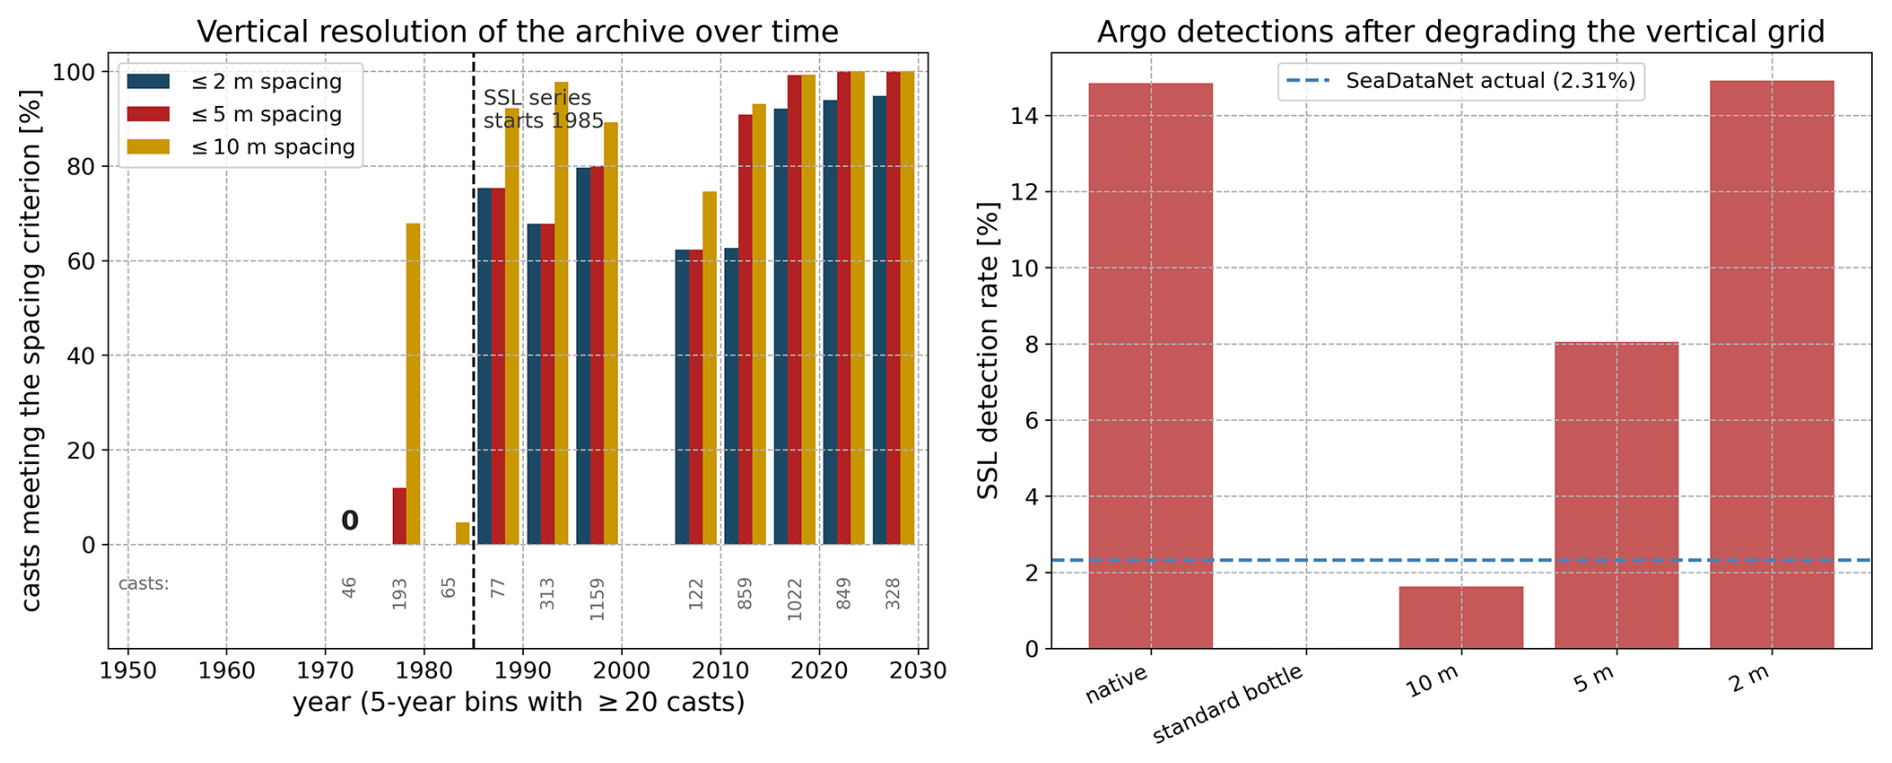
Figure A1Vertical resolution of the southern Adriatic archive and its effect on surface saline lake detection. Left: percentage of SeaDataNet and Argo casts per five-year bin whose median level spacing in 0–100 m meets each criterion; bins with fewer than 20 casts are omitted, labels give the number of casts, and “0” marks a bin that has casts but none meeting any criterion. Occurrence is plotted from 1985 (dashed line; Sect. 2.6). Right: the degradation experiment, in which Argo profiles are re-sampled onto coarser vertical grids and the detection is re-applied (Sect. 3.5); the dashed line is the detection rate among the SeaDataNet casts with at least eight levels in the upper 100 m.
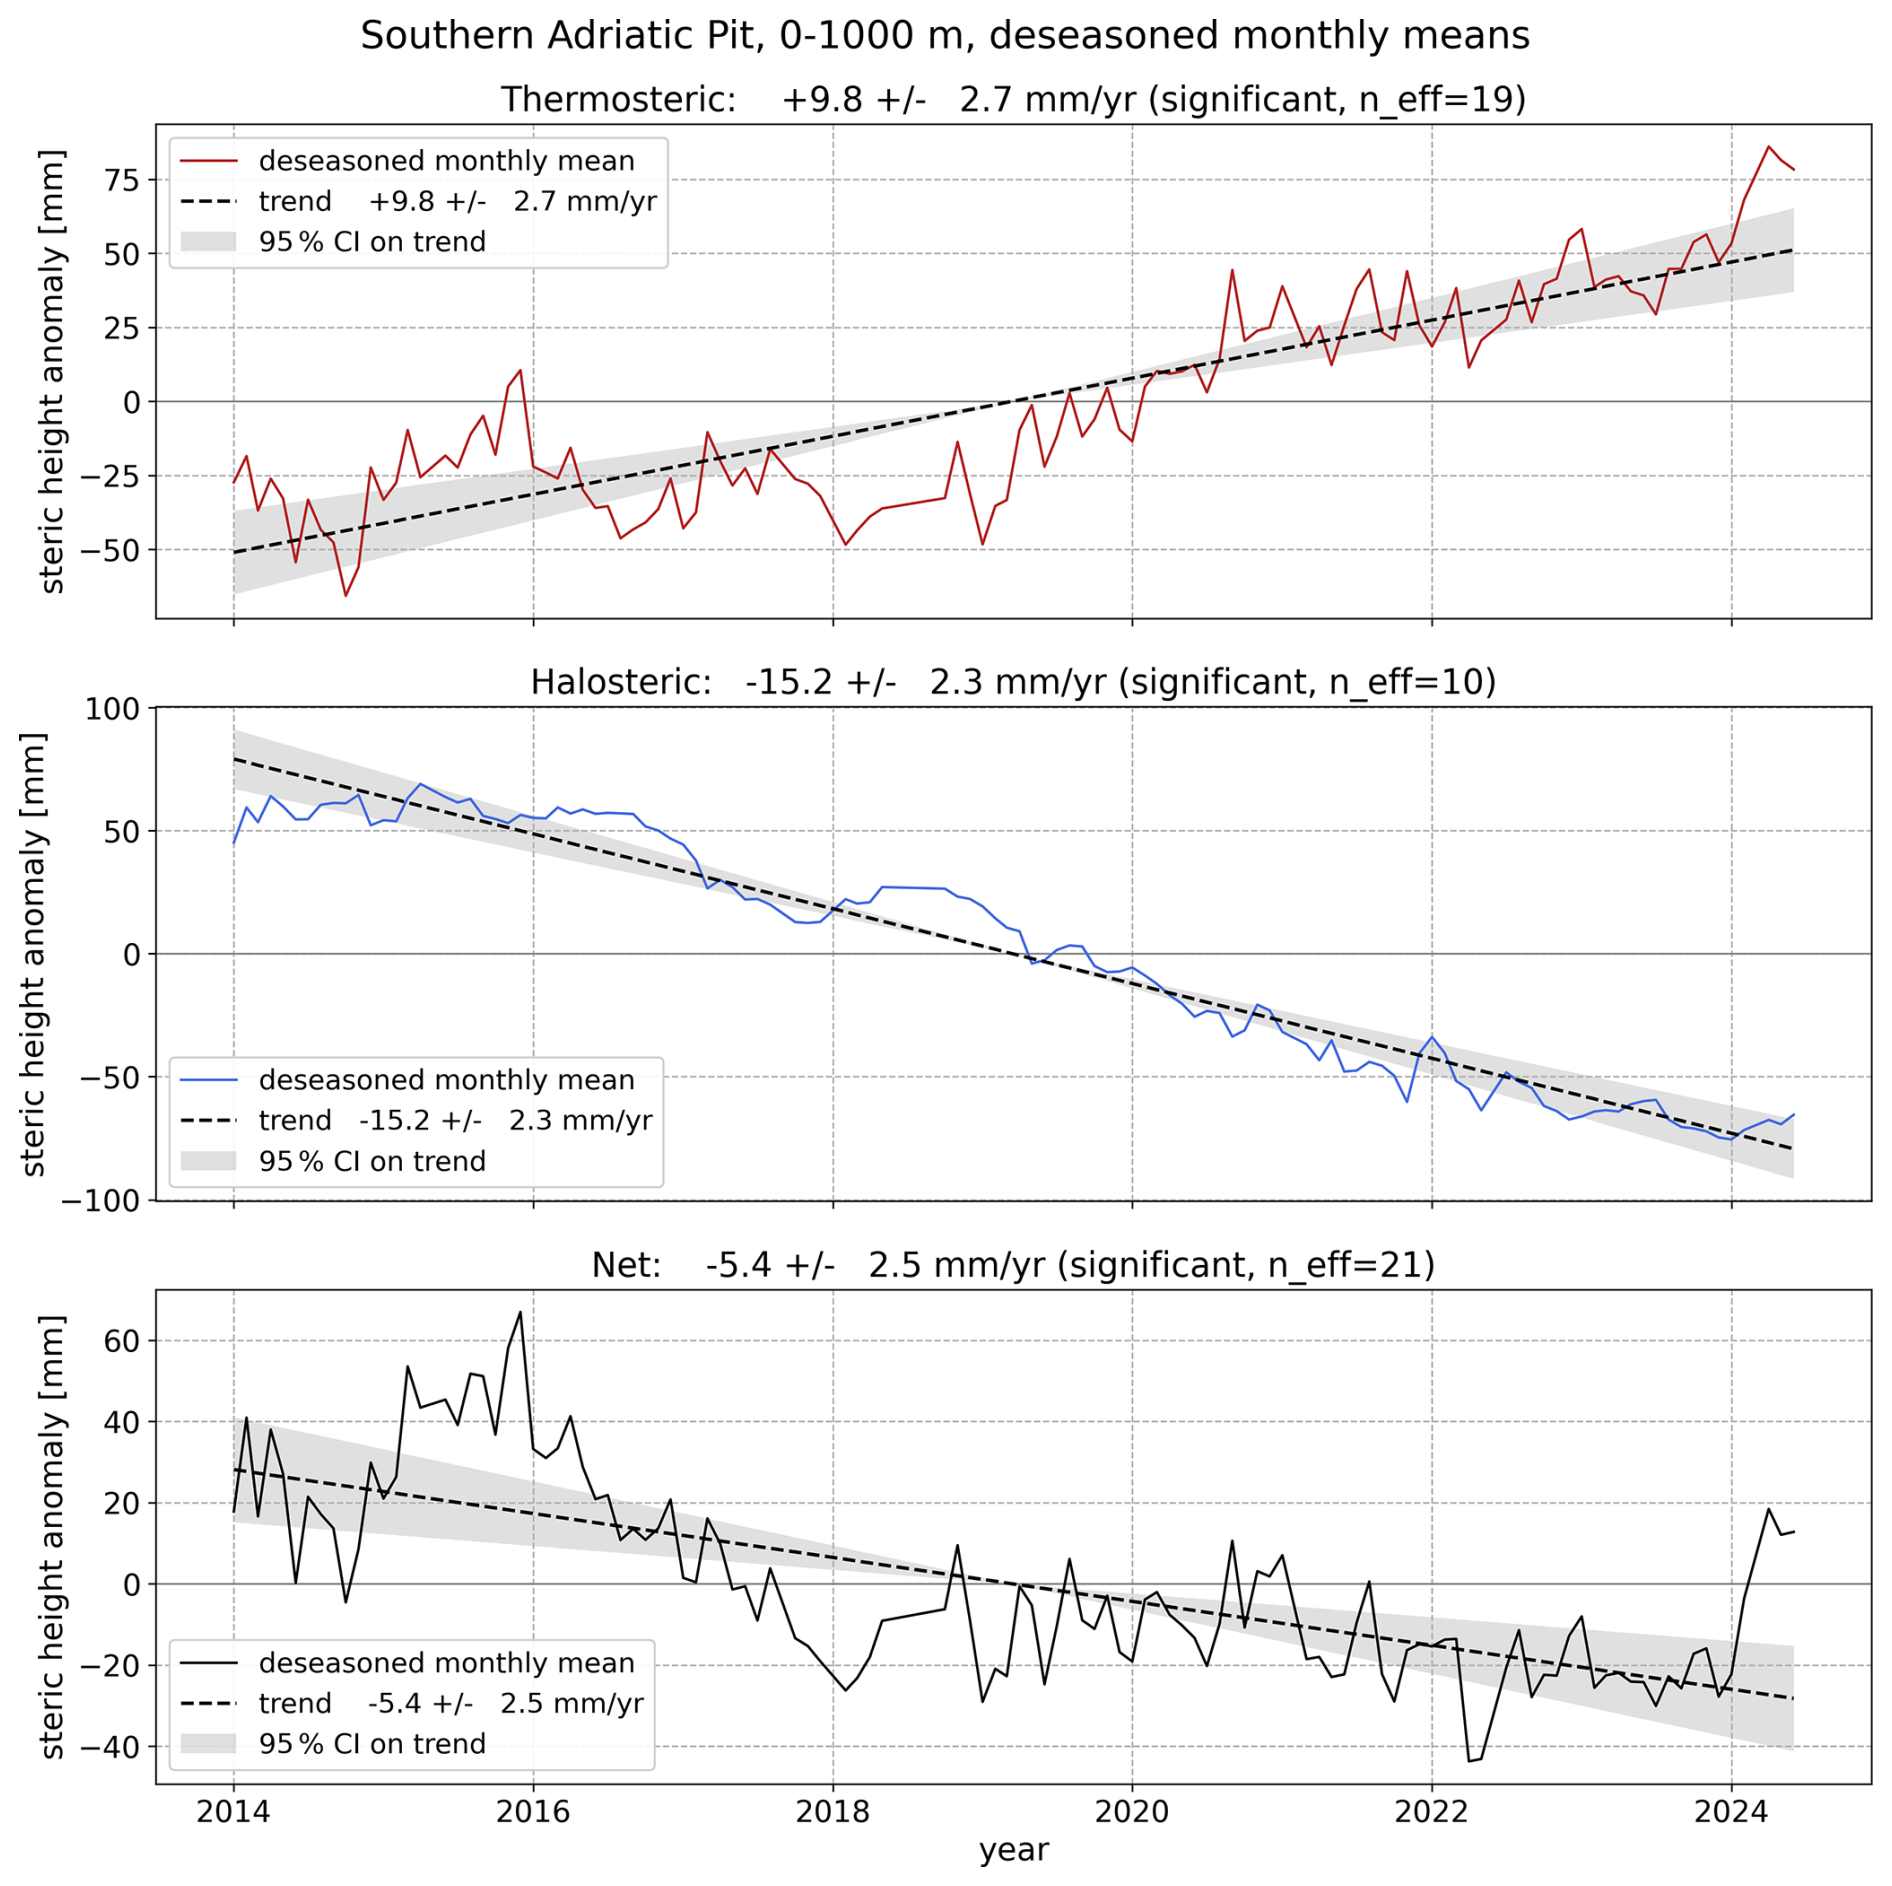
Figure A2Thermosteric, halosteric and net steric height in the Southern Adriatic Pit over January 2014 to June 2024 (Table 3), as deseasonalised monthly anomalies about each series mean, with fitted trends and 95 % confidence bands corrected for residual autocorrelation (Sect. 2.8).
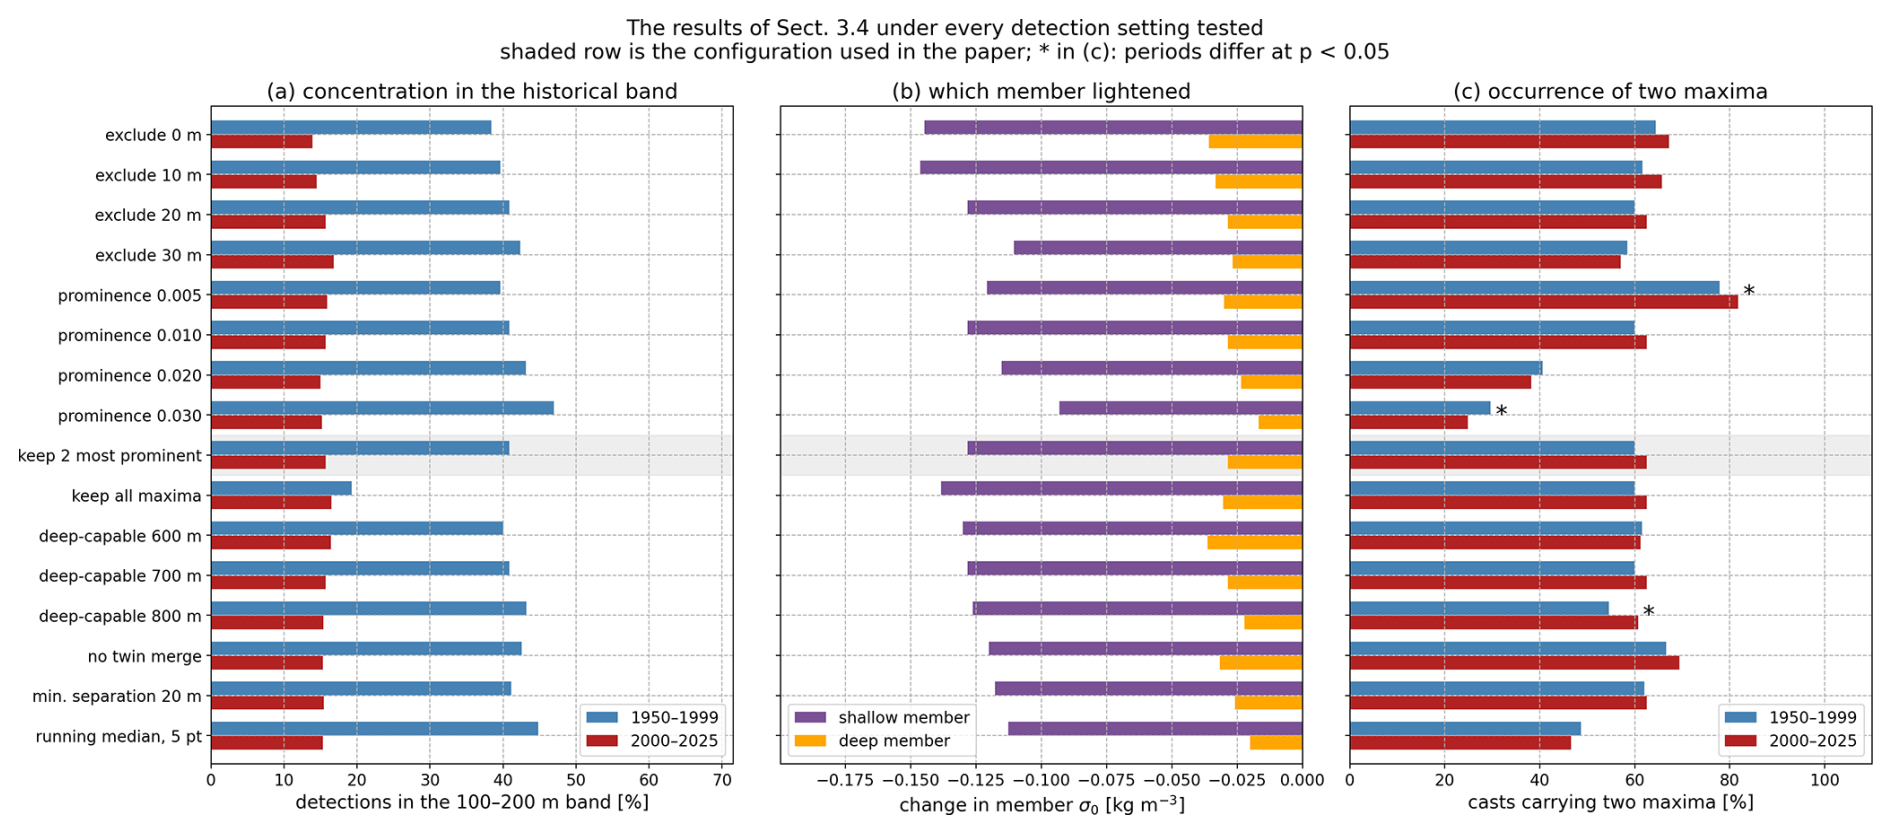
Figure A3Sensitivity of the two results of Sect. 3.4 to the detection settings (Sect. 2.7): the depth above which maxima are ignored, the prominence threshold, the number of maxima kept per cast, the depth a cast must reach, and the treatment of noise on a crest (no merging; a 20 m minimum separation between retained maxima; a five-point running median of the profile). Each row varies one setting. The configuration used in the paper is shaded; it recurs, unshaded, as the default row of the exclusion, prominence and deep-capable groups, so the sixteen rows hold thirteen distinct configurations. (a) Share of detected maxima in the 100–200 m band. (b) Change in σ0 of each member between the periods. (c) Share of casts with two maxima; an asterisk marks a significant difference between the periods (p<0.05, χ2).
The cleaned in situ data are archived on Zenodo by Terzić and Vilibić (2026a) (https://doi.org/10.5281/zenodo.20345373), the Mediterranean-wide processing pipeline by Terzić and Vilibić (2026b) (https://doi.org/10.5281/zenodo.20410481) and the analysis code and derived tables specific to this paper by Terzić and Vilibić (2026d) (https://doi.org/10.5281/zenodo.23016822). The SeaDataNet Mediterranean aggregated dataset SDC_MED_DATA_TS_V2 is available from https://www.seadatanet.org (last access: 12 December 2025). Argo data are freely available from the International Argo Program (https://argo.ucsd.edu, last access: 10 January 2026) and were accessed through argopy.
ET: conceptualisation, methodology, formal analysis, investigation, data curation, software, visualisation, writing – original draft, writing – review and editing. IV: conceptualisation, methodology, writing – original draft, writing – review and editing, funding acquisition.
The contact author has declared that neither of the authors has any competing interests.
Publisher's note: Copernicus Publications remains neutral with regard to jurisdictional claims made in the text, published maps, institutional affiliations, or any other geographical representation in this paper. The authors bear the ultimate responsibility for providing appropriate place names. Views expressed in the text are those of the authors and do not necessarily reflect the views of the publisher.
We thank the two anonymous reviewers and the topical editor for their careful reading and for comments and suggestions that greatly improved the article. We are grateful to all researchers who developed the concepts and collected the observations on which this study rests. We acknowledge the provision of temperature and salinity data by the SeaDataNet Pan-European Infrastructure, the Institute of Oceanography and Fisheries, the Ruđer Bošković Institute, and Italian marine research institutions. The Argo data were collected and made freely available by the International Argo Program and the national programs that contribute to it (https://argo.ucsd.edu, last access: 10 January 2026, https://www.ocean-ops.org, last access: 10 January 2026); the Argo Program is part of the Global Ocean Observing System. The authors used Claude (Anthropic) between August and November 2026 for coding, for improving the clarity of text drafted by the authors, and for drafting revised passages.
This research was supported by the Croatian Science Foundation through projects GLOMETS (grant no. IP-2022-10-3064) and C3PO (grant no. IP-2022-10-9139) and the incoming mobility scheme for postdoctoral researchers (grant no. MOBDOL-2023-12), the Interreg Italy–Croatia Programme 2021–2027 project AdriaClimPlus (grant no. ITHR0200333), and the EU NextGeneration project AdriaClimRisk (grant no. PK.3.4.17.0001).
This paper was edited by Mario Hoppema and reviewed by two anonymous referees.
Amorim, F. L. L., Le Meur, J., Wirth, A., and Cardin, V.: Tipping of the double-diffusive regime in the southern Adriatic Pit in 2017 in connection with record high-salinity values, Ocean Sci., 20, 463–474, https://doi.org/10.5194/os-20-463-2024, 2024. a, b
Artegiani, A., Bregant, D., Paschini, E., Pinardi, N., Raicich, F., and Russo, A.: The Adriatic Sea general circulation. Part I: Air–sea interactions and water mass structure. J. Phys. Oceanogr., 27, 1492–1514, https://doi.org/10.1175/1520-0485(1997)027<1492:TASGCP>2.0.CO;2, 1997. a, b, c, d
Beg Paklar, G., Vilibić, I., Grbec, B., Matić, F., Mihanović, H., Džoić, T., Šantić, D., Šestanović, S., Šolić, M., Ivatek-Šahdan, S., and Kušpilić, G.: Record-breaking salinities in the middle Adriatic during summer 2017 and concurrent changes in the microbial food web. Prog. Oceanogr., 185, 102345, https://doi.org/10.1016/j.pocean.2020.102345, 2020. a, b
Bellin, N. and Rossi, V.: Modeling the effects of climate change on the habitat suitability of Mediterranean gorgonians, Biodivers. Conserv., 33, 929–948, https://doi.org/10.1007/s10531-024-02779-z, 2024. a
Bourgeois, T., Goris, N., Schwinger, J., and Tjiputra, J. F.: Stratification constrains future heat and carbon uptake in the Southern Ocean between 30° S and 55° S. Nat. Commun., 13, 340, https://doi.org/10.1038/s41467-022-27979-5, 2022. a
Breitburg, D., Levin, L. A., Oschlies, A., Grégoire, M., Chavez, F. P., and Conley, D. J.: Declining oxygen in the global ocean and coastal waters, Science, 359, 6371, https://doi.org/10.1126/science.aam7240, 2018. a
Bretherton, C. S., Widmann, M., Dymnikov, V. P., Wallace, J. M., and Bladé, I.: The effective number of spatial degrees of freedom of a time-varying field, J. Climate, 12, 1990–2009, https://doi.org/10.1175/1520-0442(1999)012<1990:TENOSD>2.0.CO;2, 1999. a
Buljan, M. and Zore-Armanda, M.: Hydrographic data on the Adriatic Sea collected in the period from 1952 through 1964, Acta Adriat., 12, 1–438, 1966. a
Buljan, M. and Zore-Armanda, M.: Hydrographic properties of the Adriatic Sea in the period from 1965 through 1970, Acta Adriat., 20, 1–368, 1979. a
Cantoni, C., De Vittor, C., Faganeli, J., Giani, M., Kovač, N., and Malej, A.: Carbonate system and acidification of the Adriatic Sea, Mar. Chem., 267, 104462, https://doi.org/10.1016/j.marchem.2024.104462, 2024. a
Capriotti, M., Bracchetti, L., Cocci, P., Mazzocchi, V., Fazzini, M., Corvaro, F., and Palermo, F. A.: In situ investigation of ecological and molecular stress mechanisms triggered by marine heat waves in Adriatic populations of the Mediterranean mussel, Diversity, 17, 385, https://doi.org/10.3390/d17060385, 2025. a
Carlot, J., Galobart, C., Gómez-Gras, D., Santamaría, J., Golo, R., Sini, M., Cebrian, E., Gerovasileiou, V., Ponti, M., Turicchia, E., Comeau, S., Rilov, G., Tamburello, L., Pulido Mantas, T., Cerrano, C., Ledoux, J.-B., Gattuso, J.-P., Ramirez-Calero, S., Millan, L., Montefalcone, M., Katsanevakis, S., Bensoussan, N., Garrabou, J., and Teixidó, N.: Vulnerability of benthic trait diversity across the Mediterranean Sea following mass mortality events. Nat. Commun., 16, 1571, https://doi.org/10.1038/s41467-025-55949-0, 2025. a
Cetinić, A. B.: Shellfisheries in Croatia: from manual collection to contemporary practices, Naše More, 71, 154–165, https://doi.org/10.17818/NM/2024/3.8, 2024. a
Chiarini, M., Guicciardi, S., Zacchetti, L., Domenichetti, F., Canduci, G., Angelini, S., Belardinelli, A., Croci, C., Giuliani, G., Scarpini, P., Santojanni, A., Medvešek, D., Isajlović, I., Vrgoč, N., and Martinelli, M.: Short-term evaluation of changes in fisheries management measures in the Pomo/Jabuka Pits area, Sustainability, 14, 7742, https://doi.org/10.3390/su14137742, 2022. a, b
Civitarese, G., Gačić, M., Lipizer, M., and Eusebi Borzelli, G. L.: On the impact of the Bimodal Oscillating System (BiOS) on the biogeochemistry and biology of the Adriatic and Ionian Seas (Eastern Mediterranean), Biogeosciences, 7, 3987–3997, https://doi.org/10.5194/bg-7-3987-2010, 2010. a
Civitarese, G., Gačić, M., Batistić, M., Bensi, M., Cardin, V., Dulčić, J., Garić, R., and Menna, M.: The BiOS mechanism: History, theory, implications. Prog. Oceanogr., 216, 103056, https://doi.org/10.1016/j.pocean.2023.103056, 2023. a
Cushman-Roisin, B. and Korotenko, K. A.: Mesoscale-resolving simulations of summer and winter bora events in the Adriatic Sea, J. Geophys. Res.-Oceans, 112, C11S91, https://doi.org/10.1029/2006JC003516, 2007. a
Denamiel, C., Tojčić, I., and Vilibić, I.: Balancing accuracy and efficiency of atmospheric models in the northern Adriatic during severe bora events, J. Geophys. Res.-Atmos., 126, e2020JD033516, https://doi.org/10.1029/2020JD033516, 2021. a
Fach, B. A., Orek, H., Yilmaz, E., Tezcan, D., Salihoglu, I., Salihoglu, B., and Latif, M. A.: Water mass variability and Levantine Intermediate Water formation in the Eastern Mediterranean between 2015 and 2017, J. Geophys. Res.-Oceans, 126, e2020JC016472, https://doi.org/10.1029/2020JC016472, 2021. a
Gačić, M., Civitarese, G., Miserocchi, S., Cardin, V., Crise, A., and Mauri, E.: The open-ocean convection in the Southern Adriatic: a controlling mechanism of the spring phytoplankton bloom, Cont. Shelf Res., 22, 1897–1908, https://doi.org/10.1016/S0278-4343(02)00050-X, 2002. a
Gačić, M., Eusebi Borzelli, G. L. E., Civitarese, G., Cardin, V., and Yari, S.: Can internal processes sustain reversals of the ocean upper circulation? The Ionian Sea example, Geophys. Res. Lett., 37, L09608, https://doi.org/10.1029/2010GL043216, 2010. a
GEBCO Compilation Group: GEBCO 2024 Grid, British Oceanographic Data Centre [data set], https://doi.org/10.5285/1c44ce99-0a0d-5f4f-e063-7086abc0ea0f, 2024. a
Haberle, I., Hackenberger, D. K., Djerdj, T., Bavčević, L., Geček, S., Hackenberger, B. K., Marn, N., Klanjšček, J., Purgar, M., Pečar Ilić, J., and Klanjscek, T.: Effects of climate change on gilthead seabream aquaculture in the Mediterranean, Aquaculture, 578, 740052, https://doi.org/10.1016/j.aquaculture.2023.740052, 2024. a
Holt, J., Katavouta, A., Hopkins, J., Amoudry, L. O., Appendini, C. M., Arneborg, L., Arnold, A., Artioli, Y., Aucan, J., Berx, B., Cagigal, L., De Dominicis, M., Denamiel, C., Galli, G., Graham, J. A., Jacobs, Z., Jevrejeva, S., Kamranzad, B., Langlais, C., Larsen, M. A. D., Lira-Loarca, A., Lyddon, C., Mathis, M., Melet, A., Méndez, F., Muis, S., Myers, P., O’Donovan, M., Olbert, A. I., Palmer, M. D., Phillips, L., Polton, J., Pozo Buil, M., Robins, P., Ruju, A., Schlaefer, J. A., Senatore, A., Siedlecki, S., Tinker, J., Verri, G., Vilibić, I., Wei, X., and Pinardi, N.: Future climate projections in the global coastal ocean, Prog. Oceanogr., 235, 103497, https://doi.org/10.1016/j.pocean.2025.103497, 2025. a
Ingrosso, G., Bensi, M., Cardin, V., and Giani, M.: Anthropogenic CO2 in a dense water formation area of the Mediterranean Sea, Deep-Sea Res. Pt. I, 123, 118–128, https://doi.org/10.1016/j.dsr.2017.04.004, 2017. a
IOC, SCOR and IAPSO: The international thermodynamic equation of seawater – 2010: Calculation and use of thermodynamic properties, IOC Manuals and Guides No. 56, UNESCO, Paris, https://doi.org/10.25607/OBP-1662, 2010. a, b
Jacox, M. G. and Edwards, C. A.: Effects of stratification and shelf slope on nutrient supply in coastal upwelling regions, J. Geophys. Res.-Oceans, 116, C03019, https://doi.org/10.1029/2010JC006547, 2011. a
Juza, M., Fernández-Mora, À., and Tintoré, J.: Sub-regional marine heat waves in the Mediterranean Sea from observations: long-term surface changes, sub-surface and coastal responses, Front. Mar. Sci., 9, 785771, https://doi.org/10.3389/fmars.2022.785771, 2022. a
Kamberi, E., Hala, E., and Möllmann, C.: Evidence of climate-driven regime shifts in Adriatic Sea fisheries, Sci. Mar., 89, e108, https://doi.org/10.3989/scimar.05566.108, 2025. a
Kružić, P., Rodić, P., Popijač, A., and Sertić, M.: Impacts of temperature anomalies on mortality of benthic organisms in the Adriatic Sea, Mar. Ecol., 37, 1190–1209, https://doi.org/10.1111/maec.12293, 2016. a
Kubin, E., Poulain, P.-M., Mauri, E., Menna, M., and Notarstefano, G.: Levantine intermediate and Levantine deep water formation: an Argo float study from 2001 to 2017, Water, 11, 1781, https://doi.org/10.3390/w11091781, 2019. a
Kunze, E.: Limits on growing, finite-length salt fingers: a Richardson number constraint, J. Mar. Res., 45, 533–556, 1987. a
Le Meur, J., Wirth, A., de Mendoza, F. P., Miserocchi, S., and Cardin, V.: Intermittent supply of dense water to the deep South Adriatic Pit: an observational study, Front. Mar. Sci., 12, 1516780, https://doi.org/10.3389/fmars.2025.1516780, 2025. a, b
Manca, B. B., Burca, M., Giorgetti, A., Coatanoan, C., Garcia, M. J., and Iona, A.: Physical and biochemical averaged vertical profiles in the Mediterranean regions: an important tool to trace the climatology of water masses and to validate incoming data from operational oceanography, J. Marine Syst., 48, 83–116, https://doi.org/10.1016/j.jmarsys.2003.11.025, 2004. a, b
Marini, M., Russo, A., Paschini, E., Grilli, F., and Campanelli, A.: Short-term physical and chemical variations in the bottom water of middle Adriatic depressions, Clim. Res., 31, 227–237, https://doi.org/10.3354/cr031227, 2006. a
Martellucci, R., Dentico, C., Coppola, L., Skjelvan, I., Giani, M., Pensieri, S., Cantoni, C., Cardin, V., Fourrier, M., Bozzano, R., Paulsen, M., and Mauri, E.: Air–sea CO2 exchange in the Eastern Atlantic and the Mediterranean Sea based on autonomous surface measurements, Front. Mar. Sci., 12, 1633617, https://doi.org/10.3389/fmars.2025.1633617, 2025b. a
Martinelli, M., Zacchetti, L., Belardinelli, A., Domenichetti, F., Scarpini, P., Penna, P., Medvešek, D., Isajlović, I., and Vrgoč, N.: Changes in abundance and distribution of the sea pen, Funiculina quadrangularis, in the central Adriatic Sea (Mediterranean basin) in response to variations in trawling intensity, Fishes, 8, 347, https://doi.org/10.3390/fishes8070347, 2023. a
Matić-Skoko, S., Pavičić, M., Šepić, J., Janeković, I., Vrdoljak, D., Vilibić, I., Stagličić, N., Šegvić-Bubić, T., and Vujević, A.: Impacts of sea bottom temperature on CPUE of European lobster Homarus gammarus (Linnaeus, 1758; Decapoda, Nephropidae) in the Eastern Adriatic Sea, Front. Mar. Sci., 9, 891197, https://doi.org/10.3389/fmars.2022.891197, 2022. a
Maze, G. and Balem, K.: argopy: A Python library for Argo ocean data analysis, J. Open Source Softw., 5, 2425, https://doi.org/10.21105/joss.02425, 2020. a
Mihanović, H., Vilibić, I., Carniel, S., Tudor, M., Russo, A., Bergamasco, A., Bubić, N., Ljubešić, Z., Viličić, D., Boldrin, A., Malačič, V., Celio, M., Comici, C., and Raicich, F.: Exceptional dense water formation on the Adriatic shelf in the winter of 2012, Ocean Sci., 9, 561–572, https://doi.org/10.5194/os-9-561-2013, 2013. a
Mihanović, H., Vilibić, I., Šepić, J., Matić, F., Ljubešić, Z., Mauri, E., Gerin, R., Notarstefano, G., and Poulain, P.-M.: Observation, preconditioning and recurrence of exceptionally high salinities in the Adriatic Sea, Front. Mar. Sci., 8, 672210, https://doi.org/10.3389/fmars.2021.672210, 2021. a, b, c, d, e
Mohamed, B. and Skliris, N.: Steric and atmospheric contributions to interannual sea level variability in the eastern Mediterranean Sea over 1993–2019, Oceanologia, 64, 50–62, https://doi.org/10.1016/j.oceano.2021.09.001, 2022. a, b
Ozer, T., Rahav, E., Gertman, I., Sisma-Ventura, G., Silverman, J., and Herut, B.: Relationship between thermohaline and biochemical patterns in the Levantine upper and intermediate water masses, Southeastern Mediterranean Sea (2013–2021), Front. Mar. Sci., 9, 958924, https://doi.org/10.3389/fmars.2022.958924, 2022. a
Pranić, P., Denamiel, C., Janeković, I., and Vilibić, I.: Multi-model analysis of the Adriatic dense-water dynamics, Ocean Sci., 19, 649–670, https://doi.org/10.5194/os-19-649-2023, 2023. a, b
Querin, S., Bensi, M., Cardin, V., Solidoro, C., Bacer, S., Mariotti, L., Stel, F., and Malačič, V.: Saw-tooth modulation of the deep-water thermohaline properties in the southern Adriatic Sea, J. Geophys. Res.-Oceans, 121, 4585–4600, https://doi.org/10.1002/2015JC011522, 2016. a, b
Reich, T., Belkin, N., Sisma-Ventura, G., Hauzer, H., Berman-Frank, I., and Rahav, E.: Does oligotrophy favor chemoautotrophy over photoautotrophy?, Prog. Oceanogr., 241, 103633, https://doi.org/10.1016/j.pocean.2025.103633, 2026. a
Richardson, C. M., Peucker-Ehrenbrink, B., Wyatt, S., Bourbonnais, A., Hatje, V., Frey, C., Sanders, T., Varela, D. E., and Paytan, A.: Effects of climate change on river and groundwater nutrient inputs to the coastal ocean, Commun. Earth Environ., 6, 761, https://doi.org/10.1038/s43247-025-02594-6, 2025. a
Roether, W., Manca, B. B., Klein, B., Bregant, D., Georgopoulos, D., Beitzel, V., Kovačević, V., and Luchetta, A.: Recent changes in eastern Mediterranean deep waters, Science, 271, 333–335, https://doi.org/10.1126/science.271.5247.333, 1996. a
Schlitzer, R., Roether, W., Oster, H., Junghans, H.-G., Hausmann, M., Johannsen, H., and Michelato, A.: Chlorofluoromethane and oxygen in the Eastern Mediterranean, Deep-Sea Res., 38, 1531–1551, https://doi.org/10.1016/0198-0149(91)90088-W, 1991. a
Schmitt, R. W.: Double diffusion in oceanography, Annu. Rev. Fluid Mech., 26, 255–285, https://doi.org/10.1146/annurev.fl.26.010194.001351, 1994. a
Schroeder, K. and Chiggiato, J. (Eds.): Oceanography of the Mediterranean Sea: An Introductory Guide, Elsevier, Amsterdam, 558 pp., https://doi.org/10.1016/C2020-0-00371-3, 2022. a
Schroeder, K., Chiggiato, J., Josey, S. A., Borghini, M., Aracri, S., and Sparnocchia, S.: Rapid response to climate change in a marginal sea, Sci. Rep., 7, 4065, https://doi.org/10.1038/s41598-017-04455-5, 2017. a, b
SeaDataNet: Data quality control procedures, version 2.0, https://www.seadatanet.org/content/download/596/file/SeaDataNet_QC_procedures_V2_(May_2010).pdf (last access: 11 November 2026), 2010. a
Simoncelli, S., Schaap, D., and Schlitzer, R.: Mediterranean Sea – Temperature and salinity Historical Data Collection SeaDataCloud V2 (SDC_MED_DATA_TS_V2), SeaDataNet [data set], https://doi.org/10.12770/2a2aa0c5-4054-4a62-a18b-3835b304fe64, 2020. a
Skliris, N., Marsh, R., Breedon, M., and Josey, S. A.: Accelerated warming and salinification of the Mediterranean Sea: Implications for dense water formation, J. Mar. Sci. Eng., 13, 25, https://doi.org/10.3390/jmse13010025, 2025. a
Terzić, E. and Vilibić, I.: Cleaned Adriatic in situ hydrographic data (1952–2023) for a Mediterranean thermohaline acceleration analysis, Zenodo [data set], https://doi.org/10.5281/zenodo.20345373, 2026a. a, b
Terzić, E. and Vilibić, I.: MedClim analysis code for Mediterranean thermohaline acceleration analysis, Zenodo [code], https://doi.org/10.5281/zenodo.20410481, 2026b. a, b
Terzić, E. and Vilibić, I.: Observational evidence for accelerated warming and salinification propagating into the deep Mediterranean, Geophys. Res. Lett., 53, e2026GL124518, https://doi.org/10.1029/2026GL124518, 2026c. a, b, c, d, e, f, g, h
Terzić, E. and Vilibić, I.: Analysis code for “Recent thermohaline shifts in the Adriatic Sea and their potential consequences”, Zenodo [code], https://doi.org/10.5281/zenodo.23016822, 2026d. a, b
Terzić, E., Cardin, V., Le Meur, J., Dunić, N., Vodopivec, M., and Vilibić, I.: Unprecedented warming and salinization observed in the deep Adriatic, Limnol. Oceanogr. Lett., 10, 888–898, https://doi.org/10.1002/lol2.70051, 2025a. a, b, c, d
Terzić, E., Gardiol, C., and Vilibić, I.: Surface saline lakes in the Mediterranean Sea, Ocean Sci., 21, 1441–1459, https://doi.org/10.5194/os-21-1441-2025, 2025b. a, b
Tintoré, J., Pinardi, N., Álvarez-Fanjul, E., Aguiar, E., Álvarez- Berastegui, D., Bajo, M., Balbin, R., Bozzano, R., Buongiorno Nardelli, B., Cardin, V., Casas, B., Charcos-Llorens, M., Chiggiato, J., Clementi, E., Coppini, G., Coppola, L., Cossarini, G., Deidun, A., Deudero, S., D'Ortenzio, F., Drago, A., Drudi, M., El Serafy, G., Escudier, R., Farcy, P., Federico, I., Fernández, J. G., Ferrarin, C., Fossi, C., Frangoulis, C., Galgani, F., Gana, S., García Lafuente, J., García Sotillo, M., Garreau, P., Gertman, I., Gómez-Pujol, L., Grandi, A., ayes, D., Hernández-Lasheras, J., Herut, B., Heslop, E., Hilmi, K., Juza, M., Kallos, G., Korres, G., Lecci, R., Lazzari, P., Lorente, P., Liubartseva, S., Louanchi, F., Malačič, V., Mannarini, G., March, D., Marullo, S., Mauri, E., Meszaros, L., Mourre, B., Mortier, L., Muñoz-Mas, C., Novellino, A., Obaton, D., Orfila, A., Pascual, A., Pensieri, S., Pérez Gómez, B., Pérez Rubio, S., Perivoliotis, L., Petihakis, G., Petit de la Villéon, L., Pistoia, J., Poulain, P.-M., Pouliquen, S., Prieto, L., Raimbault, P., Reglero, P., Reyes, E., Rotllan, P., Ruiz, S., Ruiz, J., Ruiz, I., Ruiz- Orejón, L. F., Salihoglu, B., Salon, S., Sammartino, S., Sánchez Arcilla, A., Sánchez-Román, A., Sannino, G., Santoleri, R., Sardá, R., Schroeder, K., Simoncelli, S., Sofianos, S., Sylaios, G., Tanhua, T., Teruzzi, A., Testor, P., Tezcan, D., Torner, M., Trotta, F., Umgiesser, G., von Schuckmann, K., Verri, G., Vilibić, I., Yucel, M., Zavatarelli, M., and Zodiatis, G.: Challenges for sustained observing and forecasting systems in the Mediterranean Sea, Front. Mar. Sci., 6, 568, https://doi.org/10.3389/fmars.2019.00568, 2019. a
Verri, G., Furnari, L., Gunduz, M., Senatore, A., Santos da Costa, V., De Lorenzis, A., Fedele, G., Manco, I., Mentaschi, L., Clementi, E., Coppini, G., Mercogliano, P., Mendicino, G., and Pinardi, N.: Climate projections of the Adriatic Sea: role of river release, Front. Climate, 6, 1368413, https://doi.org/10.3389/fclim.2024.1368413, 2024. a, b
Vilibić, I., Matijević, S., Šepić, J., and Kušpilić, G.: Changes in the Adriatic oceanographic properties induced by the Eastern Mediterranean Transient, Biogeosciences, 9, 2085–2097, https://doi.org/10.5194/bg-9-2085-2012, 2012. a
Vilibić, I., Zemunik, P., Šepić, J., Dunić, N., Marzouk, O., Mihanović, H., Denamiel, C., Precali, R., and Djakovac, T.: Present climate trends and variability in thermohaline properties of the northern Adriatic shelf, Ocean Sci., 15, 1351–1362, https://doi.org/10.5194/os-15-1351-2019, 2019. a
Vilibić, I., Pranić, P., and Denamiel, C.: North Adriatic Dense Water: lessons learned since the pioneering work of Mira Zore-Armanda 60 years ago, Acta Adriat., 64, 53–78, https://doi.org/10.32582/aa.64.1.11, 2023. a
Wagawa, T., Igeta, Y., and Abe, S.: Warming and springtime freshening trend in the southeastern Sea of Japan revealed by observational data, Geophys. Res. Lett., 52, e2025GL118631, https://doi.org/10.1029/2025GL118631, 2025. a
Wang, G., Cheng, L., Boyer, T., and Li, C.: Halosteric sea level changes during the Argo era, Water, 9, 484, https://doi.org/10.3390/w9070484, 2017. a
Wong, A., Keeley, R., and Carval, T., and the Argo Data Management Team: Argo Quality Control Manual for CTD and Trajectory Data, Version 3.7, Ifremer, https://doi.org/10.13155/33951, 2023. a
Zore-Armanda, M.: Les masses d’eau de la mer Adriatique, Acta Adriat., 10, 5–88, 1963. a
Zore-Armanda, M., Bone, M., Dadić, V., Morović, M., Ratković, D., Stojanoski, L., and Vukadin, I.: Hydrographic properties of the Adriatic Sea in the period from 1971 through 1983, Acta Adriat., 32, 1–547, 1991. a