
the Creative Commons Attribution 4.0 License.
the Creative Commons Attribution 4.0 License.
 | 21 Oct 2026
Contrasting physical drivers of chlorophyll a responses to summer marine heatwaves in the South China Sea
Yunlu Fang

Yicheng Chen
Peiliang Li
Mingyang Li
In recent years, more frequent marine heatwaves (MHWs) in the South China Sea (SCS) have affected surface chlorophyll a (Chl a). Traditional linear statistical methods have limited capacity to identify the contributions of multiple highly interrelated physical drivers in complex oceanic systems. To address this limitation, we applied the Synergistic–Unique–Redundant Decomposition (SURD) method to investigate MHW-related Chl a anomalies from 1998 to 2024. Analyses reveal a marked regional contrast during summer MHWs, with positive Chl a anomalies in the northern SCS and negative anomalies in the western SCS. Although summer thermal extremes in both regions were linked to similar anomalous atmospheric circulations associated with the western North Pacific subtropical high, the local physical mechanisms controlling Chl a responses differed. In the South Vietnam upwelling region, weakened wind forcing reduced Ekman pumping and vertical transport, limiting surface cooling and nutrient replenishment to the euphotic zone, thereby contributing to negative Chl a anomalies. In the Pearl River Estuary, enhanced incident shortwave radiation promoted rapid surface warming, while weakened wind-driven export favoured the nearshore retention of low-salinity plume water. The SURD results suggest that retained plume water likely strengthened surface-layer stratification and maintained relatively nutrient-rich surface conditions, potentially allowing plume retention to act synergistically with cumulative heat stress and favouring positive Chl a anomalies. However, the associated nutrient pathway remains inferred rather than directly demonstrated. These results suggest that besides thermal forcing, Chl a responses to MHWs in marginal seas are also shaped by regional physical pathways.
- Article
(12131 KB) - Full-text XML
-
Supplement
(894 KB) - BibTeX
- EndNote


Under excessive greenhouse gas emissions, the Earth's climate system is experiencing an unprecedented energy imbalance (Robinson et al., 2021; von Schuckmann et al., 2020). As the largest heat sink in the climate system, the ocean has absorbed more than 90 % of the excess heat, contributing to a continued rise in global sea surface temperature (SST) and more frequent marine heatwaves (MHWs) (Cheng et al., 2019). Since the twentieth century, global MHW frequency and mean duration have increased by approximately 34 % and 17 %, respectively (Oliver et al., 2018). As global warming intensifies during the twenty-first century, MHWs are projected to increase nonlinearly in spatial extent (Oliver et al., 2018; Yao et al., 2020), with potentially adverse effects on the marine biosphere, including shellfish diseases and mollusk mortality (Jones et al., 2018; Oliver et al., 2017), coral reef bleaching (Le Nohaïc et al., 2017), functional extinction of kelp forests (Wernberg et al., 2016), harmful algal blooms, and mass strandings of marine mammals and seabirds (Cavole et al., 2016).
Marine phytoplankton underpin global primary productivity and biogeochemical cycles, and their sensitivity to environmental variability is reflected in variations in chlorophyll a (Chl a) (Fernández-González et al., 2022). However, the mechanisms by which MHWs influence Chl a are complex and spatially heterogeneous. Temperature directly influences phytoplankton physiological rates, including growth, which generally increase toward taxon-specific thermal optima and decline once these optima are exceeded (Thomas et al., 2012; Coello-Camba and Agustí, 2017). During boreal summer, the SCS commonly exhibits a pronounced subsurface chlorophyll maximum, with substantial spatial variability in its depth and magnitude (Xu et al., 2022). During the record-breaking 2020 SCS MHW, reduced surface Chl a coincided with increased subsurface Chl a (Zheng et al., 2024), and Chl a responses differed among MHWs with different vertical structures (Yuan et al., 2024). MHW-related changes in vertical Chl a structure have also been reported in other oceanic regions (Li et al., 2025). Surface Chl a alone may therefore not fully capture the underlying biological response. In low-latitude waters, MHW-induced thermal stratification can restrict the vertical transport of subsurface nutrients, leading to declines in Chl a concentrations (Le Grix et al., 2021; Montie et al., 2020; Noh et al., 2022). By contrast, in high-latitude light-limited regions, a shallower mixed layer can enhance phytoplankton blooms by improving light availability within the euphotic zone (Le Grix et al., 2021; Noh et al., 2022). Such spatial variability makes it difficult to generalize or evaluate the ecological impacts of MHWs based on a single physical mechanism.
The South China Sea (SCS), the largest marginal sea in the western Pacific Ocean, is governed by a complex monsoon circulation system and hosts extensive coral reef ecosystems (Li et al., 2011), rendering it highly sensitive to climate change. Observational and reanalysis data identify the SCS as a hotspot for MHWs, with their frequency, duration, and intensity showing significant upward trends (Li et al., 2019; Yao and Wang, 2021). In particular, previous studies have identified the northern SCS continental shelf and the western SCS as active regions of MHW occurrence, with documented regional differences in coastal warming amplitudes and seasonal variability (Wang et al., 2022, 2023). Recent studies have extended this characterization below the sea surface, revealing pronounced subsurface intensification and diverse vertical structures of MHWs in the SCS (Yao and Wang, 2024; Yuan et al., 2024). Despite these advances in characterizing MHW variability in the SCS, their ecological impacts remain less well understood, partly because of methodological challenges.
Previous studies have shown that Chl a responses to MHWs in the SCS are spatially heterogeneous and vary among different oceanographic settings (Chen et al., 2024; He et al., 2023). However, most attribution analyses still rely on traditional linear statistical methods, such as correlation analysis and multiple linear regression. These methods have inherent limitations when applied to complex marine systems where environmental variables are highly interrelated. In particular, they struggle to disentangle overlapping influences among drivers such as SST, wind fields, and mixed layer depth (MLD), and rarely resolve synergistic effects of these factors. Thus, a key scientific question remains unresolved: are Chl a anomalies during MHWs mainly driven by direct thermal effects, or by concurrent changes in the physical environment?
To address these limitations, this study applies the Synergistic–Unique–Redundant Decomposition (SURD) method (Martínez-Sánchez et al., 2024). More recent applications have extended the framework to climate and environmental problems, including Arctic precipitation forecasting, vapor pressure deficit, and meteorological drought (Panja et al., 2025; Han et al., 2025; Ren et al., 2026). Unlike variance attribution in multivariate regression, SURD is based on information theory and quantifies how much uncertainty in a future target is reduced by the selected drivers. The captured information is then decomposed into redundant, unique, and synergistic components, while the remaining target uncertainty is reported separately as the causality leak. This allows us to distinguish independent, overlapping, and joint contributions of physical drivers to Chl a anomalies during MHWs. By applying this framework to the SCS, this study aims to clarify why summer MHW-related Chl a responses differ between the selected regions and to identify the physical pathways associated with these contrasting responses. These results provide a clearer view of regional Chl a variability during MHWs in the SCS and improve our understanding of physical–biological coupling in marginal seas.
The remainder of this paper is organized as follows. Section 2 describes the datasets, MHW identification, Chl a anomaly analysis, and SURD method. Section 3 presents and discusses the spatiotemporal characteristics of MHWs in the SCS, the associated Chl a responses, and the regional physical–biological mechanisms in the Vietnam upwelling area and the Pearl River Estuary. Section 4 summarizes the main conclusions.
2.1 Study area
The SCS is a semi-enclosed basin whose circulation is governed by the East Asian monsoon system (Jiang et al., 2023). The prevailing southwest winds in summer and northeast winds in winter (Liu and Xie, 1999) drive a seasonally reversing basin-scale circulation and shape a range of complex coastal dynamical processes. In recent years, the region has also become a hotspot for MHWs, posing a growing threat to marine ecosystem stability.
This study focuses on two regions within the SCS that represent contrasting oceanographic settings:
The Pearl River Estuary (PRE) and its adjacent waters are located on the northern continental shelf of the SCS (Fig. 1) and represent a typical runoff-dominated estuarine ecosystem. The Pearl River, the second-largest river system in China, delivers substantial summer runoff to the continental shelf, transporting freshwater and terrestrial nutrients (Harrison et al., 2008) that sustain high primary productivity in this region (Ye et al., 2020).
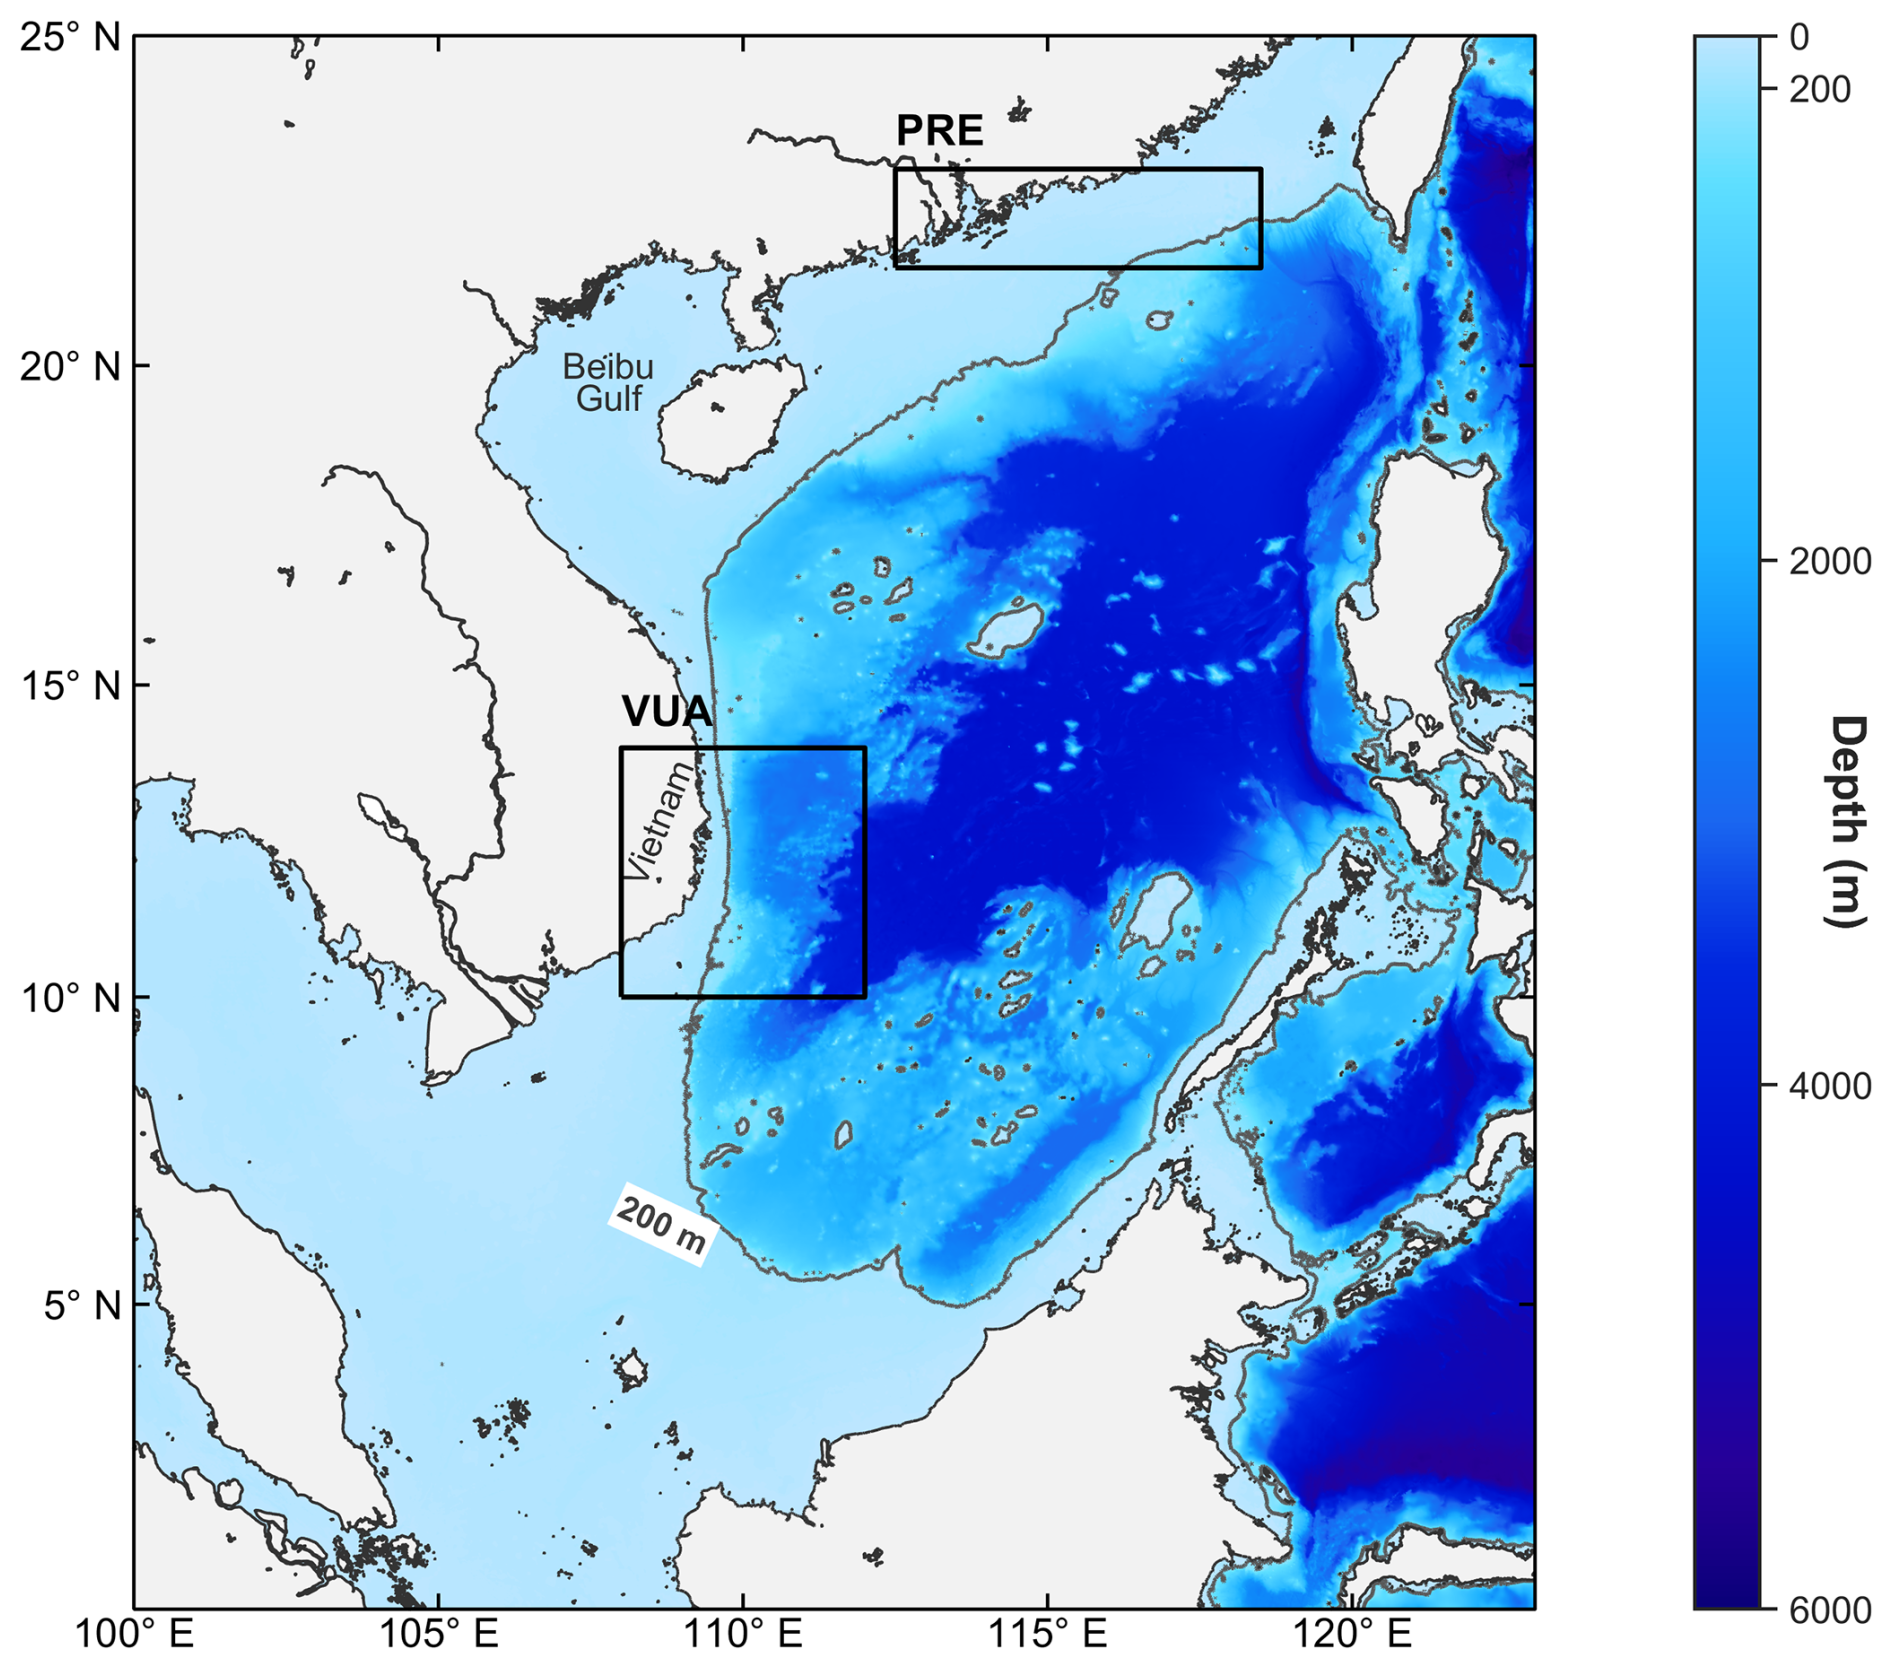
Figure 1Bathymetry of the South China Sea (SCS) and locations of the two study regions. Shading indicates water depth (m), and the grey contour denotes the 200 m isobath. Black rectangles mark the Pearl River Estuary (PRE) and the Vietnam Upwelling Area (VUA).
The Vietnam Upwelling Area (VUA) defined in this study is located off southeastern Vietnam and lies within the broader South Vietnam upwelling region (Fig. 1). It represents a principal summer wind-driven upwelling system of the SCS. The strong summer southwest monsoon generates offshore Ekman transport in this region (Ngo and Hsin, 2021), driving the upwelling of cold subsurface water. This process transports nutrient-rich subsurface water into the euphotic zone, forming a characteristic summer belt of high Chl a concentration (Liu and Tang, 2022).
2.2 Data sources and preprocessing
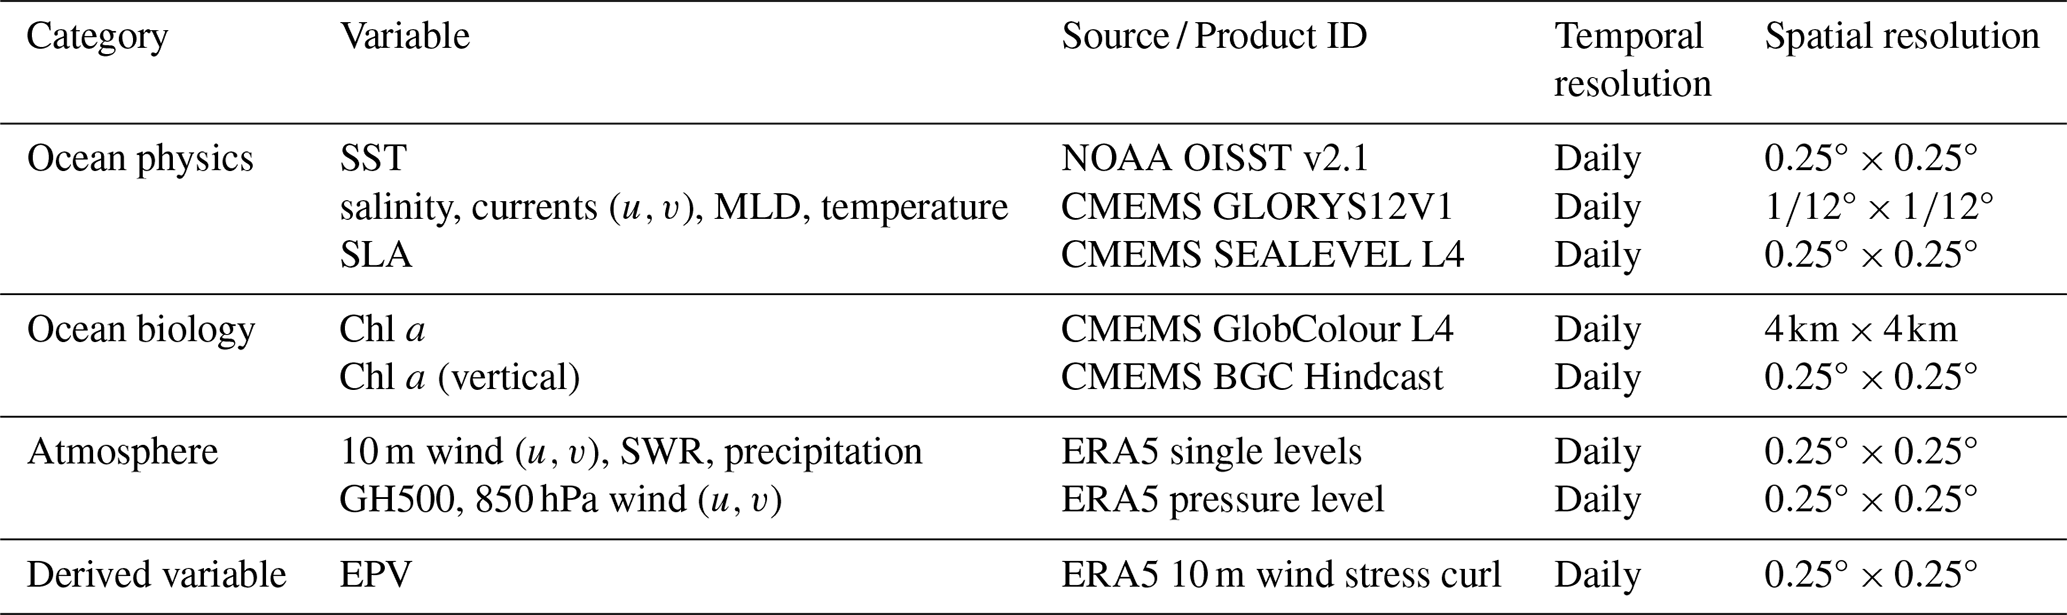
A daily dataset covering 1998 to 2024 was compiled from physical, biological, and atmospheric variables. MHWs were identified using the National Oceanic and Atmospheric Administration (NOAA) Optimum Interpolation Sea Surface Temperature version 2.1 (OISST v2.1) product at 0.25° resolution (Huang et al., 2020), and Chl a concentrations were obtained from the Copernicus Marine Environment Monitoring Service (CMEMS) GlobColour level 4 (L4) merged product (Global Ocean Colour, 2025). Vertically resolved Chl a used for the supplementary vertical-structure diagnostics was obtained from the CMEMS Global Ocean Biogeochemistry (BGC) Hindcast product (GLOBAL_MULTIYEAR_BGC_001_029). Oceanic physical variables, including temperature, salinity, MLD, and ocean currents, were obtained from the CMEMS GLORYS12V1 reanalysis, an eddy-resolving product at ° resolution suitable for examining upper-ocean physical variability (Lellouche et al., 2021; Global Ocean Physics Reanalysis, 2023). The GLORYS12V1 MLD is defined using a density criterion relative to 10 m depth, with the density increment corresponding to a 0.2 °C temperature decrease under local conditions (Drévillon et al., 2025). The squared Brunt–Väisälä frequency (N2) was derived from the temperature and salinity profiles. Following the linear equation of state approximation (Gill, 1982), density was approximated as with , , . Here, T and S denote seawater temperature and salinity, respectively, and T0=25 °C and S0=35 are reference values. N2 was calculated from the vertical density gradient as , where D is depth increasing downward and . Sea level anomaly (SLA) was obtained from the Copernicus Marine Service sea level climate product (Global Ocean Gridded, 2024). The SLA in this product is referenced to the product mean sea surface for 1993 to 2012, rather than to the 1998 to 2024 climatology used in this study. Thus, the climatological SLA fields shown later should be interpreted as study-period mean departures from the product reference mean surface. The GlobColour L4 product has also been used in studies of Chl a variability in the SCS, including analyses of MHW-related Chl a responses and summer upwelling-associated phytoplankton changes (Liu and Tang, 2022; He et al., 2023). Atmospheric variables were obtained from the European Centre for Medium-Range Weather Forecasts (ECMWF) ERA5 reanalysis. The 10 m winds, surface downward shortwave radiation (SWR), and total precipitation were obtained from ERA5 post-processed daily statistics on single levels (Hersbach et al., 2023b), while 500 hPa geopotential height (GH500) and 850 hPa wind components were obtained from ERA5 post-processed daily statistics on pressure levels (Hersbach et al., 2023a). These atmospheric variables were used to diagnose local wind forcing, radiative and precipitation conditions during MHWs, and the circulation background related to the western North Pacific subtropical high (WNPSH). Ekman pumping velocity (EPV) was derived from the wind stress curl calculated using ERA5 10 m wind components and was used as an indicator of wind-driven vertical transport. The calculation followed , where τx and τy are the zonal and meridional wind stress components, ρ0 is the reference seawater density, and f is the Coriolis parameter. To ensure spatiotemporal consistency among variables for SURD analysis, the OISST grid (0.25°×0.25°) was adopted as the reference grid, and the remaining datasets were resampled onto this grid using bilinear interpolation. The temporal coverage of all datasets was restricted to 1998 to 2024, the common period with consistent availability of the key Chl a, oceanic, and atmospheric variables used in this study. This procedure yielded a unified spatiotemporal dataset for the SURD analysis. Detailed information on the data sources is summarized in Table 1.
2.3 Research methods
2.3.1 MHW identification and metric calculation
MHW events were identified following the definition of Hobday et al. (2016), using the MATLAB code package developed by Zhao and Marin (2019). Under this framework, MHWs are defined as discrete extreme events characterized by anomalously high SST. The detection criteria were as follows. An MHW event was recorded when daily SST exceeded the seasonally varying 90th percentile threshold for at least five consecutive days. If two events were separated by a gap of two days or less, they were merged into a single event. The period 1982 to 2011 was used as a fixed 30-year climatological baseline for calculating daily thresholds, consistent with the fixed-baseline approach widely used in MHW studies (Hobday et al., 2016; Chiswell, 2022). MHW detection was then applied to SST time series from 1998 to 2024. One limitation of this approach is that the climatological threshold remains fixed and therefore does not adjust to the long-term warming of the background climate (Chiswell, 2022).
Four metrics were calculated at each grid cell to describe the spatial distribution of MHW occurrence and event-scale temporal properties: frequency, duration, total days, and cumulative intensity. MHWs were identified independently from the daily SST time series at each grid cell. Frequency was defined as the annual number of MHW events, total days as the annual number of MHW days, duration as the length of an individual MHW event, and cumulative intensity as the sum of daily SST anomalies relative to the climatological mean over an individual MHW event (Hobday et al., 2016). Frequency and total days were then averaged over 1998 to 2024 at each grid cell. Duration and cumulative intensity were first calculated for each grid-cell event and then averaged over all events detected at that grid cell during 1998 to 2024.
Separately, for the SURD analysis, we constructed a running cumulative SST anomaly metric (SST_CUM) to represent the thermal exposure accumulated from MHW onset to each MHW day. SST_CUM therefore evolves over the progression of an event rather than representing a single event-level value.
2.3.2 SURD causality analysis
To disentangle the causal contributions of environmental drivers to Chl a anomalies, this study adopted the SURD method. SURD is grounded in information theory and quantifies causality as the reduction in uncertainty (Shannon entropy) of a future target variable provided by the past states of observed drivers. In this study, the target variable was defined as the Chl a anomaly at future time t+τ, where τ is the response lag. The observed physical vector represents the states of the selected physical variables at time t. This framework is suitable for the present problem because Chl a anomalies during MHWs in the SCS are shaped by highly coupled physical drivers and potentially nonlinear interactions. The SURD decomposition was implemented in Python using the surd function provided by Martínez-Sánchez et al. (2024).
Following the principle of forward information propagation, the total entropy , representing the uncertainty of the future Chl a anomaly, can be decomposed into redundant, unique, synergistic, and residual components:
Here, 𝒞 denotes the set of all driver combinations involving two or more observed drivers. In the redundant and synergistic sums, i∈𝒞 indexes a driver combination, whereas in the unique term, indexes individual drivers. In this study, causality refers to lagged information-theoretic predictive causality under the prescribed driver set and response lag, rather than direct experimental causation. The unique causality ΔIU quantifies the causal information provided by a single driver that is not contained in any other individual driver, thus serving as a key indicator for identifying independent drivers. The redundant causality ΔIR represents the overlapping information arising from shared dependencies among drivers. By separating this shared information, SURD reduces misattribution caused by multicollinearity in traditional models (Han et al., 2025), helping to prevent correlated signals from being interpreted as independent mechanisms. The synergistic causality ΔIS represents causal information about future Chl a anomalies that can be obtained only from the joint states of multiple selected physical drivers, rather than from any single driver alone. It therefore indicates additional information on the future Chl a response arising from interactions among the selected drivers. The causality leak ΔIleak quantifies target uncertainty not assigned to the selected driver set under the prescribed lag, variable subset, and discretization scheme. It may reflect unresolved processes, observational uncertainty, finite-sample effects, or missing variables.
SST_CUM, defined in Sect. 2.3.1, was retained in all tested variable subsets as the metric of cumulative thermal stress. This design allowed us to evaluate whether Chl a anomalies during MHWs were mainly associated with cumulative heat stress itself or with concurrent changes in other physical processes. For each region, three additional predictors were combined with SST_CUM from a candidate pool consisting of sea surface salinity (SSS), SLA, MLD, EPV, zonal and meridional current components, wind speed, and zonal (u_wind) and meridional (v_wind) wind components. These variables represent major physical pathways known to regulate Chl a variability in the SCS, including monsoon wind forcing, Ekman pumping, coastal and offshore circulation, mesoscale modulation, and upper-ocean thermohaline structure (Lu and Gan, 2015; Chen et al., 2021; Hong et al., 2022; Zhi et al., 2022). SST_CUM at time t represented the accumulated thermal conditions from MHW onset to the current day, whereas the other predictors were represented by their concurrent daily anomalies at t and were not averaged over the MHW duration or converted to cumulative metrics. Nutrient and biological variables were not included in the SURD driver pool; the associated data limitations and implications are discussed in Sect. 3.5. All variables were standardized using z-scores before SURD analysis.
The main analysis used four-variable subsets. Although adding more variables can in principle reduce the causality leak by conditioning the future Chl a state on a larger set of drivers, a lower leak alone does not necessarily yield a more physically interpretable or statistically robust decomposition. Increasing the number of variables also produces increasingly high-order SURD terms, making individual information components more difficult to relate to specific physical processes. The four-variable setting was therefore adopted as a parsimonious balance among leak reduction, probability-estimation stability, and physical interpretability. Within this framework, each candidate four-variable subset was evaluated over bin numbers from 2 to 10. For each region, the subset with the lowest mean causality leak across these bin settings was selected for the subsequent SURD decomposition.
In practice, SURD requires the estimation of the joint probability distribution between the future Chl a anomaly and the selected physical drivers. Given the continuous nature of these anomalous time series, they were first discretized into a finite number of states before estimating the joint probability distribution. The number of bins defines the number of discrete states used to represent each variable and therefore controls the resolution of the discretized state space. Too few bins may merge distinct anomaly states and obscure variability, whereas too many bins may leave insufficient samples in each state and lead to unstable probability estimates. The bin-sensitivity results were also used to determine the discretization for the final decomposition. Nine bins were retained as a common setting for both regions, providing a low causality leak while limiting further sparsity in the joint state space. The response lag τ defines the time interval between the physical drivers and the future Chl a anomaly. Sensitivity tests for τ=1, 2, and 3 d showed that the selected region-specific variable subsets remained unchanged across the tested lags (Table S1 in the Supplement). Given this limited sensitivity to the lag choice, τ=1 d was retained for the main analysis.
The non-leak SURD terms were normalized by the mutual information captured by the selected driver subset. Therefore, for a given non-leak term k, the percentage shown in Figs. 5b and 8b was calculated as
where Ω includes all unique, redundant, and synergistic terms of the selected driver subset, but excludes the causality leak. These percentages therefore represent relative information contributions within the information captured by the selected physical drivers. They should not be interpreted as fractions of total Chl a variance or total target entropy. The causality leak is reported separately because it is normalized by and measures the fraction of target uncertainty that remains unexplained by the selected driver set.
3.1 Spatial distribution of MHWs
MHW metrics in the SCS exhibit marked spatial heterogeneity (Fig. 2). In terms of occurrence frequency (Fig. 2a), high values are mainly concentrated on the northern continental shelf, with annual occurrence frequencies generally exceeding 4 events yr−1. High values of single-event duration (Fig. 2b) and cumulative intensity (Fig. 2d) are present in the Beibu Gulf, off Vietnam, and in the western SCS basin, where the mean duration exceeds 15 d. Annual total MHW days display a spatial pattern characterized by higher values in coastal regions and lower values in the open basin (Fig. 2c). In the Beibu Gulf and PRE, annual total MHW days exceed 50 d. These patterns indicate pronounced MHW activity in the northern shelf region, including the PRE, and in the VUA.
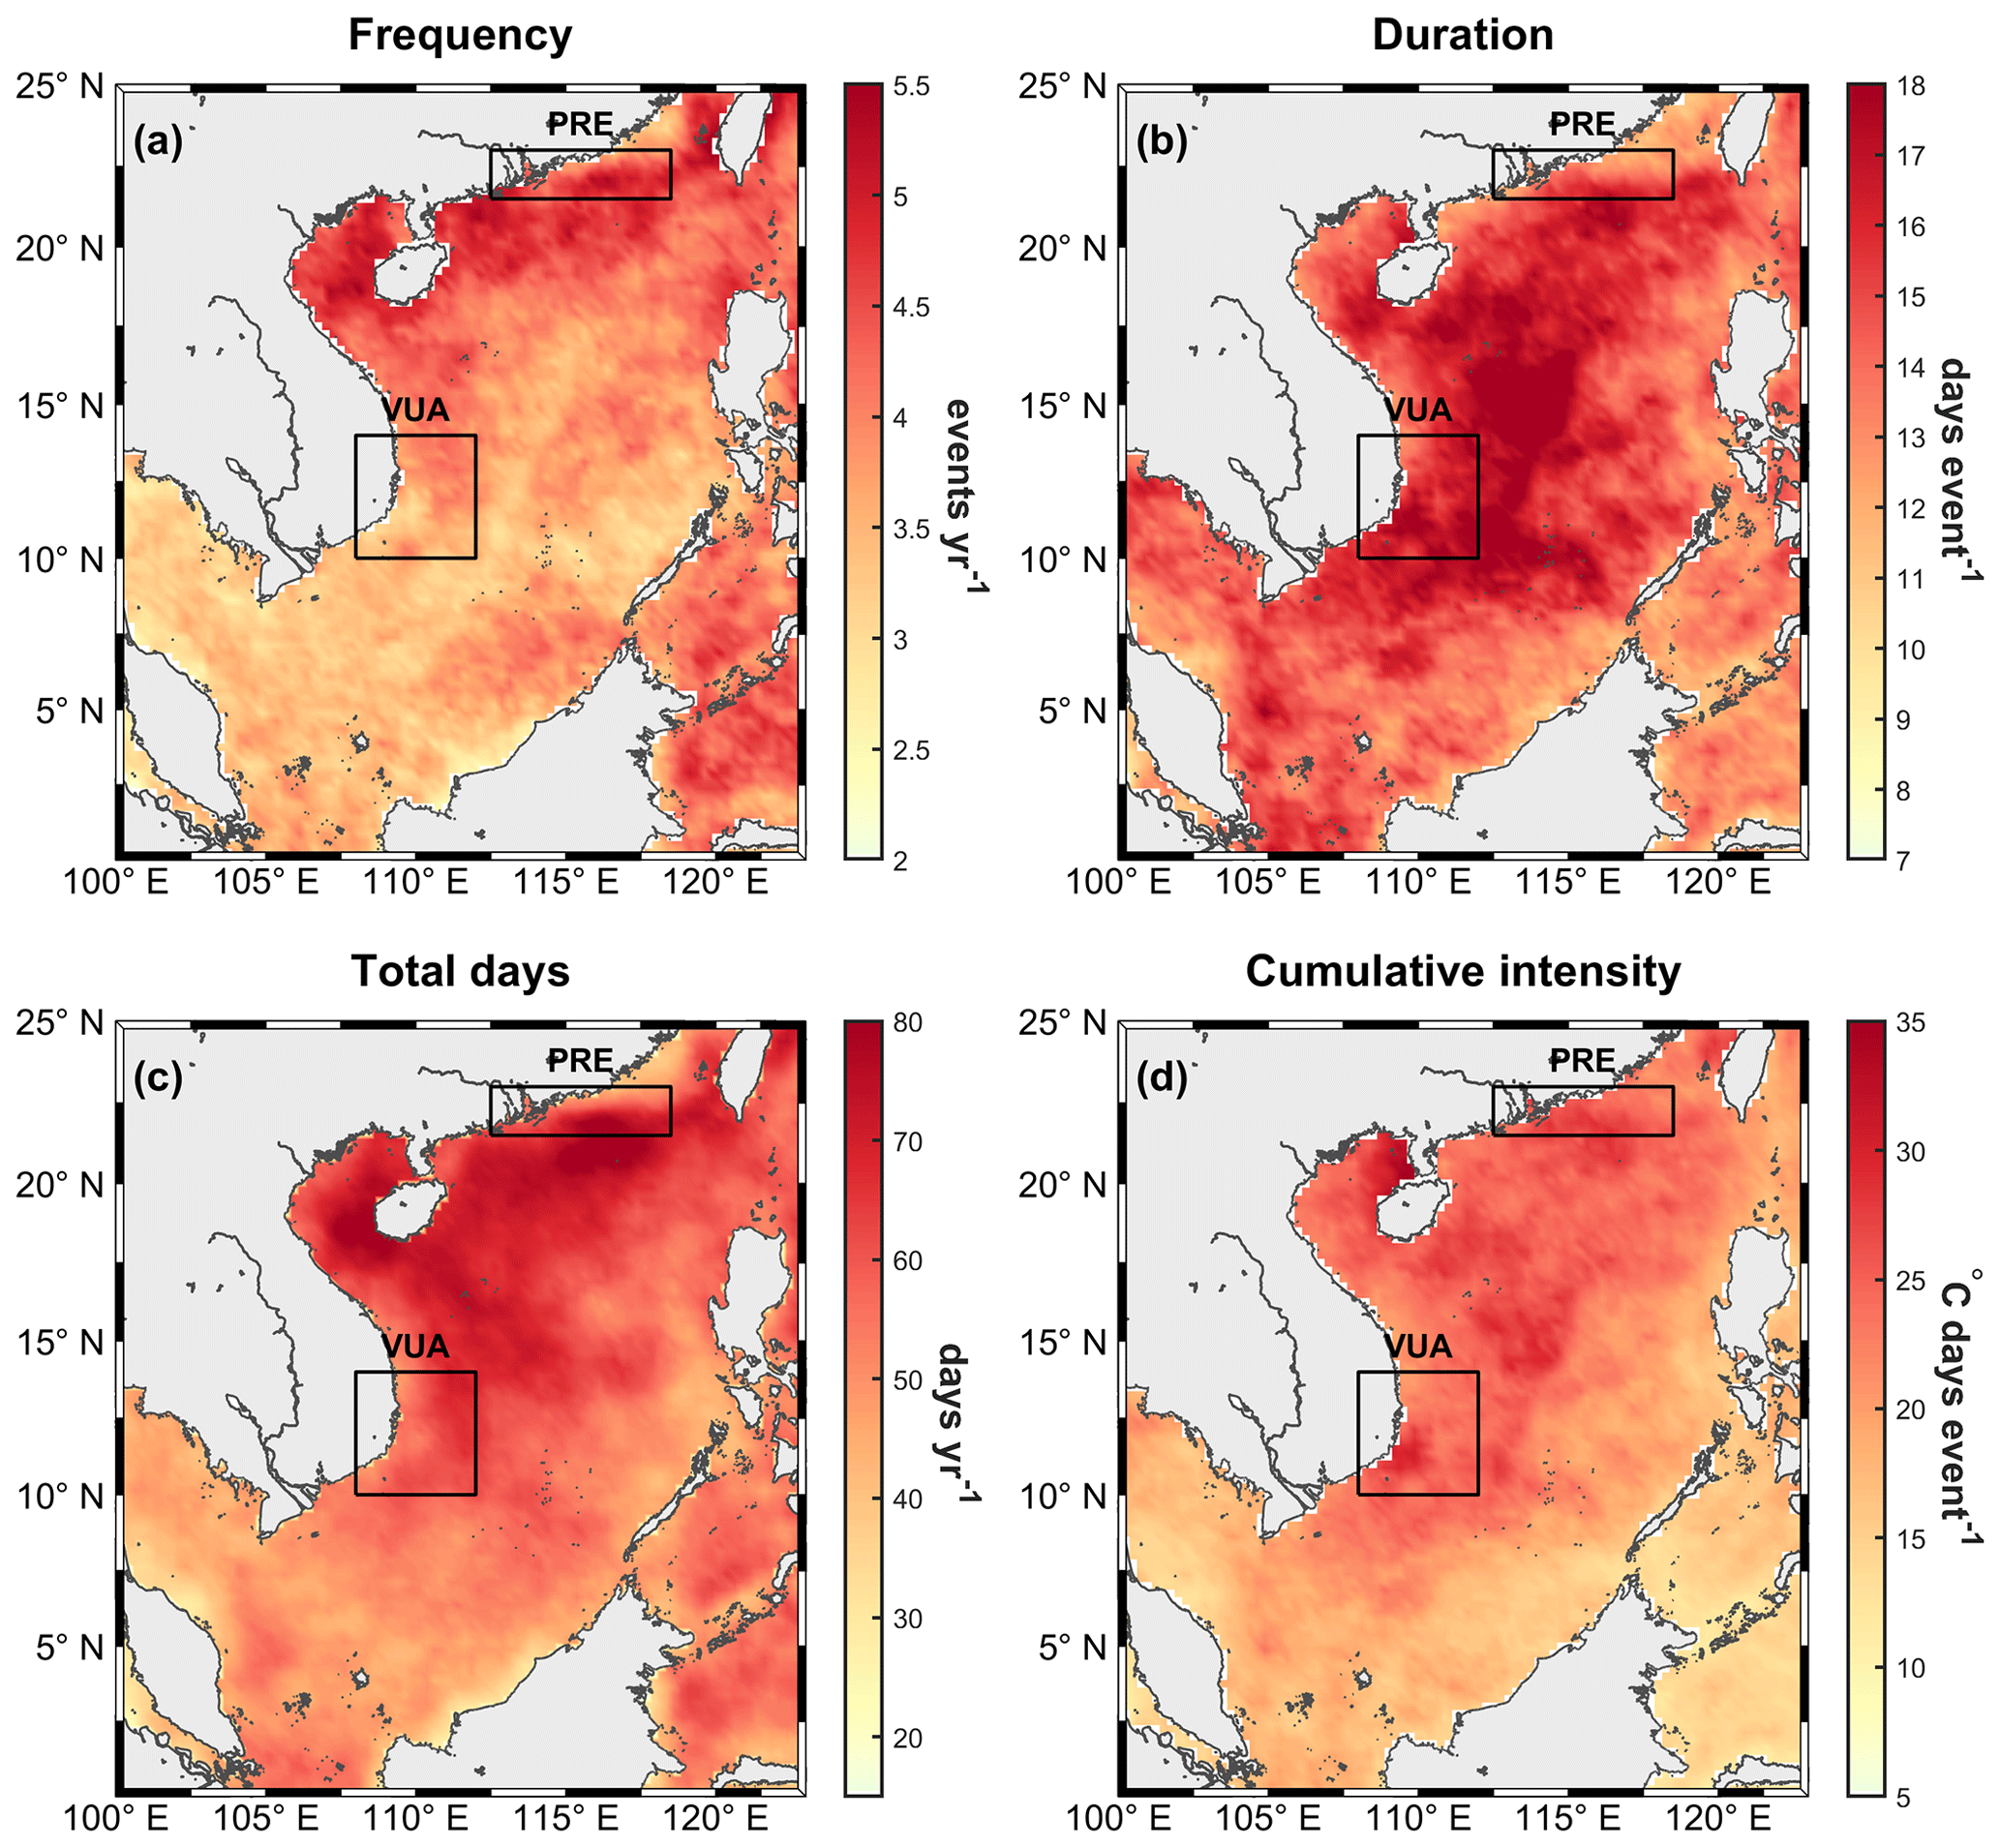
Figure 2Mean spatial distribution of MHW characteristics in the SCS during 1998 to 2024. Black rectangles indicate the PRE and VUA study regions. The panels show (a) annual mean occurrence frequency (events yr−1), (b) mean duration (d per event), (c) annual mean total MHW days (d yr−1), and (d) mean cumulative intensity (°C d per event).
Statistical analyses further quantified the MHW characteristics of the VUA and the PRE relative to the basin-wide SCS statistics (p<0.01; Fig. 3). The PRE is characterized as a typical high-frequency MHW area. The annual occurrence frequency ranges from 3.41 to 5.37 events yr−1, with a median of 4.57 events yr−1, which is higher than the basin-wide SCS median of 3.78 events yr−1 (Fig. 3a). The VUA, by comparison, is characterized as a long-duration area. In this region, the median duration of individual events reaches 16.63 d per event, exceeding the basin-wide SCS median of 14.30 d per event (Fig. 3b). In addition, both the PRE and the VUA exhibit significantly higher median annual total MHW days and cumulative intensity than the basin-wide SCS median values (Fig. 3c and d).
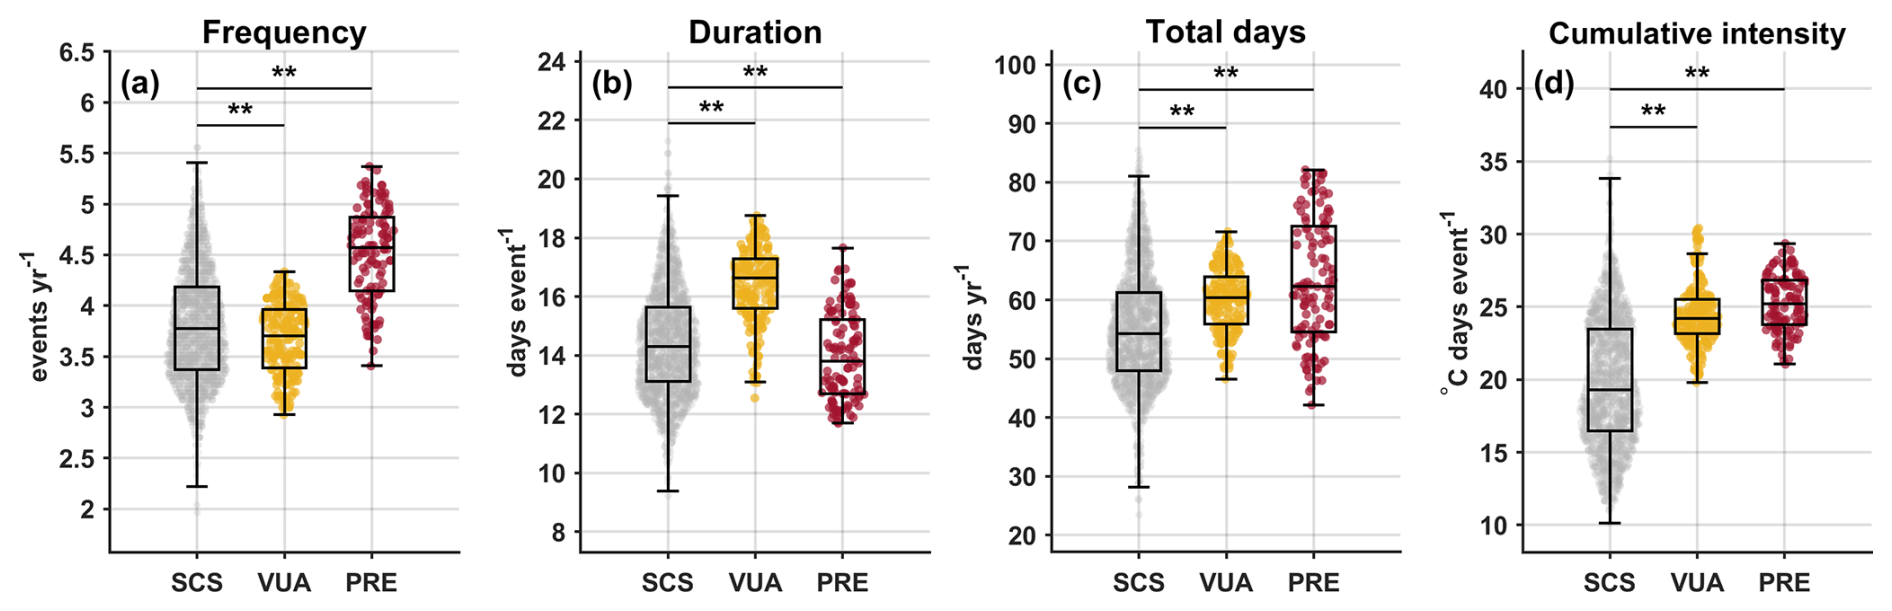
Figure 3Comparison of MHW characteristics among the SCS, the VUA, and the PRE. The panels show (a) annual mean occurrence frequency, (b) mean duration, (c) annual mean total MHW days, and (d) mean cumulative intensity. Each point represents one valid grid cell, with values averaged over 1998 to 2024. Boxes indicate the interquartile ranges, and central horizontal lines denote medians. Horizontal bars indicate comparisons of VUA versus SCS and PRE versus SCS; double asterisks indicate significant differences (p<0.01) based on two-sided Wilcoxon rank-sum tests (Wilcoxon, 1945).
3.2 Chl a responses to MHWs
Seasonal composite analysis of Chl a anomalies during MHWs reveals a predominantly negative response across most seasons (Fig. 4). In spring, autumn, and winter, negative Chl a anomalies dominate the SCS (Fig. 4a, c, and d). By contrast, the summer response exhibits a marked spatial contrast between the northern shelf and the western SCS (Fig. 4b). In the PRE and adjacent northern shelf regions, Chl a concentrations show positive anomalies during MHWs, with increases exceeding 40 % relative to the climatological summer chlorophyll concentration in some nearshore core areas. Meanwhile, the VUA shows negative Chl a anomalies. Because the SCS exhibits strong seasonal variability in both physical conditions and Chl a background states, pooling MHW responses across seasons could mask these season-specific contrasts. The summer composite anomalies in both regions also lay outside the variability observed under comparable non-MHW summer conditions (Fig. S3). We therefore focus the subsequent mechanistic analysis on summer, when the clearest contrast emerges between the PRE and VUA.
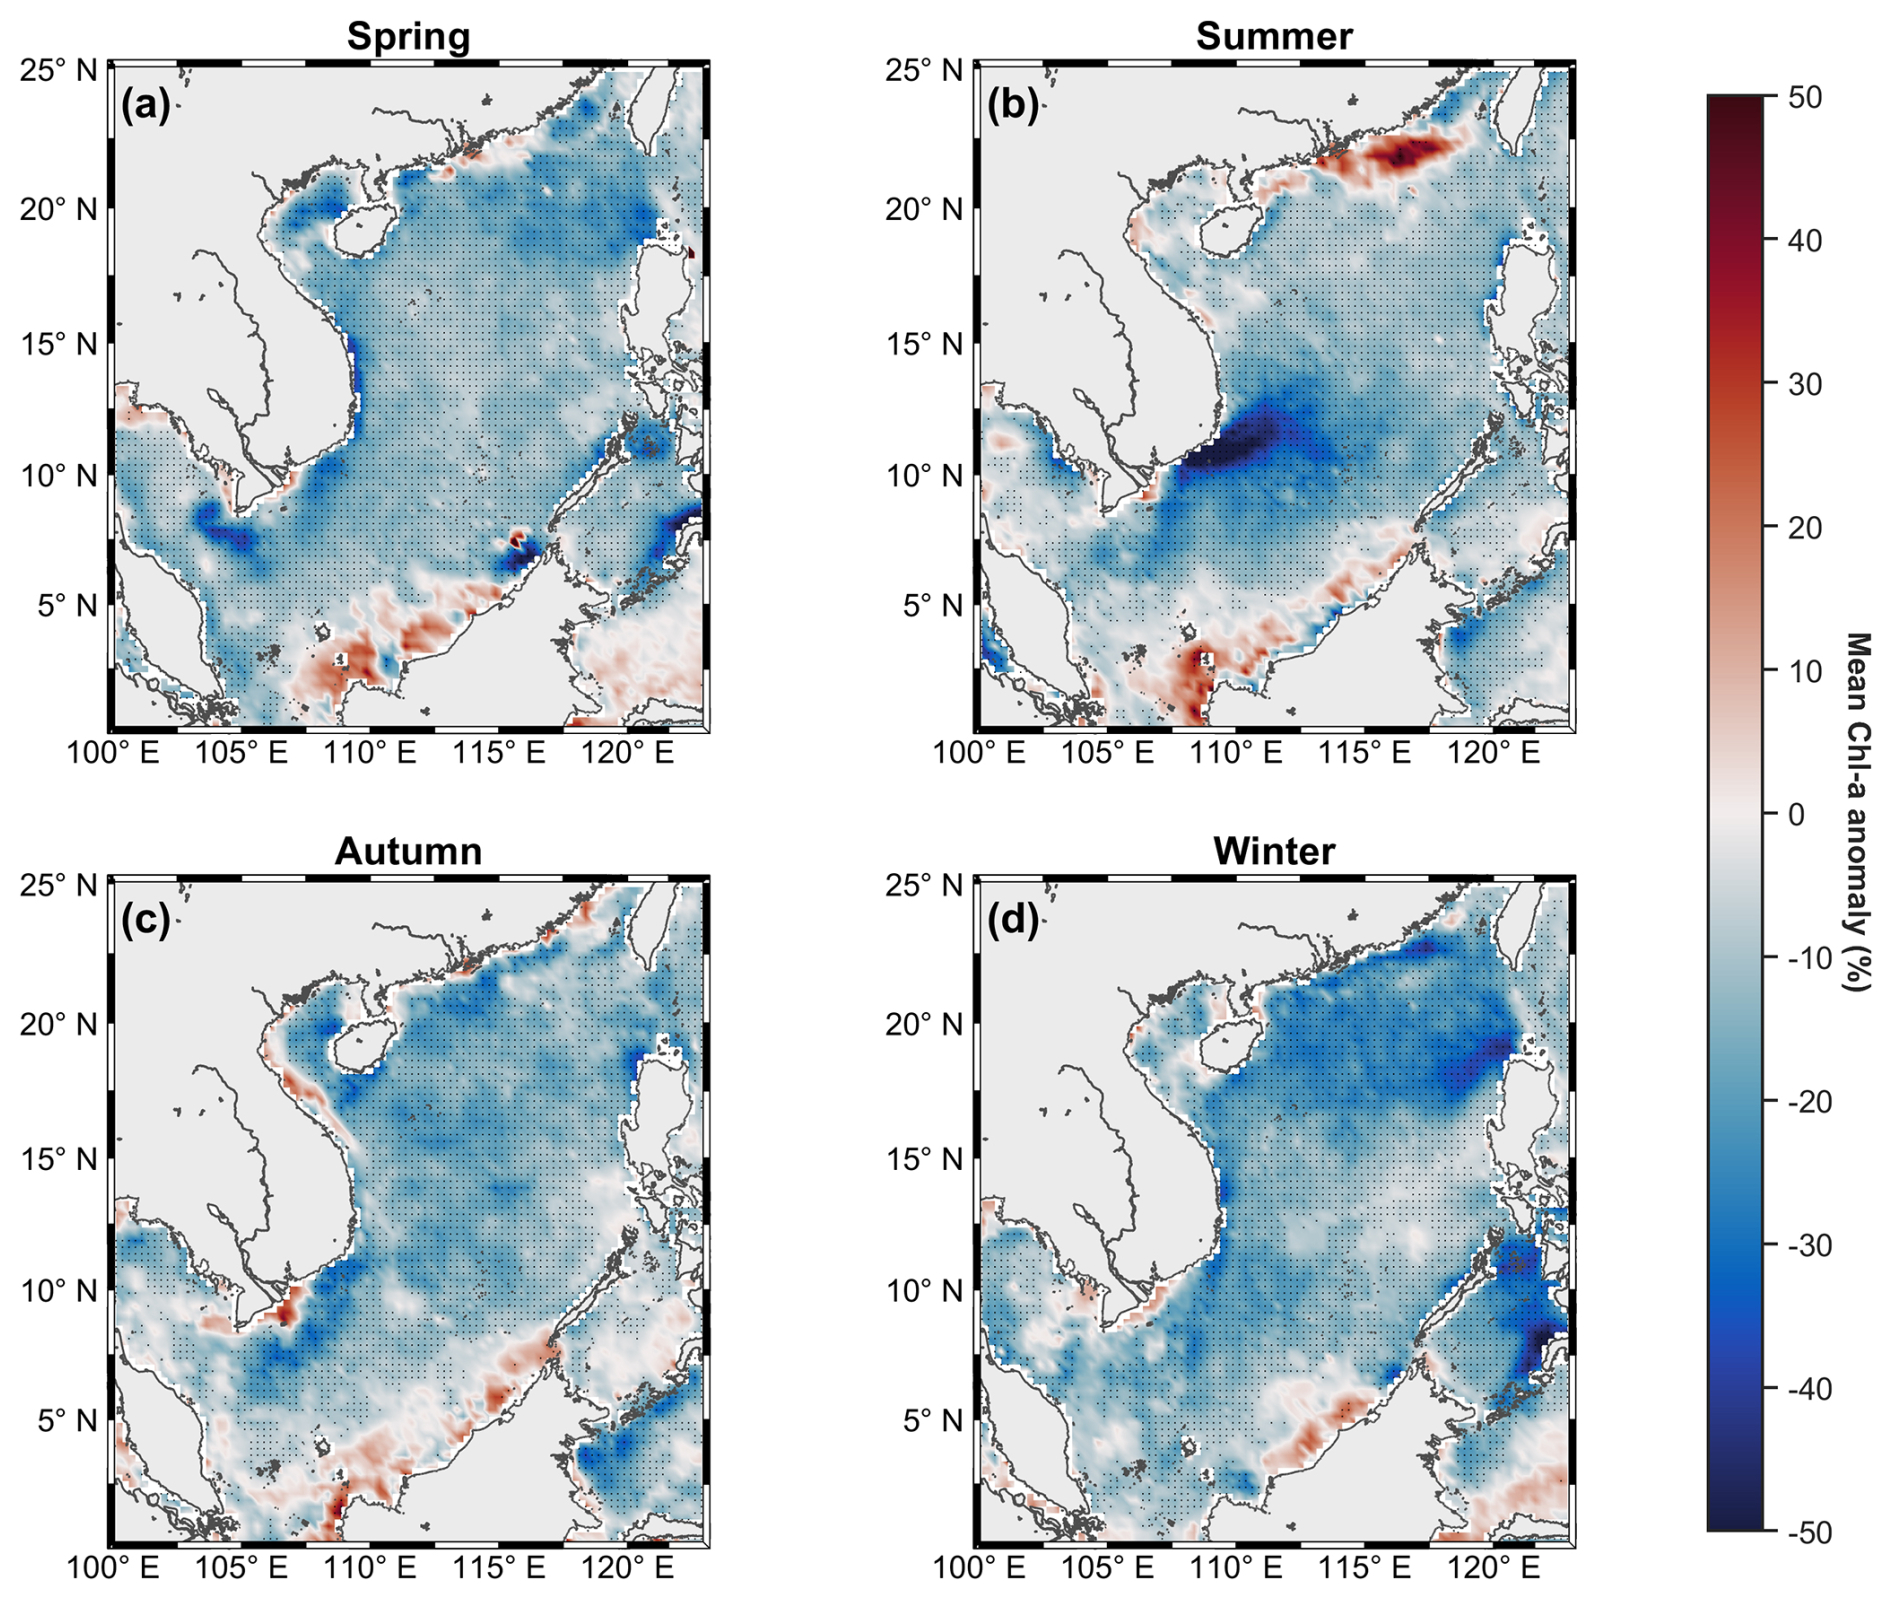
Figure 4Spatial distribution of the seasonal mean Chl a percentage anomalies during MHWs in the SCS for 1998 to 2024. The panels show composite anomalies for (a) spring, (b) summer, (c) autumn, and (d) winter. Chl a anomalies are expressed as percentage differences between event-mean values during MHWs and the seasonal climatology at each grid cell. Black stippling indicates anomalies significantly different from zero (p<0.05).
3.3 Regional physical pathways of Chl a responses during summer MHWs
To identify the dominant physical signals associated with summer Chl a anomalies during MHWs, SURD was applied separately to the VUA and PRE using the region-specific variable subsets selected as described in Sect. 2.3.2. The resulting decompositions revealed distinct information structures between the two regions, which are examined below in terms of unique, redundant, and synergistic contributions.
3.3.1 Suppressed upwelling in the VUA
As a typical wind-driven upwelling system, the VUA is strongly regulated by local air–sea interactions during summer (Ngo and Hsin, 2021). Within the tested four-variable subsets described above, the combination of SSS, SLA, EPV, and SST_CUM had the lowest mean causality leak over the tested bin numbers, with a leak of approximately 0.55 under the selected nine-bin discretization (Fig. 5a). This subset was therefore used to examine the physical information associated with VUA Chl a anomalies.
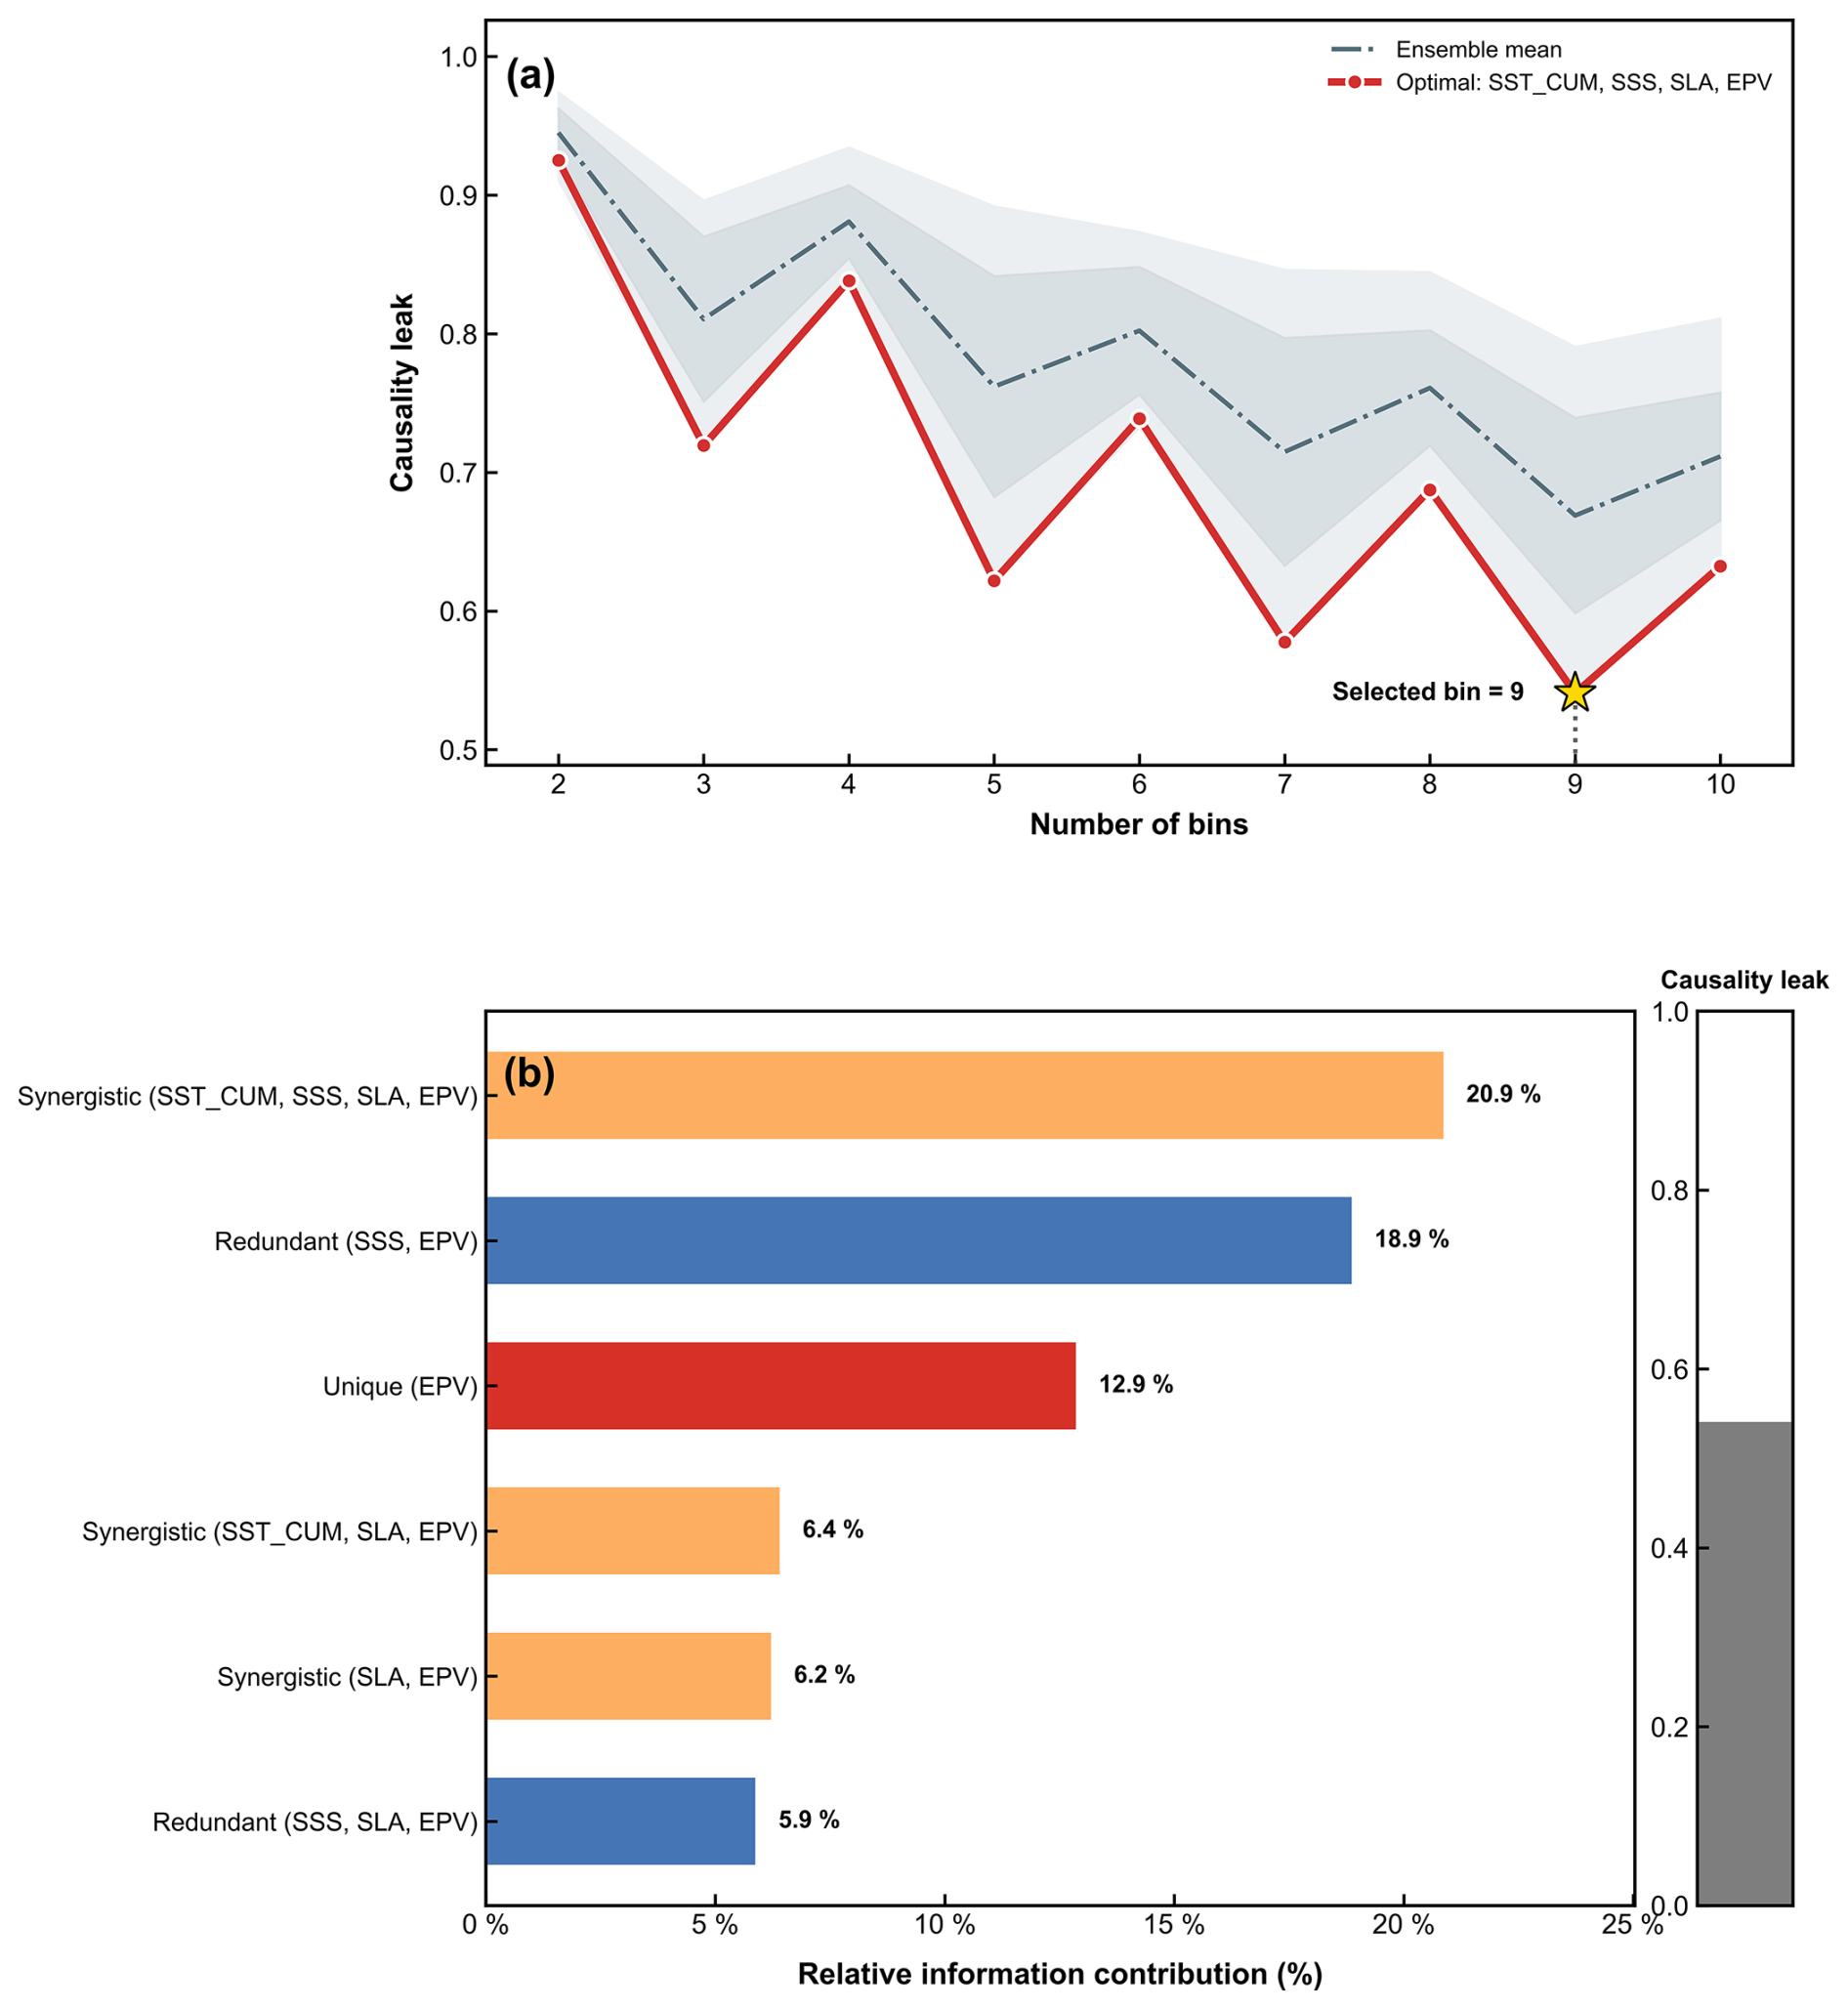
Figure 5Selection of the four-variable subset and SURD decomposition for the VUA during summer MHWs. (a) Sensitivity of the causality leak to the number of bins. The solid red line denotes the selected variable subset, and the dot-dashed grey line denotes the ensemble mean across all four-variable subsets. Shading indicates the full range and ±1 standard deviation of the ensemble. The yellow star marks the selected discretization parameter of nine bins. (b) Relative non-leak information contributions to the future Chl a anomaly. Percentages are normalized by the sum of all unique, redundant, and synergistic SURD terms for the selected subset. The grey bar indicates the causality leak, , which is normalized separately. Only the six largest non-leak terms are shown; therefore, the displayed percentages do not sum to 100 %.
Figure 6 illustrates climatological fields and MHW-related composite anomalies for key variables in the VUA during summer. The climatological fields show the canonical summer upwelling signature off southeastern Vietnam, including relatively lower SST, enhanced EPV, lower nearshore SLA, and a nearshore high-Chl a belt (Fig. 6a, b, d, and e). The high-Chl a belt remains evident under alternative characterizations of the summer background state, suggesting that it is not primarily driven by a small number of episodic high-Chl a observations (Fig. S4). This pattern agrees with previous studies indicating that southwest monsoon forcing and Ekman processes drive coastal and offshore upwelling in the western SCS, thereby supporting elevated Chl a in the upwelling zone (Herrmann et al., 2023; To Duy et al., 2022; Zhao and Tang, 2007).
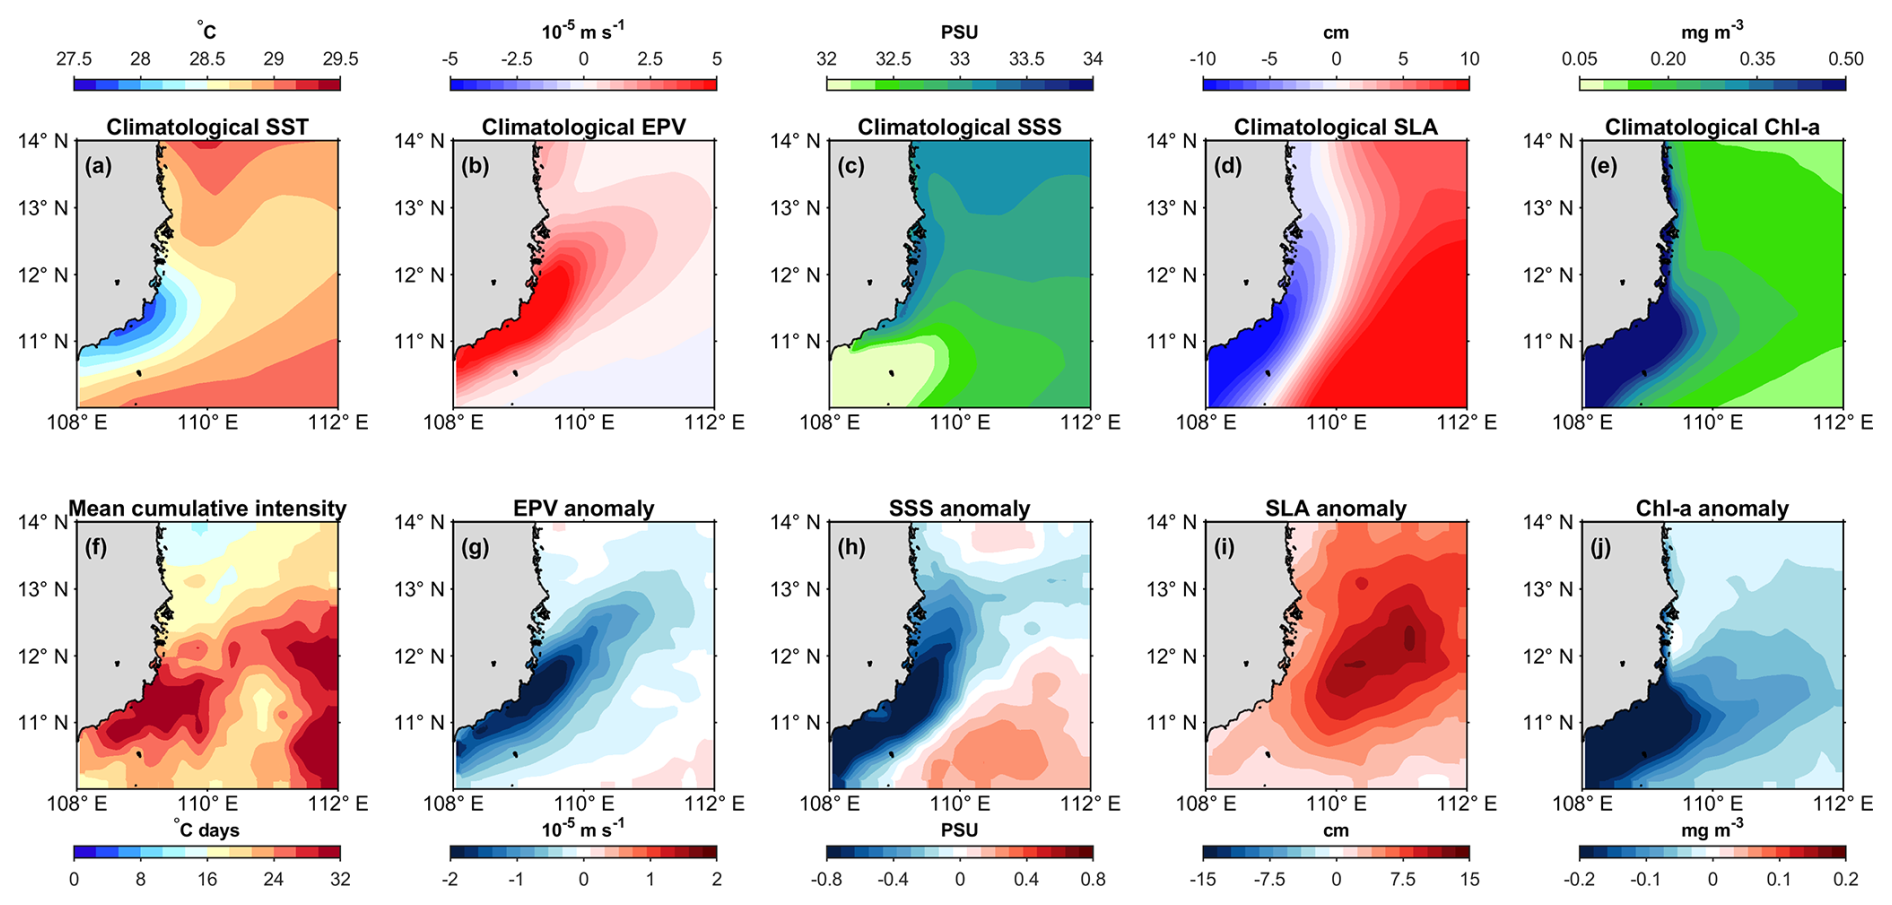
Figure 6Summer climatological fields and MHW-related anomaly composites in the VUA. Panels show (a) climatological SST (°C), (f) mean cumulative intensity of summer MHWs (°C d), and climatological fields with corresponding anomaly composites for (b, g) EPV (10−5 m s−1), (c, h) SSS (PSU), (d, i) SLA (cm), and (e, j) Chl a (mg m−3). The anomaly fields were calculated from daily departures relative to the day-of-year climatology and then averaged using an event-equal composite.
High mean cumulative-intensity values span the entire region, with high-value centres (>30 °C d) concentrated in offshore waters and along the nearshore band south of 12° N (Fig. 6f). Correspondingly, Chl a concentrations show negative anomalies (Fig. 6j), with the core decline zone (10 to 12° N) overlapping the coastal region experiencing the strongest cumulative heat stress. These negative Chl a anomalies spatially coincide with the summer climatological high-Chl a belt (Fig. 6e), suggesting that MHWs may suppress surface Chl a in this climatologically high-Chl a region.
These negative Chl a anomalies cannot be solely explained by direct surface warming. The SURD analysis (Fig. 5b) detected no unique information contribution from SST_CUM within the selected VUA variable subset, whereas EPV showed the largest unique information contribution among the selected physical drivers (12.9 %). The absence of a detected unique contribution from SST_CUM should not be interpreted as an absence of thermal involvement, because SST_CUM remained involved in synergistic terms with the other selected physical variables. This result identifies vertical transport as the dominant identified physical pathway associated with the Chl a decline within the selected driver set. EPV exhibits negative anomalies along the coast, with a spatial extent that generally coincides with the core region of negative Chl a anomalies (Fig. 6g and j). This phenomenon further supports that negative EPV anomalies contribute to the Chl a decline.
Substantial redundant information is shared by SSS and EPV (18.9 %; Fig. 5b), consistent with the spatial overlap of their negative anomalies (Fig. 6g and h). This redundancy suggests that SSS variability contains information linked to EPV. Reduced EPV suppresses the upward transport of subsurface high-salinity water, contributing to surface freshening (Ngo and Hsin, 2021; To Duy et al., 2022). Thus, the negative SSS anomaly can be interpreted as a hydrographic tracer of weakened wind-driven upwelling (Dippner et al., 2007; Wu et al., 2025).
Within the explainable information captured by the selected subset, the largest single contribution (20.9 %) arose from the synergistic interaction among SSS, SLA, EPV, and SST_CUM. Given that SURD terms are not stepwise marginal effects, the four-variable synergy should not be interpreted as the incremental effect of adding SSS to a lower-order combination. The SSS–EPV redundancy mainly reflects shared upwelling-related information. The dominant four-variable synergy therefore supports a joint-state interpretation rather than a single-driver explanation. The vertical structure further supports this point (Fig. 7). During MHWs, positive temperature anomalies penetrate into the subsurface layer (Fig. 7f), strengthening water-column stratification, as reflected by positive N2 anomalies (Fig. 7i). Positive SLA anomalies (Fig. 6i) correspond to thermocline deepening (Fig. 7e and f), while negative EPV anomalies indicate weakened upwelling. This synergy can be interpreted as a dual suppression mechanism: dynamically, reduced wind-driven upwelling limits the upward transport of nutrients (He and Mahadevan, 2021); thermally, enhanced stratification further restricts vertical nutrient exchange in the upper ocean (Yao and Wang, 2021; Noh et al., 2022). Together, these processes restrict the upward supply of nutrients to the upper ocean and are consistent with the observed negative surface Chl a anomalies (He et al., 2023; Ma and Chen, 2025).
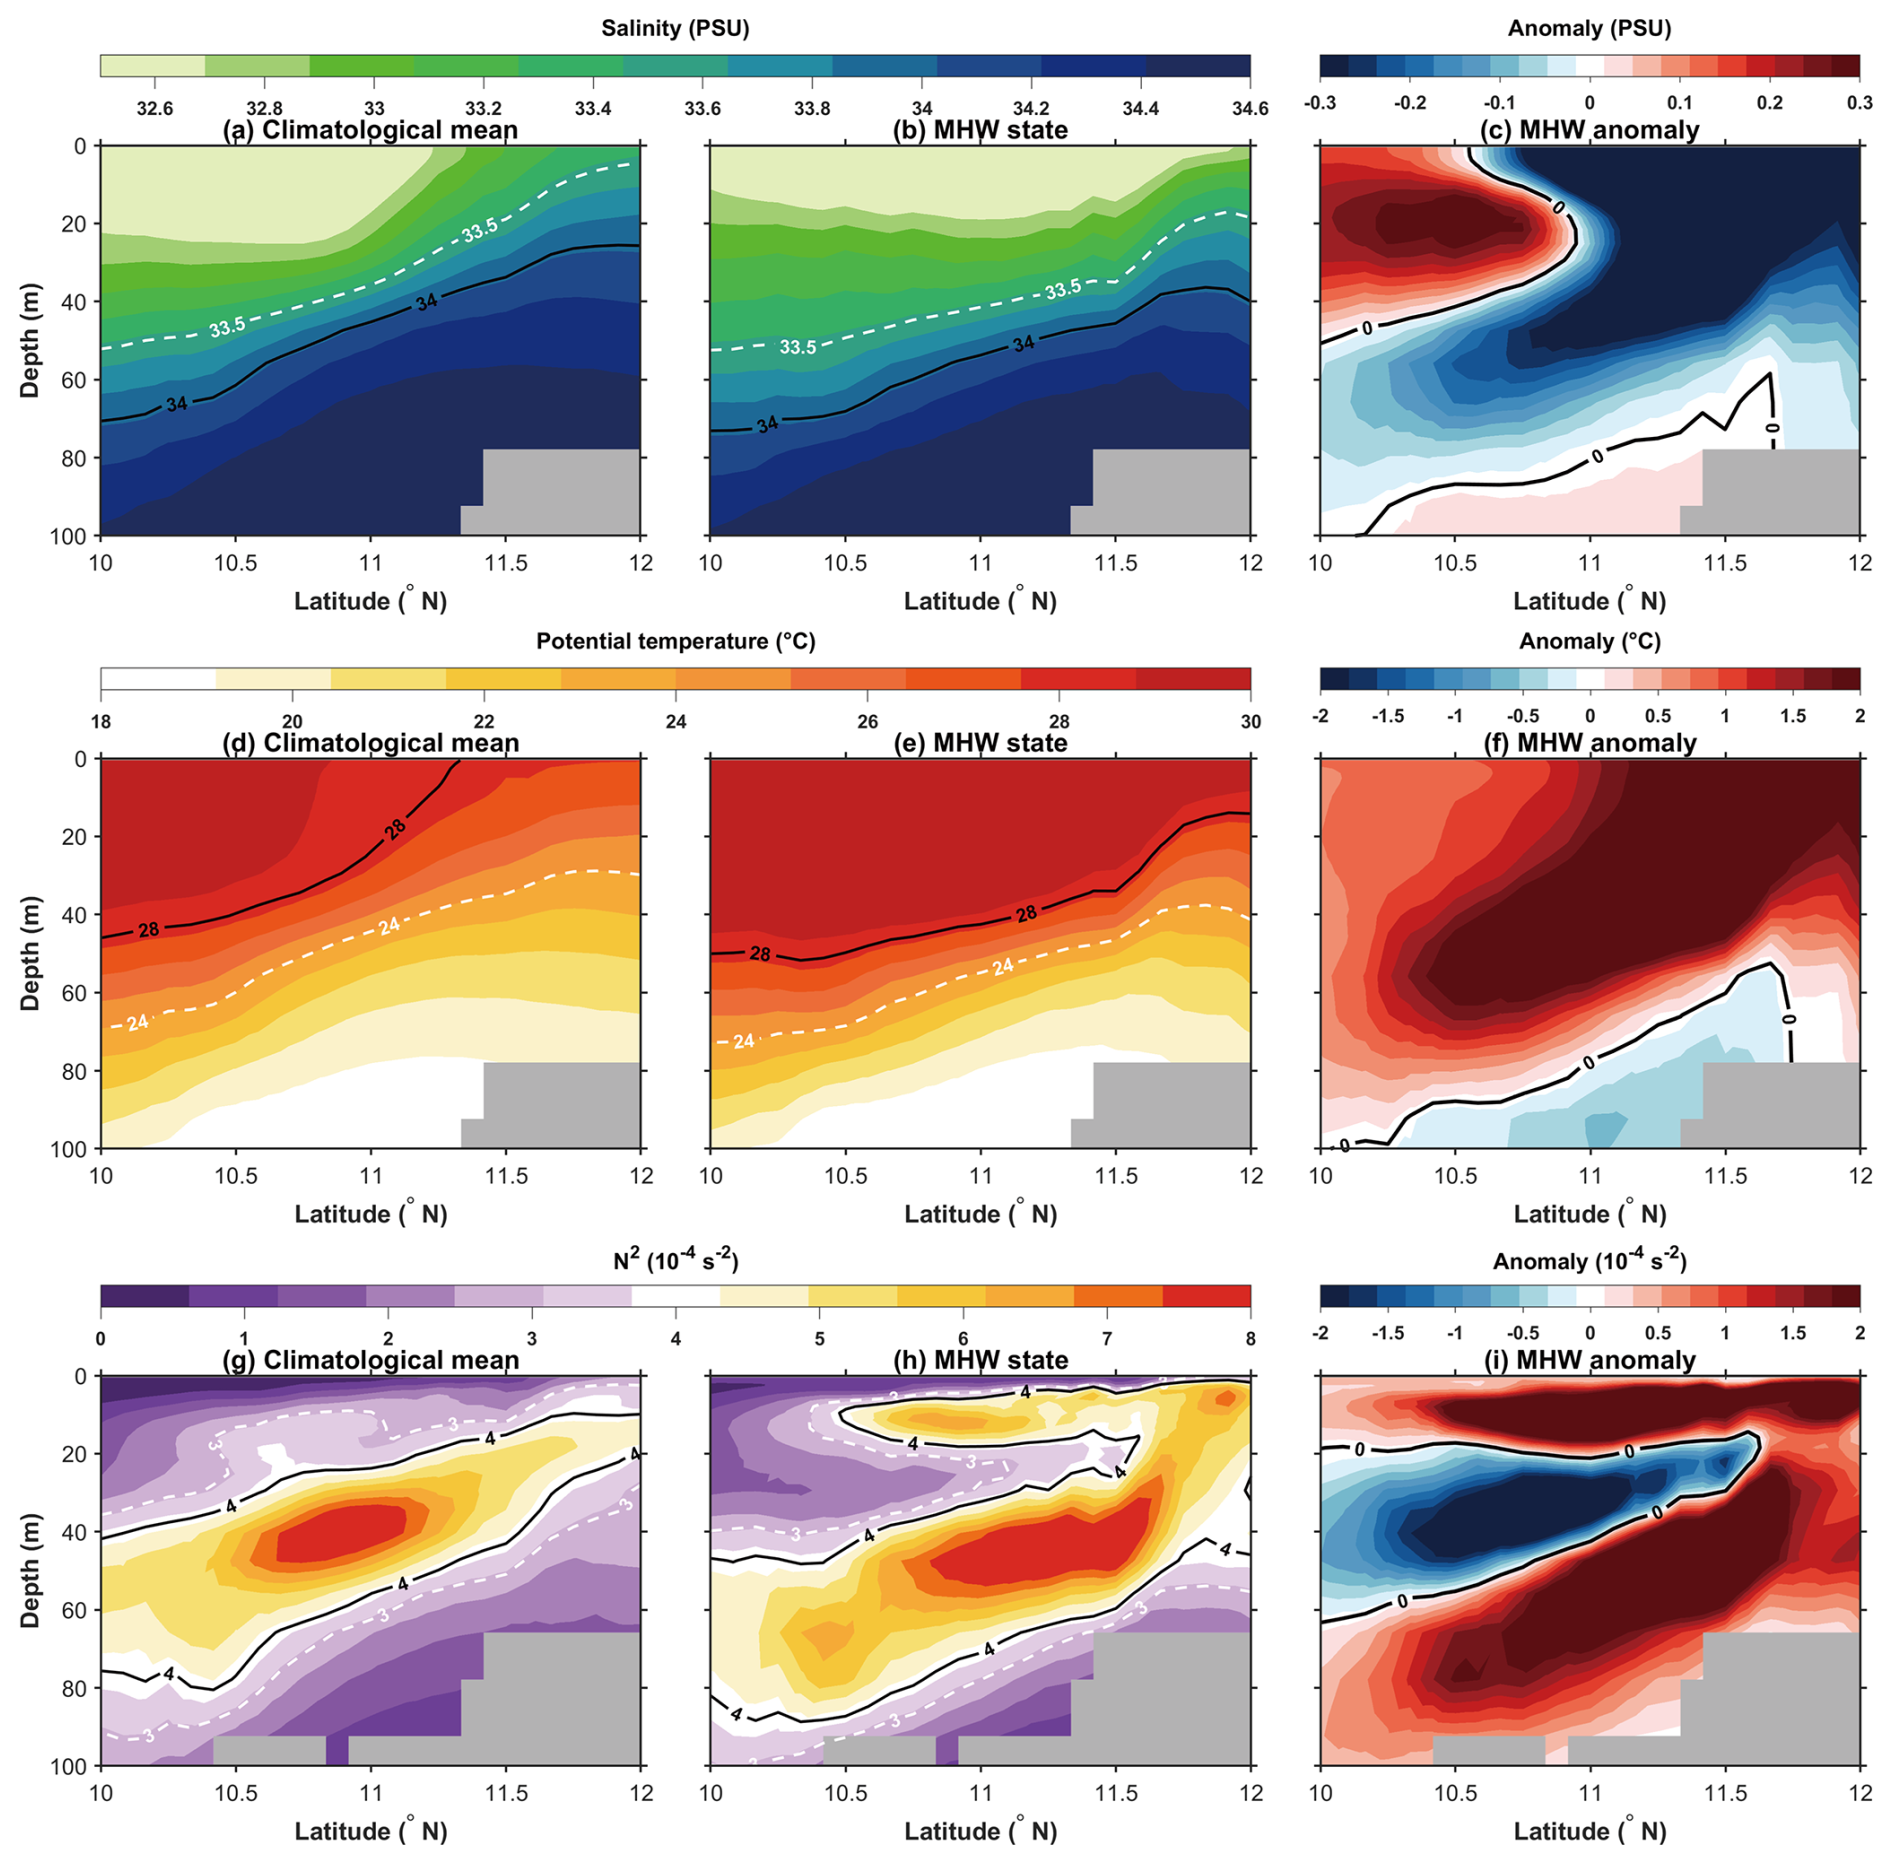
Figure 7Vertical upper-ocean structure (0 to 100 m) along the 109.33° E transect in the VUA during summer (June to August). The rows display, from top to bottom, the (a–c) salinity (PSU), (d–f) potential temperature (°C), and (g–i) squared Brunt–Väisälä frequency (N2, 10−4 s−2). The left, middle, and right columns represent the climatological mean, MHW state, and MHW anomaly field, respectively. In the left and middle columns, solid black and dashed white contours indicate selected salinity, potential-temperature, and N2 values. In the right column, thick black contours denote zero anomalies. Grey shading at the bottom of each panel represents seafloor bathymetry or masked grid cells.
The vertical Chl a from the CMEMS BGC Hindcast product (Sect. 2.2) was used to further examine the negative surface Chl a anomalies in the VUA. Although the magnitude differs from the satellite observations, the BGC hindcast also shows a negative surface Chl a anomaly in the VUA (Fig. S5), supporting its use for examining the vertical structure of the response. The climatological vertical profile shows a pronounced subsurface Chl a maximum at approximately 50–70 m (Fig. S5a). Strong climatological summer upwelling (Fig. 6b) transports subsurface high-Chl a water upward, contributing to the high climatological Chl a in the VUA (Fig. 6e). During MHWs, weakened upwelling (Fig. 6g) reduced this upward transport, while enhanced stratification (Fig. 7i) suppressed vertical exchange, thereby contributing to the negative surface Chl a anomalies.
When averaged over the full water column, the water-column anomaly is only −0.006 mg m−3, substantially smaller in magnitude than the model-derived surface anomaly of −0.077 mg m−3 (Fig. S5c). The much weaker water-column mean anomaly suggests that vertical redistribution associated with weakened upwelling and enhanced stratification contributed to the surface Chl a response in the VUA.
Chl a anomalies were negative throughout approximately the upper 60 m, where climatological Chl a concentrations are higher than in deeper water (Fig. S5a and b). This broad upper-ocean decrease suggests that vertical redistribution alone may not fully explain the observed response. Other unresolved processes may also contribute to the surface Chl a response in the VUA. Given that the causality leak in the SURD analysis for the VUA Chl a anomalies is not zero (Fig. 5b), these unresolved processes may contribute to the remaining causality leak.
3.3.2 Horizontal plume retention in the PRE
Using the same four-variable selection framework as in the VUA, the PRE subset selected at the nine-bin discretization consisted of SSS, SLA, SST_CUM, and u_wind (Fig. 8a). Although the causality leak continued to decrease at 10 bins, nine bins were retained for the main analysis to maintain comparability with the VUA and to avoid excessive sparsity in the discretized joint probability estimates. Within this selected subset, the largest non-leak contribution was the four-variable synergistic term involving SST_CUM, SSS, SLA, and u_wind (30.6 %; Fig. 8b). As in the VUA, the SURD analysis detected no unique information contribution from SST_CUM, whereas SSS provided the largest unique information contribution among the selected physical drivers (28.1 %; Fig. 8b). This contrast indicates that cumulative thermal stress did not provide separable predictive information within the selected PRE variable subset, with SSS instead representing the dominant source of unique information. The spatial distribution of SSS provides physical context for this result. The climatology shows low-salinity plume water near the estuary and more saline offshore waters (Fig. 9e), while the MHW composite shows predominantly positive SSS anomalies outside the plume-affected region (Fig. 9f). Therefore, the intrusion of high-salinity offshore waters – both climatological and anomalous – cannot account for the pronounced negative SSS anomalies in the nearshore area (Fig. 9f). The pronounced negative SSS anomalies are mainly concentrated in the plume-affected region (Fig. 9e and f). Together, these spatial patterns support an enhanced influence or local retention of low-salinity Pearl River plume water near the coast. Precipitation anomalies provide little support for enhanced rainfall as the source of this freshening: local PRE precipitation did not increase during summer MHWs, and precipitation over the nearby Pearl River Delta (PRD) likewise showed no systematic increase around regional MHW establishment (Fig. S2).
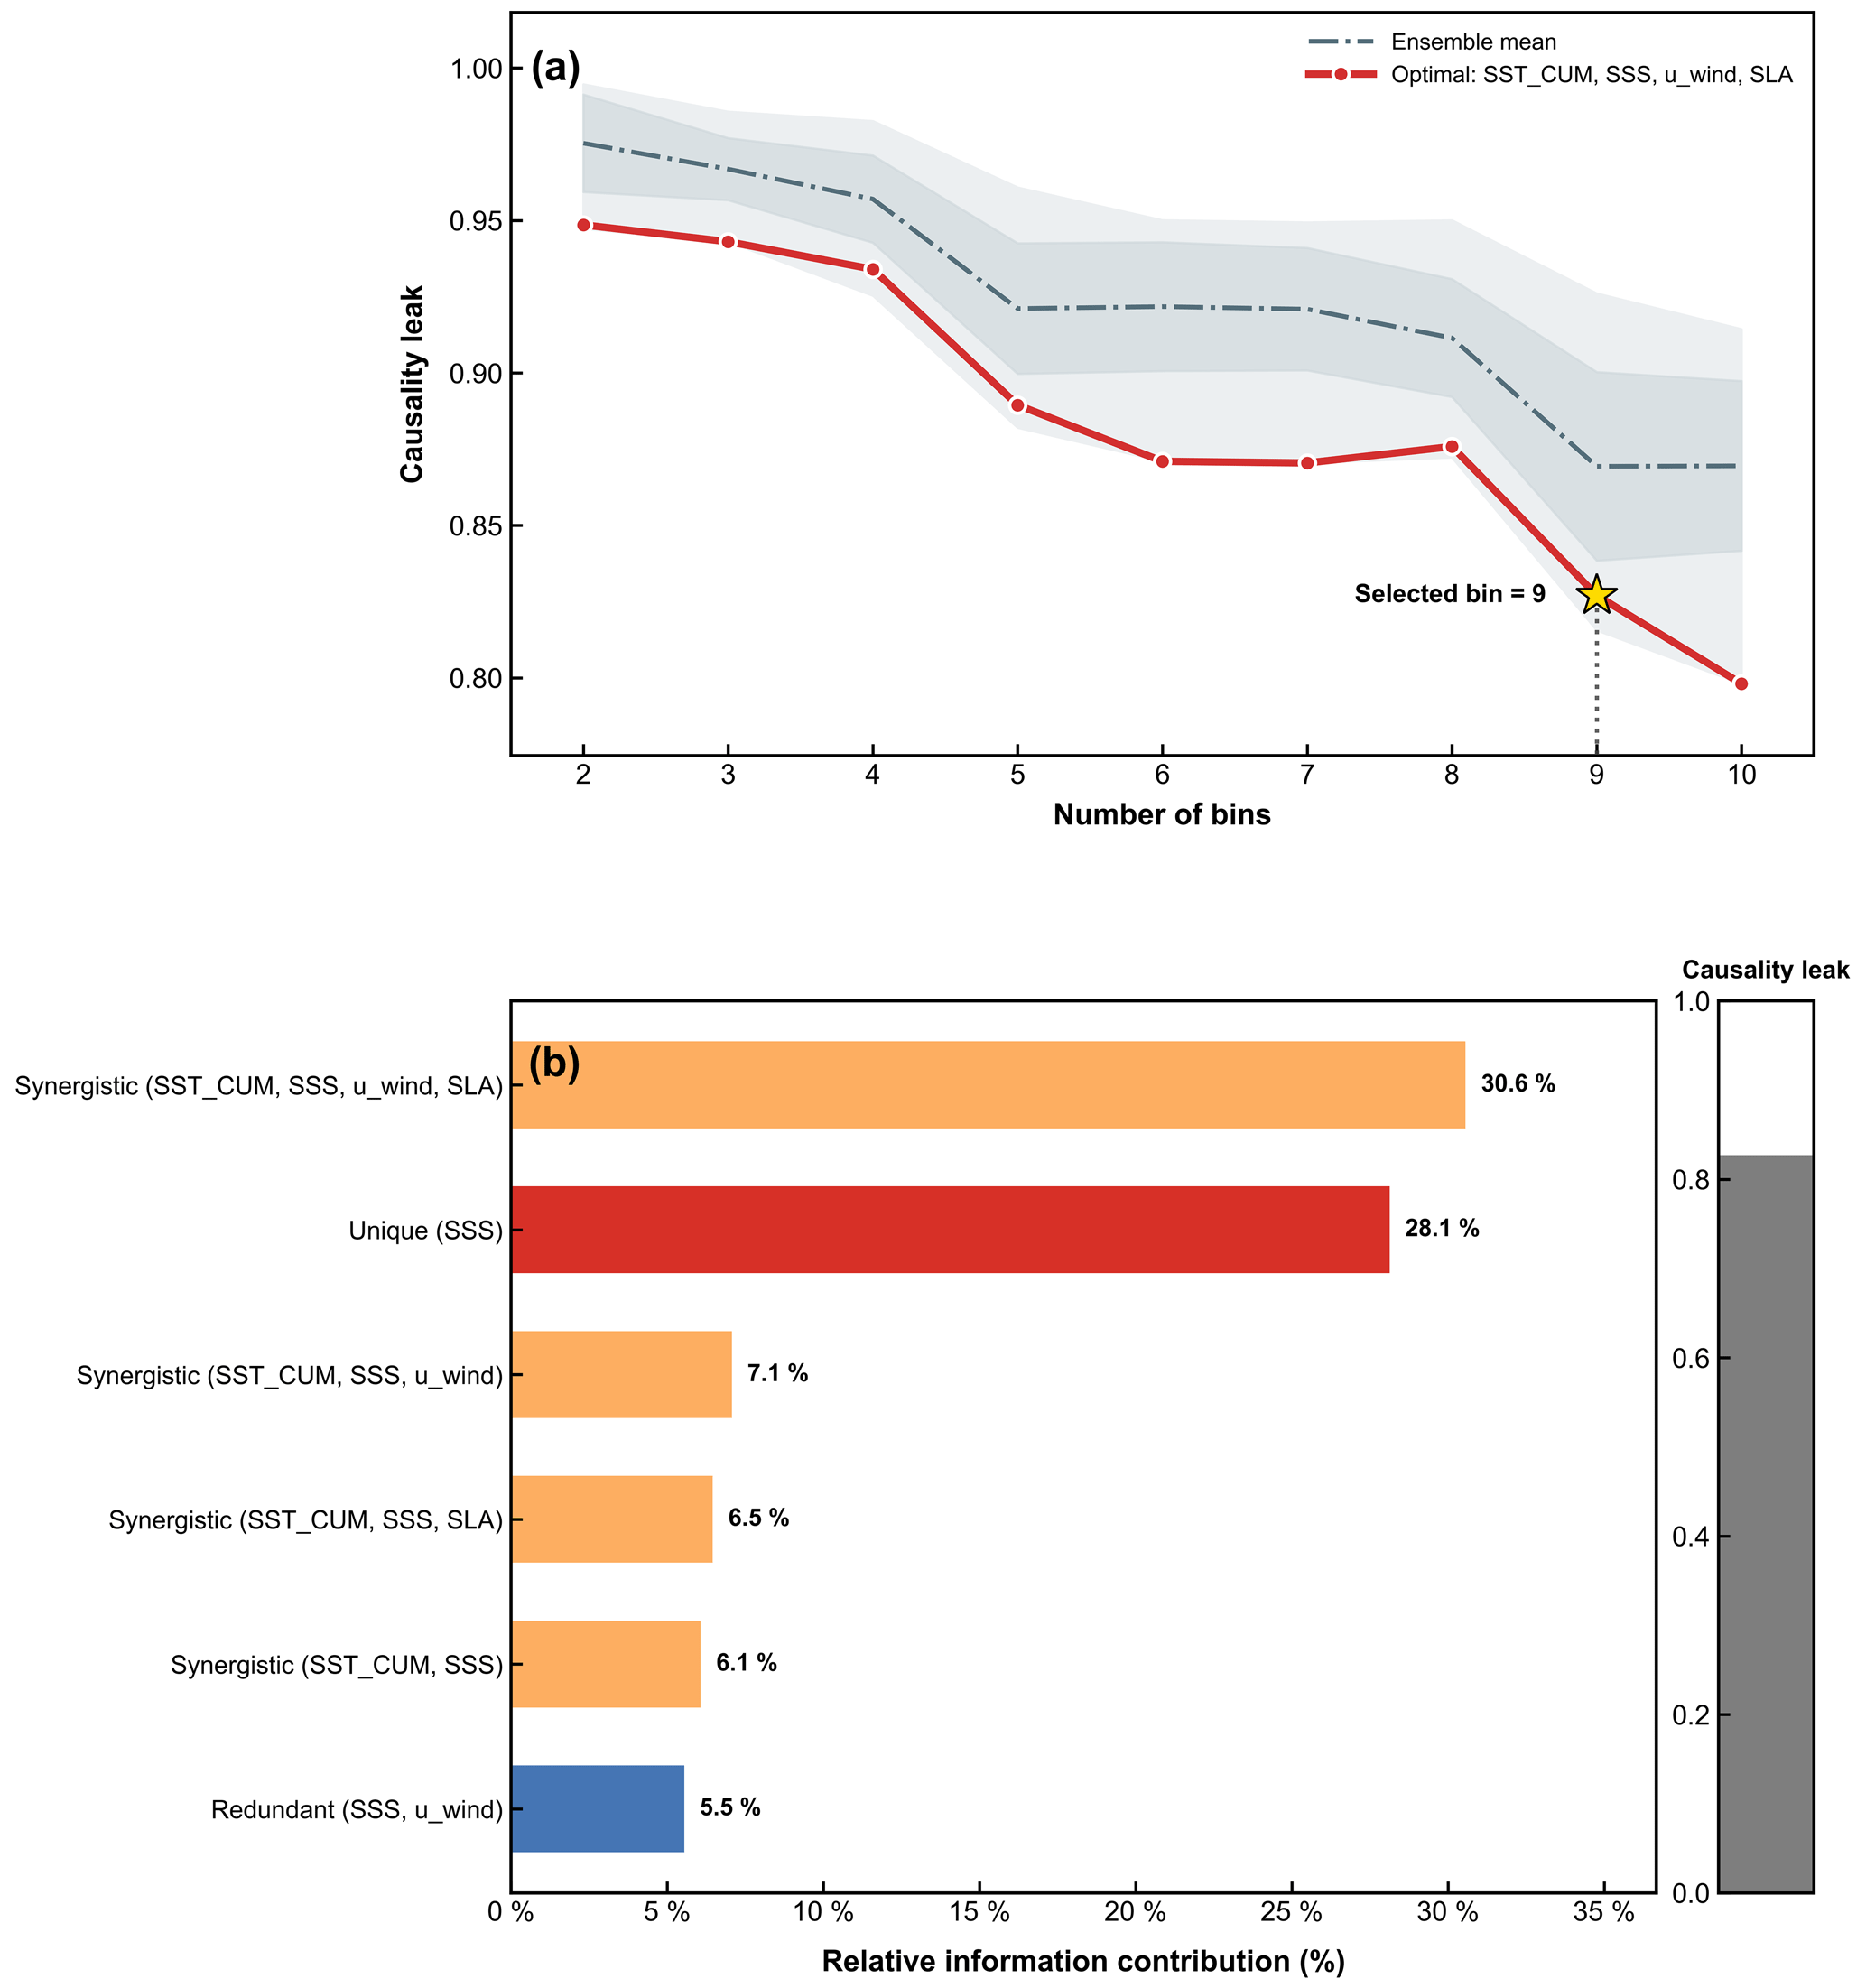
Figure 8Selection of the four-variable subset and SURD decomposition for the PRE during summer MHWs. (a) Sensitivity of the causality leak to the number of bins. The solid red line denotes the selected variable subset, and the dot-dashed grey line denotes the ensemble mean across all four-variable subsets. Shading indicates the full range and ±1 standard deviation of the ensemble. The yellow star marks the selected discretization parameter of nine bins. (b) Relative non-leak information contributions to the future Chl a anomaly. Percentages are normalized by the sum of all unique, redundant, and synergistic SURD terms for the selected subset. The grey bar indicates the causality leak, , which is normalized separately. Only the six largest non-leak terms are shown; therefore, the displayed percentages do not sum to 100 %.
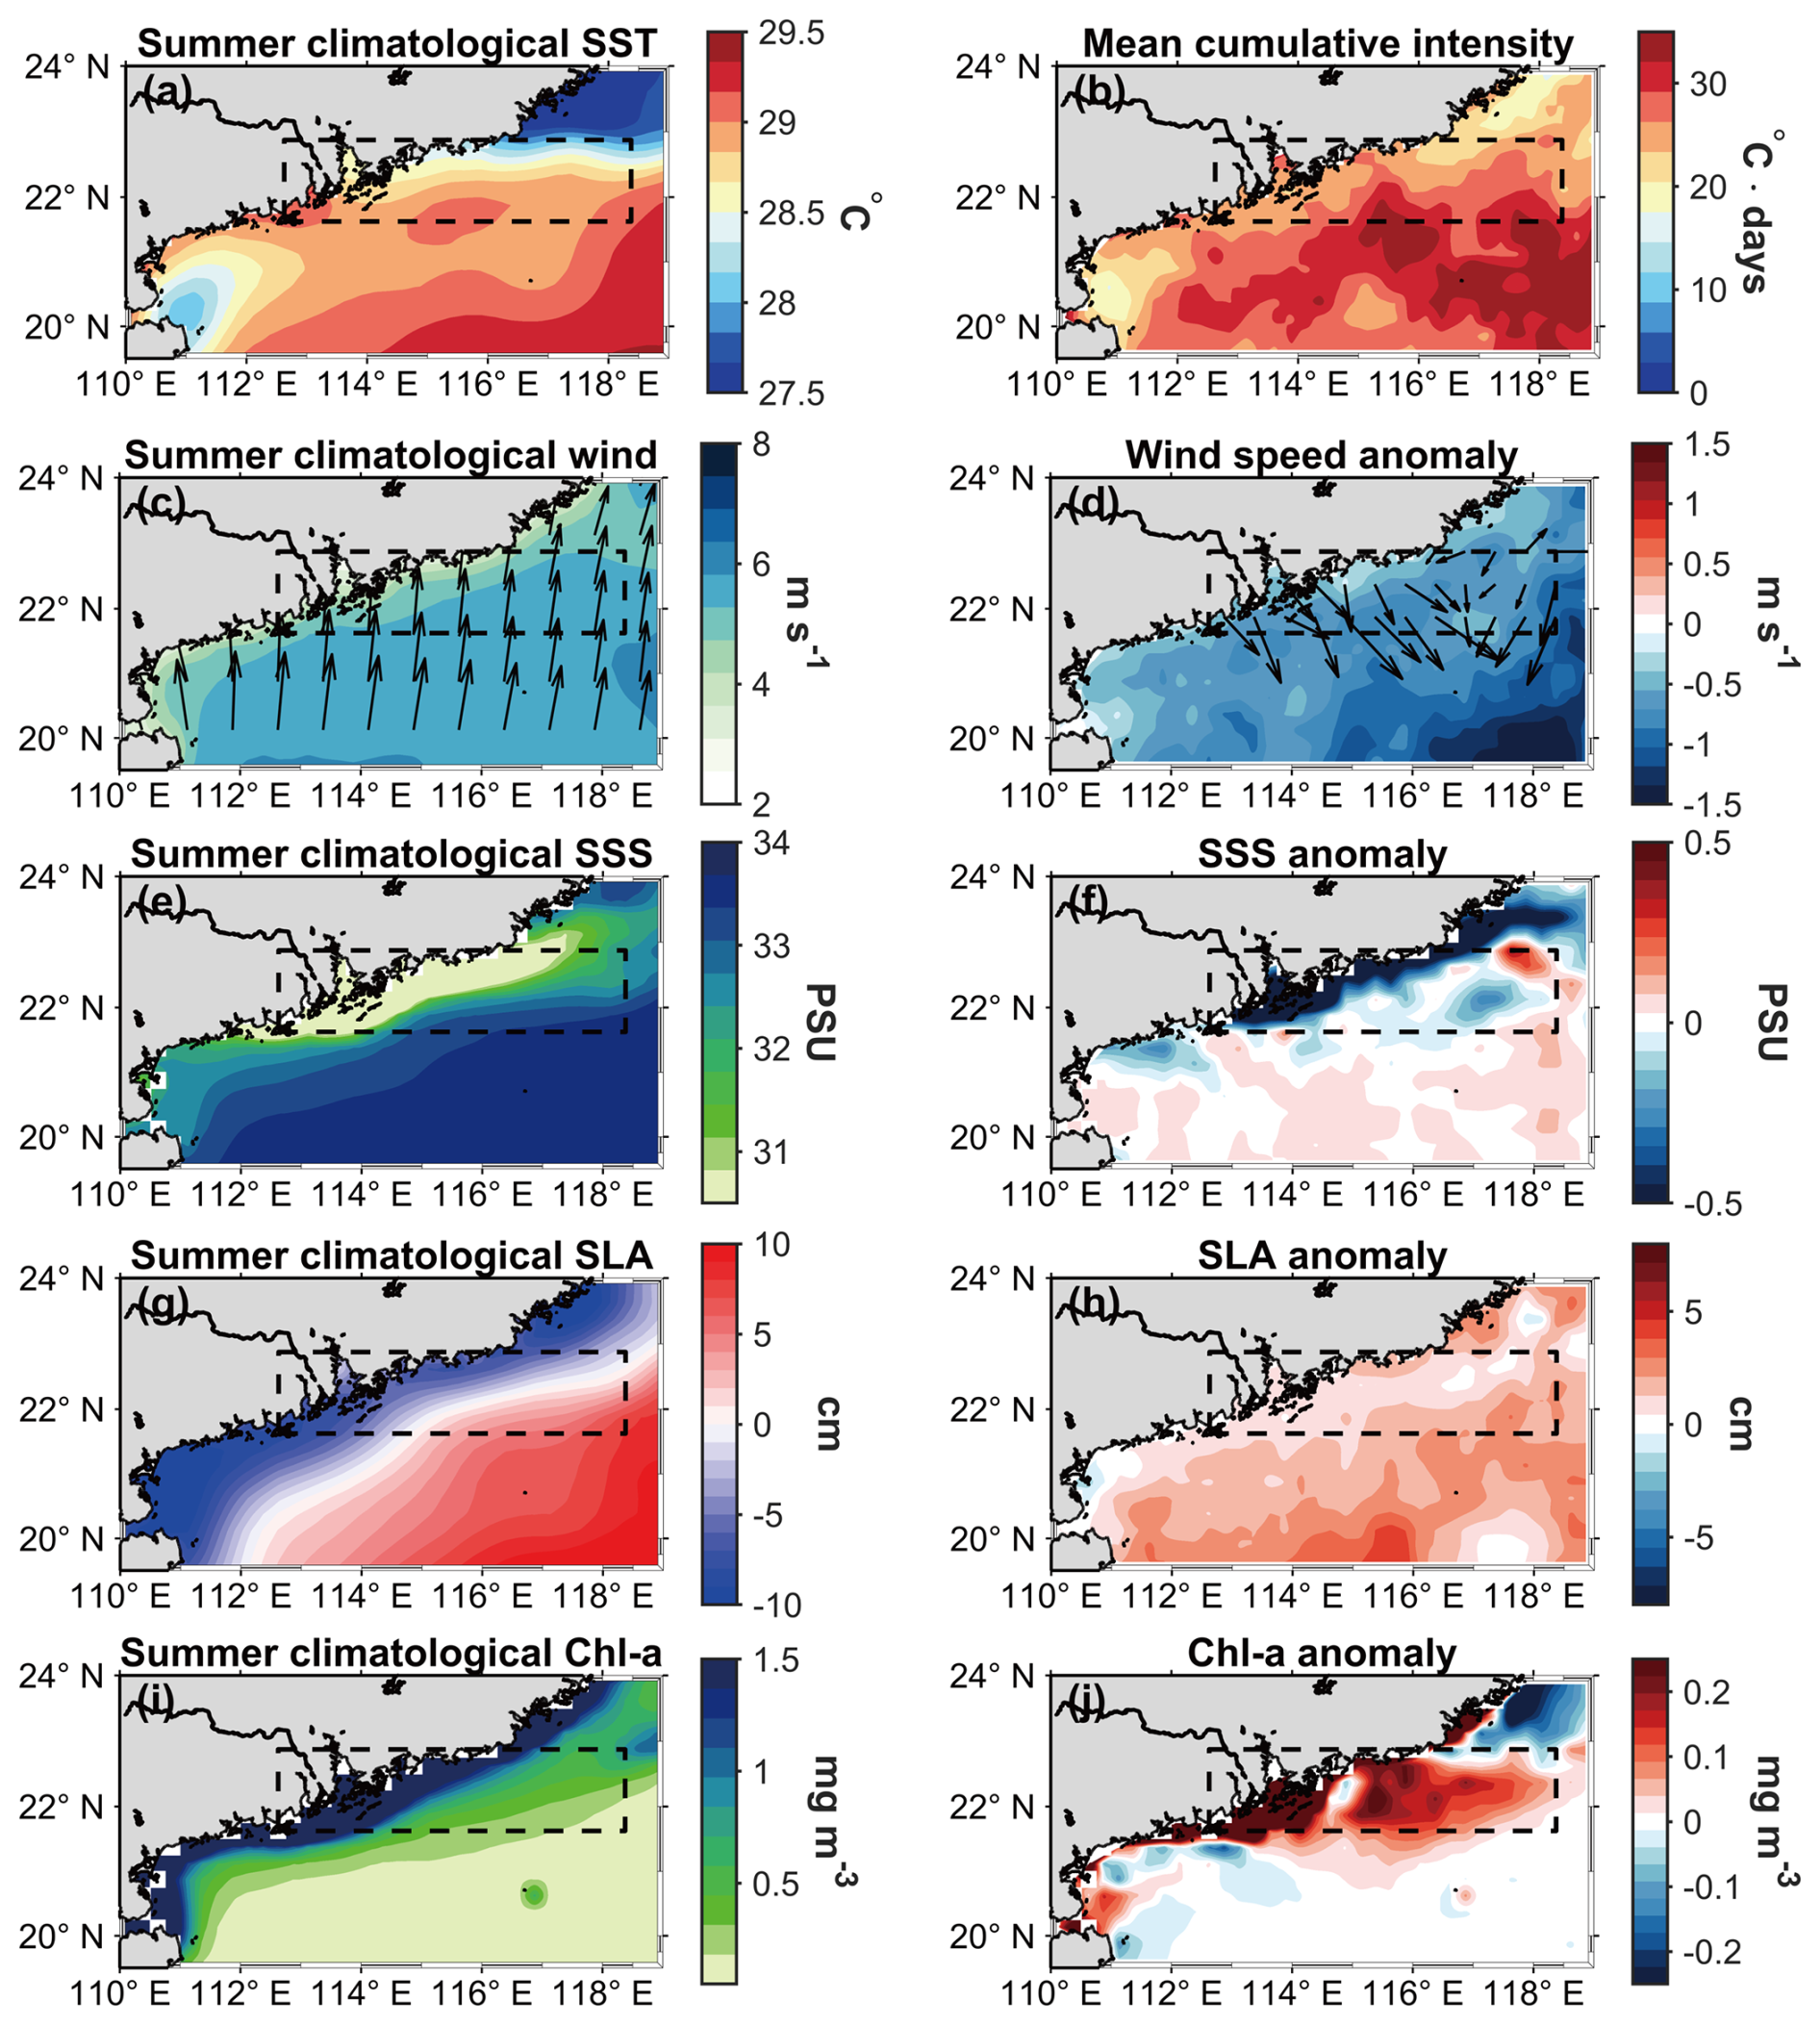
Figure 9Summer climatological fields and MHW-related anomaly composites in the PRE. The first row shows (a) summer climatological SST (°C) and (b) mean cumulative intensity of summer MHWs (°C d). The remaining rows display, from top to bottom, wind speed (m s−1), SSS (PSU), SLA (cm), and Chl a (mg m−3); the left and right columns represent the summer climatological mean and the corresponding MHW anomaly field, respectively. In the wind panels, arrows indicate climatological wind vectors in (c) and wind-vector anomalies in (d). The dashed black box denotes the PRE region used for regional analysis. The anomaly fields were calculated from daily departures relative to the day-of-year climatology and then averaged using an event-equal composite.
In the eutrophic PRE, nutrient concentrations often exhibit a negative correlation with salinity (Dai et al., 2008; Niu et al., 2020), so retention of Pearl River plume water could also maintain relatively nutrient-rich surface conditions. Because nutrient concentrations were not directly observed during the MHW events, this nutrient pathway remains inferred rather than directly demonstrated. The same low-salinity surface layer reduces surface density and strengthens salinity-driven stratification, consistent with the salinity and N2 anomaly patterns in Fig. S1a and c in the Supplement.
The four-variable synergy among SST_CUM, SSS, SLA, and u_wind supports a joint-state interpretation rather than a single-driver response. This term should not be interpreted as the sum of separate marginal effects from u_wind and SLA. The negligible unique contributions of u_wind and SLA indicate that neither variable provides strong independent information on its own. Instead, they become informative in the joint state because they help distinguish plume-retention conditions during cumulative heat stress. The composite fields show weakened winds relative to the summer monsoon background (Fig. 9c and d), reducing wind-driven offshore Ekman transport and favouring nearshore plume retention. Positive SLA anomalies over the adjacent shelf indicate elevated nearshore sea level during MHWs (Fig. 9h). This sea-level rise could reduce the estuary–shelf water-level gradient and slow the offshore spreading of plume water, reinforcing the retention effect of weakened winds. Sustained surface heating could further stabilize the upper layer, as indicated by positive temperature and N2 anomalies in Fig. S1b and c. This enhanced stratification could help maintain the low-salinity plume water within the upper layer and limit its vertical mixing with surrounding waters. Where nutrient availability remained sufficient, plume retention together with a warmer and more stratified surface environment could favour the observed positive surface Chl a anomalies. Such a response would be consistent with the strong dependence of phytoplankton responses to warming on nutrient availability (Marañón et al., 2018) and with evidence that MHWs can promote phytoplankton blooms in nutrient-rich coastal waters (Hayashida et al., 2020). Although the selected physical variables support the plume-retention interpretation, the relatively high causality leak in the PRE suggests that unresolved biogeochemical processes may also contribute to local Chl a variability.
The vertical Chl a diagnostics are also consistent with this stratification-related interpretation. Both the satellite observations and the BGC hindcast show positive surface Chl a anomalies in the PRE (Fig. S6b). This agreement supports the use of the BGC hindcast to further examine the vertical structure of the PRE response. Under climatological conditions, Chl a is concentrated near the surface (Fig. S6a), while widespread mixed-layer shoaling during summer MHWs indicates enhanced upper-ocean stratification (Fig. S7). The stronger stratification suppresses vertical exchange between the relatively high-Chl a upper layer and the lower-Chl a water below, favouring higher Chl a concentrations near the surface. Within the BGC hindcast, the positive surface Chl a anomaly is much larger in magnitude than the water-column mean anomaly, which is close to zero (−0.004 mg m−3; Fig. S6c). This difference supports a contribution from vertical redistribution to the positive surface Chl a response in the PRE.
3.4 Contrasting regional responses to the western North Pacific subtropical high
The VUA and the PRE exhibit contrasting Chl a responses during summer MHWs, yet their respective event composites point to a similar large-scale atmospheric background associated with the westward extension and intensification of the western North Pacific subtropical high (WNPSH; Fig. 10a and b). The WNPSH is the western sector of the North Pacific subtropical high and an important component of the summer atmospheric circulation over East Asia. Here, GH500 denotes 500 hPa geopotential height, expressed in geopotential metres (gpm), and the 5875 gpm contour is used as a proxy for the WNPSH extent (Basconcillo and Moon, 2022; Nie et al., 2024). Anomalous intensification and westward extension of the WNPSH are typically accompanied by an anomalous anticyclonic circulation over the western North Pacific and SCS. Associated subsidence can suppress convection and cloud cover, thereby increasing incoming shortwave radiation at the sea surface (Tan et al., 2022; Li et al., 2022). The accompanying wind anomalies can also weaken the SCS summer monsoon and suppress wind-driven upwelling and the midwestern SCS cold filament (Yao and Wang, 2021; Song et al., 2023). These processes reduce local ocean cooling and favour the development and persistence of summer MHWs in the SCS. Under similar large-scale circulation anomalies, differences in regional oceanographic settings give rise to distinct physical pathways and contrasting physical–biological coupling mechanisms (Fig. 11).
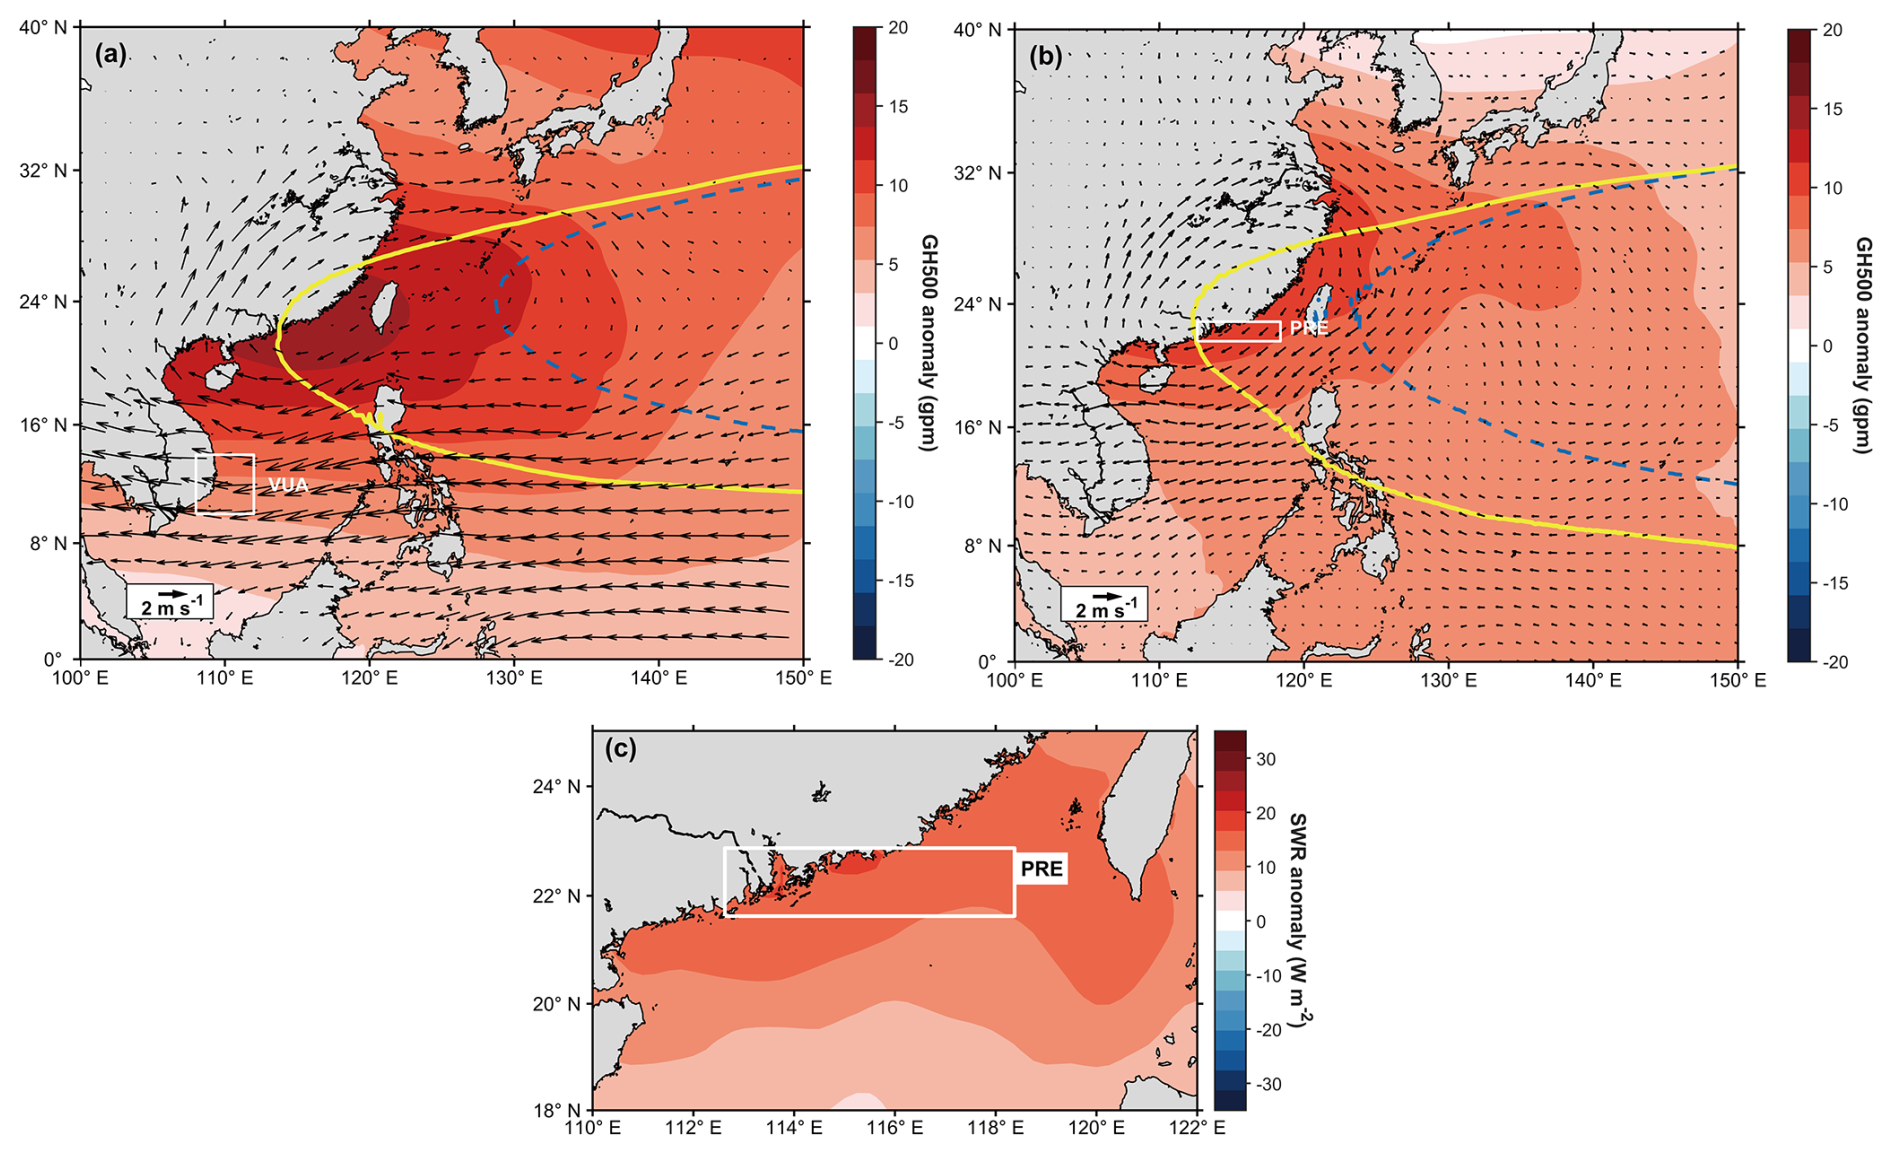
Figure 10Composite large-scale atmospheric circulation and local shortwave-radiation anomalies during summer MHWs. (a, b) Composite anomalies of 500 hPa geopotential height (GH500; geopotential metres, gpm) and 850 hPa wind (m s−1) for summer MHW events in (a) the VUA and (b) the PRE during 1998 to 2024. The reference vector in panels (a) and (b) indicates 2 m s−1. The dashed blue and solid yellow contours denote the summer-climatological and MHW composite 5875 gpm GH500 contours, respectively. (c) Composite SWR anomalies (W m−2) during summer MHW events in the PRE. All anomalies are relative to the summer climatology over the corresponding analysis period. White rectangles mark the focal study regions.
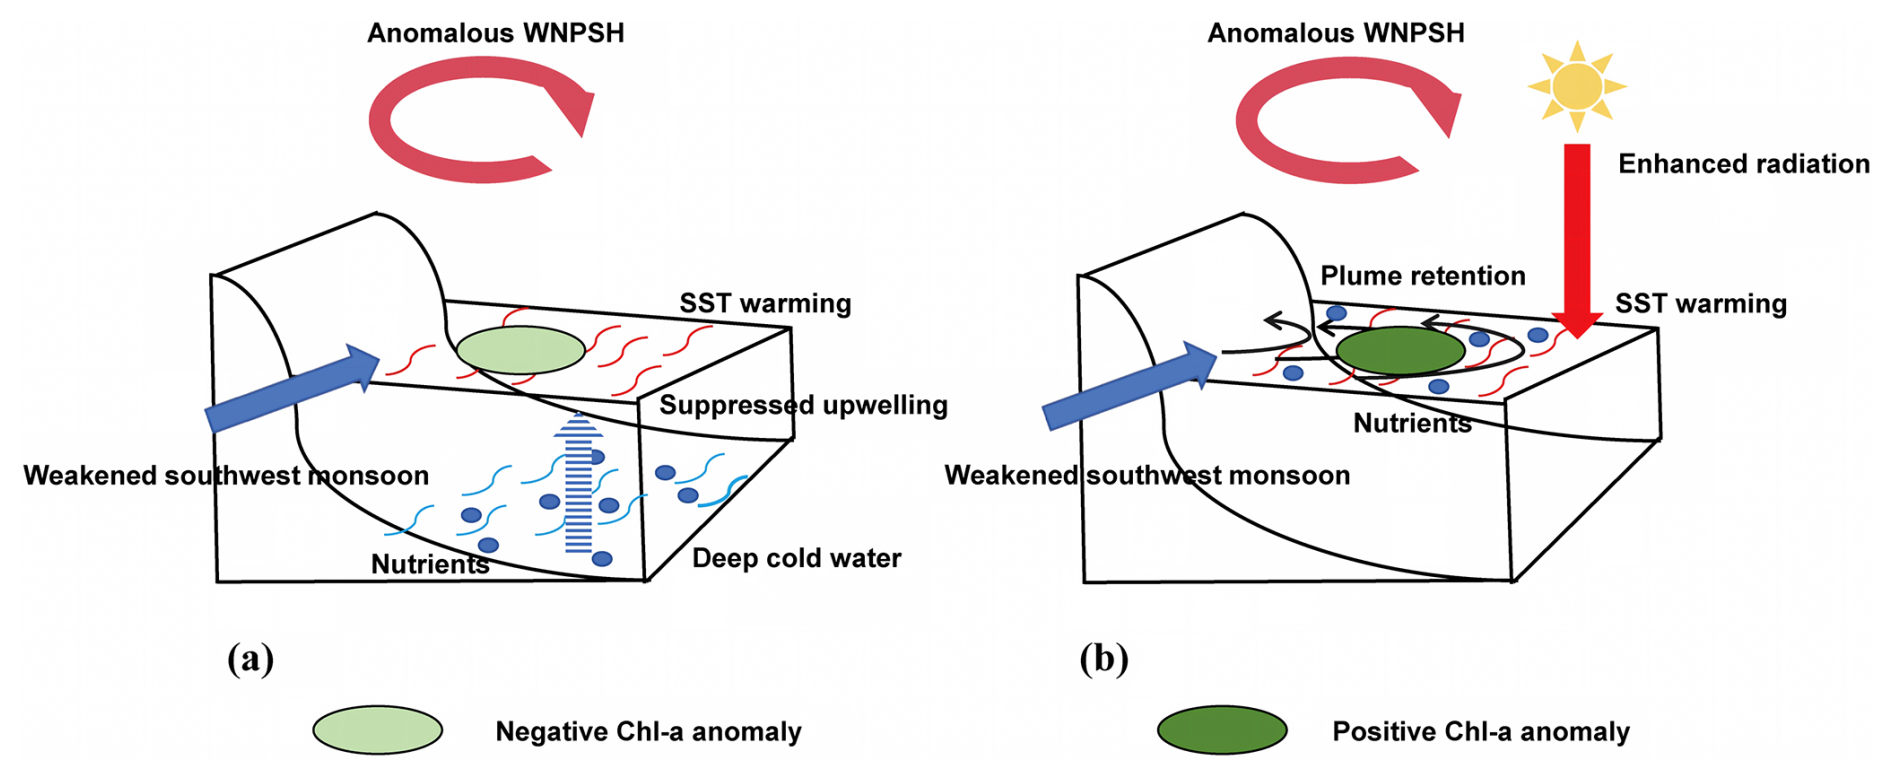
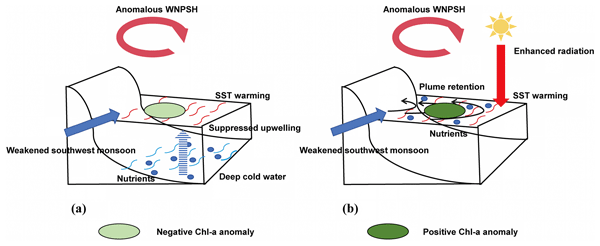
Figure 11Schematic diagram of the contrasting physical–biological coupling mechanisms in the VUA and the PRE during summer MHWs under an anomalous WNPSH. (a) In the VUA, a weakened southwest monsoon suppresses coastal upwelling, which simultaneously reduces surface cooling and restricts subsurface nutrient supply, thereby favouring MHW development and a negative Chl a anomaly. (b) In the PRE, enhanced shortwave radiation promotes surface warming and MHW development, while weakened wind-driven offshore transport favours nearshore retention of low-salinity river plume water, providing conditions associated with a positive Chl a anomaly. Arrows indicate key physical processes, and ellipse colours denote the sign of the Chl a response.
In the VUA, MHW occurrence and negative Chl a anomalies are linked through a common physical pathway. For the VUA events, positive GH500 anomalies and the westward extension of the 5875 gpm contour are accompanied by anomalous low-level winds consistent with weakened southwest monsoon forcing (Yao and Wang, 2021; Li et al., 2022). This shift in dynamical forcing weakens coastal Ekman transport and EPV. This suppression can produce two linked effects: first, reduced upwelling of cold subsurface water weakens surface cooling and favours elevated temperatures (Yao and Wang, 2021); second, restricted upward nutrient transport to the euphotic zone can contribute to decreased Chl a concentrations. These results indicate that MHW development and reduced Chl a in the VUA represent coupled thermal and biological responses to weakened vertical dynamics under the same anomalous wind forcing.
By contrast, the PRE exhibits a more complex response, reflecting the joint effects of thermal and dynamical processes. The WNPSH-related anomalies influence the PRE through two distinct pathways. Thermally, the PRE composite shows positive SWR anomalies over the northern shelf (Fig. 10c), indicating enhanced incident shortwave radiation during MHWs. Given that the SST variability in shallow areas is highly sensitive to surface heat fluxes, the enhanced radiation favours rapid surface warming and hence MHW development (Wang et al., 2022; Gao et al., 2023; Chen et al., 2025). Dynamically, WNPSH-related anomalous atmospheric circulations weakened low-level wind forcing over the northern SCS shelf (Fig. 10b), reducing wind-driven offshore transport. These conditions favour nearshore retention of low-salinity river plume water, consistent with the negative SSS anomalies in the plume-affected region (Fig. 9f). The absence of enhanced precipitation over the PRE and nearby PRD around these events further argues against anomalous rainfall as the primary cause of the nearshore freshening (Fig. S2). In the eutrophic PRE, retention of plume water could maintain favourable nutrient conditions for positive Chl a anomalies, although this nutrient pathway was not directly resolved in the present analysis. Together, these processes provide a physically consistent framework for the simultaneous occurrence of elevated temperatures and positive Chl a anomalies in the PRE, linking radiative warming with wind-regulated plume retention and a plausible nutrient-mediated response.
3.5 Causal leakage and uncertainty in SURD-based interpretation
In the SURD framework, the causality leak represents the residual uncertainty of the target variable that cannot be explained by the selected driver set under the prescribed time lag, variable combination, and discretization scheme. It should not be interpreted as model failure, but rather as reflecting the incompleteness of the current variable set in explaining Chl a variability. This residual uncertainty may arise from processes not represented by the selected variables, as well as from observational and finite-sample uncertainty, and therefore cannot be assigned to any single missing process. The causality leak is lower in the VUA than in the PRE, indicating that the selected physical variables capture a larger fraction of the information associated with Chl a anomalies in the upwelling system, whereas greater unresolved uncertainty remains in the estuarine shelf system. The substantial causality leak in both regions also indicates that processes beyond the selected physical drivers, including biological, biogeochemical, and optical processes, should be considered when interpreting the observed Chl a anomalies.
This regional difference reflects the contrasting process complexity of the two systems. In the VUA, negative Chl a anomalies are closely linked to wind-driven vertical dynamics. The selected variables, including EPV, SSS, SLA, and SST_CUM, represent key physical processes such as weakened upwelling, thermocline adjustment, and enhanced stratification. The SURD decomposition thus provides a physically consistent interpretation of the Chl a decline in the VUA. In comparison, the PRE is more complex. Chl a variability there is influenced by wind-regulated plume retention and surface warming, but also by biological, biogeochemical, and optical processes that are not fully represented by the selected physical variables. Nutrient and biological variables were not included in the SURD driver pool because suitable datasets with daily resolution, spatial continuity, and consistent reliability across both study regions over 1998 to 2024 were not available. This limitation is particularly relevant in nearshore and estuarine waters, where optically complex conditions affect satellite retrievals and model-derived biogeochemical variables remain subject to uncertainties associated with parameterization and limited observational constraints (Aurin and Dierssen, 2012; Mamnun et al., 2022; Skákala et al., 2024). Several processes affecting Chl a during MHWs therefore remain unresolved. In the turbid PRE, variations in suspended sediment and light availability may constrain phytoplankton growth and modify Chl a variability (Lu and Gan, 2015). Changes in grazing pressure may alter Chl a accumulation independently of bottom-up nutrient forcing, and microzooplankton grazing is known to represent an important phytoplankton loss pathway in coastal waters influenced by the Pearl River (Chen et al., 2009). MHWs can also alter phytoplankton community composition and size structure, potentially modifying the aggregate Chl a response (Arteaga and Rousseaux, 2023; Zhan et al., 2026). In coastal waters around China, including the Pearl River Delta, warming and MHWs have also been associated with changes in bloom occurrence, suggesting that biological responses to MHWs may extend beyond the physical pathways represented by the selected physical variables (Yang et al., 2026). These processes are plausible contributors to the larger causality leak in the PRE, although their individual contributions cannot be separated from the leak term in the present analysis.
Given these constraints, the PRE results should be interpreted as relative information contributions among the included physical variables, rather than as a complete attribution of estuarine Chl a variability. The high unique contribution of SSS and the synergistic contribution among SST_CUM, SSS, SLA, and u_wind support a physically consistent plume-retention interpretation, but they are insufficient to establish the nutrient delivery pathway. The lag sensitivity tests and bin-sensitivity analysis support the stability of the main SURD results under the tested settings.
These methodological checks cannot resolve uncertainties associated with omitted biological processes or with the biological interpretation of surface Chl a itself. Satellite-derived surface Chl a is not a direct measure of phytoplankton biomass or primary productivity. Physiological photoacclimation can alter cellular chlorophyll content independently of proportional biomass changes (Masuda et al., 2021). Accordingly, the physical pathways identified here should be interpreted as processes associated with the observed surface Chl a anomalies, rather than as direct evidence of changes in phytoplankton biomass or productivity. Distinguishing among these biological responses will require high-frequency in situ observations of nutrients, light attenuation, plankton biomass, and phytoplankton community composition during MHW events in the PRE.
This study used satellite observations and reanalysis data from 1998 to 2024 to investigate the contrasting surface Chl a responses to summer MHWs in the SCS. During summer MHWs, surface Chl a exhibited positive anomalies in the PRE and negative anomalies in the VUA. By applying SURD, we quantified the contributions of multiple physical drivers to these contrasting summer Chl a responses.
Although WNPSH-related circulation anomalies provided a similar large-scale atmospheric background, these contrasting responses were shaped largely by region-specific physical pathways. In the VUA, the unique contribution of EPV within the selected physical drivers indicates that weakened upwelling was the dominant identified physical pathway associated with the negative Chl a anomalies. Reduced vertical transport restricted nutrient replenishment to the euphotic zone. In addition, weakened upwelling brought less cold subsurface water to the surface, reducing surface cooling during MHWs. Enhanced stratification further inhibited vertical nutrient exchange. These processes contributed to the local Chl a decline.
In the PRE, SSS showed the largest unique information contribution among the selected physical drivers, and its synergy with SST_CUM, SLA, and u_wind supports a coupled radiative-warming and plume-retention interpretation. The negative SSS anomalies likely reflect the retention of low-salinity plume water. Precipitation did not increase during the MHW events, further supporting plume retention rather than anomalous rainfall as a cause of the observed nearshore freshening. Enhanced shortwave radiation favoured rapid surface warming and MHW development in this shallow shelf region, while weakened wind-driven export favoured the nearshore retention of low-salinity plume water. This low-salinity surface layer likely strengthened upper-ocean stratification and hence favoured the positive surface Chl a anomalies, although the associated nutrient pathway was not directly resolved.
By separating unique, redundant, and synergistic information, SURD distinguishes independent physical contributions from shared and joint effects among covarying drivers. The interpretation is limited by the variables in the current multi-source datasets, especially in the PRE. The higher causality leak in the PRE indicates that unresolved optical and biological processes, such as sediment-driven light limitation and zooplankton grazing, remain important sources of uncertainty. The plume-retention pathway in the PRE should therefore be treated as a physically supported interpretation rather than a complete explanation of the estuarine Chl a response. Future high-frequency observations of nutrients, optical properties, and plankton communities will be needed to validate the inferred pathways.
Overall, this study shows that contrasting Chl a responses to summer MHWs in the SCS cannot be explained by heat stress alone. In both the VUA and the PRE, SST_CUM showed no unique information contribution within the selected variable subsets but remained involved in synergistic interactions with region-specific physical variables. These findings highlight the importance of physical–biological coupling in shaping Chl a responses to MHWs. Because Chl a provides an indicator of phytoplankton conditions, and phytoplankton form the energetic foundation of marine food webs, persistent Chl a reductions may reduce energy availability for higher trophic levels and affect fisheries productivity in ecosystems (Ware and Thomson, 2005; Chassot et al., 2010). In addition, changes in Chl a may indicate alterations in marine primary production and biological carbon export, with implications for regional carbon cycling (Richardson, 2019; Siegel et al., 2023). Beyond the SCS, future applications of this SURD-based framework to other marginal seas worldwide could help assess whether MHW-driven Chl a responses arise from similar or regionally distinct physical–biological pathways.
The datasets used in this study are publicly available from their respective data providers. SST data were downloaded from NOAA OISST v2.1 (https://www.ncei.noaa.gov/data/sea-surface-temperature-optimum-interpolation/v2.1/access/avhrr/, last access: 23 May 2026). Surface Chl a data were obtained from the Copernicus Marine Service GlobColour L4 product (https://data.marine.copernicus.eu/product/OCEANCOLOUR_GLO_BGC_L4_MY_009_104/services, last access: 23 May 2026). Vertically resolved Chl a data were obtained from the Copernicus Marine Service Global Ocean Biogeochemistry Hindcast product (https://data.marine.copernicus.eu/product/GLOBAL_MULTIYEAR_BGC_001_029/description, last access: 27 August 2026). The 10 m wind, SWR, and total precipitation data were obtained from ERA5 daily statistics on single levels (https://cds.climate.copernicus.eu/datasets/derived-era5-single-levels-daily-statistics?tab=download, last access: 27 August 2026). GH500 and 850 hPa wind data were obtained from ERA5 daily statistics on pressure levels (https://cds.climate.copernicus.eu/datasets/derived-era5-pressure-levels-daily-statistics?tab=download, last access: 23 May 2026). Salinity, temperature, currents, and MLD data were obtained from the Copernicus Marine Service GLORYS12V1 ocean reanalysis product (https://data.marine.copernicus.eu/product/GLOBAL_MULTIYEAR_PHY_001_030/services, last access: 23 May 2026). SLA data were obtained from the Copernicus Marine Service sea level product (https://data.marine.copernicus.eu/product/SEALEVEL_GLO_PHY_CLIMATE_L4_MY_008_057/services, last access: 23 May 2026). All datasets were used for the common analysis period of 1998–2024.
The supplement related to this article is available online at https://doi.org/10.5194/os-22-3347-2026-supplement.
YLF and CL conceived the study. YLF, CL, and YCC designed the analysis framework. YLF compiled and processed the datasets, conducted the analyses, generated the figures, and wrote the original manuscript. YCC and MYL contributed to dataset compilation and checked the analyses. CL, YCC, and PLL contributed to the analysis design and interpretation of the results. All authors reviewed and edited the final version of the manuscript.
The contact author has declared that none of the authors has any competing interests.
Publisher's note: Copernicus Publications remains neutral with regard to jurisdictional claims made in the text, published maps, institutional affiliations, or any other geographical representation in this paper. The authors bear the ultimate responsibility for providing appropriate place names. Views expressed in the text are those of the authors and do not necessarily reflect the views of the publisher.
The authors are grateful for the support provided by the Hainan Provincial Observatory of Ecological Environment and Fishery Resource in Yazhou Bay. The authors also acknowledge NOAA/NCEI, the Copernicus Marine Service, the Copernicus Climate Data Store, and ECMWF for providing the datasets used in this study.
This research has been supported by the Project of Sanya Yazhou Bay Science and Technology City (contract no. SKJC-JYRC-2025-52), the Key Research and Development Program of Hainan Province (grant no. ZDYF2026SXLH039), and the Funds for Special Projects of the Central Government in Guidance of Local Science and Technology Development (grant no. 2025ZY01111).
This paper was edited by John M. Huthnance and reviewed by three anonymous referees.
Arteaga, L. A. and Rousseaux, C. S.: Impact of Pacific Ocean heatwaves on phytoplankton community composition, Commun. Biol., 6, 263, https://doi.org/10.1038/s42003-023-04645-0, 2023.
Aurin, D. A. and Dierssen, H. M.: Advantages and limitations of ocean color remote sensing in CDOM-dominated, mineral-rich coastal and estuarine waters, Remote Sens. Environ., 125, 181–197, https://doi.org/10.1016/j.rse.2012.07.001, 2012.
Basconcillo, J. and Moon, I.-J.: Increasing activity of tropical cyclones in East Asia during the mature boreal autumn linked to long-term climate variability, npj Clim. Atmos. Sci., 5, 4, https://doi.org/10.1038/s41612-021-00222-6, 2022.
Cavole, L. M., Demko, A. M., Diner, R. E., Giddings, A., Koester, I., Pagniello, C. M. L. S., Paulsen, M.-L., Ramirez-Valdez, A., Schwenck, S. M., Yen, N. K., Zill, M. E., and Franks, P. J. S.: Biological impacts of the 2013–2015 warm-water anomaly in the Northeast Pacific: winners, losers, and the future, Oceanography, 29, 273–285, https://doi.org/10.5670/oceanog.2016.32, 2016.
Chassot, E., Bonhommeau, S., Dulvy, N. K., Mélin, F., Watson, R., Gascuel, D., and Le Pape, O.: Global marine primary production constrains fisheries catches, Ecol. Lett., 13, 495–505, https://doi.org/10.1111/j.1461-0248.2010.01443.x, 2010.
Chen, B., Liu, H., Landry, M. R., Chen, M., Sun, J., Shek, L., Chen, X., and Harrison, P. J.: Estuarine nutrient loading affects phytoplankton growth and microzooplankton grazing at two contrasting sites in Hong Kong coastal waters, Mar. Ecol. Prog. Ser., 379, 77–90, https://doi.org/10.3354/meps07888, 2009.
Chen, Y., Shi, H., and Zhao, H.: Summer phytoplankton blooms induced by upwelling in the western South China Sea, Front. Mar. Sci., 8, 740130, https://doi.org/10.3389/fmars.2021.740130, 2021.
Chen, Y., Shen, C., Zhao, H., and Pan, G.: The impact of marine heatwaves on surface phytoplankton chlorophyll a in the South China Sea, Sci. Total Environ., 949, 175099, https://doi.org/10.1016/j.scitotenv.2024.175099, 2024.
Chen, Z., Wang, Y., Wang, J., Zhang, R.-H., Jiang, Y., Qi, Y., and Yu, X.: Distinct mechanisms of marine heatwave formation in offshore waters of China, J. Oceanol. Limnol., 43, 1405–1424, https://doi.org/10.1007/s00343-025-4192-3, 2025.
Cheng, L., Abraham, J., Hausfather, Z., and Trenberth, K. E.: How fast are the oceans warming?, Science, 363, 128–129, https://doi.org/10.1126/science.aav7619, 2019.
Chiswell, S. M.: Global Trends in Marine Heatwaves and Cold Spells: The Impacts of Fixed Versus Changing Baselines, J. Geophys. Res.-Oceans, 127, e2022JC018757, https://doi.org/10.1029/2022JC018757, 2022.
Coello-Camba, A. and Agustí, S.: Thermal Thresholds of Phytoplankton Growth in Polar Waters and Their Consequences for a Warming Polar Ocean, Front. Mar. Sci., 4, 168, https://doi.org/10.3389/fmars.2017.00168, 2017.
Dai, M., Wang, L., Guo, X., Zhai, W., Li, Q., He, B., and Kao, S.-J.: Nitrification and inorganic nitrogen distribution in a large perturbed river/estuarine system: the Pearl River Estuary, China, Biogeosciences, 5, 1227–1244, https://doi.org/10.5194/bg-5-1227-2008, 2008.
Dippner, J. W., Nguyen, K. V., Hein, H., Ohde, T., and Loick, N.: Monsoon-induced upwelling off the Vietnamese coast, Ocean Dynam., 57, 46–62, https://doi.org/10.1007/s10236-006-0091-0, 2007.
Drévillon, M., Fernandez, E., and Lellouche, J.-M.: Product User Manual for the Global Ocean Physical Multi Year Product, GLOBAL_MULTIYEAR_PHY_001_030, Issue 1.7, Copernicus Marine Service, https://documentation.marine.copernicus.eu/PUM/CMEMS-GLO-PUM-001-030.pdf (last access: 13 October 2026), 2025.
Fernández-González, C., Tarran, G. A., Schuback, N., Woodward, E. M. S., Arístegui, J., and Marañón, E.: Phytoplankton responses to changing temperature and nutrient availability are consistent across the tropical and subtropical Atlantic, Commun. Biol., 5, 1035, https://doi.org/10.1038/s42003-022-03971-z, 2022.
Gao, Z., Jia, W., Zhang, W., and Wang, P.: Study on seasonal characteristics and causes of marine heatwaves in the South China Sea over nearly 30 years, Atmosphere-Basel, 14, 1822, https://doi.org/10.3390/atmos14121822, 2023.
Gill, A. E.: Atmosphere-Ocean Dynamics, International Geophysics, 30, Academic Press, 662 pp., ISBN 9780122835223, 1982.
Global Ocean Colour: Global Ocean Colour (Copernicus-GlobColour), Bio-Geo-Chemical, L4 (monthly and interpolated) from Satellite Observations (1997–ongoing), E. U. Copernicus Marine Service Information (CMEMS), Marine Data Store (MDS) [data set], https://doi.org/10.48670/moi-00281, 2025.
Global Ocean Gridded: Global Ocean Gridded L4 sea surface heights and derived variables reprocessed Copernicus Climate Service, E. U. Copernicus Marine Service Information (CMEMS), Marine Data Store (MDS) [data set], https://doi.org/10.48670/moi-00145, 2024.
Global Ocean Physics Reanalysis: Global Ocean Physics Reanalysis, E. U. Copernicus Marine Service Information (CMEMS), Marine Data Store (MDS) [data set], https://doi.org/10.48670/moi-00021, 2023.
Han, Y., Zhou, P., Lv, Q., Cui, R., and Meng, L.: Synergistic drivers and threshold effects of vapor pressure deficit in China: An integrated framework of causal inference and machine learning, J. Environ. Manage., 395, 127739, https://doi.org/10.1016/j.jenvman.2025.127739, 2025.
Harrison, P. J., Yin, K., Lee, J. H. W., Gan, J., and Liu, H.: Physical–biological coupling in the Pearl River Estuary, Cont. Shelf Res., 28, 1405–1415, https://doi.org/10.1016/j.csr.2007.02.011, 2008.
Hayashida, H., Matear, R. J., and Strutton, P. G.: Background nutrient concentration determines phytoplankton bloom response to marine heatwaves, Glob. Change Biol., 26, 4800–4811, https://doi.org/10.1111/gcb.15255, 2020.
He, J. and Mahadevan, A.: How the source depth of coastal upwelling relates to stratification and wind, J. Geophys. Res.-Oceans, 126, e2021JC017621, https://doi.org/10.1029/2021JC017621, 2021.
He, W., Zeng, X., Deng, L., Pi, Q. L. C., and Zhao, J.: Enhanced impact of prolonged MHWs on satellite-observed chlorophyll in the South China Sea, Prog. Oceanogr., 218, 103123, https://doi.org/10.1016/j.pocean.2023.103123, 2023.
Herrmann, M., To Duy, T., and Estournel, C.: Intraseasonal variability of the South Vietnam upwelling, South China Sea: influence of atmospheric forcing and ocean intrinsic variability, Ocean Sci., 19, 453–467, https://doi.org/10.5194/os-19-453-2023, 2023.
Hersbach, H., Comyn-Platt, E., Bell, B., Berrisford, P., Biavati, G., Horányi, A., Muñoz Sabater, J., Nicolas, J., Peubey, C., Radu, R., Rozum, I., Schepers, D., Simmons, A., Soci, C., Dee, D., Thépaut, J.-N., Cagnazo, C., and Cucchi, M.: ERA5 post-processed daily statistics on pressure levels from 1940 to present, Copernicus Climate Change Service (C3S) Climate Data Store (CDS) [data set], https://doi.org/10.24381/cds.50314f4c, 2023a.
Hersbach, H., Comyn-Platt, E., Bell, B., Berrisford, P., Biavati, G., Horányi, A., Muñoz Sabater, J., Nicolas, J., Peubey, C., Radu, R., Rozum, I., Schepers, D., Simmons, A., Soci, C., Dee, D., Thépaut, J.-N., Cagnazo, C., and Cucchi, M.: ERA5 post-processed daily statistics on single levels from 1940 to present, Copernicus Climate Change Service (C3S) Climate Data Store (CDS) [data set], https://doi.org/10.24381/cds.4991cf48, 2023b.
Hobday, A. J., Alexander, L. V., Perkins, S. E., Smale, D. A., Straub, S. C., Oliver, E. C. J., Benthuysen, J. A., Burrows, M. T., Donat, M. G., Feng, M., Holbrook, N. J., Moore, P. J., Scannell, H. A., Sen Gupta, A., and Wernberg, T.: A hierarchical approach to defining marine heatwaves, Prog. Oceanogr., 141, 227–238, https://doi.org/10.1016/j.pocean.2015.12.014, 2016.
Hong, B., Xue, H., Zhu, L., and Xu, H.: Climatic change of summer wind direction and its impact on hydrodynamic circulation in the Pearl River Estuary, J. Mar. Sci. Eng., 10, 842, https://doi.org/10.3390/jmse10070842, 2022.
Huang, B., Liu, C., Banzon, V. F., Freeman, E., Graham, G., Hankins, W., Smith, T. M., and Zhang, H.-M.: NOAA 0.25-degree Daily Optimum Interpolation Sea Surface Temperature (OISST), Version 2.1, NOAA National Centers for Environmental Information [data set], https://doi.org/10.25921/RE9P-PT57, 2020.
Jiang, K., Wang, Y., Sun, Y., and Lan, J.: The seasonal variation of shallow meridional overturning circulation in the South China Sea and the related dynamics, Ocean Model., 186, 102242, https://doi.org/10.1016/j.ocemod.2023.102242, 2023.
Jones, T., Parrish, J. K., Peterson, W. T., Bjorkstedt, E. P., Bond, N. A., Ballance, L. T., Bowes, V., Hipfner, J. M., Burgess, H. K., Dolliver, J. E., Lindquist, K., Lindsey, J., Nevins, H. M., Robertson, R. R., Roletto, J., Wilson, L., Joyce, T., and Harvey, J.: Massive mortality of a planktivorous seabird in response to a marine heatwave, Geophys. Res. Lett., 45, 3193–3202, https://doi.org/10.1002/2017GL076164, 2018.
Le Grix, N., Zscheischler, J., Laufkötter, C., Rousseaux, C. S., and Frölicher, T. L.: Compound high-temperature and low-chlorophyll extremes in the ocean over the satellite period, Biogeosciences, 18, 2119–2137, https://doi.org/10.5194/bg-18-2119-2021, 2021.
Lellouche, J.-M., Greiner, E., Bourdallé-Badie, R., Garric, G., Melet, A., Drévillon, M., Bricaud, C., Hamon, M., Le Galloudec, O., Regnier, C., Candela, T., Testut, C.-E., Gasparin, F., Ruggiero, G., Benkiran, M., Drillet, Y., and Le Traon, P.-Y.: The Copernicus Global ° oceanic and sea ice GLORYS12 reanalysis, Front. Earth Sci., 9, 698876, https://doi.org/10.3389/feart.2021.698876, 2021.
Le Nohaïc, M., Ross, C. L., Cornwall, C. E., Comeau, S., Lowe, R., McCulloch, M. T., and Schoepf, V.: Marine heatwave causes unprecedented regional mass bleaching of thermally resistant corals in northwestern Australia, Sci. Rep.-UK, 7, 14999, https://doi.org/10.1038/s41598-017-14794-y, 2017.
Li, J., Miller, A. J., Wang, Q., Amaya, D. J., Li, P., Gu, Y., and Bai, P.: Vertical structure of chlorophyll a during marine heatwaves in the California Current Ecosystem, Commun. Earth Environ., 6, 938, https://doi.org/10.1038/s43247-025-02835-8, 2025.
Li, S., Yu, K., Chen, T., Shi, Q., and Zhang, H.: Assessment of coral bleaching using symbiotic zooxanthellae density and satellite remote sensing data in the Nansha Islands, South China Sea, Chinese Sci. Bull., 56, 1031–1037, https://doi.org/10.1007/s11434-011-4390-6, 2011.
Li, Y., Ren, G., Wang, Q., and You, Q.: More extreme marine heatwaves in the China Seas during the global warming hiatus, Environ. Res. Lett., 14, 104010, https://doi.org/10.1088/1748-9326/ab28bc, 2019.
Li, Y., Ren, G., Wang, Q., Mu, L., and Niu, Q.: Marine heatwaves in the South China Sea: tempo-spatial pattern and its association with large-scale circulation, Remote Sens.-Basel, 14, 5829, https://doi.org/10.3390/rs14225829, 2022.
Liu, F. and Tang, S.: A double-peak intraseasonal pattern in the chlorophyll concentration associated with summer upwelling and mesoscale eddies in the western South China Sea, J. Geophys. Res.-Oceans, 127, e2021JC017402, https://doi.org/10.1029/2021JC017402, 2022.
Liu, W. T. and Xie, X.: Spacebased observations of the seasonal changes of south Asian monsoons and oceanic responses, Geophys. Res. Lett., 26, 1473–1476, https://doi.org/10.1029/1999GL900289, 1999.
Lu, Z. and Gan, J.: Controls of seasonal variability of phytoplankton blooms in the Pearl River Estuary, Deep-Sea Res. Pt. II, 117, 86–96, https://doi.org/10.1016/j.dsr2.2013.12.011, 2015.
Ma, X. and Chen, G.: Marine heatwaves are shaping the vertical structure of phytoplankton in the global ocean, Commun. Earth Environ., 6, 715, https://doi.org/10.1038/s43247-025-02718-y, 2025.
Mamnun, N. M. N., Völker, C., Vrekoussis, M., and Nerger, L.: Uncertainties in ocean biogeochemical simulations: Application of ensemble data assimilation to a one-dimensional model, Front. Mar. Sci., 9, 984236, https://doi.org/10.3389/fmars.2022.984236, 2022.
Marañón, E., Lorenzo, M. P., Cermeño, P., and Mouriño-Carballido, B.: Nutrient limitation suppresses the temperature dependence of phytoplankton metabolic rates, ISME J., 12, 1836–1845, https://doi.org/10.1038/s41396-018-0105-1, 2018.
Martínez-Sánchez, Á., Arranz, G., and Lozano-Durán, A.: Decomposing causality into its synergistic, unique, and redundant components, Nat. Commun., 15, 9296, https://doi.org/10.1038/s41467-024-53373-4, 2024.
Masuda, Y., Yamanaka, Y., Smith, S. L., Hirata, T., Nakano, H., Oka, A., and Sumata, H.: Photoacclimation by phytoplankton determines the distribution of global subsurface chlorophyll maxima in the ocean, Commun. Earth Environ., 2, 128, https://doi.org/10.1038/s43247-021-00201-y, 2021.
Montie, S., Thomsen, M. S., Rack, W., and Broady, P. A.: Extreme summer marine heatwaves increase chlorophyll a in the Southern Ocean, Antarct. Sci., 32, 508–509, https://doi.org/10.1017/S0954102020000401, 2020.
Ngo, M.-H. and Hsin, Y.-C.: Impacts of wind and current on the interannual variation of the summertime upwelling off southern Vietnam in the South China Sea, J. Geophys. Res.-Oceans, 126, e2020JC016892, https://doi.org/10.1029/2020JC016892, 2021.
Nie, J., Fang, J., Yang, X.-Q., and Huang, Q.: Subseasonal relationship between the zonal oscillation of the Western Pacific Subtropical High and the South Asia High, Clim. Dynam., 62, 7293–7308, https://doi.org/10.1007/s00382-024-07279-y, 2024.
Niu, L., van Gelder, P., Luo, X., Cai, H., Zhang, T., and Yang, Q.: Implications of nutrient enrichment and related environmental impacts in the Pearl River Estuary, China: characterizing the seasonal influence of riverine input, Water-Sui, 12, 3245, https://doi.org/10.3390/w12113245, 2020.
Noh, K. M., Lim, H.-G., and Kug, J.-S.: Global chlorophyll responses to marine heatwaves in satellite ocean color, Environ. Res. Lett., 17, 064034, https://doi.org/10.1088/1748-9326/ac70ec, 2022.
Oliver, E. C. J., Benthuysen, J. A., Bindoff, N. L., Hobday, A. J., Holbrook, N. J., Mundy, C. N., and Perkins-Kirkpatrick, S. E.: The unprecedented 2015/16 Tasman Sea marine heatwave, Nat. Commun., 8, 16101, https://doi.org/10.1038/ncomms16101, 2017.
Oliver, E. C. J., Donat, M. G., Burrows, M. T., Moore, P. J., Smale, D. A., Alexander, L. V., Benthuysen, J. A., Feng, M., Sen Gupta, A., Hobday, A. J., Holbrook, N. J., Perkins-Kirkpatrick, S. E., Scannell, H. A., Straub, S. C., and Wernberg, T.: Longer and more frequent marine heatwaves over the past century, Nat. Commun., 9, 1324, https://doi.org/10.1038/s41467-018-03732-9, 2018.
Panja, M., Das, D., Chakraborty, T., Ray, A., Athulya, R., Hens, C., Dana, S. K., Murukesh, N., and Ghosh, D.: Forecasting precipitation in the Arctic using probabilistic machine learning informed by causal climate drivers, Chaos, 35, 113108, https://doi.org/10.1063/5.0297336, 2025.
Ren, K., Guo, W., Wang, F., Qu, J., Ming, T., and Fang, W.: Synergistic-unique-redundant decomposition of the causal influences of four large-scale climate oscillations on meteorological drought in the Yangtze River Basin, Stoch. Env. Res. Risk A., 40, 128, https://doi.org/10.1007/s00477-026-03255-6, 2026.
Richardson, T. L.: Mechanisms and Pathways of Small-Phytoplankton Export from the Surface Ocean, Annu. Rev. Mar. Sci., 11, 57–74, https://doi.org/10.1146/annurev-marine-121916-063627, 2019.
Robinson, A., Lehmann, J., Barriopedro, D., Rahmstorf, S., and Coumou, D.: Increasing heat and rainfall extremes now far outside the historical climate, npj Clim. Atmos. Sci., 4, 45, https://doi.org/10.1038/s41612-021-00202-w, 2021.
Siegel, D. A., DeVries, T., Cetinić, I., and Bisson, K. M.: Quantifying the Ocean's Biological Pump and Its Carbon Cycle Impacts on Global Scales, Annu. Rev. Mar. Sci., 15, 329–356, https://doi.org/10.1146/annurev-marine-040722-115226, 2023.
Skákala, J., Ford, D., Fowler, A., Lea, D., Martin, M. J., and Ciavatta, S.: How uncertain and observable are marine ecosystem indicators in shelf seas?, Prog. Oceanogr., 224, 103249, https://doi.org/10.1016/j.pocean.2024.103249, 2024.
Song, Q., Yao, Y., and Wang, C.: Response of Future Summer Marine Heatwaves in the South China Sea to Enhanced Western Pacific Subtropical High, Geophys. Res. Lett., 50, e2023GL103667, https://doi.org/10.1029/2023GL103667, 2023.
Tan, H.-J., Cai, R.-S., and Wu, R.-G.: Summer marine heatwaves in the South China Sea: Trend, variability and possible causes, Adv. Clim. Change Res., 13, 323–332, https://doi.org/10.1016/j.accre.2022.04.003, 2022.
Thomas, M. K., Kremer, C. T., Klausmeier, C. A., and Litchman, E.: A Global Pattern of Thermal Adaptation in Marine Phytoplankton, Science, 338, 1085–1088, https://doi.org/10.1126/science.1224836, 2012.
To Duy, T., Herrmann, M., Estournel, C., Marsaleix, P., Duhaut, T., Bui Hong, L., and Trinh Bich, N.: The role of wind, mesoscale dynamics, and coastal circulation in the interannual variability of the South Vietnam Upwelling, South China Sea – answers from a high-resolution ocean model, Ocean Sci., 18, 1131–1161, https://doi.org/10.5194/os-18-1131-2022, 2022.
von Schuckmann, K., Cheng, L., Palmer, M. D., Hansen, J., Tassone, C., Aich, V., Adusumilli, S., Beltrami, H., Boyer, T., Cuesta-Valero, F. J., Desbruyères, D., Domingues, C., García-García, A., Gentine, P., Gilson, J., Gorfer, M., Haimberger, L., Ishii, M., Johnson, G. C., Killick, R., King, B. A., Kirchengast, G., Kolodziejczyk, N., Lyman, J., Marzeion, B., Mayer, M., Monier, M., Monselesan, D. P., Purkey, S., Roemmich, D., Schweiger, A., Seneviratne, S. I., Shepherd, A., Slater, D. A., Steiner, A. K., Straneo, F., Timmermans, M.-L., and Wijffels, S. E.: Heat stored in the Earth system: where does the energy go?, Earth Syst. Sci. Data, 12, 2013–2041, https://doi.org/10.5194/essd-12-2013-2020, 2020.
Wang, Q., Zhang, B., Zeng, L., He, Y., Wu, Z., and Chen, J.: Properties and drivers of marine heat waves in the northern South China Sea, J. Phys. Oceanogr., 52, 917–927, https://doi.org/10.1175/JPO-D-21-0236.1, 2022.
Wang, Y., Zhang, C., Tian, S., Chen, Q., Li, S., Zeng, J., Wei, Z., and Xie, S.: Seasonal cycle of marine heatwaves in the northern South China Sea, Clim. Dynam., 61, 3367–3377, https://doi.org/10.1007/s00382-023-06747-1, 2023.
Ware, D. M. and Thomson, R. E.: Bottom-up ecosystem trophic dynamics determine fish production in the Northeast Pacific, Science, 308, 1280–1284, https://doi.org/10.1126/science.1109049, 2005.
Wernberg, T., Bennett, S., Babcock, R. C., De Bettignies, T., Cure, K., Depczynski, M., Dufois, F., Fromont, J., Fulton, C. J., Hovey, R. K., Harvey, E. S., Holmes, T. H., Kendrick, G. A., Radford, B., Santana-Garcon, J., Saunders, B. J., Smale, D. A., Thomsen, M. S., Tuckett, C. A., Tuya, F., Vanderklift, M. A., and Wilson, S.: Climate-driven regime shift of a temperate marine ecosystem, Science, 353, 169–172, https://doi.org/10.1126/science.aad8745, 2016.
Wilcoxon, F.: Individual comparisons by ranking methods, Biometrics Bull., 1, 80–83, https://doi.org/10.2307/3001968, 1945.
Wu, X., Yao, F., and Wang, D.: Interannual variability of the summer surface salinity in the southern South China Sea driven by the summer monsoon, J. Geophys. Res.-Oceans, 130, e2025JC022399, https://doi.org/10.1029/2025JC022399, 2025.
Xu, W., Wang, G., Cheng, X., Jiang, L., Zhou, W., and Cao, W.: Characteristics of subsurface chlorophyll maxima during the boreal summer in the South China Sea with respect to environmental properties, Sci. Total Environ., 820, 153243, https://doi.org/10.1016/j.scitotenv.2022.153243, 2022.
Yang, S., Feng, L., Dai, Y., Liu, X., Zheng, C., Wang, D.-Z., Zhou, K., and Zhai, X.: Phytoplankton Blooms in the Coastal Seas Around China Increase in Response to Warming, J. Geophys. Res.-Oceans, 131, e2025JC022348, https://doi.org/10.1029/2025JC022348, 2026.
Yao, Y. and Wang, C.: Variations in summer marine heatwaves in the South China Sea, J. Geophys. Res.-Oceans, 126, e2021JC017792, https://doi.org/10.1029/2021JC017792, 2021.
Yao, Y. and Wang, C.: Subsurface Marine Heatwaves in the South China Sea, J. Geophys. Res.-Oceans, 129, e2024JC021356, https://doi.org/10.1029/2024JC021356, 2024.
Yao, Y., Wang, J., Yin, J., and Zou, X.: Marine heatwaves in China's marginal seas and adjacent offshore waters: past, present, and future, J. Geophys. Res.-Oceans, 125, e2019JC015801, https://doi.org/10.1029/2019JC015801, 2020.
Ye, H., Yang, C., Tang, S., and Chen, C.: The phytoplankton variability in the Pearl River estuary based on VIIRS imagery, Cont. Shelf Res., 207, 104228, https://doi.org/10.1016/j.csr.2020.104228, 2020.
Yuan, T., Zhang, J., Yang, S., Su, Q., Zhao, Z., and Ren, K.: Vertical Structures of Marine Heatwaves in the South China Sea: Characteristics, Drivers and Impacts on Chlorophyll Concentration, J. Geophys. Res.-Oceans, 129, e2024JC021091, https://doi.org/10.1029/2024JC021091, 2024.
Zhan, W., Zhang, Y., He, Q., Feng, M., Du, Y., Shen, X., Liu, Y., and Zhan, H.: Global Responses of Phytoplankton Size Structure to Marine Heatwaves, Global Biogeochem. Cy., 40, e2025GB008854, https://doi.org/10.1029/2025GB008854, 2026.
Zhao, H. and Tang, D. L.: Effect of 1998 El Niño on the distribution of phytoplankton in the South China Sea, J. Geophys. Res.-Oceans, 112, C02017, https://doi.org/10.1029/2006JC003536, 2007.
Zhao, Z. and Marin, M.: A MATLAB toolbox to detect and analyze marine heatwaves, J. Open Source Softw., 4, 1124, https://doi.org/10.21105/joss.01124, 2019.
Zheng, J., Xiu, P., Zeng, L., Zhu, X., Ji, X., Gao, S., and Li, Z.: Phytoplankton Response to the Record-Breaking Marine Heatwave in the Summer of 2020 in the South China Sea, J. Geophys. Res.-Oceans, 129, e2024JC021275, https://doi.org/10.1029/2024jc021275, 2024.
Zhi, H., Wu, H., Wu, J., Zhang, W., and Wang, Y.: River plume rooted on the sea floor: seasonal and spring-neap variability of the Pearl River plume front, Front. Mar. Sci., 9, 791948, https://doi.org/10.3389/fmars.2022.791948, 2022.