
the Creative Commons Attribution 4.0 License.
the Creative Commons Attribution 4.0 License.
 | 14 Oct 2026
Current dynamics, drivers, and vertical thermal structure around Sir Bu Nair Island (Arabian/Persian Gulf)

Filipe Vieira
Rita Bento
Aaron Bartholomew
John A. Burt
Sir Bu Nair Island (SBN) in the central Arabian Gulf is one of the last locations in the UAE's Gulf waters to retain extensive and well-developed coral reefs, whereas many nearshore environments have experienced severe degradation following recurrent marine heatwaves. Although tides, winds, and subtidal circulation are thought to influence reef-level thermal conditions at SBN, the local physical processes governing circulation and temperature variability have not previously been resolved from in situ observations. Here, we analysed a 17 month record (May 2021–October 2022) of currents, sea level, and temperature from bottom-mounted ADCPs and multi-depth temperature moorings, complemented by wind reanalysis and long-term regional satellite and model products. Currents at SBN were strongly anisotropic and aligned along a dominant principal axis, reflecting topographic steering around the island. Currents were substantially stronger and more directionally organized at the northwest site than at the southern site, demonstrating pronounced spatial variability around the island. Tidal forcing dominated current variability, explaining up to ∼80 % of the along-axis variance at the northwest site but substantially less in the cross-axis direction and at the southern site. Wind–current coupling was strongest at subtidal timescales, with rapid (0–2 h) responses consistent with local barotropic adjustment to wind forcing. Summer temperatures exceeded 35 °C, and vertical temperature differences of 2–4 °C developed during late spring and summer before undergoing rapid transitions toward thermal homogeneity. The diurnal band accounted for much of the variability in vertical temperature structure, with additional variability at synoptic (2–4 d) timescales associated with wind, sea level, and currents. Long-term regional analyses showed that the exceptionally warm conditions observed in 2021 extended across the southeastern Gulf, whereas regional current speeds remained within historical variability. Together, the observations indicated that changes in vertical thermal structure were associated with interacting tidal, atmospheric, and lower-frequency circulation processes rather than a single mechanism. These findings provide the first integrated observational description of circulation and thermal structure at SBN and highlight how regional forcing and local topographic modification combine to produce spatially and temporally heterogeneous conditions around an isolated reef system in the central Gulf.
- Article
(6279 KB) - Full-text XML
-
Supplement
(808 KB) - BibTeX
- EndNote


The Arabian/Persian Gulf (hereafter “the Gulf”) is a shallow, semi-enclosed marginal sea characterized by strong evaporation, limited freshwater input, and intense atmospheric forcing (Campos et al., 2020; Ibrahim and Eltahir, 2019; Ranjbar et al., 2020). Circulation results from the interaction of density-driven flow, wind forcing, and tides, producing a basin-scale cyclonic gyre current of typically 0.05–0.20 ms−1, and strong synoptic variability associated with north-westerly (Shamal) winds (Langodan et al., 2023; Cavalcante et al., 2016; Al Senafi and Anis, 2015). While tides dominate instantaneous currents, winds and density gradients play a key role in subtidal variability and vertical exchange (Al Azhar et al., 2016; Alosairi et al., 2011).
The Gulf also exhibits a highly variable stratification regime driven by seasonal heating. During summer, surface heating promotes the formation of a shallow thermocline, particularly under weak wind conditions, with subsurface waters remaining several degrees cooler than the surface (Hassanzadeh et al., 2011; Alosairi et al., 2011; Yao and Johns, 2010b). At the same time, energetic tidal currents and synoptic wind systems, including Shamal events, can intermittently disrupt stratification, leading to rapid vertical mixing and water-column homogenization (Yao and Johns, 2010a; Thoppil and Hogan, 2010; Chao et al., 1992). Although these processes are relatively well described at basin scales, their interaction with local bathymetry and their role in controlling vertical exchange at smaller spatial scales remain poorly understood.
Sir Bu Nair Island (SBN), located in the central southern Gulf, provides a natural setting to investigate these processes. The island lies within the pathway of basin-scale circulation and is characterized by steep surrounding bathymetry, with depths reaching ∼30 m within 3–5 km of the shoreline (Cavalcante et al., 2024; Bento et al., 2021). The interaction between incoming flow and this topography is expected to promote flow steering, current intensification, and localized mixing, consistent with topographically constrained environments, where tidal propagation is modified and shear-driven processes enhance vertical exchange (Lowe and Falter, 2015; Simpson et al., 1990; Wolanski and Hamner, 1988).
Earlier research on SBN has focused mainly on the continued resilience of extensive, well-developed coral reefs communities at the island compared to other parts of the Gulf, where recurrent marine heatwaves have resulted in the near collapse of coral reefs, particularly within the southern Gulf basin (Hadj-Hammou et al., 2025; Bento et al., 2021). Studies based on numerical models have highlighted the potential role of mesoscale and sub-mesoscale features in transporting larvae from SBN to coastal reef systems along the southern Gulf margin (Cavalcante et al., 2020; Riegl et al., 2017; Cavalcante et al., 2016), suggesting that physical circulation processes at SBN may have broader regional implications for reef connectivity and recovery. Moreover, recent studies have suggested that heat-sensitive corals (Acropora spp.) may have continued to persist at SBN due to the buffering effect of deeper, cooler waters surrounding the island, which mitigate extreme summer temperatures (Hadj-Hammou et al., 2025; Cavalcante et al., 2024; Bejarano et al., 2022).
To our knowledge, the only study providing direct observational insights into the oceanographic conditions at SBN is based on a short (∼6 week) study in 2021, which reported near-surface current speeds of up to and abrupt temperature variations with daily vertical ranges of ∼4 °C (Cavalcante et al., 2024). Despite this, direct observational data on circulation and stratification dynamics at SBN remains limited.
Here, we use a multi-instrument observational dataset to investigate the physical processes controlling circulation and thermal structure at SBN. We (i) characterize the dominant circulation regime, (ii) quantify the relative roles of tidal and wind forcing across multiple timescales, and (iii) examine the mechanisms responsible for episodic stratification and rapid mixing. We hypothesize that circulation is strongly modulated by local bathymetry, that tides dominate instantaneous flow but not stratification variability, and that stratification collapse results from the interaction between synoptic and higher-frequency forcing.
2.1 Study area
Sir Bu Nair Island (SBN) located ∼70 km offshore from the southeast coast of the UAE lies within a well-enforced protected area with limited human disturbances (Hadj-Hammou et al., 2025), which extends over 49.6 km2, including ∼36.3 km2 of marine habitat surrounding the island (Fig. 1) (Bento et al., 2021). The island is surrounded by a relatively steep bathymetry gradient reaching up to ∼30 m depth just from shore (Fig. 1) (Cavalcante et al., 2024). Geologically, SBN Island's near-circular shape and the surrounding steep bathymetric gradient result from the surface expression of a Hormuz salt dome rising from the stable shelf of the Arabian basement, influencing local seafloor topography (Ellison et al., 2021; Thomas et al., 2015).
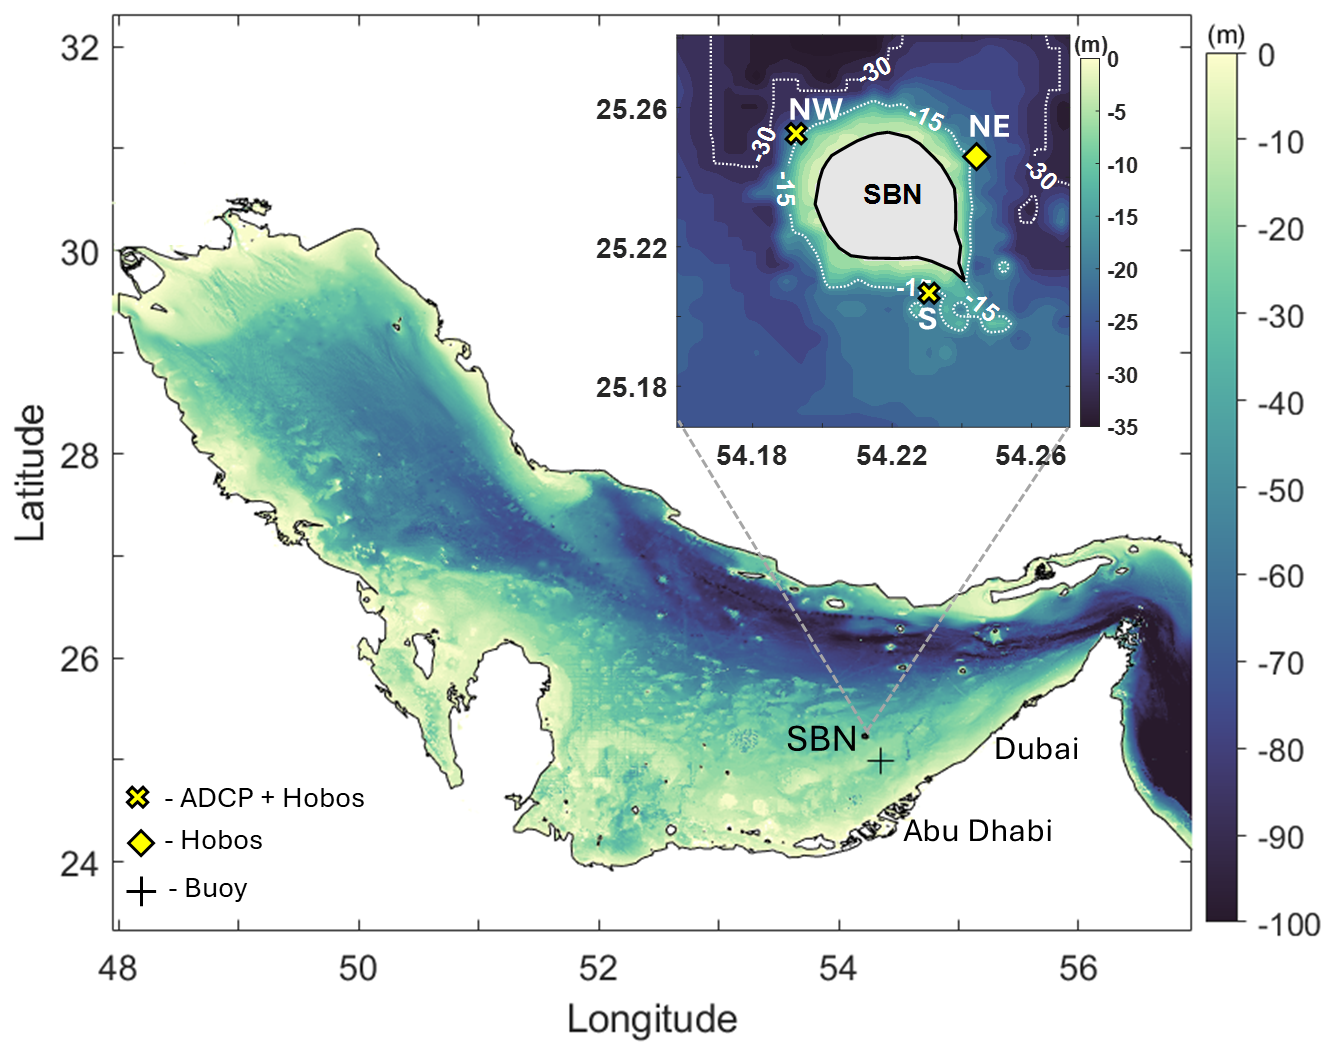
Figure 1The top panel presents the deployment sites around Sir Bu Nair (SBN) Island, while the bottom panel shows the location of the oceanographic buoy. Depth contours in the top panel were adjusted to enhance visualization of the pronounced bathymetric gradient surrounding the island. ADCP moorings are designated as SBN-NW (northwest ADCP) and SBN-S (south ADCP). Temperature loggers deployed in the northwest, northeast, and southern sectors are referred to as SBN-NW, SBN-NE, and SBN-S, respectively. Buoy location is referred to as (+).
The dominant astronomical constituents responsible for the water level fluctuations in the Gulf are the principal semi-diurnal (M2, S2) and diurnal (K1, O1) tides (Fig. 2 – shows M2 and K1). While the Gulf as a whole is often described as mixed, mainly semi-diurnal, the location of SBN is near the central area where the relationship between the semi-diurnal and diurnal tides is crucial (Burt and Paparella, 2024). Previous studies of current meter data near SBN have shown that the local hydrodynamic conditions are influenced by both the diurnal (∼24 h) and semi-diurnal (12.5 h) tidal periods (Fig. 2), leading to a complex daily pattern of water flow (Cavalcante et al., 2024).
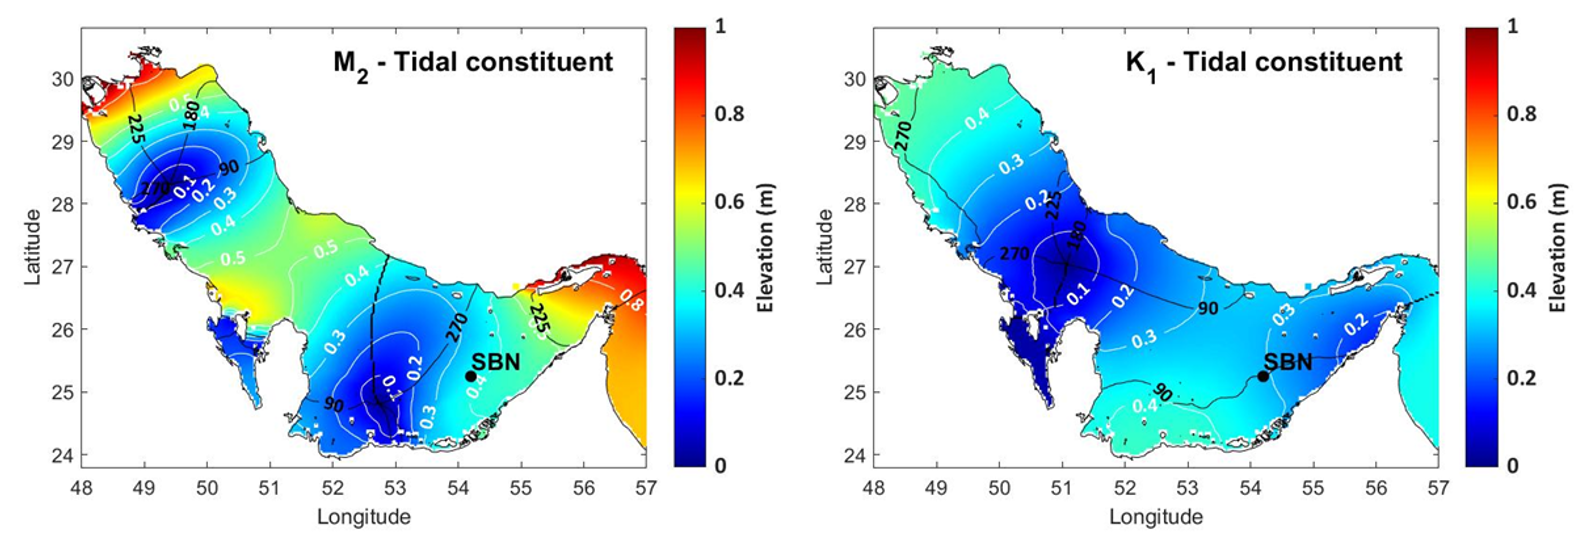
Figure 2Amplitudes in m (shaded in colors) overlaid with phase contours of the major tidal constituents (M2 and K1) generated from TPXO10-atlas models (Egbert and Erofeeva, 2002).
2.2 In situ observations
Time-series measurements of vertical currents, temperature, and absolute water depth were collected and analyzed around Sir Bu Nair Island (SBN). Two ADCP moorings were deployed (Fig. 1). On the northwest flank (SBN-NW; 25.251° N, 54.194° E), an upward-looking Nortek Signature 1000 kHz ADCP was bottom-mounted at ∼17 m water depth. The instrument sampled with 0.5 m vertical bins, averaging 120 pings at 1 Hz into 2 min ensembles, saved every 20 min, from 18 May 2021–31 October 2022. On the south side (SBN-S; 25.208° N, 54.221° E), a bottom-mounted Teledyne RDI Workhorse Sentinel 600 kHz ADCP at ∼18 m depth used a comparable setup, but due to an equipment malfunction produced two shorter records: 18 May 2021–21 July 2021 and 21 August 2021–19 September 2021.
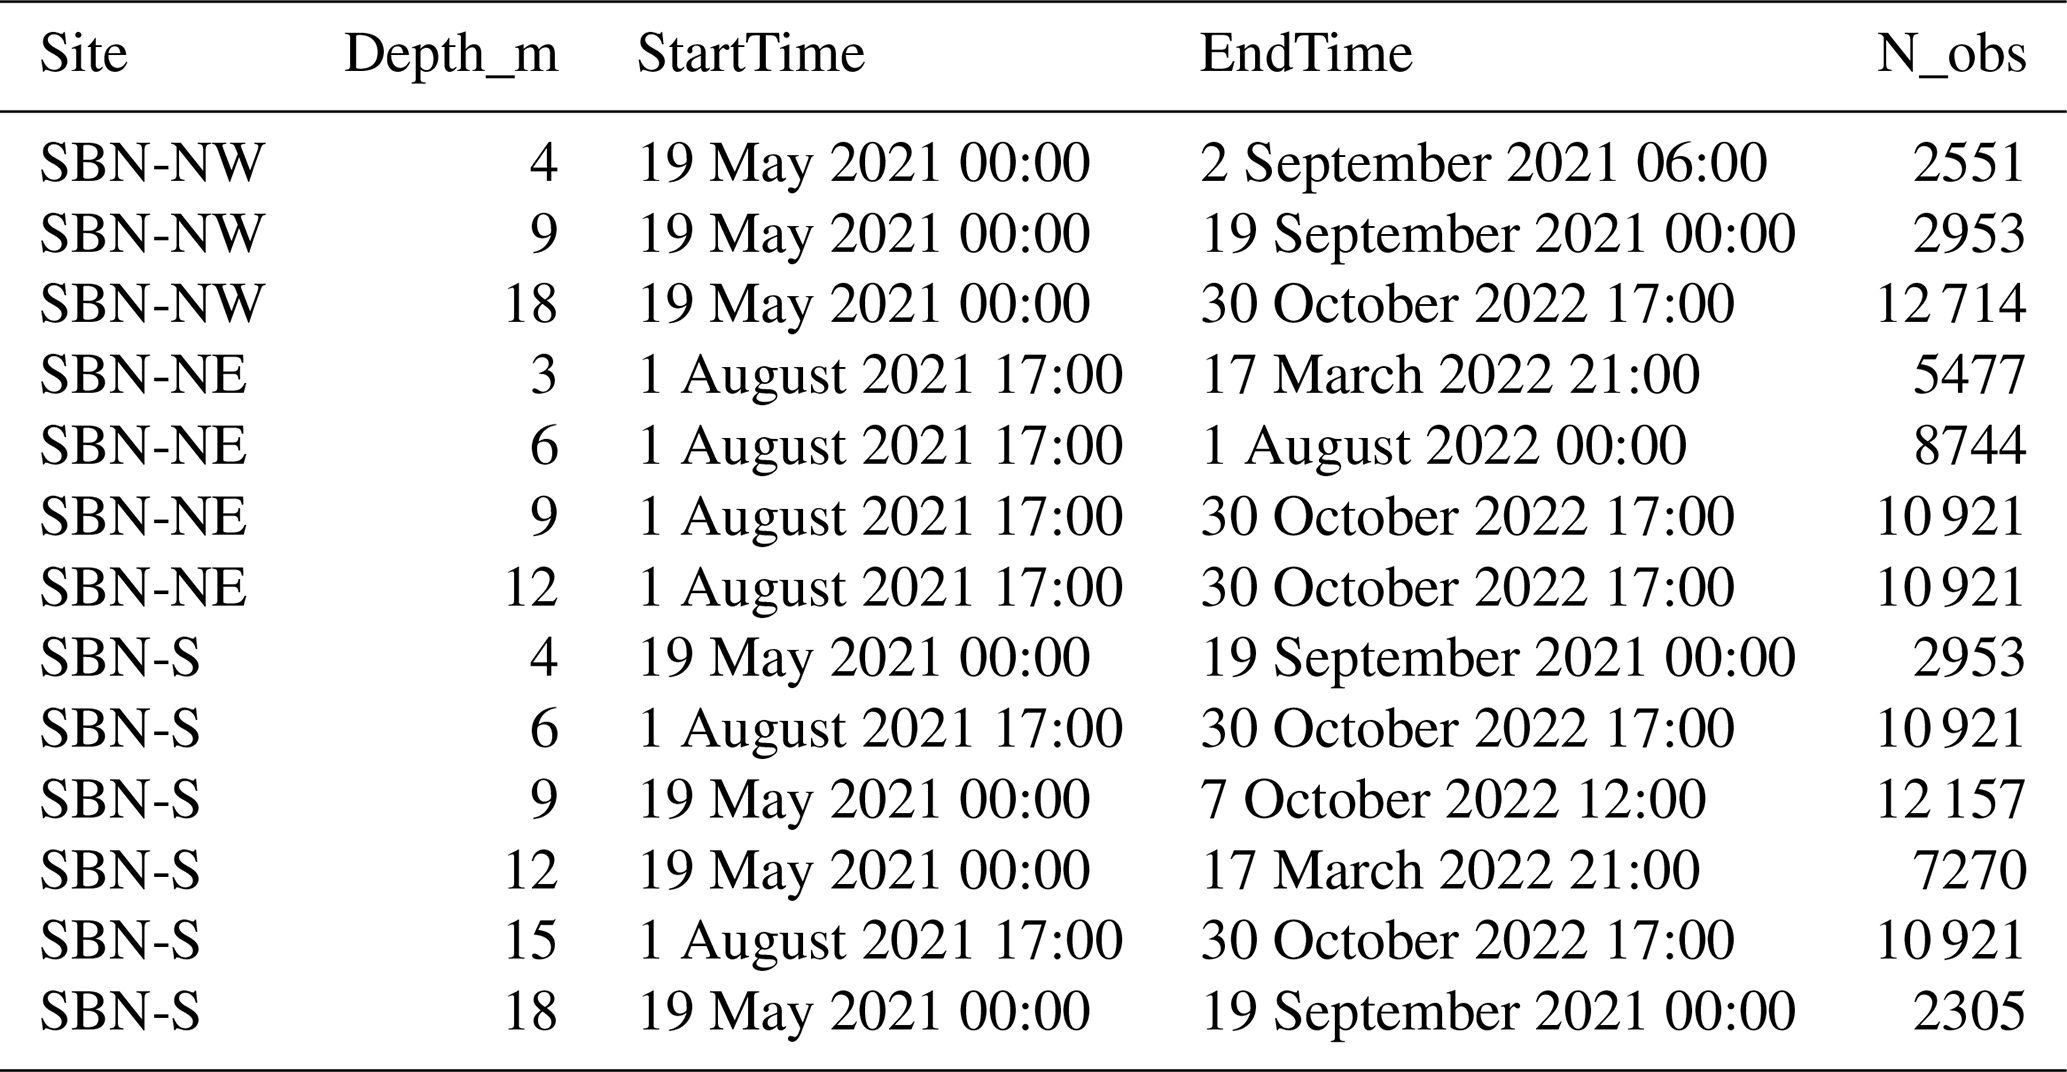
To characterize the vertical thermal structure at SBN, six moorings equipped with HOBO (TidbiT) temperature loggers were deployed across near-surface to near-bottom depths (refer to Table 1). However, only two arrays were successfully recovered. The SBN-S temperature mooring was co-located with the ADCP frame at ∼18 m depth, while the SBN-NE mooring was located ∼750 m offshore at ∼16 m depth (Fig. 1). Both arrays recorded hourly temperature data from 1 August 2021–30 October 2022. Although the SBN-NW temperature array was not recovered, thermal conditions on the northwest flank were partially reconstructed using an earlier deployment of array of temperature loggers attached to the ADCP frame at nominal depths of 4 and 9 m, which provided hourly data from 19 May–19 September 2021. Earlier temperature records at SBN-S were also incorporated to extend temporal coverage. All records were quality-controlled and harmonized to a common temporal resolution prior to analysis. Details of data availability and integration are provided in Table 1.
2.3 Environmental data
In the absence of in-situ wind observations at Sir Bu Nair (SBN), we used 10 m winds (u10, v10) from the ERA5 atmospheric reanalysis for the grid cell enclosing SBN (https://cds.climate.copernicus.eu/datasets/reanalysis-era5-single-levels?tab=download (last access: 15 September 2025) (Hersbach et al., 2020). The hourly ERA5 wind fields were extracted for the full mooring period (18 May 2021–31 October 2022), using the nearest 0.25° grid cell without spatial interpolation. All time stamps were converted to a common time base and expressed in local time. Positive (u10) points east and positive (v10) north.
To evaluate ERA5 skill for local winds, we compared against the closest available in-situ record from an oceanographic buoy located ∼24 km southeast of SBN (24.992° N, 54.350° E) (Fig. 1) over 24 April 2025–1 September 2025. Despite the validation period falling outside the mooring window, the analysis indicates strong agreement in vector components (ru=0.84 (along-axis) and rv=0.92 (cross-axis)), supporting the use of ERA5 as a proxy for local wind forcing at SBN. We therefore use ERA5 winds (and derived wind stress where specified) as the atmospheric driver in the analysis.
To assess the spatial and temporal representativeness of the observed temperature conditions, we used daily NOAA Coral Reef Watch (CRW) CoralTemp v3.1 SST for 1985–2025 at 5 km spatial resolution (Skirving et al., 2020). CRW SST was first compared with daily mean temperatures from the shallowest in situ sensors at the three SBN sites (Fig. 1). Agreement was strong across the available records (; ), supporting its use to provide longer-term and regional thermal context.
We used an analogous approach to assess the spatial and temporal context of the observed circulation using Copernicus Marine Service (CMEMS) current fields for 1993–2025 (Jean-Michel et al., 2021). CMEMS currents have daily temporal and horizontal resolution of (∼8 km around SBN). The uppermost model layer (0.494 m depth) was used to characterize regional surface circulation.
2.4 Wind stress calculation
Hourly ERA5 10 m winds (u10, v10) were converted to eastward and northward wind-stress components (τx, τy) components using the Eqs.(1 and 2):
where is air density, is wind speed, and CD is the neutral drag coefficient following Large–Pond style (Large and Pond, 1981): for , . We then projected (τx, τy) onto the principal axis obtained from principal component analysis (PCA) to obtain along (τa) and across (τc) components and finally applied the same low-pass filter as for currents. To assess sensitivity to drag-coefficient parameterization and to separate dynamic forcing from simple wind-speed covariance, all analyses were repeated using rotated and filtered wind velocity components (u10,v10) in place of wind stress.
2.5 Time series analysis
Raw 20 min Acoustic Doppler Current Profiler (ADCP) ensembles were averaged to hourly eastward (u) and northward (v) velocity components (m s−1) prior to analysis. Water level, η (m), was derived from the ADCP absolute depth record and averaged to the same resolution. ERA5 winds (u10, v10) and temperature observations were interpolated onto a common hourly time base. Short gaps (≤3 h) were linearly interpolated, whereas longer gaps were retained as missing values and excluded pairwise from subsequent calculations. For characterization of the wind regime, wind-speed percentiles were calculated using a 3 d sliding window, and the median was smoothed using a 9 d moving mean. Linear trends were removed prior to filtering to minimize low-frequency leakage (Thomson and Emery, 2024; Bendat and Piersol, 2011).
Subtidal variability was isolated using a 48 h Lanczos digital filter. To account for topographic steering around the island, currents were rotated into along-axis and cross-axis coordinates using the principal axis of variance derived from the low-pass currents. This orientation therefore reflects the dominant subtidal flow relevant to wind-current coupling (Kanarik et al., 2025; Van Der Molen et al., 2022).
The barotropic velocity was defined as the depth-mean flow, and the baroclinic component as the deviation from that mean. Kinetic energy was calculated for each component and expressed relative to total kinetic energy (Simpson et al., 1990). Tidal constituents in currents and sea level were estimated using the MATLAB package t_tide (Pawlowicz et al., 2002). In addition, along-axis and cross-axis currents were regressed against sea level (η) and its Hilbert transform to estimate amplitude and phase relationships with sea level variability (Piecuch et al., 2022).
2.6 Correlation and lag analysis
Linear relationships between wind forcing and currents were quantified using Pearson correlation at zero lag and cross-correlation over lags of ±72 h. Analyses were performed between along-axis forcing (τa or u10,a) and along-axis currents (ua), and likewise between cross-axis forcing (τc or u10,c) and cross-axis currents (vc). Lags are reported in hours, with positive values indicating current variations lagging the wind forcing. Pairwise deletion was used where missing values were present. As a sensitivity test, analyses were repeated using three current metrics: the uppermost ADCP bin, the mean of the upper three bins, and the depth-averaged current, to identify the layer exhibiting the strongest wind-driven response.
2.7 Frequency domain coupling
Frequency-domain relationships were examined with Welch spectra and cross-spectra using a 50 % overlap and applied a Hanning filter (Welch, 1967). Magnitude-squared coherence (MSC) was used to quantify frequency-dependent coupling between forcing and response series (Bendat and Piersol, 2011). The complex transfer function between wind stress (τa, τc) and current response (ua, vc) was used to estimate gain H and phase ϕ. Gain and phase were interpreted only where MSC exceeded the approximate 95 % confidence level based on the number of independent Welch segments (Elipot and Gille, 2009). Spectral filtering and frequency-domain procedures followed standard methods described by Emery and Thomson (2024).
2.8 Band-limited variance attribution of thermal structure
To assess the relative importance of dynamical drivers, band-pass filtered ΔT (temperature difference between 4 and 18 m depth) was regressed against similarly filtered τa, τc, ua, uc, and sea level η. Frequency-band decomposition was performed using fourth-order Butterworth filters applied with zero-phase filtering. Predictor importance was quantified as the reduction in full-model R2 when each predictor was removed in turn (semi-partial variance contribution). These values therefore represent the unique fraction of ΔT variance associated with each predictor after accounting for covariance among forcings. Because predictors are partially correlated, contributions are interpreted as variance attribution rather than strict causality (Grömping, 2007; Peres-Neto et al., 2006).
The results of this study cover various aspects of oceanographic and atmospheric dynamics in the Gulf during the study period, including the analysis of local winds (Sect. 3.1), vertical temperature regimes (Sect. 3.2), absolute water level and current variability (Sect. 3.3), as well as the interactions between currents and wind forcings (Sect. 3.4). The analysis between intense thermal variability events and potential drivers (Sect. 3.5) closes this section.
3.1 Local winds
The wind regime at Sir Bu Nair (SBN) was quantified from the distribution of 10 m wind speed magnitudes and directional frequencies. Figure 3 shows the annual cycle based on ERA5 data, while Fig. 4 provides the corresponding directional distribution.
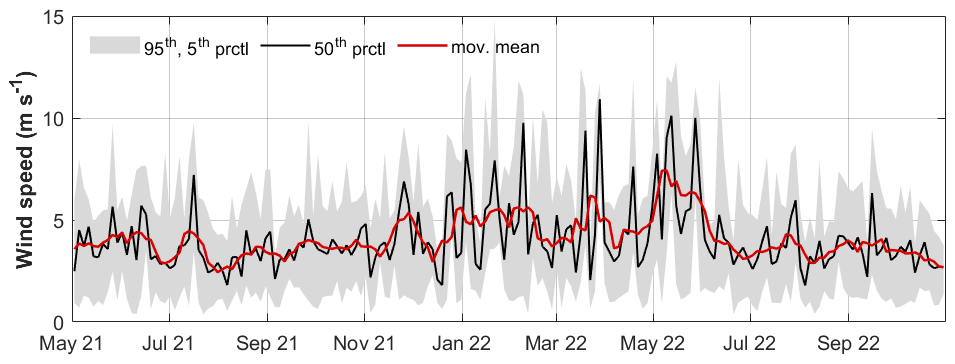
Figure 3Temporal evolution of ERA5 10 m wind speed at Sir Bu Nair, expressed as 5th, 50th, and 95th percentiles computed over the observation period (May 2021–October 2022). Shading denotes the 5 %–95 % range; the black line shows the median for 3 d window; the red curve shows a 9 d moving mean of the median.
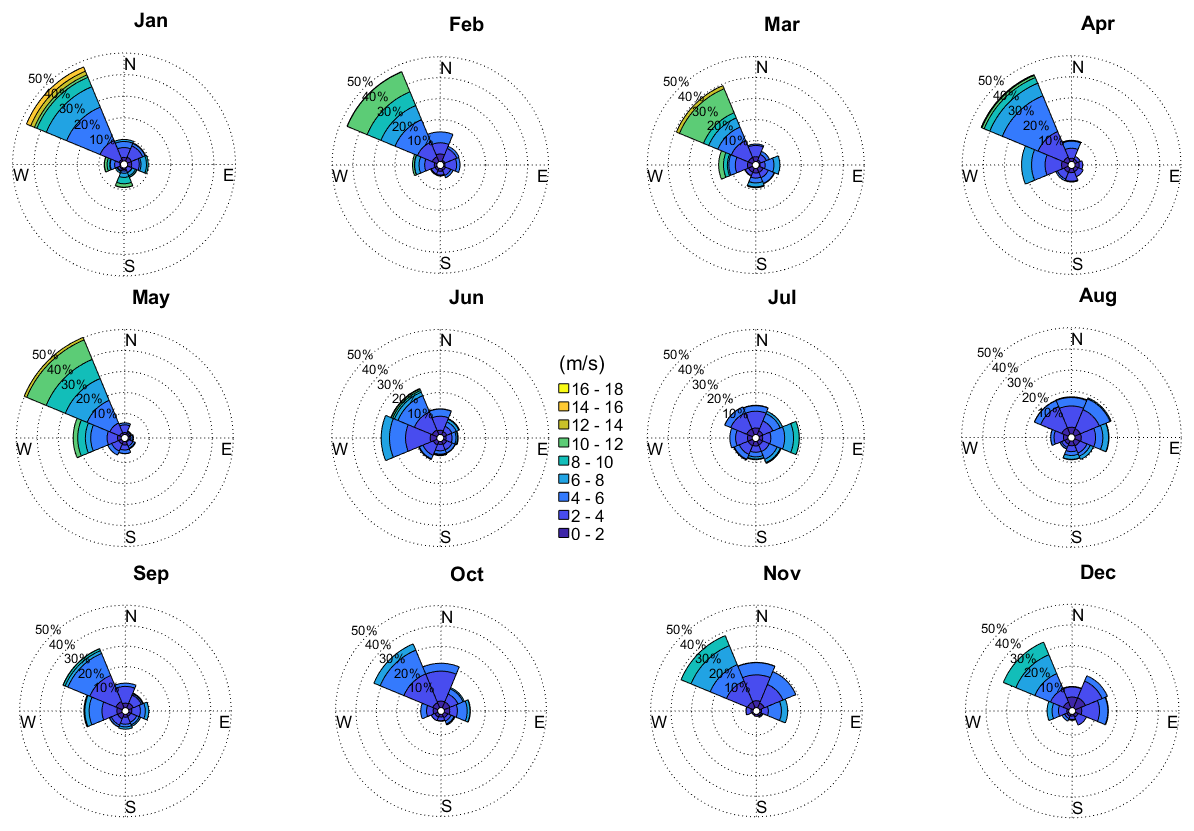
Figure 4Wind rose plots at Sir Bu Nair Island for the study period (May 2021–October 2022) grouped by month from January–December. Color scales indicate wind speed magnitude (m s−1), and the radial axis represents frequency of occurrence (%).
The 9 d moving mean of the median (red curve, Fig. 3) showed wind speeds fluctuating between 4 and 7 m s−1 throughout the observation period, while the 95th percentile identified discrete peaks in wind magnitude. During winter, these values consistently exceed 10 m s−1. A maximum 95th percentile speed of approximately 15 m s−1 was recorded on 21 January 2022, followed by a secondary peak near 13 m s−1 on 14 May 2022. The 5th–95th percentile range narrowed notably from June through August, indicating reduced variability in daily wind magnitude.
The directional distributions (Fig. 4) showed a bimodal wind field at SBN. The primary mode originated from the Northwest (NW), while a secondary, less frequent mode originated from the Southeast (SE). The highest velocity classes () were concentrated within the NW quadrant and associated with Shamal winds (“shamal” means north in Arabic). Winds from the SE were predominantly weaker, with most observations within the 3–6 m s−1 range. The NW mode showed the greatest directional stability, particularly during the months when the 95th percentile wind speeds were highest.
3.2 Water temperature structure
Over the study period, the annual temperature range exceeded 15 °C (Fig. 5), with summer temperatures reaching ∼35.5 °C and winter temperatures declining to ∼21.2 °C. Vertical temperature differences were most pronounced in late spring and summer, reaching maxima of 4.8 °C at SBN-NW, 4.5 °C at SBN-S, and 3.8 °C at SBN-NE. These events were transient and occurred across multiple depth sensors, indicating short-lived periods of pronounced thermal stratification superimposed on the seasonal cycle.
Across all sites, the highest daily mean temperatures occurred in mid-August 2021, when temperatures exceeded 35.0 °C across multiple depths. At SBN-NW, temperatures ≥35.0 °C persisted for up to 20 consecutive days, compared with 18 d at SBN-NE and 24 d at SBN-S. Exceedance of 35.5 °C was restricted to shallow depths and lasted up to three consecutive days at SBN-S and SBN-NW.
The regional analysis showed that the warm conditions observed in 2021 were not restricted to SBN. The 1985–2025 record showed that JAS 2021 was anomalously warm at SBN (mean SST=34.02 °C; +0.79 °C relative to the long-term JAS mean; 95th percentile), whereas JAS 2022 was close to climatological conditions (33.14 °C; −0.09 °C; 32nd percentile) (Fig. S1 in the Supplement). Spatial SST anomalies showed that the 2021 warming extended across much of the southeastern Gulf, whereas anomalies in 2022 were substantially weaker (Fig. S1).
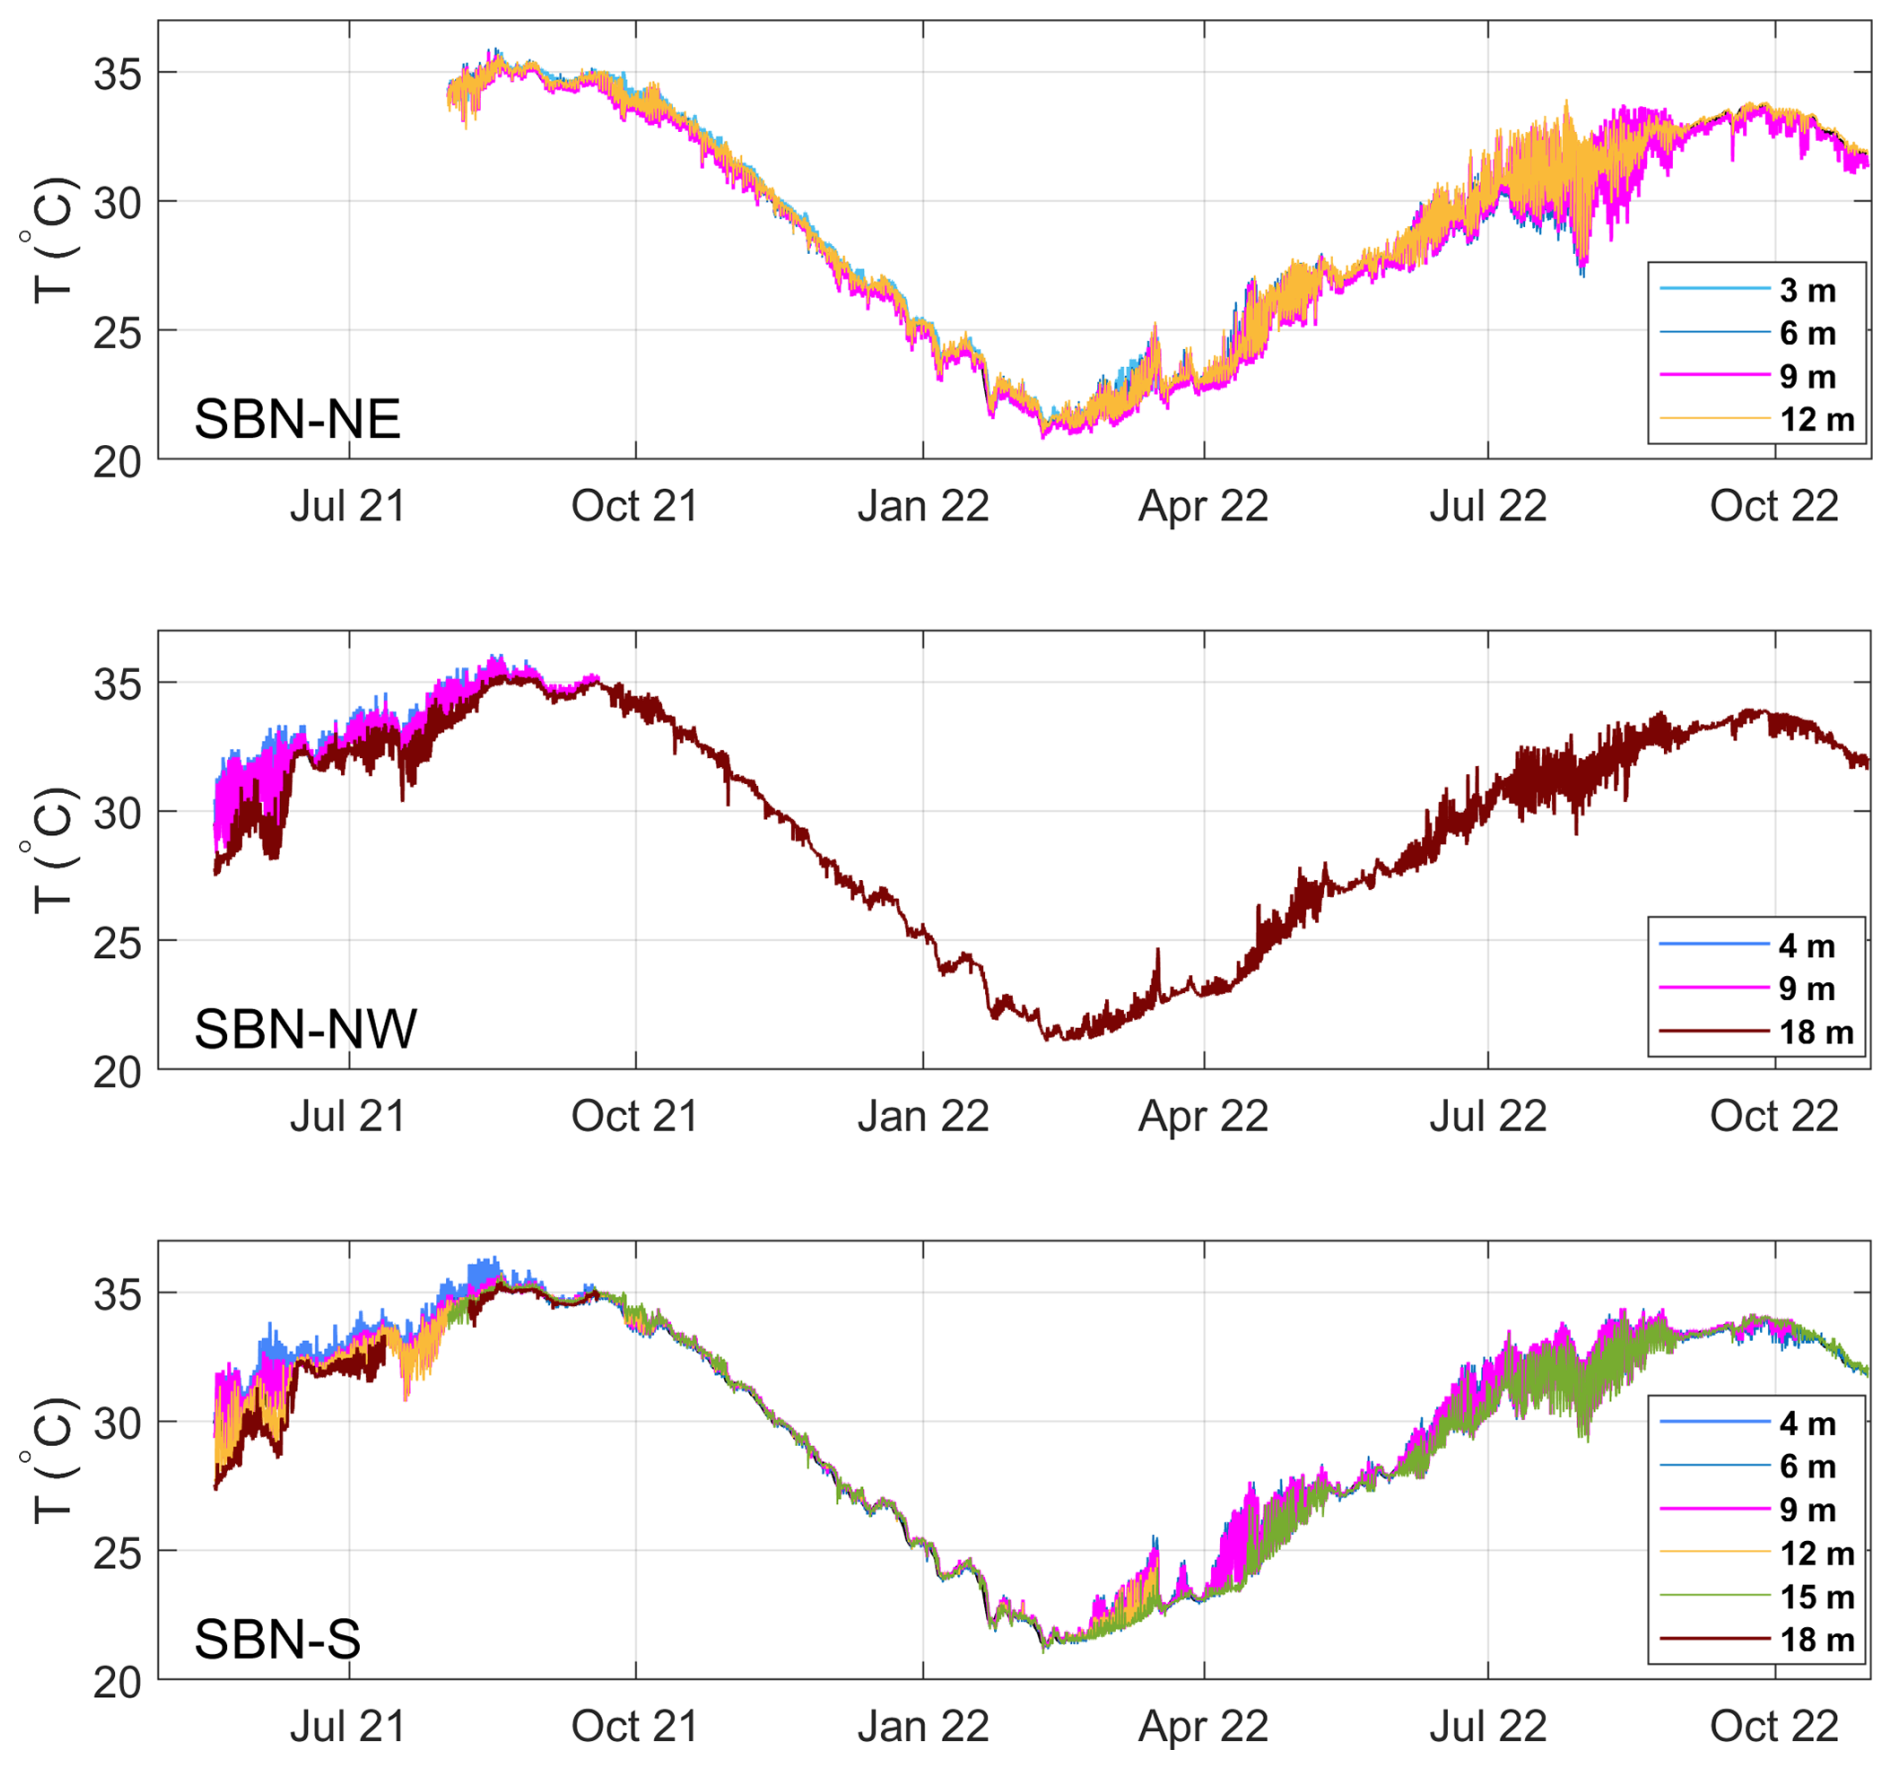
Figure 5Hourly temperature time series at the three SBN sites (SBN-NE, SBN-NW, SBN-S) from May 2021–October 2022. Colored lines represent temperature measurements at each nominal depth.
3.3 Water level and current variability
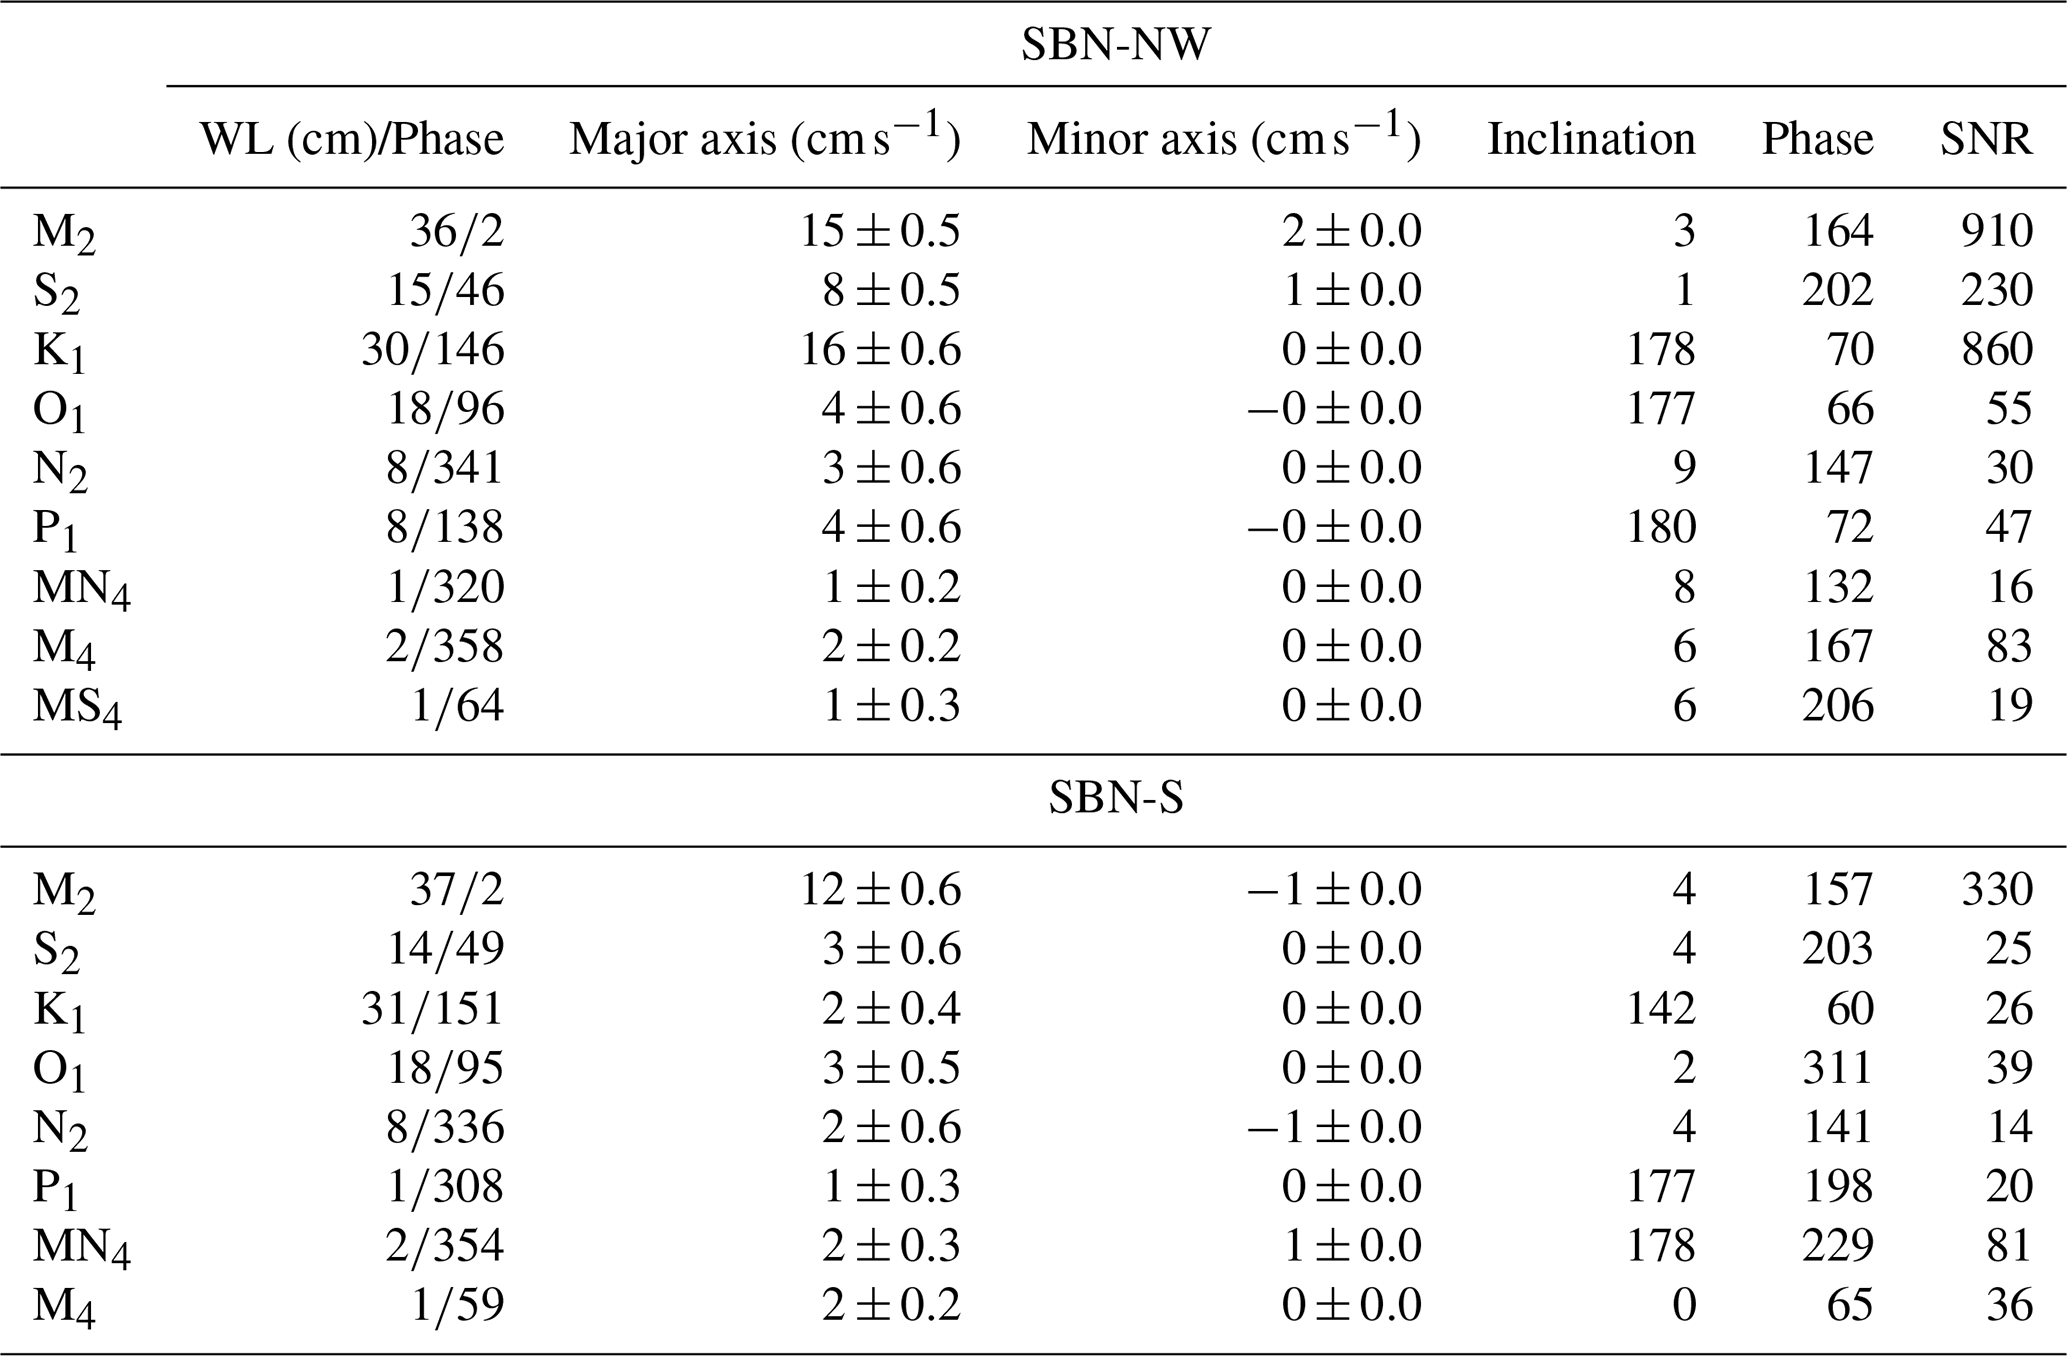
The harmonic analysis results for SBN-NW and SBN-S are summarized in Table 2. The tidal form number, was ∼0.95 at both sites, indicating mixed tides with semidiurnal dominance. M2 was the largest constituent (36–37 cm), followed by K1 and O2 with mean semidiurnal range of . Under constructive interference, the astronomical tidal range could exceed ∼1.5 m.
Phase differences for the dominant constituents were small between stations, indicating a coherent regional tidal signal. Tidal current ellipses were predominantly rectilinear, with strong currents at SBN-NW than SBN-S Maximum semimajor axes occurred for M2 and K1 at SBN-NW (15–16 cm s−1), compared with for M2 and for K1 at SBN-S. Diurnal constituents were oriented approximately north–south at SBN-NW but were more variable at SBN-S. Shallow-water constituents were small ( cm), indicating weak tidal distortion at both sites.
Table 2Results of the tidal analysis with associated confidence intervals for the two ADCP locations.
Currents at SBN-NW and SBN-S exhibited distinct directional structures (Fig. 6). At SBN-NW, flow was strongly aligned along a principal axis oriented ∼29°, accounting for >94 % of the variance and indicating weak cross-axis motion and strong vertical coherence (Fig. 6A and B). At SBN-S, currents were oriented predominantly east–west (∼91°), with directional dominance decreasing from ∼85 % near the bottom to ∼67 % in the upper layer and greater cross-axis variability (Fig. 6C and D). Upper-layer along-axis currents at SBN-NW reached (95th percentile), compared with at SBN-S (Figs. 7 and 8), while cross-axis velocities generally remained within at both sites.
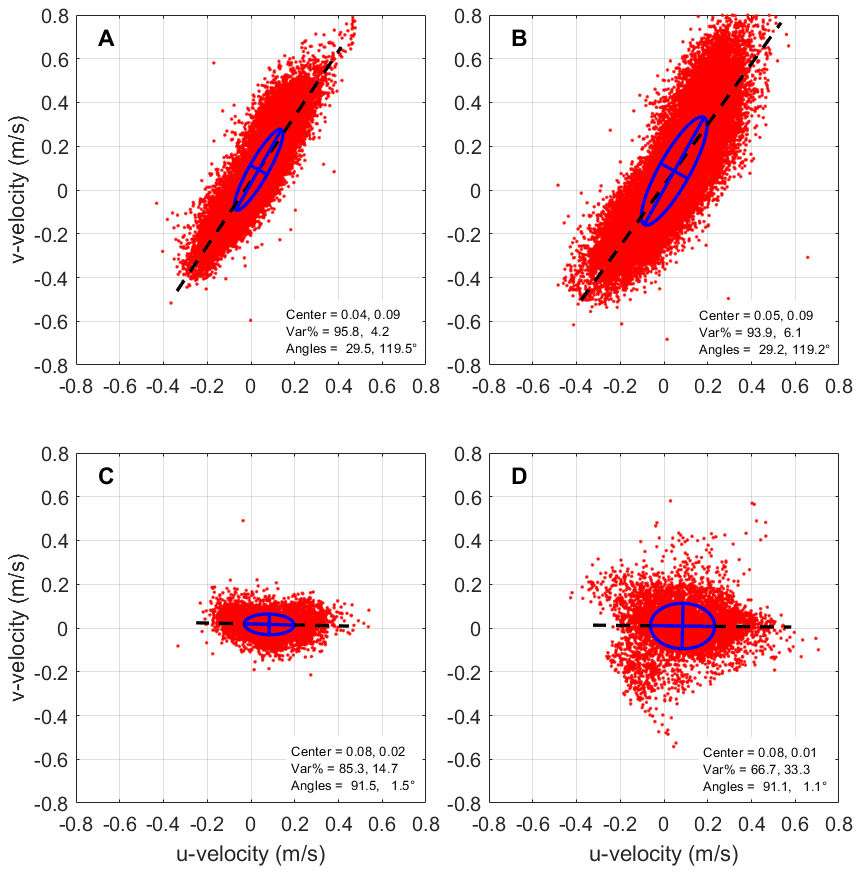
Figure 6Velocity covariance ellipses and principal-axis orientation for SBN-NW and SBN-S. SBN-NW near-bottom (A) and near-surface (B). SBN-S near-bottom (C) and near-surface (D). Red dots show instantaneous east–north velocity components; blue curves denote the 1−σ PCA covariance ellipse; dashed black lines indicate the centroid linear fit.
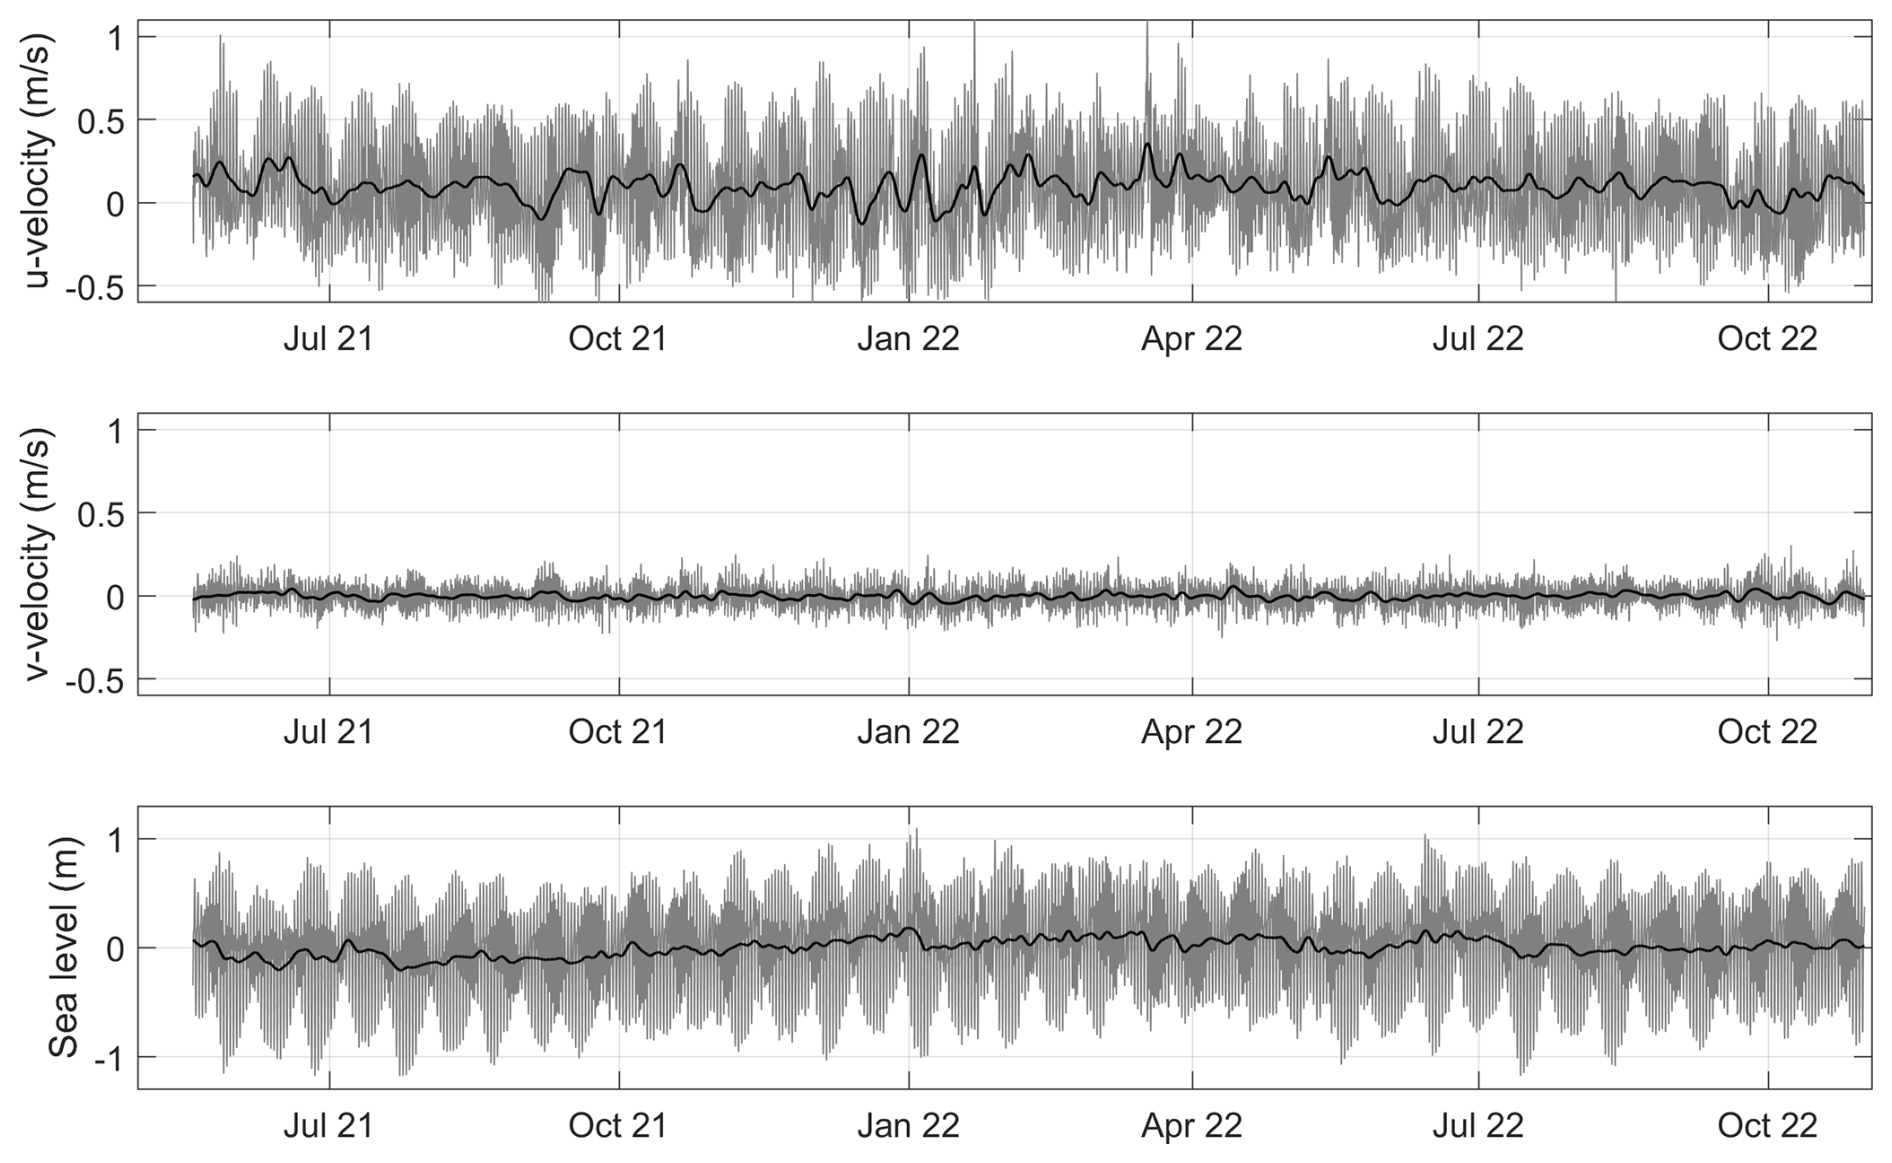
Figure 7SBN-NW time series of the u-velocity component (towards 29 °T), v-velocity component (towards 119 °T), and sea level with the 48 h low-pass filtered data superimposed on the hourly measurements.
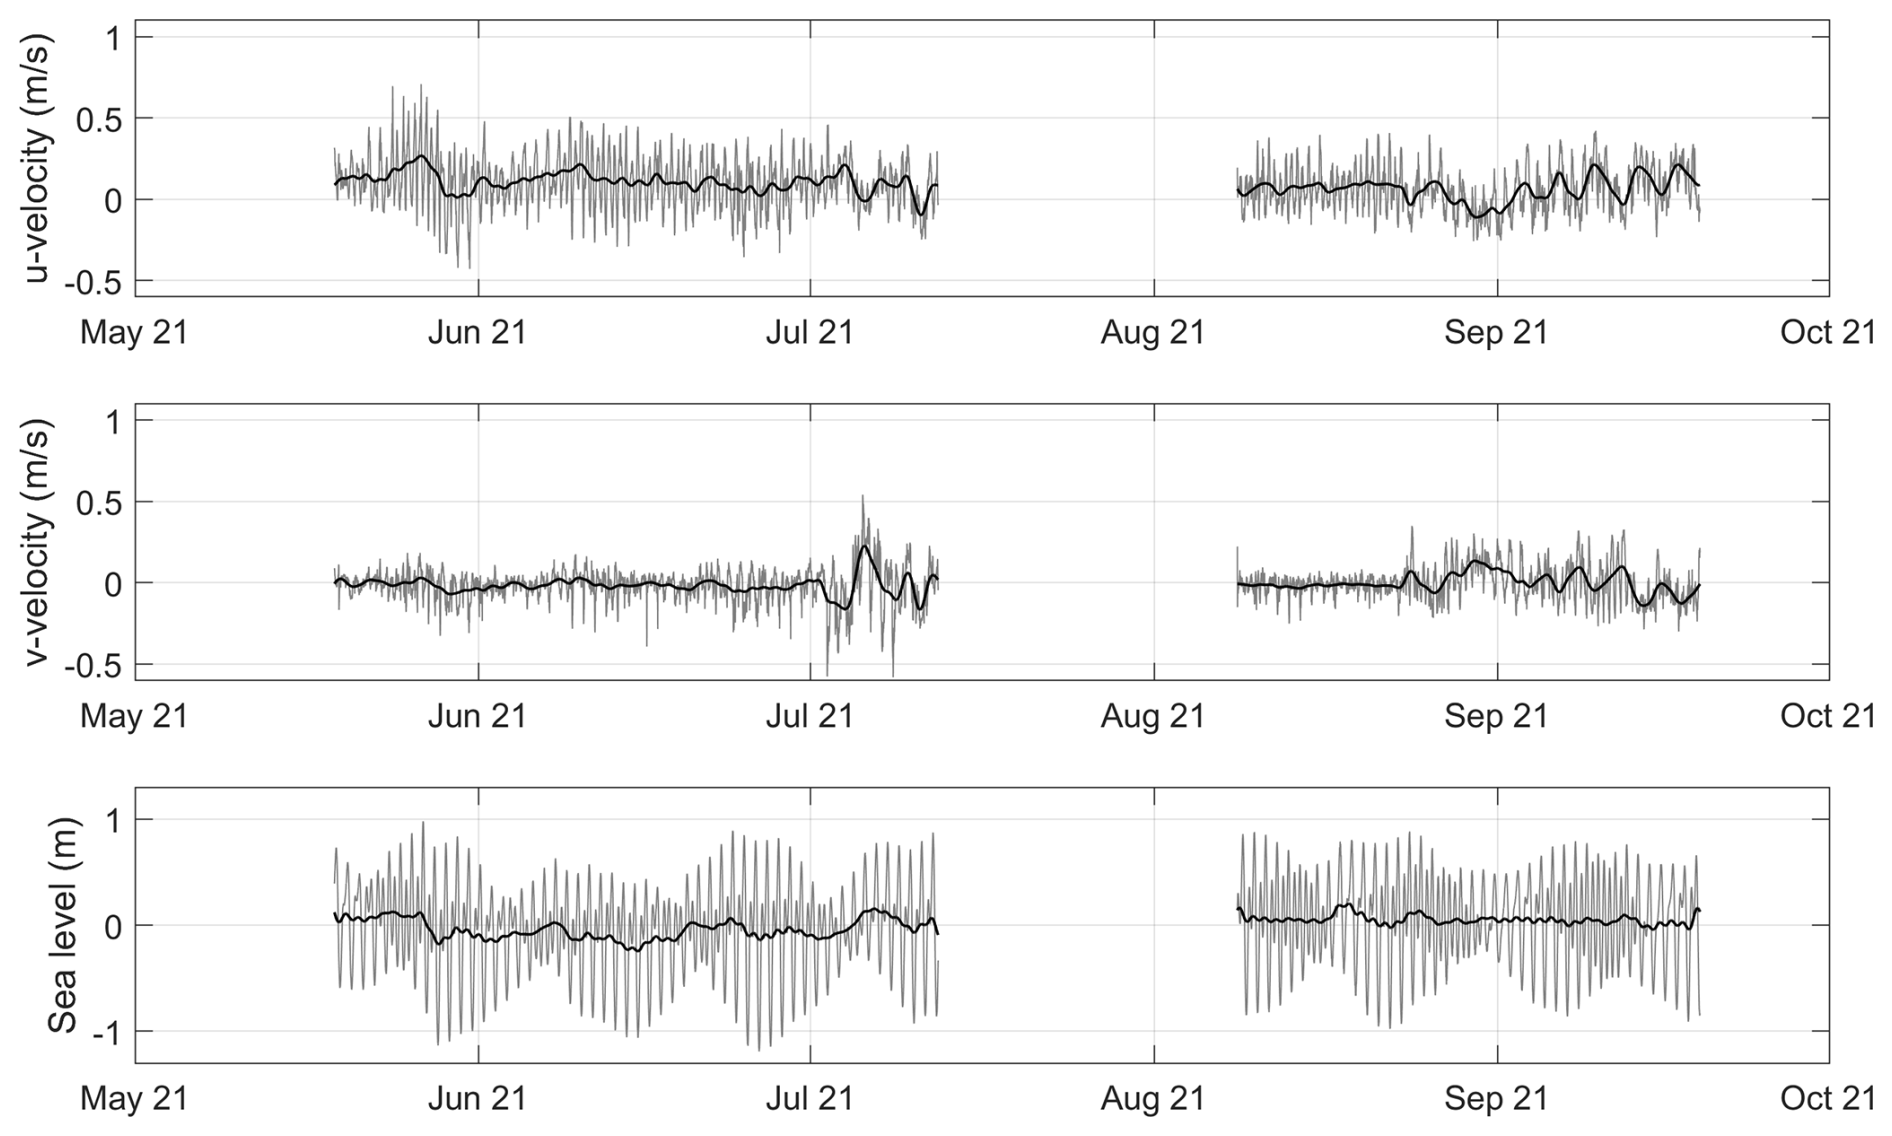
Figure 8SBN-S time series of the u-velocity component (towards 91 °T), v-velocity component (towards 1.5 °T), and sea level with the 48 h low-pass filtered data superimposed on the hourly measurements.
The tidal harmonics explained 80 % of the along-axis current variance at SBN-NW but only 35 % of the cross-axis variance. Tidal influence was weaker at SBN-S, explaining 39 % and 12 % of the along and cross-axis variance, respectively. Sea level relationships showed a similar spatial pattern, with stronger coupling at SBN-NW.
At the regional scale, the 1993–2025 CMEMS record showed that surface-current speeds during the 2021 observational period were moderately below the long-term mean but remained within historical variability (0.096 versus 0.102 m s−1; 24th percentile) (Fig. S2a). The mean current at SBN-S (0.089 m s−1, 78.2°) was broadly consistent with the regional CMEMS flow (0.081 m s−1, 98.7°), whereas the mean current at SBN-NW (0.1 m s−1, 26.6°) was strongly rotated relative to the regional flow (0.083 m s−1, 103.6°) (Fig. S2b–e).
Low-pass filtered velocities showed a persistent residual flow of along the principal axis at both sites (Figs. 7 and 8). Subtidal flow was predominantly barotropic, with 94 % and 89 % of the kinetic energy associated with the depth-mean component at SBN-NW and SBN-S, respectively, and strongly anisotropic, with 97 % and 92 % aligned with the principal axis at SBN-NW and SBN-S, respectively. Subtidal kinetic energy was substantially higher at SBN-NW (0.09 m2 s−2) than at SBN-S (0.01 m2 s−2).
3.4 Currents and wind dynamics
Wind–current relationships were evaluated for along- and cross-axis currents using wind stress and velocity, considering depth-averaged currents and the average of the top three ADCP bins, with representative cases shown in Fig. 9. Results were insensitive to 40–48 h filter cutoffs and consistent across seasonal windows (not shown).
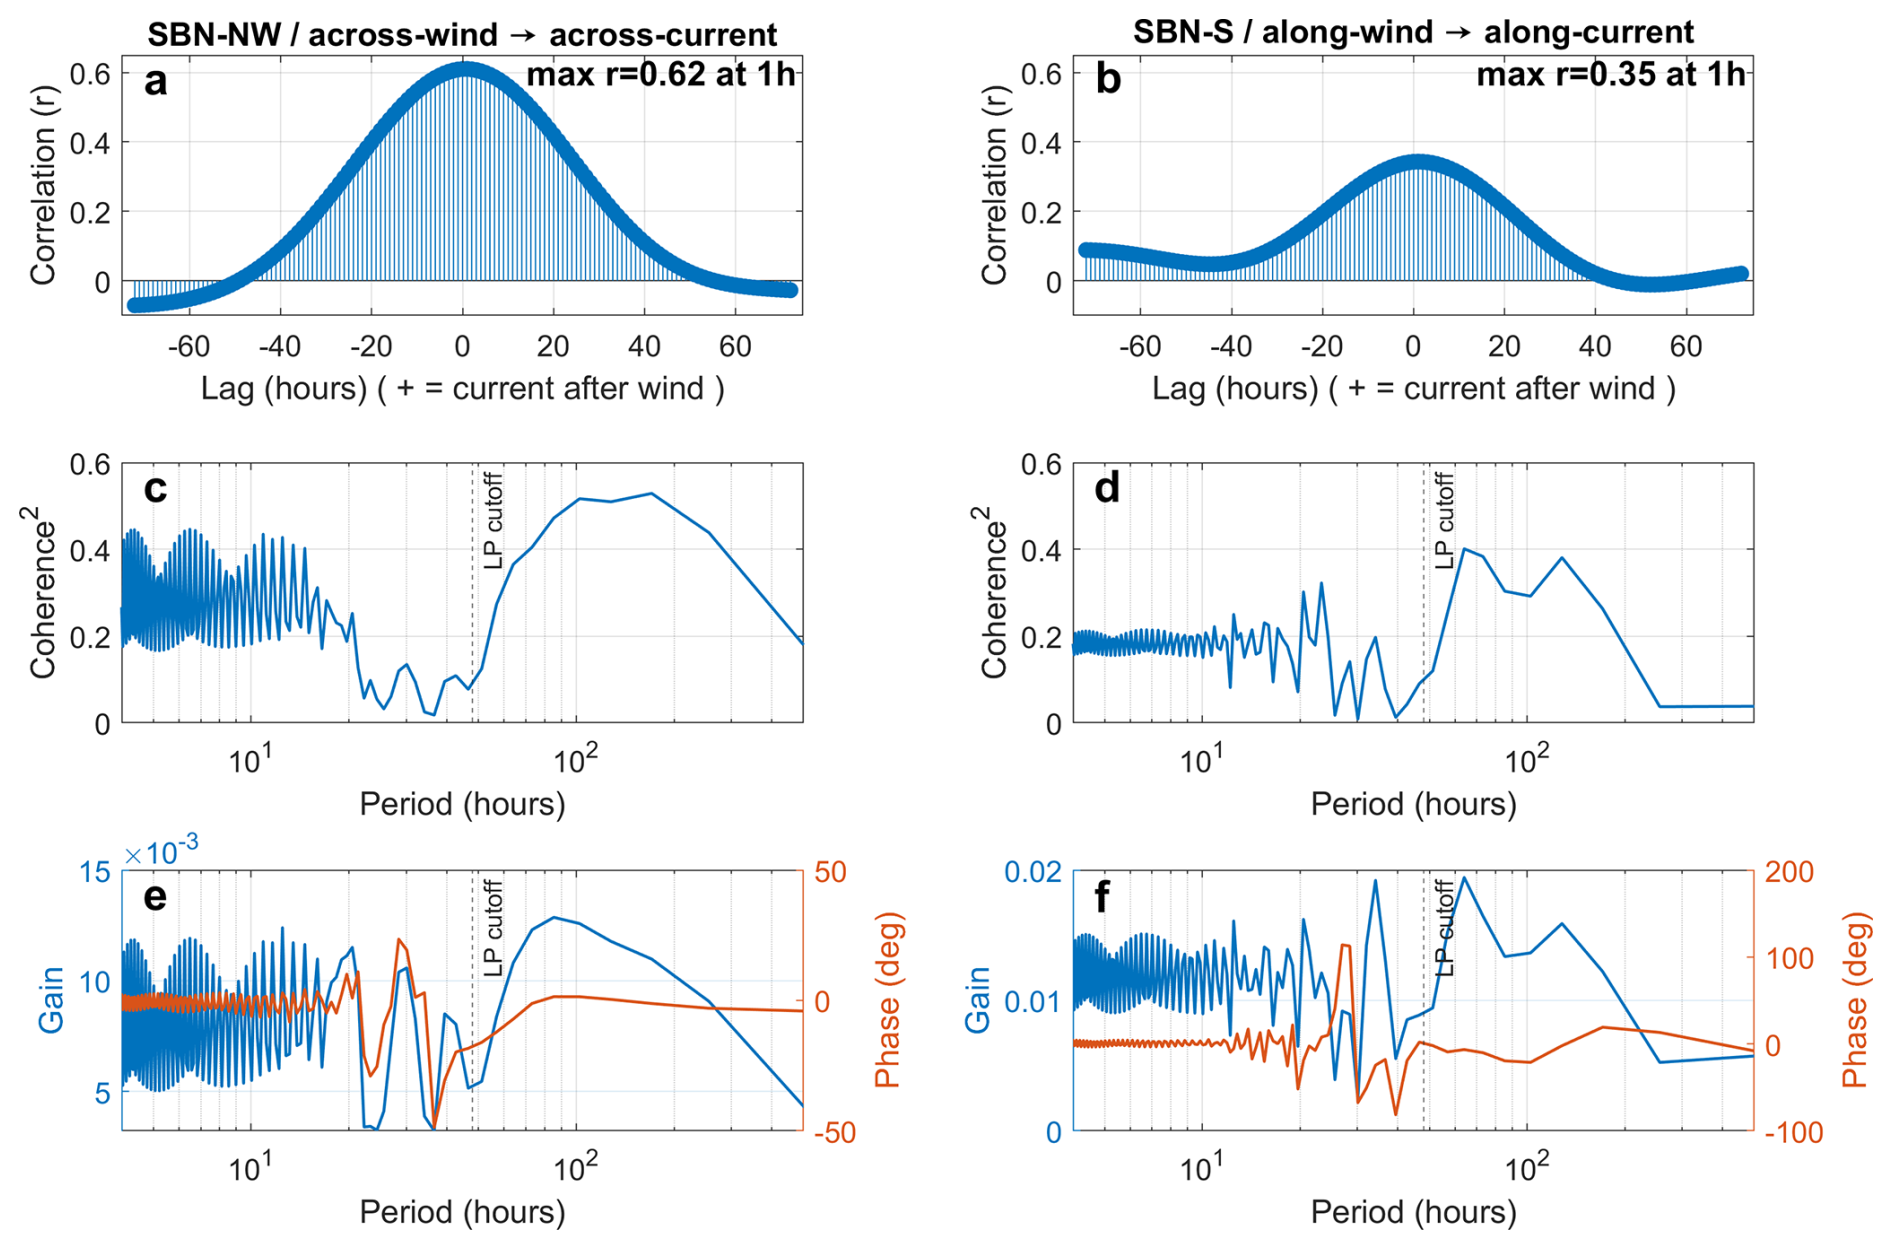
Figure 9Wind–current relationships at SBN-NW and SBN-S based on the average of the top three ADCP bins. Lagged correlation between wind and currents for the across-axis at SBN-NW (a) and along-axis at SBN-S (b). Positive lag indicates currents near-synchronous responding after wind forcing. Magnitude-squared coherence as a function of period at SBN-NW (c) and SBN-S (d). The dashed vertical line indicating the low-pass (LP) cutoff at 48 h. Transfer function estimates showing gain (blue) and phase (orange) at SBN-NW (e) and SBN-S (f).
Wind forcing showed a moderate relationship with the residual currents. At SBN-NW, the strongest relationship occurred in the cross-axis component, with correlated reaching r=0.62 for wind velocity and r=0.50 for wind stress at ∼1 h lag (Fig. 9a). At SBN-S, coupling was weaker and occurred primarily along-axis (r=0.35 for wind velocity; Fig. 9b), while cross-axis correlations were negligible.
Wind–current coherence increased at subtidal periods, particularly between 3 and 8 d. At SBN-NW, cross-axis coherence reached 0.4–0.5 (Fig. 9c), whereas at SBN-S, along-axis coherence reached ∼0.4 (Fig. 9d). Transfer functions showed a corresponding increase in gain at 2–8 d periods for these components, with phase estimates corresponding to hour-scale lags (Fig. 9e and f). Overall, wind coupling was strongest in the cross-axis currents at SBN-NW, with a weaker but detectable along-axis response at SBN-S.
3.5 Vertical thermal variability and associated physical forcing
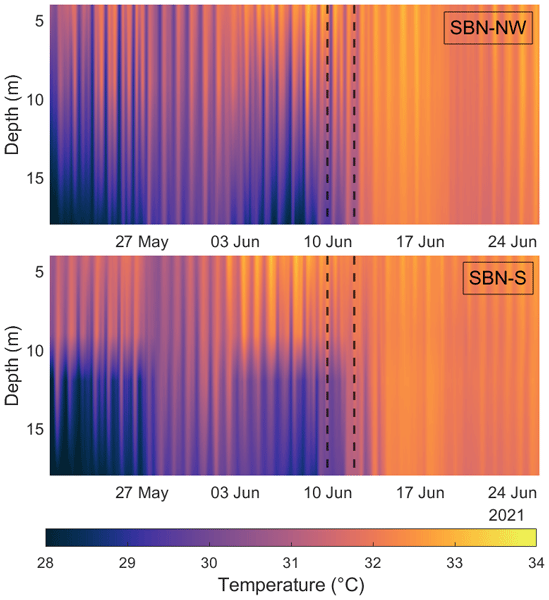
At SBN-S, the surface-to-bottom temperature difference (ΔT) increased during spring and summer and repeatedly decreased towards zero, whereas autumn and winter were characterized by small and occasionally negative differences (Fig. 10). These transitions occurred during both warm seasons (2021 and 2022), indicating recurrent thermal variability. A period of pronounced vertical thermal variability from 20 May–25 June 2021 was selected for detailed analysis because concurrent observations were available at both SBN-NW and SBN-S (Fig. 11).
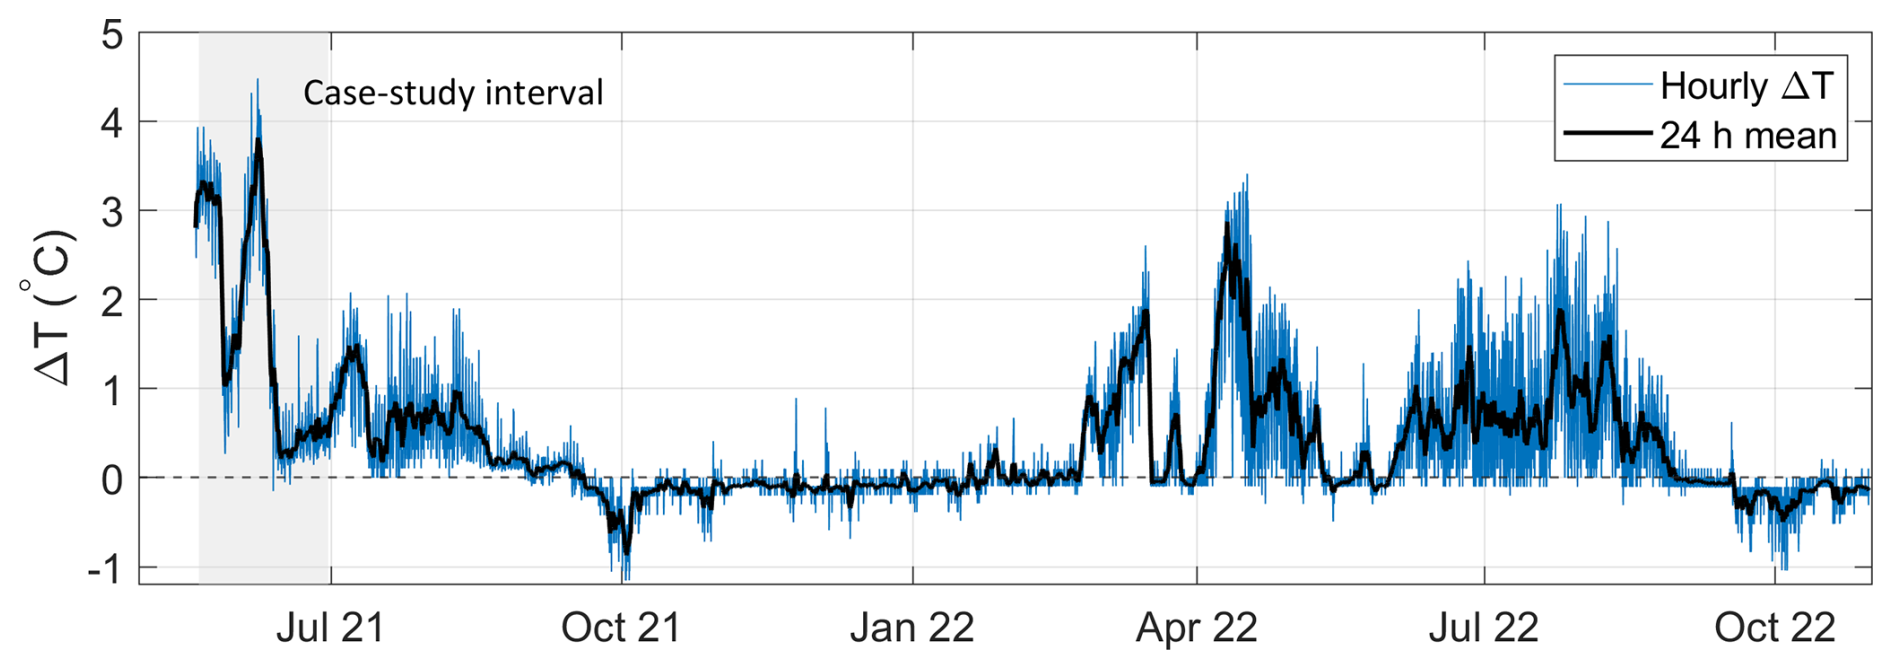
Figure 10Vertical temperature difference (ΔT) at SBN-S from May 2021–October 2022. Hourly values are shown together with the 24 h running mean. The shaded area indicates the 20 May–25 June 2021 case-study interval used for the detailed analysis of vertical thermal variability.
Both sites were strongly thermally stratified before ∼10 June, interrupted by a brief weakening around 28–29 May followed by rapid re-establishment of vertical temperature differences. Temperatures then converged across depths over days around 10–12 June, producing near-thermal homogeneity at both sites (Fig. 11), although higher-frequency variability was more pronounced at SBN-NW. Before this transition, vertical temperature differences () were generally and occasionally exceeded 4 °C, with surface temperatures of overlying bottom temperatures of .
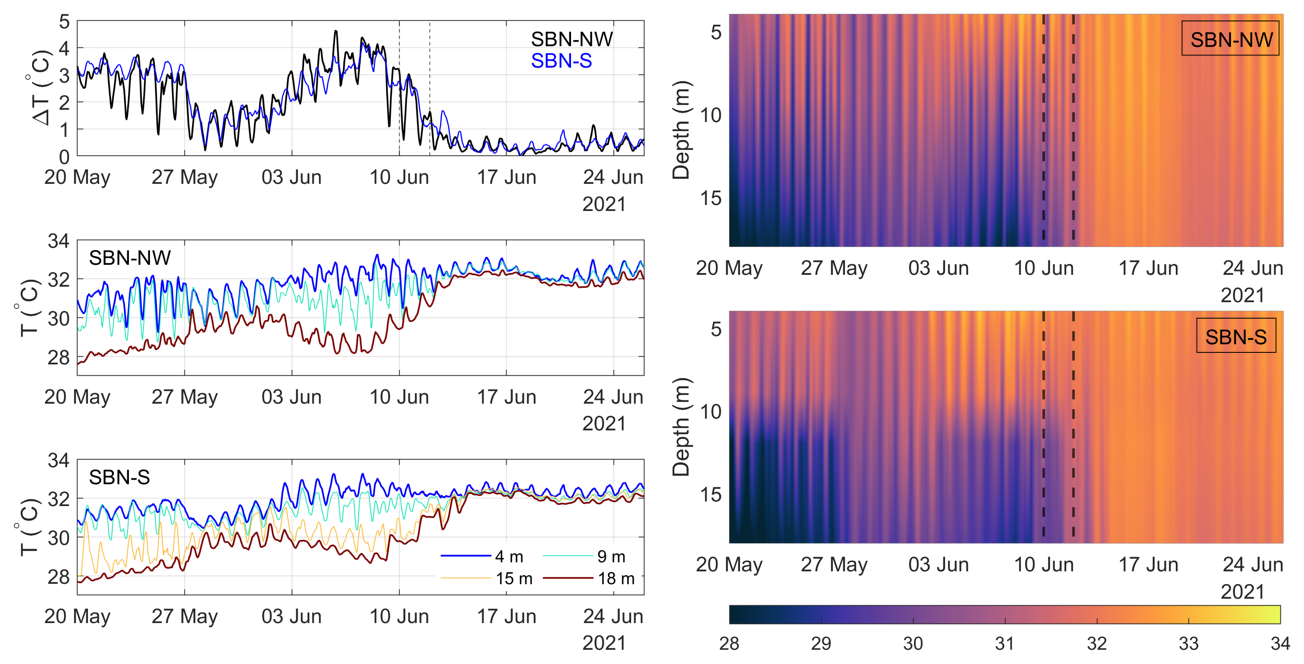
Figure 11Representative episode of strong vertical thermal variability at SBN-NW and SBN-S. Left column: (top) near-surface to near-bottom temperature difference (); (middle and bottom) temperature time series at instrumented depths (6 h moving mean) for SBN-NW and SBN-S, respectively. Right column: corresponding depth–time temperature fields derived from the discrete sensors at each site. Contour plots are used to synthesize the vertical structure from discrete depth measurements.
During this period, along-axis currents at SBN-NW frequently exceeded 0.3 m s−1 and were vertically coherence, with episodic intensification throughout the water column (Fig. 12a and c). At SBN-S, currents were weaker () and less vertically coherence (Fig. 12b and d). Progressive vector diagrams showed stronger, more directional northeastward displacement at SBN-NW, whereas trajectories at SBN-S were weaker, more dispersed, and predominantly eastward (Fig. 13b).
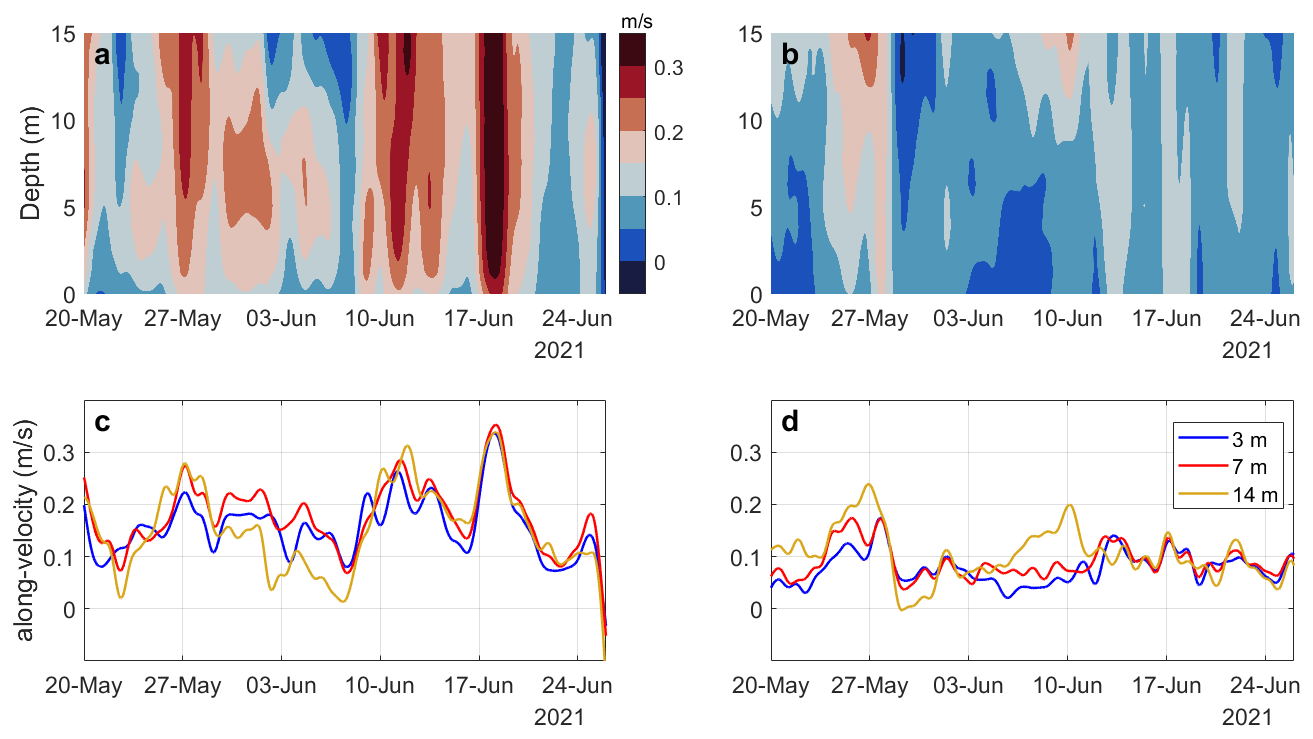
Figure 12Low-pass filtered currents correspond to SBN-NW (a, c), and to SBN-S (b, d). The upper panels (a, b) show depth–time distributions of along-axis velocity, obtained by rotating the velocity field onto the principal axis of variability (PCA), which defines the dominant flow direction. The panels (c, d) present time series at selected depths from the bottom (3, 7, and 14 m).
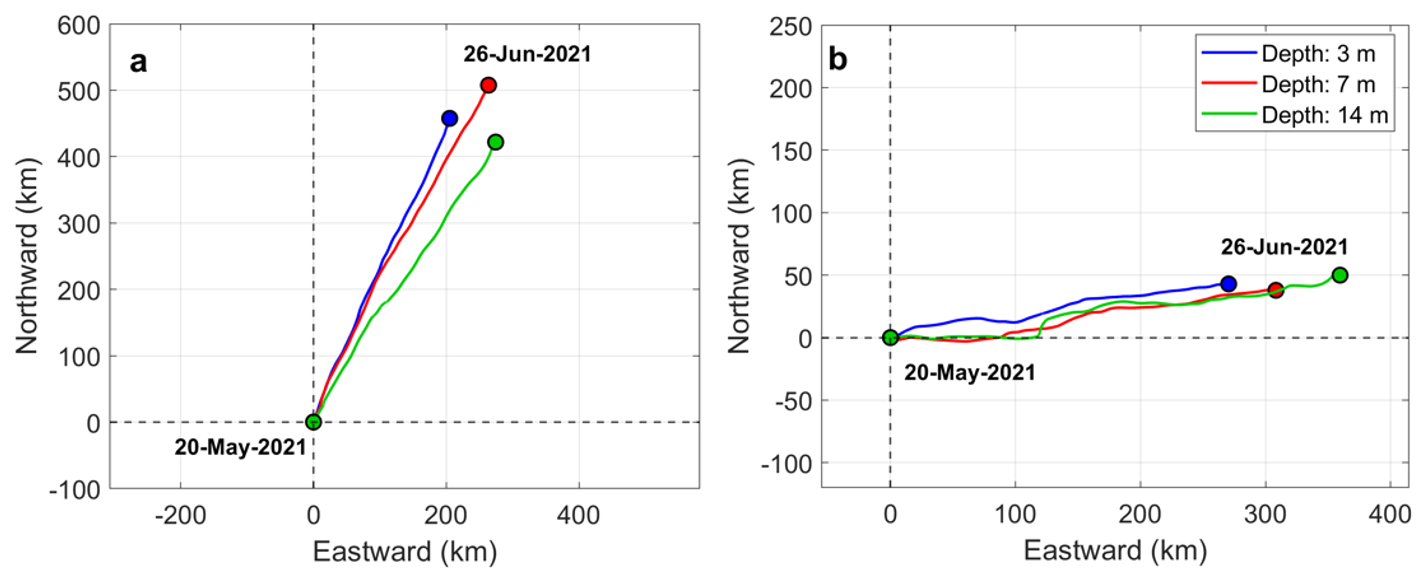
Figure 13Progressive vector diagrams of the hourly ADCP currents at SBN-NW (a) and SBN-S (b), for selected depths (3, 7, and 14 m), for the period 20 May–26 June 2021.
Spectral analysis of (ΔT) showed similar frequency-dependent variability at both sites (Fig. 14a), with most energy at lower frequencies (2–4 d), a pronounced diurnal peak (∼0.04 cph), and a smaller semidiurnal peak. The diurnal and lower-frequency signals were also evident in the full-record SBN-S spectrum (Fig. S3). Sea level (η) and currents showed pronounced variability at tidal frequencies, with site and component-specific differences, whereas wind stress was dominated by lower-frequency variability (Fig. 14b and c).
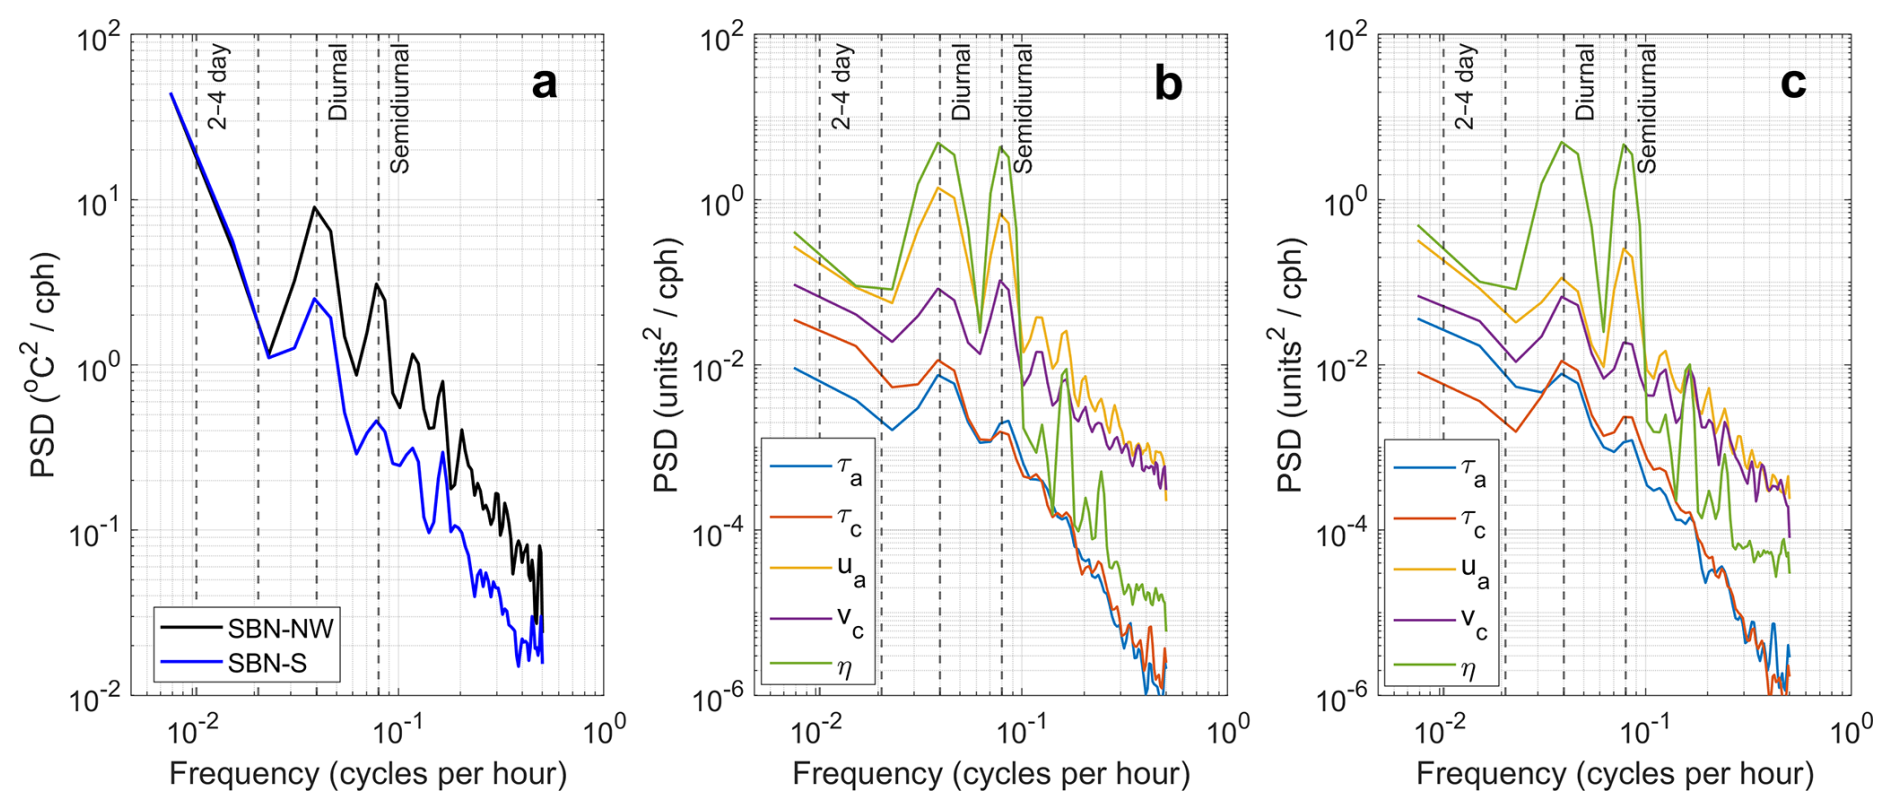
Figure 14Power spectral density (PSD) of vertical temperature difference () at SBN-NW (black) and SBN-S (blue) (a). PSD of forcing components projected onto the local principal axes at SBN-NW (b) and SBN-S (c), including along- and across-axis wind stress (τa, τc), current velocity (Ua, Uc), and sea level (η). Vertical dashed lines indicate characteristic bands (2–4 d, diurnal, semidiurnal).
At SBN-NW, coherence with ΔT was strongest in the diurnal band, reaching ∼0.55 for cross-axis wind stress (τc) and along-axis currents (ua), with lower coherence for sea level (η), and along-axis wind stress (τa) (Fig. 15a). Cross-spectral density was also largest in this band, particularly for ua (Fig. 15c). At SBN-S, diurnal coherence was weaker (∼0.35), with correspondingly lower cross-spectral density (Fig. 15b and d).
Secondary coherence occurred near semidiurnal frequencies, although ΔT spectral energy was small. A quarter-diurnal (M4) signal was evident in the hydrodynamic field, particularly between sea level and along-axis currents at SBN-NW (coherence ∼0.50), but its coherence with ΔT remained <0.25. Coherence at the 2–4 d periods was generally modest. Significant diurnal relationships corresponded to phase-derived lags of a few hours.
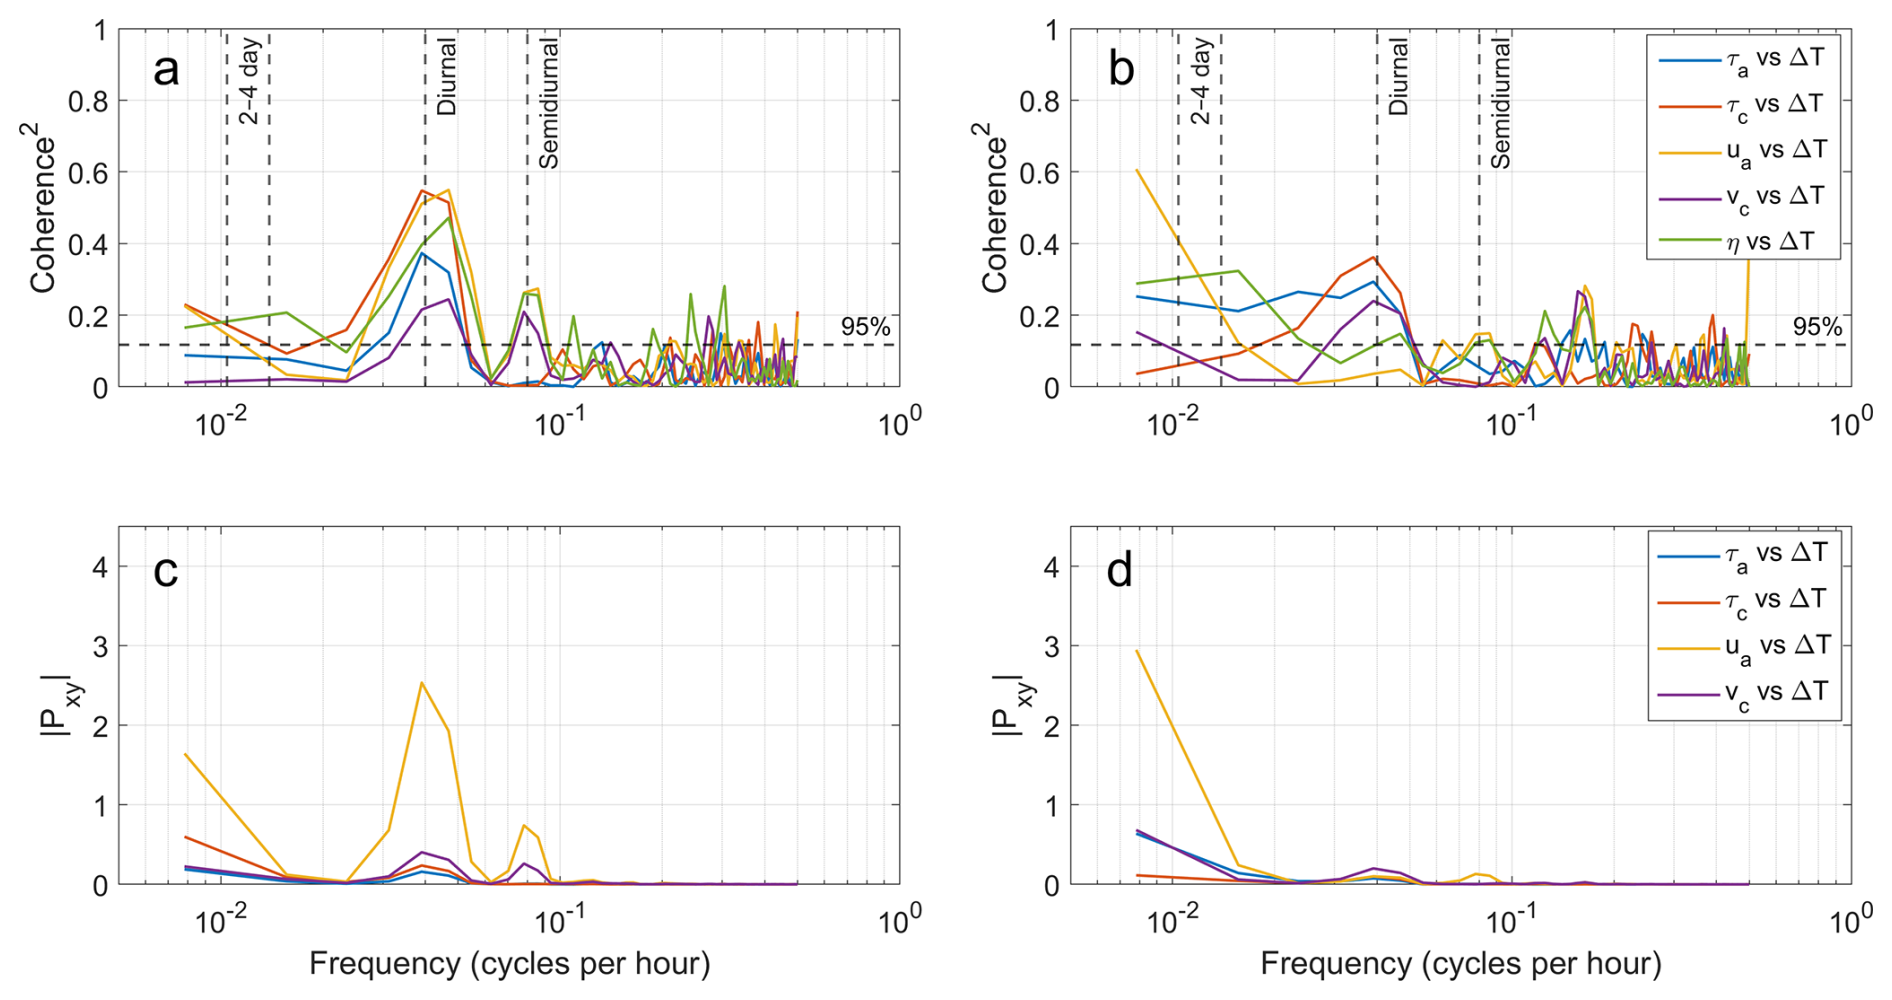
Figure 15Magnitude-squared coherence and cross-spectral density magnitude between ΔT (18-4 m) and forcing components at SBN-NW (a, c) and SBN-S (b, d). Wind forcing is represented by along- and across-axis wind stress (τa,τc), then current velocity (ua, vc), and sea level (η). Dashed vertical lines indicate the 2–4 d, diurnal, and semidiurnal bands, and the horizontal dashed line marks the 95 % coherence significance threshold.
Band-limited variance partitioning showed that ΔT variability was greatest in the diurnal band, followed by the 2–4 d and semidiurnal bands (Fig. 16). At SBN-NW, the diurnal band explained 67 % of ΔT variance, with the largest unique contributions from cross-axis wind stress (τc; 9.8 %) and along-axis currents (ua; 8.8 %). The 2–4 d band explained 39 %, with sea level providing the largest unique contribution (12 %), whereas the semidiurnal band explained 31 % and was primarily associated with currents (Fig. 16a and c).
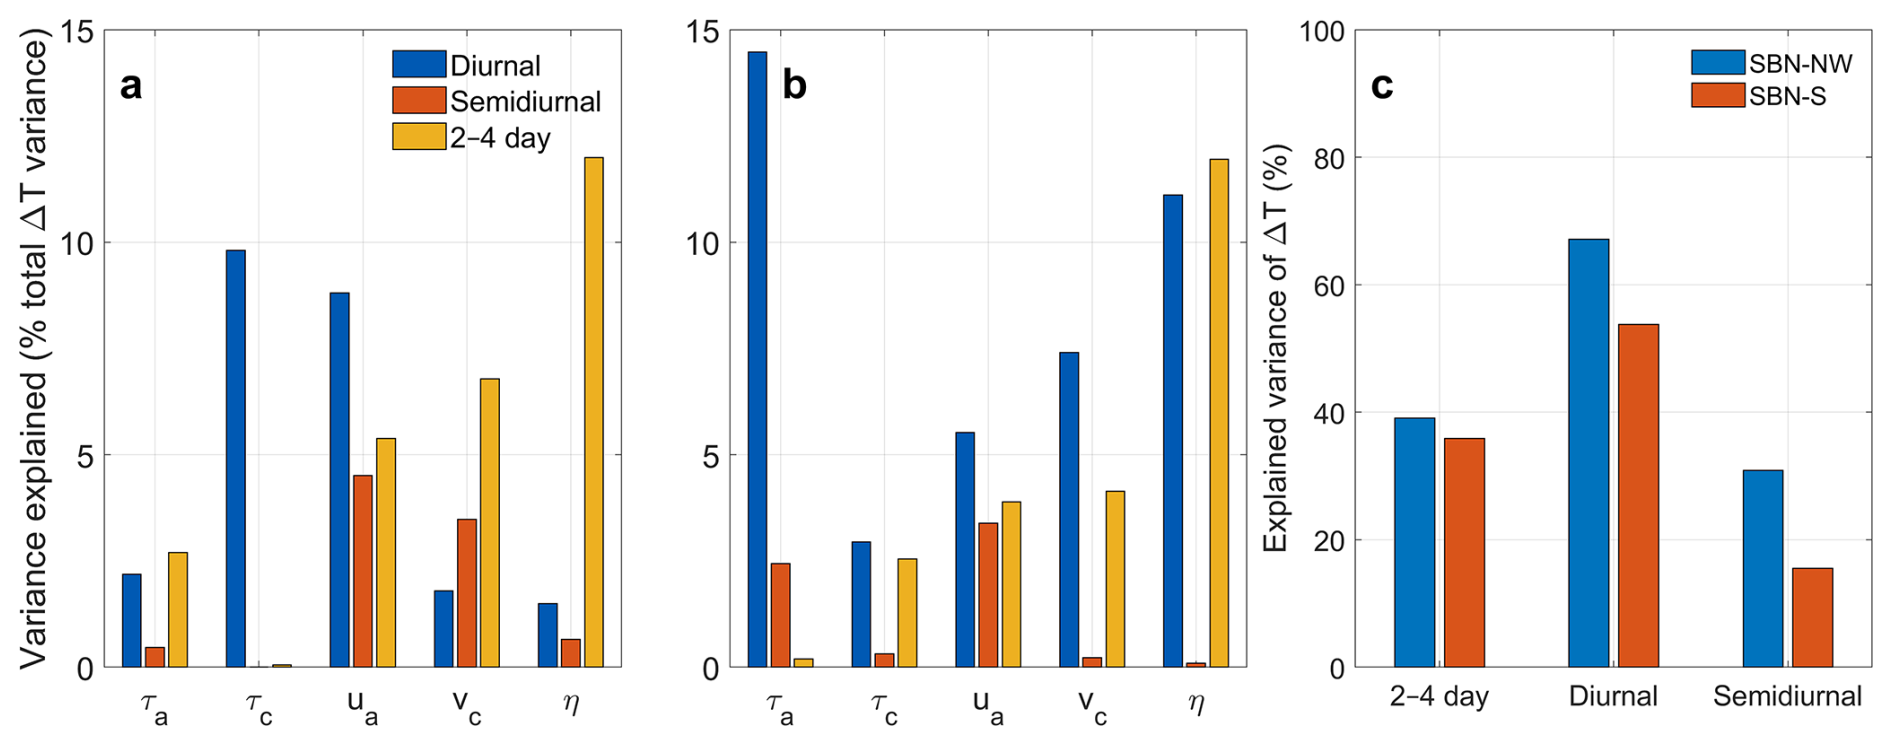
Figure 16Unique variance explained in ΔT by individual forcing components (wind stress: τa, τc; along- and across-axis currents: ua, vc; sea level: (η) expressed as percentage of total ΔT variance at SBN-NW (a) and SBN-S (b); (c) Total explained variance of ΔT(%) for the full model in the 2–4 d, diurnal, and semidiurnal bands. Contributions were calculated as the reduction in full-model R2 when each predictor was omitted.
At SBN-S, the diurnal band explained 54 % of ΔT variance, with the largest unique contribution from along-axis wind stress (τa; 14.5 %), sea level (η; 11.1 %). The 2–4 d band explained 36 %, again with the sea level providing the largest unique contribution (12 %), while the semidiurnal band explained 16 % (Fig. 16b and c).
Despite instrument loss and associated data gaps, the multi-instrument observations provided the most comprehensive physical oceanographic description of SBN to date, and probably anywhere else in the southern Gulf. The results identified the dominant physical influences on local circulation and characterized the vertical thermal structure and episodic transitions between stratified and thermally homogeneous conditions around the island.
4.1 Principal circulation regime around Sir Bu Nair Island
The observations provide the first integrated description of circulation around Sir Bu Nair Island (SBN) and show that local hydrodynamics reflect the interaction between tidal forcing, regional circulation, and the island's steep surrounding bathymetry. At both mooring sites, currents were highly anisotropic and aligned with a dominant principal axis, indicating rectilinear flow strongly influenced by local bathymetry rather than freely rotating shelf circulation.
At SBN-NW, upper-layer along-axis currents commonly reached , with episodic peaks approaching 0.8–1.0 m s−1, consistent with values reported from a shorter deployment (Cavalcante et al., 2024). Currents at SBN-S were weaker, commonly reaching . This directional asymmetry is typical of island and reef environments where tidal and residual flows can be steered by bathymetry gradients and coastline geometry into preferred pathways (Lowe and Falter, 2015; Wolanski and Hamner, 1988). The regional CMEMS comparison further showed that the mean flow at SBN-S was broadly aligned with the regional circulation, whereas the flow at SBN-NW was strongly rotated relative to the regional field. This contrast was consistent with substantial local modification of the regional flow around the island. Circulation around SBN therefore cannot be represented by a single island-scale state but varied substantially between adjacent flanks.
Subtidal currents were also predominantly barotropic, with most kinetic energy contained in the depth-mean flow and concentrated along the principal axis, indicating that the rectilinear circulation pattern persisted at lower frequencies. This vertically coherent flow is consistent with previous Gulf studies showing that tidal shear, bottom friction, and shallow bathymetry promote strong mixing and depth-uniform currents over broad areas of the basin (Alosairi and Pokavanich, 2017; Kämpf and Sadrinasab, 2006; Salim et al., 2024; Cavalcante et al., 2012). Periods of thermal stratification in late spring and summer, however, were accompanied by increased vertical differentiation in the flow, particularly from late May to mid-June 2021 (Fig. 11). During these periods, surface waters were 2–4 °C warmer than bottom waters and vertical shear increased.
4.2 Relative roles of tides and wind forcing
Tidal forcing was the primary driver of current variability at SBN, particularly along the principal flow axis. Harmonic analysis showed that tidal constituents explained ∼80 % of the along-axis variance at SBN-NW, but only ∼35 % of the cross-axis variance. At SBN-S, tidal control was weaker, accounting for ∼39 % of the along-axis and ∼12 % of the cross-axis variance. Spectral analyses further showed that the principal tidal energy was concentrated in the diurnal and semidiurnal bands, consistent with previous Gulf-wide studies (Reynolds, 1993; Cavalcante et al., 2011), although both peaks were less pronounced at SBN-S.
This interpretation was reinforced by the coherence and phase relationships between sea level and currents. At SBN-NW, sea level was strongly coherent with along-axis currents in both the diurnal and semidiurnal bands, while cross-axis currents also exhibited substantial coherence, consistent with local modification of the tidal flow around the island. At SBN-S, the strongest coupling occurred in the semidiurnal along-axis band, whereas other bands were weaker and more variable. Together with the stronger current amplitudes and directional organization at SBN-NW, these results indicated more energetic and organized tidal exchange at SBN-NW than at SBN-S.
A secondary quarter-diurnal peak (M4, ∼0.161 cph) was also present in the spectra. Previous work interpreted this feature as possible seiche activity around SBN (Cavalcante et al., 2024). However, its coincidence with the expected M4 overtide of the dominant semidiurnal tide, together with its weak association with ΔT in the present analysis, was more consistent with nonlinear tidal harmonic generation around the island and adjacent shoals. By contrast, energy near the 25–26 h period identified from multi-year Gulf sea level records is more consistent with previously proposed Gulf-scale seiche dynamics (Afshar-Kaveh et al., 2020). Thus, although tides dominated currents and sea level variability, they did not fully explain the observed current variability, particularly in the cross-axis component and at subtidal timescales.
Wind forcing emerged as an important secondary influence within this tide-dominated regime. The clearest responses occurred in the cross-axis flow at SBN-NW and the along-axis flow at SBN-S, where correlations peaked at short lags (0–2 h) and coherence increased at subtidal periods of 3–8 d. These responses were consistent with synoptic timescales of Shamal variability (Al Senafi and Anis, 2015; Makarem et al., 2026), which influences Gulf circulation and sea level setup (Thoppil and Hogan, 2010; Kämpf and Sadrinasab, 2006; Pous et al., 2004; Reynolds, 1993). Although secondary to tides, wind forcing could therefore have modified residual transport pathways around SBN (Cavalcante et al., 2020). The short response times were consistent with rapid local barotropic adjustment through wind-driven setup/set-down and associated pressure gradients, rather than a classical offshore Ekman response.
4.3 Mechanisms of episodic thermal homogenization
The repeated development and rapid reduction, typically over 2–3 d, of vertical temperature differences at SBN characterized a highly dynamic thermal regime. During the May–June 2021 event (Fig. 11), ΔT exceeded 4 °C before temperatures converged rapidly across the observed depths, indicating an abrupt thermal homogenization rather than gradual erosion of the vertical temperature gradient. Comparable episodes occurred across all three mooring locations during 2021–2022, with vertical temperature differences commonly reaching 2–4 °C, indicating that these transitions were not restricted to individual sites. Their seasonal timing was consistent with strong late spring and summer surface heating in the Gulf (Burt and Paparella, 2024; Paparella et al., 2019), which promotes the development of warm surface waters over cooler deeper layers, as previously observed around SBN (Cavalcante et al., 2024).
The persistence of large vertical temperature differences despite energetic tides indicated that tidal stirring alone was insufficient to suppress summer thermal stratification. Within the diurnal band, ΔT variability was associated with both current and atmospheric variability. Coherence and variance partitioning (Figs. 15 and 16) showed particularly strong associations at SBN-NW between ΔT, cross-axis wind stress (τc) and along-axis currents (ua). The diurnal band explained 67 % of ΔT variance at SBN-NW and 54 % at SBN-S. These relationships indicated that diurnal variability in wind forcing and currents was closely associated with changes in vertical thermal structure, superimposed on the tidally energetic background circulation.
At lower frequencies, the 2–4 d band accounted for 36 %–39 % of ΔT variance at both sites, with sea level (η) providing the largest unique contribution (∼12 %; Fig. 16). This timescale overlapped with synoptic wind variability in the Gulf, including Shamal events, suggesting that atmospheric forcing and associated sea-level and current adjustments may have contributed to the development and subsequent reduction of vertical temperature gradients. The rapid, near-synchronous convergence of temperatures across observed depths during the June 2021 event (Fig. 11) indicated a rapid transition toward thermal homogeneity, but the absence of concurrent salinity observations prevented assessment of density stratification and limited our ability to distinguish among vertical mixing, horizontal advection, or their combined effects. The observed variability therefore suggested an interaction between lower-frequency preconditioning and shorter-timescale tidal and atmospheric forcing, rather than control by a single mechanism.
4.4 Ecological implications
Over the past decade, coral reefs across much of the southern Gulf have declined following recurrent marine heatwaves, with losses of more than 80 % of live coral documented in some areas (Burt, 2024). SBN stands out in this context, with only one bleaching event recorded over the same period, comparatively modest coral losses, and the only known large stands of heat-sensitive Acropora table corals remaining in the southern Gulf after their extirpation elsewhere in the region (Hadj-Hammou et al., 2025). The hydrodynamic setting identified here may contribute to this relative resilience. thermal exposure across reef depths was strongly modulated by vertical temperature variability
SBN's offshore location (>70 km) reduces its exposure to coastal anthropogenic pressures (Howells et al., 2020; Hadj-Hammou et al., 2025), while our results showed that thermal exposure across reef depths was strongly modulated by vertical temperature variability. During summer 2021, temperatures>35 °C persisted for up to 24 consecutive days (Fig. 5). Under these conditions, energetic tidal currents were insufficient to prevent persistent vertical temperature gradients and prolonged exposure of shallow reef habitats to high temperatures. This period coincided with the first recorded bleaching event at SBN and losses of heat-sensitive Acropora species (Hadj-Hammou et al., 2025).
These observations suggest an important relationship between physical forcing and reef thermal exposure at SBN. Under typical summer conditions, episodic wind forcing may contribute to the disruption of vertical temperature gradients and exchange between cooler subsurface waters and shallow reef habitats, potentially reducing cumulative thermal stress (Paparella et al., 2019; Yao and Johns, 2010b). Conversely, prolonged weak-wind conditions may favour the persistence of strong vertical temperature gradientsand heat retention in the shallow reef zone, increasing exposure to temperatures associated with bleaching. The potential role of wind forcing in modulating reef thermal exposure may become increasingly relevant under climate change, given the reported decline in summer Shamal frequency since the mid-1990s (Al Senafi and Anis, 2015), and increasingly recurrent bleaching events across Gulf reefs (Riegl et al., 2018).
Spatial variability in circulation may also influences SBN's role in regional connectivity. Previous modelling studies identified SBN as a potential larval source for degraded reefs along the southern Gulf coast (Riegl et al., 2017; Cavalcante et al., 2016). The present observations provide physical context for this interpretation, showing substantial differences in current strength and direction between adjacent island flanks and in their relationship with the regional circulation. Such spatial heterogeneity is likely to influence pathways of larval export and retention around the island. SBN's capacity to function as both a relative thermal refuge and a source of larvae therefore likely depends on the interaction between regional and locally modified circulation and episodic thermal stress.
Overall, circulation and thermal variability at SBN reflected a hierarchy of interacting processes, with tides establishing the dominant current variability and flow structure, and wind and lower-frequency sea level and current variability associated with changes in residual circulation and vertical thermal structure. Together with strong topographic steering, these interacting processes produced spatially and temporally heterogeneous conditions around the island, with implications for physical exchange, thermal exposure, and reef connectivity.
The bathymetry data in Fig. 1 was retrieved from the GEBCO website: https://download.gebco.net/ (last access: 10 March 2026). ERA5 atmospheric reanalysis data were obtained from the Copernicus Climate Data Store (CDS) (Hersbach et al., 2020) and are publicly available at: https://cds.climate.copernicus.eu/datasets/reanalysis-era5-single-levels?tab=download (last access: 15 September 2025). The in-situ data (ADCP, HOBO and winds) can be provided by the corresponding author upon request. TPXO10-atlas global tidal model data used to generate the tidal constituent maps were obtained from the TPXO global tidal solutions (Egbert and Erofeeva, 2002) and are publicly available at: https://www.tpxo.net/global (last access: 8 August 2025). The SST data were obtained from NOAA CRW and are available at: https://www.star.nesdis.noaa.gov/pub/socd/mecb/crw/data/5km/v3.1_op/nc/v1.0/daily/sst/ (last access: 25 August 2026). The CMEMS data used to evaluate the spatial and temporal circulation is available at: https://data.marine.copernicus.eu/product/GLOBAL_MULTIYEAR_PHY_001_030/files?subdataset=cmems_mod_glo_phy_my_0.083deg_P1D-m_202311 (last access: 26 August 2026).
The supplement related to this article is available online at https://doi.org/10.5194/os-22-3165-2026-supplement.
GHC: Conceptualization, Methodology, Investigation, Visualization, Formal analysis, Funding acquisition, Writing – original draft, Writing – review and editing. FV: Investigation, Writing – review and editing. RB: Investigation, Writing – review and editing. AB: Methodology, Investigation, Funding acquisition, Writing – review and editing. JAB: Conceptualization, Methodology, Investigation, Writing – review and editing. All authors took part in the extensive discussion of the results and provided expertise and insight to the conclusions from their areas of expertise.
The contact author has declared that none of the authors has any competing interests.
Publisher's note: Copernicus Publications remains neutral with regard to jurisdictional claims made in the text, published maps, institutional affiliations, or any other geographical representation in this paper. The authors bear the ultimate responsibility for providing appropriate place names. Views expressed in the text are those of the authors and do not necessarily reflect the views of the publisher.
The authors acknowledge the outstanding support of Mubadala Arabian Center for Climate and Environmental Sciences for providing the logistics support for the fieldwork activities. The anonymous reviewers of the first versions of this publication are kindly acknowledged for their comments. The authors also acknowledge the Environment and Protected Areas Authority – Sharjah, for granting research permits to conduct this study. In additional, the author acknowledges the creators of ChatGPT used to improve the English writing in some parts of this manuscript.
This work was supported by the American University of Sharjah, United Arab Emirates (grant no. FRG21-M-S24). G. H. Cavalcante thanks CNPq (National Council for Scientific and Technological Development) for the Research Fellowship (grant no. 306370/2023-9). GC, RB and JB were supported by funding from the Mubadala Foundation under the NYUAD Research Institute grant CG009 to Mubadala ACCESS, and their support is greatly appreciated.
This paper was edited by Katsuro Katsumata and reviewed by Bernhard Riegl and one anonymous referee.
Afshar-Kaveh, N., Nazarali, M., and Pattiaratchi, C.: Relationship between the Persian Gulf Sea-Level Fluctuations and Meteorological Forcing, Journal of Marine Science and Engineering, 8, 285, https://doi.org/10.3390/jmse8040285, 2020.
Al Azhar, M., Temimi, M., Zhao, J., and Ghedira, H.: Modeling of circulation in the Arabian Gulf and the Sea of Oman: Skill assessment and seasonal thermohaline structure, J. Geophys. Res.-Oceans, 121, 1700–1720, https://doi.org/10.1002/2015jc011038, 2016.
Alosairi, Y. and Pokavanich, T.: Seasonal circulation assessments of the Northern Arabian/Persian Gulf, Mar. Pollut. Bull., 116, 270–290, https://doi.org/10.1016/j.marpolbul.2016.12.065, 2017.
Alosairi, Y., Imberger, J., and Falconer, R. A.: Mixing and flushing in the Persian Gulf (Arabian Gulf), J. Geophys. Res.-Oceans, 116, https://doi.org/10.1029/2010jc006769, 2011.
Al Senafi, F. and Anis, A.: Shamals and climate variability in the Northern Arabian/Persian Gulf from 1973–2012, Int. J. Climatol., 35, 4509–4528, https://doi.org/10.1002/joc.4302, 2015.
Bejarano, I., Orenes-Salazar, V., Bento, R., García-Charton, J. A., and Mateos-Molina, D.: Coral reefs at Sir Bu Nair Island: An offshore refuge of Acropora in the southern Arabian Gulf, Mar. Pollut. Bull., 178, 113570, https://doi.org/10.1016/j.marpolbul.2022.113570, 2022.
Bendat, J. S. and Piersol, A. G.: Random Data: Analysis and Measurement Procedures, 4th Edn., Wiley, https://doi.org/10.1002/9781118032428, 2011.
Bento, R., Cavalcante, G., Mateos-Molina, D., Riegl, B., and Bejarano, I.: Recruitment and larval connectivity of a remnant Acropora community in the Arabian Gulf, United Arab Emirates, Coral Reefs, https://doi.org/10.1007/s00338-021-02187-7, 2021.
Burt, J. A.: From Phoenix to Sisyphus: Climate Change Impacts and Intervention Strategies for Arabian Gulf Coral Reefs, J. Coastal Res., 113, 839–839, 831, https://doi.org/10.2112/JCR-SI113-165.1, 2024.
Burt, J. A. and Paparella, F.: The Marine Environment of the Emirates, in: A Natural History of the Emirates, edited by: Burt, J. A., Springer Nature Switzerland, Cham, 95–117, https://doi.org/10.1007/978-3-031-37397-8_4, 2024.
Campos, E. J. D., Vieira, F., Cavalcante, G., Kjerfve, B., Abouleish, M. Y., Shahriar, S., Mohamed, R., and Gordon, A. L.: Impacts of brine disposal from water desalination plants on the physical environment in the Persian/Arabian Gulf, Environmental Research Communications, https://doi.org/10.1088/2515-7620/abd0ed, 2020.
Cavalcante, G., Vieira, F., Mortensen, J., Ben-Hamadou, R., Range, P., Goergen, E. A., Campos, E., and Riegl, B. M.: Biophysical model of coral population connectivity in the Arabian/Persian Gulf, Chap. 8, in: Advances in Marine Biology, edited by: Riegl, B. M., Academic Press, 193–221, https://doi.org/10.1016/bs.amb.2020.07.001, 2020.
Cavalcante, G. H., Kjerfve, B., Feary, D. A., Bauman, A. G., and Usseglio, P.: Water currents and water budget in a coastal megastructure, Palm Jumeirah lagoon, Dubai, UAE, J. Coastal Res., 27, 384–393, https://doi.org/10.2112/JCOASTRES-D-09-00177.1, 2011.
Cavalcante, G. H., Kjerfve, B., and Feary, D. A.: Examination of residence time and its relevance to water quality within a coastal mega-structure: The Palm Jumeirah Lagoon, J. Hydrol., 468–469, 111–119, https://doi.org/10.1016/j.jhydrol.2012.08.027, 2012.
Cavalcante, G. H., Feary, D. A., and Burt, J. A.: The influence of extreme winds on coastal oceanography and its implications for coral population connectivity in the southern Arabian Gulf, Mar. Pollut. Bull., 105, 489–497, https://doi.org/10.1016/j.marpolbul.2015.10.031, 2016.
Cavalcante, G. H., Vieira, F., Bento, R., Bartholomew, A., and Burt, J. A.: Oceanographic variability in Sir Bu Nair Island (Arabian/Persian Gulf) based on in situ observations., J. Coastal Res., 113, 410–414, https://doi.org/10.2112/JCR-SI113-081.1, 2024.
Chao, S.-Y., Kao, T. W., and Al-Hajri, K. R.: A numerical investigation of circulation in the Arabian Gulf, J. Geophys. Res.-Oceans, 97, 11219–11236, https://doi.org/10.1029/92JC00841, 1992.
Egbert, G. D. and Erofeeva, S. Y.: Efficient Inverse Modeling of Barotropic Ocean Tides, J. Atmos. Ocean. Tech., 19, 183–204, https://doi.org/10.1175/1520-0426(2002)019<0183:EIMOBO>2.0.CO;2, 2002.
Elipot, S. and Gille, S. T.: Estimates of wind energy input to the Ekman layer in the Southern Ocean from surface drifter data, J. Geophys. Res.-Oceans, 114, C06003-C06003, https://doi.org/10.1029/2008JC005170, 2009.
Ellison, R. A., Thomas, R. J., Jacobs, J., and Pharaoh, T. C.: Anatomy and uplift history of the emergent salt domes of the United Arab Emirates, Arab. J. Geosci., 15, 23, https://doi.org/10.1007/s12517-021-09034-7, 2021.
Grömping, U.: Estimators of Relative Importance in Linear Regression Based on Variance Decomposition, Am. Stat., 61, 139–147, https://doi.org/10.1198/000313007X188252, 2007.
Hadj-Hammou, J., Bartholomew, A., Bento, R. C., Mohamed, F. A., Cavalcante, G. H., and Burt, J. A.: Bleaching Impacts on the Last Remaining Acropora-dominated Reefs in the United Arab Emirates, Diversity, 17, 610, https://doi.org/10.3390/d17090610, 2025.
Hassanzadeh, S., Hosseinibalam, F., and Rezaei-Latifi, A.: Numerical modelling of salinity variations due to wind and thermohaline forcing in the Persian Gulf, Appl. Math. Model., 35, 1512–1537, https://doi.org/10.1016/j.apm.2010.09.029, 2011.
Hersbach, H., Bell, B., Berrisford, P., Hirahara, S., Horányi, A., Muñoz-Sabater, J., Nicolas, J., Peubey, C., Radu, R., Schepers, D., Simmons, A., Soci, C., Abdalla, S., Abellan, X., Balsamo, G., Bechtold, P., Biavati, G., Bidlot, J., Bonavita, M., De Chiara, G., Dahlgren, P., Dee, D., Diamantakis, M., Dragani, R., Flemming, J., Forbes, R., Fuentes, M., Geer, A., Haimberger, L., Healy, S., Hogan, R. J., Hólm, E., Janisková, M., Keeley, S., Laloyaux, P., Lopez, P., Lupu, C., Radnoti, G., de Rosnay, P., Rozum, I., Vamborg, F., Villaume, S., and Thépaut, J.-N.: The ERA5 global reanalysis, Q. J. Roy. Meteorol. Soc., 146, 1999–2049, https://doi.org/10.1002/qj.3803, 2020.
Howells, E. J., Vaughan, G. O., Work, T. M., Burt, J. A., and Abrego, D.: Annual outbreaks of coral disease coincide with extreme seasonal warming, Coral Reefs, 39, 771–781, https://doi.org/10.1007/s00338-020-01946-2, 2020.
Ibrahim, H. D. and Eltahir, E. A. B.: Impact of Brine Discharge from Seawater Desalination Plants on Persian/Arabian Gulf Salinity, J. Environ. Eng., 145, 04019084, https://doi.org/10.1061/(ASCE)EE.1943-7870.0001604, 2019.
Jean-Michel, L., Eric, G., Romain, B.-B., Gilles, G., Angélique, M., Marie, D., Clément, B., Mathieu, H., Olivier, L. G., Charly, R., Tony, C., Charles-Emmanuel, T., Florent, G., Giovanni, R., Mounir, B., Yann, D., and Pierre-Yves, L. T.: The Copernicus Global Oceanic and Sea Ice GLORYS12 Reanalysis, Front. Earth Sci., 9, https://doi.org/10.3389/feart.2021.698876, 2021.
Kämpf, J. and Sadrinasab, M.: The circulation of the Persian Gulf: a numerical study, Ocean Sci., 2, 27–41, https://doi.org/10.5194/os-2-27-2006, 2006.
Kanarik, H., Tuomi, L., Alenius, P., Miettunen, E., Johansson, M., Roine, T., Westerlund, A., and Kahma, K. K.: Currents and their drivers in the Archipelago Sea: insights from ADCP measurements, Ocean Sci., 21, 2125–2147, https://doi.org/10.5194/os-21-2125-2025, 2025.
Langodan, S., Cavaleri, L., Bertotti, L., Qasem, A. M., Razak, S. P., Pomaro, A., and Hoteit, I.: Winds and waves in the Arabian Gulf: Physics, characteristics and long-term hindcast, Int. J. Climatol., 43, 3538–3551, https://doi.org/10.1002/joc.8043, 2023.
Large, W. G. and Pond, S.: Open ocean momentum flux measurements in moderate to strong winds, J. Phys. Oceanogr., 11, 324–336, https://doi.org/10.1175/1520-0485(1981)011<0324:OOMFMI>2.0.CO;2, 1981.
Lowe, R. J. and Falter, J. L.: Oceanic Forcing of Coral Reefs, Annu. Rev. Mar. Sci., 7, 43–66, https://doi.org/10.1146/annurev-marine-010814-015834, 2015.
Makarem, F., Alzaatreh, A., Atabay, S., Yılmaz, A. G., and Cavalcante, G.: Unraveling storm wave populations in the UAE with multivariate and clustering analysis, Scientific Reports, 16, 3412, https://doi.org/10.1038/s41598-025-33409-5, 2026.
Paparella, F., Xu, C., Vaughan, G. O., and Burt, J. A.: Coral Bleaching in the Persian/Arabian Gulf Is Modulated by Summer Winds, Frontiers in Marine Science, 6, https://doi.org/10.3389/fmars.2019.00205, 2019.
Pawlowicz, R., Beardsley, B., and Lentz, S.: Classical tidal harmonic analysis including error estimates in MATLAB using T_TIDE, Comput. Geosci.-UK, 28, 929–937, https://doi.org/10.1016/S0098-3004(02)00013-4, 2002.
Peres-Neto, P. R., Legendre, P., Dray, S., and Borcard, D.: Variation partitioning of species data matrices: Estimation and comparison of fractions, Ecology, 87, 2614–2625, https://doi.org/10.1890/0012-9658(2006)87[2614:VPOSDM]2.0.CO;2, 2006.
Piecuch, C. G., Coats, S., Dangendorf, S., Landerer, F. W., Reager, J. T., Thompson, P. R., and Wahl, T.: High-Tide Floods and Storm Surges During Atmospheric Rivers on the US West Coast, Geophys. Res. Lett., 49, e2021GL096820, https://doi.org/10.1029/2021GL096820, 2022.
Pous, S. P., Carton, X., and Lazure, P.: Hydrology and circulation in the Strait of Hormuz and the Gulf of Oman – Results from the GOGP99 Experiment: 2. Gulf of Oman, J. Geophys. Res.-Oceans, 109, https://doi.org/10.1029/2003JC002146, 2004.
Ranjbar, M. H., Etemad-Shahidi, A., and Kamranzad, B.: Modeling the combined impact of climate change and sea-level rise on general circulation and residence time in a semi-enclosed sea, Sci. Total Environ., 740, 140073, https://doi.org/10.1016/j.scitotenv.2020.140073, 2020.
Reynolds, R. M.: Physical oceanography of the Gulf, Strait of Hormuz, and the Gulf of Oman – Results from the Mt Mitchell expedition, Mar. Pollut. Bull., 27, 35–59, https://doi.org/10.1016/0025-326X(93)90007-7, 1993.
Riegl, B., Cavalcante, G., Bauman, A. G., Feary, D. A., Steiner, S., and Purkis, S.: Demographic mechanisms of reef coral species winnowing from communities under increased environmental stress, Frontiers in Marine Science, 4, 344, https://doi.org/10.3389/fmars.2017.00344, 2017.
Riegl, B., Johnston, M., Purkis, S., Howells, E., Burt, J., Steiner, S. C. C., Sheppard, C. R. C., and Bauman, A.: Population collapse dynamics in Acropora downingi, an Arabian/Persian Gulf ecosystem-engineering coral, linked to rising temperature, Glob. Change Biol., 24, 2447–2462, https://doi.org/10.1111/gcb.14114, 2018.
Salim, M., M P, S., Scott, J., Song, H., Marshall, J., and Al Shehhi, M. R.: Role of tidal mixing on ocean exchange through the Strait of Hormuz, Environmental Research Communications, 6, 071006, https://doi.org/10.1088/2515-7620/ad578c, 2024.
Simpson, J. H., Brown, J., Matthews, J., and Allen, G.: Tidal straining, density currents, and stirring in the control of estuarine stratification, Estuaries, 13, 125–132, https://doi.org/10.2307/1351581, 1990.
Skirving, W., Marsh, B., De La Cour, J., Liu, G., Harris, A., Maturi, E., Geiger, E., and Eakin, C. M.: CoralTemp and the coral reef watch coral bleaching heat stress product suite version 3.1, Remote Sens.-Basel, 12, 3856, https://doi.org/10.3390/rs12233856, 2020.
Thomas, R. J., Ellison, R. A., Goodenough, K. M., Roberts, N. M. W., and Allen, P. A.: Salt domes of the UAE and Oman: Probing eastern Arabia, Precambrian Res., 256, 1–16, https://doi.org/10.1016/j.precamres.2014.10.011, 2015.
Thomson, R. E. and Emery, W. J.: Data analysis methods in physical oceanography, Elsevier, https://doi.org/10.1016/C2021-0-00298-4, 2024.
Thoppil, P. G. and Hogan, P. J.: A Modeling Study of Circulation and Eddies in the Persian Gulf, J. Phys. Oceanogr., 40, 2122–2134, https://doi.org/10.1175/2010jpo4227.1, 2010.
van der Molen, J., Groeskamp, S., and Maas, L. R. M.: Imminent reversal of the residual flow through the Marsdiep tidal inlet into the Dutch Wadden Sea based on multiyear ferry-borne acoustic Doppler current profiler (ADCP) observations, Ocean Sci., 18, 1805–1816, https://doi.org/10.5194/os-18-1805-2022, 2022.
Welch, P. D.: The use of fast Fourier transform for the estimation of power spectra: A method based on time averaging over short, modified periodograms, IEEE T. Acoust. Speech, 15, 70–73, https://doi.org/10.1109/TAU.1967.1161901, 1967.
Wolanski, E. and Hamner, W. M.: Topographically controlled fronts in the ocean and their biological influence, Science, 241, 177–181, https://doi.org/10.1126/science.241.4862.177, 1988.
Yao, F. and Johns, W. E.: A HYCOM modeling study of the Persian Gulf: 1. Model configurations and surface circulation, J. Geophys. Res.-Oceans, 115, https://doi.org/10.1029/2009JC005781, 2010a.
Yao, F. and Johns, W. E.: A HYCOM modeling study of the Persian Gulf: 2. Formation and export of Persian Gulf Water, J. Geophys. Res.-Oceans, 115, https://doi.org/10.1029/2009JC005788, 2010b.