
the Creative Commons Attribution 4.0 License.
the Creative Commons Attribution 4.0 License.
 | 09 Sep 2026
Phytoplankton community structure responses to episodic summer storms in a temperate coastal ecosystem
Harshal Chavan

Urania Christaki
Luis Felipe Artigas
Francois G. Schmitt
Extreme events potentially modify the physical and biogeochemical environment resulting in dramatic changes in phytoplankton community structure. In this study, the impact of ten well-identified storms on phytoplankton communities was explored in a productive temperate coastal ecosystem, the eastern English Channel (EEC). Our study targeted the summer season, which is typically characterised by low nutrient availability, yet transient phytoplankton blooms often occur. From 2012–2022, low-frequency (weekly to fortnightly) flow cytometry measurements of phytoplankton abundance were combined with high-frequency meteorological data (precipitation and wind) and river flow rates as a proxy for riverine influence. Storm impacts occurred in three distinct forms: high river inflow events, high wind stress-low inflow events, and low wind stress-low inflow events. Regardless of wind conditions, high inflow storms favoured diatoms, as nutrient-rich river plumes supported their growth. In contrast, low inflow events paired with strong winds enhanced vertical mixing and nutrient availability, favouring nanophytoplankton. Finally, weak winds and relatively low-nutrient conditions favoured picophytoplankton (Synechococcus and picoeukaryotes). Across years, storms repeatedly reset seasonal succession and maintained environmental heterogeneity, leading to transient monospecific peaks of phytoplankton. These findings highlight storms as recurrent structuring forces in the EEC, mediating nutrient availability and driving shifts in phytoplankton composition; as such, storm-driven dynamics might be an important input to prediction models for phytoplankton.
- Article
(7109 KB) - Full-text XML
- BibTeX
- EndNote


Coastal marine ecosystems are vulnerable to changes in weather patterns, particularly extreme events such as storms and heatwaves. The impact of extreme events can lead to deoxygenation, eutrophication, or the formation of harmful algal blooms in aquatic systems (Bianucci et al., 2018; Carpenter et al., 2022; Stockwell et al., 2020). Studies in lakes and oligotrophic seas in tropical and subtropical regions showed an increase in the chlorophyll-a (Chl-a) with cooling of the sea surface temperature (Babin et al., 2004; Jena et al., 2012) usually lasting for 1–3 weeks following storm passage and inducing changes in phytoplankton composition by altering seasonal succession (Thyssen et al., 2014). While studies in polar environments have observed appreciable Chl-a increases in oligotrophic Arctic waters (Pozdnyakov et al., 2014) and elevated primary production in the Barents and southern Chukchi Seas following cyclones (Crawford et al., 2020), the influence of such storms in coastal temperate waters remains poorly documented. Most existing studies rely on Chl-a and derived productivity estimates from satellite data (Crawford et al., 2020; Pozdnyakov et al., 2014; Zhao et al., 2009), yet the ecological consequences of storms are reflected not only on biomass but also on shifts in community composition and seasonal succession (Robache et al., 2025; Thyssen et al., 2014).
In this context, we focus on the eastern English Channel (EEC), a temperate coastal sea characterized by strong atmospheric frontal activity and regularly influenced by frequent extratropical storms. Originating in the North Atlantic, these storms track towards north-western Europe, where they exert substantial physical forcing on the region's coastal waters (Kaspi and Schneider, 2013; Priestley et al., 2020; Priestley and Catto, 2022). With rising global temperatures, weakening of the polar midlatitude temperature gradient is reducing jet stream stability, leading to more persistent weather patterns and a higher frequency of extreme precipitation events in temperate regions (Crawford et al., 2023; Dietze et al., 2022; Francis et al., 2020; Pfleiderer et al., 2019). Within the English Channel, the EEC is characterized by a nutrient-rich regime (Dulière et al., 2019; Lefebvre et al., 2011), particularly with an excess of nitrogen originating mainly from local rivers (e.g., the Somme; Loquet et al., 2000). The EEC coastline hosts numerous estuaries, including the Seine, the Somme, and several smaller systems such as the Authie, Canche, Liane, Wimereux, and Slack, which collectively contribute substantial nutrient inputs to coastal waters (Dulière et al., 2019). As a result, nutrient concentrations typically peak during the end of the winter leading to massive Phaeocystis globosa blooms in April–May each year (e.g., Breton et al., 2021; Lefebvre et al., 2011). By contrast, the end of spring is characterized by nutrient depletion, yet episodic summer blooms of diatoms as well as nanophytoplankton and picophytoplankton have been observed (e.g., Houliez et al., 2023; Skouroliakou et al., 2022). Over recent decades, summer season in the EEC has been increasingly dominated by picophytoplankton, accompanied by a decreasing trend in Chl-a concentrations (Hubert et al., 2025a; Huguet et al., 2024). Nevertheless, the causes of interannual variability in summer Chl-a concentrations and seasonal succession patterns remain poorly understood, reflecting the complex interplay among hydrodynamic processes, nutrient dynamics, and meteorological forcing. In a recent study (Skouroliakou et al., 2022), the summer phytoplankton succession in the EEC has been characterized as largely stochastic, with drift mechanisms accounting for more than 69 % of community turnover. However, these authors did not identify any specific environmental drivers underlying these stochastic processes. In the present work, we extend phytoplankton observations over a 10-year period and explore summer storm events as drivers of changes in phytoplankton composition.
The main objective of the present study was to better understand the occurrence of the summer phytoplankton blooms and to investigate the possible effect of summer storm events on the magnitude of the blooms and the phytoplankton community. We hypothesized that varying intensities of river inflow and wind stress drive distinct changes in abundance and community composition. Transient phytoplankton blooms during the nutrient-limited summer months in the eastern English Channel are a key feature of interest. A 10-year dataset (2012–2022) was used to evaluate biological responses alongside local meteorological forcing and riverine inputs. The phytoplankton community was characterized using functional groups derived from flow cytometry along a coastal–offshore gradient in the Strait of Dover, known as the DYPHYRAD (Dynamics of PHYtoplankton on RADiale) transect (Hubert et al., 2026).
2.1 Sampling strategy
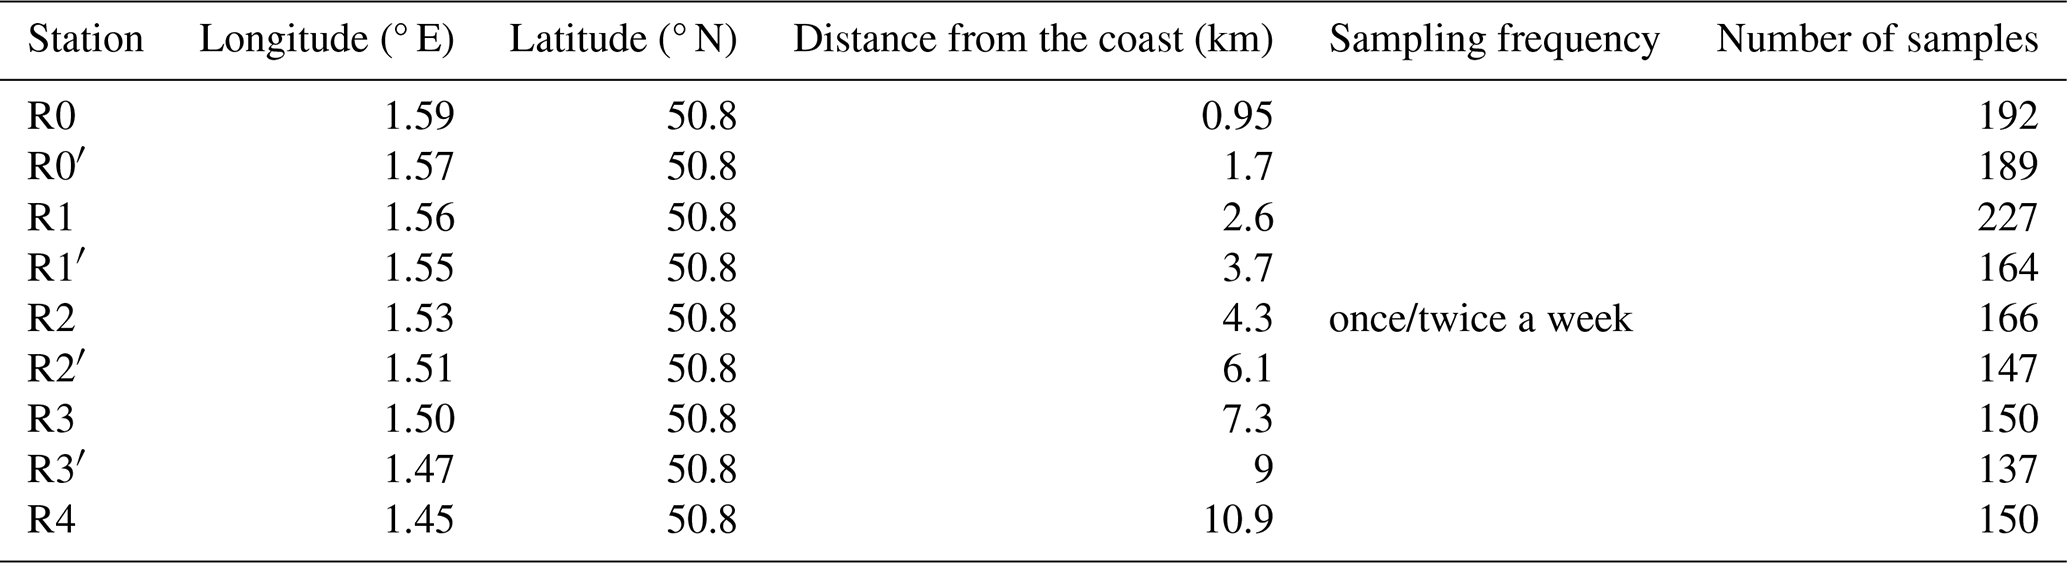
The EEC is a shallow coastal sea where depths rarely exceed 50 m, with an average depth of 45 m between Calais and Dover (Fig. 1). The region is subject to macro- and mega-tidal regimes, with tidal amplitudes often surpassing 8 m, and it receives substantial nutrient inputs from multiple estuaries along the Picardy and Opale coasts, most notably the Seine and Somme (Huguet et al., 2024). Sampling was performed weekly aboard the research vessel Sepia II (CNRS INSU-FOF, Centre National de la Recherche Scientifique Institut National des Sciences de l'Univers-Flotte Océanographique Française). The “coastal–offshore” distinction was defined within the frontal area to ensure each category consistently represented coastal and offshore waters, regardless of tidal state. Because frontal waters are strongly mixed, they span both categories, and tides mainly influence only the direction of flow (northwards or southwards; Brylinski et al., 1991). To account for tidal influences on phytoplankton communities, the sampling strategy used a high-resolution (∼ 1 km) coast–offshore transect comprising 9 stations (Fig. 1; Table 1). The transect spans approximately 9.7 km from coast to offshore, from R0 (50.8° N, 1.59° E) to R4 (50.8° N, 1.45° E) (Fig. 1). To facilitate analysis of spatial patterns, stations were categorized into two zones based on their proximity to shore: coastal (R0–R2) and offshore (R2′–R4). The highest sampling frequency was recorded at station R1 (227 samples, Table 1). Additional details regarding data acquisition and validation are provided in Hubert et al. (2026). In addition to DYPHYRAD, we incorporated datasets from two French National Observation Systems (Systèmes Nationaux d'Observation, SNO): SOMLIT and PHYTOBS. SOMLIT contributed data from two stations (SOMLIT C and SOMLIT L) sampled at most twice per month. PHYTOBS contributed data from Boulogne and from station C, which is co-located with SOMLIT C. Data from SOMLIT C and PHYTOBS C were classified as coastal, while SOMLIT L represented offshore conditions.
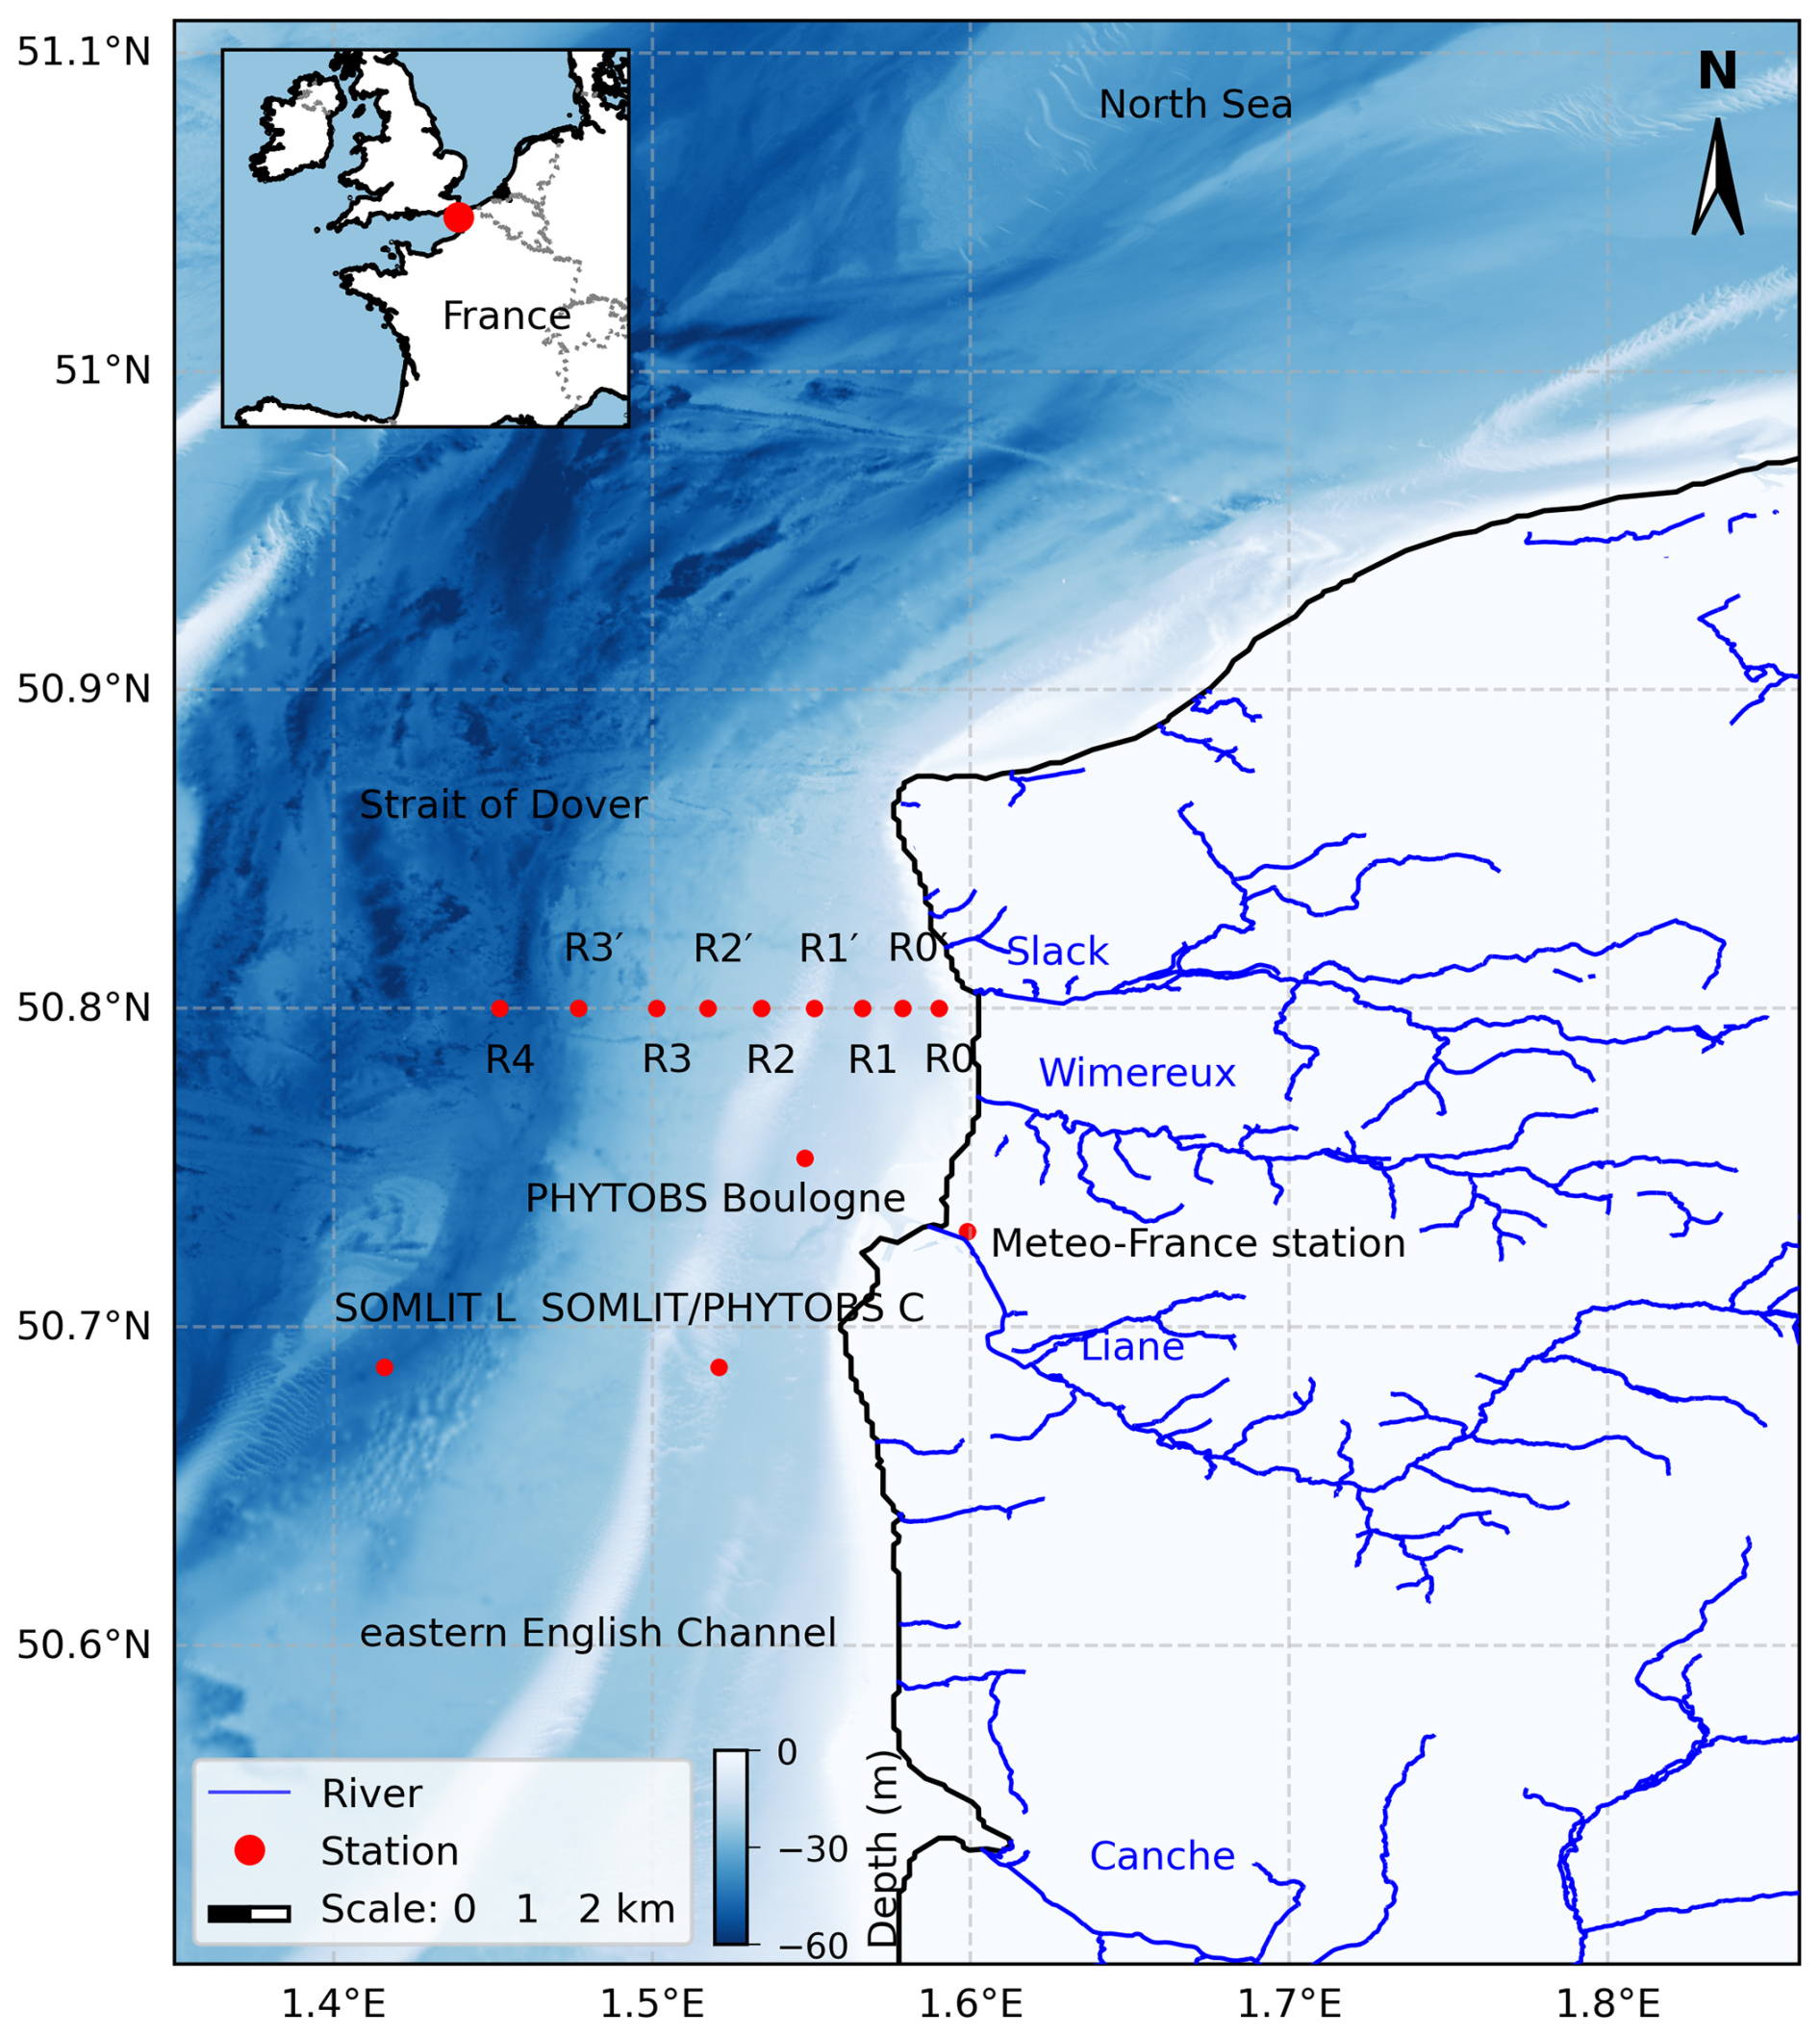
Figure 1Map of the study area showing the locations of the DYPHYRAD stations (R0–R4), the co-located SOMLIT/PHYTOBS C, SOMLIT L, and PHYTOBS Boulogne station in the EEC near the Strait of Dover. The Météo-France station at Boulogne-sur-Mer is situated on the adjacent coastline of the EEC.
2.2 Environmental and biological parameters
At each station (R0–R4), sea temperature (T, °C) and salinity were measured using a conductivity-temperature-depth profiler (CTD Seabird SBE 25). Subsurface water samples (1–2 m depth) were collected along the DYPHYRAD transect to measure Chl-a, nutrients and phytoplankton abundance. Dissolved inorganic nutrients i.e., nitrite (), nitrate (), orthophosphate () and orthosilicic acid (Si(OH)4) concentrations were quantified using an autoanalyzer (AutoAnalyzer ALLIANCE SpA, Italy until 2016; then AA3 HR AutoAnalyzer, SEAL Analytical GmbH, Germany) following a protocol based on Aminot and Kérouel (2004). Dissolved nutrients are referred to hereafter as DIN ( + ), DIP () and DiSi (Si(OH)4). Chl-a concentrations were measured using a Turner Designs 10-AU field fluorometer (Turner Designs Ltd, USA), as described in the equations developed by Lorenzen (1966).
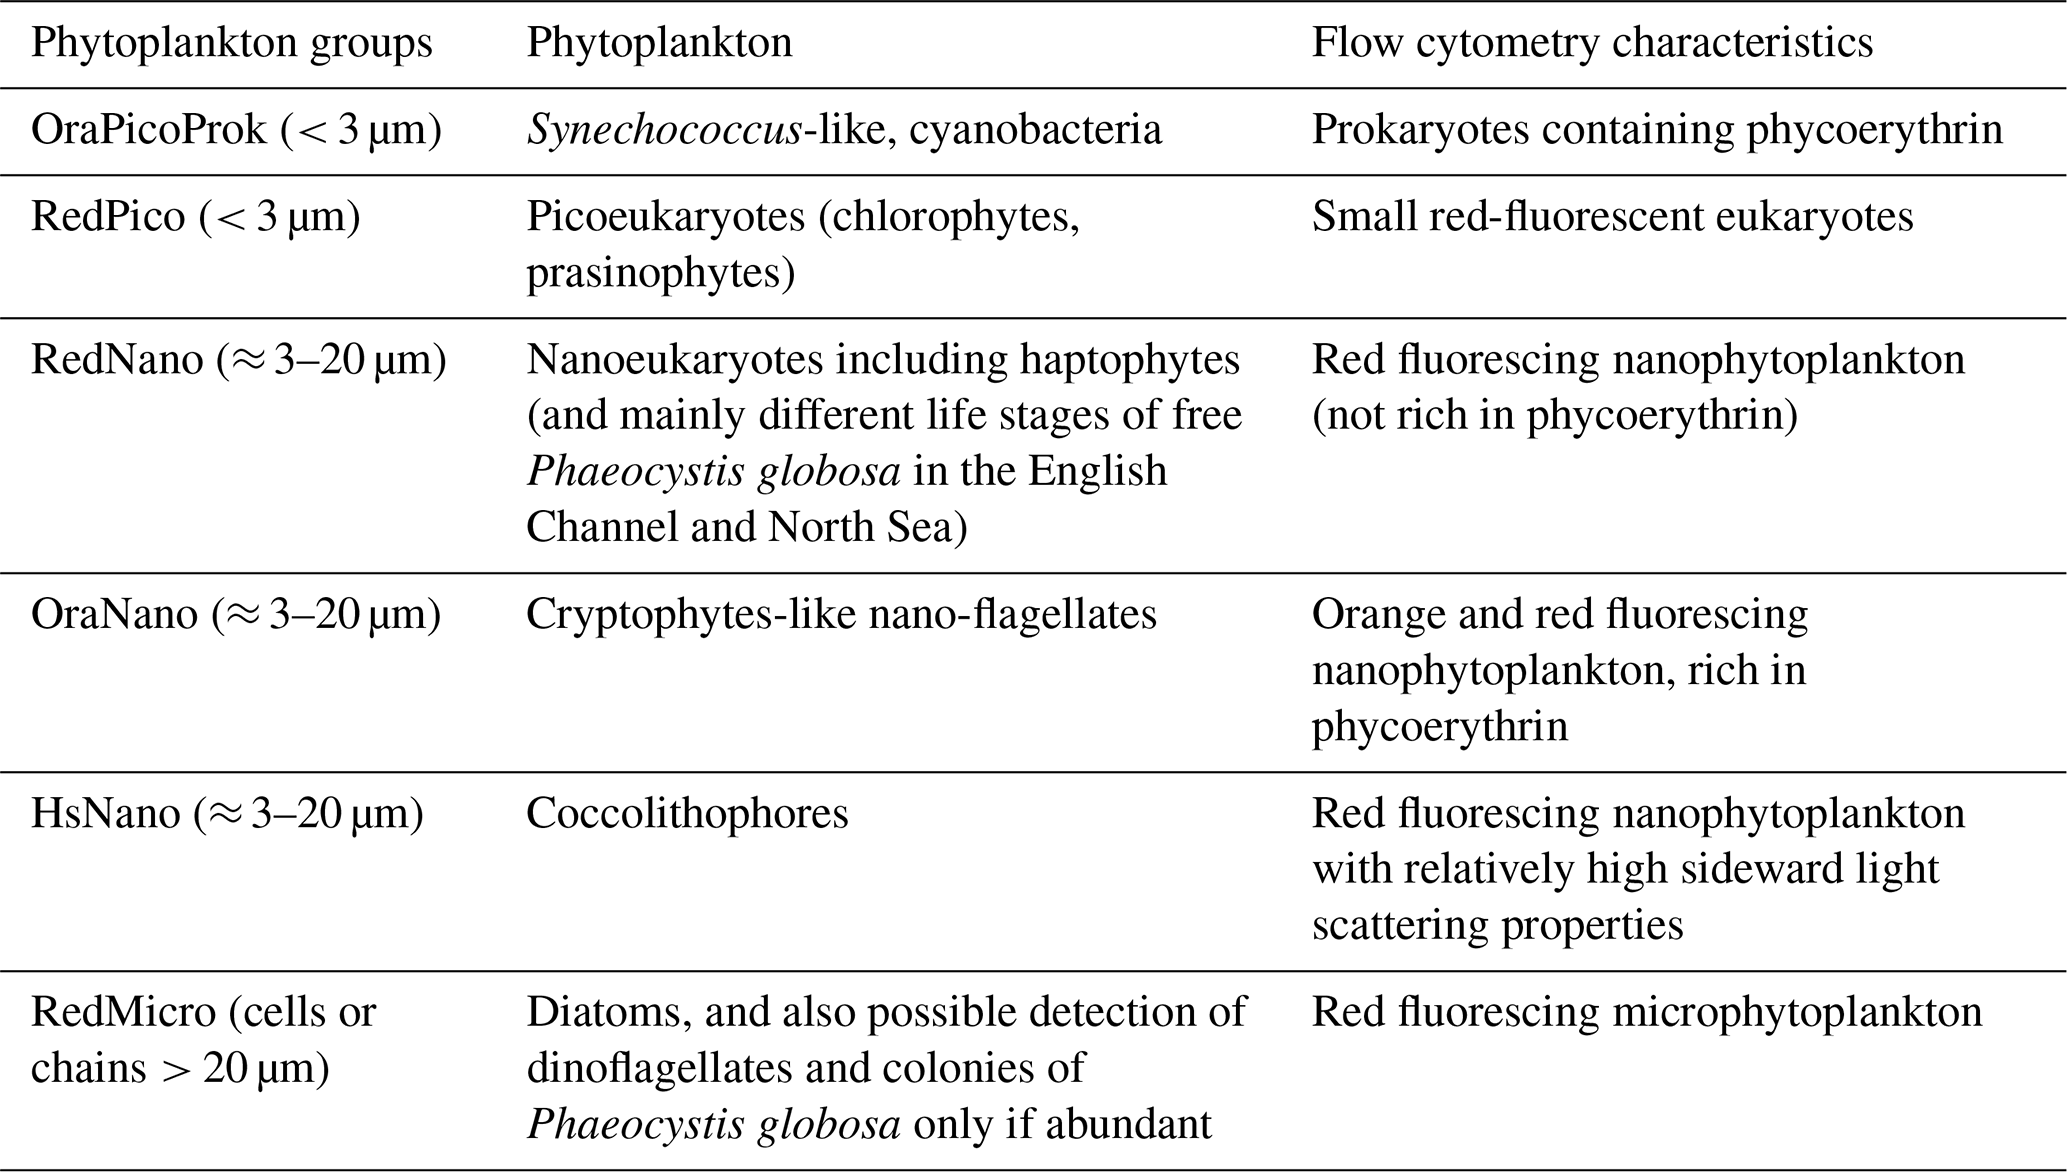
The DYPHYRAD dataset (Hubert et al., 2025b) comprises 1835 samples collected over 268 dates during a 10-year survey (2012–2022, Table 1). Single-cell optical analyses were conducted using pulse-shape recording flow cytometers (CytoSense and CytoSub, manufactured by CytoBuoy b.v., Woerden, the Netherlands), which are designed for high-resolution in vivo characterization of phytoplankton based on their optical properties. Four cytometers were used over the 11-year time series. These instruments count particles ranging from 0.1 to 800 µm in width, covering practically the entire phytoplankton size range. Technical specifications for each flow cytometer are detailed in previous studies (Hubert et al., 2026). Briefly, two protocols were employed: the “Pico” protocol used low detection thresholds (10 mV red fluorescence), low pump speed (5 µL s−1), and short sampling time (5 min) to target 0.1–3 µm cells with low fluorescence and high abundance. The second protocol targeted nanophytoplankton and microphytoplankton using higher detection thresholds (25 mV red fluorescence), high pump speed (1013 µL s−1), and longer sampling time (8–10 min). The flow cytometers are equipped with a blue laser (488 nm, 50 mW) to allow discrimination between phototrophic and non-phototrophic particles. Cytogram analysis (biplots combining scatter and fluorescence data, Hubert et al., 2025a) was performed using CytoClus 4 software (CytoBuoy b.v., the Netherlands). Five phytoplankton functional groups (PFGs) were manually discriminated and characterized based on their size distribution, structural complexity and fluorescence signals (Table 2). PHYTOBS microscopy data (https://www.phytobs.fr/en, last access: 7 September 2026) were used only to check for the species related to the observed phytoplankton blooms, while SOMLIT data (https://www.somlit.fr/, last access: 7 September 2026) provided complementary measures of temperature, salinity, nutrients (DIN, DIP and DiSi), Chl-a and flow cytometry counts of nanophytoplankton and picophytoplankton for comparison with the DYPHYRAD transect (see Fig. 1 for the locations). All samples from both networks were collected at the subsurface (1–2 m) at a bimonthly frequency. SOMLIT datasets were used solely to construct the climatologies of nutrients, salinity, temperature, and Chl-a for the study area. Chl-a was the only variable for which SOMLIT and DYPHYRAD datasets also contributed to the statistical analyses.
Table 2Flow cytometry phytoplankton groups in the DYPHYRAD transect (from Hubert et al., 2026).
2.3 Storm event identification and characterization
Storm events in this study were identified as periods when wind speeds exceeded the 90th percentile (11.3 m s−1), calculated from a 25-year reference period (1 January 2000 to 30 June 2025). Storm length was identified as the ±3 day period surrounding the peak wind speed day, with day 3 designated as the storm day. Storm events were characterized using hourly measurements of wind speed, wind direction, and precipitation from the Météo-France Boulogne-sur-Mer station (50.73° N, 1.59° E; https://meteo.data.gouv.fr/, last access: 7 September 2026), located 8 km from the DYPHYRAD transect, for the period 2012–2022.
Storms were selected for analysis when phytoplankton abundance and environmental data were available for at least 10 d prior to the storm day and for 14 d following the peak storm event. Wind observations include both wind speed and direction. Wind observations were used to evaluate the wind stress at the sea surface (τ, N m−2) computed as (Wu, 1982):
where ρair is the air density (assumed here as ρair=1.225 kg m−3) and the drag coefficient Cd was assumed to depend on the wind speed as:
The wind stress was derived from wind speed using a ±3 day window around each peak date. This approach allowed us to classify periods of low versus high wind forcing, which in turn served as an indicator of water column stability and the likelihood of wind-induced mixing.
Daily freshwater inflows were obtained from river inflow data for the Slack and Wimereux rivers, which border the transect (Fig. 1) (https://www.eaufrance.fr/, last access: 7 September 2026). River flow rates were used as indicators of riverine inputs from the respective watershed areas. For the analysis, we used the combined inflow from both rivers to estimate the mean freshwater input during a storm event. In the study area, river plumes are transported under the influence of prevailing south-westerly winds (Brylinski et al., 1991, 1996). Because of their proximity to the transect, the Wimereux Estuary and the River Slack were used as indicators of local riverine influence on water chemistry. Although the Slack lies north of the transect, strong tidal mixing, wind reversals and the NE–SW ebb-directed tidal flow (Brylinski et al., 1991) can transport its freshwater signal into the study area. Total accumulated precipitation (mm) and mean river inflow (m3 s−1) were calculated over the ±3 d storm period. Thresholds for total precipitation and mean river flow were derived from the combined June–July distribution across the 25-year period, with the 80th percentiles used to define “High” and “Low” classes as indicators of storm impact.
2.4 Chl-a analysis and June–July baseline phytoplankton distribution
Whisker plots were constructed to evaluate post-storm changes in Chl-a and to examine variability in Chl-a relative to the average river inflow associated with each storm. Due to the limited temporal coverage of Chl-a measurements in the DYPHYRAD dataset, Chl-a data from all available stations were used. Seasonal climatologies of phytoplankton abundances were derived from DYPHYRAD data. To assess the impact of storm events on phytoplankton abundances, we calculated the empirical complementary cumulative distribution function (CCDF, Helton, 1997), which represents the probability of observing abundance greater than or equal to a particular abundance level. In order to focus on all values, from medium to extremes, the CCDF were displayed in log-log plots to emphasize extreme events. For each phytoplankton group, the CCDF (P(X ≥ x)) was constructed from June–July observations from the DYPHYRAD dataset, providing a baseline distribution:
where FX(x) is the cumulative distribution function of a phytoplankton abundances X and x denotes a specific abundance threshold (i.e., an observed value of phytoplankton abundance).
Shaded percentile bands (50 %–90 %) were used to represent the expected June–July baseline variability, and values exceeding the 90th percentile were interpreted as extreme abundances. The pre-storm window was limited to 10 d to ensure at least one available observation per station given the weekly sampling frequency, whereas the post-storm window was extended to 14 d to capture the propagation of storm-driven freshwater and nutrient inputs into the Strait of Dover. Phytoplankton abundances from the pre-storm and post-storm periods were compared with this baseline to determine whether post-storm conditions remained within, or exceeded, the typical seasonal range. This non-parametric approach avoids assumptions about underlying distributions and is particularly suitable in this context, as phytoplankton abundances are not normally distributed (Derot et al., 2015). It also allows for a direct comparison of pre- and post-storm conditions relative to the seasonal climatology. Post-storm abundances were further examined using a distribution-wide Anderson–Darling (AD) test and a tail-exceedance test.
3.1 Storm duration, precipitation and river flow rate
Based on the availability of flow cytometry data, 10 storms were retained for analysis, each showing distinct patterns in wind stress, precipitation, and river inflow. Storm-associated wind stress varied considerably among events (Fig. 2). Most storms were characterized by sustained windy conditions, with median and interquartile range (IQR) values close to 0.1 N m−2, whereas others were weaker, marked only by short bursts of strong winds (20 June 2016, 6 June 2020, 6 June 2022). The consistently windy storms included 22 June 2012, 12 July 2012, 15 June 2013, 2 June 2015, 13 July 2015, 2 July 2016, and 27 July 2020 (Fig. 2; Table 3). Wind speeds above 8 m s−1 generated wind stress exceeding 0.1 N m−2 (Fig. 2), reaching more than 0.2 N m−2 during extreme winds (> 11.3 m s−1). The storm event on 2 July 2016 exhibited the longest duration of winds above 8 m s−1 (86 h; Fig. A1 in Appendix A) and the strongest wind-stress forcing (mean = 0.12; SD = 0.09 N m−2; Fig. 2). Across all events, wind speeds exceeding 8 m s−1 originated predominantly from south-westerly directions (Fig. A2 in Appendix A).
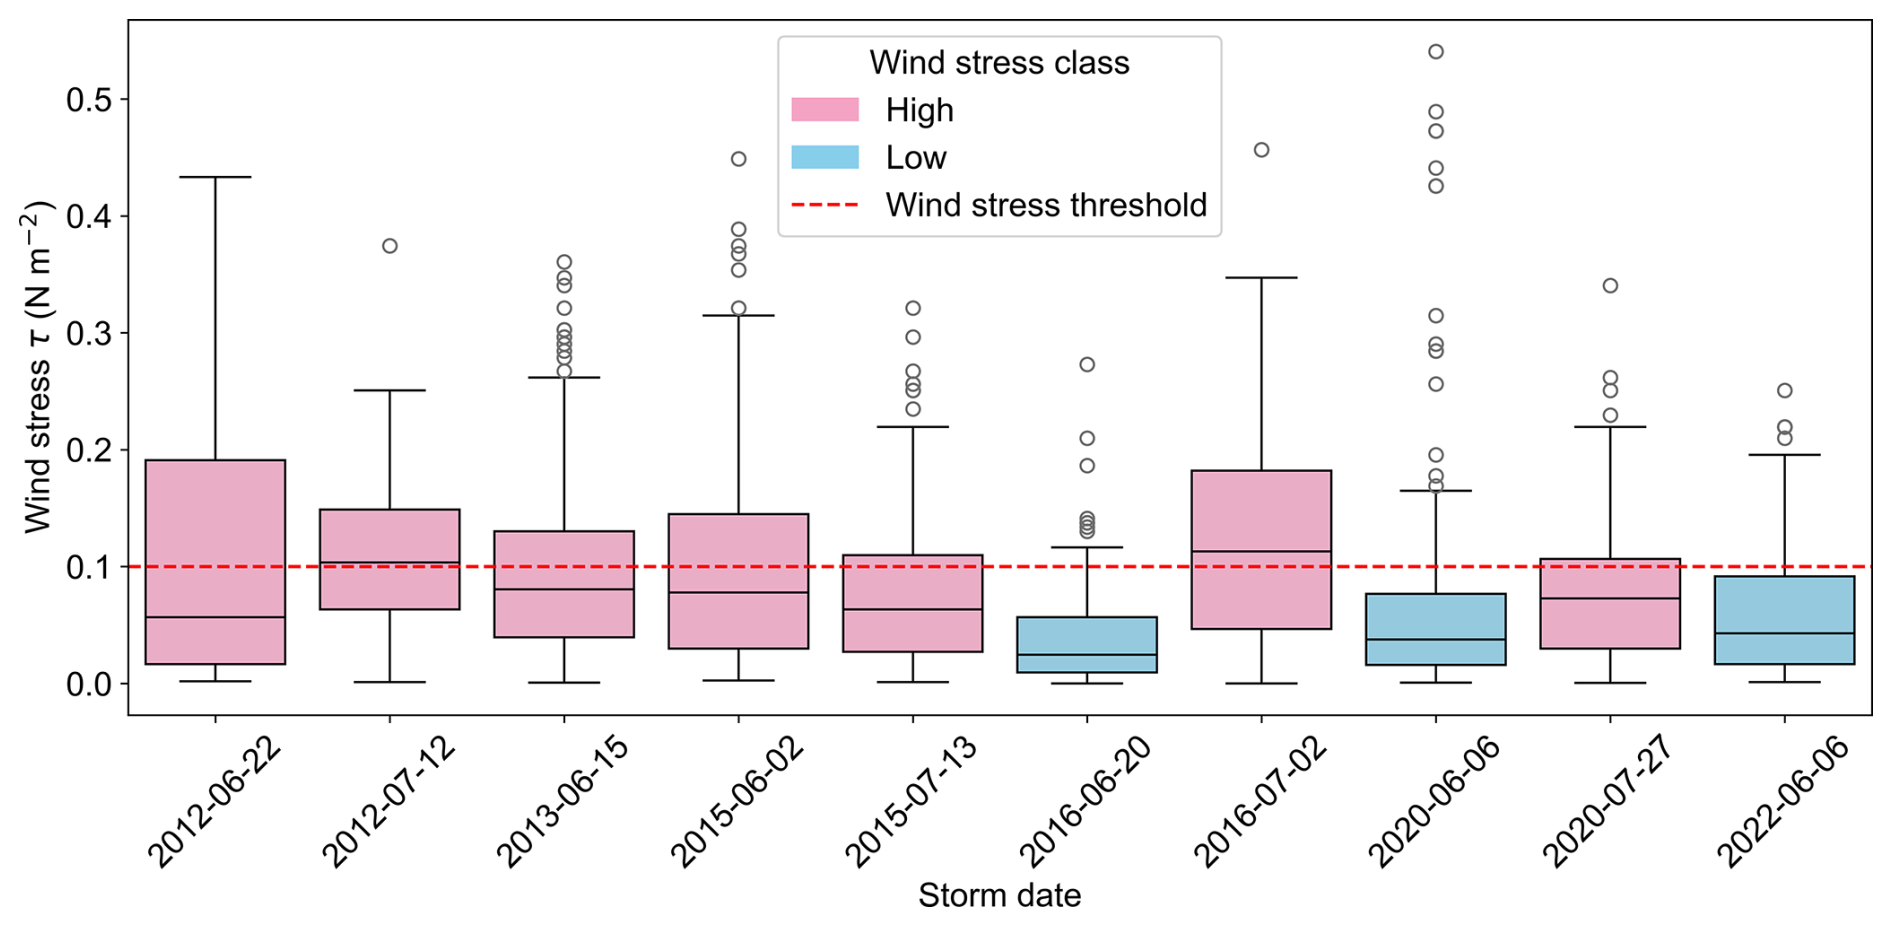
Figure 2Boxplots of wind stress (τ; N m−2) distributions across the 10 storms, derived from wind speed measurements over ±3 d around each event at Boulogne-sur-Mer (Météo-France station). The red dashed line marks the wind-stress threshold (0.1 N m−2). Storms were classified as high (pink) or low (blue) wind stress. “High” storms are those for which the upper quartile (Q3) exceeded the set wind stress threshold of 0.1 N m−2 (dashed line).
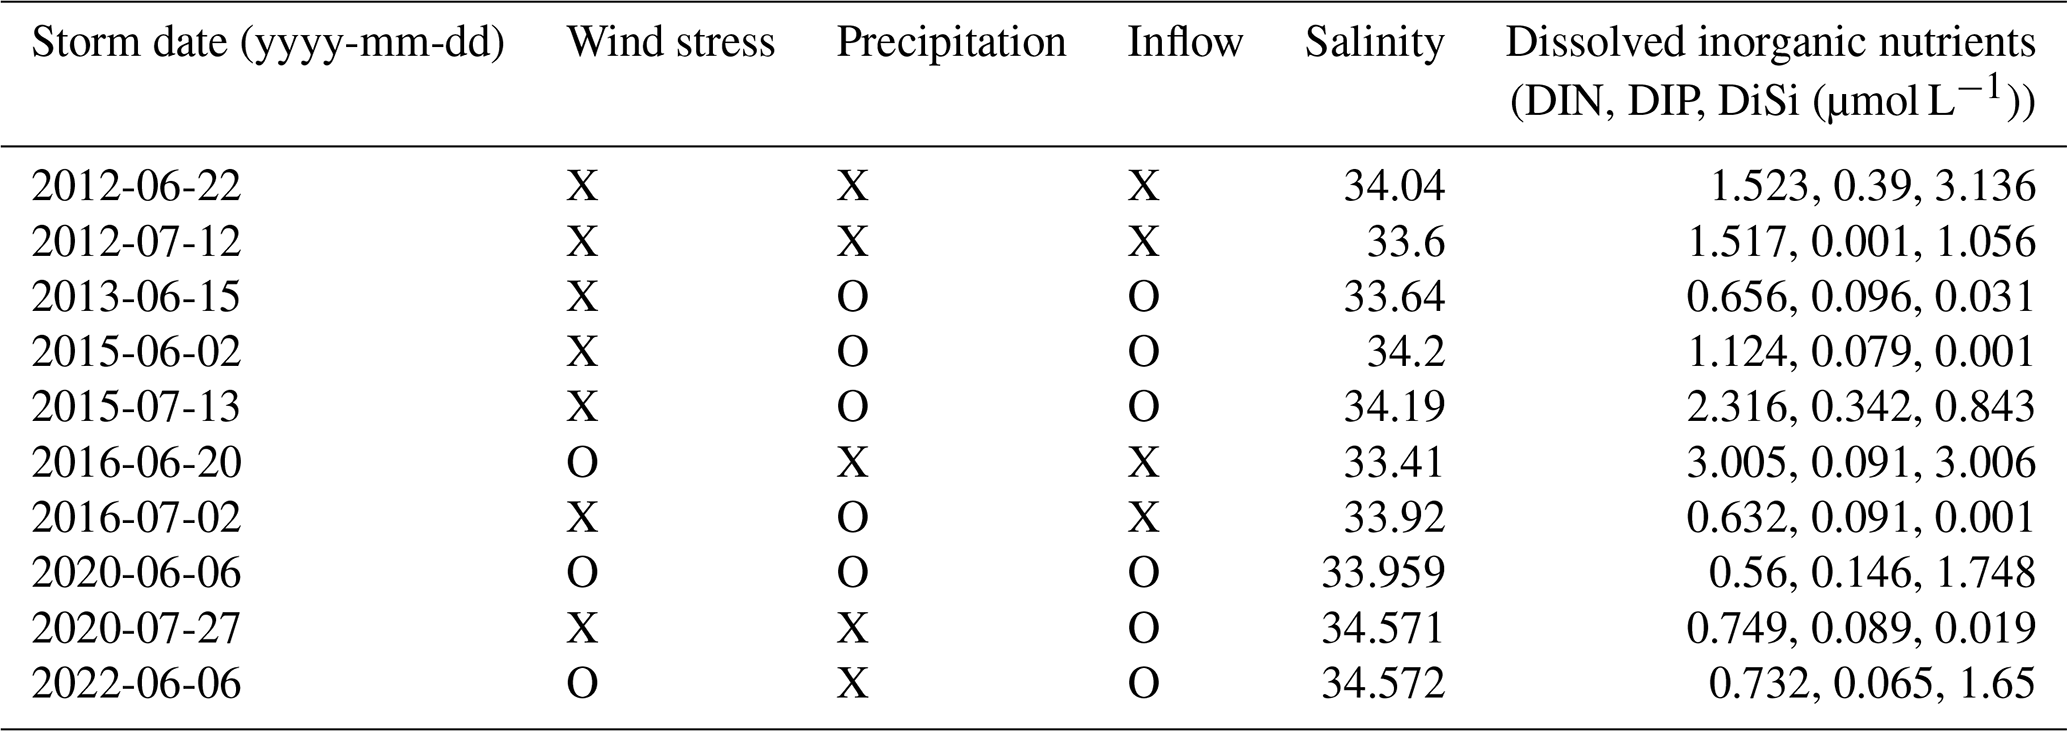
Table 3Overview of selected storm events. Wind stress, precipitation and inflow are classified as High (X) or Low (O). High wind stress events correspond to those for which the event-specific upper quartile (Q3) exceeds 0.1 N m−2 (see Fig. 2). High precipitation and high inflow events are defined as those exceeding the 80th percentile thresholds (16.12 mm and 0.45 m3 s−1, respectively; see Fig. 3a, b). Salinity and nutrients represent the lowest and highest values, respectively, available in our dataset during the post-storm period.
Precipitation amounts ranged from 1 mm (13 July 2015) to 32.20 mm (20 June 2016) over the ±3 d window surrounding each storm (Fig. 3a). High precipitation and high inflow were defined using the 80th percentile of their respective June–July distributions, corresponding to thresholds of 16.12 mm and 0.45 m3 s−1 (Fig. B1 in Appendix B). In most cases, precipitation amounts corresponded with flow rates, with high precipitation events typically producing high inflows (Fig. 3b). Exceptions included the 27 July 2020 and 6 June 2022 storms, where this relationship did not hold. Similarly, the 2 July 2016 storm showed low precipitation at Boulogne-sur-Mer but was associated with elevated inflows (Fig. 3b). Across all events, inflow ranged from a minimum of 0.18 m3 s−1 (13 July 2015) to a maximum of 1.98 m3 s−1 (20 June 2016).
River inflow strongly influenced environmental variables (Fig. C1a–f in Appendix C). Salinity decreased below the climatological mean of 34.42 during “High” inflow storms (Fig. C1b in Appendix C). Events in 2012, 2013, and 2016 were associated with elevated inflows and a corresponding reduction in salinity (33.4–34.0; Table 3). The highest inflow rate (1.976 m3 s−1 on 20 June 2016) corresponded to the lowest observed salinity (33.4). In contrast, storms with “Low” inflow (2 June 2015, 13 July 2015, 27 July 2020, 6 June 2022) had little effect on salinity (post-storm salinity > 34.0), and in the case of 6 June 2022 salinity (34.572) did not fall below the climatological mean (Table 3). Elevated inflow events were also linked to substantial increases in nutrient concentrations. Because pre-storm nutrient samples were limited (1 sample per station within the 10 d pre-storm window) and did not consistently capture conditions immediately before each event, we used climatological means as the reference baseline (Fig. C1d–f in Appendix C). Summer nutrient concentrations were typically low, while post-storm concentrations exceeding these baselines therefore indicated anomalous nutrient inputs. For example, the 20 June 2016 storm exhibited DIN and DiSi concentrations of 3.0 µmol L−1, while the 22 June 2012 event, characterized by strong winds and relatively high inflow, yielded DIN concentrations of 1.52 µmol L−1, DIP concentrations of 0.39 µmol L−1, and DiSi concentrations of 3.136 µmol L−1 (Table 3). However, due to the relatively low sampling frequency, some storm-related changes in salinity and nutrient concentrations (e.g., from mixing or riverine supply) may not have been captured, as in the cases of 2 July 2016 and 15 June 2013.
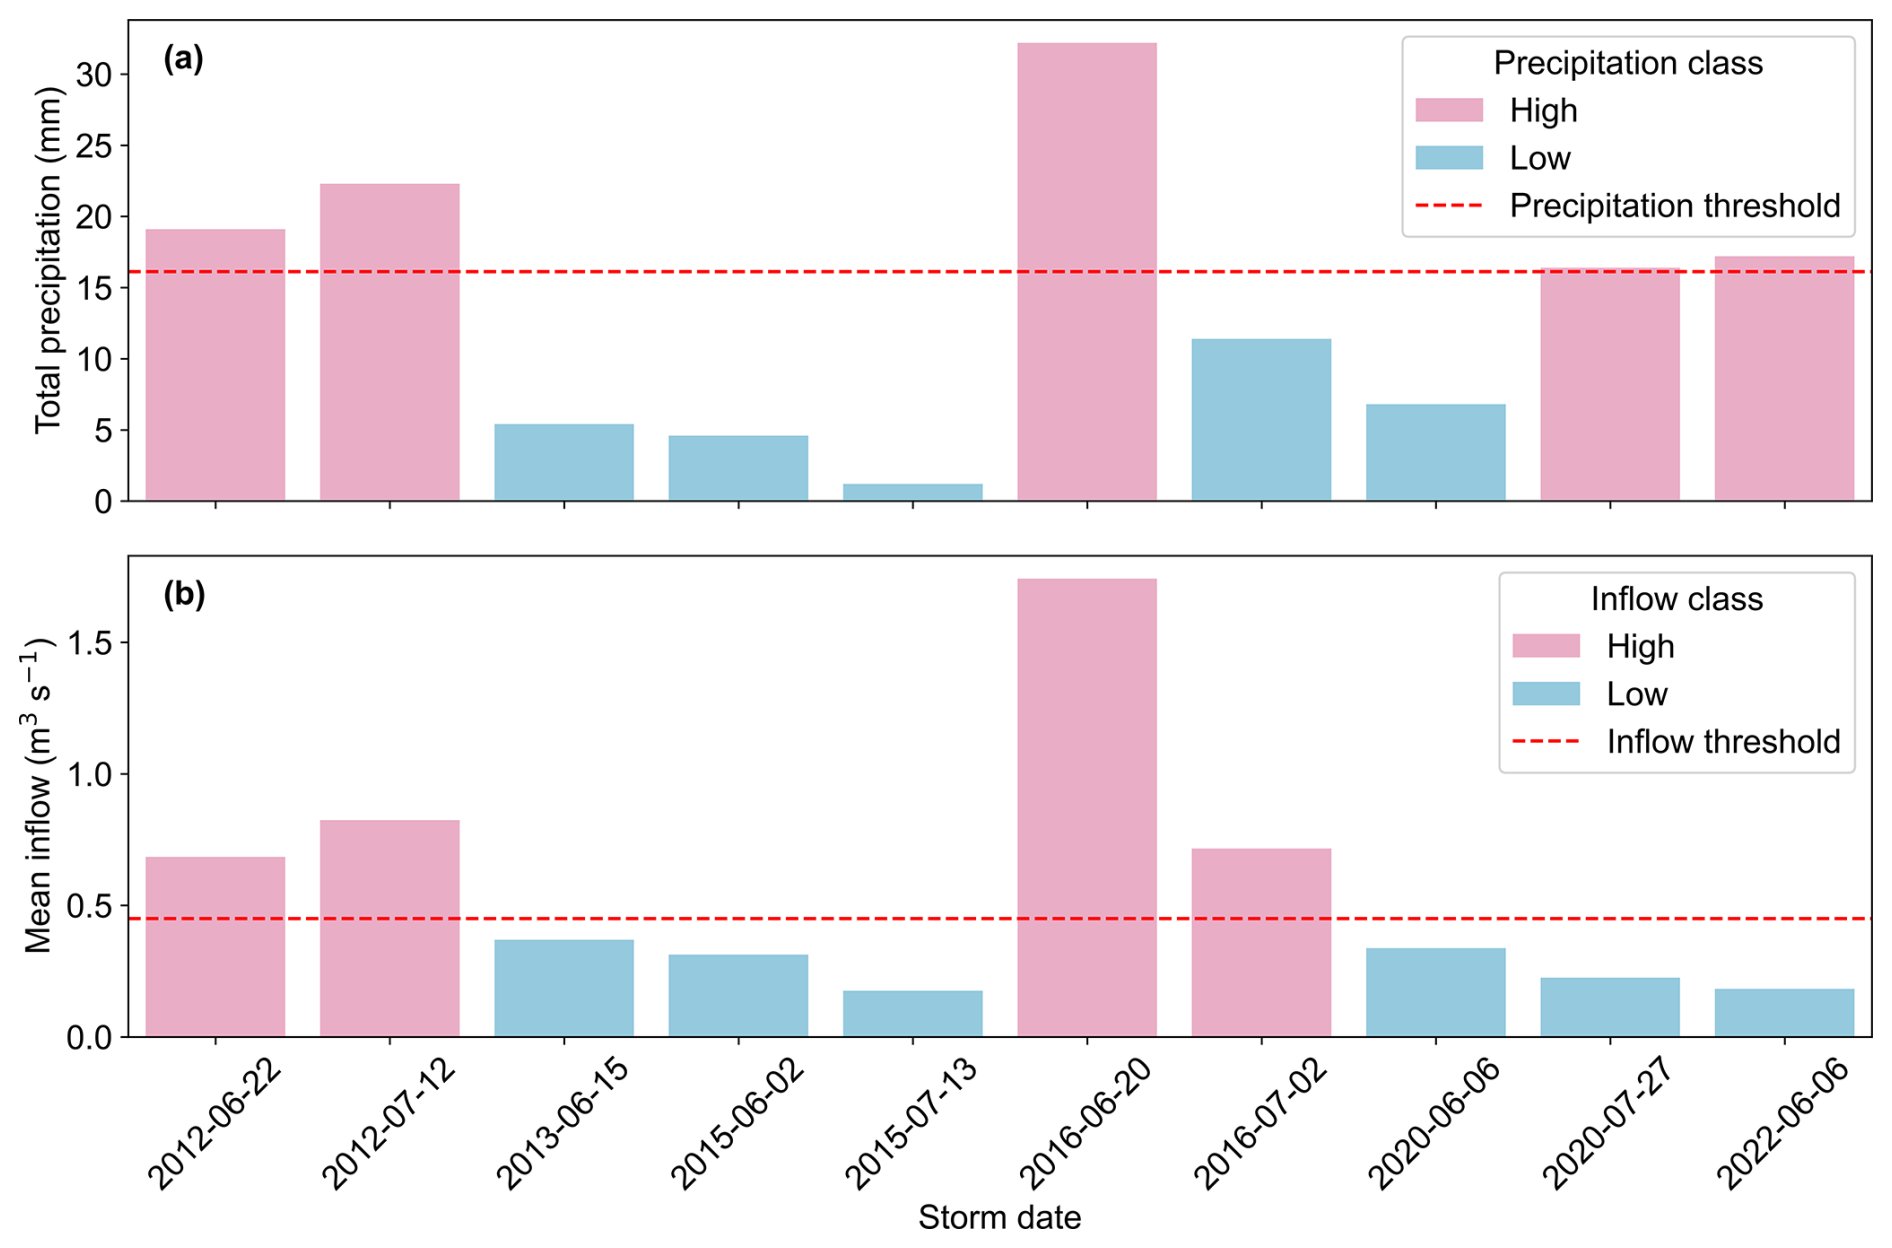
Figure 3(a) Total precipitation (mm) over ±3 d at Boulogne-sur-Mer (Météo-France station) and mean river inflow (m3 s−1) (b) from the Slack and Wimereux rivers for 10 storms, averaged over ±3 d around each storm. Precipitation and inflow classes (“High” and “Low”) were defined based on the 80th percentile of their respective June–July distributions. The corresponding threshold values are 16.12 mm for precipitation and 0.45 m3 s−1 for inflow. Pink bars denote “High” class and blue bars denote “Low” class in both panels.
Interannual variability in the number of windy days (days with wind speed > 8 m s−1; at least 10 d per month) and average river inflow (m3 s−1) from the Slack and Wimereux rivers during June and July near the DYPHYRAD transect was analyzed to characterize weather patterns (Fig. 4). Pronounced interannual variability was observed in June–July wind speeds and river inflows. Years with high inflows (2012, 2013, 2016, 2021) exhibited June–July mean inflow above 0.35 m3 s−1 (Fig. 4) and included storms such as 22 June 2012, 12 July 2012, 15 June 2013, 20 June 2016, and 2 July 2016. In contrast, periods with low monthly inflows (2014, 2015, 2017, June 2018, July 2019, 2020, 2022; Fig. 4) encompassed storms such as 2 June 2015, 13 July 2015, 27 July 2020, and 6 June 2022. Some years were characterised by notably windy conditions (days with wind speeds > 8 m s−1; at least 10 d per month) despite low inflows, including July 2014, 2015, July 2017, July 2020, and June 2022. June–July months in 2015 and July 2020 all experienced more than 24 windy days above 8 m s−1, coupled with June–July average river flow below 0.35 m3 s−1 (Fig. 4). Thus, storm impacts arose either from high inflows, from strong winds alone, or from low inflows combined with short windy events (e.g., 6 June 2022). Storms were classified as consecutive when they occurred shortly after a preceding or following storm, such that the effects of the consecutive storms could have persisted. For example, the 2 July 2016 storm followed the 20 June 2016 event, suggesting that storm-driven changes in the marine environment may have been sustained between them. A similar sequence occurred in 2012, when the 12 July 2012 storm followed the 22 June 2012 event.
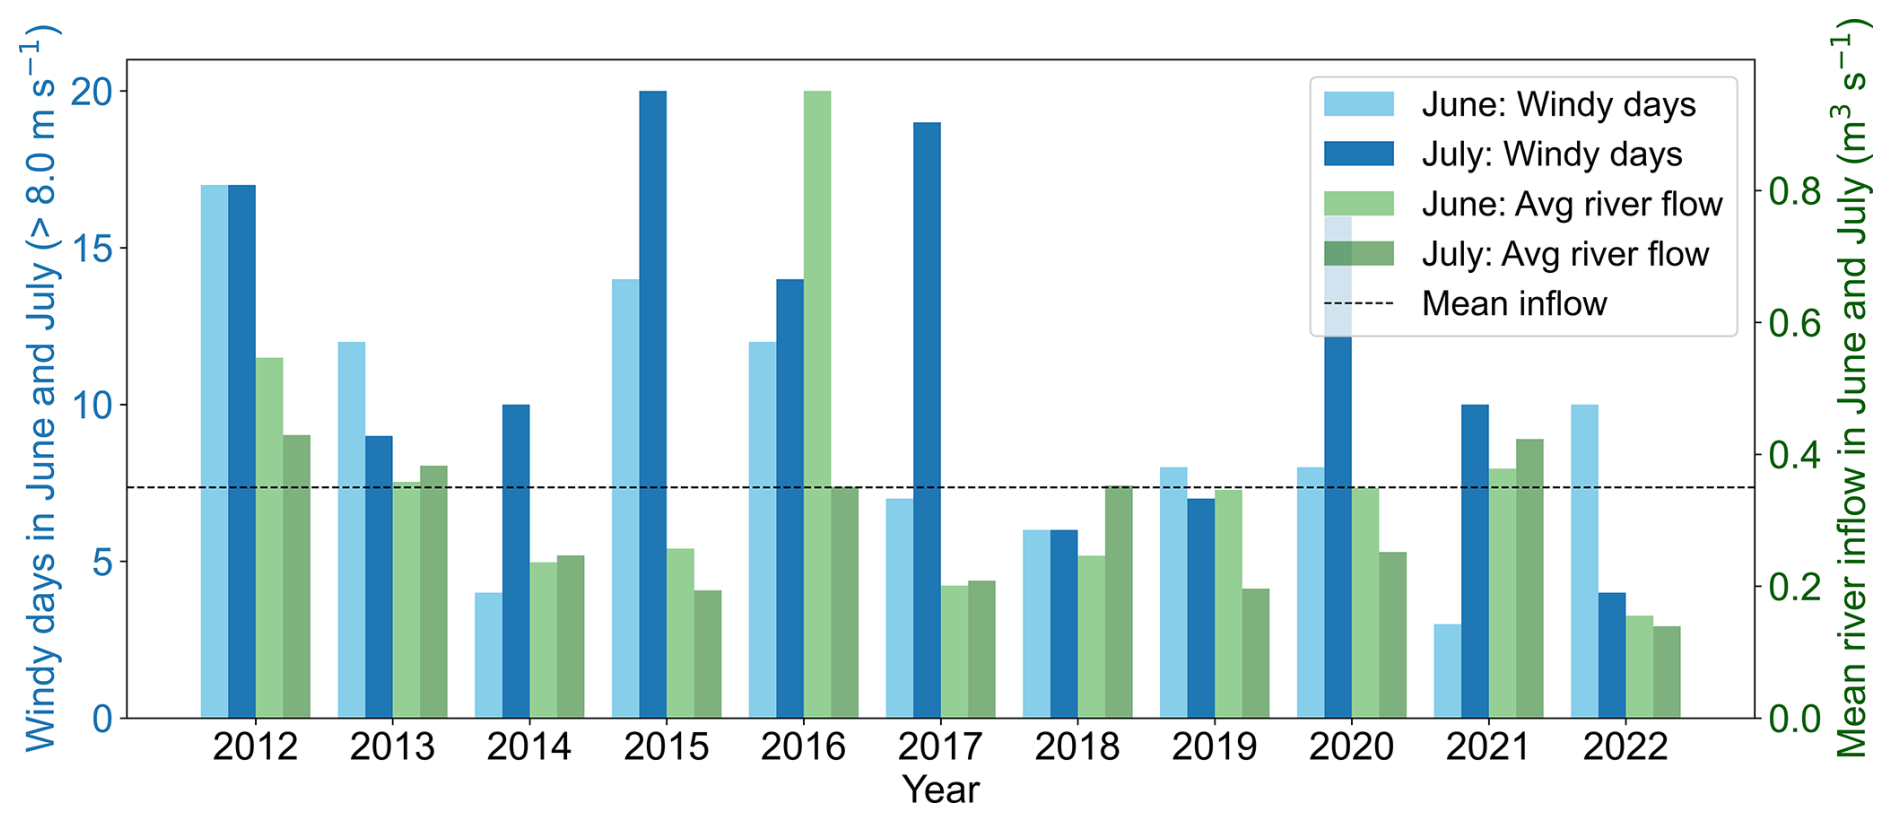
Figure 4Number of windy days (wind speed > 8 m s−1) at Boulogne-sur-Mer (Météo-France station) and average river flow (m3 s−1) from the Slack and Wimereux rivers during June and July (2012–2022). The dashed line indicates the mean June–July inflow of 0.35 m3 s−1. The blue bars indicate the number of days with wind speed > 8 m s−1 during June–July and the green bars indicate mean June–July inflow.
3.2 Exploring summer storm impact on Chl-a and phytoplankton communities
Storms were characterized by the biological response of Chl-a assessed through their pre- and post-storm distributions. Pre-storm mean Chl-a concentrations increased following nearly all storm events, except for those on 15 June 2013 and 13 July 2015 (Fig. 5). In high inflow storms (depicted in pink, Fig. 5), post-storm mean increases persisted above the June–July climatological mean of 3.20 µg L−1. The consecutive storm events of 2012 resulted in up to a 4-fold increase in Chl-a concentrations, whereas the consecutive events of 2016 maintained concentrations above the 3.20 µg L−1. A similar persistence of elevated Chl-a was observed following the 15 June 2013 storm, despite the relatively low inflow (depicted in blue, Fig. 5) of 0.35 m3 s−1. A subsequent event on 22 June 2013, with a mean flow rate of 0.39 m3 s−1, occurred within the 14 d post-storm window and is therefore considered part of the same response as the 15 June 2013 storm. The remaining low inflow storms (depicted in blue, Fig. 5) did not elevate post-storm mean Chl-a concentrations above 3.20 µg L−1. Post-storm responses in Chl-a distribution were more closely aligned with river inflow than with precipitation, as illustrated by the 27 July 2020 and 6 June 2022 storms (Fig. 5; Fig. E1 in Appendix E).
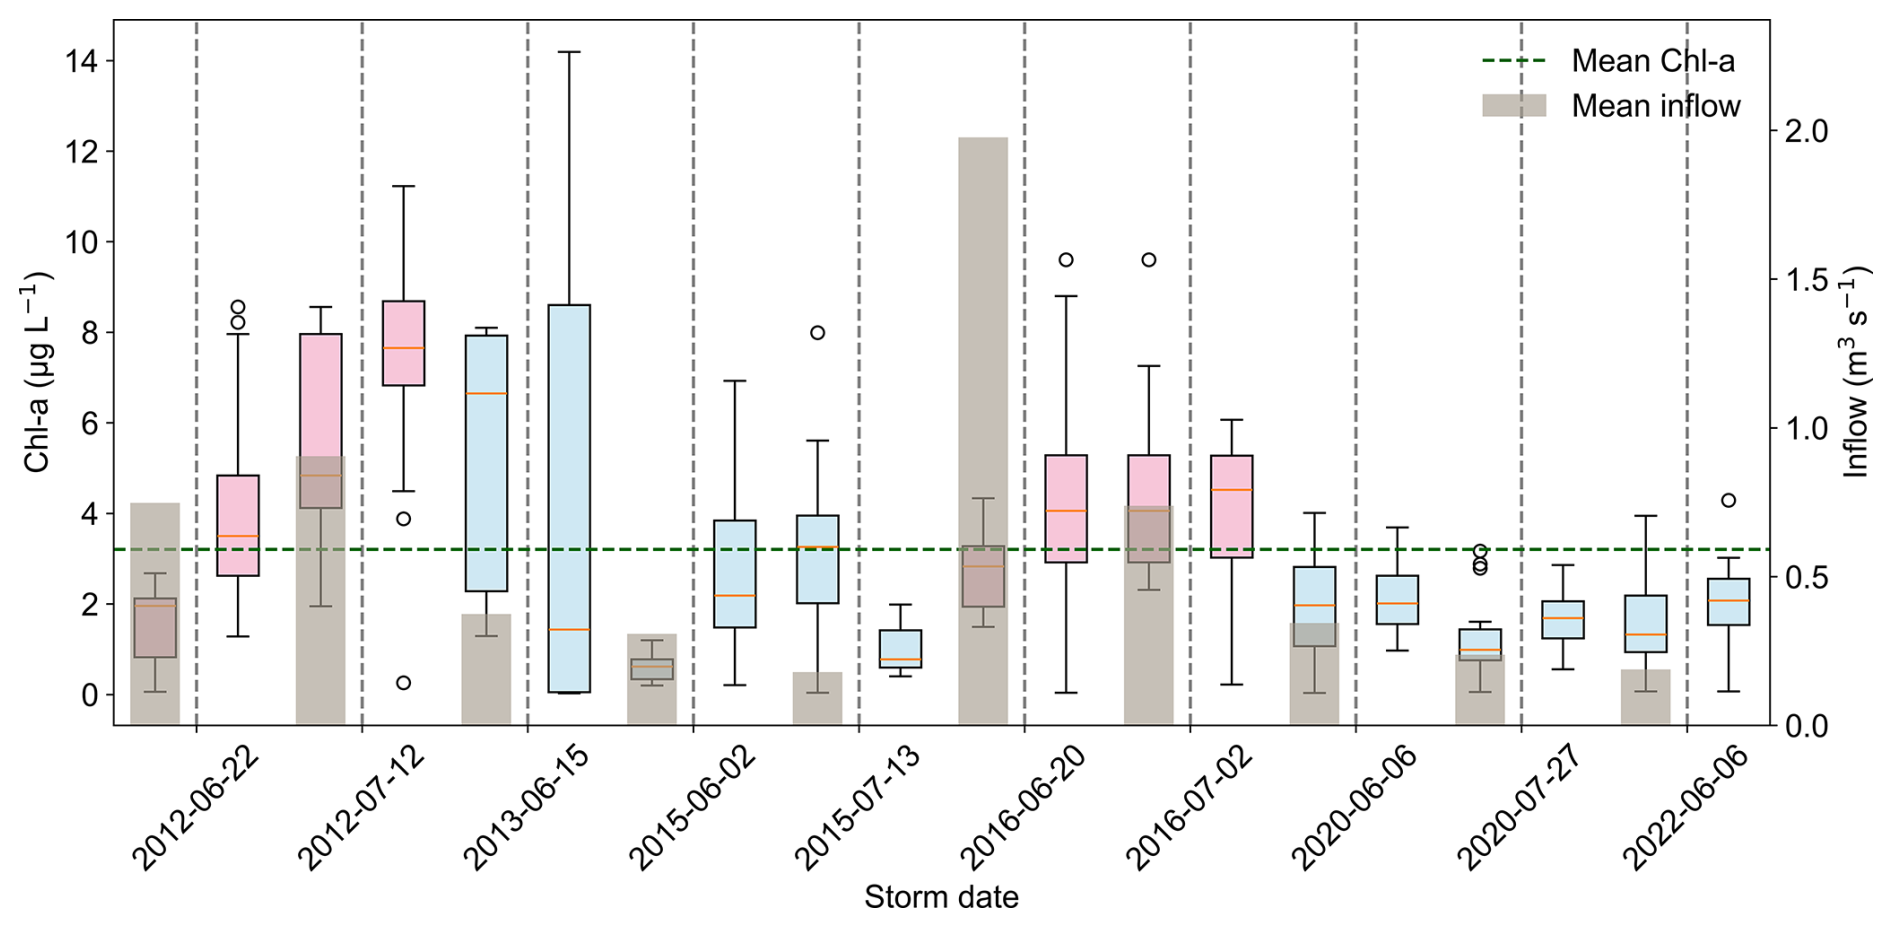
Figure 5Boxplots of pre- and post-storm Chl-a distributions (compiled from DYPHYRAD and SOMLIT) for the 10 storms. Vertical dashed lines indicate the day of each storm event. Pre-storm Chl-a distributions are shown together with mean inflow over a ±3 d storm period (grey bars). The green dashed line marks the June–July climatological mean of Chl-a concentration (3.20 µg L−1) in the EEC. Pink and blue colouring indicate “High” and “Low” inflow storms, respectively.
The 15 d climatology derived from weekly to biweekly data captured spatial and temporal variations in phytoplankton abundances within each month and revealed that distinct groups characterize different periods of the year (Fig. 6a–f). RedMicro (diatoms) reached abundances on the order of 105 cells L−1, increasing from late winter to late spring and declining during summer (Fig. 6a). A sharp increase in RedNano (107 cells L−1) from late March to early May reflected the recurring Phaeocystis globosa blooms in EEC waters (Fig. 6b). After spring, RedNano abundances were sustained at ∼ 106 cells L−1. Other nanophytoplankton groups showed distinct seasonal peaks: HsNano (coccolithophorids) in summer and autumn (Fig. 6c), and OraNano (cryptophytes), which increased steeply from June through autumn, reaching ∼ 105 cells L−1 (Fig. 6d). During summer, the phytoplankton community was dominated by picophytoplankton, with abundances on the order of 107 cells L−1 (Fig. 6e–f), including OraPicoProk (Synechococcus) and RedPico (picoeukaryotes). The climatology also revealed high standard errors in diatom, picophytoplankton, and cryptophyte abundances, indicating greater variability during June–July. Spatially, RedMicro were more abundant in coastal waters (Fig. 6a), whereas Synechococcus dominated offshore waters (Fig. 6e).
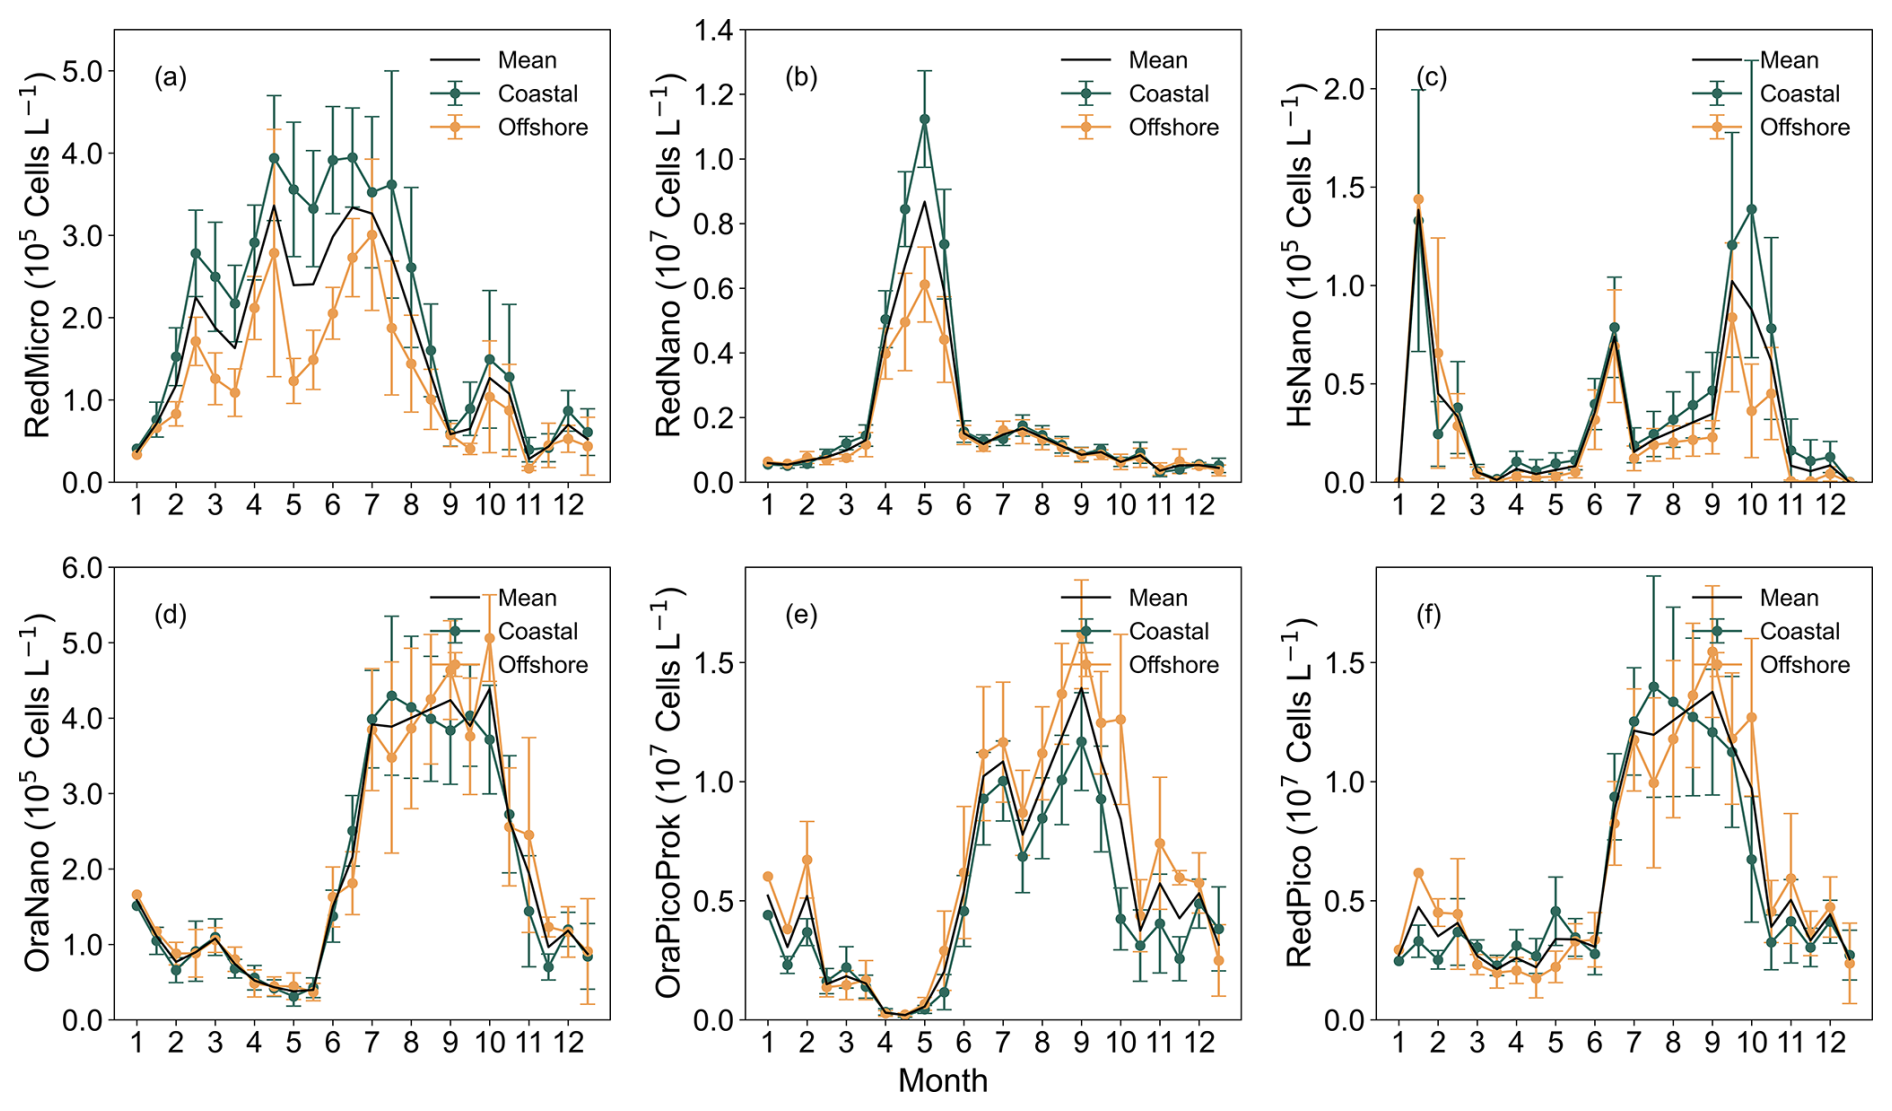
Figure 6Climatological means and standard errors of phytoplankton abundances in the Coastal (R0–R2) and Offshore (R2′–R4) regions along the DYPHRAD transect, based on 15 d means from February 2012 to December 2022. The black line represents the mean value across all stations. (a) RedMicro (diatoms), (b) RedNano (nanoeukaryotes), (c) HsNano (coccolithophorids), (d) OraNano (cryptophytes), (e) OraPicoProk (Synechococcus), and (f) RedPico (picoeukaryotes), respectively (see also Table 2).
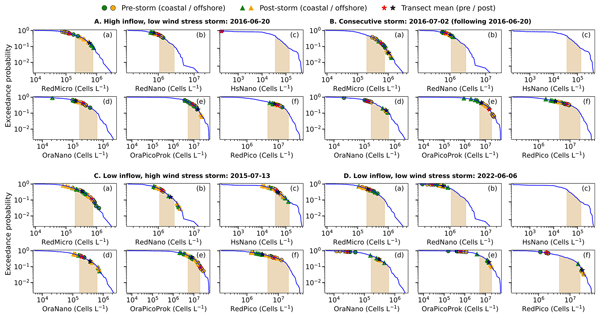
An empirical complementary cumulative distribution function (CCDF) was applied to detect shifts in phytoplankton abundances by quantifying the probability of blooms exceeding climatological ranges (Fig. 7A–D). Four storm types were considered. The first type was characterized by high inflow with low wind stress, exemplified by the storm of 20 June 2016, which was the rainiest and had the highest inflow, while showing the least impact of wind. The second type consisted of consecutive storms, with the storm of 2 July 2016 occurring immediately after the previous storm on 20 June 2016. The third type was defined by low inflow with high wind stress, represented by the storm of 13 July 2015, which had the lowest precipitation and inflow but was marked by strong winds. The fourth type involved low inflow with low wind stress, illustrated by the short storm of 6 June 2022, which was classified as high in precipitation yet remained among the lowest in inflow and wind stress. The CCDFs of the remaining six storms are presented in the appendices with these storm characterizations (Figs. F1–F6 in Appendix F).
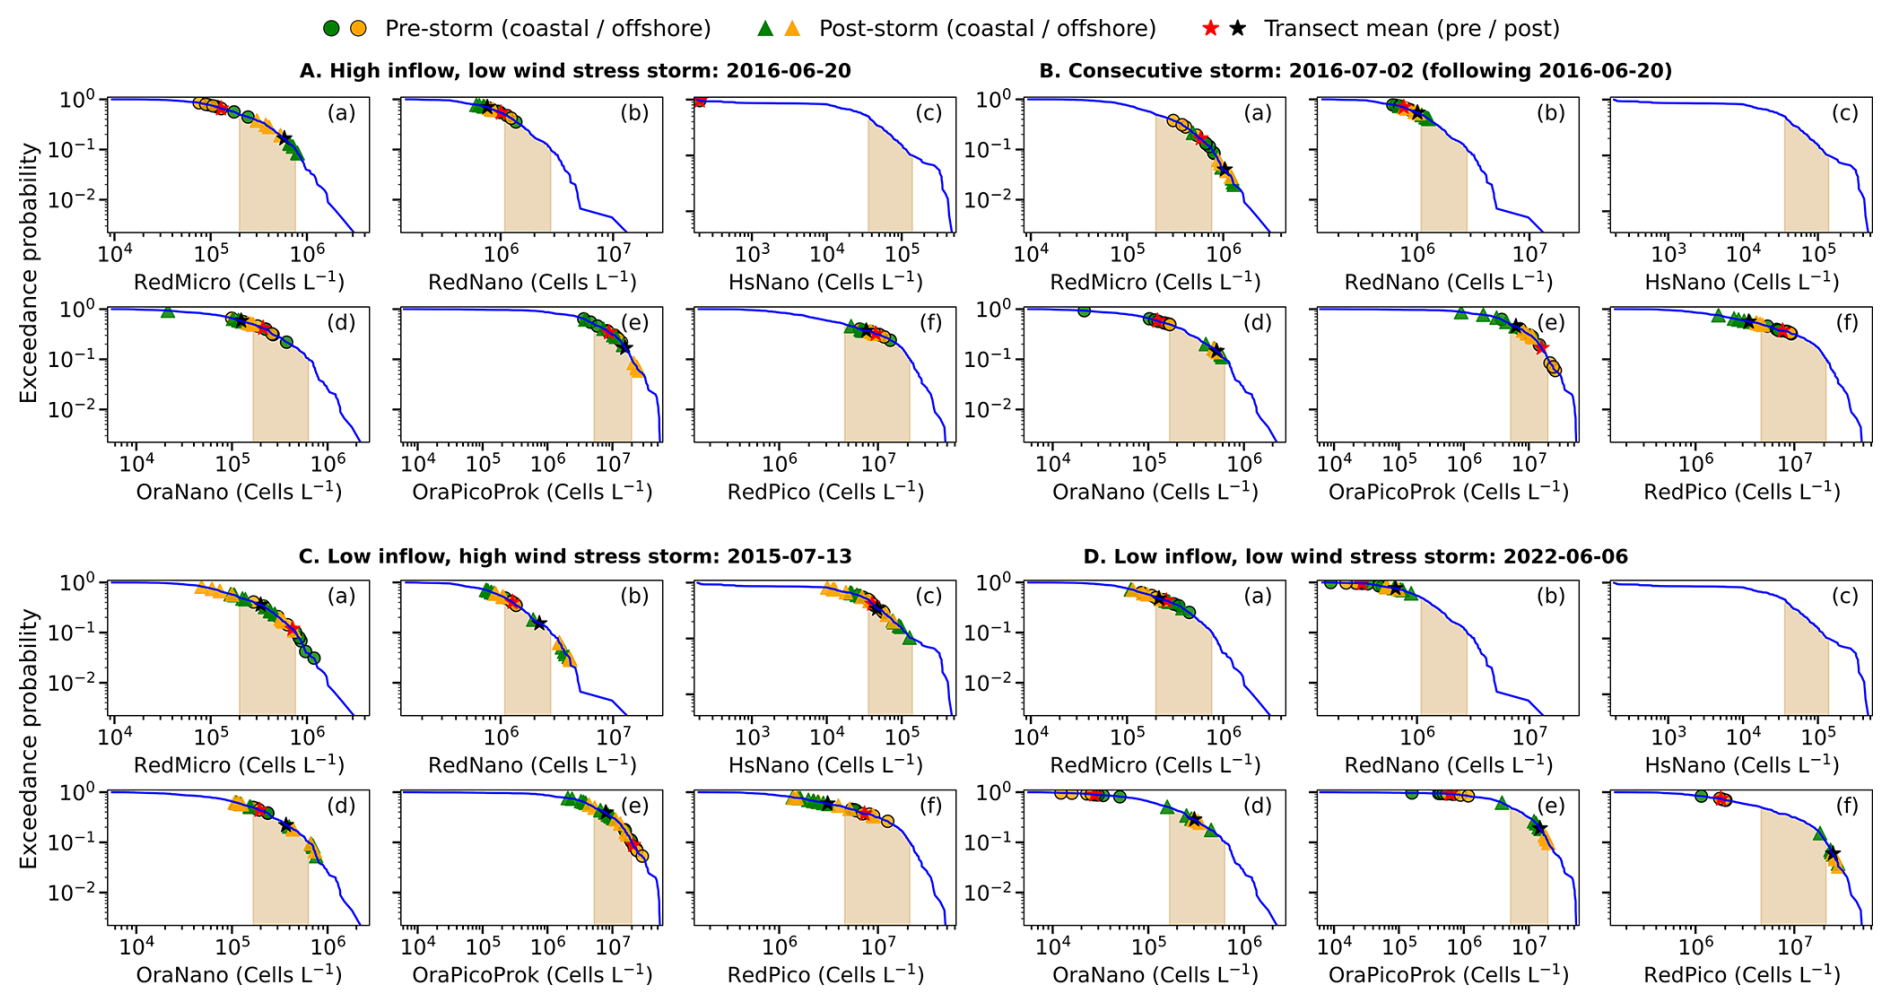
Figure 7Exceedance probability (CCDF) distributions of six phytoplankton groups (a–f) along the DYPHYRAD transect during selected storms. Panels show: (A) 20 June 2016, (B) 2 July 2016, (C) 13 July 2015, and (D) 6 June 2022. For each panel: RedMicro (diatoms), RedNano (nanoeukaryotes), HsNano (coccolithophorids), OraNano (cryptophytes), OraPicoProk (Synechococcus), and RedPico (picoeukaryotes) are presented. Blue lines represent June–July climatological distributions, with shaded areas indicating the 50th–90th percentiles. Pre-storm (−10 d) and post-storm (+14 d) observations are plotted as green (coastal) and orange (offshore) symbols: circles for pre-storm and triangles for post-storm abundances. Red and black stars indicate the transect mean abundances before and after the storm, respectively.
3.2.1 High inflow, low wind stress storm: 20 June 2016
The storm on 20 June 2016 had contrasting impacts across phytoplankton groups and locations. In coastal waters, diatoms responded most strongly, while offshore the dominant signal came from Synechococcus (Fig. 7A), mirroring broader summer seasonal patterns. This event was characterized by high inflow and high precipitation, with only short-lived wind stress, conditions that delivered substantial nutrient inputs to the coast. Across the DYPHYRAD transect, diatom abundances increased significantly from pre- to post-storm (AD test, p=0.001; Table G1 in Appendix G), with a 5-fold rise in the mean (Fig. 7Aa). At the stations closer to the coast R0–R1, diatom concentrations approached the 90th percentile, and the maximum post-storm abundance was 8.0 × 10⁵ cells L−1. Note that at PHYTOBS Boulogne on 23 June 2016, the diatom Leptocylindrus danicus reached 3.0 × 10⁶ cells L−1 (Table H1 in Appendix H), representing 90 % of the microphytoplankton assemblage, and was accompanied by a Chl-a concentration of 9.6 µg L−1. In contrast, nanoeukaryotes and cryptophytes declined well below their June–July climatological means (14 and 2.6 × 10⁵ cells L−1, Fig. 6b, d respectively), with the sharpest decreases observed at station R0–R1 closer to the coast (Fig. 7Ab–d). Picophytoplankton groups, however, showed a different pattern. Synechococcus abundances were more than 2-fold higher than the climatological mean (8.9 × 10⁶ cells L−1, Fig. 6e), reaching a post-storm mean of 1.6 × 10⁷ cells L−1 across the DYPHYRAD transect (Fig. 7Ae). Offshore stations (R2′–R4) exhibited the strongest response, with abundances exceeding the 90th percentile and peaking at 2.5 × 10⁷ cells L−1. Picoeukaryotes, by contrast, showed only a slight reduction, maintaining abundances close to their climatological levels (Fig. 7Af).
3.2.2 High inflow consecutive storm: 2016-07-02
The 2 July 2016 storm was the windiest event recorded in the analysis, arriving less than two weeks after the 20 June 2016 storm and forming a consecutive high inflow sequence. Before this storm, the phytoplankton community was characterized by high abundances of both diatoms and Synechococcus (Fig. 7A). This back-to-back pattern illustrates how successive storms can reinforce impacts, in this case triggering a pronounced shift toward diatom dominance in the community structure (Fig. 7B). Following the storm, diatoms surged dramatically across the DYPHYRAD transect (Fig. 7Ba), with post-storm abundances exceeding the 90th percentile (AD test, p=0.0013 and tail-exceedance test, ; Table G1 in Appendix G). Diatom abundances doubled relative to pre-storm levels, reaching a mean of 1.1 × 10⁶ cells L−1, with peaks of 1.3 × 10⁶ cells L−1 at coastal stations and 1.2 × 10⁶ cells L−1 offshore. At PHYTOBS Boulogne, the planktonic diatom Chaetoceros socialis reached 1.8 × 10⁶ cells L−1 on 4 July 2016 (Table H1 in Appendix H), accompanied by a Chl-a concentration of 7.26 µg L−1. This bloom marked a shift in dominance from Leptocylindrus danicus to Chaetoceros socialis. Other groups responded differently. Nanoeukaryotes showed only slight increases (Fig. 7Bb), while cryptophytes rose sharply with a more than a 4-fold increase at all stations. (Fig. 7Bd), with a post-storm mean of 5.2 × 10⁵ cells L−1. At SOMLIT L on 6 July 2016, cryptophyte abundance peaked at 1.3 × 10⁶ cells L−1 (Table H2 in Appendix H), indicating a pronounced offshore response. In contrast, Synechococcus declined markedly, with post-storm abundances reduced nearly 3-fold to a mean of 6.3 × 10⁶ cells L−1, particularly offshore (Fig. 7Be). Picoeukaryotes also decreased, maintaining abundances below pre-storm levels. Both Synechococcus and picoeukaryotes declined significantly relative to pre-storm conditions (AD tests, p=0.014 and tail-exceedance test, p=0.001, respectively; Table G1 in Appendix G).
Similar transient yet recurrent responses were observed across the summer years. Leptocylindrus danicus dominated June diatom blooms between 2016 and 2020, except in 2018 when Pseudo-nitzschia prevailed (∼ 106 cells L−1; Skouroliakou et al., 2024), contributing 90 % of total diatom abundance at PHYTOBS C. Comparable storm-driven diatom dominance was observed in earlier years. In June–July 2012, consecutive high-inflow storms sustained strong coastal diatom blooms, with mean abundances of 8.4 × 10⁵ cells L−1 (Fig. F2a in Appendix F) and post-storm mean Chl-a concentrations of 7.12 µg L−1 (Fig. 5). Following the 19 June 2012 storm, Leptocylindrus danicus peaked at 7.6 × 10⁵ cells L−1 at PHYTOBS Boulogne (Table H1 in Appendix H). Similarly, in June 2013, consecutive storms (15 and 22 June) elevated diatom abundances to maxima of 1.6 × 10⁶ cells L−1 (Fig. F3a in Appendix F), with L. danicus reaching 5.9 × 10⁶ cells L−1 (Table H1 in Appendix H) and Chl-a concentrations of 14.19 µg L−1 at PHYTOBS C on 25 June 2013. Additional evidence of storm-driven responses was observed on 21 July 2016 at PHYTOBS C, following the 11 July 2016 storm, when a bloom of Chaetoceros socialis reached 3.0 × 10⁶ cells L−1 (Table H1 in Appendix H).
3.2.3 Low inflow, high wind stress storm: 13 July 2015
The 13 July 2015 storm was the windiest event among the low-inflow, low-precipitation storms. It generated strong turbulence in the water column without delivering additional nutrients from riverine inputs. Under these conditions, the phytoplankton community was reshaped: diatoms and picophytoplankton groups were suppressed, while nanophytoplankton were favoured (Fig. 7C). Diatom abundances declined sharply in coastal stations (R0–R2), with the pre-storm mean of 6.8 × 10⁵ cells L−1 reduced by 2-fold to 3.3 × 10⁵ cells L−1 (Fig. 7Ca). In contrast, nanophytoplankton responded positively (Fig. 7Cb–d). Nanoeukaryotes increased significantly relative to pre-storm conditions (AD test, p=0.033; Table G1 in Appendix G), and post-storm abundances at all stations exceeding the 90th percentile (tail-exceedance test, p<0.001; Table G1 in Appendix G). Their distribution shifted from the 50th to above the 90th percentile (Fig. 7Cb), with a post-storm mean of 2.2 × 10⁶ cells L−1 and a maximum of 4.1 × 10⁶ cells L−1. Coccolithophorids peaked at 1.2 × 10⁵ cells L−1 at the near to the coast R0′ station (Fig. 7Cc), while cryptophytes showed a strong increase (Fig. 7Cd) moving offshore from R1 to R3 stations (mean: 3.6 × 10⁵ cells L−1; max: 7.6 × 10⁵ cells L−1), exceeding their climatological mean of 3.0 × 10⁵ cells L−1. By contrast, picophytoplankton groups declined markedly. Synechococcus abundances dropped nearly 4-fold, from a pre-storm mean of 2.1 × 10⁷ to 8.2 × 10⁶ cells L−1, while picoeukaryotes decreased from 7.4 to 3.2 × 10⁶ cells L−1 in the DYPHYRAD transect (Fig. 7Ce–f). Similarly, at SOMLIT L, the suppression was particularly striking: Synechococcus fell from 3.4 × 10⁷ to 3.6 × 10⁶ cells L−1, and picoeukaryotes from 1.1 × 10⁷ to 7.9 × 10⁵ cells L−1 by 15 July 2015 (Table H2 in Appendix H) with Chl-a concentrations limited to 1.39 µg L−1.
3.2.4 Low inflow, low wind stress storm: 6 June 2022
The 6 June 2022 storm was characterized by low inflow and low wind stress, conditions that implied minimal mixing and limited nutrient supply from rivers. Yet, occurring during a marine heatwave (Simon et al., 2023), this event uniquely reshaped the phytoplankton community. Under the prevailing warm conditions, the storm amplified picophytoplankton (Fig. 7D). Diatom abundances declined slightly, with a post-storm mean of 2.0 × 10⁵ cells L−1 (Fig. 7Da), remaining below the climatological mean of 3.4 × 10⁵ cells L−1 (Fig. 6a). Before the storm, populations of nanoeukaryotes, cryptophytes, Synechococcus, and picoeukaryotes were underdeveloped (Fig. 7Db–f). Following the storm, cryptophytes responded modestly at stations R0′, R2′, R3′, and R4, increasing to a post-storm mean of 3.0 × 10⁵ cells L−1 (Fig. 7Dd). In contrast, Synechococcus exhibited a dramatic surge at all stations (Fig. 7De), increasing from a post-storm mean of 6.3 × 10⁵ to 1.5 × 10⁷ cells L−1, with an offshore maximum of 2.0 × 10⁷ cells L−1. This increase reflected a significant distributional shift (AD test, p=0.001; Table G1 in Appendix G), though without enrichment of extreme values (Fig. 7De). The strongest response, however, came from picoeukaryotes. They not only shifted significantly (AD test, p=0.001; Table G1 in Appendix G) but also exhibited strong enrichment at all stations, reaching extreme abundances (Fig. 7Df; tail- exceedance test, ; Table G1 in Appendix G). Post-storm, their mean abundance rose to 2.4 × 10⁷ cells L−1, with maxima of 2.8 × 10⁷ cells L−1.
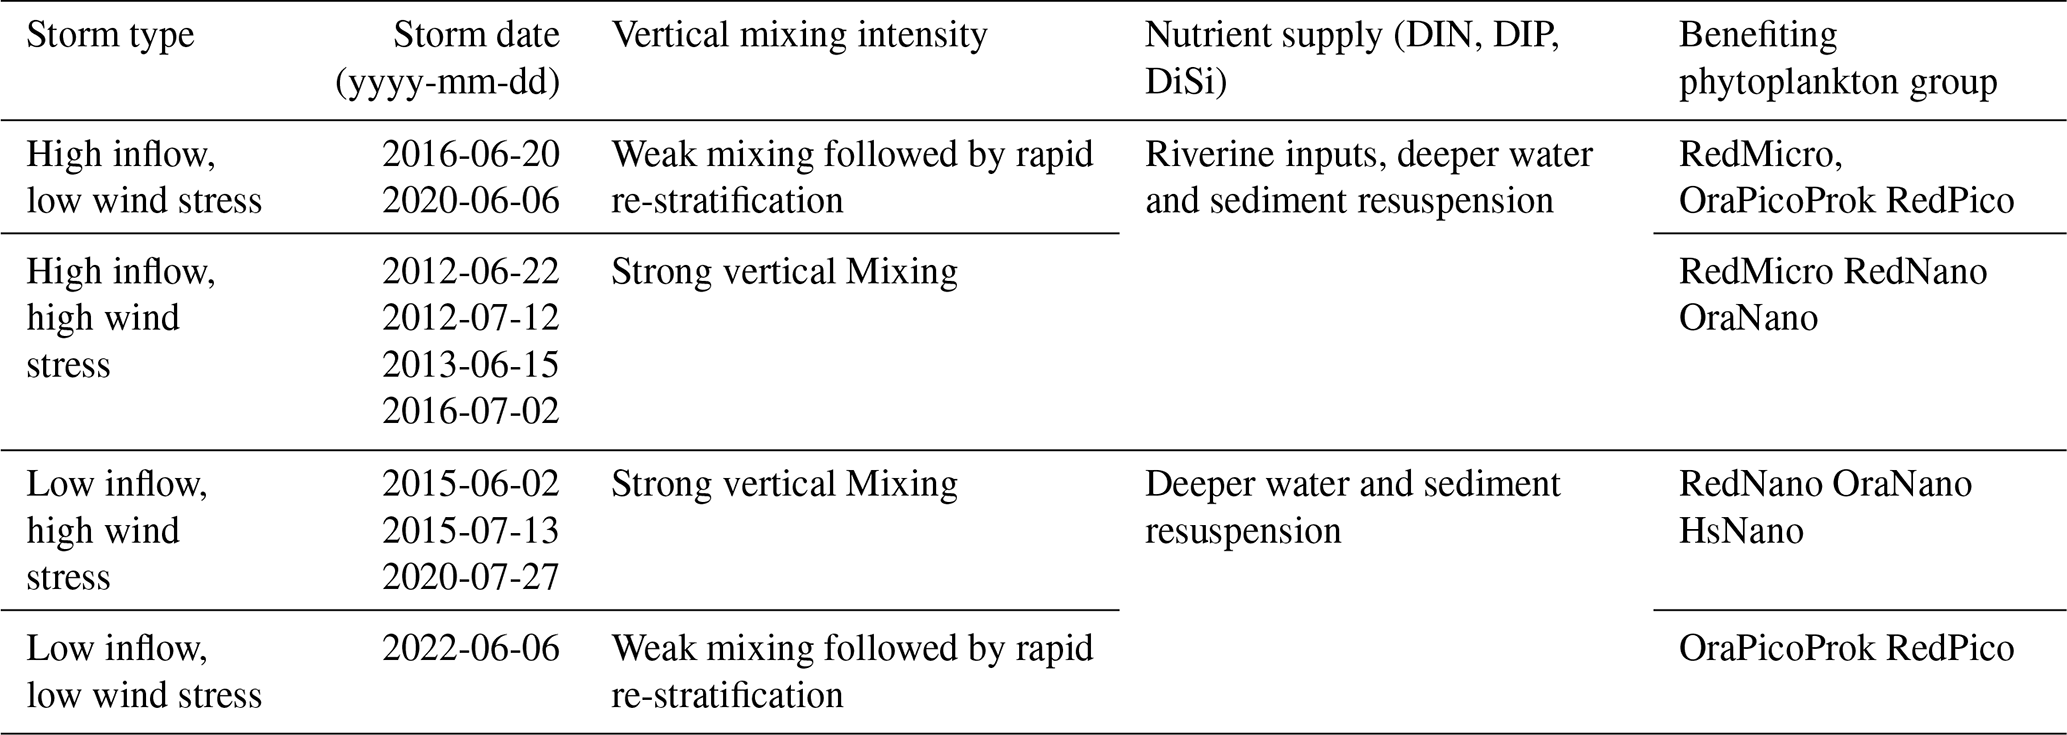
Summer storm impacts in the EEC were highly variable between years, arising from different combinations of river inflows and wind events that were in turn modulated by large-scale atmospheric circulation (Alvarez et al., 2024; Crawford et al., 2023; Turki et al., 2023). These patterns support our hypothesis that variations in river inflow and wind forcing drive changes in phytoplankton abundance and community composition. Specifically, our findings indicate that high inflow storms favoured diatoms, wind-driven mixing, low inflow summers promoted nanophytoplankton and picophytoplankton (Table 4). Nutrient loading via riverine inflow and sediment resuspension can be modulated by precipitation intensity and wind-driven mixing, respectively, resulting in variable storm impacts on temperate phytoplankton community structure. High inflow summer storms were predominantly observed in 2012, 2013, 2016, and June 2020, while low inflow windy conditions characterized summer of 2014, 2015, 2017, and July 2020. The 2022 event exemplified a short, low inflow storm with minimal extreme wind duration (<1 h, Fig. A1 in Appendix A). These contrasting phytoplankton dynamics are discussed below.
Table 4Summary of storm impacts and their associated nutrient and phytoplankton responses. See Table 2 for phytoplankton group description.
4.1 Summer storm induced changes in marine environment of the EEC
In During June–July, south-westerly winds frequently prevail, often exceeding 8 m s−1 (Figs. A1–A2 in Appendix A). These winds enhance vertical mixing and drive the northward transport of deep and oceanic waters, replenishing nutrients in surface layers (Dulière et al., 2019). In addition, high precipitation events can produce either high or low inflow (Fig. 3). At the same time, south-westerly winds sustain a narrow coastal current, 3–4 km wide, originating from the Bay of Somme and occasionally linked to the Seine Estuary (Brylinski et al., 1991). This current is distinct from offshore waters, as reflected in the coastal–offshore salinity gradient, and serves as a conduit for riverine inputs from the Somme, Authie, Canche, Liane, Wimereux and Slack rivers. Although we did not identify a measurable effect of tidal phase on the post-storm observations (not shown here), previous studies indicate that tides primarily influence biological processes through their control of the width of the coastal current and associated transport of riverine inputs, rather than through the coastal–offshore tidal cycle itself (Brylinski et al., 1996; Fettweis et al., 2022). Storm impacts are reflected in the coastal water salinity climatology, which exhibits an increasing trend until late May, followed by a decline through the end of July (Fig. C1b in Appendix C). Under south-westerly winds (Figs. A2 and D1 in Appendix A and D), these surplus inputs can be advected northward into the study area, ultimately reaching the Strait of Dover (Brylinski et al., 1996). For example, the Somme Estuary delivers daily averages of ∼ 500 kmol d−1 of silicate and nitrate during June–July (Loquet et al., 2000). Such enrichment from the Bay of Somme has long been associated with the proliferation of diatoms and Phaeocystis globosa in the EEC (Brunet et al., 1996).
In the English Channel and southern North Sea, summer is often associated with storm activity (Cook et al., 2015; Gronholz et al., 2017; Scholz et al., 2022). Extratropical storms generate extensive cloud cover, precipitation, and riverine inflows, all of which can alter light availability, nutrient concentrations and salinity (Jennings et al., 2012; Kasprzak et al., 2017). The EEC summer months are typically marked by low silicate, nitrate, and phosphate concentrations (Fig. C1d–f in Appendix C). Chl-a concentrations were relatively high and showed spatial differences, with higher values in coastal waters compared with offshore waters during the summer months (Fig. C1c in Appendix C). As previously reported, phytoplankton blooms in the English Channel can persist for several weeks after summer storms (Rees et al., 2009). For instance, Rees et al. (2009) documented three summer precipitation events that induced freshwater stratification and delivered DIN to surface waters, stimulating primary production. They proposed that storm-driven nutrient loading alleviated DIN limitation, while dissolved organic phosphate was mobilized to meet DIP demand. Such processes may generate synergistic, non-additive responses to dual nutrient enrichments, resulting in enhanced phytoplankton growth (Allgeier et al., 2011).
4.2 Storm impacts on Chl-a and phytoplankton summer communities
Interannual variability in windy days (number of days > 8 m s−1) and inflow during June–July was evident, with episodes of strong winds in 2015 and 2020, and enhanced riverine inflow in 2012, 2013, 2016, and 2021 (Fig. 4). Long-term records show that northern Europe has become wetter since the last century (Cook et al., 2015), with alternating wet and dry periods driven by both climate change and natural variability. Corresponding variability was reflected in post-storm Chl-a concentrations and phytoplankton community structure. Since 2012, Chl-a in the DYPHYRAD transect has declined (Hubert et al., 2025a), consistent with earlier observations of interannual shifts in the EEC, including a late-20th-century decrease followed by a rise in the early 2000s (Lefebvre et al., 2011). Similar patterns have been reported elsewhere, with summer primary production responding to precipitation and riverine inputs in the western English Channel (Barnes et al., 2015) and to increased summer winds in the Arctic Ocean (Crawford et al., 2020). These findings suggest that interannual and multidecadal variability in Chl-a may be in part also regulated by distinct storm impacts affecting phytoplankton composition (Stockwell et al., 2020).
Previous studies have shown that large phytoplankton often dominate nutrient-rich upwelling regions of the ocean, whereas open-ocean waters are typically dominated by picophytoplankton (James et al., 2022; Ribalet et al., 2010). A similar pattern was observed in the English Channel, where riverine input represents the dominant mechanism of nutrient supply. This nutrient enrichment supports the abundance of larger phytoplankton, such as diatoms and Phaeocystis globosa, in coastal waters (Napoléon et al., 2014). During the summer months, distinct and contrasting patterns emerged between coastal and offshore waters: diatoms were consistently more abundant in coastal waters (Fig. 6a), whereas Synechococcus dominated offshore waters (Fig. 6e). Seasonal dynamics revealed a June–July mean increase in diatom abundance following the spring bloom. Synechococcus rose in late May but dipped in early July despite warming temperatures, then recovered by late July as diatoms declined. This crossover suggests that transient meteorological disturbances, including storm-related reductions in light or shifts in nutrient dynamics, temporarily favoured diatoms over Synechococcus. The subsequent reversal toward late July reflects a return to more stable summer conditions. Similarly, high standard errors in diatom, picophytoplankton, and cryptophyte abundances point to greater fluctuations during June–July (Fig. 6a–f) due to storm-driven disturbances.
4.2.1 High inflow storms and diatom (microphytoplankton) responses
In several cases, post-storm increases in Chl-a coincided with strong diatom dominance, particularly during the 2012, 2013, and 2016 storm events. These summers were characterized as windy because June and July recorded more than 10 days with wind speeds exceeding 8 m s−1 and monthly average river flows above 0.35 m3 s−1 (Fig. 4). Storms create turbulent, nutrient-rich niches that benefit diatoms (Margalef, 1978). Their large cell size allows them to store nutrients during fluctuating nutrient conditions (Litchman et al., 2009), while their ability to increase Chl-a and other pigments under variable light regimes enhances resilience to rapid changes in irradiance (Kuczynska et al., 2015; Pniewski and Piasecka-Jędrzejak, 2020).
Post-storm peaks in microphytoplankton abundances were often driven by specific diatom taxa such as Leptocylindrus danicus and Chaetoceros socialis, whose abundances exceeded climatological baseline shown in Fig. 6a–f by more than 3-fold (Table H1 in Appendix H). The recurrence of these post-storm diatom blooms across multiple years (Table 4; 2012, 2013, 2016, 2020) indicates that they are not isolated anomalies but rather a consistent feature of coastal phytoplankton dynamics. High inflow storms in 2012, 2013, 2016, and June 2020 were consistently associated with significant increases in diatom abundances (AD test, p<0.05; Figs. 7A–B, F3a, F5a in Appendix F), particularly in coastal waters (R0–R2). In a previous study, Rees et al. (2009) reported a monospecific post-storm bloom of Chaetoceros debilis associated with increased Chl-a following enhanced river inflow, supporting our observation that such blooms are recurrent in the region. Higher summer silicate concentrations (∼ 1.8 µmol L−1) at the coastal station R0 (Hubert et al., 2025a) likely favour diatom growth in coastal waters.
Periods of consecutive rainy storms at the end of June may explain the convergence of coastal and offshore diatom climatology in early July (Fig. 6a). In addition, consecutive storms often ensure that the nutrient-rich coastal flow reaches the Strait of Dover, consistent with the high diatom abundances (Figs. 7A–B, F1–F3, F5 in Appendix F) observed in the coastal (R0–R2) and frontal zone (R2–R3′). In contrast, the 6 June 2022 storm, characterized by low inflow and weak wind stress (Fig. 7D), did not enhance diatom abundances across the transect. Instead, elevated Chl-a concentrations were detected at PHYTOBS Boulogne and PHYTOBS C (4.29 and 4.7 µg L−1, respectively; Table H1 in Appendix H), accompanied by a bloom of Leptocylindrus danicus (2.27 × 10⁶ cells L−1 at PHYTOBS Boulogne). These responses suggest that the impact of low wind stress on coastal flow was largely confined to the south till Boulogne-sur-Mer, while limited inflows from smaller rivers such as the Slack and Wimereux did not enhance diatom growth in the transect (Fig. 7D). Under weak winds, reduced advection creates strong spatial patchiness in the EEC (Bonato et al., 2015). Consequently, it was appropriate that our analysis did not incorporate flow rates from rivers such as the Canche and Liane, as their influence on the transect would have been minimal under these conditions.
This study highlights that certain diatom genera and species are able to dominate storm-driven summer blooms; specifically, Leptocylindrus danicus in June and Chaetoceros socialis in July. Such dominance suggests that these taxa are well adapted to post-storm conditions associated with riverine nutrient supply under the well-lit conditions of summer (Polimene et al., 2014; Widdicombe et al., 2010). Moreover, while diatoms in offshore waters during the summer are generally confined to subsurface layers (20–30 m; Barnett et al., 2019), riverine nutrient inputs and mixing can promote their proliferation in surface waters across the transect (e.g., Fig. 7Ba and F3a in Appendix F).
4.2.2 High wind stress, low inflow storms and nanophytoplankton responses
June–July periods in 2015 and 2020 consistently recorded more windy than high-inflow days, with summer 2015 standing out for its 34 windy days, particularly in July (Fig. 4). Summer stratification of the English Channel (Barnett et al., 2024; Schmitt et al., 2024) provides the backdrop for these dynamics. Wind speeds of ∼ 8 m s−1 are sufficient to disrupt stratification (Barnett et al., 2019), mixing the water column and transporting remineralized nutrients from deeper layers to the surface (Williams et al., 2013). Nutrients remineralized from P. globosa organic matter (Lamy et al., 2009) along the EEC coast can be transported northward by south-westerly winds. Turbulence in the frontal zone (R2–R3′) (Brylinski et al., 1991) explains both the lack of spatial differences in nanoeukaryotes climatology (Fig. 6b) and their accumulation in frontal zones (Gieskes et al., 2007), as turbulent conditions favour nutrient consumption. With low inflows limiting silicate supply, diatom growth was constrained, leaving space for nanophytoplankton to expand by exploiting available DIN and DIP. Dry and windy summers such as 2015 and 2020 produced significant increases in nanophytoplankton (Figs. 7B, D, F4b in Appendix F; AD test, p<0.05; Table G1 in Appendix G). According to metabarcoding, small eukaryotic phytoplankton communities were dominated by the coccolithophorid Emiliania and the nanoplanktonic diatom Minidiscus, while cryptophyte peaks — dominated by Plagioselmis — were observed in July 2016, 2018, and 2020 (Skouroliakou et al., 2022).
4.2.3 Low wind stress storms and picophytoplankton responses
By contrast, the 6 June 2022 storm produced a different outcome. This short-lived event generated only weak wind forcing, and the post-storm community was dominated by picophytoplankton, with only marginal increases in nanophytoplankton (Fig. 7D). This event unfolded during concurrent marine and atmospheric heatwaves (Guinaldo et al., 2023), which elevated sea surface temperatures and reduced cloud cover and wind speeds, creating favourable conditions for picophytoplankton (Levasseur et al., 2025). Their high surface-to-volume ratio confers a competitive advantage under oligotrophic conditions, enabling efficient nutrient uptake even when concentrations are low (Raven, 1984). Then, the EEC remained stratified until a new short windy event disrupted the stratification on 19 June 2022 (not shown here). By late June, Synechococcus and picoeukaryotes reached exceptional abundances offshore (1.0 × 10⁸ and 2.3 × 10⁸ cells L−1 at SOMLIT L; Table H2 in Appendix H) and at the coast (4.8 × 10⁷ and 1.8 × 10⁷ cells L−1 at SOMLIT C; Table H2 in Appendix H). Similar low-wind storm in June 2016 also favoured picophytoplankton. Low wind-stress storms (e.g., 20 June 2016 and 6 June 2022) were associated with significant increases in Synechococcus and picoeukaryotes, respectively, with no significant decrease in picoeukaryotes during the 20 June 2016 event (AD test, p<0.05; Table G1, Appendix G). Nanophytoplankton and picophytoplankton are well adapted to low nutrient concentrations, efficiently acquiring resources and sustaining growth under windy, low-inflow conditions (Table 4).
While previous research in this region attributed summer phytoplankton blooms and community turnover (69 %; Skouroliakou et al., 2022) primarily to stochastic processes associated with reduced diversity, the underlying drivers of these disturbances remained unclear. The present study elucidates these patterns by identifying weather-induced nutrient suppletion as a key mechanism in an otherwise nutrient-depleted environment after the spring bloom. We found that recurrent storms disrupted seasonal succession, triggering short-lived but pronounced community shifts characterized by transient monospecific peaks such as Leptocylindrus danicus and Chaetoceros socialis observed in our study. Similar storm-related shifts have been documented in other aquatic systems – for example, the post-storm dominance of cryptomonads in a temperate lake (Jacobsen and Simonsen, 1993) and reduced phytoplankton diversity linked to stochastic processes in the Yangtze River Estuary (Xian et al., 2024).
The present study revealed that summer phytoplankton dynamics were strongly shaped by the interplay of stratification, turbulence, and riverine inputs due to storms. Summer storm impacts in the EEC were highly variable between years, arising from different combinations of river inflows and wind storms that are themselves modulated by large-scale atmospheric circulation. This interannual variability was reflected in phytoplankton community composition, with storms repeatedly disrupting seasonal succession and generating short-lived but pronounced shifts in community structure. Storm events disrupted seasonal succession by introducing episodic nutrient pulses and modifying the physical environment. Riverine inputs enhanced diatom dominance through increased silicate availability, resulting in elevated Chl-a concentrations in coastal waters. In particular, enhanced riverine inputs promoted transient monospecific diatom blooms, such as Leptocylindrus danicus and Chaetoceros socialis. In contrast, when riverine nutrient inputs were limited, strong wind-driven mixing promoted nanophytoplankton, whereas these conditions were associated with reduced picophytoplankton abundance. Picophytoplankton, particularly Synechococcus in offshore waters, were associated with oligotrophic conditions and were sustained under low-nutrient environments. These findings emphasize the role of episodic summer storms in redistributing nutrients and shaping phytoplankton succession in post-spring bloom coastal ecosystems.
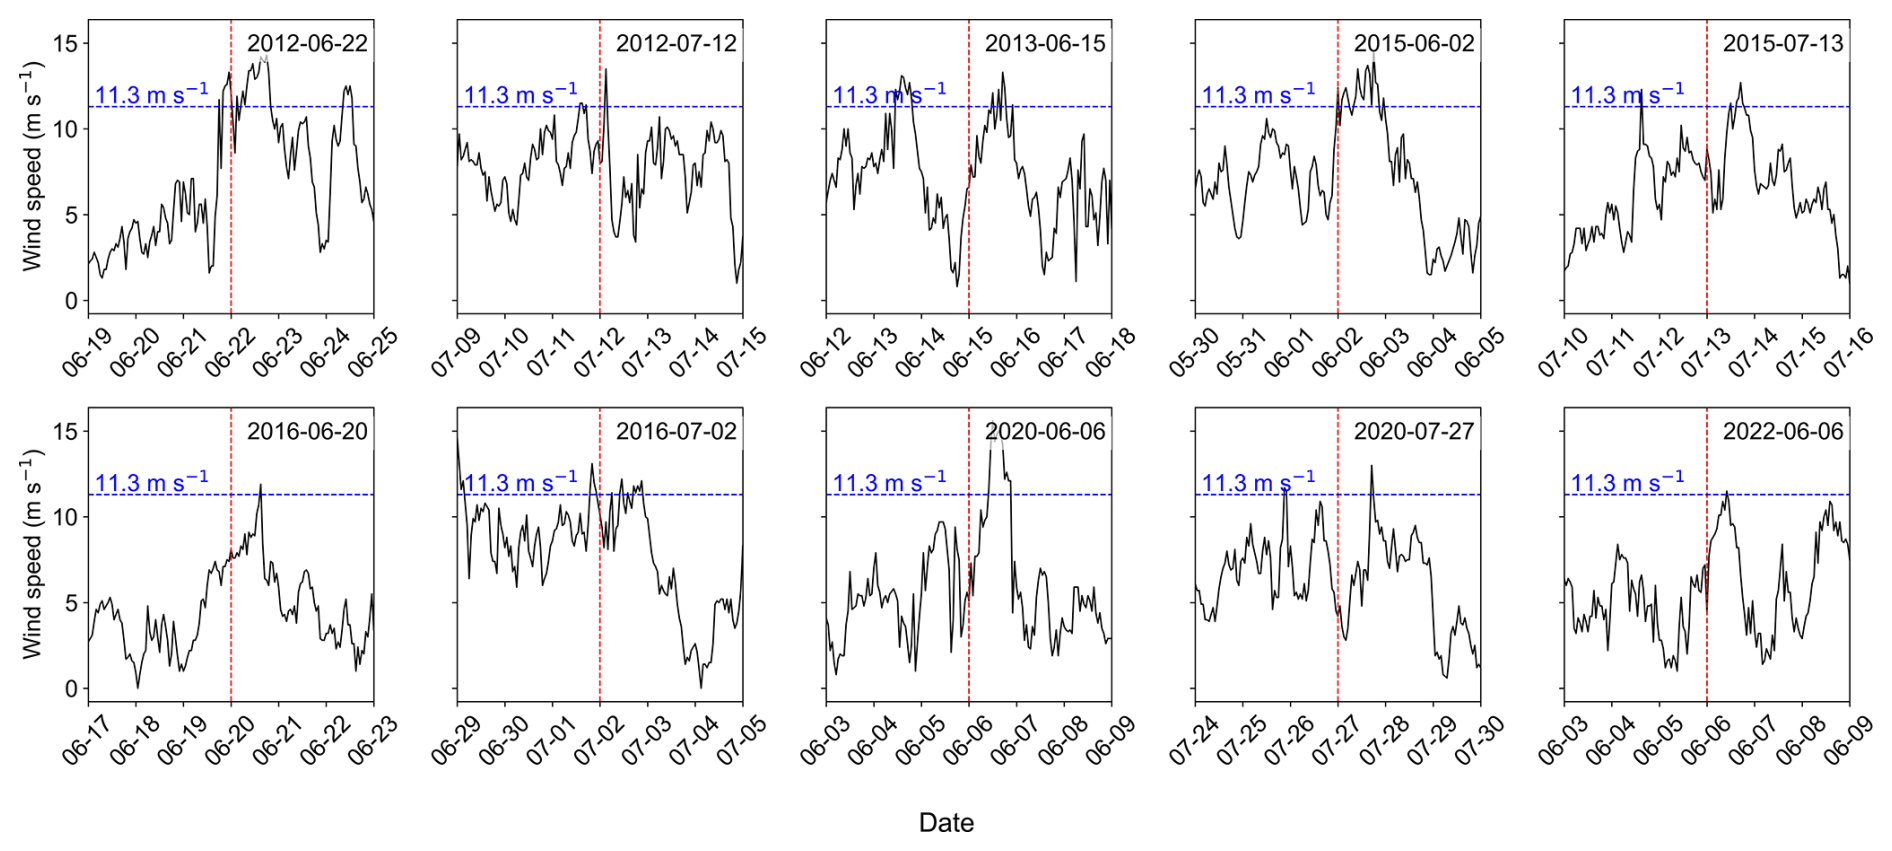
Figure A1Hourly wind speed time series centred on each storm event at Boulogne-sur-Mer (Météo-France station). The red dashed line marks the central storm day, and all analyses use a ±3 d window around this reference point. The longest event occurred on 2 July 2016, when wind speeds remained above 8 m s−1 throughout the ±3 d period. In contrast, the 20 June 2016 and 6 June 2022 storms exhibited short-lived peaks (≥ 11.3 m s−1) lasting no more than one hour within the ±3 d window.
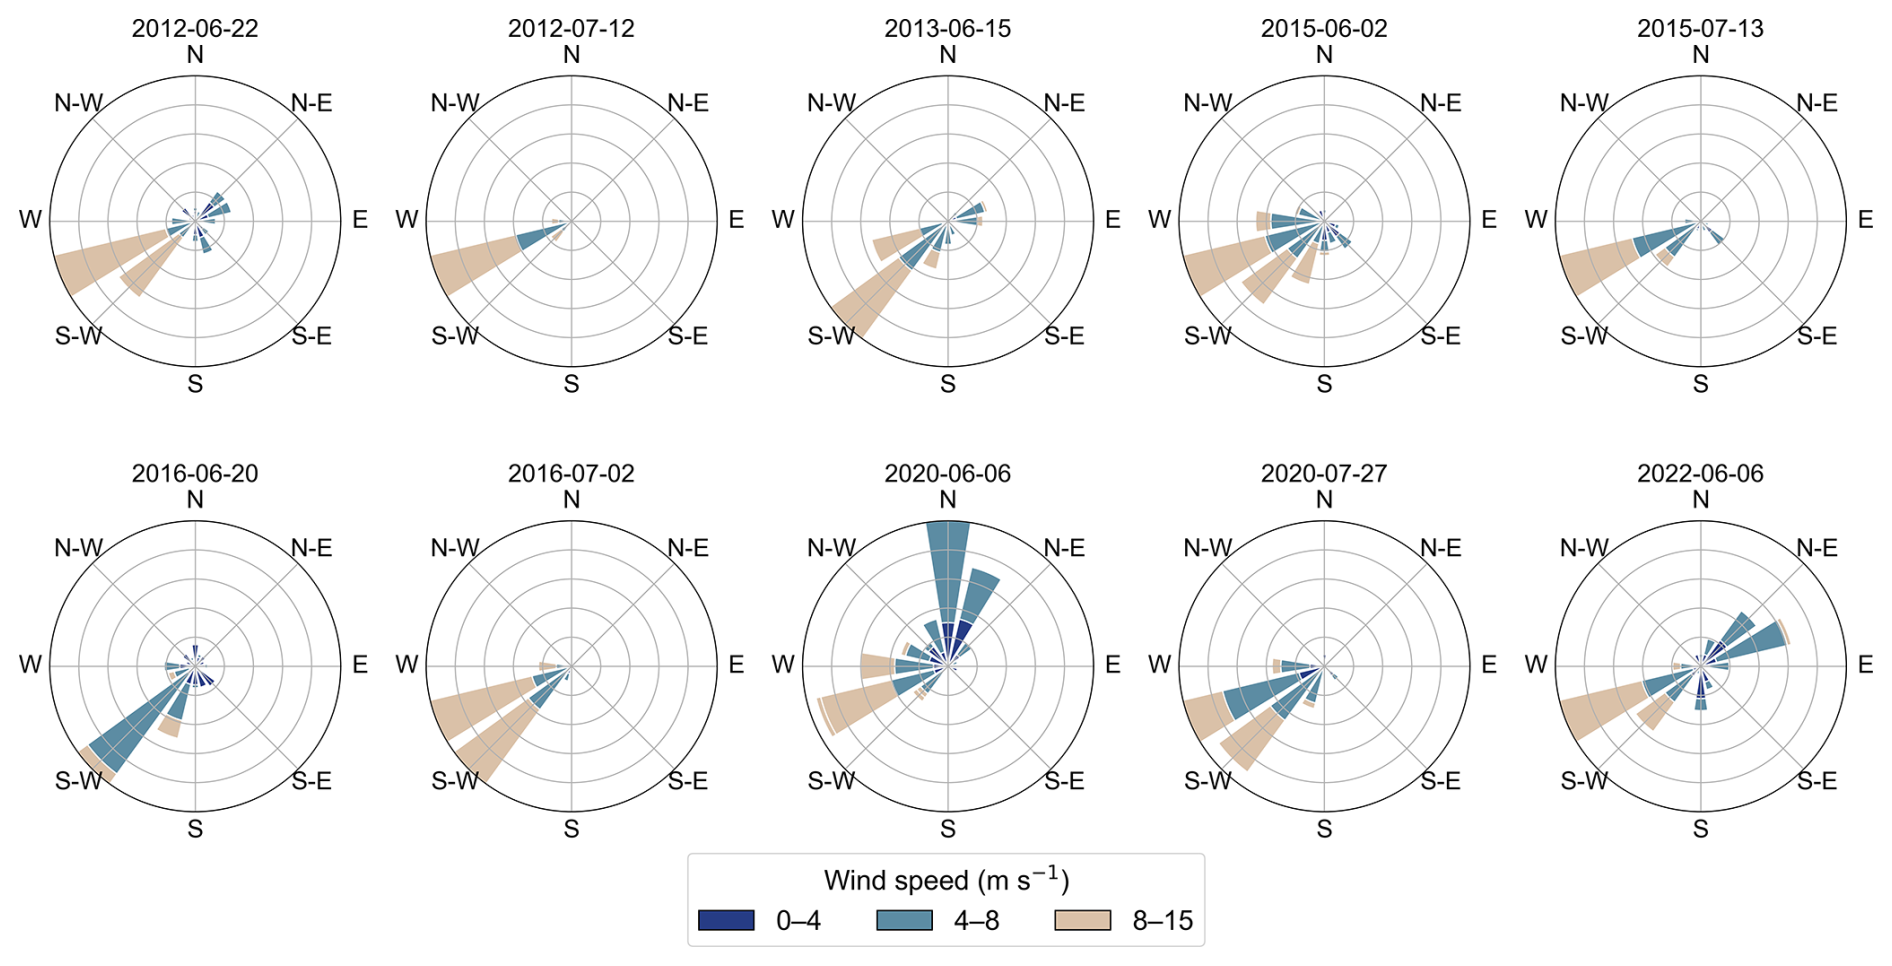
Figure A2Hourly wind direction time series centred on each storm event at Boulogne-sur-Mer (Météo-France station). Across all storms, the strongest winds during the ±3 d analytical windows were consistently from the south-west. Subsurface current data were not available, preventing comparison with coastal flow direction.
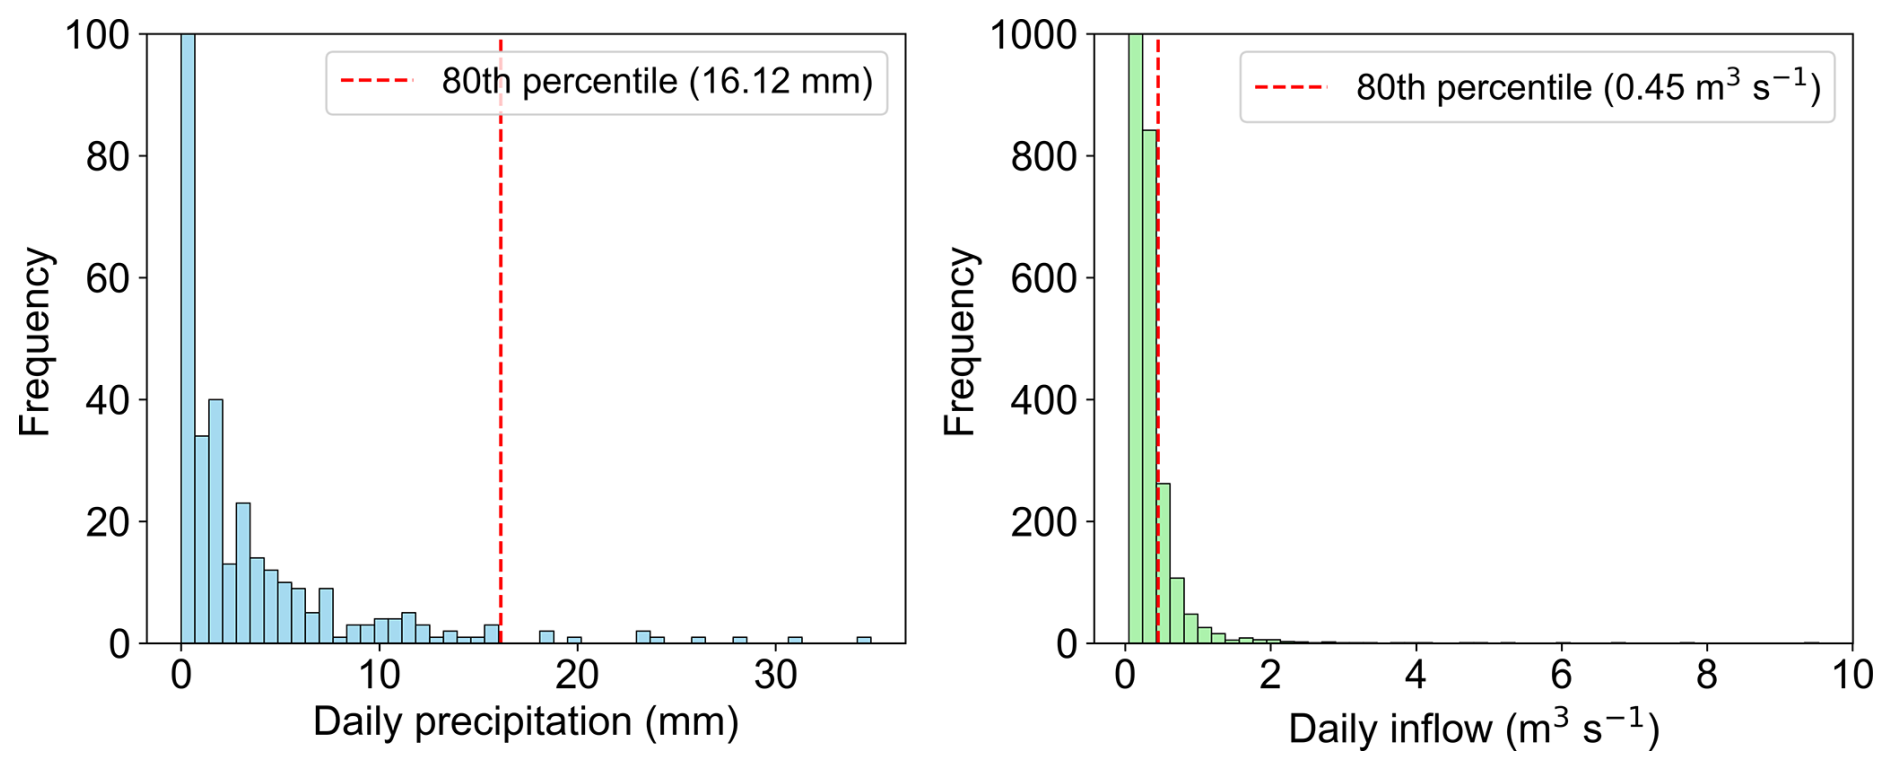
Figure B1Frequency distributions of June–July precipitation (left) and river inflow (right) at the Boulogne-sur-Mer (Météo-France station). Red dashed lines indicate the 80th percentile thresholds (16.12 mm for precipitation; 0.45 m3 s−1 for inflow), calculated from normalized ±3 d total accumulated precipitation and mean inflow values. These thresholds were used to identify storm impacts as “High” or “Low” classes precipitation and river inflow.
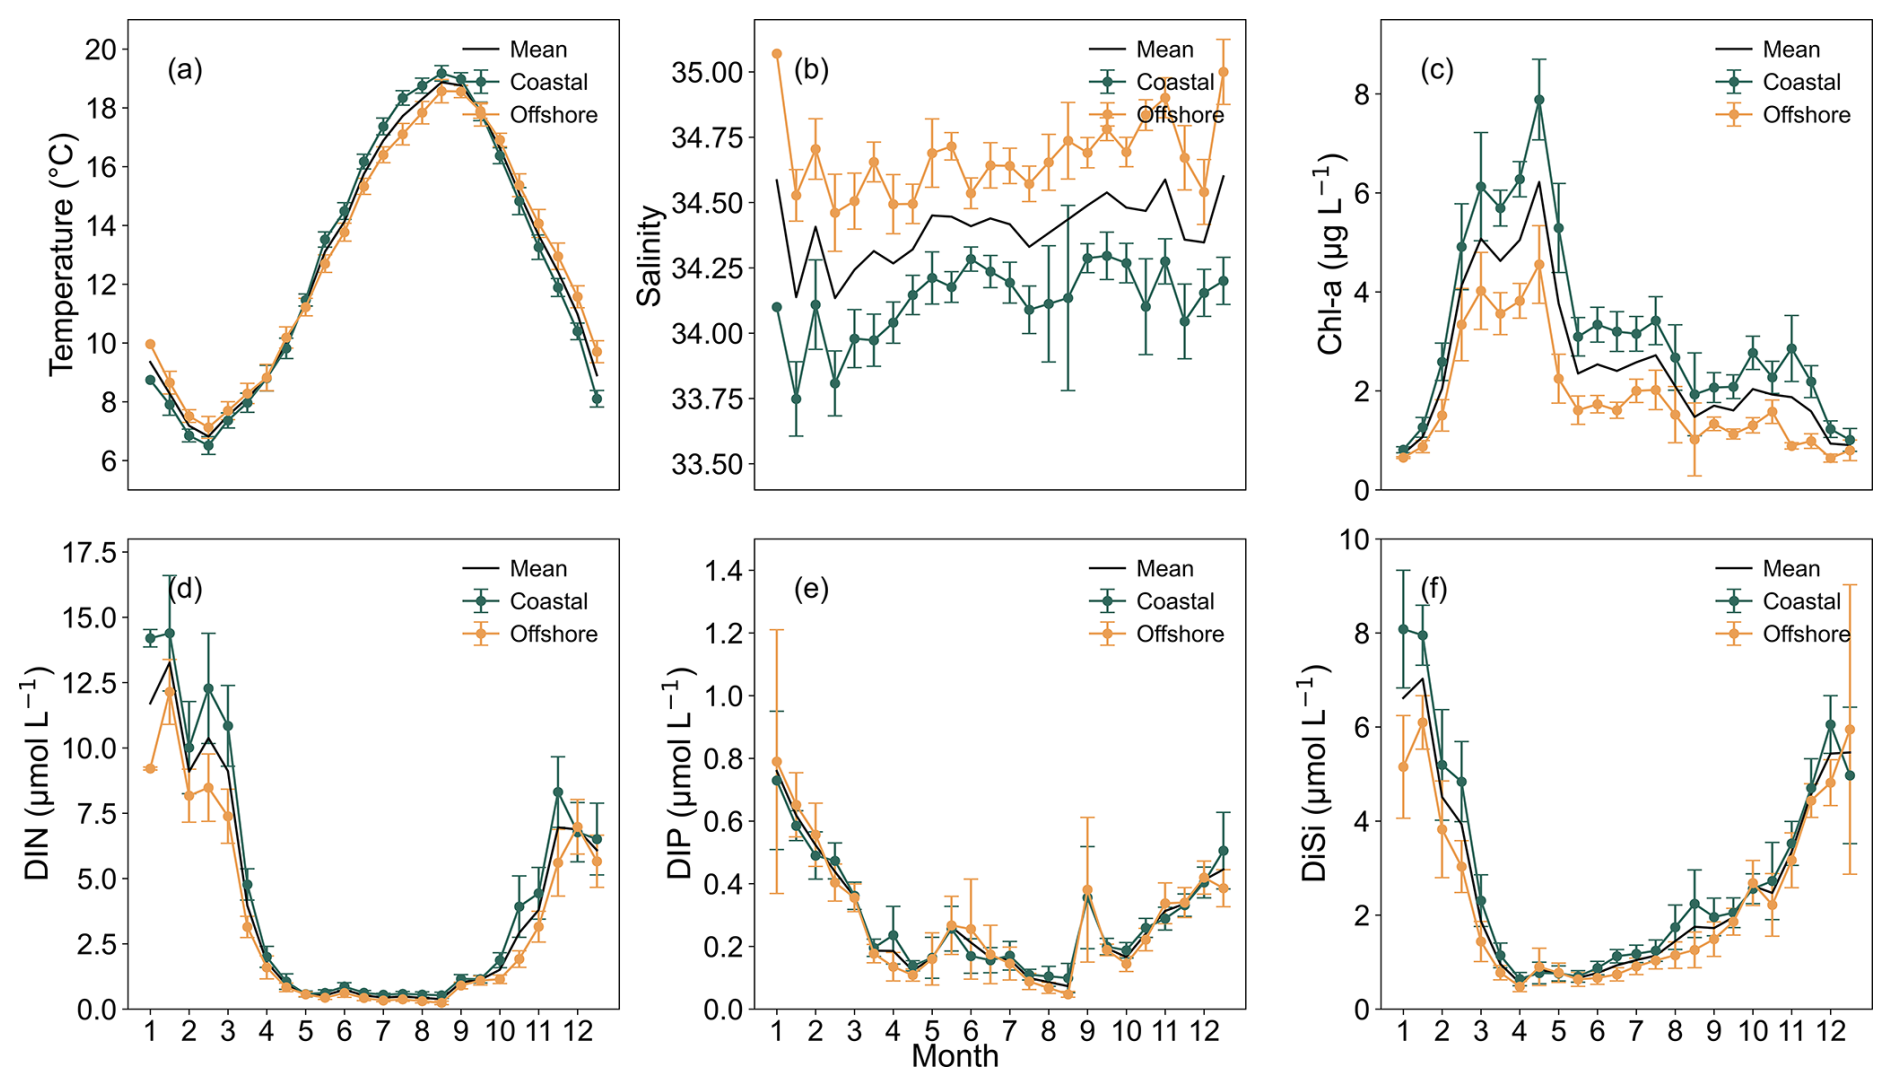
Figure C1Climatological means and standard errors for Coastal (R0–R2 + SOMLIT C) and Offshore (R2′–R4 + SOMLIT L) regions of the EEC, based on 15 d means from February 2012 to December 2022. The black line represents the mean value across all stations. (a) Sea temperature (°C), (b) salinity, (c) Chl-a (µg L−1), (d) dissolved inorganic nitrogen (DIN, µmol L−1), (e) dissolved inorganic phosphorus (DIP, µmol L−1), and (f) dissolved inorganic silicate (DiSi, µmol L−1). Coastal stations (R0–R2 + SOMLIT C) show stronger seasonal variability than offshore stations (R2′–R4 + SOMLIT L), particularly in salinity and Chl-a, reflecting coastal riverine influence. Chl-a exhibits two spring peaks (the first associated with diatoms and the second in April with P. globosa), followed by a summer peak in June–July and a smaller autumn peak. Despite strongest nutrient limitation in June–July, Chl-a concentration remained elevated.
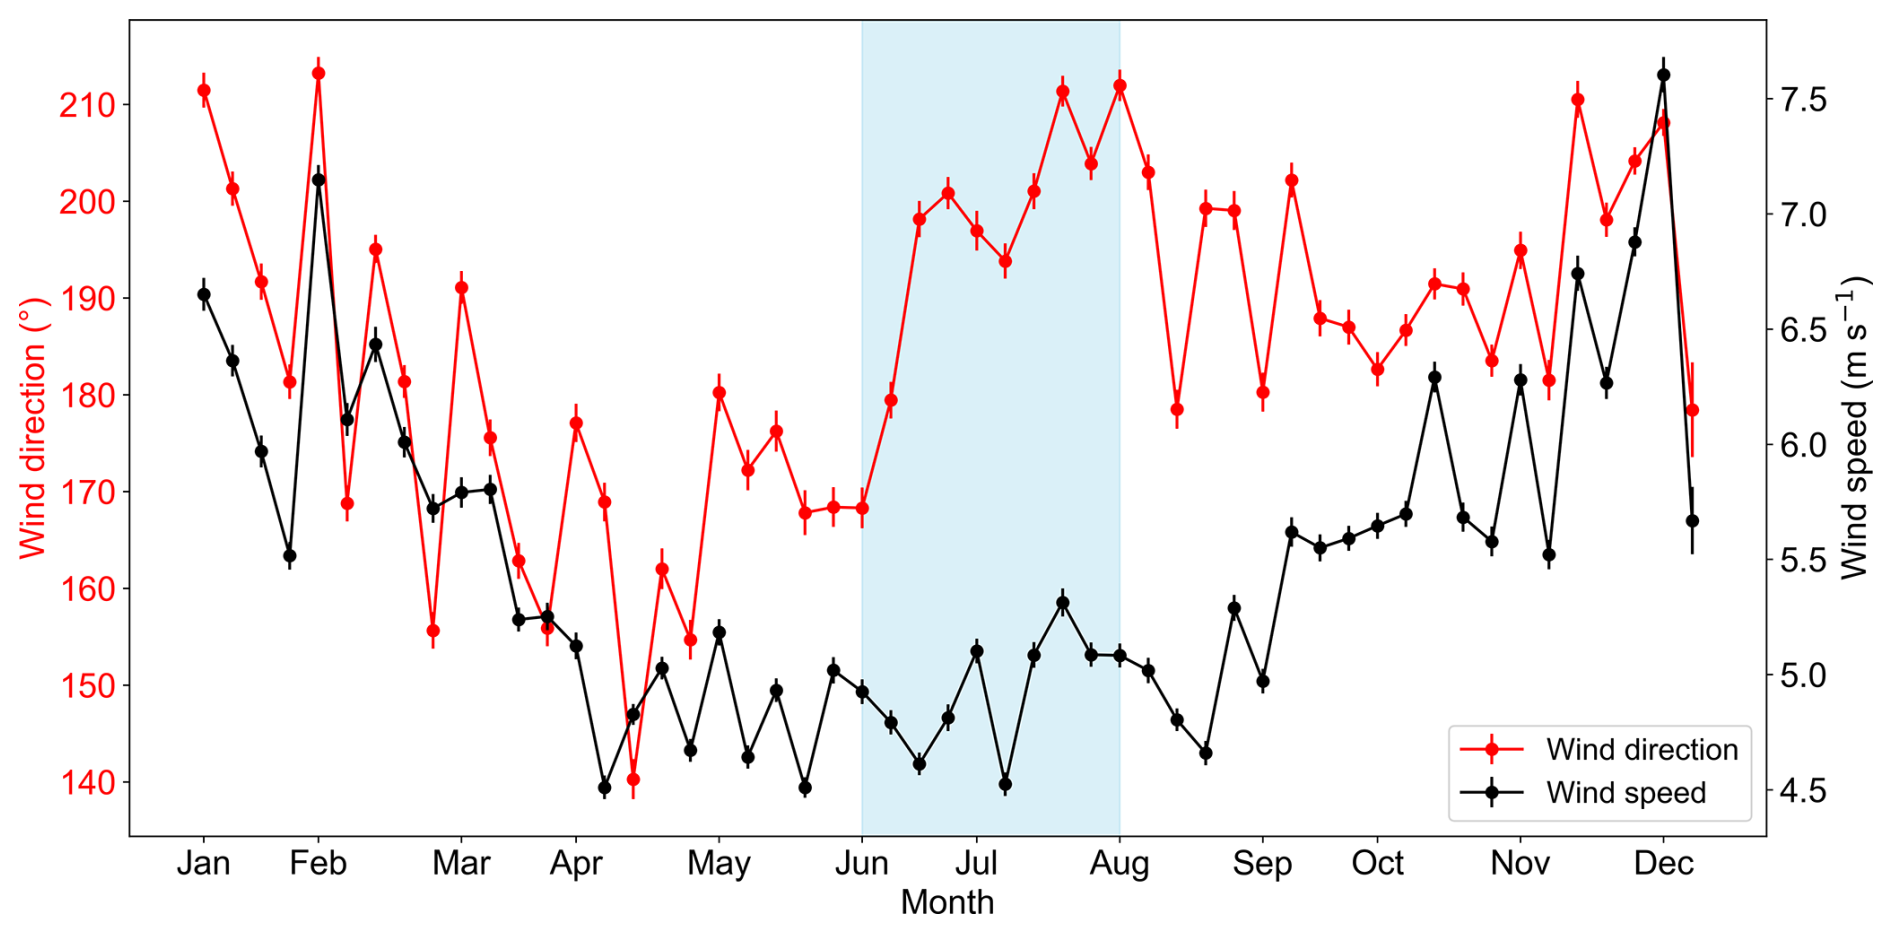
Figure D115 d climatology of wind speed (black line, mean ± SEM) and wind direction (red line, mean ± SEM) at Boulogne-sur-Mer (Météo-France station), based on hourly measurements for 2010–2025. The shaded area highlights the June–July period used for the summer analysis, during which south-westerly winds dominate.
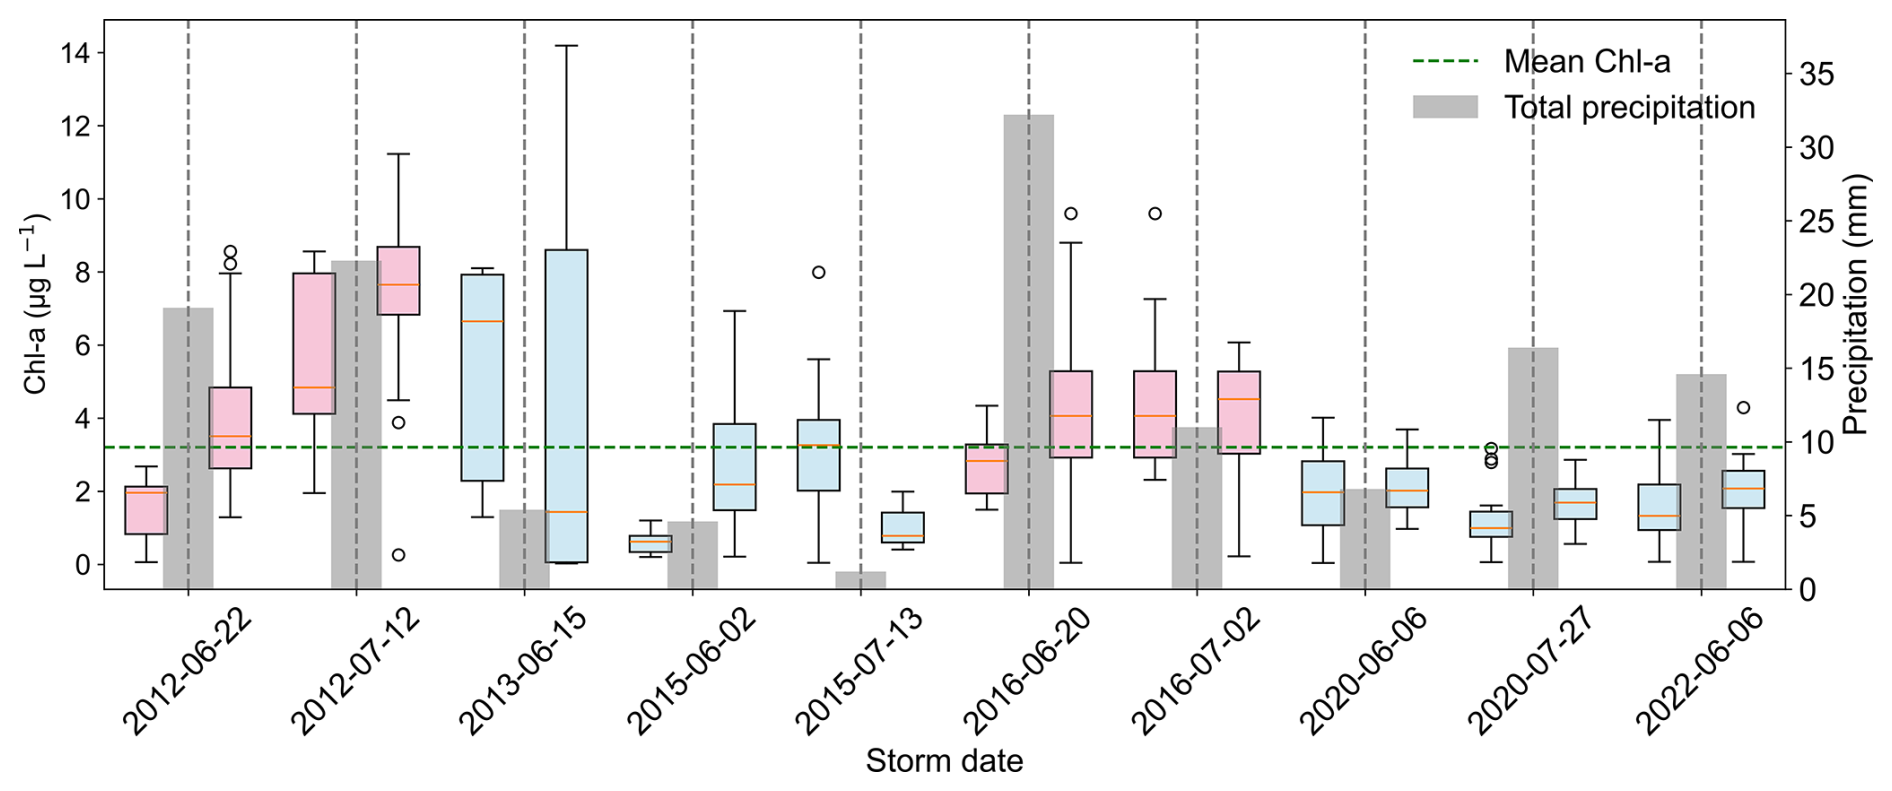
Figure E1Boxplots of pre- and post-storm Chl-a distributions (compiled from DYPHYRAD and SOMLIT) for the 10 storms. Vertical dashed lines indicate the timing of each storm event. Pink and blue boxplots denote “high” and “low” inflow storms, respectively, corresponding to increased and decreased Chl-a responses. Pre-storm Chl-a distributions are shown together with total accumulated precipitation over a ±3 d storm period (dark grey bars). Total precipitation and post-storm Chl-a did not exhibit a linear relationship for the storms on 15 June 2013, 27 July 2020 and 6 June 2022. The green dashed line indicates the June–July climatological mean Chl-a concentration (3.20 µg L−1) in the EEC.
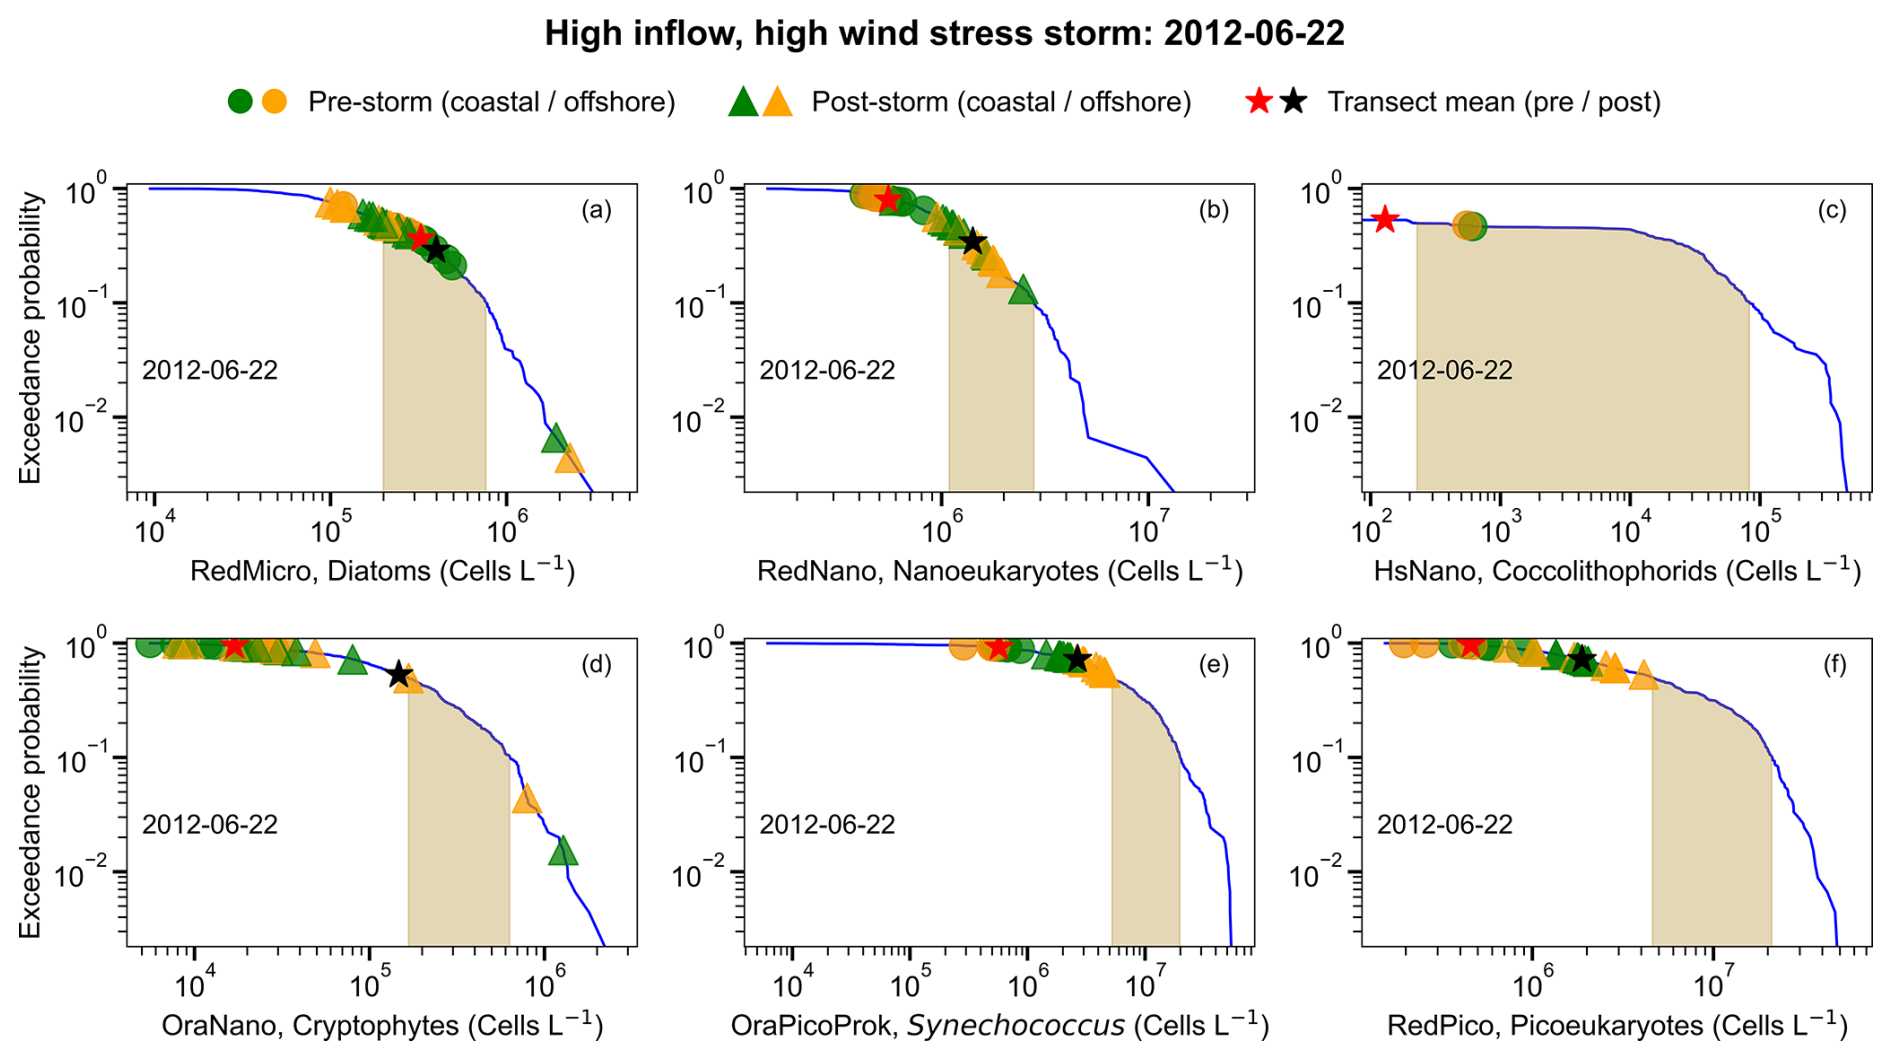
Figure F1Exceedance probability (CCDF) distributions of six phytoplankton groups (a–f) along the DYPHYRAD transect during the storm of 22 June 2012. For each panel, RedMicro (diatoms), RedNano (nanoeukaryotes), HsNano (coccolithophorids), OraNano (cryptophytes), OraPicoProk (Synechococcus), and RedPico (picoeukaryotes) are presented. Blue lines represent June–July climatological distributions, with shaded areas indicating the 50th–90th percentiles. Pre-storm (−10 d) and post-storm (+14 d) observations are shown as green (coastal) and orange (offshore) symbols, with circles indicating pre-storm and triangles indicating post-storm abundances. Red and black stars indicate transect-mean abundances before and after the storm, respectively. Post-storm communities were dominated by diatoms and nanophytoplankton.
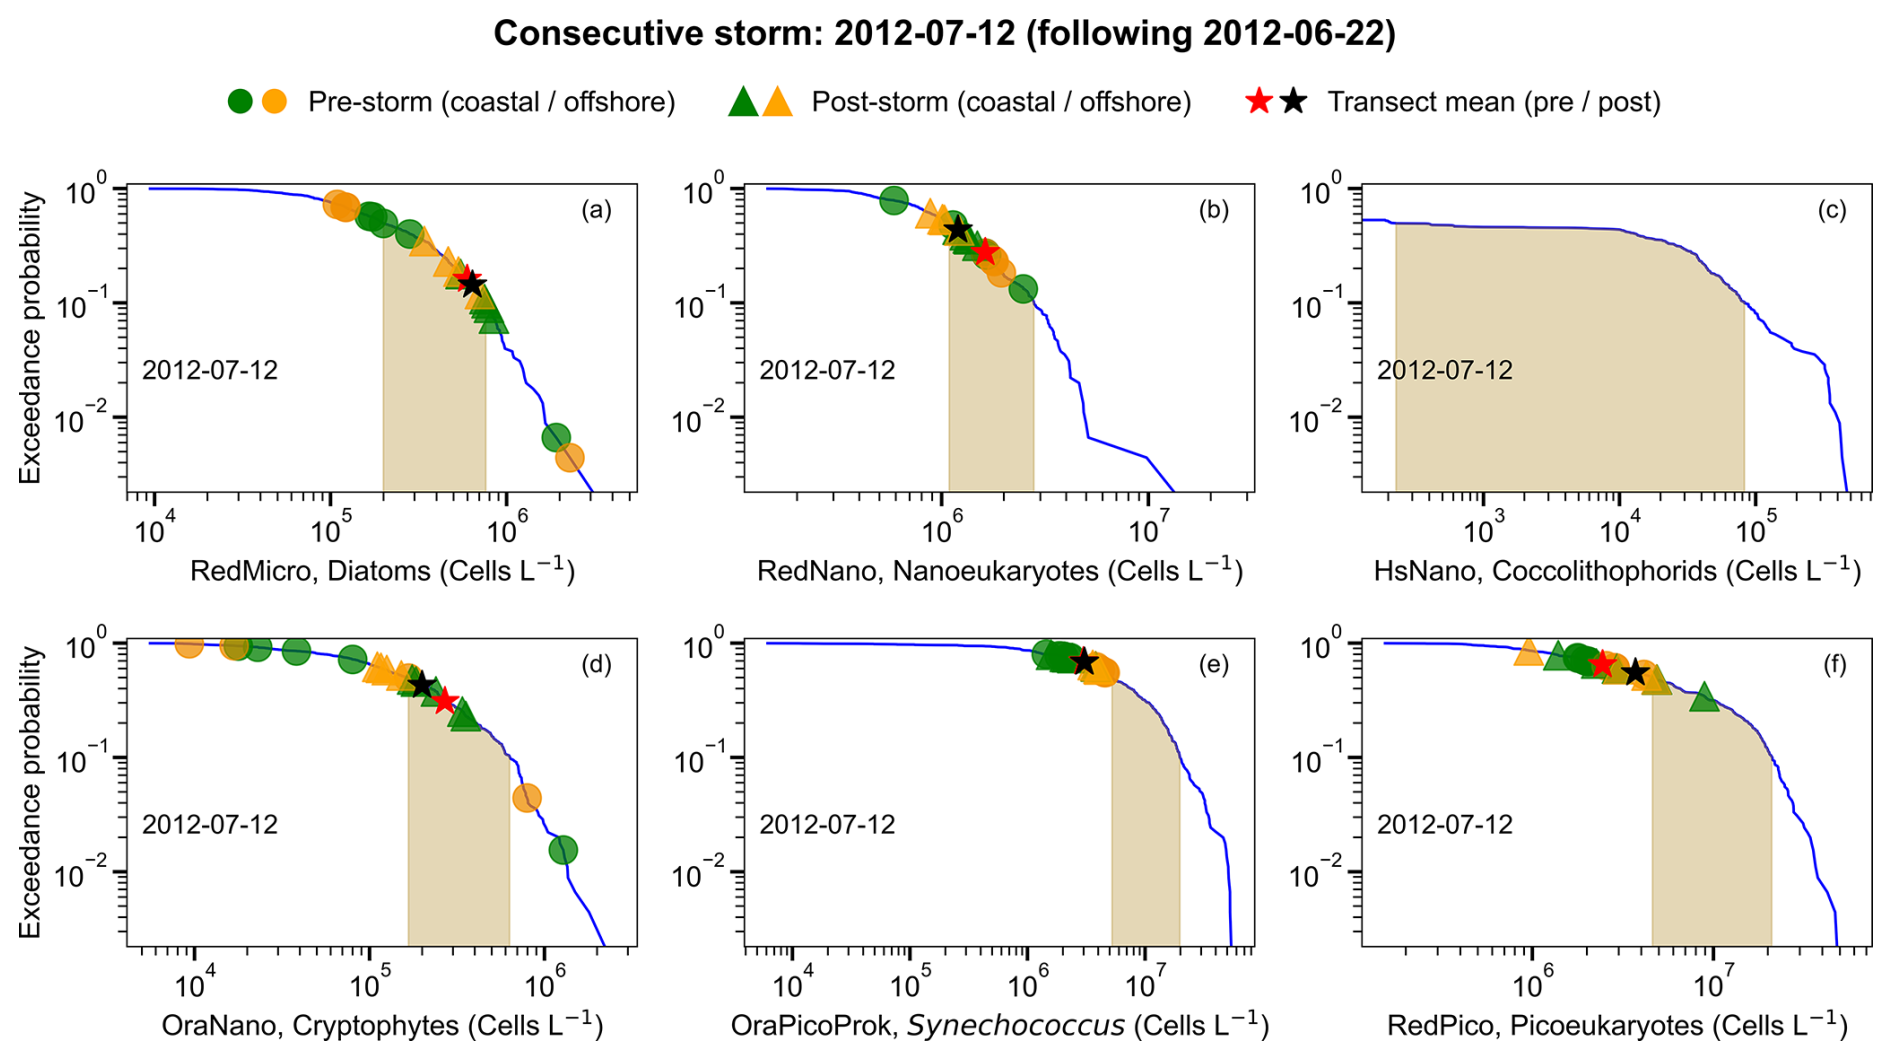
Figure F2Exceedance probability (CCDF) distributions of six phytoplankton groups (a–f) along the DYPHYRAD transect during the storm of 12 July 2012. For each panel, RedMicro (diatoms), RedNano (nanoeukaryotes), HsNano (coccolithophorids), OraNano (cryptophytes), OraPicoProk (Synechococcus), and RedPico (picoeukaryotes) are presented. Blue lines represent June–July climatological distributions, with shaded areas indicating the 50th–90th percentiles. Pre-storm (−10 d) and post-storm (+14 d) observations are shown as green (coastal) and orange (offshore) symbols, with circles indicating pre-storm and triangles indicating post-storm abundances. Red and black stars indicate transect-mean abundances before and after the storm, respectively. Post-storm communities were dominated by diatoms and cryptophytes.
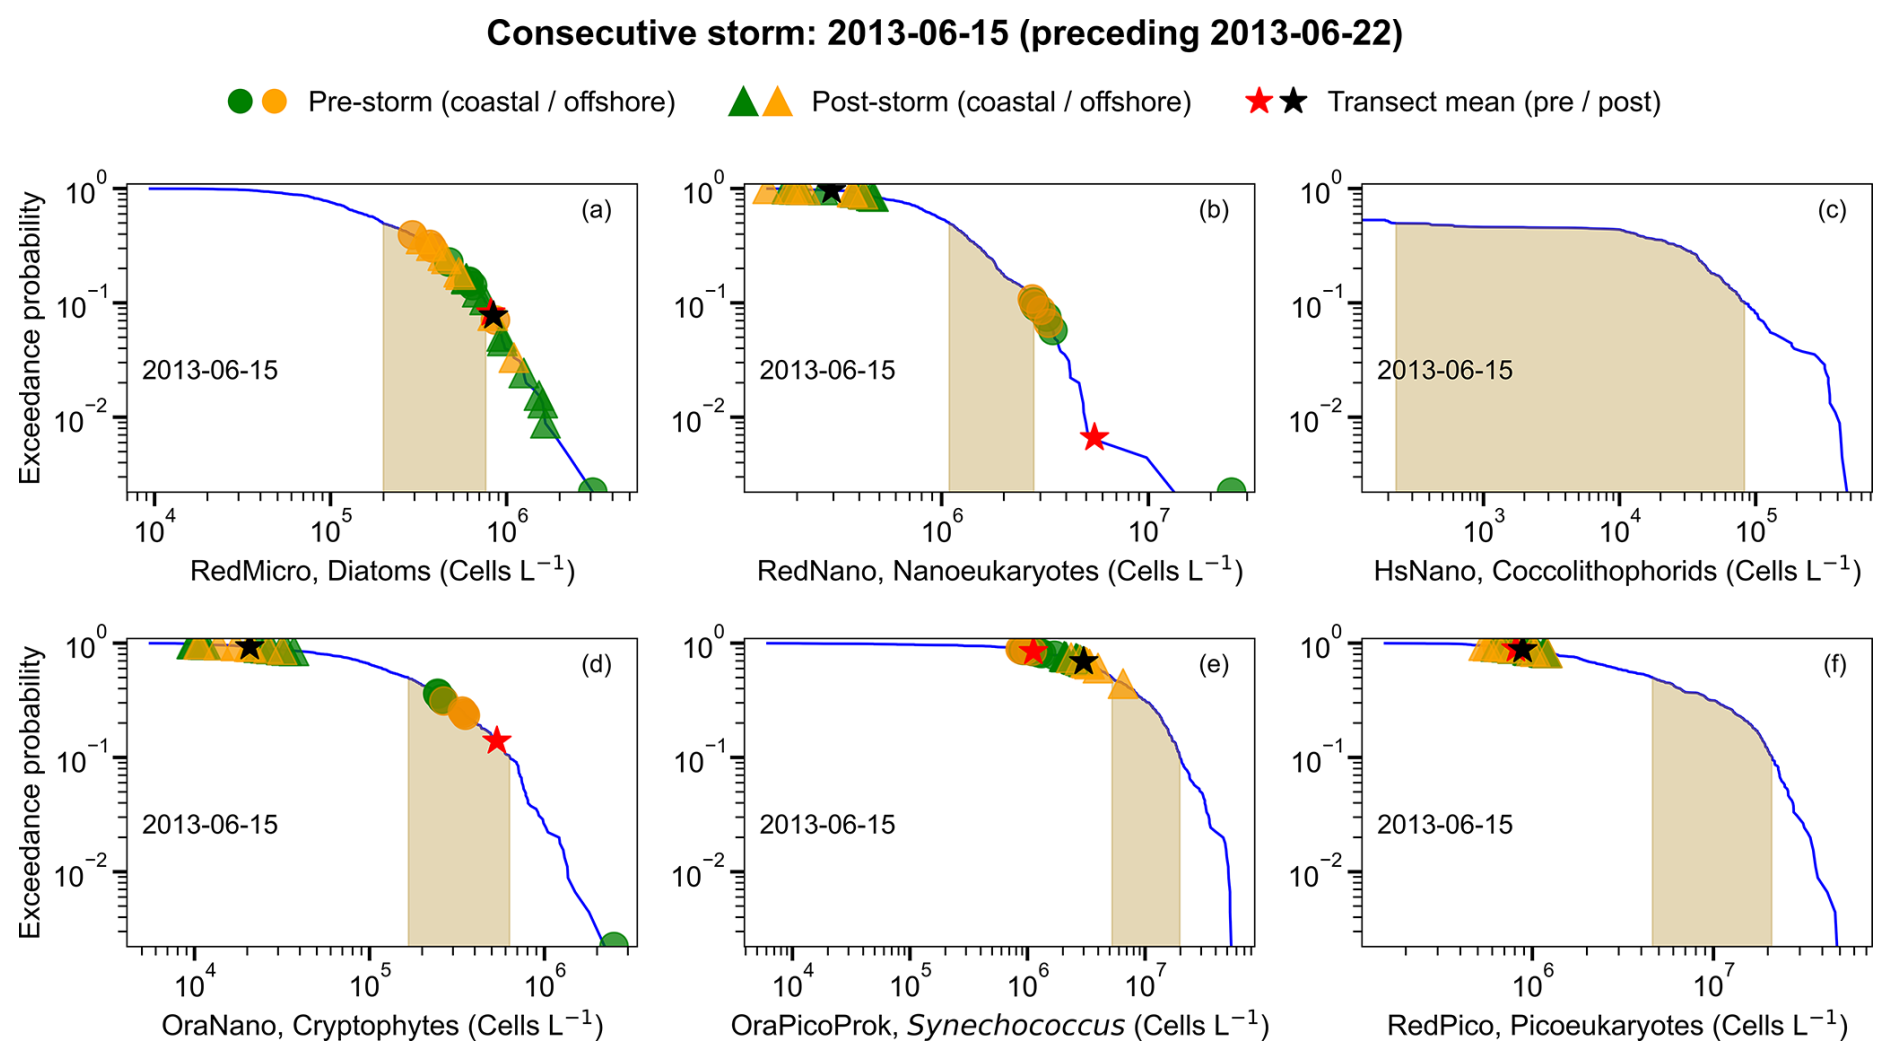
Figure F3Exceedance probability (CCDF) distributions of six phytoplankton groups (a–f) along the DYPHYRAD transect during the storm of 2013-06-15. For each panel, RedMicro (diatoms), RedNano (nanoeukaryotes), HsNano (coccolithophorids), OraNano (cryptophytes), OraPicoProk (Synechococcus), and RedPico (picoeukaryotes) are presented. Blue lines represent June–July climatological distributions, with shaded areas indicating the 50th–90th percentiles. Pre-storm (−10 d) and post-storm (+14 d) observations are shown as green (coastal) and orange (offshore) symbols, with circles indicating pre-storm and triangles indicating post-storm abundances. Red and black stars indicate transect-mean abundances before and after the storm, respectively. Post-storm communities were dominated by diatoms.
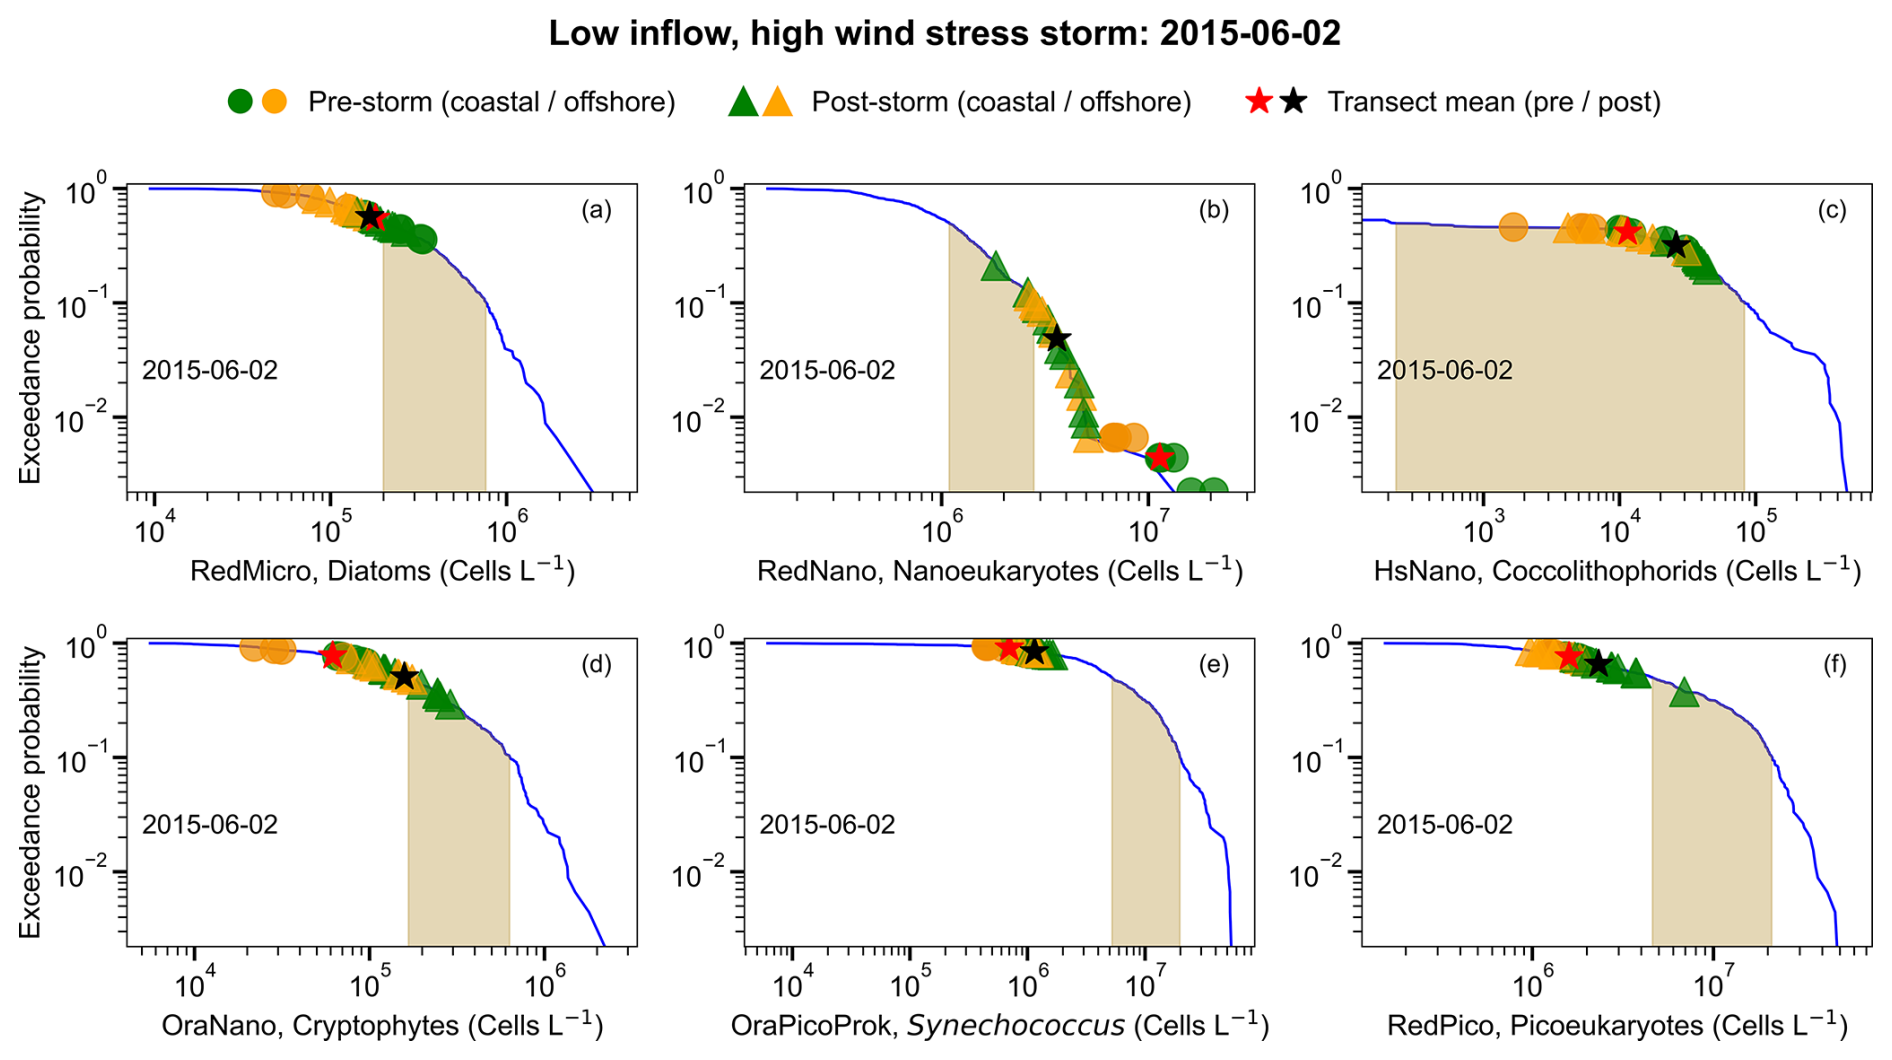
Figure F4Exceedance probability (CCDF) distributions of six phytoplankton groups (a–f) along the DYPHYRAD transect during the storm of 2 June 2015. For each panel, RedMicro (diatoms), RedNano (nanoeukaryotes), HsNano (coccolithophorids), OraNano (cryptophytes), OraPicoProk (Synechococcus), and RedPico (picoeukaryotes) are presented. Blue lines represent June–July climatological distributions, with shaded areas indicating the 50th–90th percentiles. Pre-storm (−10 d) and post-storm (+14 d) observations are shown as green (coastal) and orange (offshore) symbols, with circles indicating pre-storm and triangles indicating post-storm abundances. Red and black stars indicate transect-mean abundances before and after the storm, respectively. Post-storm communities were initially dominated by Phaeocystis globosa, before being replaced by nanophytoplankton.
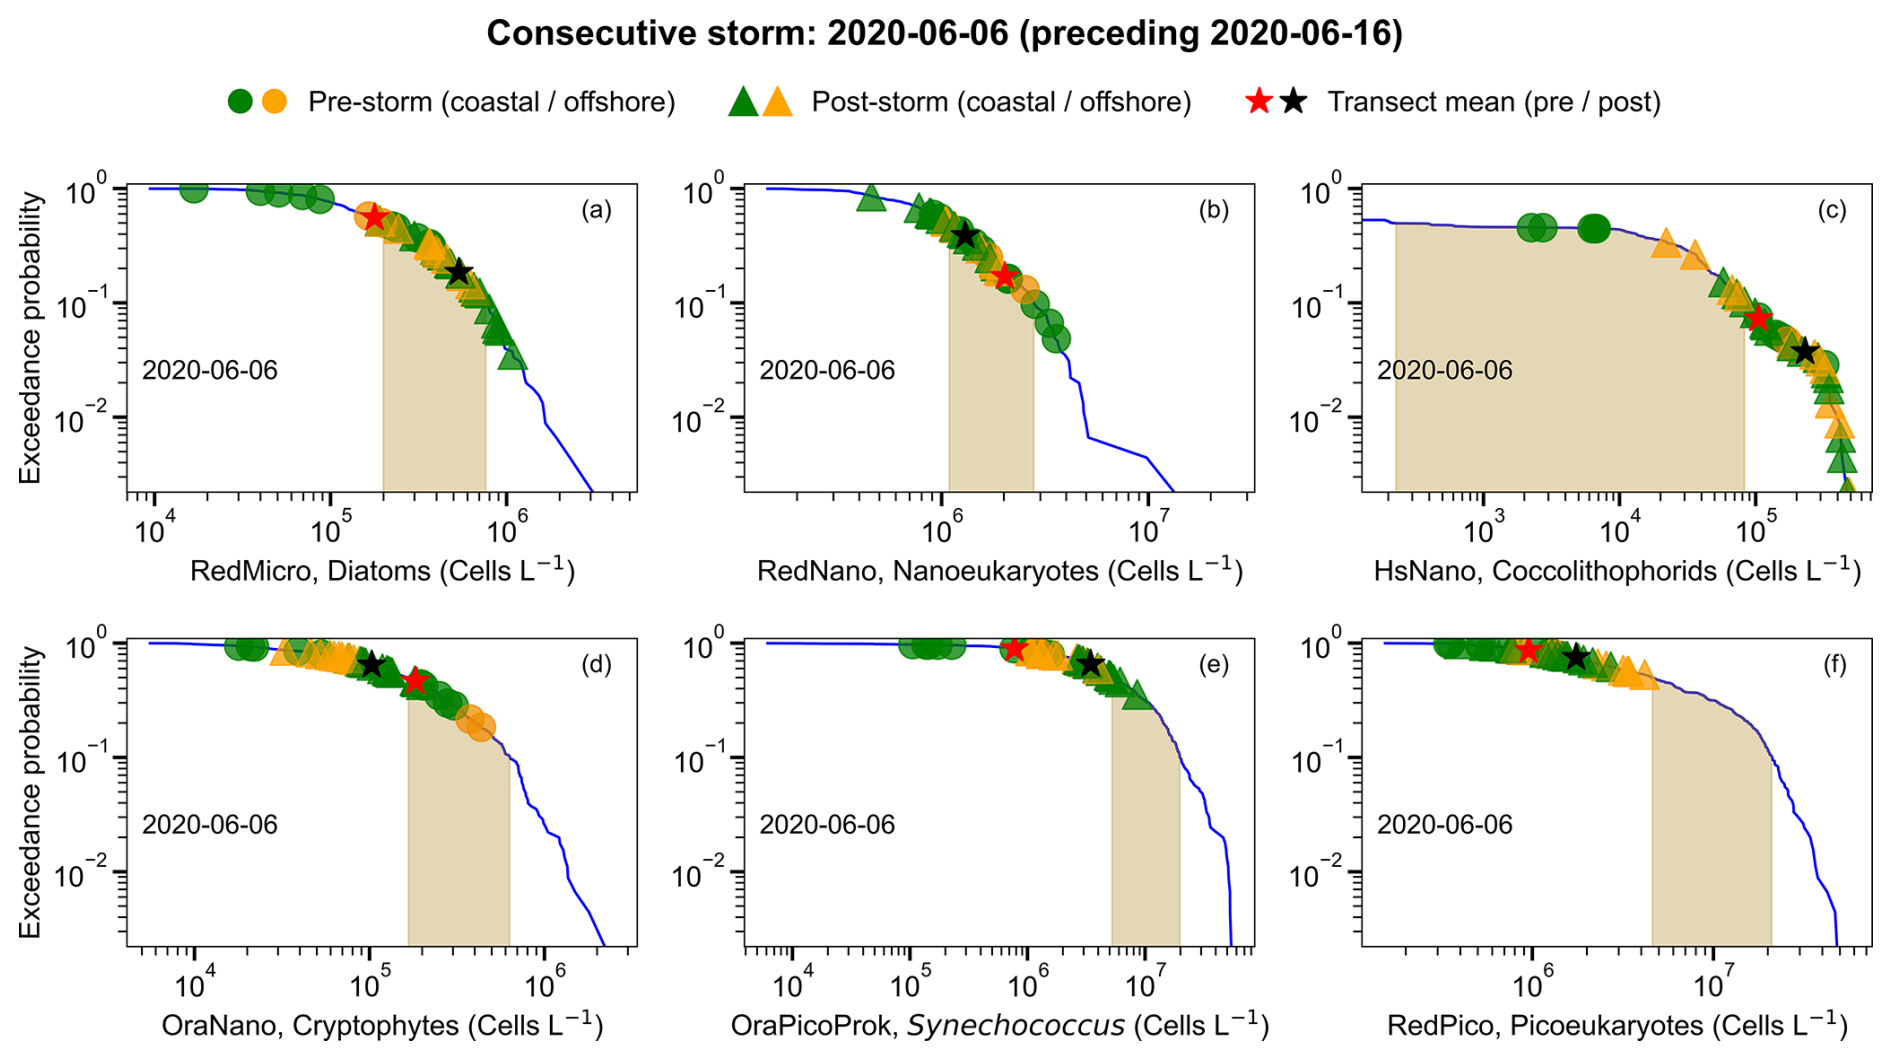
Figure F5Exceedance probability (CCDF) distributions of six phytoplankton groups (a–f) along the DYPHYRAD transect during the storm of 6 June 2020. For each panel, RedMicro (diatoms), RedNano (nanophytoplankton), HsNano (coccolithophorids), OraNano (cryptophytes), OraPicoProk (Synechococcus), and RedPico (picoeukaryotes) are presented. Blue lines represent June–July climatological distributions, with shaded areas indicating the 50th–90th percentiles. Pre-storm (−10 d) and post-storm (+14 d) observations are shown as green (coastal) and orange (offshore) symbols, with circles indicating pre-storm and triangles indicating post-storm abundances. Red and black stars indicate transect-mean abundances before and after the storm, respectively. The 6 June 2020 storm received additional precipitation and inflow on 16 June 2020 (not shown), supporting diatoms.
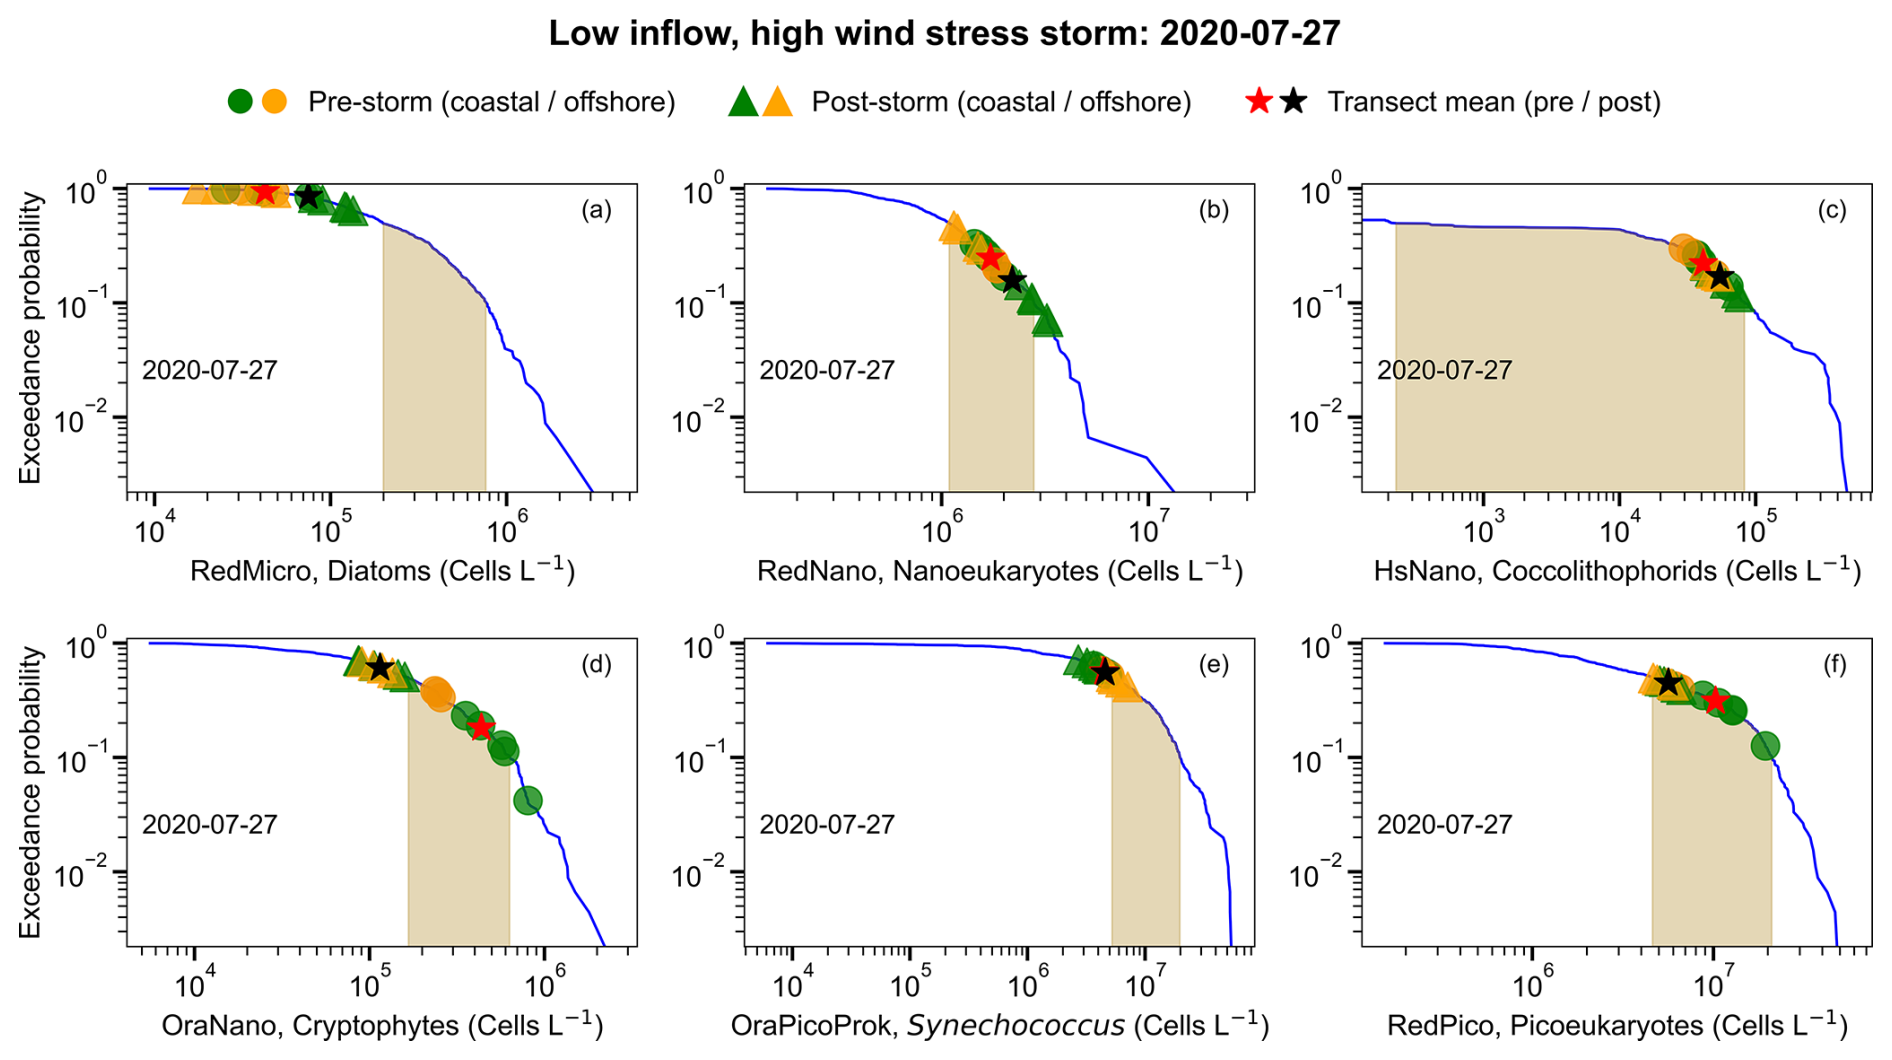
Figure F6Exceedance probability (CCDF) distributions of six phytoplankton groups (a–f) along the DYPHYRAD transect during the storm of 27 July 2020. For each panel, RedMicro (diatoms), RedNano (nanoeukaryotes), HsNano (coccolithophorids), OraNano (cryptophytes), OraPicoProk (Synechococcus), and RedPico (picoeukaryotes) are presented. Blue lines represent June–July climatological distributions, with shaded areas indicating the 50th–90th percentiles. Pre-storm (−10 d) and post-storm (+14 d) observations are shown as green (coastal) and orange (offshore) symbols, with circles indicating pre-storm and triangles indicating post-storm abundances. Red and black stars indicate transect-mean abundances before and after the storm, respectively. Post-storm communities showed increased nanoeukaryotes and a replacement of cryptophytes and picoeukaryotes in coastal waters.
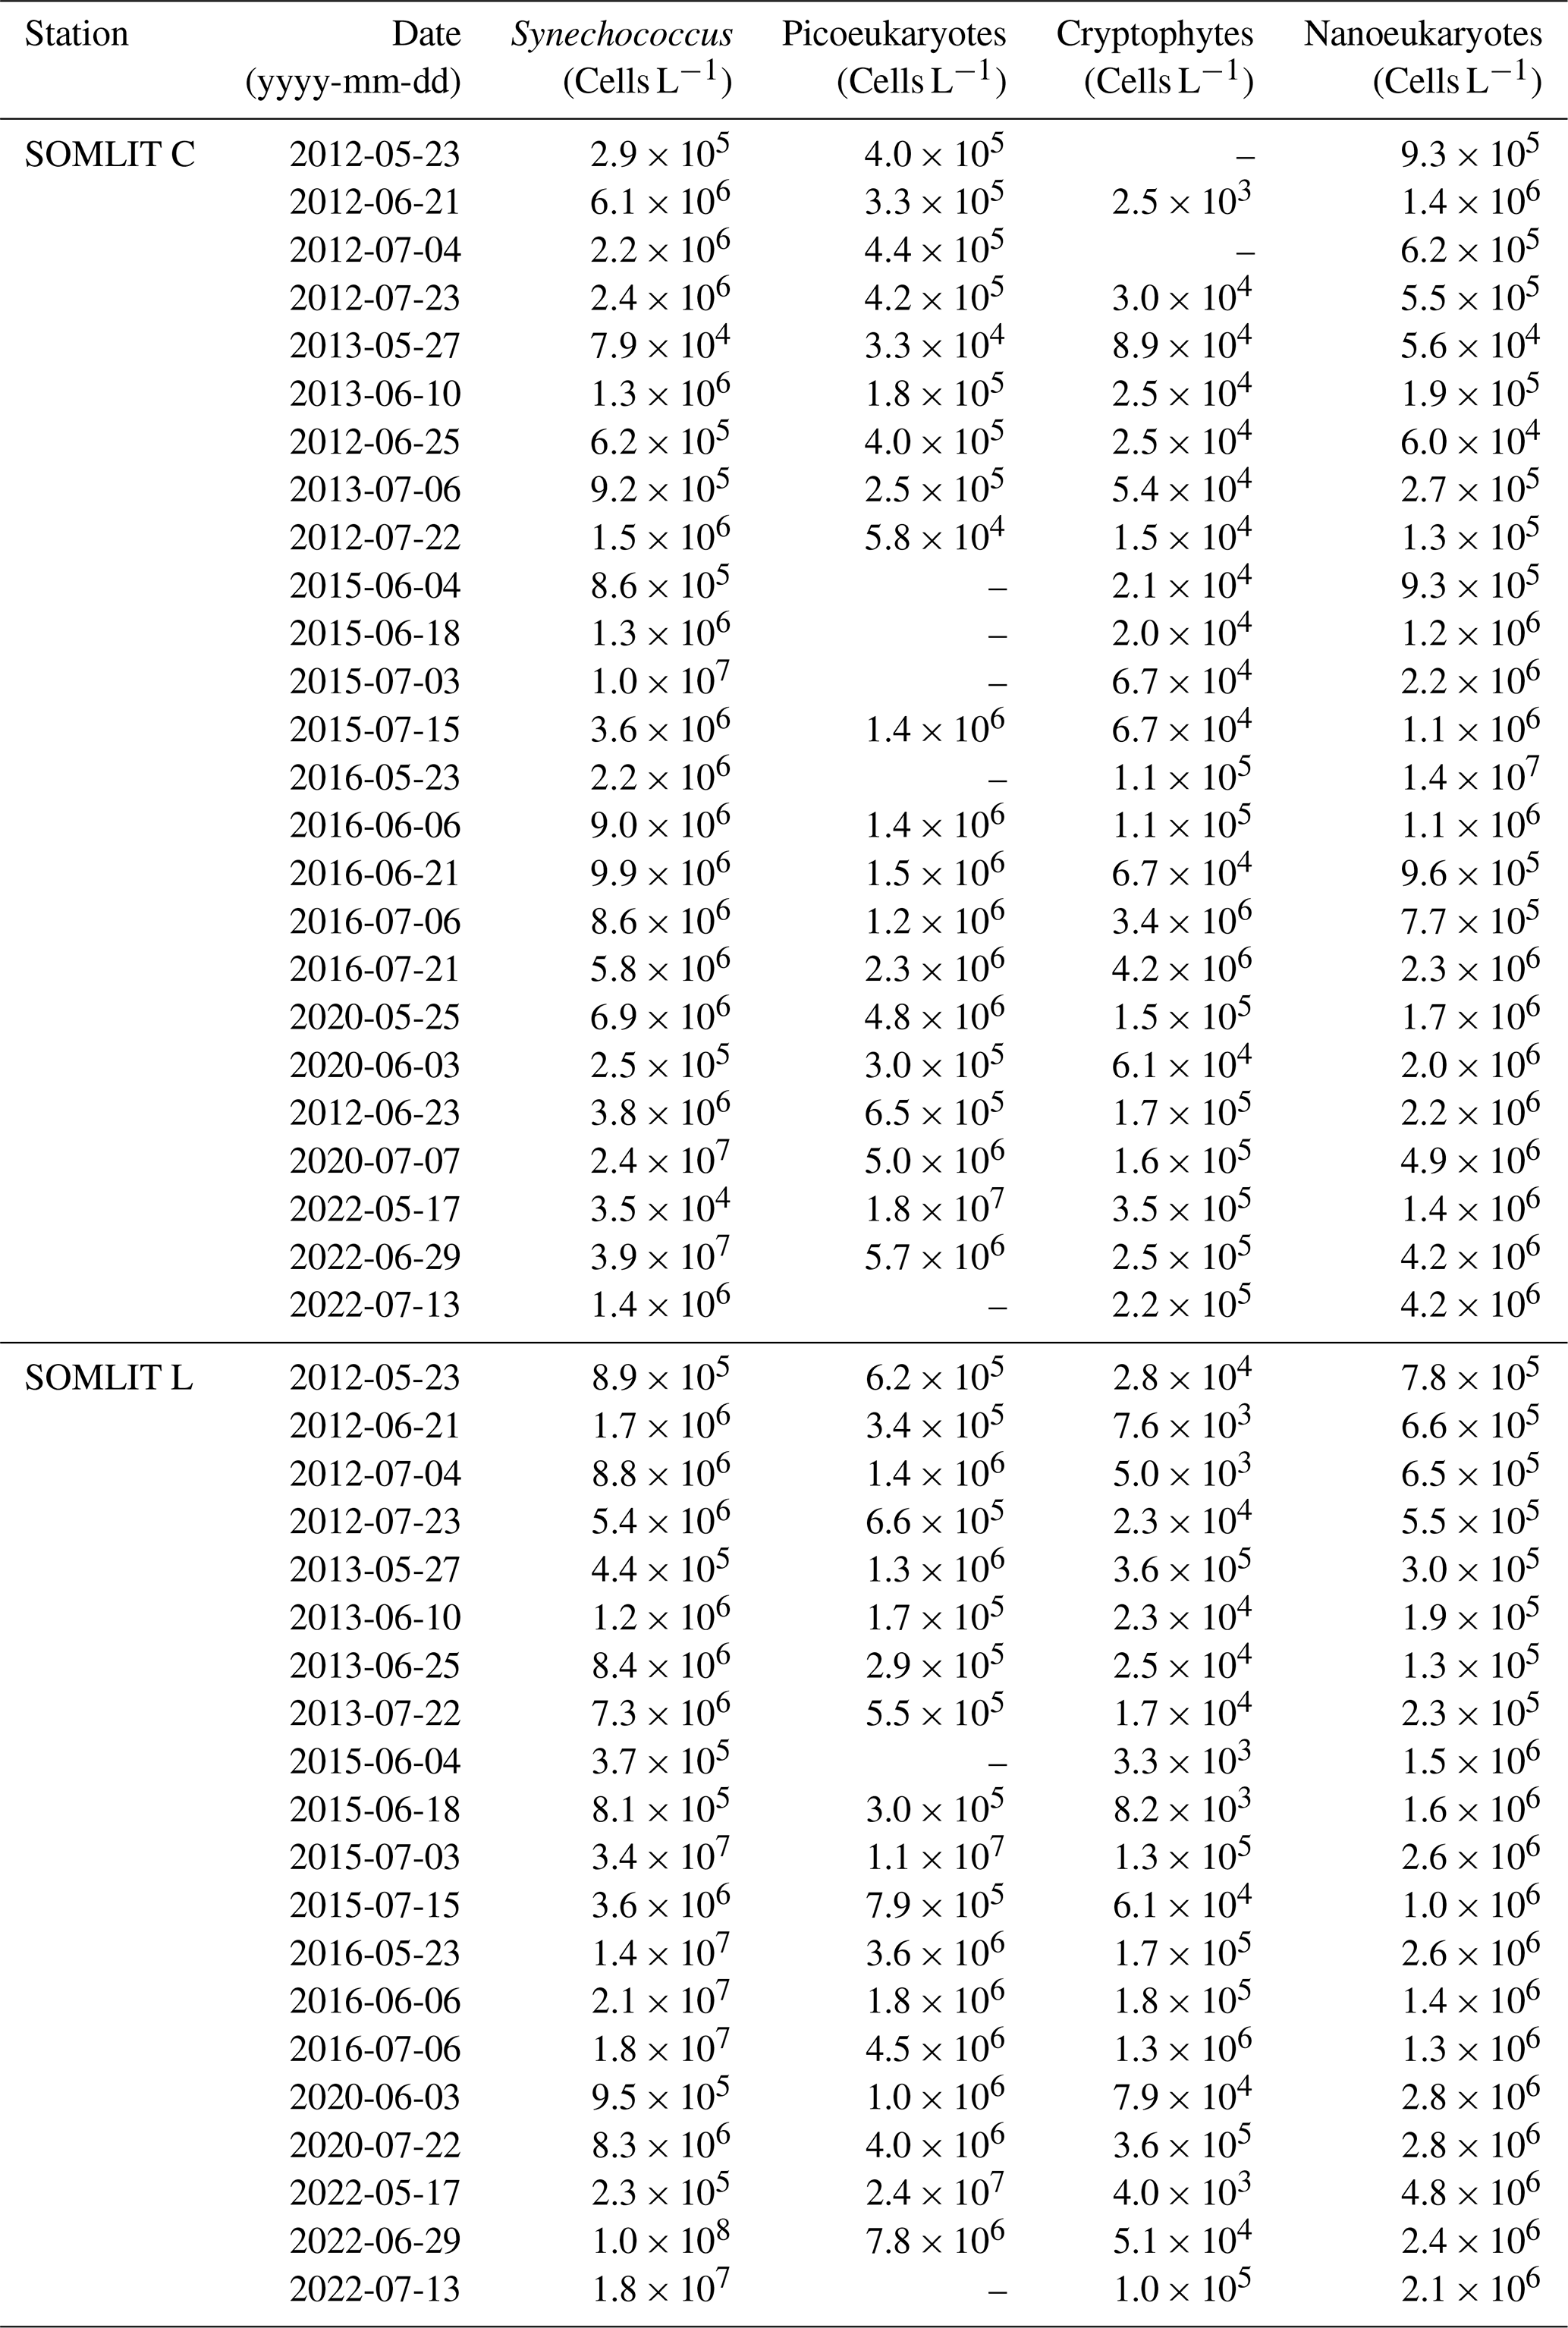
Table G1Results of distribution-wide (Anderson–Darling) and tail-exceedance tests used to characterize phytoplankton responses to storm events in the EEC. The Anderson–Darling test detects overall shifts in abundance distributions between pre- and post-storm samples, while the tail-exceedance test evaluates whether the frequency of extreme post-storm abundances (above the 90th percentile climatology) differs significantly from expectation (i.e., 90th percentile). Significant p-values (p<0.05) in bold indicate either a distributional shift or enrichment of extreme values.
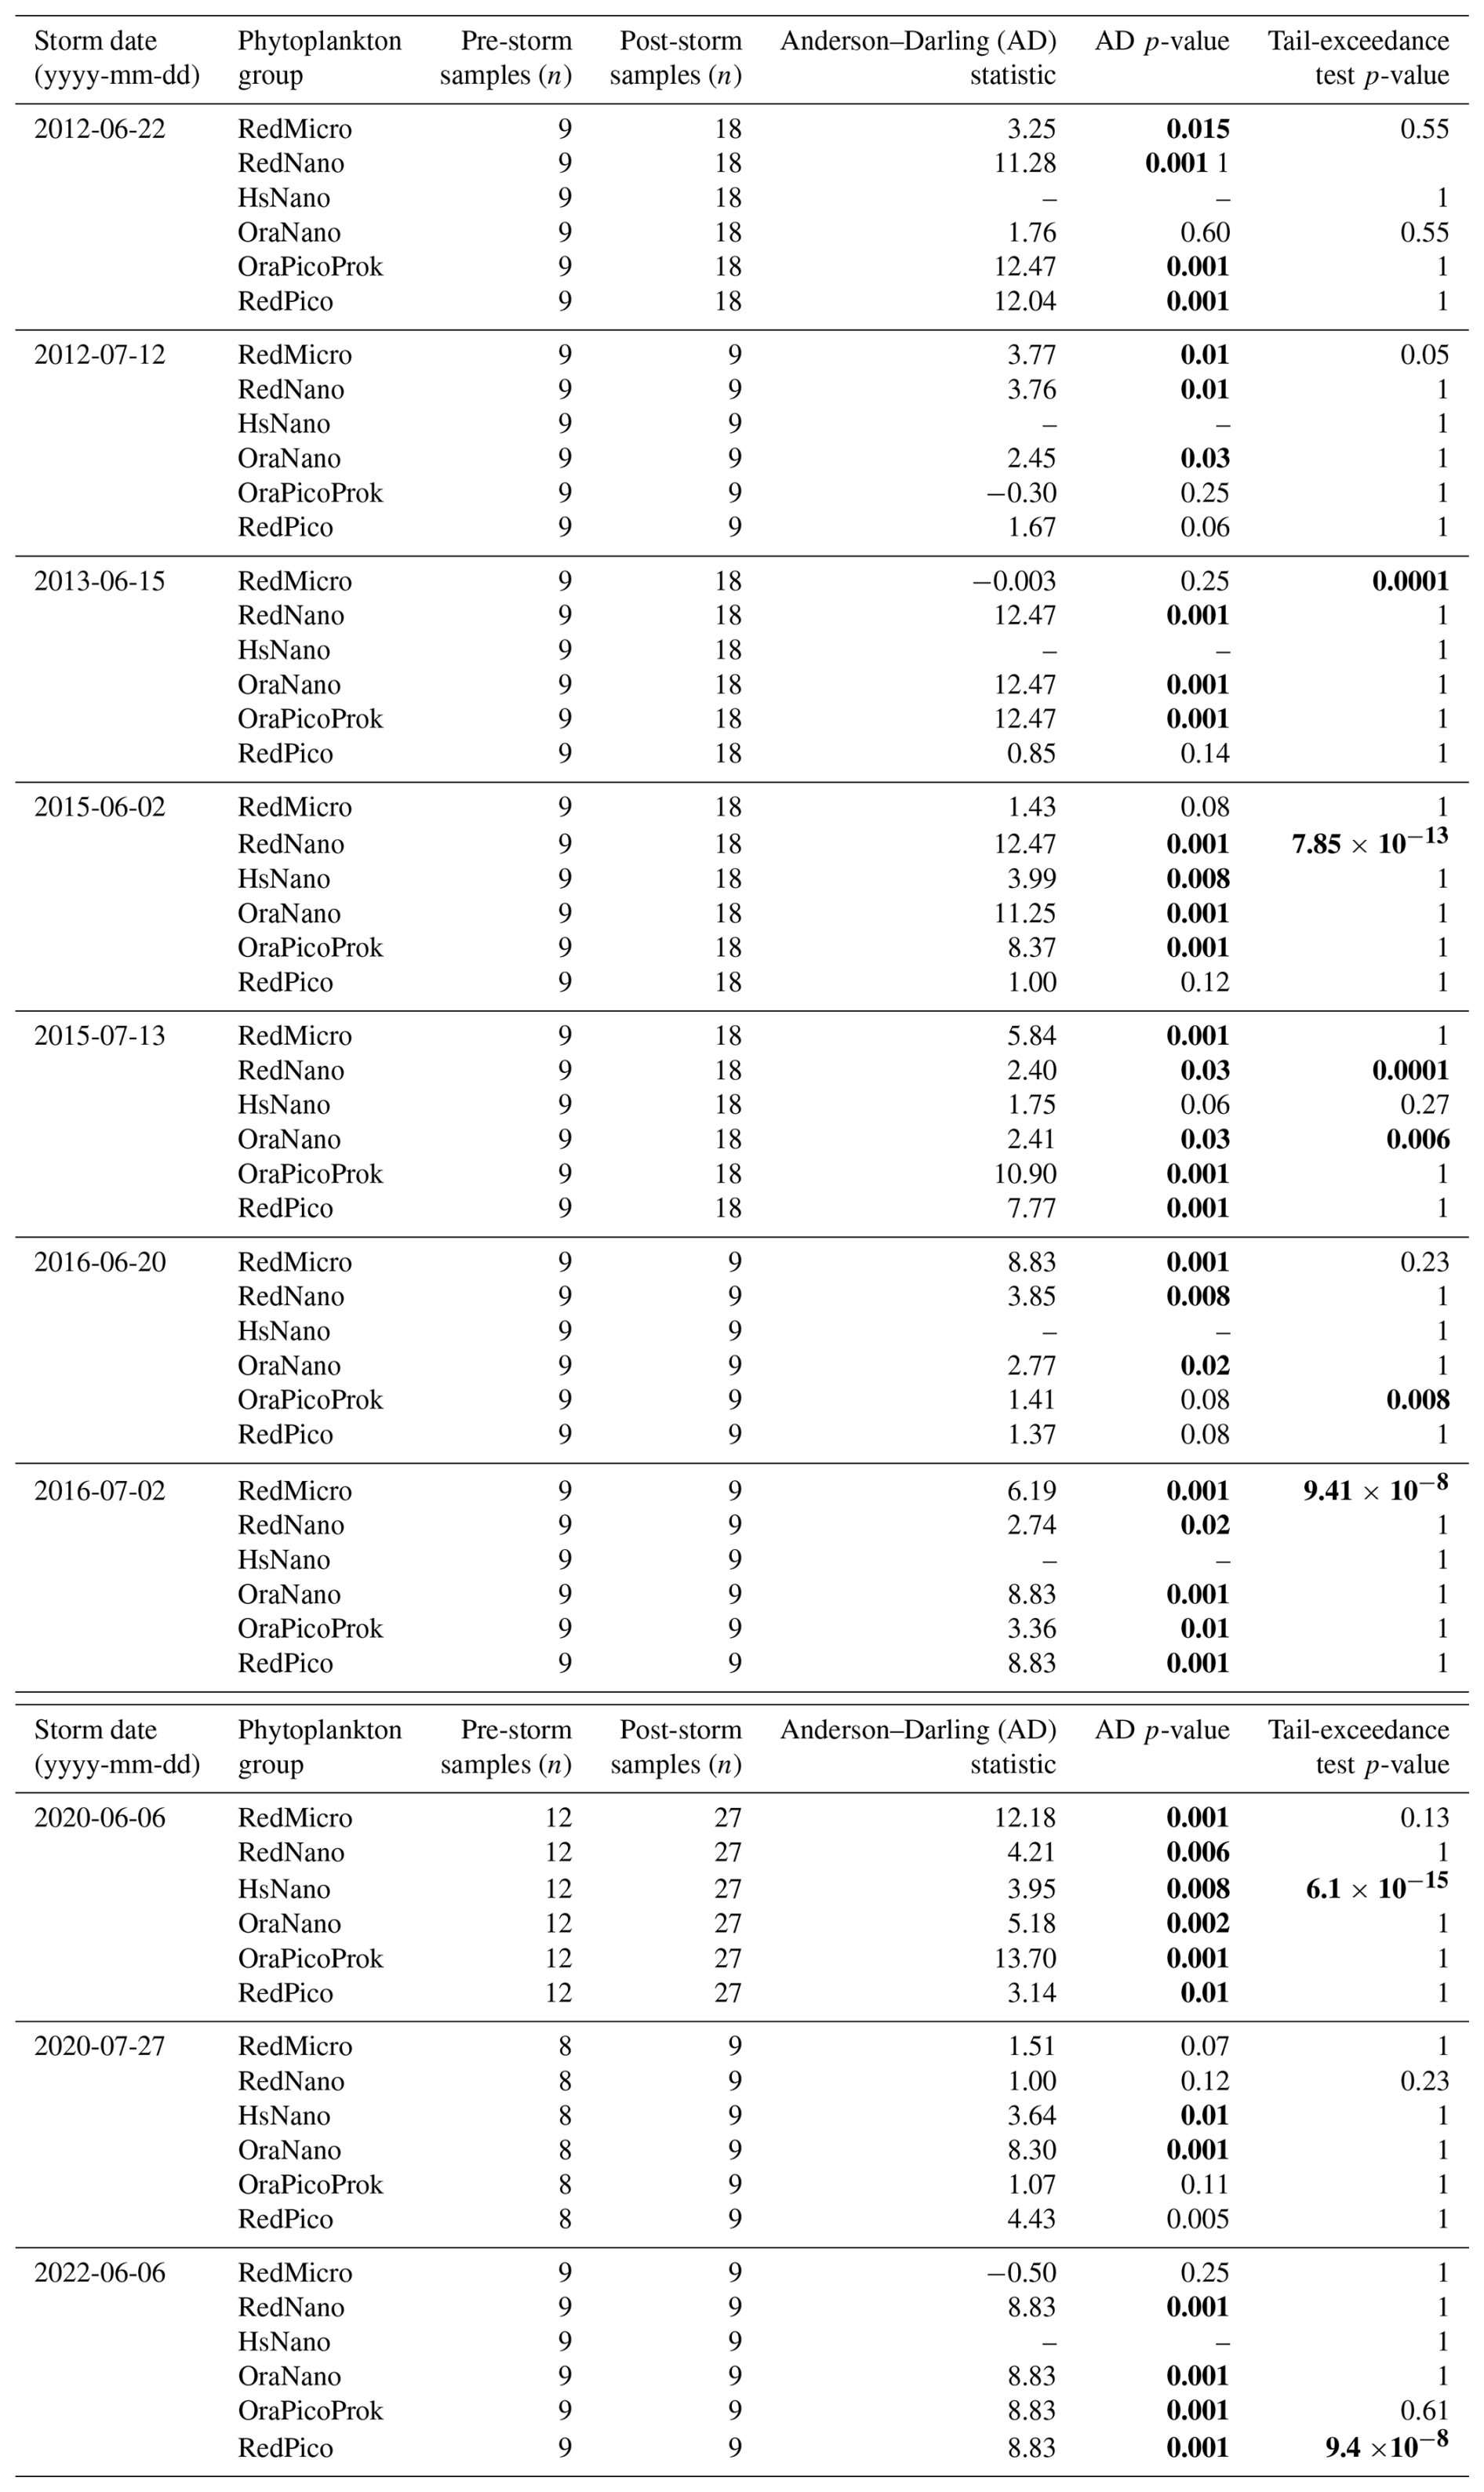
Table H1Dominant phytoplankton taxa identified in the EEC between 20 May and 10 August during storm years (2012, 2013, 2015, 2016, 2020, 2022). For each sampling date, the phytoplankton taxa with the highest cell abundance (Cells L−1) were selected from the PHYTOBS Boulogne and PHYTOBS C databases.
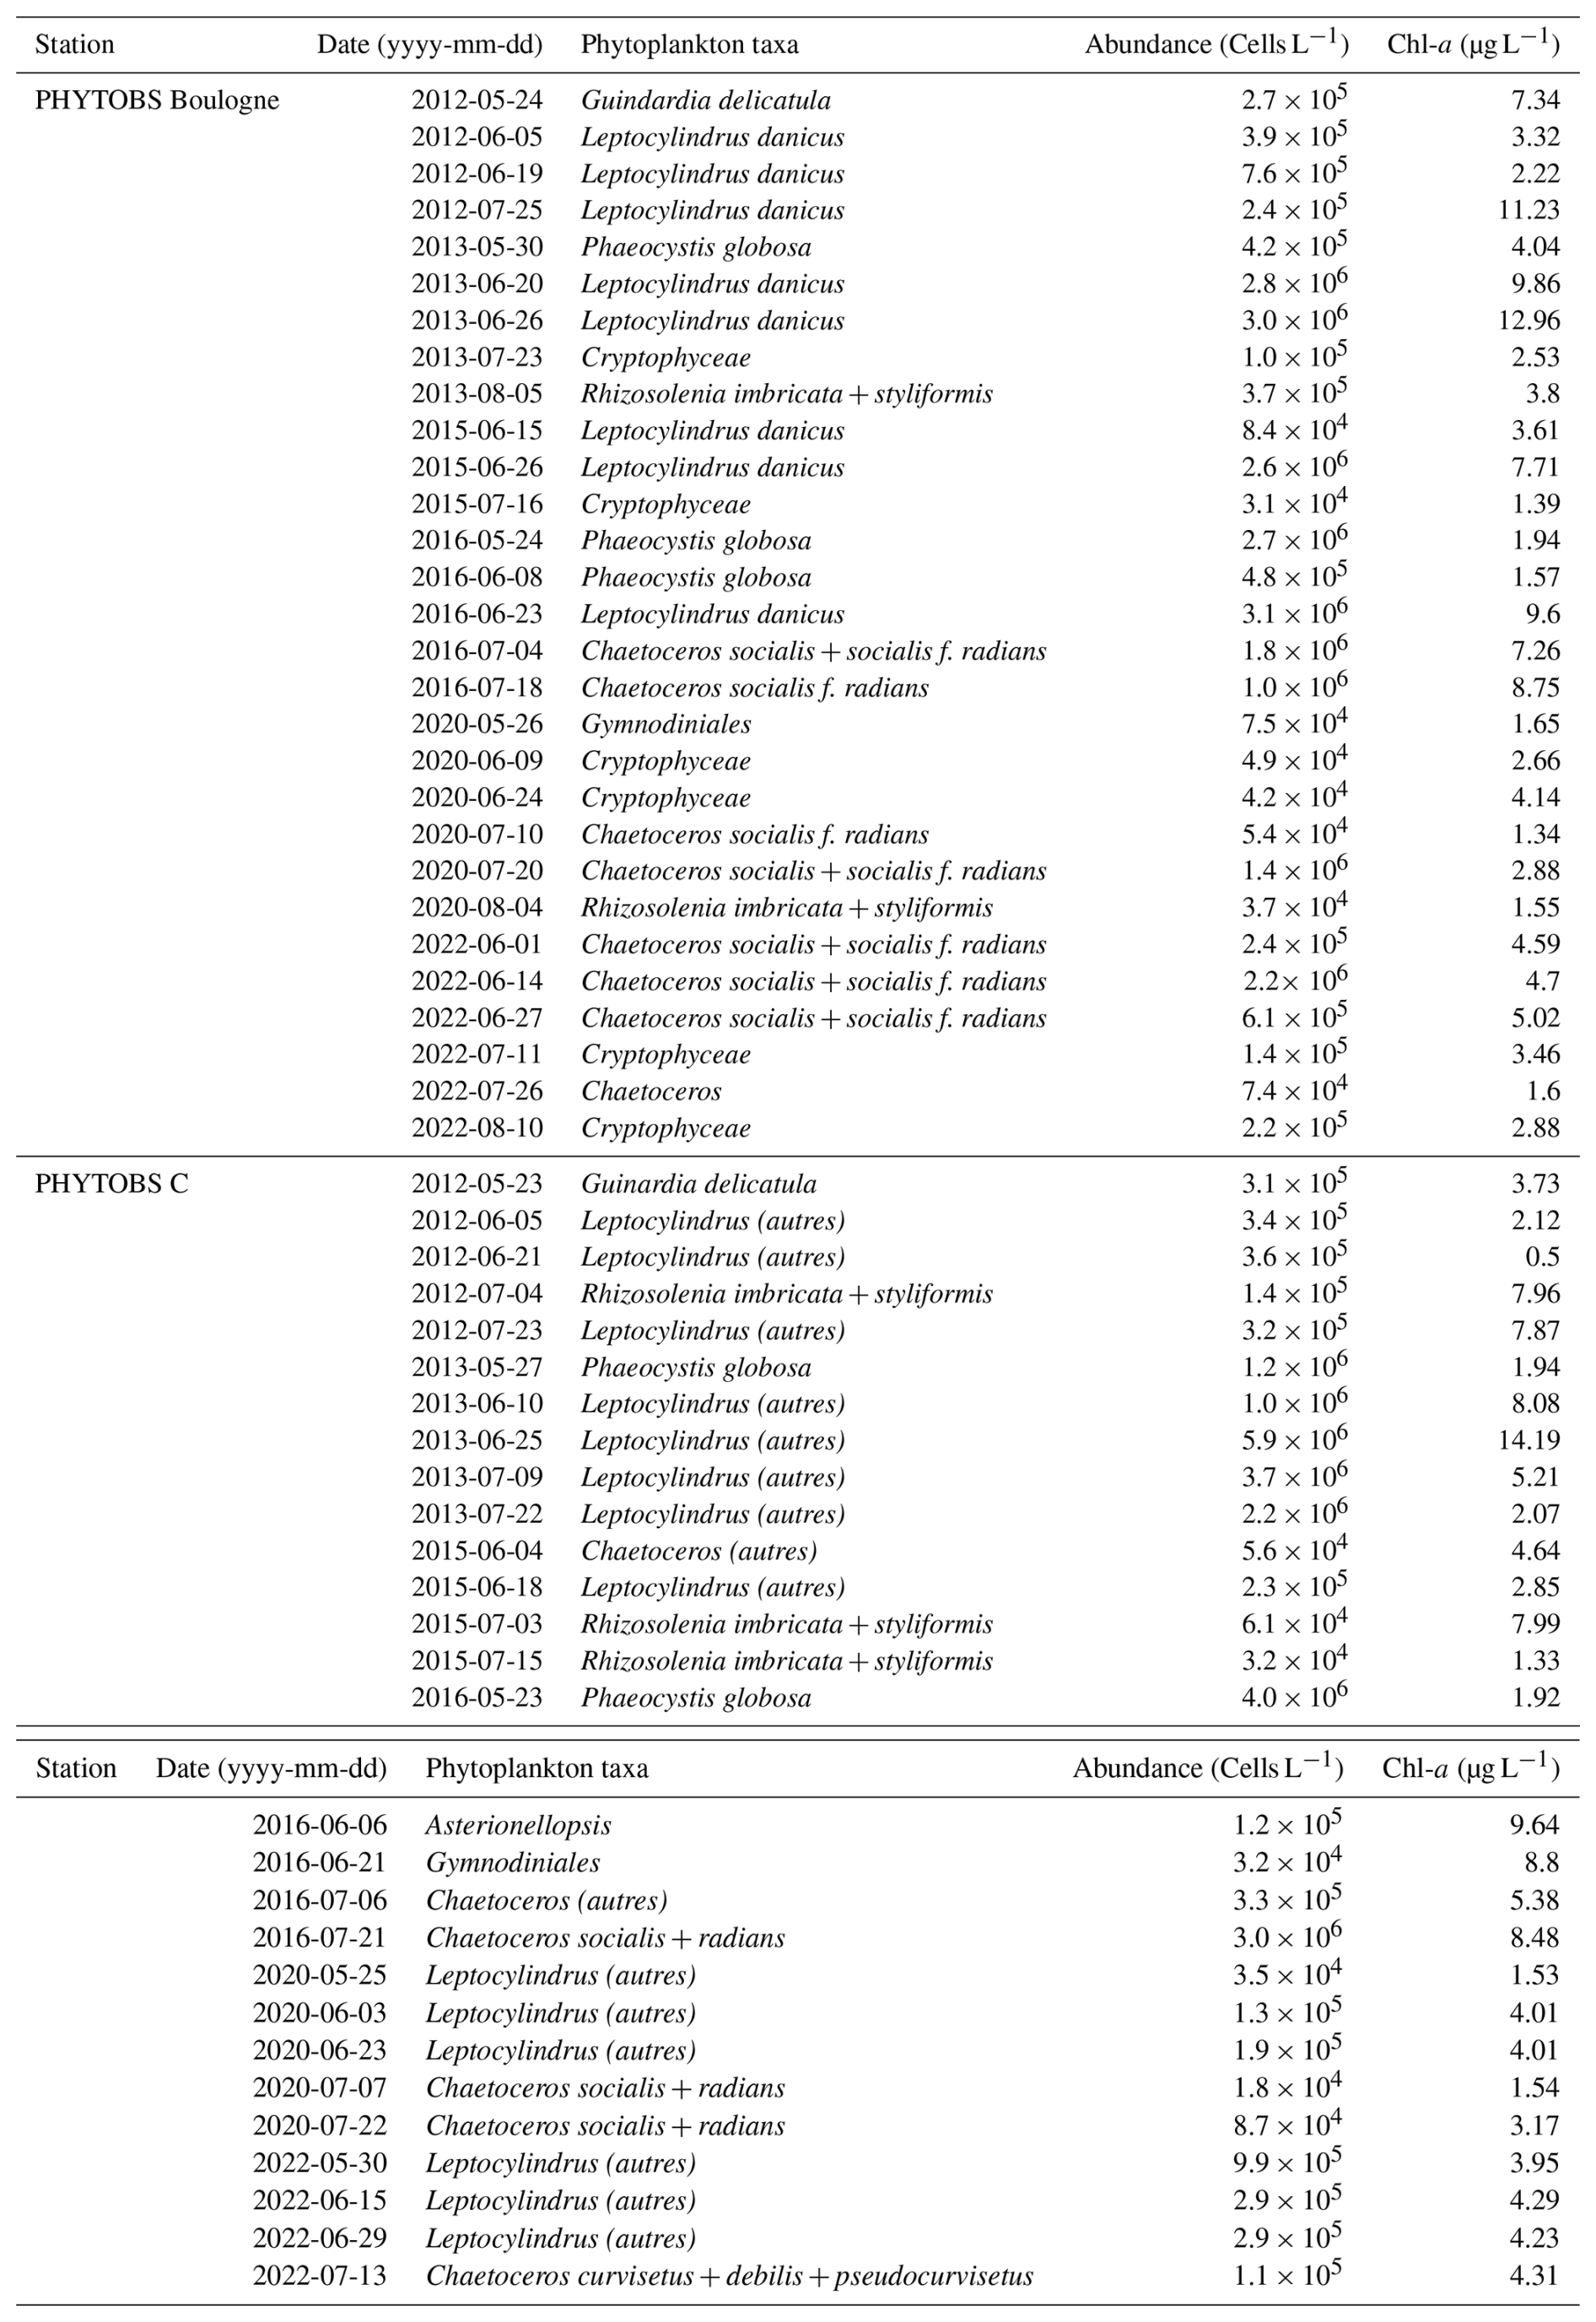
Table H2SOMLIT observations of phytoplankton functional groups at SOMLIT C and SOMLIT L between 20 May and 10 August. Data include Synechococcus, picoeukaryotes, cryptophytes, and nanoeukaryotes abundances (Cells L−1).
The cytometric and environmental datasets (https://doi.org/10.17882/104524, Hubert et al., 2025b), as well as phytoplankton abundance data from the SOMLIT (https://doi.org/10.17882/100323, Savoye et al., 2026) and PHYTOBS (https://doi.org/10.17882/85178, PHYTOBS, 2025) stations, are available through the SEANOE data repository. Meteorological data (wind speed, precipitation and direction) are provided by Météo-France and available at https://meteo.data.gouv.fr/ (last access: 7 September 2026). Hydrological data on freshwater inflow are accessible from Eau France at https://www.eaufrance.fr/ (last access: 7 September 2026).
This work was conceptualized by FGS, UC, and HC. LFA provided DYPHYRAD data HC performed the analysis and interpreted the results with input from FGS and UC. HC wrote the first draft with the help of UC and FGS. FGS and UC secured funding and supervised HC.
The contact author has declared that none of the authors has any competing interests.
Publisher's note: Copernicus Publications remains neutral with regard to jurisdictional claims made in the text, published maps, institutional affiliations, or any other geographical representation in this paper. The authors bear the ultimate responsibility for providing appropriate place names. Views expressed in the text are those of the authors and do not necessarily reflect the views of the publisher.
This article is part of the special issue “Special issue on ocean extremes (55th International Liège Colloquium)”. It is a result of the 55th International Liège Colloquium on Ocean Dynamics, Liège, Belgium, 27–30 May 2024.
The authors wish to thank the crew of the R/V Sepia II (CNRS INSU, French National Oceanographic Fleet), and Zeline Hubert for the DYPHYRAD automated flow cytometry database, collaborators and funders. Finally, we thank the French national observation network SOMLIT and PHYTOBS within the ILICO research infrastructure for providing additional phytoplankton and environment databases.
This research has been supported by the Région Hauts-de-France and Université du Littoral Côte d'Opale. This work is also supported by the graduate school IFSEA that benefits from French State funding operated by the French National Research Agency (ANR) under the France 2030 plan, as well as from the European Union's NextGenerationEU programme, under grant no. 21-EXES-0011.
This paper was edited by Aida Alvera-Azcárate and reviewed by two anonymous referees.
Allgeier, J. E., Rosemond, A. D., and Layman, C. A.: The frequency and magnitude of non‐additive responses to multiple nutrient enrichment, J. Appl. Ecol., 48, 96–101, https://doi.org/10.1111/j.1365-2664.2010.01894.x, 2011.
Alvarez, I., Pereira, H., Picado, A., Sousa, M. C., Lorenzo, M. N., and Dias, J. M.: Projection of Compound Wind and Precipitation Extreme Events in the Iberian Peninsula Based on CMIP6, Earth Syst. Environ., 8, 801–814, https://doi.org/10.1007/s41748-024-00429-6, 2024.
Aminot, A. and Kérouel, R.: Dissolved organic carbon, nitrogen and phosphorus in the N-E Atlantic and the N-W Mediterranean with particular reference to non-refractory fractions and degradation, Deep-Sea Res. Part I Oceanogr. Res. Pap., 51, 1975–1999, https://doi.org/10.1016/j.dsr.2004.07.016, 2004.
Babin, S. M., Carton, J. A., Dickey, T. D., and Wiggert, J. D.: Satellite evidence of hurricane‐induced phytoplankton blooms in an oceanic desert, J. Geophys. Res.: Oceans, 109, C03043, https://doi.org/10.1029/2003JC001938, 2004.
Barnes, M. K., Tilstone, G. H., Suggett, D. J., Widdicombe, C. E., Bruun, J., Martinez-Vicente, V., and Smyth, T. J.: Temporal variability in total, micro- and nano-phytoplankton primary production at a coastal site in the Western English Channel, Prog. Oceanogr., 137, 470–483, https://doi.org/10.1016/j.pocean.2015.04.017, 2015.
Barnett, M. L., Kemp, A. E. S., Hickman, A. E., and Purdie, D. A.: Shelf sea subsurface chlorophyll maximum thin layers have a distinct phytoplankton community structure, Cont. Shelf Res., 174, 140–157, https://doi.org/10.1016/j.csr.2018.12.007, 2019.
Barnett, M. L., Kemp, A. E. S., Hickman, A. E., and Purdie, D. A.: Environmental controls on the interannual variability in chlorophyll and phytoplankton community structure within the seasonal sub surface chlorophyll maximum in the western English channel, Cont. Shelf Res., 277, 105253, https://doi.org/10.1016/j.csr.2024.105253, 2024.
Bianucci, L., Balaguru, K., Smith, R. W., Leung, L. R., and Moriarty, J. M.: Contribution of hurricane-induced sediment resuspension to coastal oxygen dynamics, Sci. Rep., 8, 15740, https://doi.org/10.1038/s41598-018-33640-3, 2018.
Bonato, S., Christaki, U., Lefebvre, A., Lizon, F., Thyssen, M., and Artigas, L. F.: High spatial variability of phytoplankton assessed by flow cytometry, in a dynamic productive coastal area, in spring: The eastern English Channel, Estuar. Coast. Shelf Sci., 154, 214–223, https://doi.org/10.1016/j.ecss.2014.12.037, 2015.
Breton, E., Christaki, U., Sautour, B., Demonio, O., Skouroliakou, D.-I., Beaugrand, G., Seuront, L., Kléparski, L., Poquet, A., Nowaczyk, A., Crouvoisier, M., Ferreira, S., Pecqueur, D., Salmeron, C., Brylinski, J.-M., Lheureux, A., and Goberville, E.: Seasonal Variations in the Biodiversity, Ecological Strategy, and Specialization of Diatoms and Copepods in a Coastal System With Phaeocystis Blooms: The Key Role of Trait Trade-Offs, Front. Mar. Sci., 8, 656300, https://doi.org/10.3389/fmars.2021.656300, 2021.
Brunet, C., Brylinski, J. M., Bodineau, L., Thoumelin, G., Bentley, D., and Hilde, D.: Phytoplankton Dynamics During the Spring Bloom in the South-eastern English Channel, Estuar. Coast. Shelf Sci., 43, 469–483, https://doi.org/10.1006/ecss.1996.0082, 1996.
Brylinski, J. M., Lagadeuc, Y., Gentilhomme, V., Dupont, J. P., Lafite, R., Dupeuble, P. A., Huault, M. F., Auger, Y., Puskaric, E., Wartel, M., and Cabioch, L.: Le “fleuve côtier”: Un phénomène hydrologique important en Manche orientale. Exemple du Pas-de-Calais, Oceanol. Acta, 11, 197–203, 1991.
Brylinski, J. M., Brunet, C., Bentley, D., Thoumelin, G., and Hilde, D.: Hydrography and Phytoplankton Biomass in the Eastern English Channel in Spring 1992, Estuar. Coast. Shelf Sci., 43, 507–519, https://doi.org/10.1006/ecss.1996.0084, 1996.
Carpenter, S. R., Gahler, M. R., Kucharik, C. J., and Stanley, E. H.: Long-range dependence and extreme values of precipitation, phosphorus load, and Cyanobacteria, Proc. Natl. Acad. Sci. USA., 119, e2214343119, https://doi.org/10.1073/pnas.2214343119, 2022.
Cook, E. R., Seager, R., Kushnir, Y., Briffa, K. R., Büntgen, U., Frank, D., Krusic, P. J., Tegel, W., Van Der Schrier, G., Andreu-Hayles, L., Baillie, M., Baittinger, C., Bleicher, N., Bonde, N., Brown, D., Carrer, M., Cooper, R., Čufar, K., Dittmar, C., Esper, J., Griggs, C., Gunnarson, B., Günther, B., Gutierrez, E., Haneca, K., Helama, S., Herzig, F., Heussner, K.-U., Hofmann, J., Janda, P., Kontic, R., Köse, N., Kyncl, T., Levanič, T., Linderholm, H., Manning, S., Melvin, T. M., Miles, D., Neuwirth, B., Nicolussi, K., Nola, P., Panayotov, M., Popa, I., Rothe, A., Seftigen, K., Seim, A., Svarva, H., Svoboda, M., Thun, T., Timonen, M., Touchan, R., Trotsiuk, V., Trouet, V., Walder, F., Ważny, T., Wilson, R., and Zang, C.: Old World megadroughts and pluvials during the Common Era, Sci. Adv., 1, e1500561, https://doi.org/10.1126/sciadv.1500561, 2015.
Crawford, A. D., Krumhardt, K. M., Lovenduski, N. S., Van Dijken, G. L., and Arrigo, K. R.: Summer High‐Wind Events and Phytoplankton Productivity in the Arctic Ocean, J. Geophys. Res.: Oceans, 125, e2020JC016565, https://doi.org/10.1029/2020JC016565, 2020.
Crawford, A. D., McCrystall, M. R., Lukovich, J. V., and Stroeve, J. C.: The Response of Extratropical Cyclone Propagation in the Northern Hemisphere to Global Warming, J. Climate, 36, 7123–7142, https://doi.org/10.1175/JCLI-D-23-0082.1, 2023.
Derot, J., Schmitt, F. G., Gentilhomme, V., and Zongo, S. B.: Long-term high frequency phytoplankton dynamics, recorded from a coastal water autonomous measurement system in the eastern English Channel, Cont. Shelf Res., 109, 210–221, https://doi.org/10.1016/j.csr.2015.09.015, 2015.
Dietze, M., Bell, R., Ozturk, U., Cook, K. L., Andermann, C., Beer, A. R., Damm, B., Lucia, A., Fauer, F. S., Nissen, K. M., Sieg, T., and Thieken, A. H.: More than heavy rain turning into fast-flowing water – a landscape perspective on the 2021 Eifel floods, Nat. Hazards Earth Syst. Sci., 22, 1845–1856, https://doi.org/10.5194/nhess-22-1845-2022, 2022.
Dulière, V., Gypens, N., Lancelot, C., Luyten, P., and Lacroix, G.: Origin of nitrogen in the English Channel and Southern Bight of the North Sea ecosystems, Hydrobiologia, 845, 13–33, https://doi.org/10.1007/s10750-017-3419-5, 2019.
Fettweis, M., Schartau, M., Desmit, X., Lee, B. J., Terseleer, N., Van Der Zande, D., Parmentier, K., and Riethmüller, R.: Organic Matter Composition of Biomineral Flocs and Its Influence on Suspended Particulate Matter Dynamics Along a Nearshore to Offshore Transect, JGR Biogeosciences, 127, e2021JG006332, https://doi.org/10.1029/2021JG006332, 2022.
Francis, J. A., Skific, N., and Vavrus, S. J.: Increased persistence of large-scale circulation regimes over Asia in the era of amplified Arctic warming, past and future, Sci. Rep., 10, 14953, https://doi.org/10.1038/s41598-020-71945-4, 2020.
Gieskes, W. W. C., Leterme, S. C., Peletier, H., Edwards, M., and Reid, P. C.: Phaeocystis colony distribution in the North Atlantic Ocean since 1948, and interpretation of long-term changes in the Phaeocystis hotspot in the North Sea, Biogeochemistry, 83, 49–60, https://doi.org/10.1007/s10533-007-9082-6, 2007.
Gronholz, A., Gräwe, U., Paul, A., and Schulz, M.: Investigating the effects of a summer storm on the North Sea stratification using a regional coupled ocean-atmosphere model, Ocean Dyn., 67, 211–235, https://doi.org/10.1007/s10236-016-1023-2, 2017.
Guinaldo, T., Voldoire, A., Waldman, R., Saux Picart, S., and Roquet, H.: Response of the sea surface temperature to heatwaves during the France 2022 meteorological summer, Ocean Sci., 19, 629–647, https://doi.org/10.5194/os-19-629-2023, 2023.
Helton, J. C.: Uncertainty and sensitivity analysis in the presence of stochastic and subjective uncertainty, J. Stat. Comput. Simul., 57, 3–76, https://doi.org/10.1080/00949659708811803, 1997.
Houliez, E., Schmitt, F. G., Breton, E., Skouroliakou, D.-I., and Christaki, U.: On the conditions promoting Pseudo-nitzschia spp. blooms in the eastern English Channel and southern North Sea, Harmful Algae, 125, 102424, https://doi.org/10.1016/j.hal.2023.102424, 2023.
Hubert, Z., Louchart, A. P., Robache, K., Epinoux, A., Gallot, C., Cornille, V., Crouvoisier, M., Monchy, S., and Artigas, L. F.: Decadal changes in phytoplankton functional composition in the Eastern English Channel: possible upcoming major effects of climate change, Ocean Sci., 21, 679–700, https://doi.org/10.5194/os-21-679-2025, 2025a.
Hubert, Z., Libeau, A., Gallot, C., and Artigas, L. F.: Dynamics of phytoplankton on RADiale of the Saint-Jean Bay (DYPHYRAD) surveys, SEANOE [data set], https://doi.org/10.17882/104524, 2025b.
Hubert, Z., Libeau, A., Gallot, C., Cornille, V., Crouvoisier, M., Lécuyer, É., and Artigas, L. F.: Phytoplankton coastal-offshore monitoring by the Strait of Dover at high spatial resolution: the DYPHYRAD surveys, Earth Syst. Sci. Data, 18, 1877–1903, https://doi.org/10.5194/essd-18-1877-2026, 2026.
Huguet, A., Barillé, L., Soudant, D., Petitgas, P., Gohin, F., and Lefebvre, A.: Identifying the spatial pattern and the drivers of the decline in the eastern English Channel chlorophyll-a surface concentration over the last two decades, Mar. Pollut. Bull., 199, 115870, https://doi.org/10.1016/j.marpolbul.2023.115870, 2024.
Jacobsen, B. A. and Simonsen, P.: Disturbance events affecting phytoplankton biomass, composition and species diversity in a shallow, eutrophic, temperate lake, Hydrobiologia, 249, 9–14, https://doi.org/10.1007/BF00008838, 1993.
James, C. C., Barton, A. D., Allen, L. Z., Lampe, R. H., Rabines, A., Schulberg, A., Zheng, H., Goericke, R., Goodwin, K. D., and Allen, A. E.: Influence of nutrient supply on plankton microbiome biodiversity and distribution in a coastal upwelling region, Nat. Commun., 13, 2448, https://doi.org/10.1038/s41467-022-30139-4, 2022.
Jena, B., Swain, D., and Avinash, K.: Investigation of the biophysical processes over the oligotrophic waters of South Indian Ocean subtropical gyre, triggered by cyclone Edzani, Int. J. Appl. Earth Obs. Geoinf., 18, 49–56, https://doi.org/10.1016/j.jag.2012.01.006, 2012.
Jennings, E., Jones, S., Arvola, L., Staehr, P. A., Gaiser, E., Jones, I. D., Weathers, K. C., Weyhenmeyer, G. A., Chiu, C., and De Eyto, E.: Effects of weather‐related episodic events in lakes: an analysis based on high‐frequency data, Freshw. Biol., 57, 589–601, https://doi.org/10.1111/j.1365-2427.2011.02729.x, 2012.
Kaspi, Y. and Schneider, T.: The Role of Stationary Eddies in Shaping Midlatitude Storm Tracks, J. Atmos. Sci., 70, 2596–2613, https://doi.org/10.1175/JAS-D-12-082.1, 2013.
Kasprzak, P., Shatwell, T., Gessner, M. O., Gonsiorczyk, T., Kirillin, G., Selmeczy, G., Padisák, J., and Engelhardt, C.: Extreme Weather Event Triggers Cascade Towards Extreme Turbidity in a Clear-water Lake, Ecosystems, 20, 1407–1420, https://doi.org/10.1007/s10021-017-0121-4, 2017.
Kuczynska, P., Jemiola-Rzeminska, M., and Strzalka, K.: Photosynthetic Pigments in Diatoms, Mar. Drugs, 13, 5847–5881, https://doi.org/10.3390/md13095847, 2015.
Lamy, D., Obernosterer, I., Laghdass, M., Artigas, F., Breton, E., Grattepanche, J., Lecuyer, E., Degros, N., Lebaron, P., and Christaki, U.: Temporal changes of major bacterial groups and bacterial heterotrophic activity during a Phaeocystis globosa bloom in the eastern English Channel, Aquat. Microb. Ecol., 58, 95–107, https://doi.org/10.3354/ame01359, 2009.
Lefebvre, A., Guiselin, N., Barbet, F., and Artigas, F. L.: Long-term hydrological and phytoplankton monitoring (1992–2007) of three potentially eutrophic systems in the eastern English Channel and the Southern Bight of the North Sea, ICES J. Mar. Sci., 68, 2029–2043, https://doi.org/10.1093/icesjms/fsr149, 2011.
Levasseur, S., De Melo, V. W., Lambers, J. H., Klausmeier, C. A., Kremer, C. T., Litchman, E., Reyes, M., Thomas, M. K., and Narwani, A.: Warm‐Loving Species Perform Well Under Limiting Resources: Trait Combinations for Future Climate, Glob. Change Biol., 31, e70554, https://doi.org/10.1111/gcb.70554, 2025.
Litchman, E., Klausmeier, C. A., and Yoshiyama, K.: Contrasting size evolution in marine and freshwater diatoms, Proc. Natl. Acad. Sci. USA, 106, 2665–2670, https://doi.org/10.1073/pnas.0810891106, 2009.
Loquet, N., Rybarczyk, H., and Elkaim, B.: Échanges de sels nutritifs entre la zone côtière et un système estuarien intertidal : la baie de Somme (Manche, France), Oceanol. Acta, https://doi.org/10.1016/S0399-1784(00)00117-1, 2000.
Lorenzen, C. J.: A method for the continuous measurement of in vivo chlorophyll concentration, Deep-Sea Res. Oceanogr. Abstr., 13, 223–227, https://doi.org/10.1016/0011-7471(66)91102-8, 1966.
Margalef, R.: Life-forms of phytoplankton as survival alternatives in an unstable environment, Oceanol. Acta, 4, 493–509, 1978.
Napoléon, C., Fiant, L., Raimbault, V., Riou, P., and Claquin, P.: Dynamics of phytoplankton diversity structure and primary productivity in the English Channel, Mar. Ecol. Prog. Ser., 505, 49–64, https://doi.org/10.3354/meps10772, 2014.
Pfleiderer, P., Schleussner, C.-F., Kornhuber, K., and Coumou, D.: Summer weather becomes more persistent in a 2 °C world, Nat. Clim. Chang., 9, 666–671, https://doi.org/10.1038/s41558-019-0555-0, 2019.
PHYTOBS: PHYTOBS dataset - French National Service of Observation for Phytoplankton in coastal waters, SEANOE [data set], https://doi.org/10.17882/85178, 2025.
Pniewski, F. and Piasecka-Jędrzejak, I.: Photoacclimation to Constant and Changing Light Conditions in a Benthic Diatom, Front. Mar. Sci., 7, 381, https://doi.org/10.3389/fmars.2020.00381, 2020.
Polimene, L., Brunet, C., Butenschön, M., Martinez-Vicente, V., Widdicombe, C., Torres, R., and Allen, J. I.: Modelling a light-driven phytoplankton succession, J. Plankton Res., 36, 214–229, https://doi.org/10.1093/plankt/fbt086, 2014.
Pozdnyakov, D., Tang, D., Bobylev, L., Golubkin, P., Zabolotskikh, E., Petrenko, D., and Morozov, E.: A Pilot Satellite-Based Investigation of the Impact of a Deep Polar Cyclone Propagation on the Phytoplankton Chlorophyll Spatial and Temporal Dynamics in the Arctic Ocean, in: Typhoon Impact and Crisis Management, vol. 40, edited by: Tang, D. L. and Sui, G., Springer, Berlin, Heidelberg, Germany, 241–251, https://doi.org/10.1007/978-3-642-40695-9_11, 2014.
Priestley, M. D. K. and Catto, J. L.: Future changes in the extratropical storm tracks and cyclone intensity, wind speed, and structure, Weather Clim. Dynam., 3, 337–360, https://doi.org/10.5194/wcd-3-337-2022, 2022.
Priestley, M. D. K., Ackerley, D., Catto, J. L., Hodges, K. I., McDonald, R. E., and Lee, R. W.: An Overview of the Extratropical Storm Tracks in CMIP6 Historical Simulations, J. Climate, 33, 6315–6343, https://doi.org/10.1175/JCLI-D-19-0928.1, 2020.
Raven, J. A.: A Cost-Benefit Analysis of Photon Absorption by Photosynthetic Unicells, New Phytol., 98, 593–625, https://doi.org/10.1111/j.1469-8137.1984.tb04152.x, 1984.
Rees, A. P., Hope, S. B., Widdicombe, C. E., Dixon, J. L., Woodward, E. M. S., and Fitzsimons, M. F.: Alkaline phosphatase activity in the western English Channel: Elevations induced by high summertime rainfall, Estuar. Coast. Shelf Sci., 81, 569–574, https://doi.org/10.1016/j.ecss.2008.12.005, 2009.
Ribalet, F., Marchetti, A., Hubbard, K. A., Brown, K., Durkin, C. A., Morales, R., Robert, M., Swalwell, J. E., Tortell, P. D., and Armbrust, E. V.: Unveiling a phytoplankton hotspot at a narrow boundary between coastal and offshore waters, Proc. Natl. Acad. Sci. USA, 107, 16571–16576, https://doi.org/10.1073/pnas.1005638107, 2010.
Robache, K., Hubert, Z., Gallot, C., Epinoux, A., Louchart, A. P., Facq, J.-V., Lefebvre, A., Répécaud, M., Cornille, V., Verhaeghe, F., Audinet, Y., Brutier, L., Schmitt, F. G., and Artigas, L. F.: Multiscale phytoplankton dynamics in a coastal system of the eastern English Channel: the Boulogne-sur-Mer coastal area, Ocean Sci., 21, 1787–1811, https://doi.org/10.5194/os-21-1787-2025, 2025.
Savoye, N., Lizon, F., Breton, E., Claquin, P., Joly, O., Sultan, E., Jung, J.-L., Bozec, Y., Boulart, C., Rimmelin-Maury, P., Leynaert, A., Agogué, H., Pineau, P., Del Amo, Y., Conan, P., Mostajir, B., Grégori, G., Mousseau, L., and Mendès, F.: SOMLIT (Service d'Observation en Milieu Littoral) time series (French Research Infrastructure ILICO): long-term core parameter monitoring of French coasts, SEANOE [data set], https://doi.org/10.17882/100323, 2026.
Schmitt, F. G., Jiang, Y., Lecuyer, E., Crouvoisier, M., Berti, S., Calzavarini, E., Tergolina, V., and Mayette, E.: Stratification thermique des eaux marines au large de Boulogne-sur-mer, in: Observer le monde marin, de la ressource à l'assiette : recherches marines et littorales en Côte d'Opale, Editions Universitaires Européennes, 295–306, ISBN 978-3-8416-7831-7, 2024.
Scholz, S. R., Seager, R., Ting, M., Kushnir, Y., Smerdon, J. E., Cook, B. I., Cook, E. R., and Baek, S. H.: Changing hydroclimate dynamics and the 19th to 20th century wetting trend in the English Channel region of northwest Europe, Clim. Dyn., 58, 1539–1553, https://doi.org/10.1007/s00382-021-05977-5, 2022.
Simon, A., Poppeschi, C., Plecha, S., Charria, G., and Russo, A.: Coastal and regional marine heatwaves and cold spells in the northeastern Atlantic, Ocean Sci., 19, 1339–1355, https://doi.org/10.5194/os-19-1339-2023, 2023.
Skouroliakou, D., Breton, E., and Christaki, U.: Phaeocystis globosa and diatom blooms promote distinct bacterial communities and associations in a coastal ecosystem, Environ. Microbiol. Rep., 16, e13313, https://doi.org/10.1111/1758-2229.13313, 2024.
Skouroliakou, D.-I., Breton, E., Irion, S., Artigas, L. F., and Christaki, U.: Stochastic and Deterministic Processes Regulate Phytoplankton Assemblages in a Temperate Coastal Ecosystem, Microbiol. Spectr., 10, e02427-22, https://doi.org/10.1128/spectrum.02427-22, 2022.
Stockwell, J. D., Doubek, J. P., Adrian, R., Anneville, O., Carey, C. C., Carvalho, L., De Senerpont Domis, L. N., Dur, G., Frassl, M. A., Grossart, H., Ibelings, B. W., Lajeunesse, M. J., Lewandowska, A. M., Llames, M. E., Matsuzaki, S. S., Nodine, E. R., Nõges, P., Patil, V. P., Pomati, F., Rinke, K., Rudstam, L. G., Rusak, J. A., Salmaso, N., Seltmann, C. T., Straile, D., Thackeray, S. J., Thiery, W., Urrutia‐Cordero, P., Venail, P., Verburg, P., Woolway, R. I., Zohary, T., Andersen, M. R., Bhattacharya, R., Hejzlar, J., Janatian, N., Kpodonu, A. T. N. K., Williamson, T. J., and Wilson, H. L.: Storm impacts on phytoplankton community dynamics in lakes, Glob. Change Biol., 26, 2756–2784, https://doi.org/10.1111/gcb.15033, 2020.
Thyssen, M., Grégori, G. J., Grisoni, J.-M., Pedrotti, M. L., Mousseau, L., Artigas, L. F., Marro, S., Garcia, N., Passafiume, O., and Denis, M. J.: Onset of the spring bloom in the northwestern Mediterranean Sea: influence of environmental pulse events on the in situ hourly-scale dynamics of the phytoplankton community structure, Front. Microbiol., 5, 387, https://doi.org/10.3389/fmicb.2014.00387, 2014.
Turki, E. I., Deloffre, J., Lecoq, N., Gilbert, R., Mendoza, E. T., Laignel, B., Salameh, E., Gutierrez Barcelo, A. D., Fournier, M., and Massei, N.: Multi-timescale dynamics of extreme river flood and storm surge interactions in relation with large-scale atmospheric circulation: Case of the Seine estuary, Estuar. Coast. Shelf Sci., 287, 108349, https://doi.org/10.1016/j.ecss.2023.108349, 2023.
Widdicombe, C. E., Eloire, D., Harbour, D., Harris, R. P., and Somerfield, P. J.: Long-term phytoplankton community dynamics in the Western English Channel, J. Plankton Res., 32, 643–655, https://doi.org/10.1093/plankt/fbp127, 2010.
Williams, C., Sharples, J., Mahaffey, C., and Rippeth, T.: Wind‐driven nutrient pulses to the subsurface chlorophyll maximum in seasonally stratified shelf seas, Geophys. Res. Lett., 40, 5467–5472, https://doi.org/10.1002/2013GL058171, 2013.
Wu, J.: Wind‐stress coefficients over sea surface from breeze to hurricane, J. Geophys. Res., 87, 9704–9706, https://doi.org/10.1029/JC087iC12p09704, 1982.
Xian, W.-D., Ding, J., Chen, J., Qu, W., Cao, P., Tang, C., Liu, X., Zhang, Y., Li, J.-L., Wang, P., Li, W.-J., and Wang, J.: Distinct Assembly Processes Structure Planktonic Bacterial Communities Among Near- and Offshore Ecosystems in the Yangtze River Estuary, Microb. Ecol., 87, 42, https://doi.org/10.1007/s00248-024-02350-x, 2024.
Zhao, H., Tang, D., and Wang, D.: Phytoplankton blooms near the Pearl River Estuary induced by Typhoon Nuri, J. Geophys. Res., 114, 2009JC005384, https://doi.org/10.1029/2009JC005384, 2009.
- Abstract
- Introduction
- Materials and methods
- Results
- Discussion
- Conclusions
- Appendix A: Wind speed and direction during storms
- Appendix B: Frequency distributions of June–July precipitation and river inflow
- Appendix C: Seasonal and spatial variability of environmental variables
- Appendix D: Climatology of wind speed and direction
- Appendix E: Variability of Chl-a concentrations in relation to storms and precipitation
- Appendix F: Phytoplankton CCDFs during the storm events
- Appendix G: Abundance responses to storms: Anderson–Darling and Tail-exceedance test results
- Appendix H: Phytoplankton taxa and functional group observations
- Data availability
- Author contributions
- Competing interests
- Disclaimer
- Special issue statement
- Acknowledgements
- Financial support
- Review statement
- References
- Abstract
- Introduction
- Materials and methods
- Results
- Discussion
- Conclusions
- Appendix A: Wind speed and direction during storms
- Appendix B: Frequency distributions of June–July precipitation and river inflow
- Appendix C: Seasonal and spatial variability of environmental variables
- Appendix D: Climatology of wind speed and direction
- Appendix E: Variability of Chl-a concentrations in relation to storms and precipitation
- Appendix F: Phytoplankton CCDFs during the storm events
- Appendix G: Abundance responses to storms: Anderson–Darling and Tail-exceedance test results
- Appendix H: Phytoplankton taxa and functional group observations
- Data availability
- Author contributions
- Competing interests
- Disclaimer
- Special issue statement
- Acknowledgements
- Financial support
- Review statement
- References