
the Creative Commons Attribution 4.0 License.
the Creative Commons Attribution 4.0 License.
 | 02 Sep 2026
Asymmetric response of coastal currents to oscillating alongshore wind stress over a coastal bank
Jihun Jung

Gwang-Ho Seo
Kwang-Young Jeong
An asymmetric response of coastal currents to oscillating alongshore wind stress is observed over a coastal bank off the southern coast of Korea. Alongshore currents exhibit consistently larger variability in the western region than in the eastern region. Numerical experiments show that sea level reaches a maximum (minimum) in the western coastal region during westward (eastward) winds, leading to stronger cross-shore sea level gradients under both wind directions. Momentum balance analysis suggests that the alongshore pressure gradient force acts in the same direction as the wind stress in the western region but opposes the wind stress in the eastern region, resulting in a stronger current response in the western region. The asymmetry arises from spatial differences in mass convergence and divergence driven by spatially varying vertically integrated transport over the bank, which is subsequently governed by arrested topographic wave dynamics. This asymmetric mass redistribution leads to energy flux convergence in the western region. Although offshore currents and variations in the wind stress period and magnitude modulate coastal circulation, the qualitative asymmetry persists. These findings suggest that similar current asymmetries may occur in other coastal regions with bank-like geometry. Understanding such asymmetric current responses to wind stress is essential for assessing their potential ecological impacts in coastal bank regions.
- Article
(8142 KB) - Full-text XML
- BibTeX
- EndNote


Coastal currents have long been a subject of scientific inquiry because they play an important role in shaping coastal ecosystems by transporting and dispersing nutrients, sediments, and pollutants (Geyer et al., 2004; James, 2002; Washburn and McPhee-Shaw, 2013; Whitney et al., 2005).
Wind is a dominant driver of coastal currents, and the wind-driven response to alongshore wind stress has been extensively studied (Allen, 1980; Brink, 1987; Huyer et al., 1978; Winant, 1980). However, coastal circulation is also strongly influenced by alongshore variations in coastal topography (Gan and Allen, 2002; Saldías and Allen, 2020; Su and Pohlmann, 2009).
Such topographic features, including bays, bights, promontories, shelf valleys, shelf width variations, and submarine canyons, have been shown to influence coastal currents (Allen and Hickey, 2010; Chen et al., 2024; Davidson et al., 2001; Gan et al., 2009; Liu and Gan, 2014; Palma and Matano, 2009; Pringle, 2002; Pringle and Dever, 2009; Rosenfeld et al., 1994; Saldías et al., 2021; Saldías and Allen, 2020; Zhang and Lentz, 2017, 2018).
Another prominent form of alongshore topographic variation is a coastal bank. Previous studies have examined the variations in coastal currents and circulation around various banks, including Georges Bank (Brink, 1983; Brink et al., 2003, 2009; Chen et al., 1995; Naimie, 1996; Naimie et al., 1994; Noble et al., 1985), Halten Bank (Oey et al., 1992), Heceta Bank (Barth et al., 2005; Castelao and Barth, 2005; Kirincich and Barth, 2009; Kosro, 2005; Whitney and Allen, 2009b), and Taiwan Bank (Liao et al., 2018). Because the complexity of real ocean environments can obscure underlying dynamics, idealized numerical experiments using simplified bank topography have also been employed to facilitate theoretical investigation (Castelao and Barth, 2006; Chen and Beardsley, 1995; Whitney and Allen, 2009a).
Previous studies have reported asymmetric currents and circulation in the presence of alongshore topographic variations (Davidson et al., 2001; Trasviña et al., 1995; Zhang and Lentz, 2017). In particular, circulation around a coastal bank can respond asymmetrically to upwelling-favorable winds, but symmetrically to downwelling-favorable winds, with the strength of the associated upwelling and downwelling jets varying with wind stress magnitude and bank geometry (Castelao and Barth, 2006; Whitney and Allen, 2009a). However, these studies have primarily focused on steady wind forcing, paying comparatively little attention to oscillatory alongshore wind stress, which is common in coastal environments.
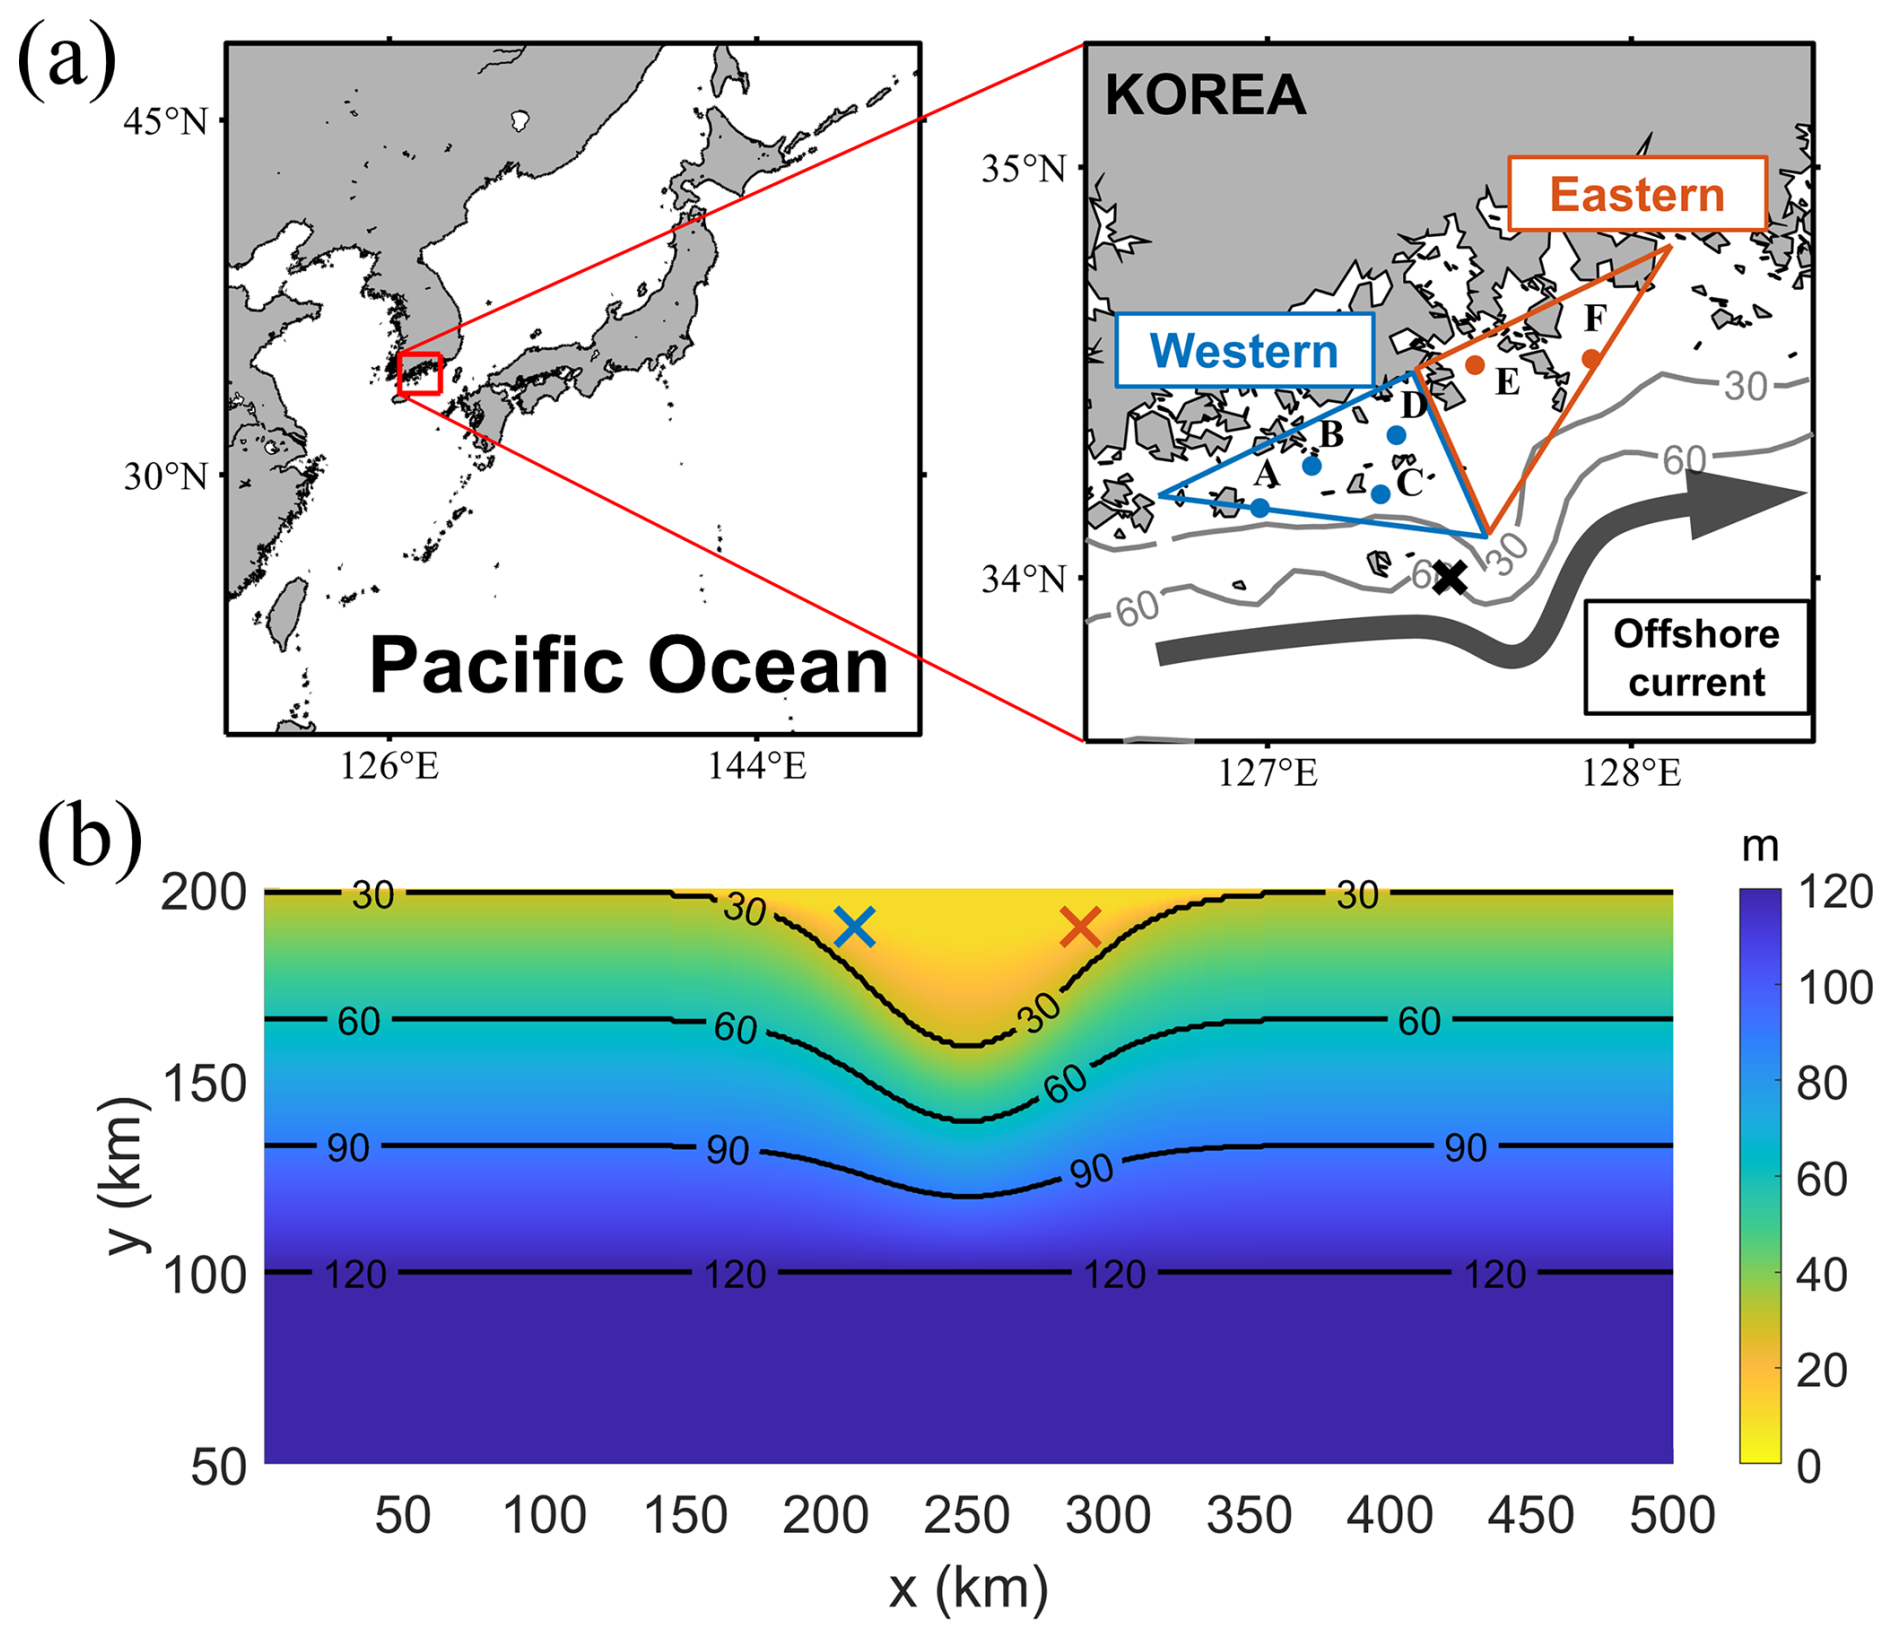
Figure 1(a) Observation stations (dots; A–F) for surface current measurements and bathymetry in the study area. Blue and orange colors indicate the western and eastern regions of the bank, respectively. Gray lines represent 30 and 60 m isobaths. The black cross denotes the wind observation station, and the thick black arrow indicates the schematic path of the offshore current. (b) Model domain and bathymetry for the idealized experiment.
During the summer of 2019, surface currents were observed at six stations in the southern sea of the Korean Peninsula (Fig. 1a). This region has a mean depth of approximately 100 m and is characterized by bank-like topography and a persistent eastward alongshore current (hereafter referred to as the offshore current) throughout the year (Cho et al., 2009, 2013; Jung and Cho, 2020; Kim et al., 2014; Pang et al., 2003; Teague et al., 2003). The observations reveal that wind-driven current variability is consistently stronger on the western side of the bank than on the eastern side, independent of wind direction, and that coastal currents covary with oscillatory alongshore wind forcing (Fig. 2).
This study investigates the factors contributing to the asymmetric response of coastal currents over a bank under both upwelling- and downwelling-favorable winds, using observational data analyses and numerical modeling. Section 2 describes the data, analysis methods, and model configuration. Section 3 presents the asymmetric current responses over the bank and examines the underlying mechanisms based on model results, along with the influence of offshore currents and sensitivity to wind forcing amplitude and period. Section 4 discusses the mechanism driving the asymmetry and other factors that may affect it. Section 5 presents the conclusions of this study.
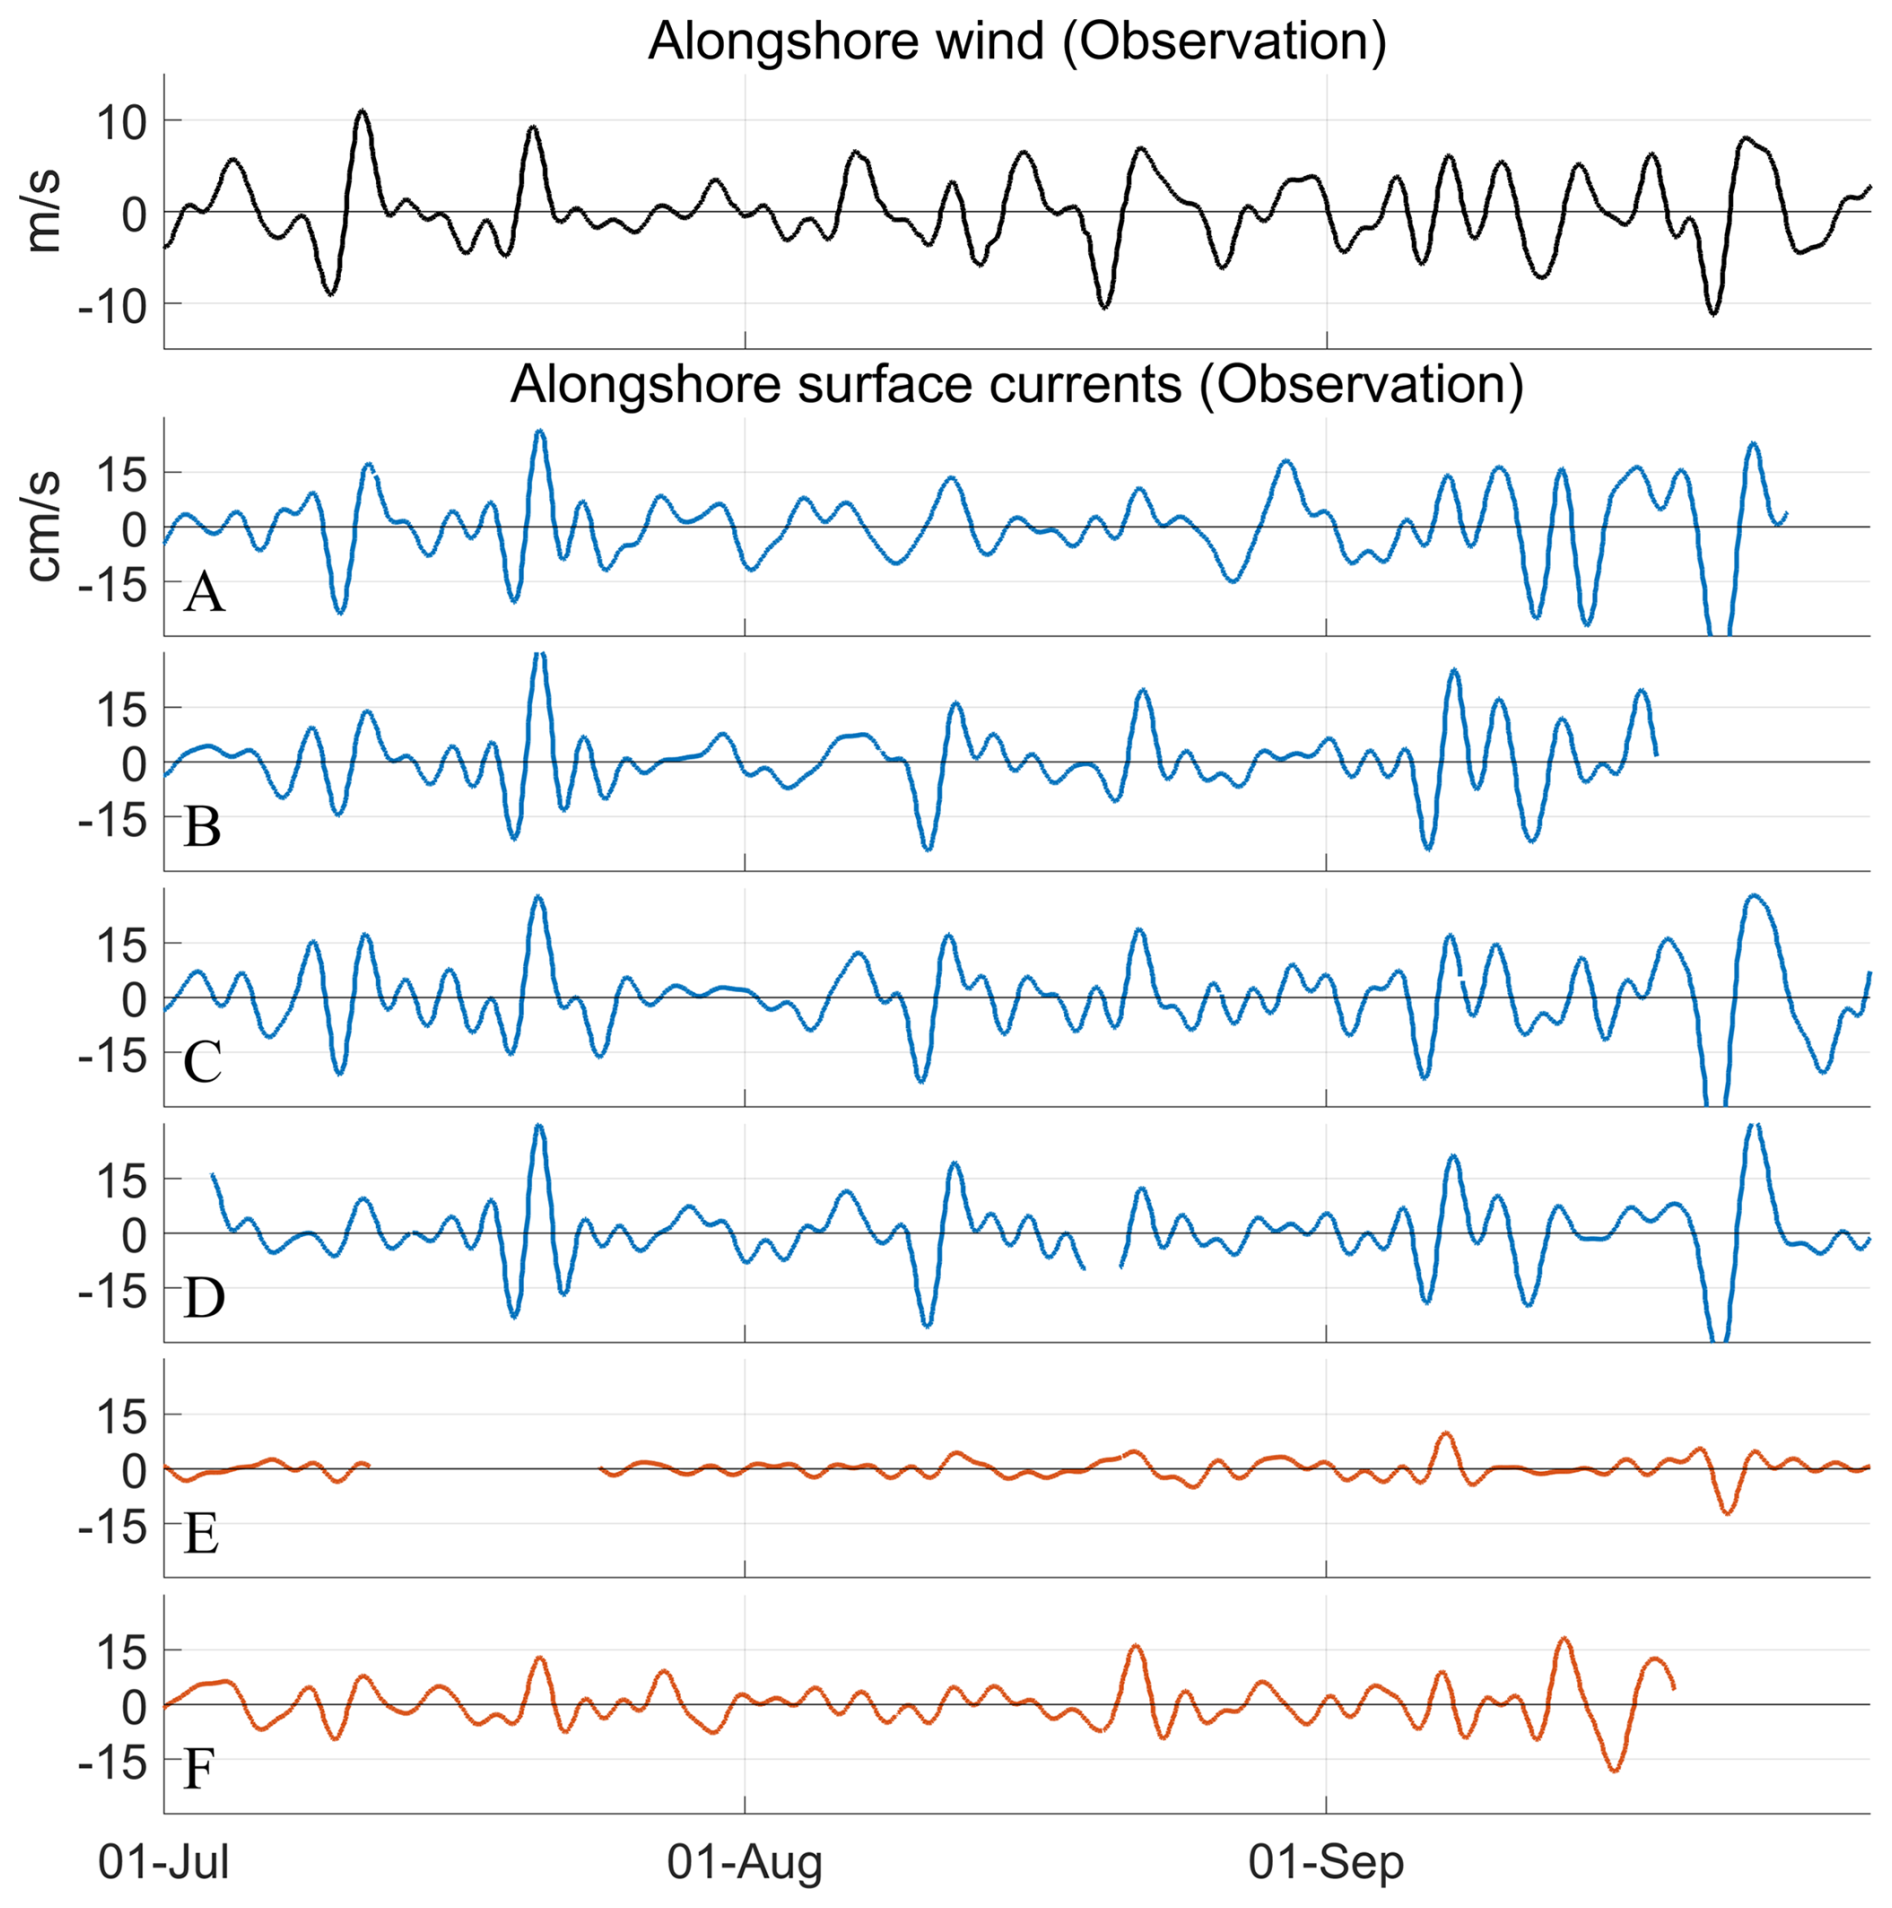
Figure 2Alongshore wind velocity (black line) and alongshore surface currents observed at the stations shown in Fig. 1a in the year 2019. Stations A–F correspond to the dots in Fig. 1a from west to east. Blue and orange colors indicate stations located in the western and eastern regions of the bank, respectively.
2.1 Observations
Surface current data were obtained from routine acoustic Doppler current profiler (ADCP) observations (depicted as dots in Fig. 1a) conducted by the Korea Hydrographic and Oceanographic Agency. The six observation stations were located at depths of 28.5, 16.5, 28.0, 17.5, 10.5, and 24.0 m from west to east. Current measurements were sampled at 10 min intervals. Vertical bin sizes were 1 m at all stations except station E, where a bin size of 0.5 m was used. Because only surface current data are publicly available, this study focuses on variability in surface currents. Wind data were obtained from the Geomundo buoy (black cross in Fig. 1a), maintained by the Korea Meteorological Administration.
In this study, the alongshore direction was defined as 20° counterclockwise from the east-west direction, with the positive direction eastward. Wind and current time series shown in Fig. 2 were band-pass filtered between 2 and 10 d to isolate wind-driven coastal variability (Allen, 1980; Barth et al., 2005).
The power spectral densities (PSDs) of the alongshore wind and surface currents at stations B and F were calculated to identify dominant periods (Fig. 3a). The PSD of the alongshore wind exhibits a pronounced peak at a 7.5 d period. At station B, the dominant spectral peak in the surface currents coincides with that of the alongshore wind. Although the PSD at station F shows an additional peak at a 5.7 d period, which is marginally the highest among the multiple peaks, it also exhibits a prominent peak at the wind-driven 7.5 d period.
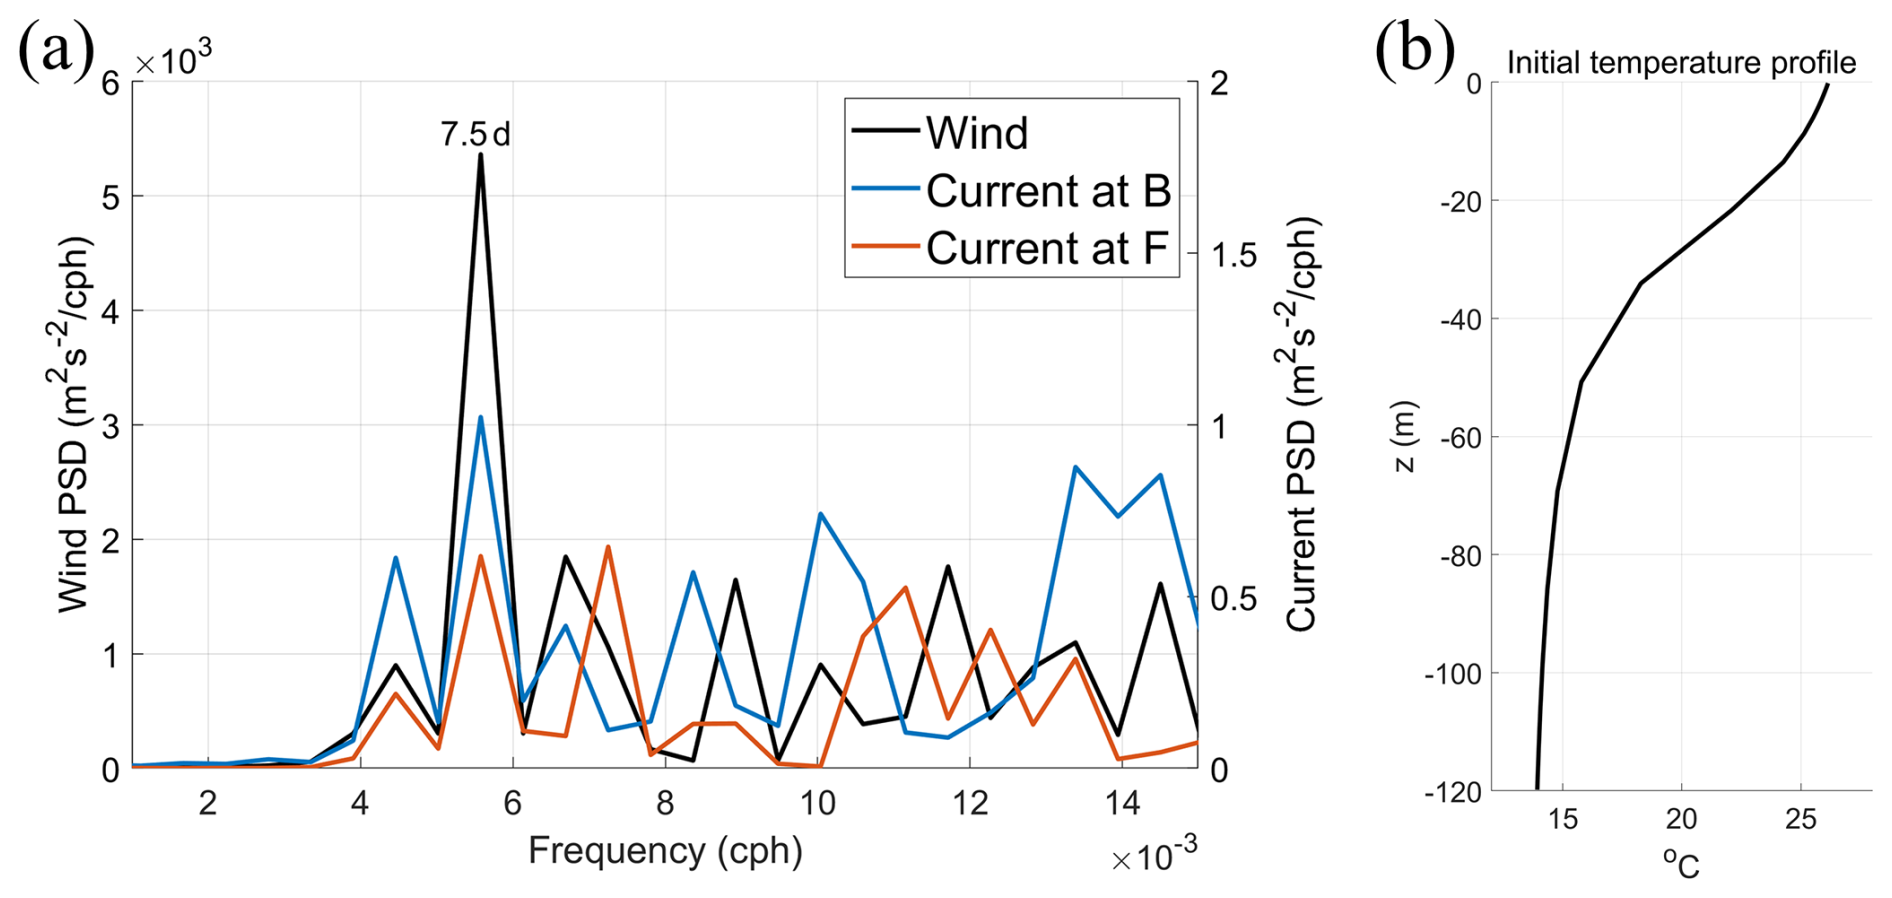
Figure 3(a) Power spectral densities (PSDs) of alongshore wind (black) observed at the buoy location (black cross in Fig. 1a) and alongshore surface currents observed at stations B (blue) and F (orange) from 1 July to 18 September. (b) Initial temperature profile used in the idealized model.
2.2 Realistic model
A previously developed realistic model was used to complement the limited observational coverage and to examine the full spatial variability of coastal currents (Jung and Cho, 2020). The model domain encompasses the Yellow Sea, the East/Japan Sea, and part of the East China Sea bounded by the line connecting the Yangtze River mouth and southern Kyushu, which is identical to that of Jung and Cho (2020) except that the coastline and bathymetry along the southern coast of the Korean Peninsula are represented using less smoothing. The previous model successfully reproduced the upwelling pattern in the study area when compared with in situ observations. The initial conditions were taken from the output of the previous model. The model was initialized from the 2015 output of the previous simulation and integrated through 2019. Tidal forcing was omitted to isolate the wind-driven dynamical response of coastal currents over the bank. All other model configurations, including atmospheric forcing and open boundary conditions, are identical to those used in the previous study. Additional details of the model configuration can be found in Jung and Cho (2020).
2.3 Idealized model
The numerical model employed in this study was the Regional Ocean Modeling System (ROMS) (Shchepetkin and McWilliams, 2005), which is a split-explicit, free-surface, hydrostatic ocean model characterized by a terrain-following curvilinear coordinate system. Because the complex coastline and bottom bathymetry in the realistic model preclude dynamical analyses of the underlying bank-induced circulation, we conducted idealized numerical experiments using a simplified coastline and bathymetry. The model domain was 500 km long and 200 km wide (Fig. 1b), with a grid resolution of 1 km horizontally and 30 vertical layers.
The idealized bank bathymetry was constructed by linearly interpolating the depth at each x location using three points: the coast (0 m), the 30 m isobath, and 100 km offshore (120 m) (Fig. 1b).
The y-coordinate of the 30 m isobath (y30) is defined as follows:
where the values of ycoast, yw, xm, and xef are 199, 40, 250, and 50 km, respectively. The bank width and length scale are controlled by yw and xef, respectively. A minimum depth of 10 m was employed in this study. The bank geometry was designed to match the scale of the bank in the study area (Fig. 1a).
Vertical mixing was parameterized with the MY-2.5 turbulent closure scheme (Mellor and Yamada, 1982). The background vertical eddy viscosity and diffusivity were both set to 10−5 m2 s−1, and the Coriolis parameter was fixed at f = 10−4 s−1. Bottom stress was parameterized using a linear formulation, in which the stress was assumed to be linearly proportional to velocity and the bottom drag coefficient was set to m s−1.
The northern boundary was closed and the eastern and western boundaries were periodic. At the southern (offshore) boundary, a radiation condition was imposed for the free-surface elevation. The Flather condition was applied to the barotropic momentum, while zero-gradient conditions were used for the baroclinic momentum and other three-dimensional (3D) variables. The horizontal viscosity and diffusivity coefficients were set to 20 and 2 m2 s−1, respectively (Ledwell et al., 1998). The initial temperature profile was prescribed as follows (Chen et al., 2019; Jung and Cho, 2023):
where z is the vertical coordinate, defined as positive upward with z=0 m at the surface. The initial temperature profile (Fig. 3b) represents typical summer conditions along the southern coast of the Korean Peninsula. Salinity was held constant at 32 psu throughout the experiments.
Because the winds in the study area blow predominantly alongshore and exhibit little spatial variability across the bank, the model was forced with a temporally oscillating, spatially uniform alongshore wind stress. The forcing period was set to 8 d based on the dominant peak in the wind power spectrum (Fig. 3a). The maximum wind stress (0.05 N m−2) corresponds to a wind speed of approximately 6.0 m s−1, assuming a drag coefficient of 1.25 × 10⁻³ and an air density of 1.2 kg m−3. This value corresponds to the mean speed within the upper 10 % of both eastward and westward wind events during the study period. No surface heat flux was applied.
In experiments including offshore currents, a constant alongshore pressure gradient ( hPa km−1 i.e. sea-level tilt of about 1 cm per 250 km alongshore) was applied as a body force (Zhang et al., 2011) over the entire model domain to generate the eastward offshore current similar to that along the southern coast of the Korean Peninsula. After a 30 d spin-up without wind stress, the simulated offshore current followed the isobaths and reached approximately 30 cm s−1 near the bank head.
2.4 Sensitivity experiments
In addition to the control simulation, which is forced by an oscillatory alongshore wind stress with a period of 8 d and an amplitude of 0.05 N m−2, a series of sensitivity experiments were conducted to evaluate the robustness of the modeled asymmetric response and to assess its dependence on wind stress characteristics. To test the sensitivity to wind periods, periods of 4 and 12 d were used. Additionally, amplitudes of 0.025 and 0.075 N m−2 were applied to test the sensitivity to wind amplitudes. Furthermore, additional idealized experiments were performed to examine specific dynamic contributions. To test the role of bottom friction, weaker ( m s−1) and stronger ( m s−1) bottom drag coefficients were applied. A uniform density experiment was also conducted to assess the influence of stratification on the occurrence of the asymmetry. Finally, steady westward and eastward wind stresses were applied to compare with the oscillatory forcing responses. Although only the results of the sensitivity experiments on wind amplitude and period are presented in detail, the key findings from the other experiments are briefly mentioned to support the physical interpretation of our results.
3.1 Asymmetric response of coastal currents to oscillating wind stress
Observed alongshore surface currents were averaged across four stations in the western region and compared with those in the eastern region. For the eastern region, only station F was used because currents at station E exhibited minimal variability, possibly due to local bathymetric effects. Alongshore currents are well correlated with the alongshore wind (Fig. 2). The 2–10 d band-pass filtered alongshore currents and the alongshore wind show statistically significant correlations (p-value < 0.05) at all stations except station E. The correlation coefficients at stations A, B, C, D, and F are 0.44, 0.57, 0.59, 0.46, and 0.42, respectively. The temporal variability is greater in the western region (blue line in Fig. 4a) than in the eastern region (orange line in Fig. 4a).
From 1 July to 18 September, the standard deviation of the alongshore surface current was 7.0 cm s−1 in the western region and 5.3 cm s−1 in the eastern region. To complement the limited observational coverage, the realistic model results were analyzed at the corresponding locations. Over the same period, the modeled alongshore current variability was 13.2 cm s−1 in the western region and 7.4 cm s−1 in the eastern region, indicating that the realistic model successfully captures the enhanced variability in the western region (Fig. 4b). Similar asymmetry is also evident in the area-averaged alongshore surface currents within each region (Fig. 4c).
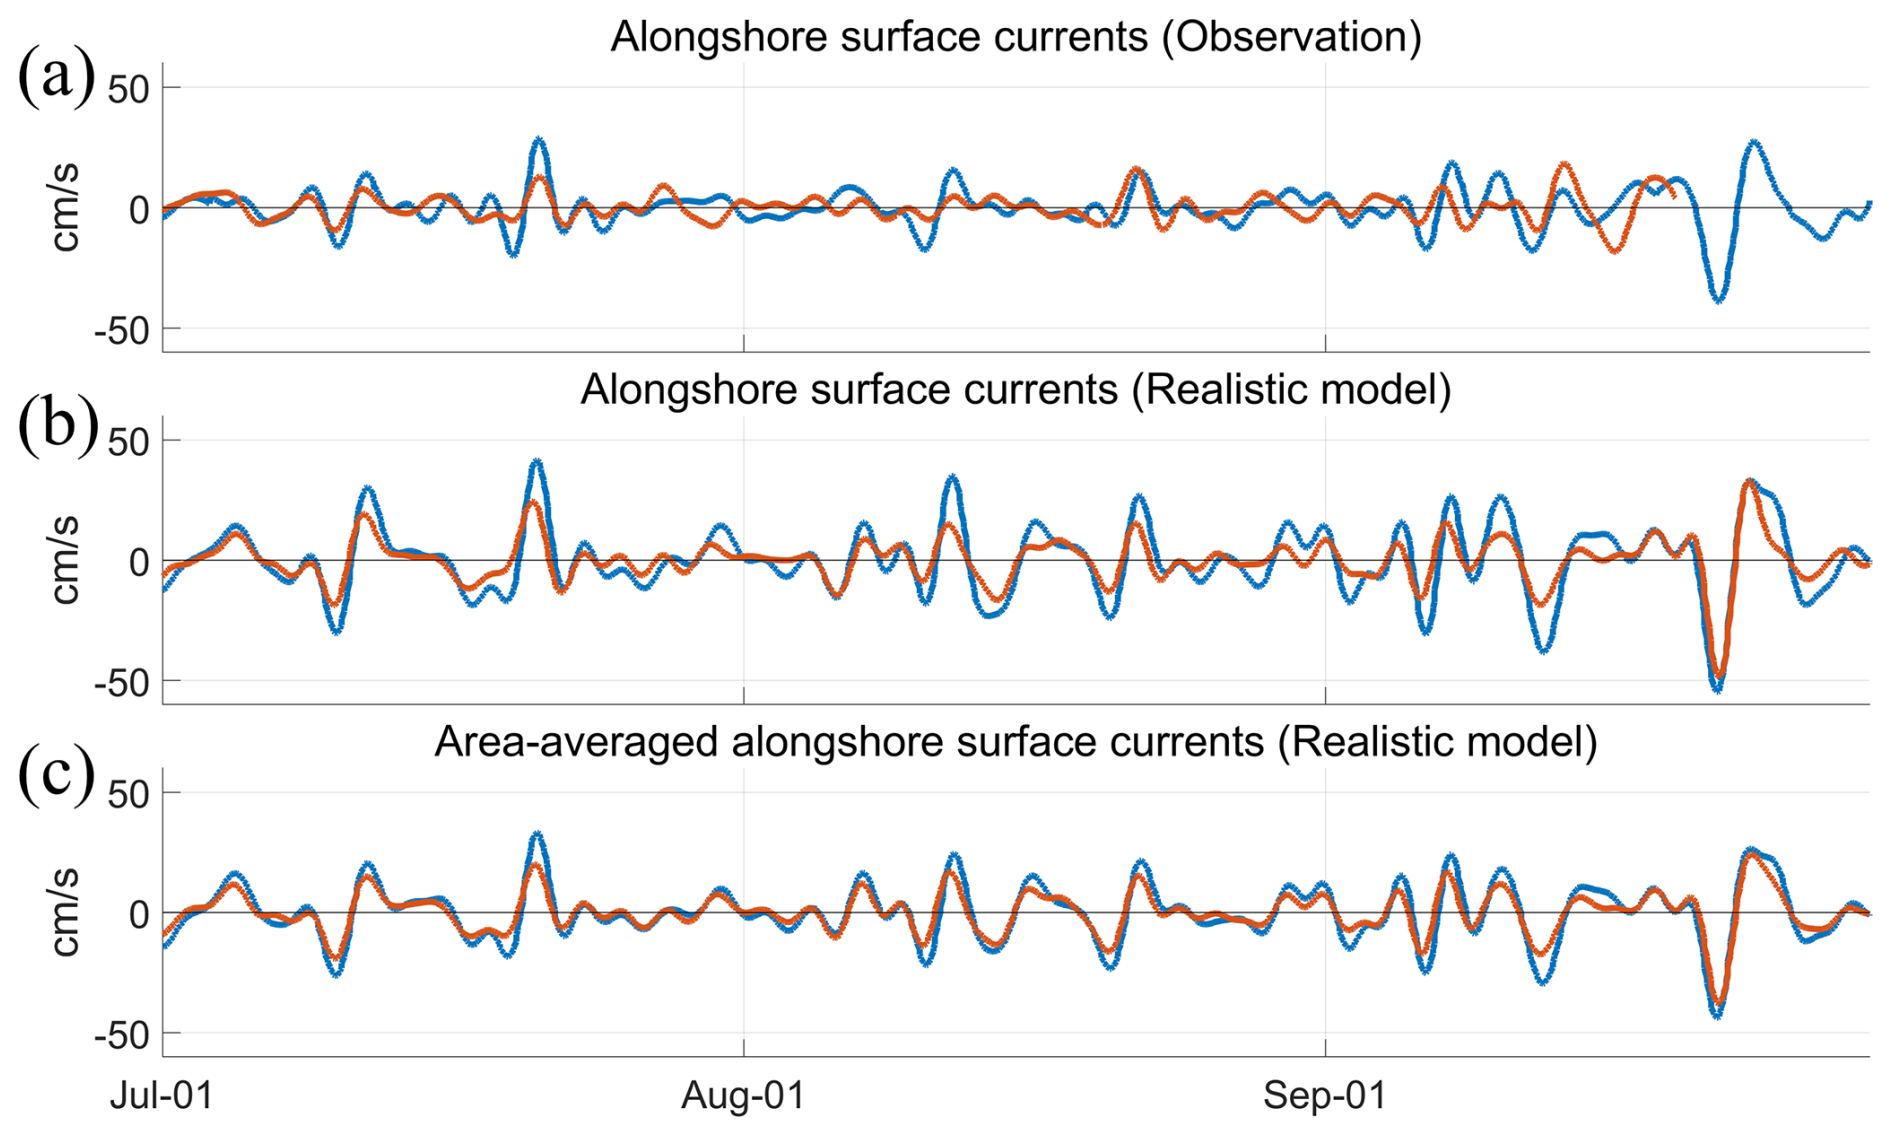
Figure 4Time series of the spatially averaged alongshore surface currents at the observation stations from (a) observations and (b) the realistic model. (c) Spatially averaged surface currents from the realistic model within each triangular region shown in Fig. 1a. The blue and orange lines represent the western and eastern regions, respectively.
Composite means of surface currents during periods when the magnitude of the alongshore wind exceeded 5 m s−1 are shown in Fig. 5. The realistic model reproduces the observed spatial patterns qualitatively well and clearly shows the difference between the two regions. Surface currents are stronger in the western region (blue arrows in Fig. 5) than in the eastern region (orange arrows in Fig. 5) under both eastward and westward wind conditions. These results indicate that the asymmetry is not sensitive to the choice of observation stations.
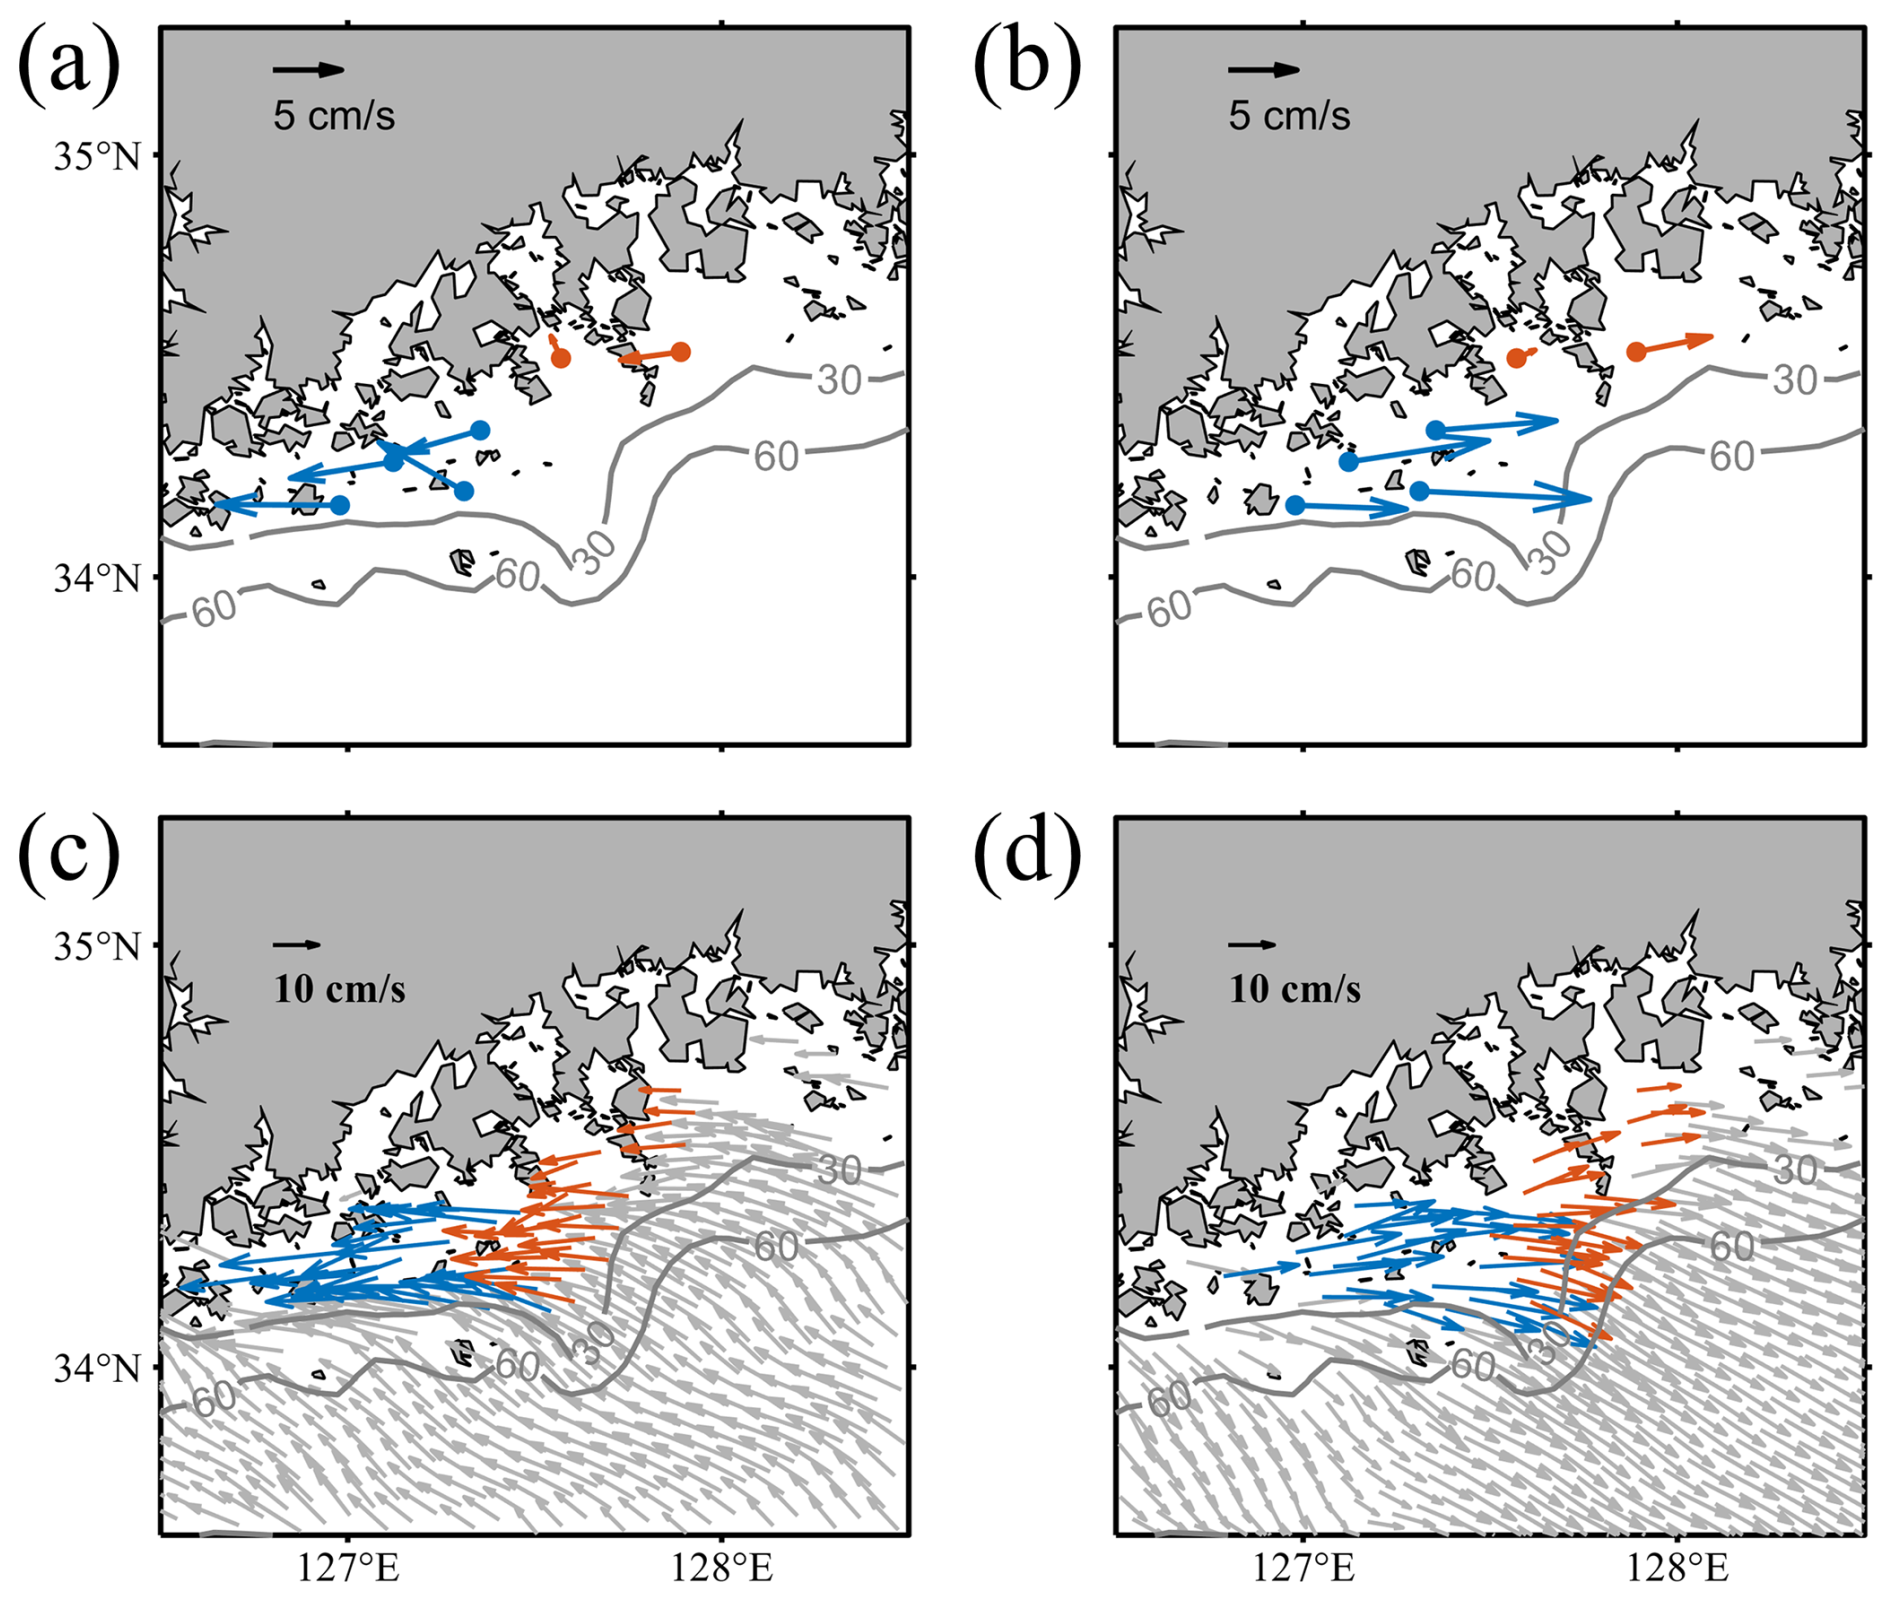
Figure 5Composite means of (top) observed surface currents and (bottom) simulated surface currents from the realistic model during (left) westward and (right) eastward winds exceeding 5 m s−1 from 1 July to 18 September.
3.2 Idealized numerical experiments
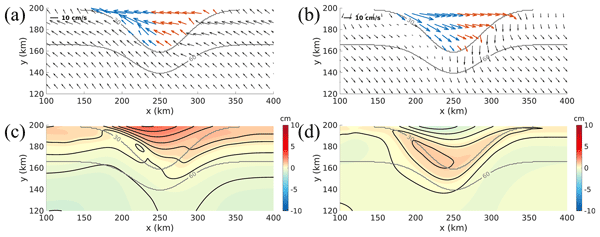
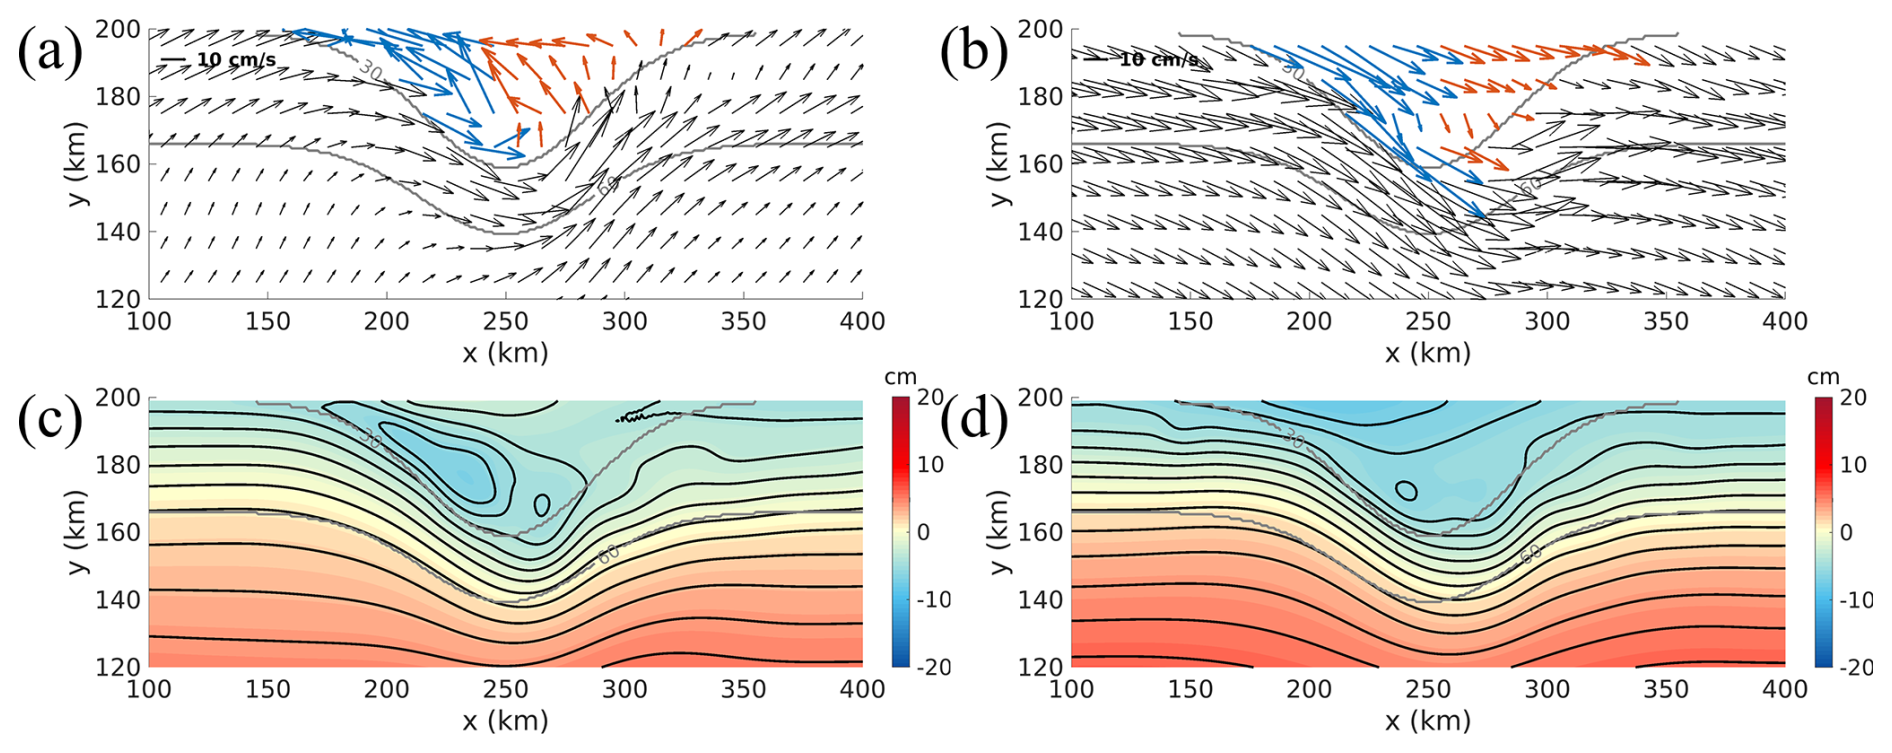
To isolate the bank-induced dynamics, an idealized model was employed, excluding the effects of a complex coastline and small-scale bathymetric irregularities. The idealized experiments were analyzed after two wind cycles. The model results exhibit an asymmetric response of the coastal currents, with larger variability in the western region (blue arrows in Fig. 6) than in the eastern region (orange arrows in Fig. 6).
Under westward (eastward) winds, sea level anomalies show asymmetric distributions, reaching a maximum (minimum) in the western region (Fig. 6c and d). The maximum and minimum sea levels result in stronger cross-shore sea level gradients in the western region. These results suggest that the observed asymmetry arises from intrinsic dynamics associated with the bank topography rather than from coastal geometry or small-scale bottom irregularities.
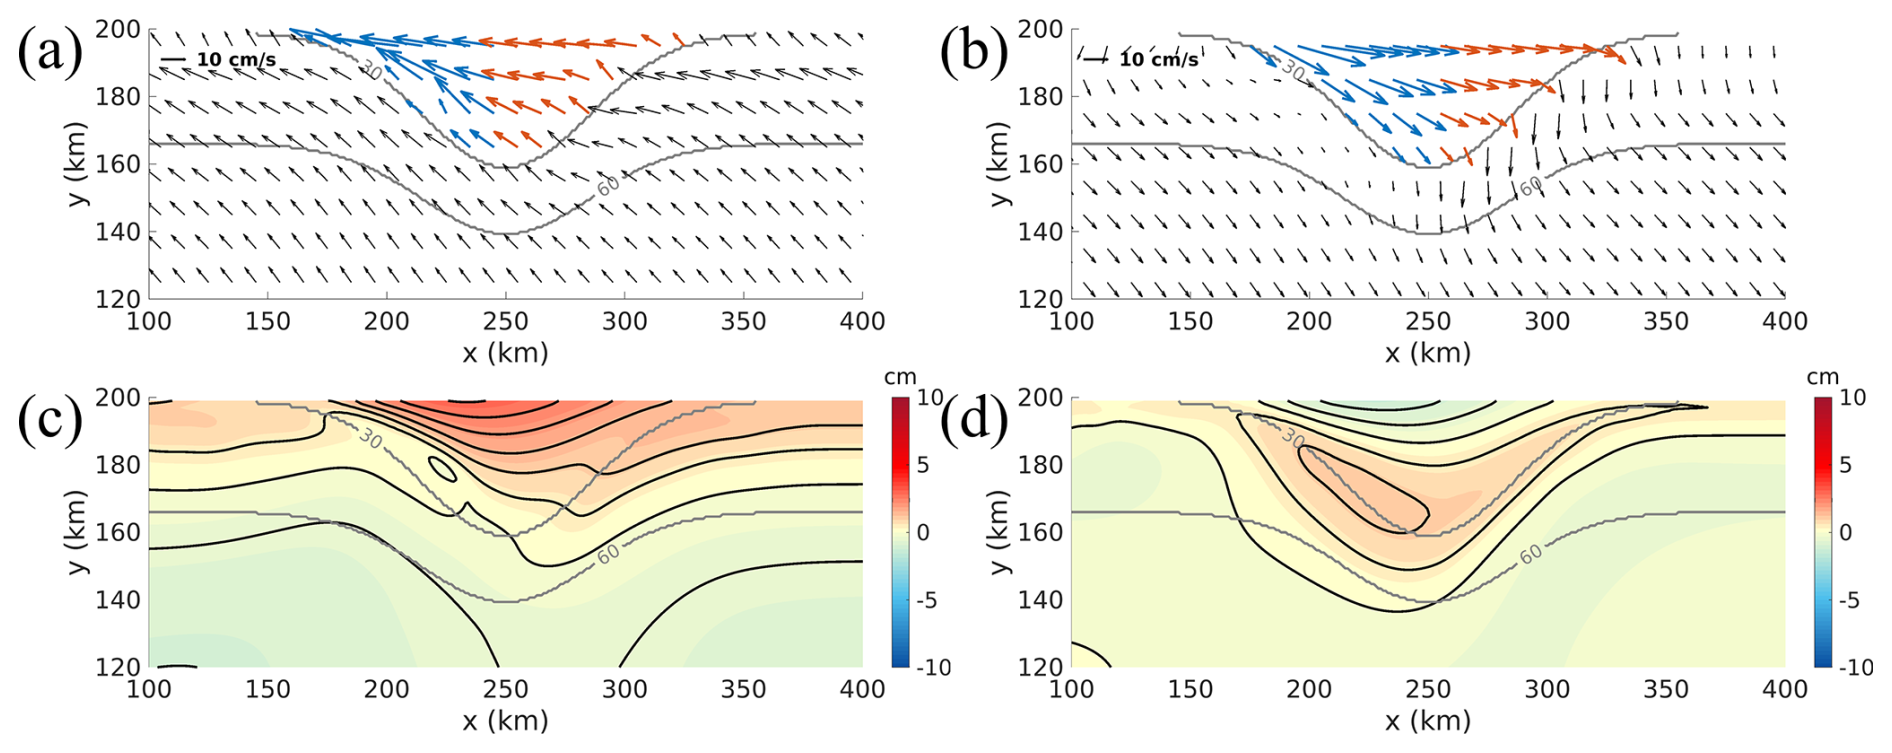
Figure 6(top) Surface currents and (bottom) sea level anomalies from the idealized model on (left) day 18 and (right) day 22. The sea level anomaly is defined as the deviation from the spatial mean. Gray contours represent the bottom topography, with depths indicated in meters.
3.3 Momentum balance
The idealized model results indicate that the asymmetric response of the coastal currents is associated with an asymmetric sea level distribution. To identify the dominant terms responsible for this asymmetry, the cross-shore and alongshore depth-averaged momentum balances were calculated from the idealized model results, neglecting the small horizontal viscosity term:
where u and v are the alongshore and cross-shore depth-averaged velocities, respectively, P is the pressure, ρ0 is the density, f is the Coriolis parameter, τs is the wind stress, and τb is the bottom stress.
In the cross-shore direction, the dominant terms are the Coriolis force and the pressure gradient force (PGF), indicating a geostrophic balance (Fig. 7). Both the Coriolis force and the PGF are larger in the western region than in the eastern region, consistent with the larger cross-shore sea level gradients (Fig. 6c and d). The stronger geostrophic balance in the western region is also evident in the time series (Fig. 8) and persists throughout the analysis period.
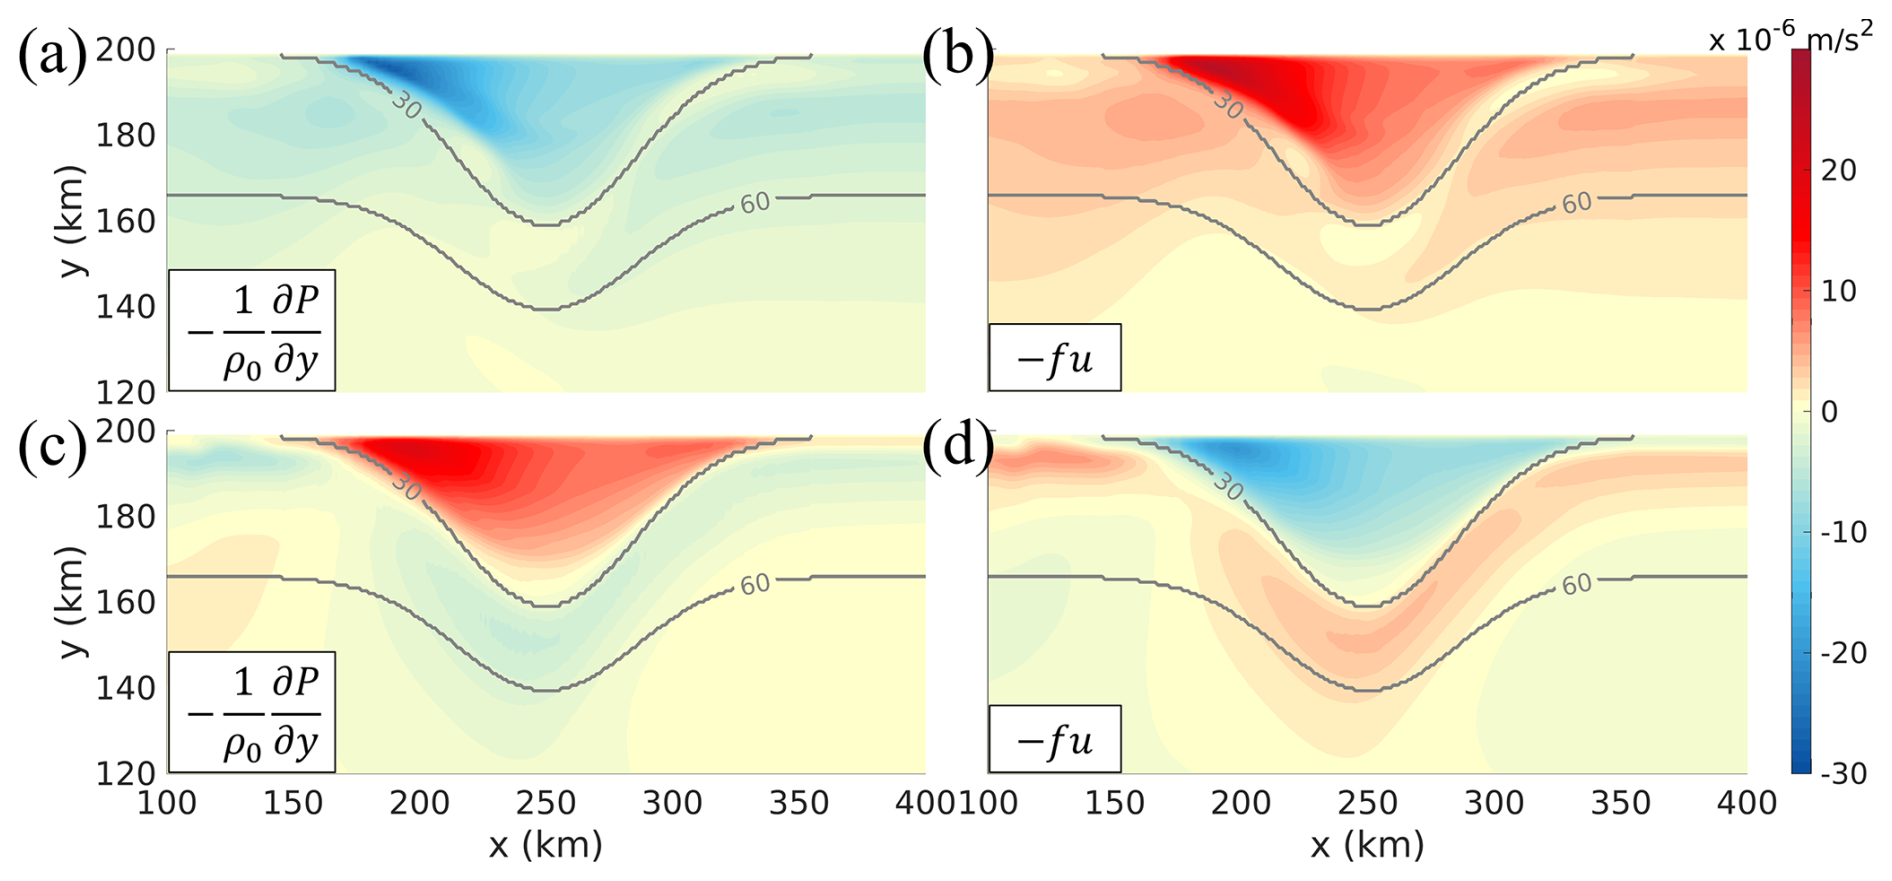
Figure 7Cross-shore depth-averaged momentum balances calculated from the idealized model results during (top) westward winds on day 18 and (bottom) eastward winds on day 22. Gray contours represent the bottom topography, with depths indicated in meters.
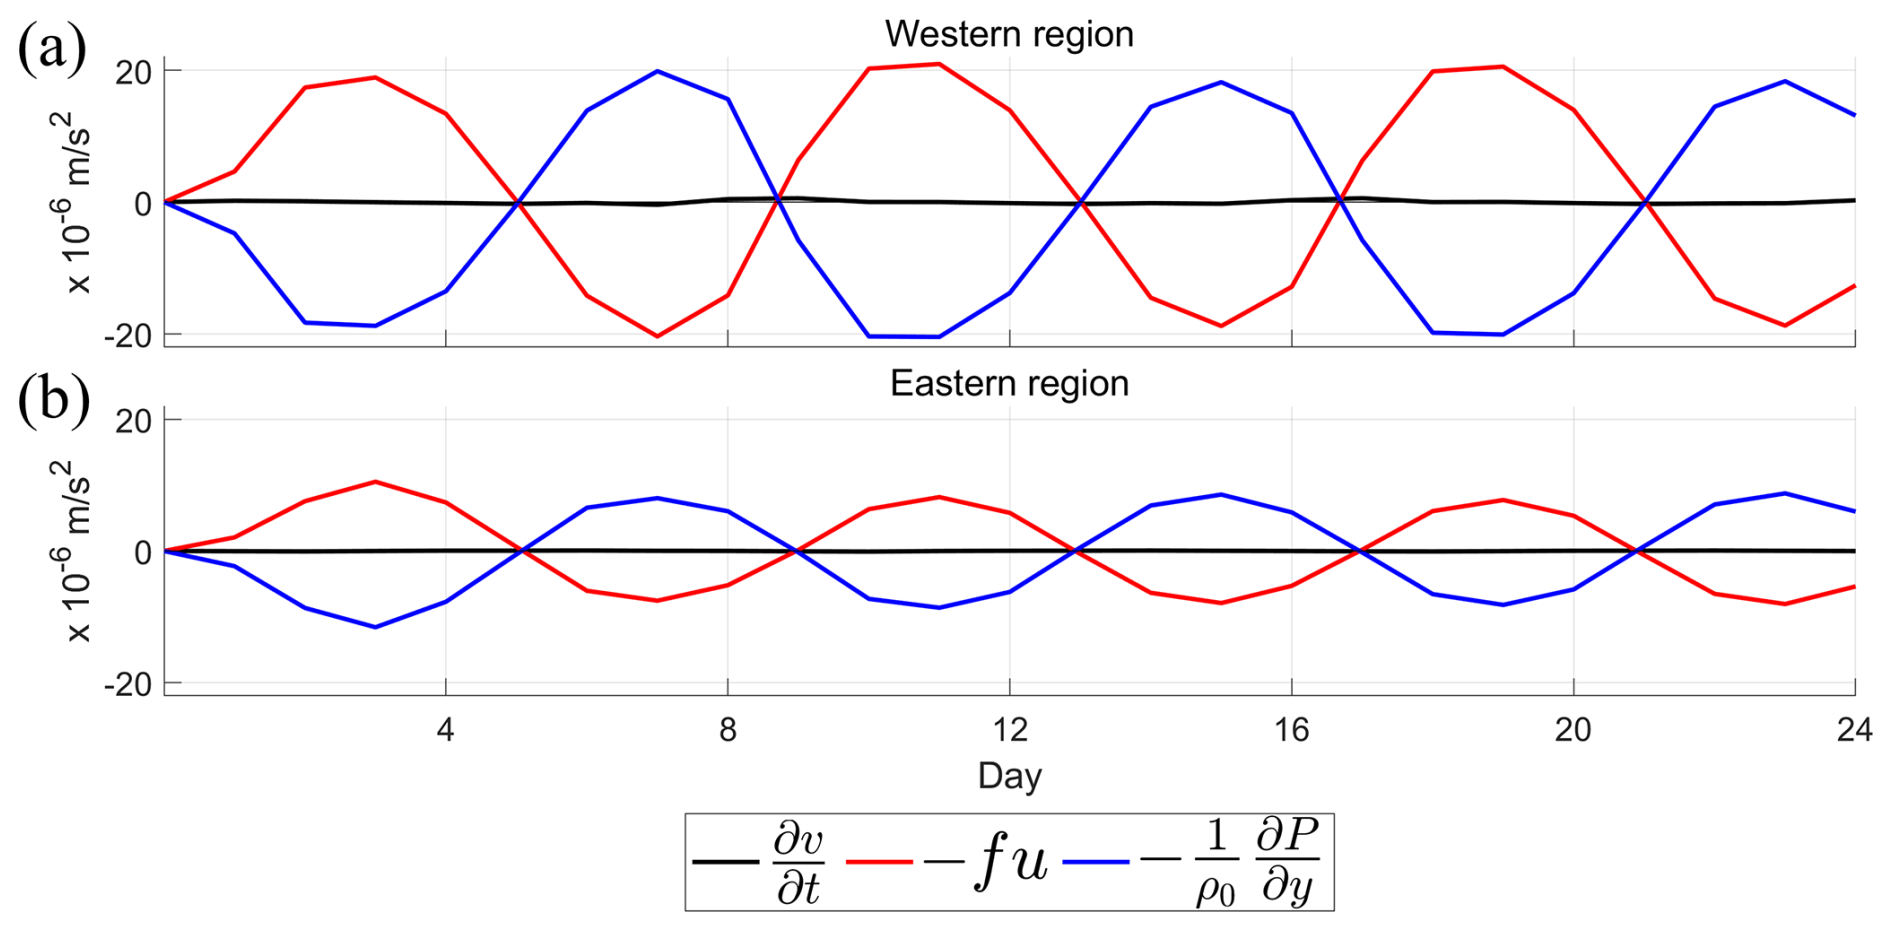
Figure 8Time series of cross-shore depth-averaged momentum balance terms from the idealized model results at the (a) western and (b) eastern regions (blue and orange crosses in Fig. 1b).
In the alongshore direction, the wind stress, PGF, Coriolis force, and bottom stress are in balance (Figs. 9 and 10). In both regions, the PGF primarily balances the Coriolis force, while the wind stress is offset by bottom stress over the shallower region. Notably, the bottom stress is strongest in the western region under both wind directions. The PGF opposes the wind stress in the eastern region but aligns with it in the western region, leading to enhanced alongshore current variability in the west. Time series of the alongshore momentum terms confirm that this contrast persists throughout the analysis period (Fig. 11b and c).
Although the depth-averaged wind stress is symmetric between the two regions (Figs. 9b and 10b), the resulting vertically integrated transport produces stronger convergence during westward winds and stronger divergence during eastward winds in the western region because the mass transport over the shallower region is more closely aligned with the wind direction. As a result, alongshore wind forcing over the bank generates laterally asymmetric sea level distributions (Fig. 6c and d), which in turn drive spatial variations in the alongshore PGF (Figs. 9c and 10c).
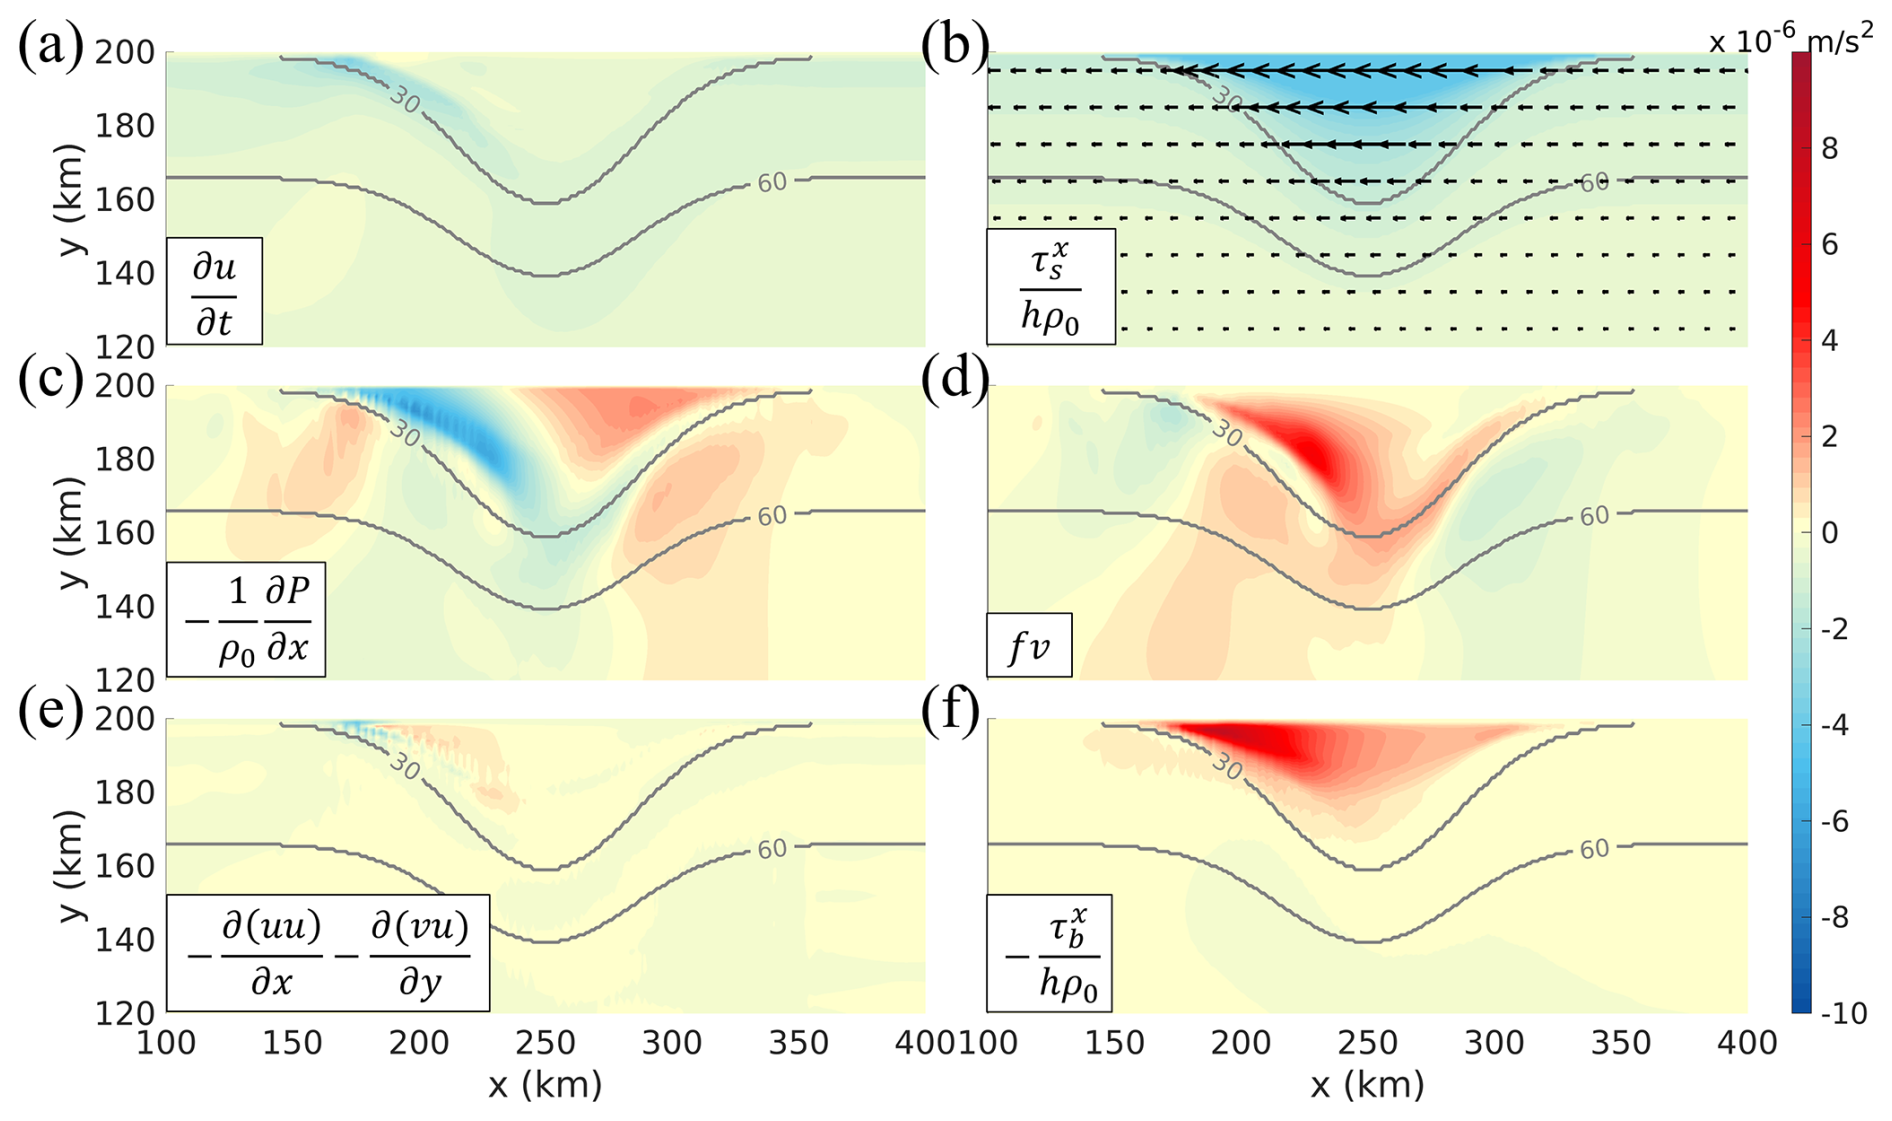
Figure 9Alongshore depth-averaged momentum balances calculated from the idealized model results during westward winds on day 18. Gray contours represent the bottom topography, with depths indicated in meters.
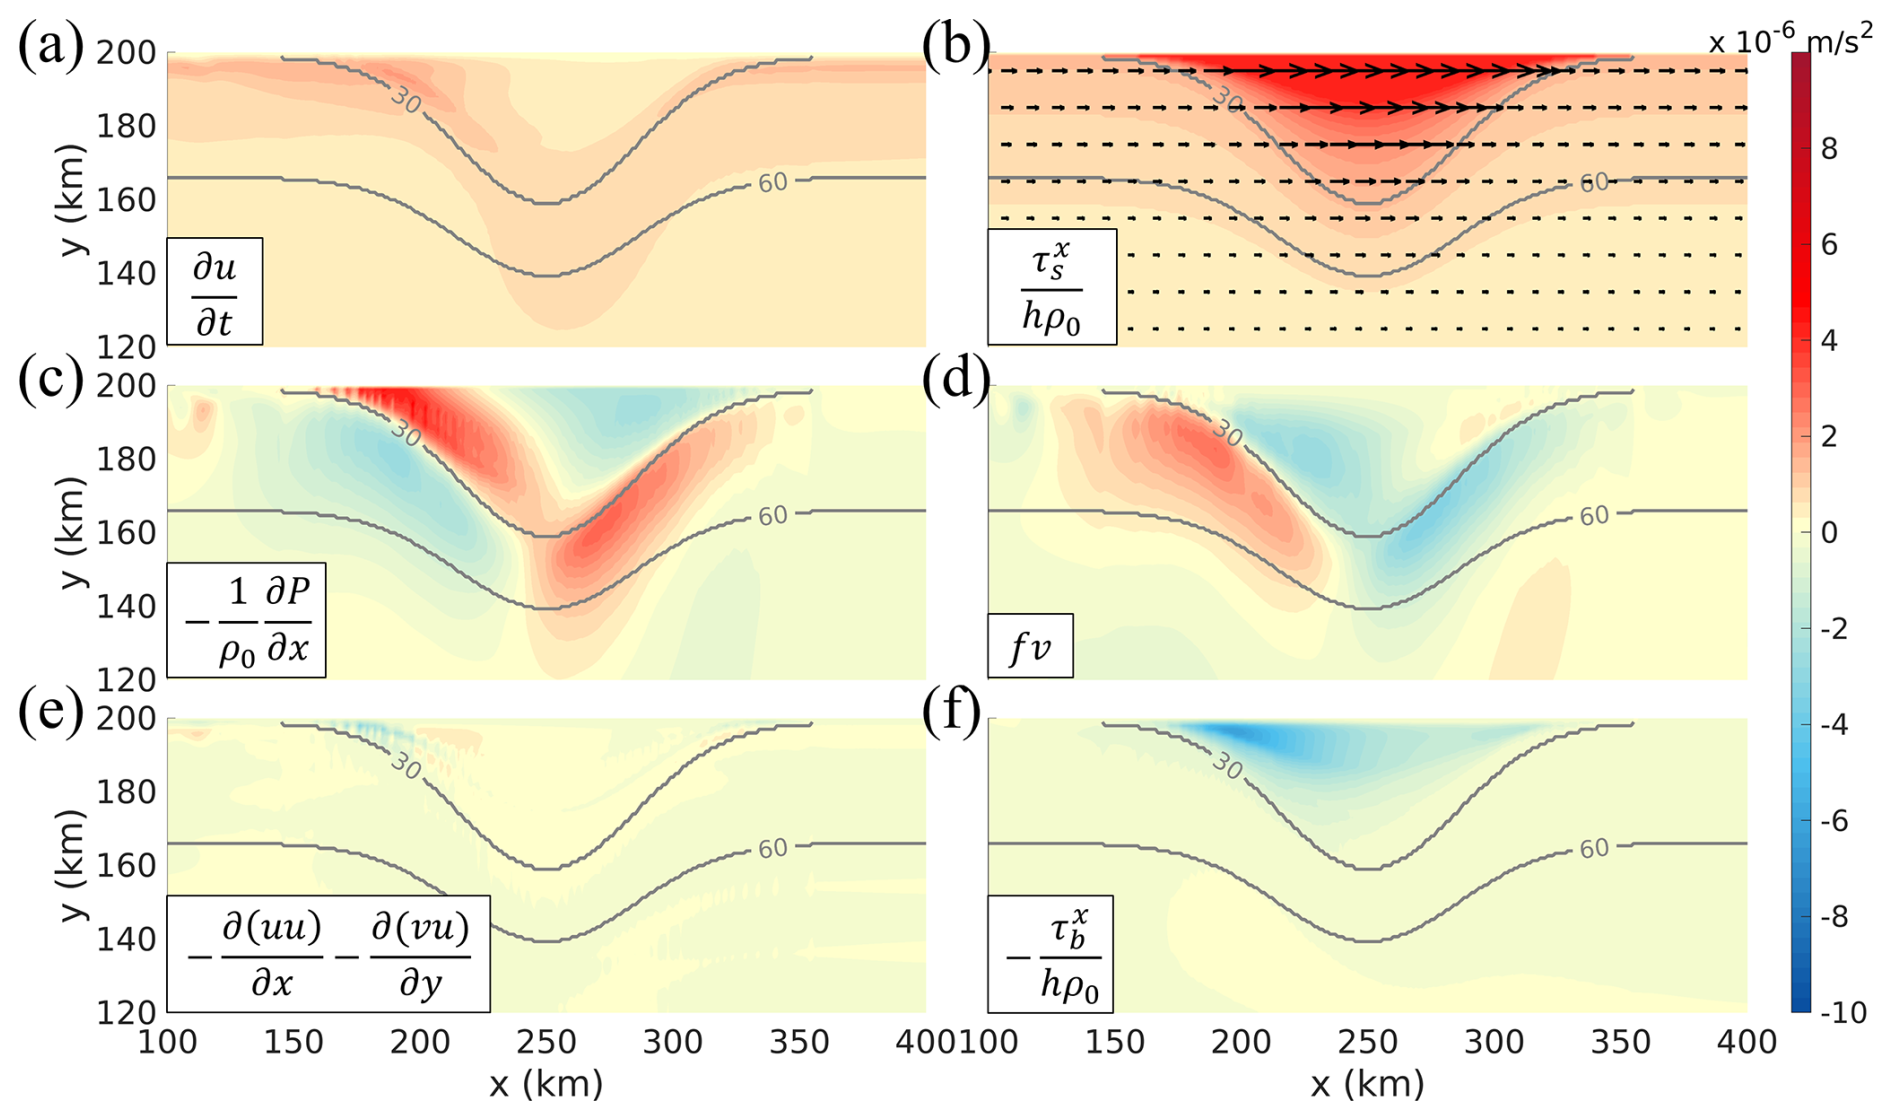
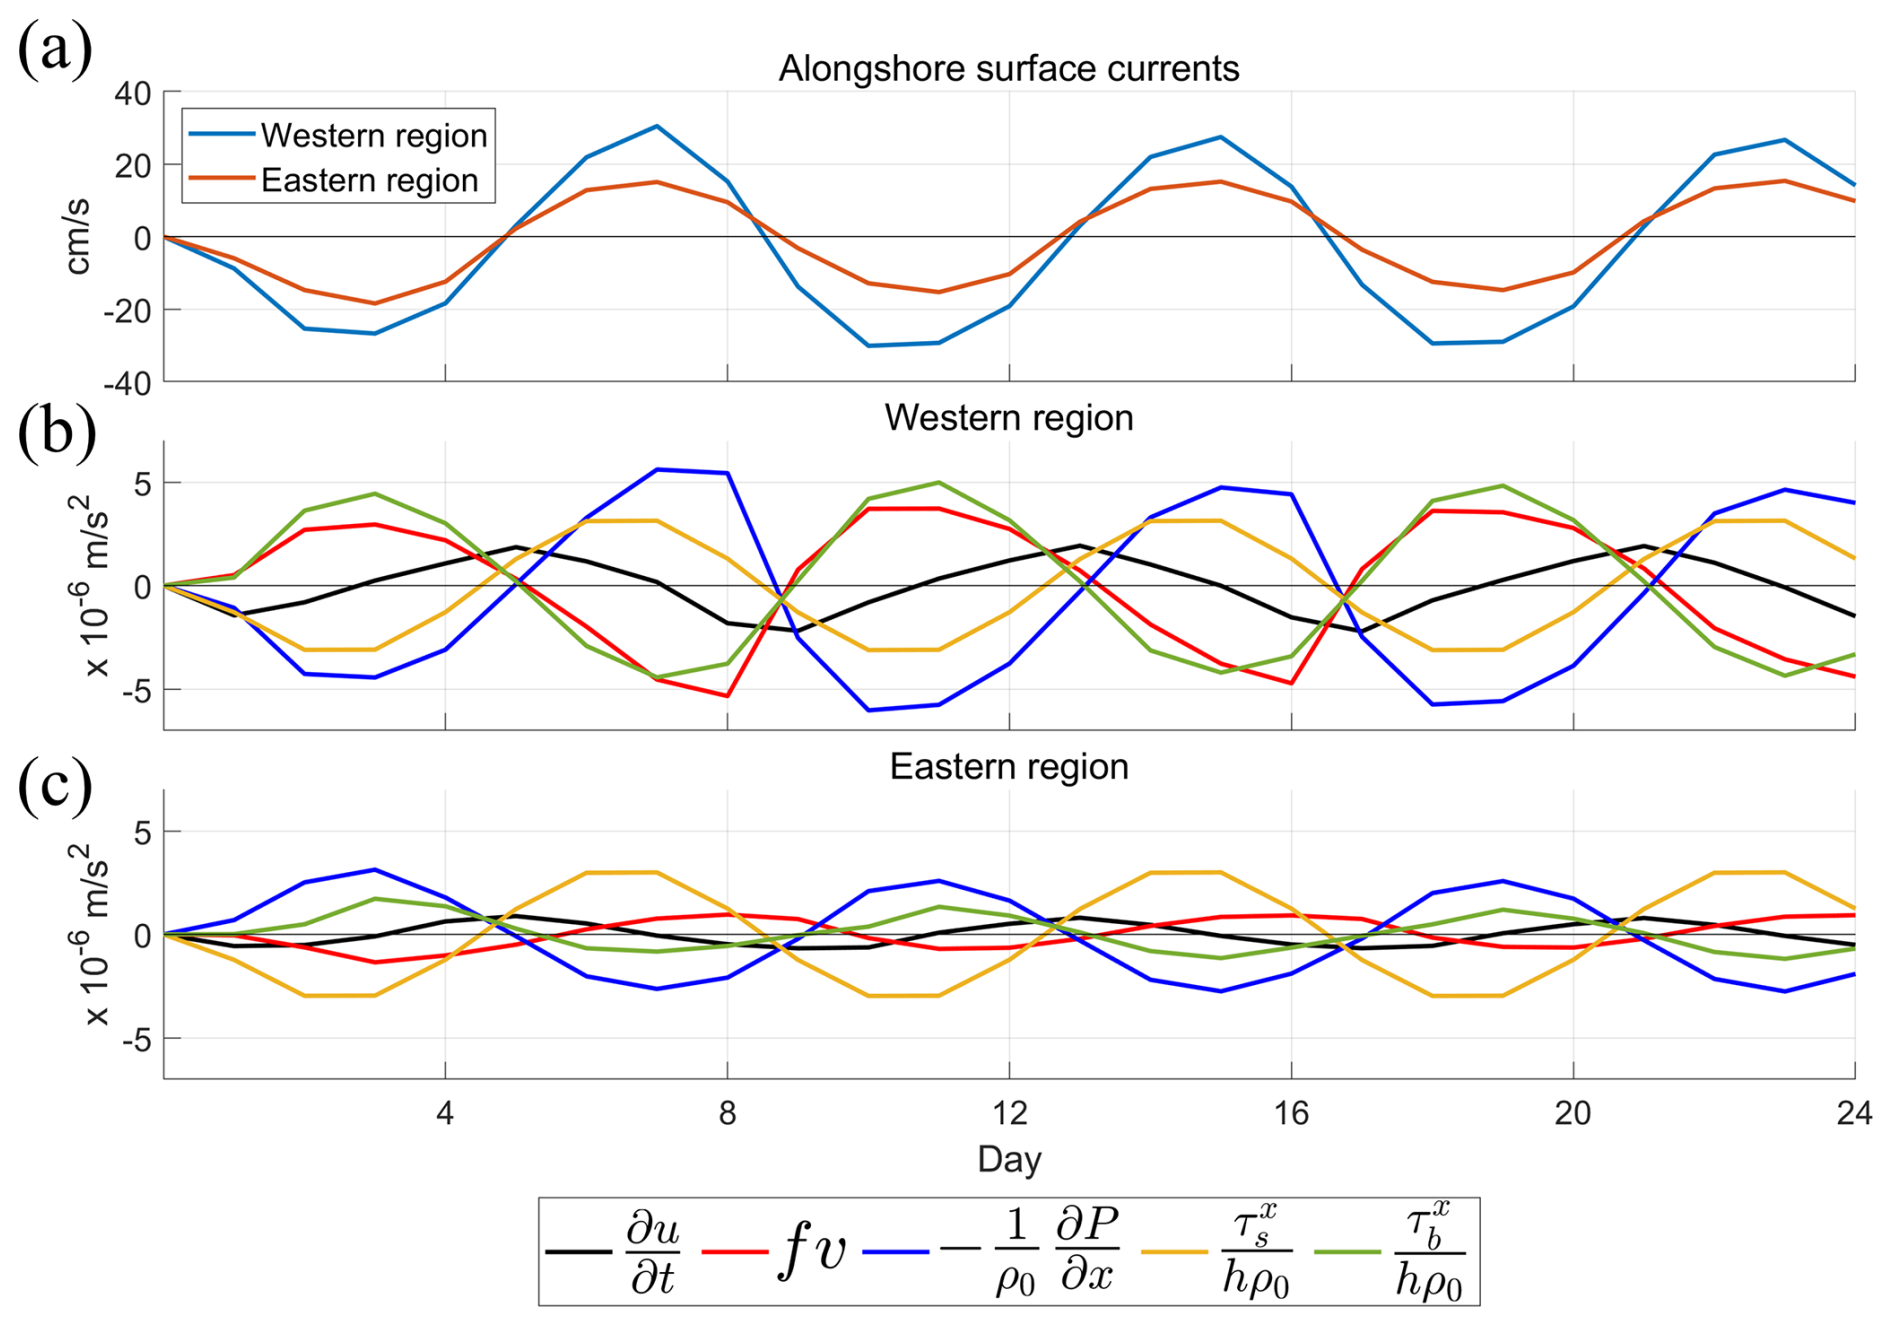
Figure 11(a) Time series of alongshore surface currents at the western (blue) and eastern (orange) regions (blue and orange crosses in Fig. 1b), and depth-averaged alongshore momentum balance terms from the idealized model results at the (b) western and (c) eastern regions (blue and orange crosses in Fig. 1b).
3.4 Influence of offshore currents on the asymmetry
In general, offshore currents can modulate both the strength and direction of coastal currents (Bane et al., 1988; Hinata et al., 2008; Palma et al., 2008; Park and Nam, 2018). In the southern sea of the Korean Peninsula, persistent eastward alongshore offshore currents exist (Cho et al., 2009, 2013; Jung and Cho, 2020; Kim et al., 2014; Pang et al., 2003; Teague et al., 2003). To examine how these offshore currents influence the asymmetric response of coastal currents, idealized numerical experiments including imposed offshore currents were conducted.
The results of these experiments are shown in Fig. 12. The offshore currents flow continuously from west to east, following the isobaths between the 30 and 60 m contours. In the absence of wind forcing, this current reaches a speed of approximately 30 cm s−1 near the bank head. During westward winds, a cyclonic coastal circulation develops in the western region (Fig. 12a), a feature that is absent in experiments without offshore currents (Fig. 6a). This cyclonic circulation enhances the westward coastal currents. In the eastern region, westward wind-driven currents veer northwestward, reducing their westward component. During eastward winds, the eastward coastal currents are further intensified by the eastward offshore currents (Fig. 12b).
The offshore currents also modify the sea level distribution. During westward winds, the sea level exhibits a pronounced offshore minimum in the western region (Fig. 12c), which coincides with the cyclonic circulation (Fig. 12a). During eastward winds, the sea level increases monotonically from the coast toward offshore (Fig. 12d), suppressing the development of a western coastal maximum (Fig. 6d). Consequently, sea level remains relatively low in the western region under both wind directions, although the location of the minimum shifts.
Despite these modifications to both the coastal currents and the sea level distribution, the asymmetric response of the coastal currents between the western and eastern regions remains qualitatively unchanged.
3.5 Sensitivity experiments on wind amplitude and period
In this study, the model was forced with a representative alongshore wind stress observed in the study area, using an 8 d period and an amplitude of 0.05 N m−2. Because wind forcing in the ocean spans a broad range of periods and amplitudes, sensitivity experiments were conducted to assess how the asymmetric response depends on wind stress characteristics.
Figure 13a and b summarize experiments with a fixed amplitude of 0.05 N m−2 and periods of 4, 8, and 12 d. In all cases, the alongshore surface currents (24 h moving average) exhibit larger variability in the western region (Fig. 13a) than in the eastern region (Fig. 13b), demonstrating that the asymmetry is robust to changes in the forcing period. Notably, the maximum surface current speed at the specified locations is nearly identical for the 8 and 12 d cases, suggesting a tendency toward saturation of the response under the present topographic setting and a wind stress amplitude of 0.05 N m−2. This behavior is consistent with previous studies describing mature upwelling and downwelling jets under sustained alongshore wind forcing (Whitney and Allen, 2009a, b). Experiments with steady westward and eastward wind stresses indicated that the alongshore surface currents reached nearly steady values comparable to the peak currents in the oscillatory wind experiments with 8 and 12 d forcing periods, with the eastward wind case showing less stable variability in surface currents (not shown).
Figure 13c and d show results for an 8 d wind period with wind stress amplitudes of 0.025, 0.05, and 0.075 N m−2. For all amplitudes, the alongshore surface currents (24 h moving average) exhibit larger variability in the western region (Fig. 13c) than in the eastern region (Fig. 13d), indicating that the asymmetric response persists across a range of wind stress magnitudes.
Power spectral density analyses of these sensitivity experiments consistently exhibit a single dominant peak that exactly matches the period of wind forcing in all cases (not shown).
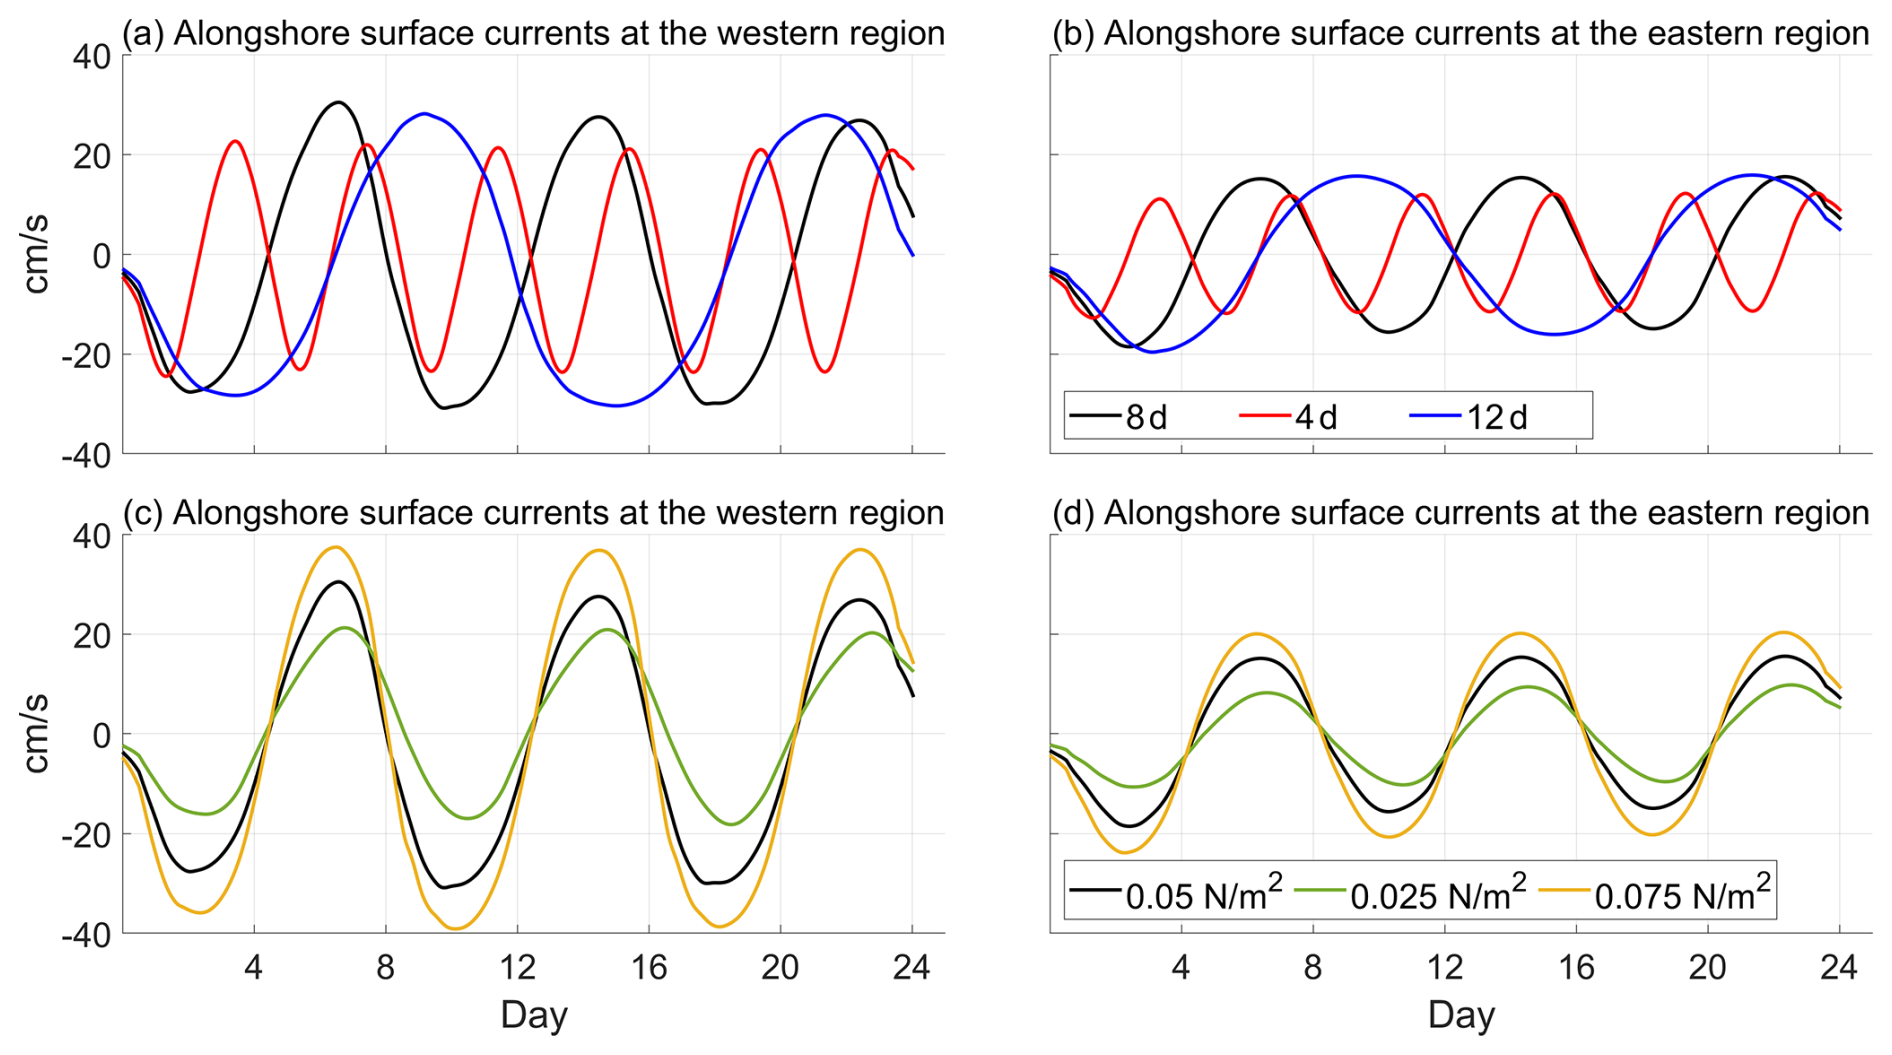
Figure 13Alongshore surface currents at the (a, c) western and (b, d) eastern regions (blue and orange crosses in Fig. 1b) from sensitivity experiments under (a, b) varying wind periods and (c, d) varying wind stress amplitudes.
To clarify the physical mechanisms driving the observed asymmetric current response over the coastal bank, it is necessary to evaluate several candidate dynamical frameworks. These include the arrested topographic wave (ATW), coastal-trapped lee waves, propagating topographic Rossby waves (TRWs), and the role of background stratification. The ATW framework describes a frictionally arrested and quasi-steady spatial adjustment to wind forcing. In contrast, coastal-trapped lee waves are transient, propagating features generated downstream of topographic variations. Similarly, propagating TRWs, generated by flow-topography interactions, could redistribute momentum and energy by propagating at intrinsic wave timescales. Finally, background stratification introduces baroclinic effects that can influence the observed asymmetry. In the following discussion, we evaluate each of these concepts to clarify their specific roles and limitations in generating the observed asymmetry.
The momentum balance analysis presented above shows a geostrophic balance in the cross-shore direction, while the alongshore momentum balance is maintained among wind stress, bottom stress, PGF, and Coriolis force, which is consistent with the ATW framework (Csanady, 1978). Although the depth-averaged wind stress is spatially symmetric across the bank, the resulting vertically integrated transport produces an asymmetric response because the mass transport over the shallower region becomes more aligned with the wind direction under the influence of strong bottom stress. This generates pronounced mass convergence and divergence in the western region during westward and eastward winds, respectively. Under these conditions, the disturbance generated by the mass convergence or divergence in the western region is subsequently governed by ATW dynamics, which describes the disturbance spreading out as a form of spatial diffusion. Furthermore, experiments with varying bottom friction suggest that current variability and cross-shore sea level gradients in the western region become stronger as bottom friction decreases (not shown), which is consistent with the ATW framework, where friction controls the spatial adjustment of the response. Because the topography converges toward the west, depth-integrated energy fluxes propagating westward converge strongly in the western region under both eastward and westward wind conditions. Thus, the enhanced variability observed in the western region reflects the spatial redistribution of energy. Within the ATW framework, energy flux convergence does not imply continuous local energy accumulation. Rather, it identifies a region where the continuously supplied energy flux must be balanced by enhanced dissipation. This balance is achieved through intensified current variability and associated sea level gradients in the western region.
The interaction between coastal currents and alongshore topographic variations can generate coastal-trapped lee waves when the current flows opposite to the phase propagation of coastal-trapped waves (Martell and Allen, 1979). Such waves can modulate coastal circulation and produce asymmetric current responses to alongshore wind stress (Chen et al., 2024; Zhang and Lentz, 2017, 2018). In contrast, when the current flows in the same direction as the phase propagation, the circulation tends to respond symmetrically (Zhang and Lentz, 2017, 2018).
However, in the present study, asymmetry in both coastal currents and sea level is observed under both westward and eastward winds. This directional independence differs from previously reported wave-induced asymmetries, suggesting that a mechanism distinct from coastal-trapped wave dynamics is responsible for the observed asymmetry.
Throughout the experiments, bottom stress plays a significant role in the alongshore momentum balance and can strongly damp propagating wave motions (Brink, 2006). Given the shallow bank depth (< 30 m over the bank and < 60 m on the flanks), bottom friction is expected to substantially limit the propagation of coastal-trapped waves. Thus, although transient or some trapped wave responses cannot be ruled out, the wind-driven response over the shallow bank is more likely governed by topographic adjustment over the bank rather than by propagating wave processes. Another potential source of the asymmetry is propagating TRWs, which can be generated through the interactions between the flow and bottom topography. Under the conditions of the present idealized model along the steep bathymetric gradients around the bank flank (buoyancy frequency of 0.02 s−1 and bottom slope of 0.0026), the estimated intrinsic TRW periods under stratified conditions (e.g., Ku et al., 2020; Rhines, 1970) are approximately 1 and 0.6 d for wavelengths of 50 and 100 km, respectively. However, the power spectral densities of surface currents and depth-averaged currents consistently exhibit a single dominant peak at 8 d (not shown), with no significant energy at shorter periods, including these intrinsic TRW timescales. In addition, given the bottom drag coefficient ( m s−1) used in the idealized model, the associated spin-down timescale along the bank edge is approximately 0.7 d, indicating that propagating TRWs would be strongly damped in this region. This confirms that the observed asymmetry is governed by frictionally arrested, quasi-steady dynamics over the bank rather than by propagating wave processes.
An experiment with uniform density suggested that the asymmetric response over the bank remained present, indicating that stratification is not essential for the asymmetry itself (not shown). However, if stratification is sufficiently strong to keep the Ekman layer shallower than the depth, oscillatory alongshore wind stress may weaken or suppress asymmetric responses over the bank because alongshore convergence and divergence would be weak (Hsueh and Kenney, 1972; Jung and Cho, 2023).
In addition to the factors discussed above, bank geometries, including dimensions and geometric asymmetry, can alter the location of upwelling and downwelling jets (Castelao and Barth, 2006; Whitney and Allen, 2009a, b). Because such jets may act as offshore currents, they can modulate the coastal circulation. Nevertheless, as discussed above, the qualitative asymmetry in alongshore currents and sea level may remain unchanged. Furthermore, if offshore currents are strong enough to overwhelm wind-driven coastal currents over the bank (Barth et al., 2005), the asymmetry may be reduced or absent. Even so, asymmetric wind-driven variability has been reported over a bank (Kosro, 2005), suggesting that an asymmetric response may emerge when wind stress is sufficiently strong to dominate the coastal bank circulation (Liao et al., 2018; Oey et al., 2014).
It should be noted that the observational data analyzed in this study span a specific period from July to September 2019. While the dominant 8 d wind period identified during this observational window may not reflect the full year-round wind climate, it effectively captures the characteristic timescales of synoptic weather events in this region. Although a detailed investigation into the seasonal variations of wind periodicity remains a subject for future study, our numerical sensitivity experiments demonstrate that the asymmetric current response over the bank robustly persists across a broad spectrum of forcing periods (from 4 to 12 d) and even under steady wind forcing (not shown). This consistent response indicates that the asymmetry proposed in this study is a fundamental feature of the coastal bank's general dynamics, independent of specific seasonal wind periods.
Observational data reveal an asymmetric response of alongshore surface currents over a coastal bank. Current variability is consistently larger in the western region than in the eastern region in response to oscillating alongshore wind stress. The asymmetry is well reproduced by a realistic model and is shown to be insensitive to the choice of observation stations.
Idealized numerical experiments, designed to isolate intrinsic variability over the bank, demonstrate that sea level reaches a maximum during westward winds and a minimum during eastward winds along the western coast of the bank. These sea level patterns produce stronger cross-shore sea level gradients, which play a central role in shaping the asymmetric current response.
Momentum balance analysis suggests that coastal currents are in geostrophic balance in the cross-shore direction. Consistent with the stronger sea level gradients, both the Coriolis force and the PGF are larger in the western region throughout the analysis period. In the alongshore direction, the PGF acts in the same direction as the wind stress in the western region but opposes it in the eastern region, leading to enhanced variability of coastal currents in the west. This contrast arises because vertically integrated transport over the shallower region is more closely aligned with the wind direction, resulting in stronger convergence during westward winds and stronger divergence during eastward winds in the western region. The resulting asymmetric mass redistribution leads to enhanced energy flux convergence in the western region, consistent with the ATW framework, associated with enhanced current variability and stronger sea level gradients in the western region.
Offshore currents modulate the coastal circulation by altering both current structures and sea level distributions over the bank. During westward winds, a cyclonic circulation develops in the western region, while during eastward winds, coastal currents accelerate and merge with the offshore currents. Nevertheless, the qualitative asymmetry between the western and eastern regions persists. Sensitivity experiments spanning a range of wind stress periods and amplitudes consistently show larger current variability in the western region, confirming that the asymmetric response is robust and not specific to the study period or location. These results suggest that similar asymmetries may be expected in other coastal regions with comparable bank geometry.
Beyond their dynamical significance, asymmetric coastal currents and sea level distributions may strongly influence nutrient transport and residence times, with important implications for coastal ecosystems. Further work, including more extensive observations and Lagrangian particle tracking, is needed to better understand the broader ecological implications of wind-driven asymmetry over coastal banks.
The observational currents dataset was obtained from the current observations conducted by the Korea Hydrographic and Oceanographic Agency (http://www.khoa.go.kr/oceangrid/gis/category/observe/observeSearch.do?type=EYS#none, last access: 6 October 2022). The wind dataset was obtained from the ocean data buoy, which was maintained by the Korea Meteorological Administration (https://data.kma.go.kr/data/sea/selectBuoyList.do?pgmNo=50, last access: 29 June 2022). The numerical model used in this study used open-access source code. The numerical model can be downloaded from https://www.myroms.org/ (last access: 26 July 2019).
JJ and YKC conceptualized and designed the study and experiments. JJ carried out the numerical experiments and performed the analysis. YKC acquired the funding and supervised the research. GHS and KYJ curated the observational data. JJ prepared the original manuscript, and all authors contributed to the review and editing of the manuscript.
The contact author has declared that none of the authors has any competing interests.
Publisher's note: Copernicus Publications remains neutral with regard to jurisdictional claims made in the text, published maps, institutional affiliations, or any other geographical representation in this paper. The authors bear the ultimate responsibility for providing appropriate place names. Views expressed in the text are those of the authors and do not necessarily reflect the views of the publisher.
This research was funded by the Korea Hydrographic and Oceanographic Agency (KHOA) through the “Analysis and Prediction of Sea Level Change in Response to Climate Change around the Korean Peninsula” program and the Korea Institute of Marine Science & Technology Promotion (KIMST) funded by the Ministry of Oceans and Fisheries (RS-2022-KS221544).
This research has been supported by the Ministry of Oceans and Fisheries (grant no. RS-2022-KS221544).
This paper was edited by Matjaz Licer and reviewed by two anonymous referees.
Allen, J. S.: Models of wind-driven currents on the continental shelf, Annu. Rev. Fluid Mech., 12, 389–433, https://doi.org/10.1146/annurev.fl.12.010180.002133, 1980.
Allen, S. E. and Hickey, B. M.: Dynamics of advection‐driven upwelling over a shelf break submarine canyon, J. Geophys. Res.-Oceans, 115, C08018, https://doi.org/10.1029/2009JC005731, 2010.
Bane Jr., J. M., Brown, O. B., Evans, R. H., and Hamilton, P.: Gulf Stream remote forcing of shelfbreak currents in the Mid‐Atlantic Bight, Geophys. Res. Lett., 15, 405–407, https://doi.org/10.1029/GL015i005p00405, 1988.
Barth, J. A., Pierce, S. D., and Castelao, R. M.: Time‐dependent, wind‐driven flow over a shallow midshelf submarine bank, J. Geophys. Res.-Oceans, 110, C10S05, https://doi.org/10.1029/2004JC002761, 2005.
Brink, K. H.: Low-Frequency Free Wave and Wind-Driven Motions Over a Submarine Bank, J. Phys. Oceanogr., 13, 103–116, https://doi.org/10.1175/1520-0485(1983)013<0103:LFFWAW>2.0.CO;2, 1983.
Brink, K. H.: Coastal ocean physical processes, Rev. Geophys., 25, 204–216, https://doi.org/10.1029/RG025i002p00204, 1987.
Brink, K. H.: Coastal-trapped waves with finite bottom friction, Dynam. Atmos. Oceans, 41, 172–190, https://doi.org/10.1016/j.dynatmoce.2006.05.001, 2006.
Brink, K. H., Limeburner, R., and Beardsley, R. C.: Properties of flow and pressure over Georges Bank as observed with near-surface drifters, J. Geophys. Res.-Oceans, 108, https://doi.org/10.1029/2001JC001019, 2003.
Brink, K. H., Beardsley, R. C., Limeburner, R., Irish, J. D., and Caruso, M.: Long-term moored array measurements of currents and hydrography over Georges Bank: 1994–1999, Prog. Oceanogr., 82, 191–223, https://doi.org/10.1016/j.pocean.2009.07.004, 2009.
Castelao, R. M. and Barth, J. A.: Coastal ocean response to summer upwelling favorable winds in a region of alongshore bottom topography variations off Oregon, J. Geophys. Res.-Oceans, 110, https://doi.org/10.1029/2004JC002409, 2005.
Castelao, R. M. and Barth, J. A.: The relative importance of wind strength and along-shelf bathymetric variations on the separation of a coastal upwelling jet, J. Phys. Oceanogr., 36, 412–425, https://doi.org/10.1175/JPO2867.1, 2006.
Chen, C. and Beardsley, R. C.: A Numerical Study of Stratified Tidal Rectification over Finite-Amplitude Banks. Part I: Symmetric Banks, J. Phys. Oceanogr., 25, 2090–2110, https://doi.org/10.1175/1520-0485(1995)025<2090:ANSOST>2.0.CO;2, 1995.
Chen, C., Beardsley, R. C., and Limeburner, R.: A Numerical Study of Stratified Tidal Rectification over Finite-Amplitude Banks. Part II: Georges Bank, J. Phys. Oceanogr., 25, 2111–2128, https://doi.org/10.1175/1520-0485(1995)025<2111:ANSOST>2.0.CO;2, 1995.
Chen, Z., Jiang, Y., Wang, J., and Gong, W.: Influence of a River Plume on Coastal Upwelling Dynamics: Importance of Stratification, J. Phys. Oceanogr., 49, 2345–2363, https://doi.org/10.1175/JPO-D-18-0215.1, 2019.
Chen, Z., Li, C., Zhang, S., Jiang, Y., and Wang, A.: Effects of Stratification on Wind-Driven Upwelling Over a Coastal Valley, J. Geophys. Res.-Oceans, 129, e2024JC021063, https://doi.org/10.1029/2024JC021063, 2024.
Cho, Y.-K., Seo, G.-H., Choi, B.-J., Kim, S., Kim, Y.-G., Youn, Y.-H., and Dever, E. P.: Connectivity among straits of the northwest Pacific marginal seas, J. Geophys. Res.-Oceans, 114, https://doi.org/10.1029/2008JC005218, 2009.
Cho, Y.-K., Seo, G.-H., Kim, C.-S., Choi, B.-J., and Shaha, D. C.: Role of wind stress in causing maximum transport through the Korea Strait in autumn, J. Mar. Syst., 115–116, 33–39, https://doi.org/10.1016/j.jmarsys.2013.02.002, 2013.
Csanady, G. T.: The Arrested Topographic Wave, J. Phys. Oceanogr., 8, 47–62, https://doi.org/10.1175/1520-0485(1978)008<0047:TATW>2.0.CO;2, 1978.
Davidson, F. J., Greatbatch, R. J., and de Young, B.: Asymmetry in the response of a stratified coastal embayment to wind forcing, J. Geophys. Res.-Oceans, 106, 7001–7015, https://doi.org/10.1029/2000JC900052, 2001.
Gan, J. and Allen, J. S.: A modeling study of shelf circulation off northern California in the region of the Coastal Ocean Dynamics Experiment: Response to relaxation of upwelling winds, J. Geophys. Res.-Oceans, 107, 6-1–6-31, https://doi.org/10.1029/2000JC000768, 2002.
Gan, J., Cheung, A., Guo, X., and Li, L.: Intensified upwelling over a widened shelf in the northeastern South China Sea, J. Geophys Res.-Oceans, 114, https://doi.org/10.1029/2007JC004660, 2009.
Geyer, W. R., Hill, P. S., and Kineke, G. C.: The transport, transformation and dispersal of sediment by buoyant coastal flows, Cont. Shelf Res., 24, 927–949, https://doi.org/10.1016/j.csr.2004.02.006, 2004.
Hinata, H., Yanagi, T., and Satoh, C.: Sea level response to wind field fluctuation around the tip of the Izu Peninsula, J. Oceanogr., 64, 605–620, https://doi.org/10.1007/s10872-008-0051-z, 2008.
Hsueh, Y. and Kenney III, R. N.: Steady coastal upwelling in a continuously stratified ocean, J. Phys. Oceanogr., 2, 27–33, https://doi.org/10.1175/1520-0485(1972)002<0027:SCUIAC>2.0.CO;2, 1972.
Huyer, A., Smith, R. L., and Sobey, E. J.: Seasonal differences in low‐frequency current fluctuations over the Oregon continental shelf, J. Geophys. Res.-Oceans, 83, 5077–5089, https://doi.org/10.1029/JC083iC10p05077, 1978.
James, I. D.: Modelling pollution dispersion, the ecosystem and water quality in coastal waters: a review, Environ. Modell. Softw., 17, 363–385, https://doi.org/10.1016/S1364-8152(01)00080-9, 2002.
Jung, J. and Cho, Y.-K.: Persistence of coastal upwelling after a plunge in upwelling-favourable wind, Sci. Rep., 10, 1–9, https://doi.org/10.1038/s41598-020-67785-x, 2020.
Jung, J. and Cho, Y.-K.: Effects of Surface Heating on Coastal Upwelling Intensity, J. Geophys. Res.-Oceans, 128, e2022JC018795, https://doi.org/10.1029/2022JC018795, 2023.
Kim, C.-S., Cho, Y.-K., Seo, G.-H., Choi, B.-J., Jung, K. T., and Lee, B.-G.: Interannual variation of freshwater transport and its causes in the Korea Strait: A modeling study, J. Mar. Syst., 132, 66–74, https://doi.org/10.1016/j.jmarsys.2014.01.007, 2014.
Kirincich, A. R. and Barth, J. A.: Alongshelf variability of inner-shelf circulation along the central Oregon coast during summer, J. Phys. Oceanogr., 39, 1380–1398, 2009.
Kosro, P. M.: On the spatial structure of coastal circulation off Newport, Oregon, during spring and summer 2001 in a region of varying shelf width, J. Geophys. Res.-Oceans, 110, C10S06, https://doi.org/10.1029/2004JC002769, 2005.
Ku, A., Seung, Y. H., Jeon, C., Choi, Y., Yoshizawa, E., Shimada, K., Cho, K.-H., and Park, J.-H.: Observation of Bottom-Trapped Topographic Rossby Waves on the Shelf Break of the Chukchi Sea, J. Geophys. Res.-Oceans, 125, e2019JC015436, https://doi.org/10.1029/2019JC015436, 2020.
Ledwell, J. R., Watson, A. J., and Law, C. S.: Mixing of a tracer in the pycnocline, J. Geophys. Res.-Oceans, 103, 21499–21529, https://doi.org/10.1029/98JC01738, 1998.
Liao, E., Oey, L. Y., Yan, X.-H., Li, L., and Jiang, Y.: The deflection of the China Coastal Current over the Taiwan Bank in winter, J. Phys. Oceanogr., 48, 1433–1450, https://doi.org/10.1175/JPO-D-17-0037.1, 2018.
Liu, Z. and Gan, J.: Modeling study of variable upwelling circulation in the East China Sea: Response to a coastal promontory, J. Phys. Oceanogr., 44, 1078–1094, https://doi.org/10.1175/JPO-D-13-0170.1, 2014.
Martell, C. M. and Allen, J. S.: The Generation of Continental Shelf Waves by Alongshore Variations in Bottom Topography, J. Phys. Oceanogr., 9, 696–711, https://doi.org/10.1175/1520-0485(1979)009<0696:TGOCSW>2.0.CO;2, 1979.
Mellor, G. L. and Yamada, T.: Development of a turbulence closure model for geophysical fluid problems, Rev. Geophys., 20, 851–875, https://doi.org/10.1029/RG020i004p00851, 1982.
Naimie, C. E.: Georges Bank residual circulation during weak and strong stratification periods: Prognostic numerical model results, J. Geophys. Res.-Oceans, 101, 6469–6486, https://doi.org/10.1029/95JC03698, 1996.
Naimie, C. E., Loder, J. W., and Lynch, D. R.: Seasonal variation of the three-dimensional residual circulation on Georges Bank, J. Geophys. Res.-Oceans, 99, 15967–15989, https://doi.org/10.1029/94JC01202, 1994.
Noble, M., Butman, B., and Wimbush, M.: Wind–Current Coupling on the Southern Flank of Georges Bank: Variation with Season and Frequency, J. Phys. Oceanogr., 15, https://doi.org/10.1175/1520-0485(1985)015<0604:WCOTSF>2.0.CO;2, 1985.
Oey, L.-Y., Zhang, Y.-H., and Chen, P.: Simulation of the Norwegian Coastal Current in the vicinity of the Halten Bank: comparison with observations and process study of bank-induced meanders, J. Mar. Syst., 3, 391–416, https://doi.org/10.1016/0924-7963(92)90012-W, 1992.
Oey, L.-Y., Chang, Y.-L., Lin, Y.-C., Chang, M.-C., Varlamov, S., and Miyazawa, Y.: Cross flows in the Taiwan Strait in winter, J. Phys. Oceanogr., 44, 801–817, https://doi.org/10.1175/JPO-D-13-0128.1, 2014.
Palma, E. D. and Matano, R. P.: Disentangling the upwelling mechanisms of the South Brazil Bight, Cont. Shelf Res., 29, 1525–1534, https://doi.org/10.1016/j.csr.2009.04.002, 2009.
Palma, E. D., Matano, R. P., and Piola, A. R.: A numerical study of the Southwestern Atlantic Shelf circulation: Stratified ocean response to local and offshore forcing, J. Geophys. Res.-Oceans, 113, C11010, https://doi.org/10.1029/2007JC004720, 2008.
Pang, I. C., Hong, C. S., Chang, K. I., Lee, J. C., and Kim, J. T.: Monthly variation of water mass distribution and current in the Cheju Strait, J. Korean Soc. Oceanogr., 38, 87–100, 2003.
Park, J.-H. and Nam, S.: Causes of Interannual Variation of Summer Mean Alongshore Current Near the East Coast of Korea Derived From 16‐Year‐Long Observational Data, J. Geophys. Res.-Oceans, 123, 7781–7794, https://doi.org/10.1029/2018JC014053, 2018.
Pringle, J. M.: Enhancement of Wind-Driven Upwelling and Downwelling by Alongshore Bathymetric Variability, J. Phys. Oceanogr., 32, 3101–3112, https://doi.org/10.1175/1520-0485(2002)032<3101:EOWDUA>2.0.CO;2, 2002.
Pringle, J. M. and Dever, E. P.: Dynamics of wind-driven upwelling and relaxation between Monterey Bay and Point Arena: Local-, regional-, and gyre-scale controls, J. Geophys. Res.-Oceans, 114, C07003, https://doi.org/10.1029/2008JC005016, 2009.
Rhines, P.: Edge‐, bottom‐, and Rossby waves in a rotating stratified fluid, Geophys. Fluid Dynam., 1, 273–302, https://doi.org/10.1080/03091927009365776, 1970.
Rosenfeld, L. K., Schwing, F. B., Garfield, N., and Tracy, D. E.: Bifurcated flow from an upwelling center: a cold water source for Monterey Bay, Cont. Shelf Res., 14, 931–964, https://doi.org/10.1016/0278-4343(94)90058-2, 1994.
Saldías, G. S. and Allen, S. E.: The influence of a submarine canyon on the circulation and cross-shore exchanges around an upwelling front, J. Phys. Oceanogr., 50, 1677–1698, https://doi.org/10.1175/JPO-D-19-0130.1, 2020.
Saldías, G. S., Ramos-Musalem, K., and Allen, S. E.: Circulation and Upwelling Induced by Coastal Trapped Waves Over a Submarine Canyon in an Idealized Eastern Boundary Margin, Geophys. Res. Lett., 48, e2021GL093548, https://doi.org/10.1029/2021GL093548, 2021.
Shchepetkin, A. F. and McWilliams, J. C.: The regional oceanic modeling system (ROMS): a split-explicit, free-surface, topography-following-coordinate oceanic model, Ocean Model., 9, 347–404, https://doi.org/10.1016/j.ocemod.2004.08.002, 2005.
Su, J. and Pohlmann, T.: Wind and topography influence on an upwelling system at the eastern Hainan coast, J. Geophys. Res.-Oceans, 114, C06017, https://doi.org/10.1029/2008JC005018, 2009.
Teague, W. J., Jacobs, G. A., Ko, D. S., Tang, T. Y., Chang, K.-I., and Suk, M.-S.: Connectivity of the Taiwan, Cheju, and Korea straits, Cont. Shelf Res., 23, 63–77, https://doi.org/10.1016/S0278-4343(02)00150-4, 2003.
Trasviña, A., Barton, E. D., Brown, J., Velez, H. S., Kosro, P. M., and Smith, R. L.: Offshore wind forcing in the Gulf of Tehuantepec, Mexico: The asymmetric circulation, J. Geophys. Res.-Oceans, 100, 20649–20663, 1995.
Washburn, L. and McPhee-Shaw, E.: Coastal Transport Processes Affecting Inner-Shelf Ecosystems in the California Current System, Oceanography, 26, 34–43, 2013.
Whitney, F. A., Crawford, W. R., and Harrison, P. J.: Physical processes that enhance nutrient transport and primary productivity in the coastal and open ocean of the subarctic NE Pacific, Deep-Sea Res. Pt. II, 52, 681–706, https://doi.org/10.1016/j.dsr2.2004.12.023, 2005.
Whitney, M. M. and Allen, J. S.: Coastal wind-driven circulation in the vicinity of a bank. Part I: Modeling flow over idealized symmetric banks, J. Phys. Oceanogr., 39, 1273–1297, https://doi.org/10.1175/2008JPO3966.1, 2009a.
Whitney, M. M. and Allen, J. S.: Coastal wind-driven circulation in the vicinity of a bank. Part II: Modeling flow over the Heceta Bank complex on the Oregon coast, J. Phys. Oceanogr., 39, 1298–1316, https://doi.org/10.1175/2008JPO3967.1, 2009b.
Winant, C. D.: Coastal circulation and wind-induced currents, Annu. Rev. Fluid Mech., 12, 271–301, https://doi.org/10.1146/annurev.fl.12.010180.001415, 1980.
Zhang, W. and Lentz, S. J.: Wind-Driven Circulation in a Shelf Valley. Part I: Mechanism of the Asymmetrical Response to Along-Shelf Winds in Opposite Directions, J. Phys. Oceanogr., 47, 2927–2947, https://doi.org/10.1175/JPO-D-17-0083.1, 2017.
Zhang, W. and Lentz, S. J.: Wind-Driven Circulation in a Shelf Valley. Part II: Dynamics of the Along-Valley Velocity and Transport, J. Phys. Oceanogr., 48, 883–904, https://doi.org/10.1175/JPO-D-17-0084.1, 2018.
Zhang, W. G., Gawarkiewicz, G. G., McGillicuddy, D. J., and Wilkin, J. L.: Climatological mean circulation at the New England shelf break, J. Phys. Oceanogr., 41, 1874–1893, https://doi.org/10.1175/2011JPO4604.1, 2011.