the Creative Commons Attribution 4.0 License.
the Creative Commons Attribution 4.0 License.
 | 17 Jun 2026
Radionuclides as tracers of Arctic outflows: pathways, water mass mixing, and freshwater input to Davis Strait and the Labrador Sea
Lisa G. T. Leist
Maxi Castrillejo
Kumiko Azetsu-Scott
Craig Lee
Jed Lenetsky
Marc Ringuette
Christof Vockenhuber
Habacuc Pérez-Tribouillier
Catherine Jeandel
Jean-Éric Tremblay
Núria Casacuberta
In Davis Strait, one of two primary Arctic gateways between the Arctic and Atlantic Oceans, the exchange between northward-flowing Atlantic waters and southward-flowing Arctic waters possibly influences deep-water formation in the subpolar North Atlantic. Yet, these circulation pathways and mixing processes, that may be changing, remain uncertain, underscoring the need for new tracers to resolve their structure and variability. This study employs observations from 2022 and 2024 of two artificial radionuclides, 129I and 236U, as new tracers of water masses in Baffin Bay, Davis Strait and the Labrador Sea. Samples were collected during three expeditions: the AZOMP occupation of the AR7W Line in May 2022, Davis Strait Observation Program in October 2022, and the Amundsen Expedition as part of the Refuge Arctic and Transforming Climate Action programme in September–October 2024. By defining the characteristic 129I and 236U concentrations of the main inflowing waters, we examined the distribution, origin and formation of key water masses in Baffin Bay. Our results reveal a substantial contribution (75 %) of West Greenland Shelf Water to Arctic Water on the surface of central Baffin Bay. 236U-rich Arctic-Atlantic-derived water entering Baffin Bay via Lancaster Sound contributes 40 %–60 % to the formation of the Transition Water observed in Baffin Bay. In contrast, cold Arctic Water appears to originate mainly from Nares Strait, and is derived primarily (up to 70 %) from Arctic-Atlantic Water. Notably, the contribution of the Baffin Bay Transition Water to the formation of LSW was significant, exceeding 20 %. However, the binary mixing model showed limitations in quantifying the origin of North East Atlantic Deep Water due to low tracer concentrations and the likely influence of multiple water mass sources. This study offers novel insights into the origin and transformation of water in Baffin Bay and the Labrador Sea and enhances our understanding of the complex interactions between the Arctic Ocean and the subpolar North Atlantic.
- Article
(7893 KB) - Full-text XML
- BibTeX
- EndNote


1.1 Davis Strait, connecting the Arctic with the subpolar North Atlantic
Davis Strait, situated between western Greenland and Baffin Island (Fig. 1A), is a key gateway for the exchange of water masses between the Arctic Ocean and the North Atlantic (Haine et al., 2015; Curry et al., 2014; Huang et al., 2024; Rudels et al., 2004; Komuro and Hasumi, 2005). The sill of Davis Strait, with a depth of approximately 1060 m, defines the southern boundary of Baffin Bay (maximum depth 2300 m) and the northern boundary of the Labrador Sea (maximum depth 3500 m). Through this passage, cold and fresh southward-flowing waters from Baffin Bay meet the northward-flowing warm Atlantic waters entering from the Labrador Sea. Both the fluxes and the water mass properties in Davis Strait exhibit pronounced seasonal variability (Cuny et al., 2005; Curry et al., 2014). The largest changes in temperature and salinity originate from modifications within Baffin Bay, which receives Arctic-derived waters via the main channels of the Canadian Arctic Archipelago (CAA). These include Nares Strait, connecting to the Eurasian Basin, as well as Lancaster Sound and Jones Sound, which link to the Canada Basin (Münchow et al., 2015; Rudels, 2011; Tang et al., 2004; Pelle et al., 2026). At the same time, Baffin Bay receives an Atlantic inflow from the Labrador Sea, linking Baffin Bay to the western subpolar gyre and key regions of deep convection, which contribute to the Atlantic Meridional Overturning Circulation (AMOC), the ventilation of deep waters, and the oceanic uptake of anthropogenic CO2 (Tang et al., 2004; Le Bras, 2023; Lozier, 2023; Rhein et al., 2017).
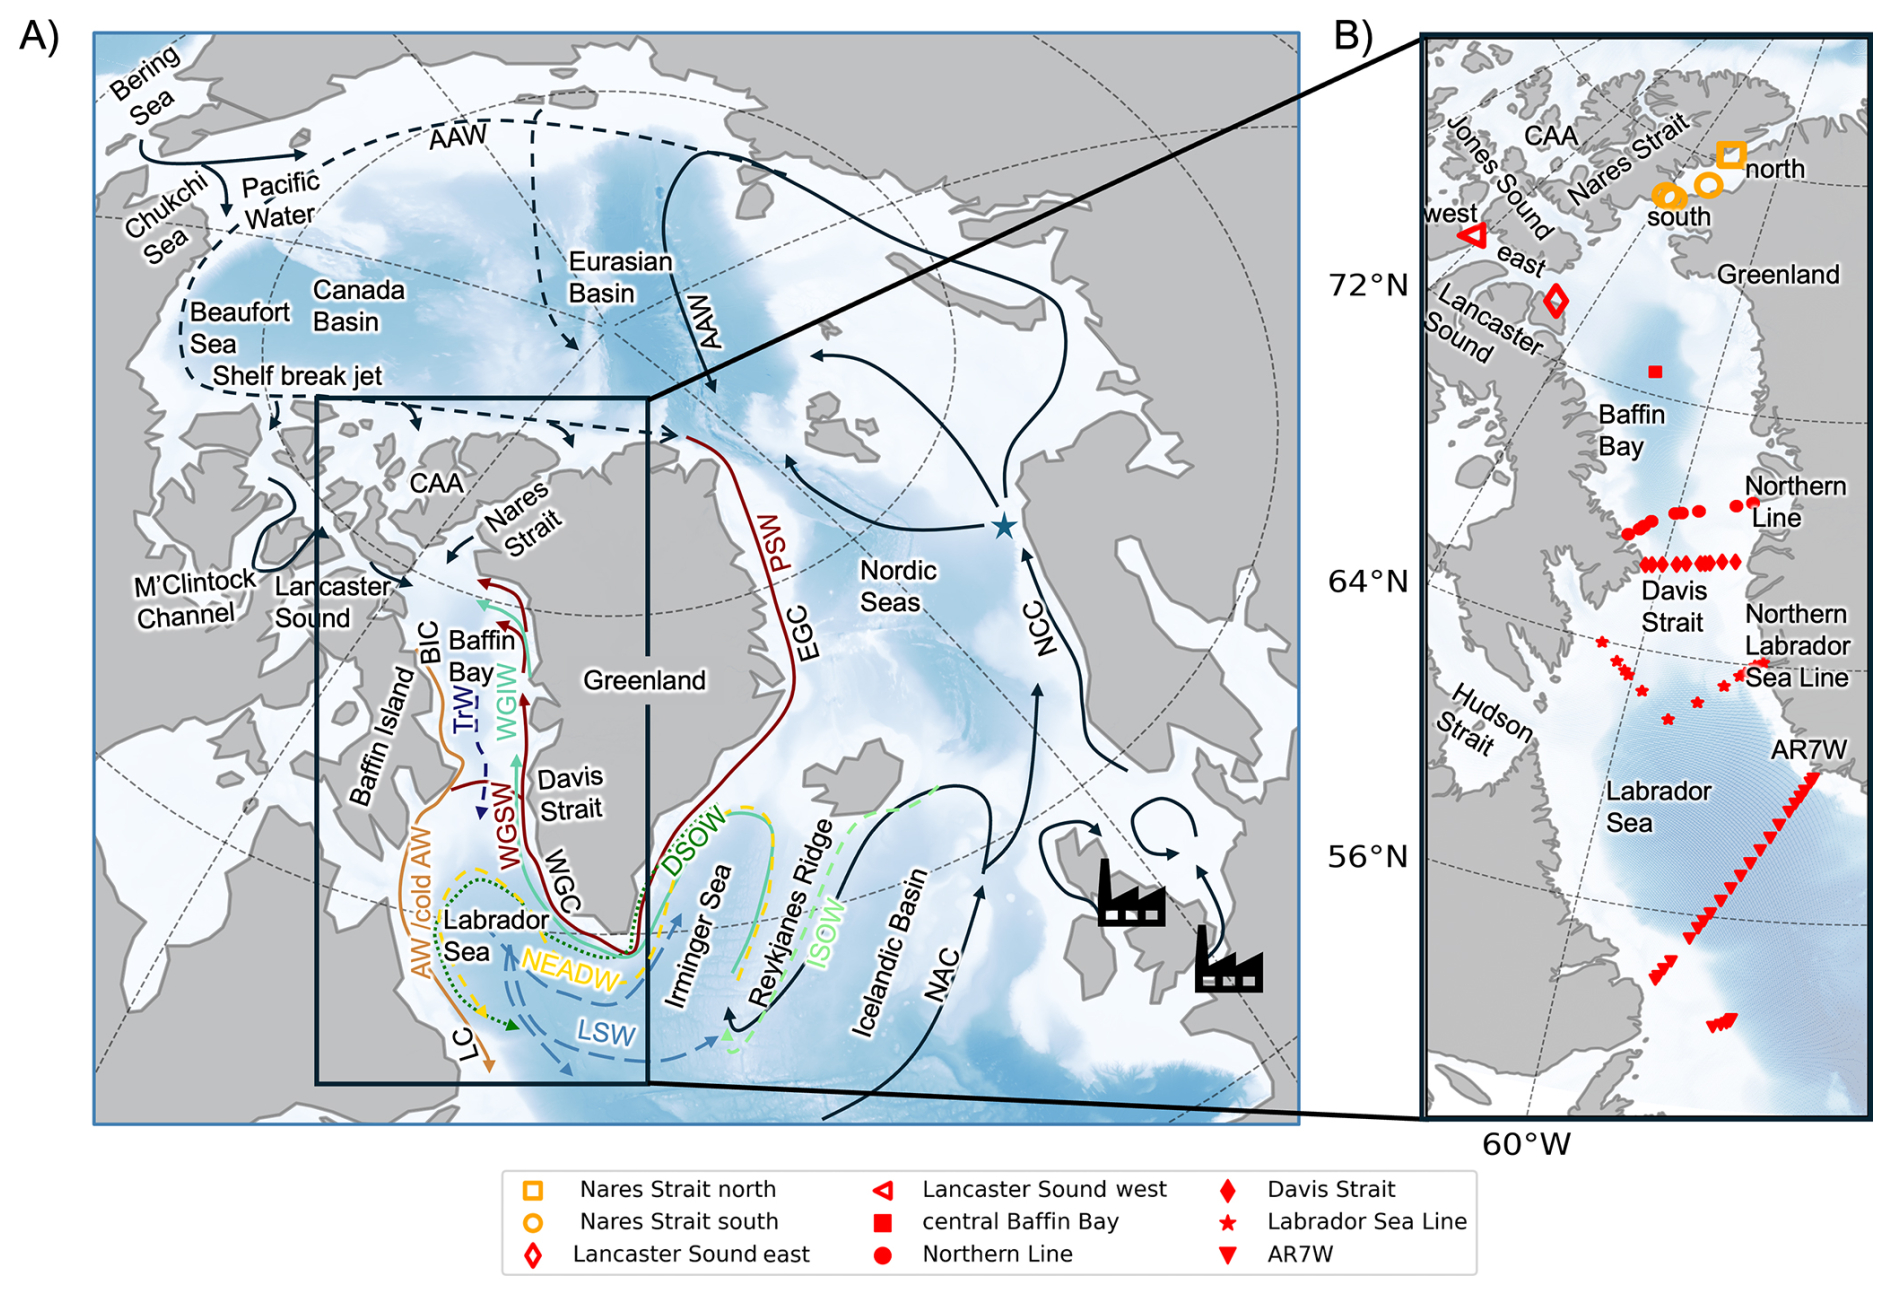
Figure 1(A) Map of the study area showing the main surface water mass circulation as solid lines, intermediate-depth circulation as dashed lines, and deep circulation as dotted lines, adapted from Curry et al. (2014), García-Ibáñez et al. (2015) and Dale et al. (2024). Ocean current names are shown in black font, while specific water mass names are represented in other colours. Black icons indicate the locations of nuclear fuel reprocessing plants at Sellafield (UK) and La Hague (France), and the blue star marks the location where the tracers input function is defined (Fig. B1). (B) Close-up view highlighting regional geographic features and the oceanographic transects sampled in this study. Filled red symbols indicate sampling locations surrounding Davis Strait and along AR7W in 2022: central Baffin Bay (square), Northern Line (dots), Davis Strait (diamonds), Northern Labrador Sea Line (stars), and AR7W (triangles). Unfilled red symbols represent samples from Lancaster Sound (west: triangle, east: diamond), while unfilled orange symbols represent samples from Nares Strait (north: square, south: circles). All abbreviations are defined in Table A1 in Appendix A.
The exchanges of water masses within Baffin Bay, and their associated variability and impacts, underscore the importance of understanding the complex circulation system of the region. The general circulation in Baffin Bay (Fig. 1A) is largely influenced by boundary currents. From eastern Davis Strait, the northward-flowing West Greenland Current system (WGC, dark red arrows, Fig. 1A) transports two components along the Greenland shelf. The fresh West Greenland Shelf Water (WGSW, dark red), transported by the West Greenland Coastal Current, and the warm and saline West Greenland Irminger Water (WGIW, light green arrow Fig. 1A), which is confined within a shelf-break jet (Lin et al., 2018; Curry et al., 2014; Huang et al., 2024; Gou et al., 2022). The WGSW originates from the East Greenland Current (EGC, dark red arrow east of Greenland, Fig. 1A), which outflows Fram Strait and flows south along the Greenland shelfbreak, carrying fresh and relatively warm Polar Surface Water (PSW) from the Arctic Ocean (Sutherland et al., 2009). After rounding the southern tip of Greenland at Cape Farewell, the EGC is joined by WGIW at depth. The warm and saline WGIW originates from the North Atlantic Current (NAC, black arrows Fig. 1A), carrying water from the subtropics (Cuny et al., 2002). Towards the northern Labrador Sea, the current system of west Greenland becomes baroclinically and barotropically unstable due to the steep continental slope, leading to large anticyclonic eddies. The eddies are known as Irminger Rings and carry both the WGSW and WGIW offshore into the Labrador Sea (Chanut et al., 2008; Zou et al., 2024; Gelderloos et al., 2011). In the northern Labrador Sea, the WGC bifurcates into two branches, with one continuing north into Baffin Bay, and a larger branch following the bathymetry of the Labrador Sea, turning westward towards the Labrador Shelf (Myers et al., 2009; Huang et al., 2024; Gou et al., 2022).
Western Davis Strait is dominated by the southward-flowing surface Baffin Island Current (BIC, orange arrow Fig. 1A), which transports fresh water of Arctic origin, such as Arctic Water (AW) and cold Arctic Water (cold AW), along the Baffin Island shelf and slope to the Labrador Sea (Cuny et al., 2005). While Arctic Water is strongly influenced by glacial run-off and sea ice melt (Curry et al., 2014; Azetsu‐Scott et al., 2012), cold Arctic Water (similar to the hydrographic properties of cold Polar Water; Huang et al., 2024) represents a subset of cold and more saline water within Arctic Water, which experienced winter convection by stronger cooling and salinification (Shan et al., 2024). Waters exiting the Arctic Ocean enter Baffin Bay through the shallow sills of Nares Strait (220 m, Jackson et al., 2014; Rabe et al., 2010), Lancaster Sound (125 m, Peterson et al., 2012) and Jones Sound (125 m, Melling et al., 2008; Pelle et al., 2026). These water masses with low salinities (<33.5) and low temperatures (<1 °C) are present primarily at the surface of Baffin Bay and along the BIC.
In central Davis Strait, at intermediate depths between 300 and 600 m, relatively warm Transition Water (dark blue Fig. 1A) flows throughout the year and at low velocities out of Baffin Bay (Huang et al., 2024; Curry et al., 2014). Rudels (2011) described Transition Water as an intermediate layer formed by mixing Atlantic water from the south and colder water from the north. More recently, Huang et al. (2024) identified two different types of Transition Water, each resulting from the mixing of several water masses. Further, Lehmann et al. (2022) identified a temperature maximum in western Baffin Bay aligning with the warmest and deepest fraction of Transition Water. Below Transition Water, down to 1600 m depth, the water column is dominated by Baffin Bay Mode Water (BBMW), also known as Baffin Bay Deep Water, whose formation processes remain unclear (Lehmann et al., 2019; Bourke et al., 1989). In central Baffin Bay, depths greater than 1600 m are filled by old Baffin Bay Bottom Water (BBBW) (Bourke et al., 1989), which is not observed in the Davis Strait outflow (Curry et al., 2014).
South of Davis Strait, the cold, fresh surface water from the BIC joins the Labrador Current, where they mix with cool, fresh outflow from the Hudson Strait and water from the WGC that turned westward, bathymetrically steared at the Labrador Sea (García-Ibáñez et al., 2015; Cuny et al., 2002; Myers, 2005; Straneo and Saucier, 2008).
In the Labrador Sea, the Irminger Rings detach from the boundary current and drift into the central basin. This water contributes to the formation of Labrador Sea Water (LSW, light blue arrows in Fig. 1A), together with fresh water from the Labrador Current, which accounts for approximately 6 %–8 % of LSW (Myers, 2005; Lilly et al., 2003; Hátún et al., 2007). The annual deep winter convection that forms the LSW represents a key component of the AMOC (Yashayaev, 2007; Bower et al., 2009; Lavender et al., 2005). Other water masses in the Labrador Sea include the North East Atlantic Deep Water (NEADW, yellow arrow in Fig. 1A), which follows the cyclonic Deep Western Boundary Current and is found below LSW at approximately 2000 m depth. The NEADW forms by mixing of multiple source water inflows from east of Greenland, including LSW, Denmark Strait Overflow Water (DSOW, dark green in Fig. 1A), and Iceland Scotland Overflow Water (ISOW, light green in Fig. 1A) (Yashayaev, 2007; Tanhua, 2005; Dickson and Brown, 1994; García-Ibáñez et al., 2015). The bottom depths are occupied by DSOW and carried primarily by the Deep Western Boundary Current from its formation region in the Nordic Seas towards the Grand Banks (Dale et al., 2024; Leist et al., 2024; Rudels, 2011).
Decades of oceanographic studies have significantly improved our understanding of water mass composition and volumetric transport in Davis Strait, Baffin Bay, and the Labrador Sea (Bourke et al., 1989; Yashayaev, 2007; Curry et al., 2011). However, climate-driven changes are altering the circulation and freshwater dynamics of the region (Shan et al., 2024). Under climate change, the Arctic is warming at nearly four times the global average, yet current ocean models appear to under-represent this rapid evolution (Rantanen et al., 2022). Observational evidence shows that weakened stratification in the Eurasian Basin of the Arctic Ocean is driving structural changes in the water column – a process known as “Atlantification”. This shift enables warm Atlantic water to penetrate further north, accelerating sea ice melt and reducing winter sea ice formation (Polyakov et al., 2025, 2017; Wang et al., 2024). Historically, approximately half of the exported Arctic freshwater has been exported through the CAA and into Baffin Bay (Haine et al., 2015). In recent years, increased glacial melt from Greenland and the CAA (The IMBIE Team, 2020; Vandecrux et al., 2024; Gardner et al., 2011) has led to more frequent ice-free channels during summer (Canadian Ice Service; http://ice-glaces.ec.gc.ca/, last access: 26 May 2026), likely modifying freshwater exchange between the Arctic and Baffin Bay (Malles et al., 2025). Furthermore, Baffin Bay now receives increasing volumes of glacier meltwater from Greenland, a trend accelerated by the warming influence of Atlantic water (Holland et al., 2008; Bamber et al., 2018).
The established pathways of water mass exchange between high latitudes and the subpolar North Atlantic may also be changing (Weijer et al., 2022; Carmack et al., 2016). Freshwater discharge (water with practical salinity below 34.6, Zhang et al., 2021a) from Davis Strait into the subpolar North Atlantic is projected to increase, potentially affecting deep convection in the Labrador Sea (Zhang et al., 2021b; Wang et al., 2023; Yashayaev, 2024; Zhang et al., 2021a). Despite Davis Strait's role as a freshwater source to the subpolar North Atlantic (Shan et al., 2024; Azetsu‐Scott et al., 2012; Huang et al., 2024), the freshwater dynamics of both Davis Strait and Baffin Bay remain poorly constrained. This is largely due to strong seasonal variability in freshwater release and the limited access during winter imposed by sea ice cover (Curry et al., 2014; Haine et al., 2015).
Additionally, the contribution of water outflowing Davis Strait on the water mass formation in the Labrador Sea remains uncertain. This is likely due to intense winter convection in the Labrador Sea, which strongly modifies temperature and salinity, complicating efforts to trace the origins of water using only these properties (Rudels, 2011; Yashayaev, 2007; Clarke and Gascard, 1983).
Furthermore, the role of Baffin Bay intermediate and deep water (e.g. Transition Water) in the formation of LSW remains poorly understood compared to the better-known origin and pathways of surface water (Curry et al., 2014; Cuny et al., 2005). Also, recent studies have emphasised the importance of Arctic freshwater export to the subpolar North Atlantic (Malles et al., 2025; Duyck et al., 2025; Myers, 2005) and the role of cross-density lateral mixing in the Labrador Sea, contributing approximately 60 % to the annual formation of LSW (Zou et al., 2023; Pickart and Spall, 2007). However, most observational studies continue to focus on boundary current systems, leaving off-boundary water exchanges understudied (Huang et al., 2024; Curry et al., 2011; Azetsu‐Scott et al., 2012). Therefore, a better understanding of the off-shelf and intermediate circulation between Baffin Bay and the Labrador Sea is still needed (Rudels et al., 2004), particularly regarding the origin and formation of Transition Water in Baffin Bay and the potential contributions of Arctic origin freshwater to the formation of LSW.
1.2 Using radionuclides to trace water mass origin
To advance on these complex water-mass interactions, we propose a novel approach in the region that combines the two long-lived artificial radionuclides 129I ( Ma) and 236U ( Ma), with hydrographic properties such as salinity and temperature. We expect 129I and 236U to suitably trace circulation patterns and mixing in the Davis Strait region because inflowing water presents contrasting tracer concentrations measured for the Pacific, Atlantic and Arctic oceans (Wefing et al., 2021; Payne et al., 2024; Leist et al., 2024; Castrillejo et al., 2018; Dale et al., 2024).
129I and 236U originate primarily from nuclear sources and are assumed to be conservative in seawater (Christl et al., 2015; Casacuberta and Smith, 2023). Their input into the ocean was dominated by a peak in 236U from the nuclear weapons test global fallout in the 1960s, and liquid releases from nuclear fuel reprocessing plants in Sellafield (UK) and La Hague (France) (Fig. 1A, black factory symbols), peaking in the 1980s for 236U and ramping up after 1990s for 129I. Figure B1 in Appendix B represents their input function defined at 70° N (blue star in Fig. 1A), a combination of global fallout and liquid releases from the nuclear reprocessing plants (Wefing et al., 2021; Payne et al., 2024). In both cases, the released radionuclides flow north from the North Sea and join the Norwegian Coastal Current (NCC), entering the Arctic Ocean. From the entrance of the Arctic Ocean, the radionuclides can recirculate within the Eurasian Basin in a short loop or a longer path (Canada Basin) before exiting the Arctic Ocean via Fram Strait or the CAA (Li et al., 2020; Rudels et al., 1994; Payne et al., 2024; Casacuberta and Smith, 2023). From Fram Strait, the radionuclides are transported south and ultimately reach the Labrador Sea and Baffin Bay as part of the WGC (Wefing et al., 2019; Dale et al., 2024; Leist et al., 2024). Up to date, there are no measurements of these two tracers in either Nares Strait or the CAA, so their transport through these routes is still unknown.
In the Arctic Ocean, the transport times and mixing of Atlantic Water can be calculated using different models that are all based on tracer input functions (Fig. B1) (Wefing et al., 2021; Payne et al., 2024). However, in sub-Arctic regions, the simultaneous mixing of multiple water masses with distinct input functions complicates the accurate estimation of water age and mixing when relying solely on these tracers. Nevertheless, the combination of 129I and 236U has already proven to be a suitable tool to study the formation and origin of water masses in the subpolar North Atlantic, where it can be assumed that both tracers are in a steady state for each water mass (Castrillejo et al., 2018; Leist et al., 2024; Dale et al., 2024).
In the study area, we expected to find a wide representation of the historical temporal variation of the tracers, allowing us to disentangle the origin of Atlantic water. While the “old” Arctic-Atlantic Water (AAW) from the Canada Basin would be characterised by high 236U and low 129I (Payne et al., 2024), the “young” Polar Surface Water (PSW) recirculated in the Eurasian Basin would carry a higher signal of 129I (Wefing et al., 2025). Low tracer concentrations should be characteristic of the WGIW, which enters the study region from the subtropics without direct contact with the radionuclides (Castrillejo et al., 2018; Dale et al., 2024; Leist et al., 2024). Also, Pacific Water (salinity of 32.5) entering Baffin Bay through the CAA would carry low concentrations of both radionuclides, as their only source was the atmospheric weapon tests (Payne et al., 2024). Finally, it is important to note that the freshest water (i.e. glacier melt, sea ice melt, and river run-off: Shadwick et al., 2011; Grenier et al., 2022; Bamber et al., 2018; Malles et al., 2025) should contain almost no tracer, hereinafter denoted as tracer-free water (Casacuberta et al., 2016).
In this study, we address critical knowledge gaps in understanding water mass transformations and exchanges between Baffin Bay, Davis Strait and the Labrador Sea by applying a novel approach based on the two long-lived artificial radionuclides, 129I and 236U. The tracers, which exhibit distinct distributions across Arctic and Atlantic origin water, offer a complementary tool to traditional hydrographic parameters such as temperature and salinity, enabling the identification of water mass sources in regions characterised by complex mixing and strong seasonal variability. Using observations collected between 2022 and 2024 across key Arctic gateways – including Davis Strait, Nares Strait, Lancaster Sound – and the Labrador Sea, we apply a binary mixing model to characterise tracer signatures of inflowing water masses and quantify their contributions to key intermediate and deep water masses. This approach allows us to explore the origin of the Transition Water, BBMW, BBBW and (cold) Arctic Water and to follow the evolution of WGSW and WGIW along their cyclonic journey through the Baffin Bay. It also enables us to assess the potential influence of Transition Water on water mass formation in the Labrador Sea.
2.1 Sample collection and processing
Seawater samples were collected from multiple sites (Fig. 1B). In May 2022, along the AR7W Line across the Labrador Sea, seawater was collected from the surface and six depth profiles (depth range: surface–3560 m), including four surface samples from southwest of the AR7W Line, aboard R/V Atlantis as a part of the Atlantic Zone Off-Shelf Monitoring Program (AZOMP) by Bedford Institute of Oceanography (red triangles). In October 2022, additional sampling was conducted in the Davis Strait region aboard R/V Neil Armstrong as part of Davis Strait Observing System Program. This survey included a depth profile in central Baffin Bay (Fig. 1B, red square, depth range: surface–2377 m), and full transects along the Northern Line (9 stations, Fig. 1B red circles, depth range: surface–1665 m), Davis Strait (10 stations, red diamonds Fig. 1B, depth range: surface–1013 m) and Northern Labrador Sea Line (9 stations, Fig. 1B red stars, depth range: surfac–2614 m). Further sampling was conducted in September–October 2024 during the Refuge Arctic Cruise Legs 4 and Transforming Climate Action Leg 5, both onboard CCGS Amundsen, targeting Nares Strait and Lancaster Sound. In northern Nares Strait, two stations were sampled: one depth profile (50–345 m, RA28) and one surface station (RA34). Both are represented in Fig. 1B as one unfilled orange square. In the southern Nares Strait, three stations were sampled: RA44, RA48, RA50, of which only RA48 is a depth profile (70–600 m). These stations are represented in Fig. 1B as unfilled orange circles. In Lancaster Sound, two sites were sampled in the western part of the Archipelago (Keb/TCA-S3, depth range: 2–140 m, unfilled red triangles in Fig. 1B), and the eastern part close to Baffin Bay (TCA S3, depth range: 2–890 m, unfilled red diamond in Fig. 1B). All cruises used a CTD-Rosette equipped with 24–12 L Niskin bottles to collect samples for the purpose of this study.
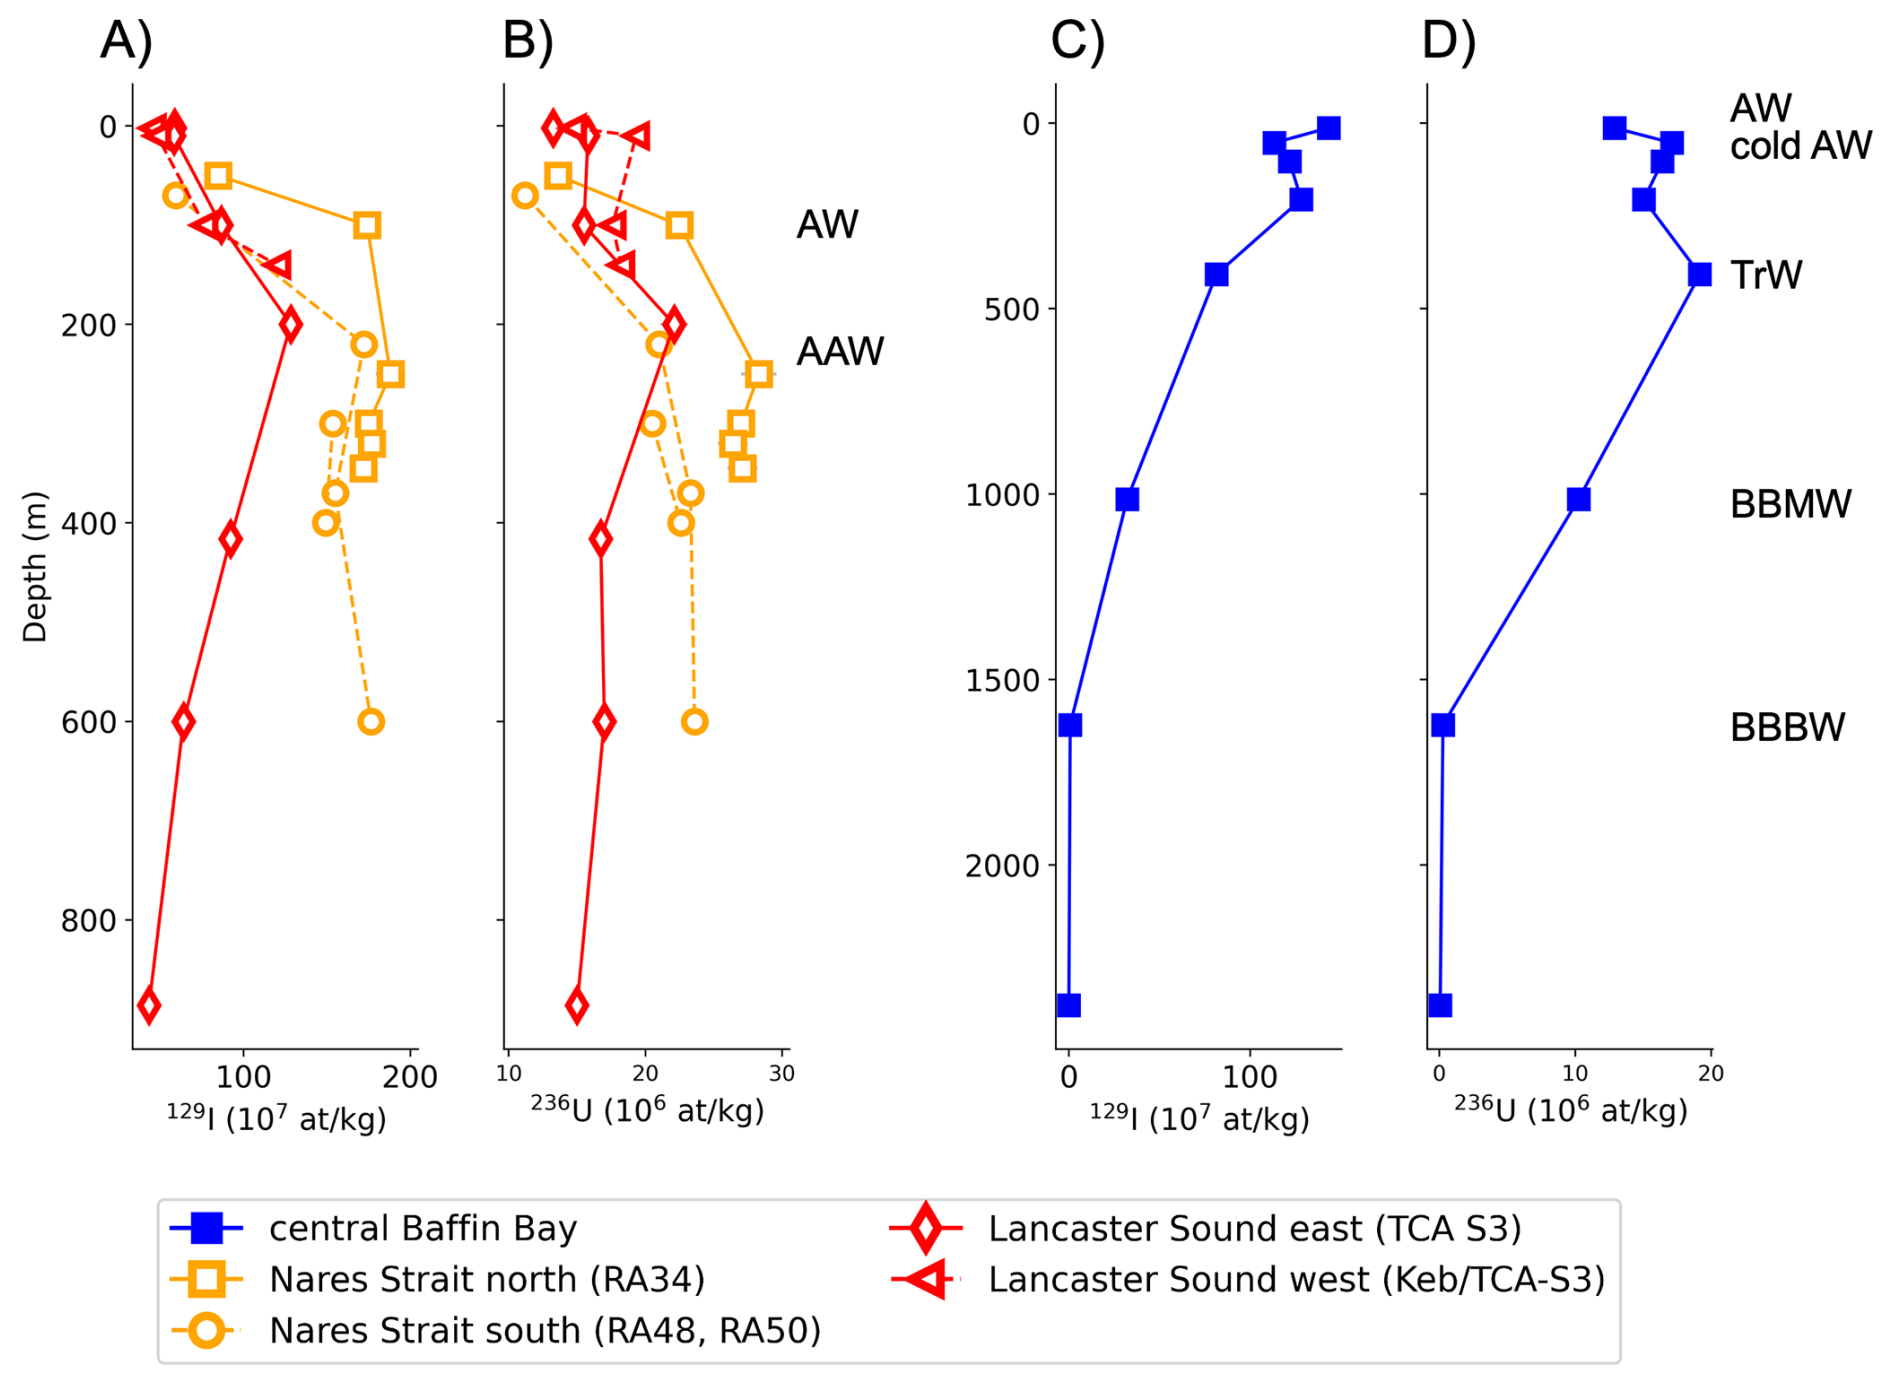
Figure 2Concentrations of 129I (A) and 236U (B) for stations in Nares Strait (orange) and Lancaster Sound (red). Panels (C) and (D) illustrate the 129I and 236U concentrations of the profile taken at central Baffin Bay.
Seawater samples for 129I analysis were collected in 250 mL brown plastic bottles, and pre-rinsed three times with water from the Niskin bottle, before being filled. For 236U, 2–3 L of seawater were collected in Nalgene cubitainers, also pre-rinsed three times before filling them. All samples were stored onboard without any further processing, sent to ETH Zurich for the analysis of iodine and uranium isotopes.
The radiochemistry of 129I and 236U was performed following Wefing et al. (2019) and Leist et al. (2024) for a total of 307 samples. The samples were analysed using the TANDY AMS system at the Laboratory of Ion Beam Physics (LIP), ETH Zurich (Vockenhuber et al., 2015). The 129I concentrations were calculated using the measured 127I/129I atom ratio and the known amount of spiked 127I. The reproducibility of 129I data was estimated based on repeated measurements of an internal seawater standard (n=14, average 129I = 10.4 ± 0.5 × 10⁷ at kg−1). Blanks for 129I (n=16, 7.6 ± 1.5 × 10⁵ at) were obtained using deionised water treated following the same procedure as for seawater samples.
The samples for 236U were spiked with 1 pg of 233U following the radiochemistry described by Wefing et al. (2021) and Leist et al. (2024). The MILEA AMS system at LIP facility (Christl et al., 2013, 2023) was used to measure 233U/238U and 236U/238U in the samples and the in-house standard “ZUTRI”. Correction procedures were applied as described by Christl et al. (2023). The concentrations of 236U and 238U were calculated based on the known amount of 233U that was spiked in the sample. Each batch included one blank (n=11, 236U: 0.01 ± 0.01 × 10⁶ at), consisting of deionised water that was treated like the samples.
The results of 129I and 236U are reported and plotted in atoms per kg of seawater (at kg−1). The combined uncertainty of chemical processing and measurements for both 129I and 236U was below 6 %. All results and detailed analytical uncertainties are reported in the Zenodo database (https://doi.org/10.5281/zenodo.16914587, Leist and Casacuberta, 2025).
2.2 Water mass classification
The water masses are summarised in Table A1, and were assigned according to previous water mass classifications in the literature (Curry et al., 2014; Huang et al., 2024; García-Ibáñez et al., 2015; Bourke et al., 1989; Lehmann et al., 2022) and identified using conservative temperature (CT) and absolute salinity (SA, see T–S diagram in Fig. B2 in Appendix B). The conversion from practical to absolute salinity and from potential to conservative temperature was performed according to TEOS-10 (IOC SCOR and IAPSO, 2010). Temperature and salinity are also represented along sections in Fig. B3 to facilitate the comprehensive distribution of water masses. West Greenland Irminger Water (WGIW; CT > 3.5 °C, SA > 34.7) is the warmest and most saline water mass, confined to intermediate depths along the Greenland shelf. West Greenland Shelf Water (WGSW; CT < 5 °C, SA < 34.2) is fresher than WGIW and located at the surface along the Greenland shelf. Arctic Water (AW; CT: −0.8 to 1.1 °C, SA > 32.9) is the freshest water mass, confined to the Baffin Island and Canadian shelf. The CT and SA ranges used here differ significantly from those in Curry et al. (2014); we applied a narrower range for Arctic Water and distinguished it from cold Arctic Water (cold AW; CT < −0.8 °C, 32.5 < SA < 33.8), which is colder and more saline. Below the cold Arctic Water, Transition Water (CT < 1.8, SA: 34–34.6) is characteristic of mid-depth in Baffin Bay and Davis Strait. Within Transition Water, temperature increases with depth to a temperature maximum (CT: 1.4–1.8 °C, SA = 34.64 ± 0.03, Lehmann et al., 2022). In Baffin Bay, at depths of 600–1000 m, Baffin Bay Mode Water (BBMW; CT: 0.7–1.2 °C, SA = 34.6; Huang et al., 2024) was observed overlying Baffin Bay Bottom Water (BBBW; CT < 0.4 °C, SA = 34.6; Bourke et al., 1989, Fig. B3). In the Labrador Sea, Labrador Sea Water (LSW; CT: 3.1–3.8 °C, SA > 35.0; García-Ibáñez et al., 2018) resides at intermediate depth. Beneath LSW, North East Atlantic Deep Water (NEADW; CT: 2.0–3.3 °C, SA = 35.07 ± 0.2; Yashayaev, 2007) overlies Denmark Strait Overflow Water (DSOW; CT < 1.3 °C, SA = 35.0 ± 0.1; García-Ibáñez et al., 2018). In Nares Strait and Lancaster Sound, water masses were classified as Arctic Water CAA (AWCAA; CT < 0 °C, SA < 33) and Arctic Atlantic Water CAA (AAWCAA; CT > −1 °C, SA > 33), entering through the Canadian Arctic Archipelago. Samples that do not fall within the defined water mass categories are considered mixtures of the above water types. While all samples are presented in the results section, the discussion focuses on those assigned to specific water masses.
2.3 Binary Mixing Model
In the study area, several potential water masses are adjacent to those observed in Baffin Bay. These include tracer-free water, Pacific Water (Azetsu‐Scott et al., 2012), WGIW (Curry et al., 2014), WGSW (Curry et al., 2014), Polar Surface Water from the Eurasian Basin (Münchow et al., 2006; Wefing et al., 2025), and Arctic-Atlantic Water originating from the Canada Basin (Lehmann et al., 2022; Payne et al., 2024). Further assessment of their formation processes will be based on the conservative tracer signatures of 129I and 236U. However, the number of water masses considered exceeds the number of available conservative tracers. Therefore, the complexity of the model is reduced by modelling the mixing fractions of samples between the two most dominant water mass sources (hereinafter referred as endmembers), instead of employing an Optimum Multiparameter Analysis. Before quantifying the origin and estimating the mixing fractions, the water masses are classified according to their temperature and salinity. Then, a binary mixing model combining both 236U and 129I is used, as previously described by Leist et al. (2024) and Dale et al. (2024). The water masses in the study area are considered as conservative mixtures of different endmembers. The endmembers are source components of a mixture and set the boundaries of the mixing model. In this study, each endmember has a distinct and characteristic value for temperature, salinity, and 129I and 236U concentrations (see details on each endmember in Sect. 4.1).
In most cases, the 129I and 236U concentrations of the endmember consist of an average concentration of several samples collected in this and previous studies, with an associated uncertainty that corresponds to the standard deviation of the average values (see Table A2). Considering the two endmembers as the primary water-mass sources, the resulting water mass is treated as a mixture of the two. The mixing fraction f is then estimated as:
where b is the vector connecting the two endmembers (mixing line), and a is the vector connecting a given sample to one of the endmembers. The resulting value of f represents the percentage contribution of each endmember to a given watermass. This study focuses on different contributions of Atlantic-derived water, and not on the differentiation between different freshwater sources, which are more precisely addressed using nutrients and δ18O (Azetsu‐Scott et al., 2012). A key limitation of this model is the assumption that mixing occurs exclusively between two endmembers. If a sample falls outside the defined mixing line, its composition is estimated by projecting orthogonally onto the mixing line and neglecting potential contributions from a third endmember. The model also assumes a steady state for transient tracers, which was previously discussed and justified by Leist et al. (2024) and Dale et al. (2024). In the study region, changes in water mass formation and mixing ratios between endmembers are believed to have a greater influence on tracer concentrations than recent changes in the tracer input function (Fig. B1), supporting the steady-state assumption. The resulting mixing fractions will only be discussed in Sect. 4 (not in results) and summarised in Table A3.
This section presents individual depth profiles from Nares Strait and Lancaster Sound (Fig. 2), followed by a description of the distribution along the three transects from southern Baffin Bay (Northern Line), Davis Strait, to northern and southern Labrador Sea (Northern Labrador Sea and AR7W lines). To better reflect the general distribution patterns, each water mass is described across the lines/panels (Fig. 3) as a whole, rather than within individual sections. In the sections below, note that SA stands for Absolute Salinity and CT for Conservative Temperature. Details about tracer concentrations, uncertainties, and hydrographic properties are provided in the Zenodo database (236U, https://doi.org/10.5281/zenodo.16914587, Leist and Casacuberta, 2025) and the abbreviations for water masses can be found in Table A1 in Appendix A.
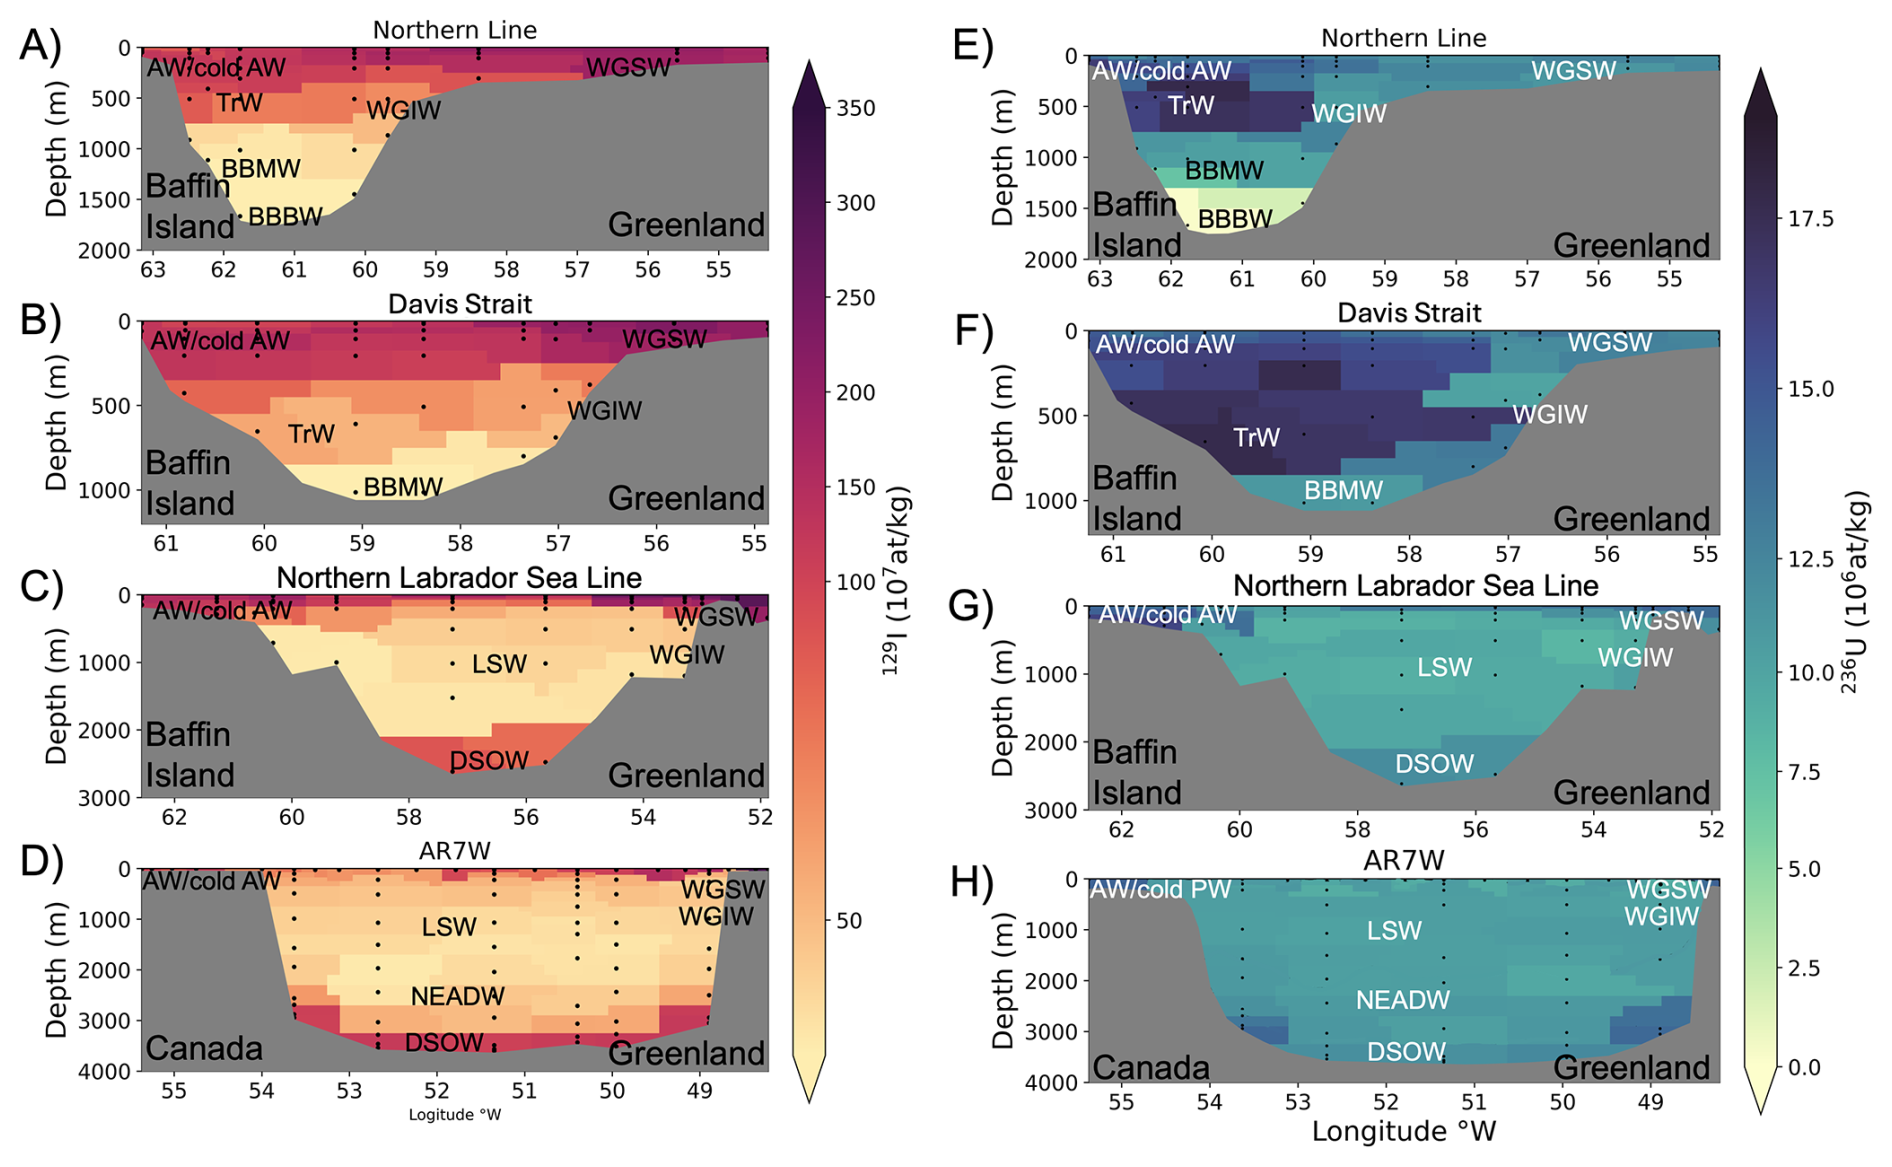
Figure 3Zonal distribution of 129I (A–D) and 236U concentrations (E–H) along Northern Line (A, E), Davis Strait (B, F), Northern Labrador Sea Line (C, G) and AR7W (D, H), respectively, in 2022. Water mass classification is based on Curry et al. (2014), Yashayaev (2007), and Huang et al. (2024).
3.1 129I and 236U in Nares Strait and Lancaster Sound
Depth profiles collected in Nares Strait are represented in Fig. 2A and B as orange symbols. Both tracers show low concentrations at the surface Arctic Water (AW, 129I: 60–85 × 107 at kg−1, 236U: 11–14 × 106 at kg−1) and a local maximum in the Arctic Atlantic Water at about 250 m (AAW, 129I: 180–210 × 107 at kg−1, 236U: 23 × 106 at kg−1). Below that depth, 129I seems to slightly decrease towards the bottom, while 236U remains more constant. Furthermore, the concentrations of both isotopes appear to be higher in the northern part of Nares Strait (squares) compared to the south (circles).
The two profiles in Lancaster Sound are represented in Fig. 2A and B as red symbols. Similar to Nares Strait, the highest concentrations of 129I were associated with AAWCB (Canada Basin) located at 200 m in eastern Lancaster Sound (129I: 130 × 107 at kg−1, SA: 33.85, CT: −0.10 °C) and at depths below 140 m in the western station (129I: 120 × 107 at kg−1, SA: 33.6, CT: −0.44 °C). In western Lancaster Sound, the highest concentration of 236U was observed at 10 m depth in Arctic Water (236U: 19×106 at kg−1, SA: 30.58, CT: −0.04 °C), and the lowest at the surface (236U: 15 × 106 at kg−1). A similar distribution was observed in the eastern Lancaster Sound, with the lowest concentration at the surface (236U: 13 × 106 at kg−1), and a maximum at 200 m (236U: 22 × 106 at kg−1), which then decreased slightly with increasing depth to 15 × 106 at kg−1 at 886 m.
3.2 129I and 236U in central and southern Baffin Bay, Davis Strait and the Labrador Sea
Along all transects (Fig. 3), the highest 129I concentrations were observed in West Greenland Shelf Water (WGSW), at the surface of the Greenland shelf (Fig. 3A–D). The concentrations of 129I decreased along the pathway of the West Greenland Current (WGC), with WGSW dropping from 320 × 107 at kg−1 at AR7W in the Labrador Sea (Fig. 3D) to 170 × 107 at kg−1 at the Northern Line in Baffin Bay (Fig. 3A). In contrast, the warmest and most saline West Greenland Irminger Water (WGIW) generally showed increasing 129I concentrations from 50 × 107 at kg−1 at AR7W to a maximum of 90 × 107 at kg−1 at the Northern Line. In Arctic Water, the freshest water along the Baffin Island Current (BIC) and Labrador Current (LC), 129I concentrations increased slightly from central Baffin Bay (140 × 107 at kg−1, blue squares Fig. 2C) to the Northern Labrador Sea Line (150 × 107 at kg−1, Fig. 3C). But, Arctic Water showed lower concentrations (100 × 107 at kg−1) at the AR7W Line in the southern Labrador Sea. Cold Arctic Water exhibited elevated 129I concentrations in the 100–170 × 107 at kg−1 range and showed no clear north-south trend. While Arctic Water, WGIW and WGSW were present in all sections, Transition Water was only present along the Northern Line, Davis Strait (Fig. 3A, B) and central Baffin Bay (Fig. 2C, blue squares), with concentrations in the range of 50–120×107 at kg−1, respectively. BBMW was observed along the Northern Line, Davis Strait and central Baffin Bay only, with 129I concentrations of 29–37 × 107 at kg−1. 129I concentrations at the levels of the blanks ( at kg−1) were measured in BBBW present below 1600 m in central Baffin Bay and the Northern Line. Labrador Sea Water (LSW) and North East Atlantic Deep Water (NEADW) (only sampled at AR7W, Fig. 3D) covered an 129I range of 30–70 × 107 at kg−1 at intermediate depth in the Labrador Sea, while the near-bottom Denmark Strait Overflow Water (DSOW) presented concentrations up to 120 × 107 at kg−1.
The distribution of 236U concentrations (Fig. 3E–H) differs from that of 129I. The highest 236U was observed in the Transition Water (Fig. 3E, F), with up to 19 × 106 at kg−1 in central Baffin Bay (Fig. 2D, blue squares), followed by cold Arctic Water, with 236U in the 14–17 × 106 at kg−1 range between Davis Strait (Fig. 3F) and central Baffin Bay. While the 236U concentration in Arctic Water was generally in the range of 13–15 × 106 at kg−1, the AR7W Line recorded the maximum value (16 × 106 at kg−1, Fig. 3H). In water inflowing Davis Strait, such as WGSW, 236U concentrations decreased slightly towards the north, from 15 × 106 at kg−1 at the AR7W Line to 13 × 106 at kg−1 at the Northern Line (Fig. 3E). Similarly to 129I, low 236U concentrations were measured in WGIW, with an increasing trend from 9 × 10⁶ at kg−1 at AR7W to 11 × 106 at kg−1 on the Northern Line.
In the Labrador Sea, LSW presented 236U concentrations on the 9–11 × 106 at kg−1 range on the AR7W and Northern Labrador Sea lines (Fig. 3G, H). NEADW, only sampled along AR7W, showed 236U concentrations slightly above LSW (10–12 × 106 at kg−1). The sampling density of DSOW was smaller in the Northern Labrador Sea Line than for AR7W and confined at slightly lower concentrations (AR7W: 12–14 × 106 at kg−1, Northern Labrador Sea Line: 12 × 106 at kg−1). Moving towards the Baffin Bay, the BBMW had similar 236U concentrations of 10–12 × 106 at kg−1. Finally, in BBBW occupying depths below 1600 m in central Baffin Bay (blue squares Fig. 2D) and the Northern Line, 236U concentrations reached the analytical limit of detection ( at kg−1).
Both tracers have concentrations well above global fallout, which would be about 2.2 × 10⁷ at kg−1 for 129I and 5.4 × 10⁶ at kg−1 for 236U, according to recent estimates at the Bering Strait (Payne, 2026). Only the bottom water at Baffin Bay (BBBW) presents tracer concentrations lower than expected from the global fallout.
3.3 Water masses in T–S and 129I–236U tracer space
Figure 4 provides an overview of the water masses observed in Baffin Bay, Davis Strait and the Labrador Sea and their distribution in T–S diagram (Fig. 4A) and 129I–236U tracer space (Fig. 4B) while the sampling location is indicated by the symbols and can be referred to in Fig. 1B.
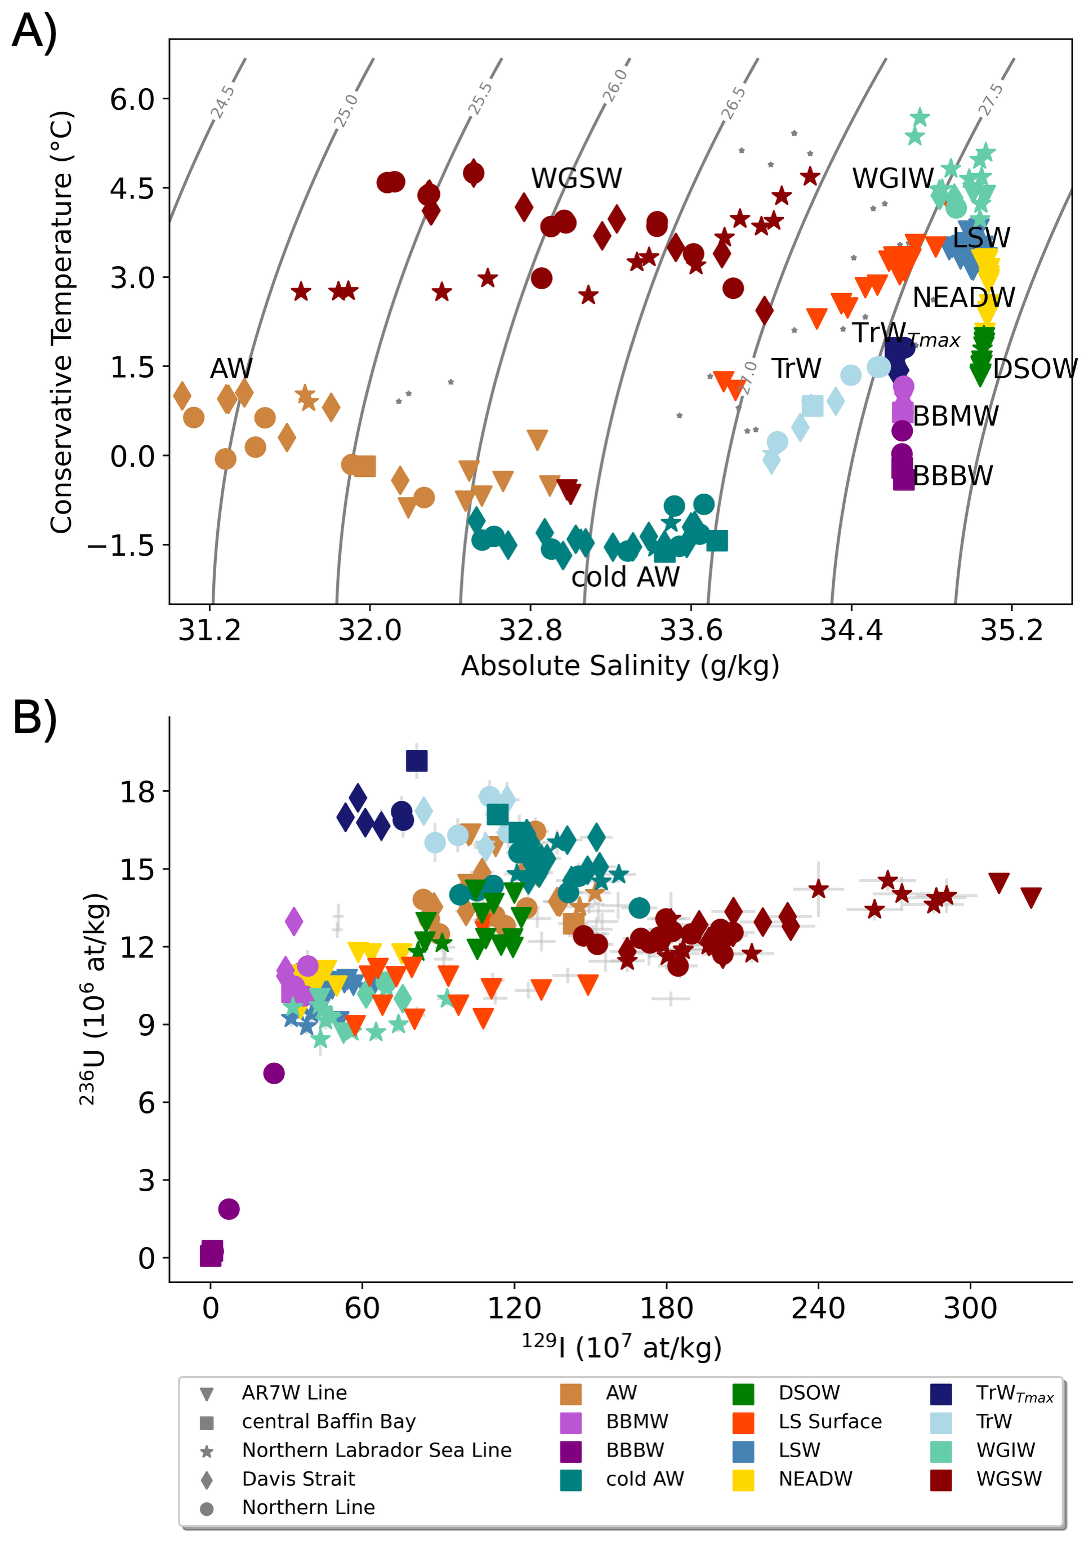
Figure 4Overview of hydrographic and tracer data. (A) Temperature–salinity (T–S) diagram, showing the distribution of water masses as listed in Table A1. (B) 129I vs. 236U plot for all samples. The same colour coding is used for water masses in (A) and (B), while grey stars represent samples that could not be assigned to a certain water mass. The grey crosses indicate the sample uncertainty. The symbols marking the sampling locations match those in Fig. 1B).
WGSW (dark-red symbols) stands out in both panels due to its relatively high temperature and low salinity (Fig. 4A), as well as its elevated 129I concentrations (from 180 to >300 × 107 at kg−1) (Fig. 4B). Its seasonal variability in temperature (Fig. 4A) is consistent with observations by Curry et al. (2014) and Zweng and Münchow (2006) and clearly expressed in the broad temperature range with CT < 0 °C along the AR7W Line (dark red triangles) sampled in spring and CT > 2 °C at the other sections sampled in autumn. In the tracer space, WGSW forms a well-defined linear relationship, despite the seasonality. This indicates that the tracers are largely insensitive to seasonal changes. The saline and warm WGIW (Fig. 4A, light green symbols) is located at the lower left in tracer space (Fig. 4B, light green symbols) due to its low 129I and 236U concentrations. Radionuclide tracers are especially low for samples collected in the Labrador Sea, then they increase slightly together with a freshening and cooling experienced on the northward flow of WGIW.
Arctic Water (Fig. 4, light brown symbols) is fresh and cold and shows tracer concentration slightly below cold Arctic Water (Fig. 4, teal symbols), which is characterised by its distinct temperature minimum and confined to the upper 100 m. Both water masses are positioned in the tracer space at the mixing interface between the relatively warm Transition Water and WGSW.
Within the Transition Water (light blue symbols), the samples located at the temperature maximum (TrWTmax, dark-blue symbols) exhibit the highest 236U concentrations. This TrWTmax lies between cold Arctic Water (teal symbols) and WGIW (light green symbols) in T–S space, consistent with its intermediate hydrographic character (Fig. 4A). In tracer space, however, the TrWTmax shows the highest 236U levels within the region (Fig. 4B), second only to the concentrations observed in Nares Strait (orange symbols) and Lancaster Sound (red symbols).
At depth below Transition Water and low temperatures is the BBMW (light purple squares and circles) confined at low 129I and intermediate 236U concentrations, leading to the even deeper and colder BBBW (purple squares and circles). The BBBW in the Northern Line and central Baffin Bay is found in the bottom left corner of the tracer space and its concentrations of 129I and 236U approach the analytical limit of detection.
In the Labrador Sea, surface water (light red symbols) fills the gap tracer between WGSW and WGIW and bridges WGSW and LSW (blue trangles) in the T–S diagram. LSW is colder than WGIW but warmer than the deeper NEADW (yellow triangles). In the tracer space, both LSW and NEADW are located close to WGIW but shifted towards slightly higher 236U concentrations.
Finally, DSOW (Fig. 4, green symbols), is characterised by low temperatures, high salinity, and intermediate tracer concentrations.
To investigate the origin and mixing of the water masses in southern Baffin Bay, Davis Strait and Labrador Sea, we apply the mixing model described in Sect. 2.3. In this section, we first examine the endmembers used in the mixing model (Sect. 4.1), followed by a discussion of the evolution of West Greenland Shelf Water and West Greenland Irminger Water (WGSW and WGIW) as they enter Baffin Bay (Sect. 4.2), the origin of Transition Water, Baffin Bay Mode Water and Baffin Bay Bottom Water (BBMW, BBBW), cold Arctic Water, and Arctic Water (Sect. 4.3 and 4.4) and their evolution to the Labrador Sea (Sect. 4.5). An overview of the mixing fractions obtained is given in Table A3.
4.1 Endmembers in the mixing model
Figure 5A shows the geographical locations of the defined endmembers, each represented with distinct symbols and colours. Their corresponding 129I and 236U tracer signatures are displayed in Fig. 5B. The endmembers are defined using a combination of published data and new tracer measurements. Water mass assignments are based on temperature–salinity characteristics, and for endmembers taken from the literature, the original classifications are retained. Table A2 summarises all endmembers used in this study, including their geographic locations, depth ranges, tracer concentrations, temperature and salinity values, the number of samples included, and the relevant references.
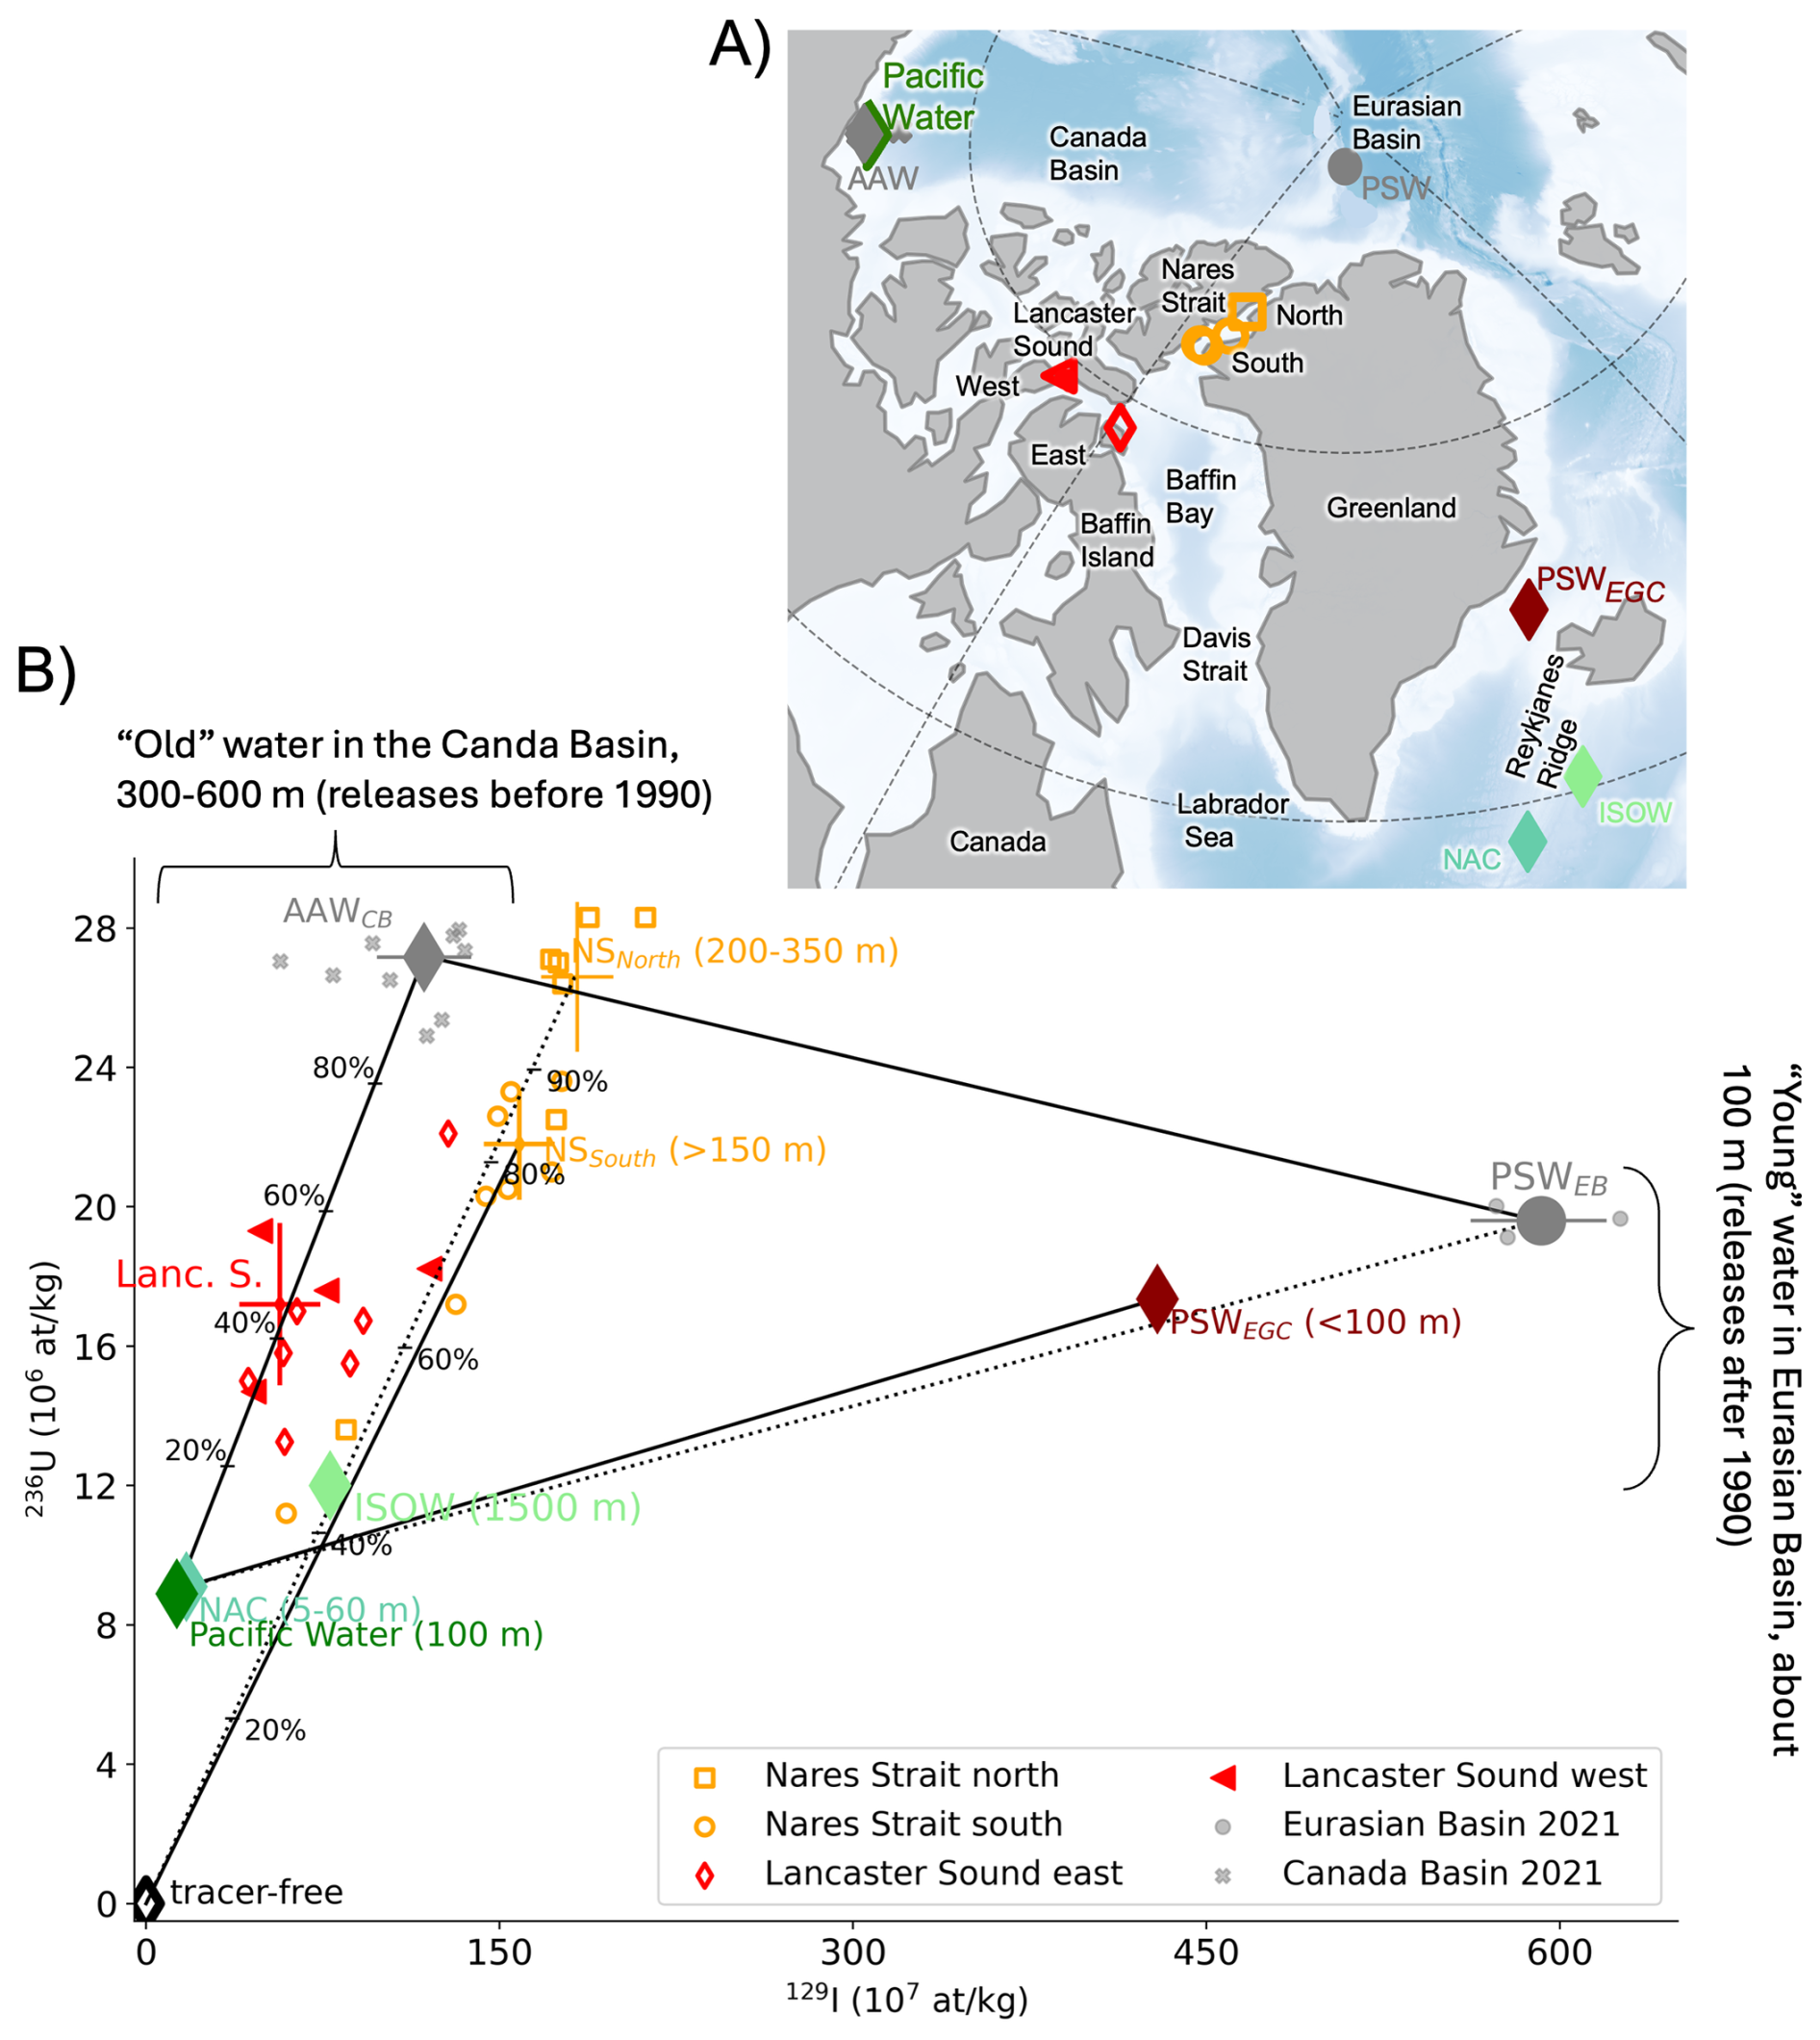
Figure 5Symbols and colours in (A) and (B) consistently denote water mass endmembers (colored diamonds and circle), previously published Arctic Ocean data (grey diamond and circle), and new data from Lancaster Sound (red symbols) and Nares Strait (orange symbols). (A) Geographic distribution of endmembers and sampling locations in the Arctic Ocean, Nares Strait, and Lancaster Sound. (B) 129I–236U tracer space showing endmembers and individual samples at Nares Strait and Lancaster Sound. Red crosses indicate the mean and maximum spread of measurements from the upper 100 m in western Lancaster Sound, while the orange cross represents the mean and maximum spread of samples from southern Nares Strait collected below 150 m. Numbers adjacent to the endmembers denote the depth ranges of the samples used in their calculation. AAWCB: Arctic Atlantic Water in Canada Basin (Payne et al., 2024). NAC: North Atlantic current (Castrillejo et al., 2018). PSWEGC: Polar Surface Water at the East Greenland Current (Dale et al., 2024). Pacific Water (Payne et al., 2024). PSWEB: Polar Surface Water in the Eurasian Basin (Wefing et al., 2025). Tracer-free: very old water without anthropogenic signature, glacier and sea ice melt, river runoff, and precipitation.
Based on previous studies, the initial mixing scenarios (Fig. 5B) are constructed using the following endmember pairs: AAWCB–Pacific Water (Peterson et al., 2012; Lehmann et al., 2022), Nares Strait outflow–Pacific Water (Melling et al., 2008) and WGSW–NAC (North Atlantic Current; Leist et al., 2024).
4.1.1 Endmembers in the subpolar North Atlantic and the Arctic Canada Basin
The NAC endmember (North Atlantic Current; turquoise diamond, Fig. 5) contributes to WGIW and transports mainly subtropical Atlantic water labelled with a low tracer content from global fallout and a small contribution from the European nuclear reprocessing plants (Leist et al., 2024; Castrillejo et al., 2018). Representative of this endmember are samples taken east of Reykjanes Ridge (St. 38, IcSPMW, Castrillejo et al., 2018). The diluted reprocessing plant signal may originate from tracer-labelled water entering the subpolar gyre from the Labrador and Irminger seas and reaching east of the Reykjanes Ridge. The Iceland Scotland Overflow Water (ISOW), formed by deep convection north of Iceland, is represented by data collected before entering the Icelandic Basin on the eastern side of the Reykjanes Ridge (Dale et al., 2024).
The endmember of the Polar Surface Water at the East Greenland Current (PSWEGC, dark red diamond, Fig. 5) represents the surface water outflowing the Arctic Ocean at Fram Strait (Wefing et al., 2019), which are then transported south by the East Greenland Current (Fig. 1A). This endmember corresponds to samples collected near the Denmark Strait in 2021 (St. MG17, Dale et al., 2024) and represents surface water entering the Labrador Sea via the West Greenland Current (WGC). As described in Dale et al. (2024) and Leist et al. (2024), the samples most characteristic of PSWEGC are located at the shelfbreak of southern Greenland, still containing a significant fraction of PSW (Dale et al., 2024). The PSWEGC endmember falls within a dilution line between NAC and the PSW sampled at 100 m depth in the Eurasian Basin (EB) in 2021 by Wefing et al. (2025) (grey circles, Fig. 5, Station No. 16, 28, 46 in Wefing et al. (2025)). The PSWEGC and PSWEB from the Eurasian Basin both represent “younger” water imprinted with post-1980s reprocessing releases (Wefing et al., 2025) with high 129I and comparably low 236U, due to the shape of the input function of both tracers (Fig. B1).
In contrast, the “old” Arctic Atlantic Water (AAW) in the Arctic Canada Basin (AAWCB, grey diamond, Fig. 5), contains high 236U and comparably low 129I (Fram Strait Branch Water at St. MK2, MK3 and CB28b, CB29 in Payne et al., 2024). These tracer values correspond to global fallout and reprocessing discharges prior to the 1990s (Fig. B1). Above AAWCB, the Pacific Summer Water holds especially low 129I and 236U from global fallout alone (dark green diamond in Fig. 5, all stations of JOIS 2020 Payne et al., 2024).
Freshwater, such as precipitation, river runoff, sea ice melt and glacial meltwater, is referred to as tracer-free and indicated as a diamond with a black outline in Fig. 5B. The Pacific Water, low in salinity, has only elevated 236U from the global fallout, while the NAC, even though its hydrographic properties are very different, has low tracer concentrations as well. Therefore, it is not possible to disentangle the different contributions of these water masses using 129I and 236U and one should add other tracers such as δ18O. Incorporating such an analysis, however, lies beyond the scope of this study, which focuses specifically on water masses identifiable through radionuclide signatures.
4.1.2 Geographical Endmembers in Nares Strait and Lancaster Sound
Based on their geographic location, the 2024 measurements from western Nares Strait (unfilled orange symbols Fig. 5) and southern Lancaster Sound (unfilled red symbols) serve as geographical endmembers for characterising the inflows from the Arctic into Baffin Bay. The surface water at Nares Strait is characterised by low salinity (Fig. B4B) and low tracer concentrations (Fig. 2A and B), both indicative of the inflow of tracer-free water (Münchow et al., 2006; Rabe et al., 2010). In northern Nares Strait (unfilled orange squares in Fig. 5) at depth below 200 m, high tracer signals were observed, probably as a result of the mixing between the Arctic-Atlantic waters from the Canada Basin (grey diamond in Fig. 5) and PSW originating from the Eurasian Basin, i.e. Amundsen and Makarov basins (grey circle in Fig. 5) (Münchow et al., 2007; Jackson et al., 2014; Wefing et al., 2025).
In southern Nares Strait (unfilled orange circles in Fig. 5), downstream of the shallow 220 m sill, tracer concentrations observed below 150 m are consistent with a mixture of waters advected from northern Nares Strait, mixed with approximately 20 % of tracer-free water, and potential contributions of water inflowing Nares Strait from eastern Baffin Bay (Shroyer et al., 2015; Münchow et al., 2007; Münchow and Melling, 2008). This geographical endmember is illustrated as an orange cross in Fig. 5B), representing the inflowing waters to Baffin Bay.
Similar to Nares Strait, the surface water in southern Lancaster Sound (red symbols in Fig. 5) is composed by Pacific and/or tracer-free water (Lehmann et al., 2022; McGeehan and Maslowski, 2012), as reflected by its low tracer concentration and salinity. However, Lancaster Sound samples show a stronger influence from AAWCB, as indicated by their position near the AAWCB – Pacific Water mixing line. In 2024, the subsurface waters (10–100 m) of western Lancaster Sound showed the highest AAWCB contribution (55 %–65 %) if mixing with Pacific Water. However, in Lancaster Sound, there is also a slight contribution of waters coming from Nares Strait (Lehmann et al., 2022; Shadwick et al., 2011; Dunlap and Tang, 2006), which circulate into Lancaster Sound. This is observed in two samples from 140 and 200 m depth with tracer signals close to the NSSouth endmember. Samples below 200 m from eastern Lancaster Sound (red unfilled diamonds in Fig. 5B) are strongly influenced by exchanges with Baffin Bay, indicated in temperature above 0 °C (Fig. B2A), probably obtained by double-diffusion with WGIW (Lobb et al., 2003). For the geographical endmember (red cross in Fig. 5B), the station in western Lancaster Sound (red filled triangle) is selected, because it is considered to be more representative of the connectivity to the Arctic Canada Basin through the CAA. This endmember is calculated from the mean values in the upper 100 m, representative of the CAA outflow and thus excluding potential recirculation entering the Sound from Baffin Bay. However, it is important to note that samples taken in Lancaster Sound were collected two years after the samples in Davis Strait. Since outflow from Lancaster Sound is variable on interannual timescales (Prinsenberg and Hamilton, 2005), this endmember might not be fully representative of waters found in Baffin Bay. For example, in previous years, Lancanster Sound endmember might have had a stronger influence of AAWCB, thus carrying a higher 236U signal.
The presence of AAWCB in central CAA has been previously observed using more detailed nutrients and temperature-salinity sampling (Jones et al., 2003; Rudels et al., 2004; Lehmann et al., 2022; Wang et al., 2012; Prinsenberg and Hamilton, 2005; Peterson et al., 2012; Melling et al., 1984). Despite the shallow passages through the CAA, the AAWCB can make its way to Lancaster Sound as a result of the eastward transport by strong winds (Melling et al., 1984), tidal currents and vertical mixing enhanced by shallow bathymetry (Lehmann et al., 2022; Rudels, 1986; Hughes et al., 2017). The AAWCB might further be upwelled to the Archipelago by easterly wind events (Peterson et al., 2012), associated with the Beaufort High or synoptic low-pressure systems originating in the North Pacific. This would result in upwelling of AAWCB onto the shallow Chukchi and Beaufort Sea shelves, where AAWCB can be transported towards the CAA as part of the Beaufort Sea shelfbreak jet (Pickart et al., 2013; Lin et al., 2019; Yang, 2006; Pickart et al., 2009). Although storms associated with AAWCB upwelling are centred over the Aleutian Islands in the Bering Sea (Pickart et al., 2009), their northward passage into the Beaufort Sea can cause anomalies of cyclonic wind stress over the Canada Basin, which in turn increases volume transports through Lancaster Sound (Zhang et al., 2016; Peterson et al., 2012).
4.2 Evolution of West Greenland Shelf Water and West Greenland Irminger Water
West Greenland Shelf Water (WGSW) and West Greenland Irminger Water (WGIW) undergo strong seasonal hydrographic variability. They cool and become more saline in winter and freshen in summer, which complicates quantifying their role in water mass formation in Baffin Bay (Curry et al., 2014). In contrast, radionuclide tracers remain unaffected by these processes, making them a powerful tool for tracking WGSW and WGIW in their journey to northern latitudes. In our dataset, the largest hydrographic variations are observed in WGSW: samples from the AR7W Line show low temperatures in spring (overlapping dark red triangles in Fig. 4A), while autumn samples adjacent to Davis Strait display higher temperatures and a broad salinity range (all dark red symbols in Fig. 4A, with CT above 2 °C). Despite these seasonal changes, tracer concentrations (Fig. 4B) remain remarkably stable, enabling a robust quantification of the contribution of WGSW to water mass formation. In the model, mixing between PSWEGC–NAC is considered in Fig. 6A for the formation and evolution of WGSW (dark red symbols) and WGIW (light green symbols).
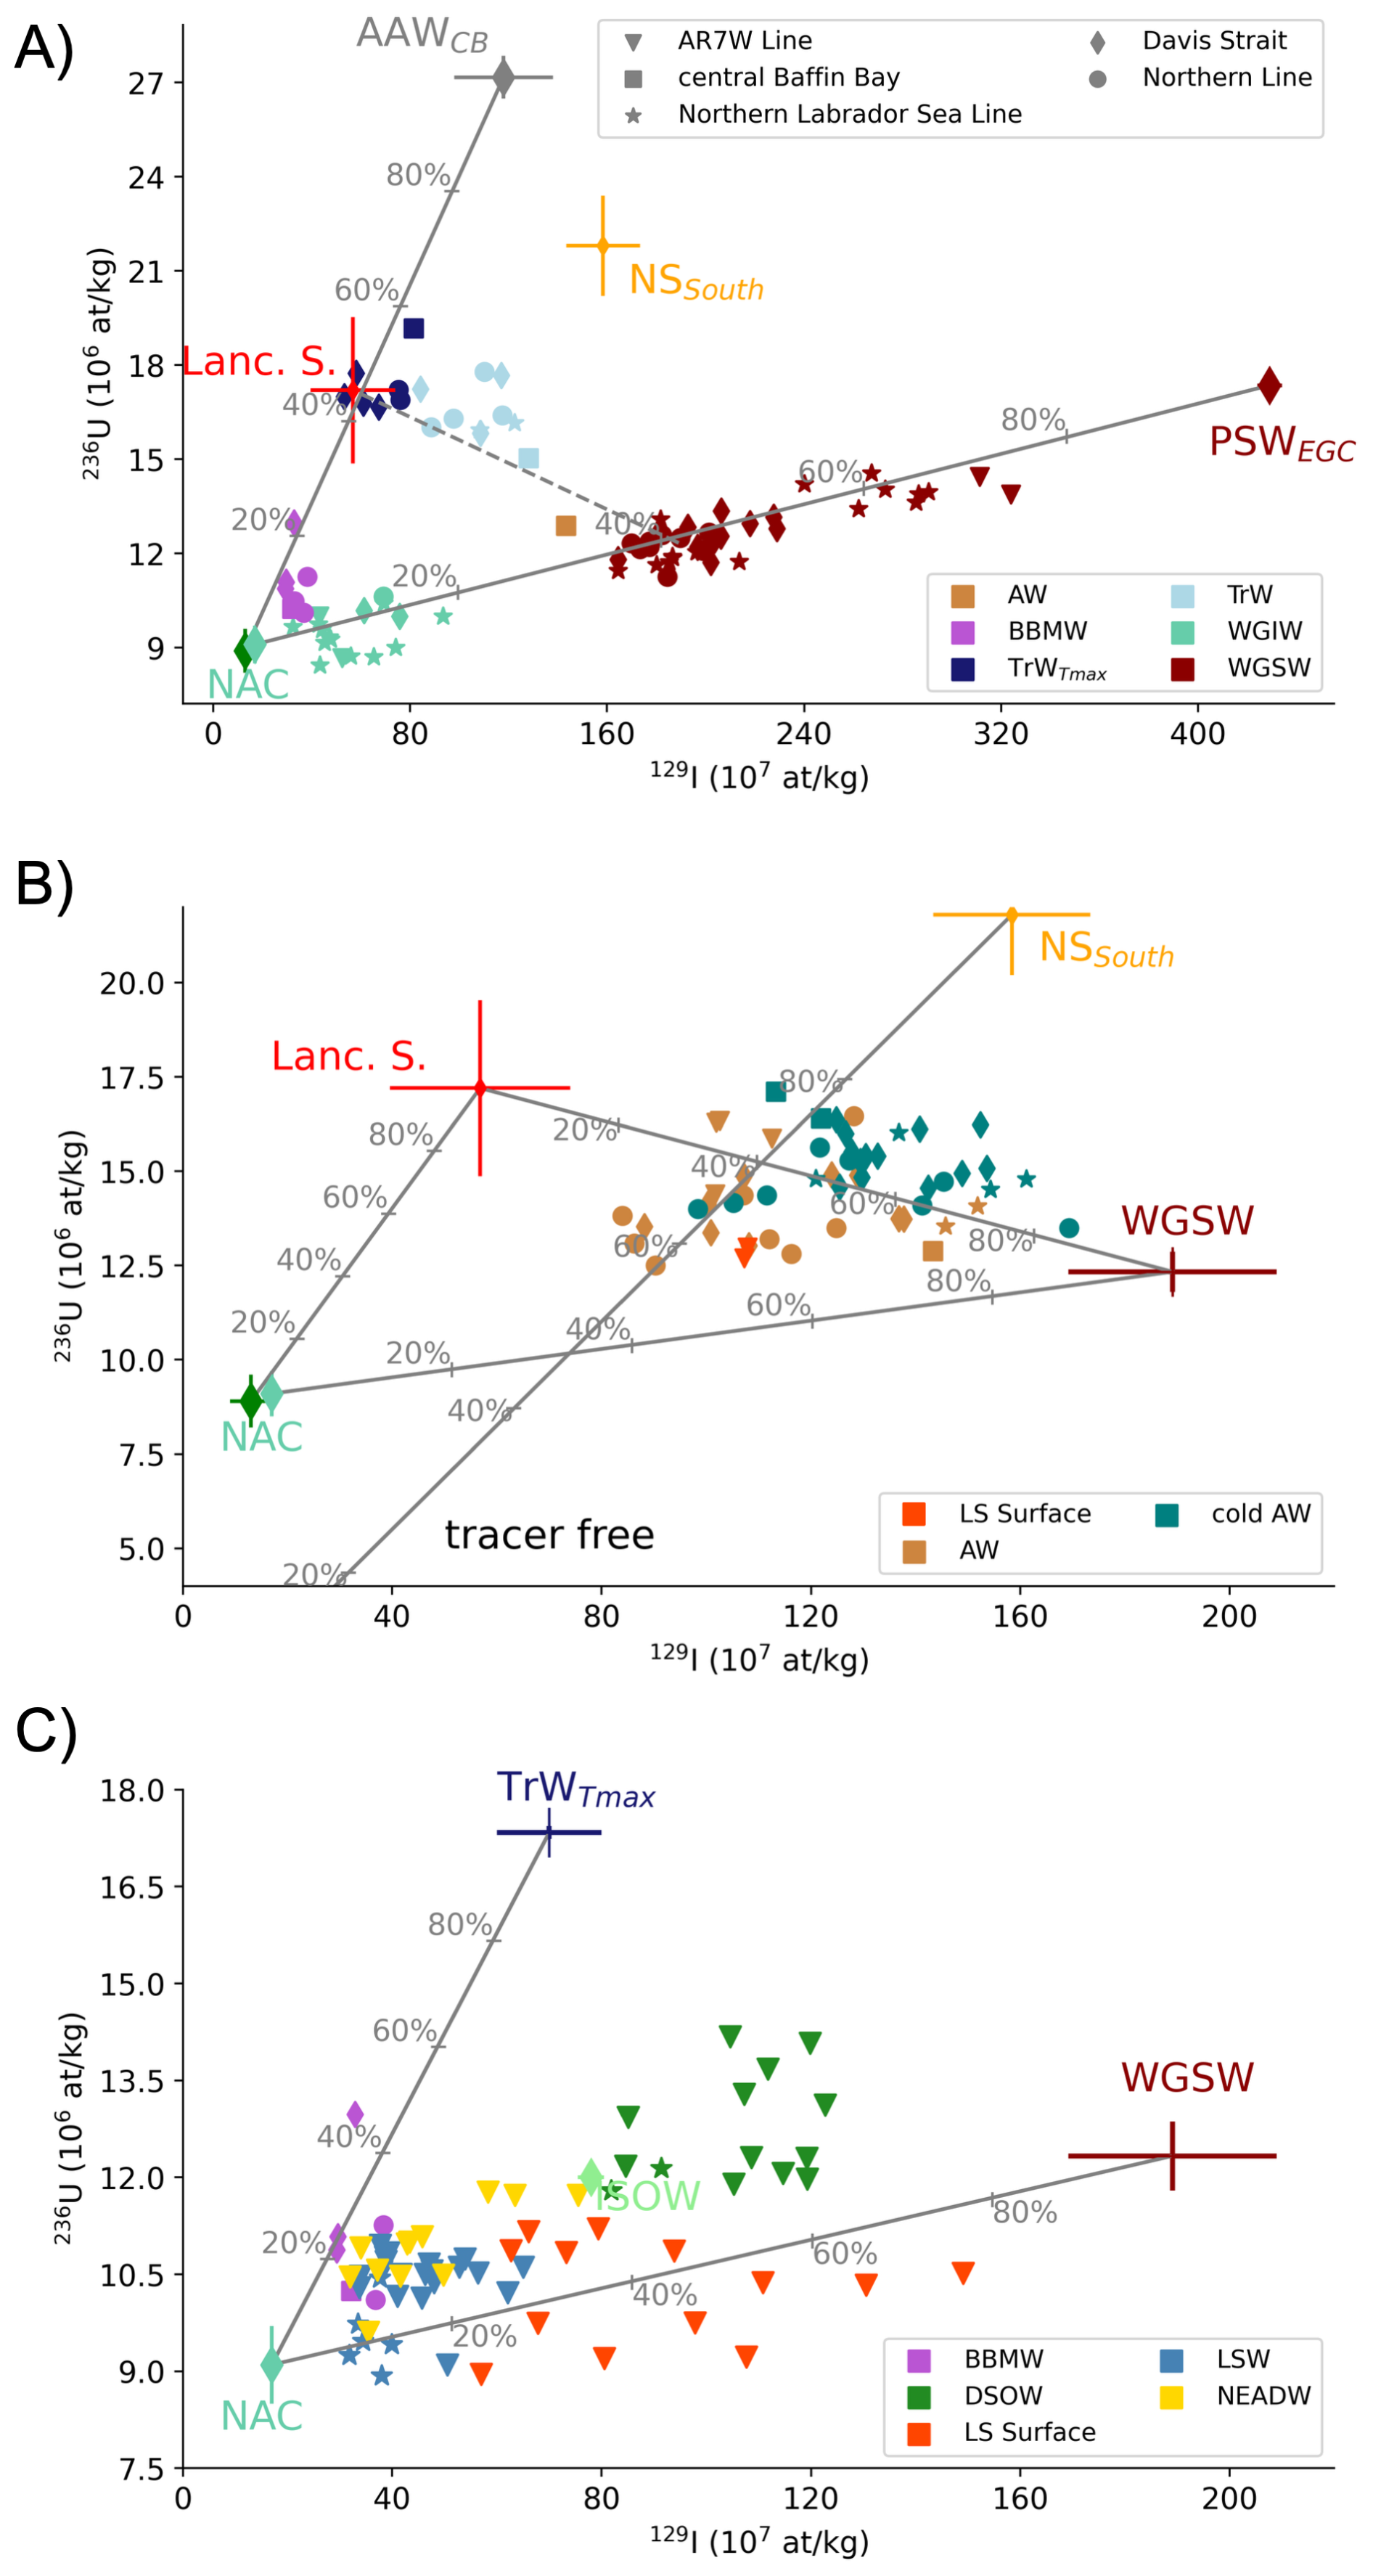
Figure 6Binary mixing model of 129I vs. 236U used to infer water mass origins and mixing. Symbol shapes indicate sampling locations: central Baffin Bay (squares), Northern Line (dots), Davis Strait (diamonds), Northern Labrador Sea Line (stars), and AR7W (triangles). Colored diamonds mark endmembers, with crosses showing endmembers defined in this study, including their maximum spread.The Pacific Water and NAC endmember overlap due to similar tracer concentrations. The line connecting the endmembers represent mixing lines, while number along the mixing lines denotes the mixing fraction. The water masses presented in the panels are selected based on their tracer properties. (A) Maximum tracer concentrations in the study region are represented by West Greenland Shelf Water (WGSW), West Greenland Irminger Water (WGIW), and Baffin Bay Mode Water (BBMW). Additionally, Transition Water (TrW) is also represented with special emphasis on its temperature maximum (TrWTmax dark blue symbols). (B) Mixing between Arctic Water (AW) and cold Arctic Water (cold AW) in Baffin Bay. (C) Mixing in the Labrador Sea, including: Labrador Sea Water (LSW), Labrador Sea Surface Water, and North East Atlantic Deep Water (NEADW). References, sample counts, and sampling years for endmembers are listed in Table A2. Abbreviations are explained in Table A1.
Along the AR7W Line (dark red triangles in Fig. 6A) the WGSW retained up to 70 % of the PSWEGC. As the WGSW flows northward along the Greenland shelf, it becomes progressively entrained by tracer-free water and WGIW (light green symbols in Fig. 6A). By the time WGSW reaches Davis Strait and the Northern Line (diamonds and circles in Fig. 6A), the PSWEGC fraction has declined to approximately 40 %. This dilution could be compared to the decrease in the thickness of warm Polar Water (equivalent to WGSW) as they flow from eastern Davis Strait to eastern Northern Line, observed by Huang et al. (2024).
At central Baffin Bay, water classified as Arctic Water (light brown square in Fig. 6A), preserved a significant fraction (about 30 %) of PSWEGC compared to the endmember at Denmark Strait. This finding contrasts with Huang et al. (2024) and Lehmann et al. (2022), who did not consider WGSW as a major contributor to the formation of water masses in the region. The substantial presence of WGSW may underscore the role of eddies, the off-branching character of the WGC, and the significant transformation of surface water in Baffin Bay.
On the contrary, WGIW is positioned closer to the NAC endmember than WGSW, reflecting a stronger influence from southern-sourced water and thus exhibits lower tracer concentrations. An increase in its tracer content from the Labrador Sea to Baffin Bay confirms its mixing with WGSW, preserving approximately 15 % PSWEGC, consistent with the decrease in the thickness observed by Huang et al. (2024), while contrasting Rysgaard et al. (2020), who did not observe WGIW on the Greenland shelf in Baffin Bay. Furthermore, Huang et al. (2024) observed WGIW in central Baffin Bay, which could not be identified here, probably due to the limitation of the mixing of two endmembers in the tracer analysis.
4.3 Origin of Transition Water, Baffin Bay Mode and Bottom Water
The formation and origin of Transition Water (TrW) remain subjects of ongoing debate. Huang et al. (2024) characterised Transition Water (their TrW1) as a mixture of several water masses, including WGIW, cold Arctic Water and WGSW. In contrast, Rudels (2011) described it as a blend of “Atlantic” water from the south and denser, colder northern water. Complementing these perspectives, nutrient analyses by Lehmann et al. (2022) and Azetsu‐Scott et al. (2010) identified WGIW, Pacific Water, and Arctic-Atlantic Waters as the primary contributors of Transition Water formation.
The broad range of 129I and 236U concentrations within Transition Water are consistent with the contribution from multiple endmembers (Huang et al., 2024; Lehmann et al., 2022). The temperature maximum within Transition Water (TrWTmax, dark blue symbol in Figs. 4 and 6A) clusters near the Lancaster Sound endmember (red cross in Fig. 6A), whereas the remaining Transition Water (light blue symbols in Figs. 4 and 6A) exhibits a spread towards lower temperatures and higher 129I, indicative of additional mixing processes. However, as mentioned above, the Lancaster Sound outflow is known to be highly variable (Lehmann et al., 2022; Peterson et al., 2012; Prinsenberg and Hamilton, 2005) and might shift along the Pacific–AAWCB mixing line. Therefore, the contribution of Lancaster Sound outflow to waters in Baffin Bay (TrWTmax and BBMW) is not calculated using this geographical endmember but from the mixing line between Pacific–AAWCB endmembers. Although the Lancaster Sound outflow might not be considered as a fixed endmember, its influence remains apparent in the composition of Transition Water and TrWTmax. TrWTmax reflects contributions of cold, 236U-rich AAWCB mixed with Pacific Water from Lancaster Sound, while its elevated temperatures are likely caused by mixing with warm, 129I- and 236U-poor WGIW within Baffin Bay. This results in a contribution of the AAWCB of 40 %–60 % if calculated using Pacific water as the lower tracer endmember (i.e. this is a lower bound contribution, as TrWTmax also mix with WGIW). This finding aligns with observations by Lehmann et al. (2022), but emphasises the outflow of Lancaster Sound as more important than contributions by the Nares Strait endmember. This finding differs from Shadwick et al. (2011), who attributed the AAW component to Nares Strait outflow only. The Lancaster Sound outflow might be transported from shallow to intermediate depths by deep convection and cascading driven by intense air–sea fluxes and polynya activity (Wang et al., 2012; Vincent, 2019; Yao and Tang, 2003; Aagaard and Carmack, 1989; Marson et al., 2017), being subsequently redistributed through lateral exchange between slope and basin waters, as modelled by Münchow et al. (2015). At intermediate depths, particularly along the 27.5 kg m−3 isopycnal (Lobb et al., 2003; Shan et al., 2024), this dense water may encounter warm WGIW, where diffusive instability and cabbeling promote further mixing and downward propagation (Lobb et al., 2003; Shan et al., 2024; Huang et al., 2024), forming TrWTmax.
Ultimately, Transition Water forms through the evolution of TrWTmax toward colder, fresher waters, which results in less 236U and higher 129I due to mixing with WGSW (Figure 6A, dashed line connecting TrWTmax with WGSW). WGSW may entrain Transition Water through cascading along the Greenland Shelf (Marson et al., 2017). Additionally, Transition Water might also have contributions from the Nares Strait outflow (Jones et al., 2003), as observed by the increased concentrations 236U that bring some of the Transition Water to the Nares Strait endmember in Fig. 6A.
Despite the limitations of a two-endmember model to constrain the origin and mixing of water masses, the radionuclide tracers strongly suggest the presence of AAWCB outflowing Lancaster Sound and subsequently entraining Transition Water, a process that could not be quantified when using nutrient-based tracers alone (Lehmann et al., 2022; Azetsu‐Scott et al., 2012). Furthermore, radionuclide tracers show negligible contributions of WGSW to TrWTmax.
Moving to greater depths, the origin and formation of BBMW still remain unclear (Bourke et al., 1989; Rudels et al., 2004). BBMW (purple symbols in Fig. 6A) has been suggested to be older than other water masses in the region, with tracer ages estimated to be up to 90 years (Lique et al., 2010), which aligns well with a tracer signal of “old” water according to Fig. B1. The relatively high 236U and very low 129I displayed by BBMW indicate the presence of AAWCB and align with observations by Rudels et al. (2004) and Bailey (1956). However, based on the available tracer data, it is not possible to differentiate if the AAWCB originated from Nares Strait, as indicated by Rudels et al. (2004) and Bailey (1956) or from Lancaster Sound.
Finally, the deepest waters in Baffin Bay, also known as Baffin Bay Bottom Water (BBBW), remain tracer-free (Fig.4B, dark purple squares). Low tracer concentrations are consistent with observations by Bourke et al. (1989), which show that convection or cascading do not contribute to BBBW formation, and is further consistent with its long ventilation time of up to 455 years based on tritium and 3He measurements (Top et al., 1980). Other studies have posited that Atlantic Water from the Canada Basin may contribute to BBBW formation (Rudels, 1986; Rudels et al., 2004), but this interpretation is incompatible with high tracer concentrations in the Canada Basin (Payne et al., 2024), which would manifest as elevated 129I and 236U concentrations in BBBW.
4.4 Origin and formation of Arctic Water and cold Arctic Water
Arctic Water and cold Arctic Water are significant sources of freshwater to the subpolar North Atlantic, and they are strongly influenced by sea ice, glacial meltwater and Pacific water (Huang et al., 2024; Sherwood et al., 2021; Curry et al., 2014; Shan et al., 2024). However, the composition of these freshwaters as they mix with other water masses in the region remains uncertain. Here, 236U and 129I demonstrate that cold Arctic Water is a mixture of Arctic-Atlantic Water outflowing mostly through Nares Strait, Pacific Water, and WGSW, with minor contributions from Lancaster Sound. Arctic Water has a similar origin, but with a stronger influence of tracer-free freshwater. Both Arctic Water and cold Arctic Water are presented in Fig. 6B as light brown and teal symbols, respectively. The new endmember for WGSW is calculated as the mean of the values shown in Fig. 6A, with the error bars representing the corresponding standard deviation. This endmember includes all samples with concentrations of 129I below 240 × 107 at kg−1, selected to best characterise the core of WGSW advecting north beyond Davis Strait. We consider mixing between Lancaster Sound (to best represent the surface and subsurface inflow) and WGSW (Lehmann et al., 2022); Nares Strait outflow (NSSouth) and Pacific Waters (Jackson et al., 2014). Additionally, potential mixing between Lancaster Sound and NAC and WGSW with NAC (Marson et al., 2017) is indicated as grey solid lines.
Cold Arctic Water generally has higher tracer concentrations than Arctic Water and is confined to a cold (CT ∼ −1.5 °C) and rather narrow temperature range, while it covers a salinity range between 32.5 and 33.6 (Figs. 4 and B4). Although Huang et al. (2024) observed mixing between cold Arctic Water (their cold Polar Water), meteoric water, and WGIW, our mixing model (Fig. 6B) points to additional water masses involved in its formation. In the following, we examine each contributor in detail, starting with WGSW.
In the binary mixing model, cold Arctic Water stretches from the mixing line of Nares Strait South (NSSouth) and tracer-free waters towards the WGSW endmember, suggesting the presence of WGSW in cold Arctic Water as well. The largest contribution of WGSW, approximately 80 %, is observed in a sample located at 54 m depth in the middle of the Northern Line (circle in Fig. 6B). WGSW generally follows the main cyclonic circulation (Curry et al., 2011; Azetsu‐Scott et al., 2012; Huang et al., 2024), which may cool through air-sea heat exchange in winter (especially in the North Water Polynya) and cascade along the Greenland shelf (Marson et al., 2017), thus reaching the temperature of the cold Arctic Water (Yao and Tang, 2003). In central Baffin Bay (teal square in Fig. 6B), the Nares Strait outflow contributes up to 70 % to cold Arctic Water, in agreement with previous observations by Huang et al. (2024); Lehmann et al. (2022) and Melling et al. (2001).
Finally, Pacific Water and NAC (Fig. 6B) with low 129I and 236U, may contribute to cold Arctic Water as well. While Huang et al. (2024) focused primarily on contributions of WGIW, the radionuclide tracer data is less conclusive, as mixing with either source produces a similar low-tracer signal. At this stage, the binary mixing model reaches its limit, unable to distinguish between these two low-tracer endmembers. Finally, mixing with Arctic Water, as previously noted by Huang et al. (2024), is likely but cannot be precisely quantified here due to similar 129I and 236U signatures of cold Arctic Water and Arctic Water. Overall, the cold Arctic Water cluster reflects a varying blend of water masses described above, showing no such clear trend when looking at hydrographic properties only.
Following the assessment of the cold Arctic Water cluster, we turn to Arctic Water to explore its distinct properties and its close association with cold Arctic Water. Although Arctic Water is fresher than cold Arctic Water, both water masses plot closely together in tracer space (light brown and teal symbols in Fig. 6B). Arctic Water appears to be the result of similar sources as cold Arctic Water but with higher contributions of low-tracer water, probably of tracer-free and Pacific origin (Huang et al., 2024; Planat et al., 2025; Sherwood et al., 2021). In Arctic Water, contributions of WGSW are observed in central Baffin Bay (light brown square in Fig. 6B), highlighting the strong stratification in this region. On the western flank of the Northern Line, there is an influx of low tracer water (light brown circles in Fig. 6B), probably due to mixing with 50 % of Pacific Water (if mixing between Pacific and NSSouth is considered). These mixed waters remain confined within the BIC and are transported southward. Stronger mixing with cold Arctic Water likely occurs near Davis Strait (diamond symbols), illustrating the dynamic conditions in this area (Huang et al., 2024; Tang et al., 2004). Further south in the Northern Labrador Sea Line (star symbols), Arctic Water was likely sampled within the bifurcation of the WGC, showing a WGSW contribution of up to 70 % (if mixing with Lancaster Sound outflow is considered). Gou et al. (2022) attributed a southward transport of water confined to the Greenland Coast to an instability of the WGC, which leads to shedding eddies in the northern Labrador Sea. In comparison, at the AR7W Line (triangles), Arctic Water carried by the Labrador Current transports a lower 129I signal, probably originating from the Nares Strait outflow (up to 70 %, again if mixing NSSouth with Pacific Water is considered). As the Labrador Current continues southward along the Canada Shelf, two surface samples (red triangles Fig. 6B) originating south west of the AR7W Line suggest further mixing between WGSW, Nares Strait and/or Lancaster Sound outflow and a low tracer component, probably of North Atlantic origin (i.e. NAC). The two surface samples are warmer (CT: 1.5 °C) and more saline (SA: 33.8) than Arctic Water, but colder and fresher than the remaining samples classified as Labrador Sea surface (Fig.4). Possible influences on the main water masses observed in the Labrador Current might include: seasonal variability in southward velocities at Davis Strait, which are generally highest in summer and lowest in winter (Curry et al., 2014; Myers, 2005; Shan et al., 2024); variability in the outflow of AAWCB via Hudson Strait south of the Northern Labrador Sea Line (Straneo and Saucier, 2008); the presence of eddies and Irminger Rings (Gou et al., 2022).
4.5 Implications on the formation of Labrador Sea Water and North East Atlantic Deep Water
The formation of Labrador Sea Water (LSW) is driven by deep winter convection and associated physical processes (Clarke and Gascard, 1983), and is modulated by multiple freshwater sources (salinity < 34.6; Zhang et al., 2021a) that alter its properties (Yashayaev, 2007; Yamamoto‐Kawai et al., 2008). The relative contributions of these sources remain uncertain, with most studies focusing on freshwater inputs from boundary currents (Schmidt and Send, 2007; Zhang et al., 2021a). In contrast, artificial radionuclides highlight the potential importance of off-boundary current sources in the formation of both LSW and North East Atlantic Deep Water (NEADW). Insights from 129I and 236U tracers suggest that the properties of LSW and NEADW may be shaped by mixing between BBMW, Transition Water (TrW), and the North Atlantic Current (NAC).
In the previous study by Leist et al. (2024) using 129I and 236U in the Labrador Sea region, the mixing model reached its limitations when trying to understand the origin of LSW, due to low tracer concentrations and the absence of critical endmembers. Nonetheless, that study showed that 129I-rich WGSW eddies contribute to LSW as they branch off the WGC and move into the interior of the Labrador Sea (Leist et al., 2024; Hátún et al., 2007; Holliday et al., 2009; Lilly et al., 2003; Chanut et al., 2008; Pacini and Pickart, 2022). Labrador Sea Water (blue symbols in Fig. 6C) appears to have a significant contribution of WGSW, estimated to be up to 30 % (if mixing with the NAC endmember is considered). The influence of WGSW is even stronger, up to 70 %, on surface water of the eastern Labrador Sea (light red triangles in Fig. 6C).
Another source of 129I and 236U in the LSW could be the Labrador Current, carrying Arctic Water and cold Arctic Water, but contributions to the LSW formation might be relatively small (< 10 %), as previously discussed in Myers (2005), Pickart and Spall (2007), Wang et al. (2018) and Duyck et al. (2025). However, the main LSW cluster observed in Fig. 6C (blue triangles) is located at comparable low 129I and elevated 236U concentrations. This suggests that another water mass, richer in 236U relative to 129I, is required to account for the observed composition of LSW. This feature, first noted by Castrillejo et al. (2018) and later confirmed by Leist et al. (2024), can now be explained by the influence of the Transition Water outflowing Davis Strait and entraining into LSW.
Among the southward-flowing water entering the Labrador Sea, the Transition Water is the only water mass with sufficiently high 236U concentrations to explain the tracer signature of LSW. To our knowledge, this entrainment of the Transition Water outflowing Baffin Bay into LSW has not been previously considered in the literature. To estimate the contributions of Transition Water a new endmember is derived from the maximum temperature observed in Transition Water (TrWTmax, dark blue cross in Fig. 6C) with error bars reflecting the variability between samples. As shown by the blue triangles in Fig. 6C, the contribution of TrWTmax could be as high as 20 %. In Davis Strait, long-term moored measurements of temperature and salinity (Fig. B5A, B), and across-strait velocity (2004–2024) at 60° W and 500 m depth support this view (Fig. B5C). They show a persistent southward flow of Transition Water from Davis Strait into the Labrador Sea from 2004 to 2024, complementing gridded transports for the 2004–2010 period (Curry et al., 2014). These measurements coincide with the 236U maximum in Davis Strait (236U ∼ 17.5 × 10⁶ at kg−1, Fig. 3), demonstrating that the transport towards the Labrador Sea of water fresher than LSW (SA < 34.9 g kg−1) provides both a 236U and freshwater source for LSW. Once the Transition Water enters the Labrador Sea, it may be entrained with LSW through mixing along-density surfaces (Zou et al., 2020). Furthermore, similar concentrations of 129I and 236U between BBMW and LSW (Fig. 4) suggest that substantial mixing also occurs between these water masses. As a result, with an average SA < 34.49 g kg−1, BBMW can also act as a further freshwater source for LSW. These previously unreported freshwater contributions from Transition Water and BBMW to LSW can help shed light on potentially unresolved physical processes in ocean models that contribute to deep convection variability in the Labrador Sea.
Finally, NEADW is a water mass that originates from multiple sources, including ISOW and LSW (Yashayaev, 2007; García-Ibáñez et al., 2015). In the mixing model (yellow triangles in Fig. 6C), NEADW occupies a low-tracer area influenced by several of these water sources, and known to be strongly entrained by ISOW (yellow-green diamond Fig. 6C, from Dale et al., 2024) while the contribution of DSOW (dark green triangles) is minor (García-Ibáñez et al., 2018). However, the elevated 236U relative to 129I is not explained by the endmembers established so far. Our results suggest that Transition Water and/or BBMW contribute up to 25 % to NEADW when mixing with NAC is considered. During autumn and winter, BBMW can enter the deep Labrador Sea as a weak overflow through Davis Strait (Huang et al., 2024; Curry et al., 2014). Once there, it joins the deeper layers and mixes with NEADW. Although the simple two-endmember model used here cannot fully resolve every contribution, particularly under low tracer concentrations and multiple sources, it still provides a valuable first-order approximation. Future work could build on this foundation with a more comprehensive multiparameter analysis.
This study uses 129I and 236U tracers in Baffin Bay, Davis Strait, and the Labrador Sea to better resolve the pathways and transformations of Arctic and Atlantic water. Elevated 236U in Transition Water reveals that Arctic–Atlantic Water from the Canada Basin contributes significantly (up to 60 %) to Transition Water formation, demonstrating that the outflow of Atlantic-derived water, most probably through Lancaster Sound, has been underestimated so far. At the same time, our results show that the West Greenland Shelf Water feeds into Arctic Water (75 %) in central Baffin Bay. Cold Arctic Water is influenced by Nares Strait outflow (up to 70 %) at the centre of the bay, while on the eastern side, it contains up to 80 % West Greenland Shelf Water. These processes highlight the role of Arctic outflows in the delivery of freshwater to Baffin Bay and the Labrador Sea. South of Davis Strait, our results show that Transition Water provides a notable contribution (up to 20 %) to the formation of Labrador Sea Water with potential contributions to North East Atlantic Deep Water. This previously overlooked pathway not only supplies freshwater but also leaves a distinct tracer signature, with direct implications for convection processes in the Labrador Sea and the composition of North East Atlantic Deep Water.
Together, these findings emphasise that Arctic outflows through the Canadian Arctic Archipelago are more important than previously assumed. They shape the transformation of Baffin Bay water masses and exert a significant influence on the ventilation and freshwater budget of the subpolar North Atlantic. This work motivates repeated sampling to understand inter-annual variability, while capturing these processes more accurately in ocean models will be essential for predicting future changes in deep water formation and the stability of the Atlantic Meridional Overturning Circulation.
Table A1Abbreviations of water masses and currents cited in the manuscript. Water mass definitions are based on classifications from Curry et al. (2014), Huang et al. (2024), García-Ibáñez et al. (2015), Yashayaev (2007) and Bourke et al. (1989). In this work, hydrographic properties are reported as follows: Absolute salinity (SA, g kg−1) and conservative temperature (CT, °C) are given for all data newly analysed in this study, following TEOS-10 recommendations. For water masses described in the literature whose properties were not re-evaluated here, values are reported as practical salinity and potential temperature (Tpot, °C), following the original sources. This approach ensures consistency with both current standards (TEOS-10) and historical literature for all water mass and current definitions.
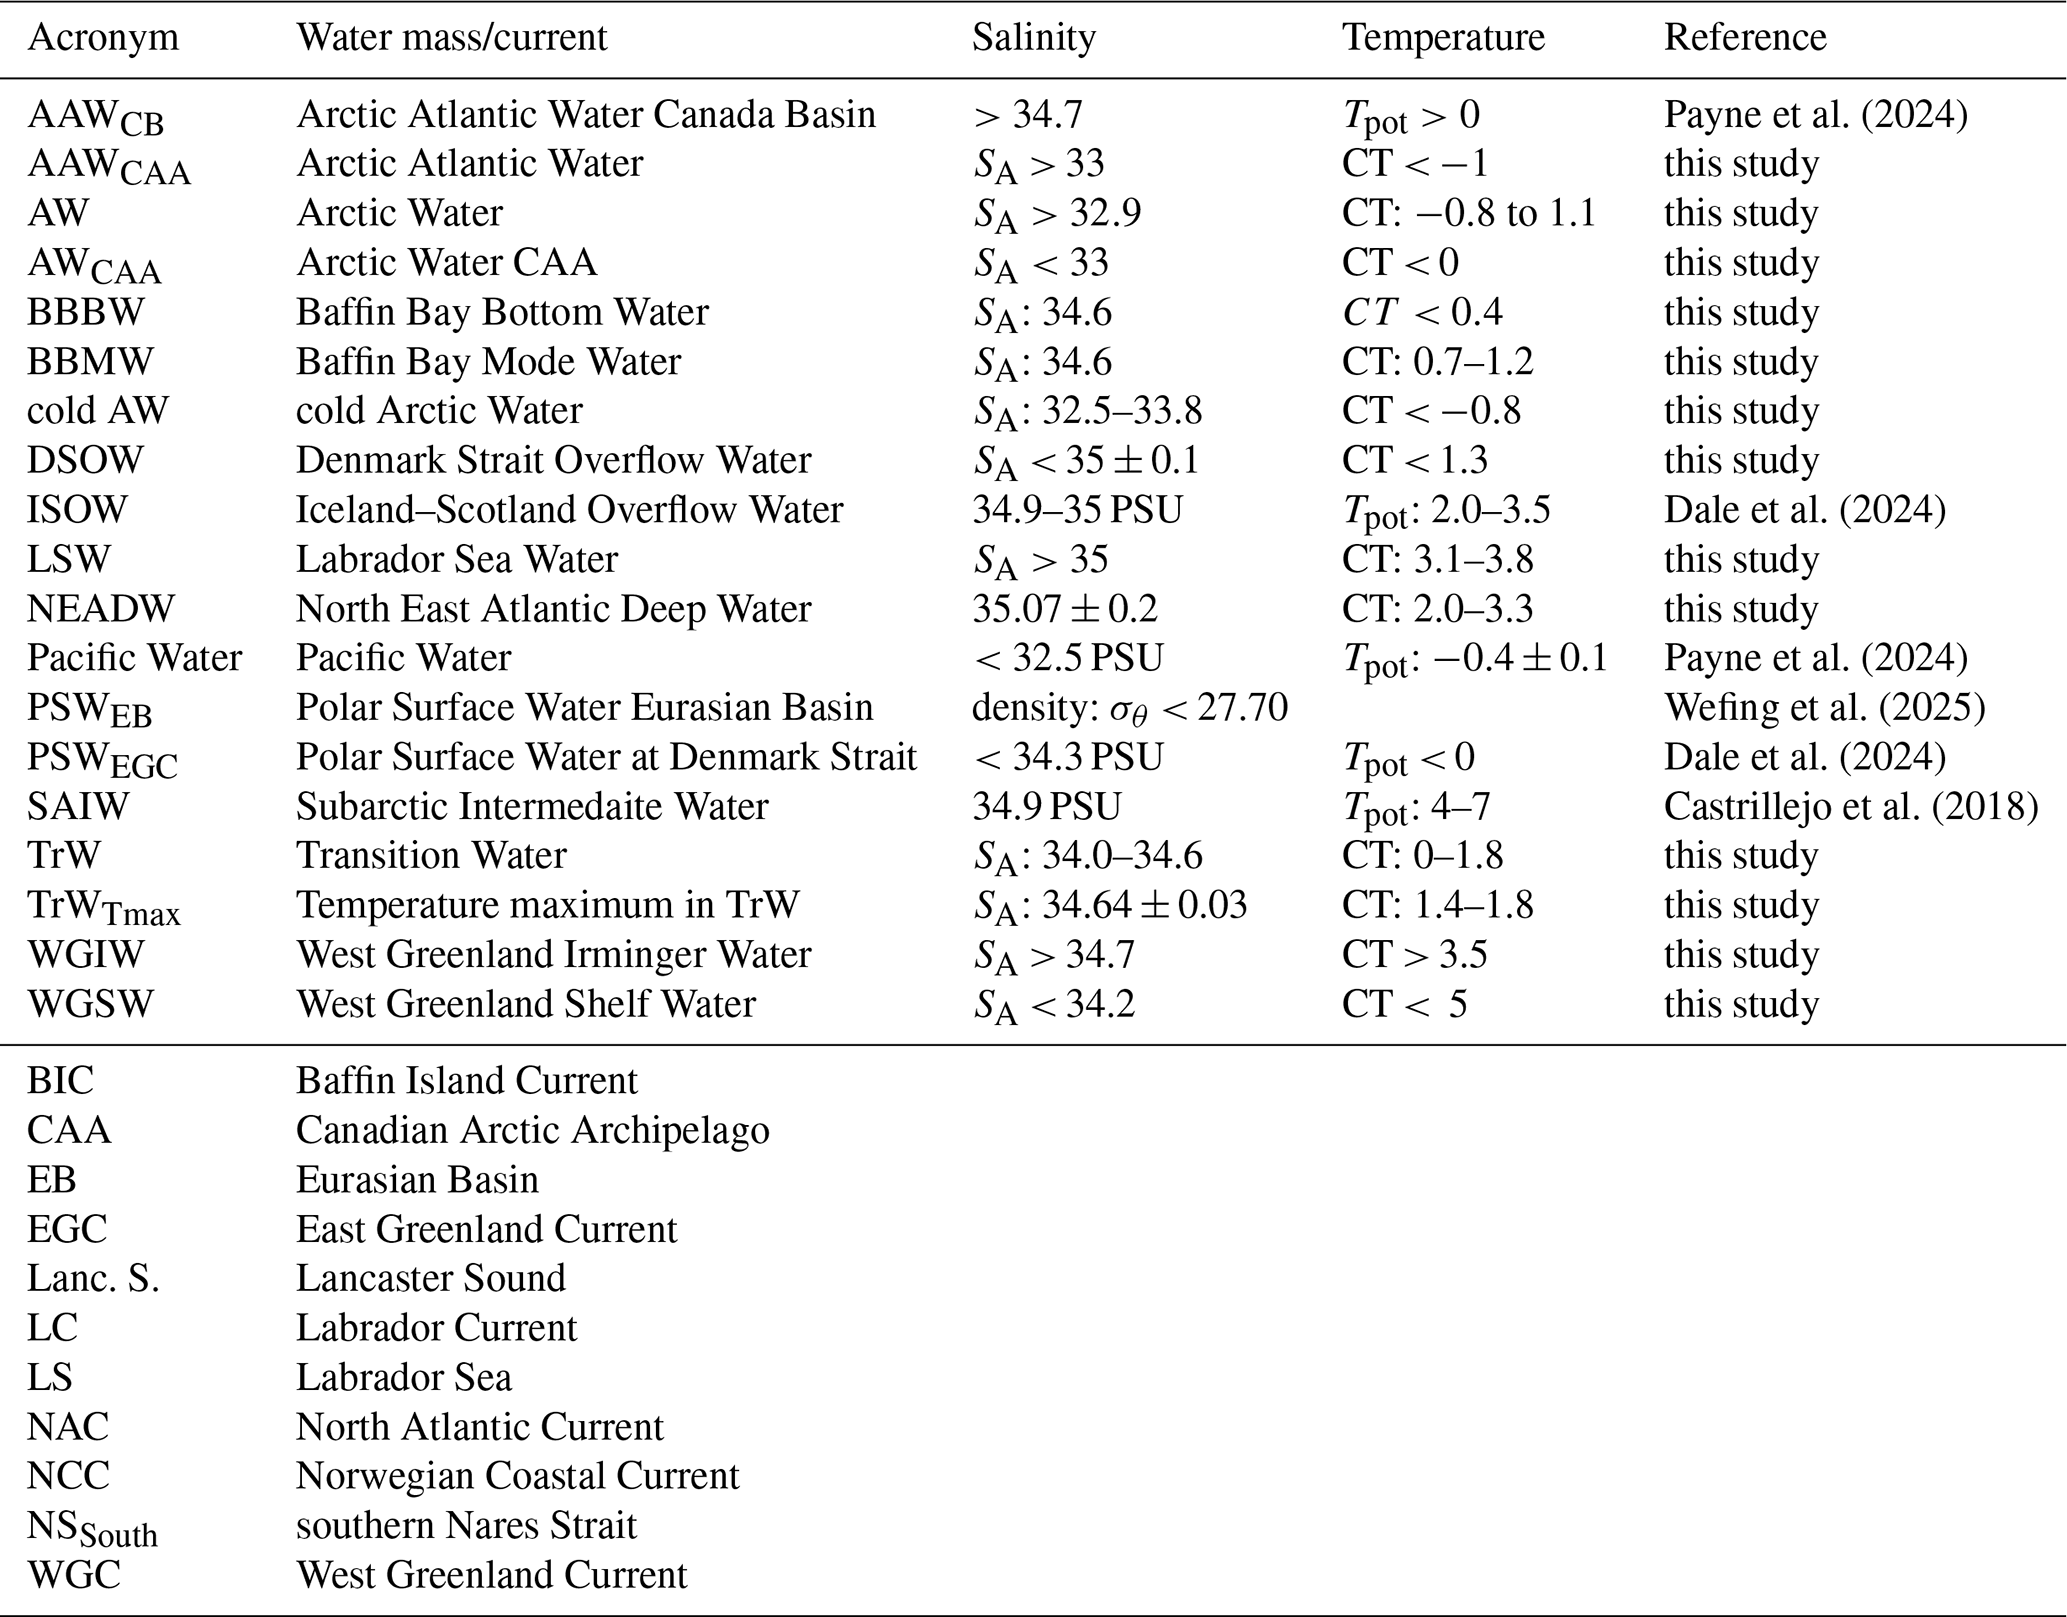
Table A2Endmember data with geographic location and depth, concentrations of 129I and 236U and hydrographic properties.
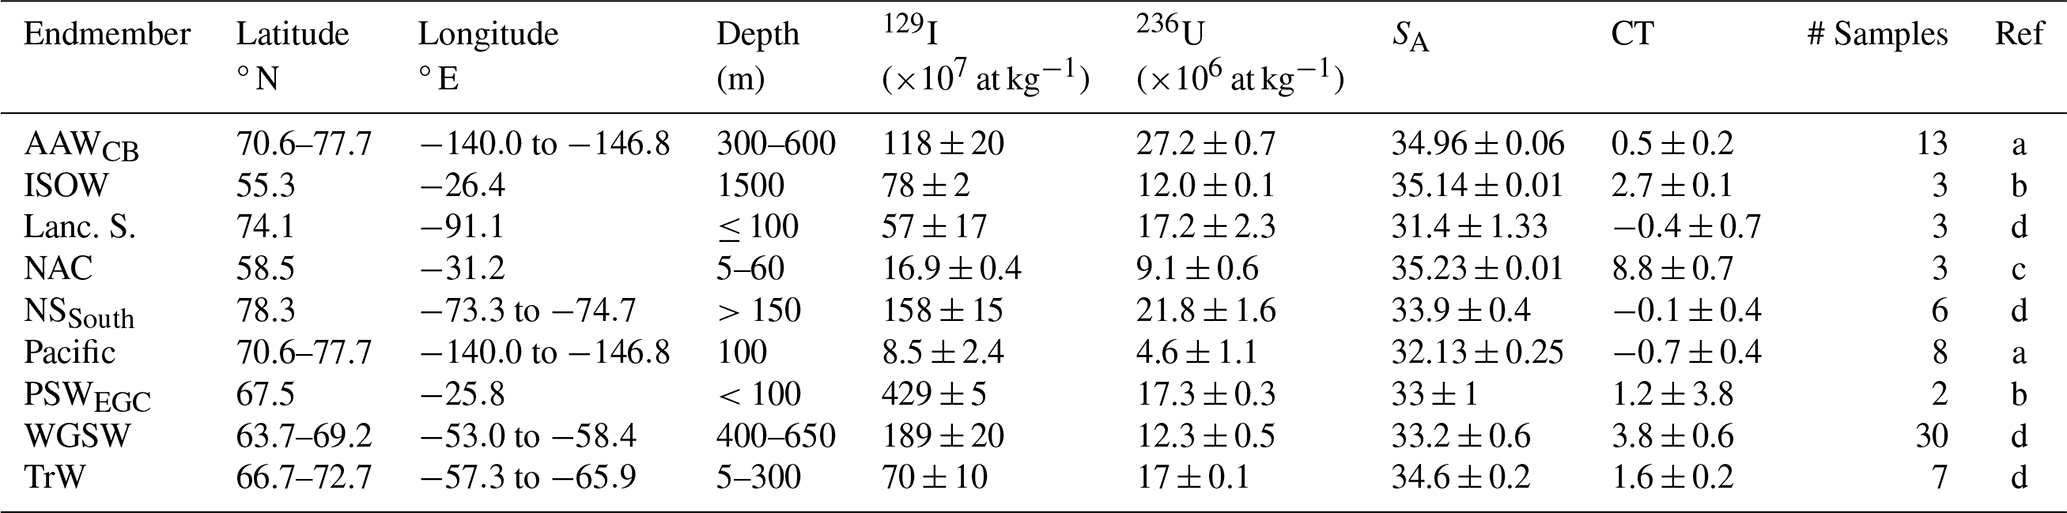
a Payne et al. (2024), b Dale et al. (2024), c Castrillejo et al. (2018), d this study.
Table A3Water mass fractions and associated endmembers. Fractions have been calculated using Eq. (1) (see methods section) and results represent the fractions f of the water mass described in the first column. Vector b is the distance between the sample and the endmember indicated in the second column (or cluster of samples) and in Fig. 6, and vector a is defined by the two endmembers described in the third column of the table.
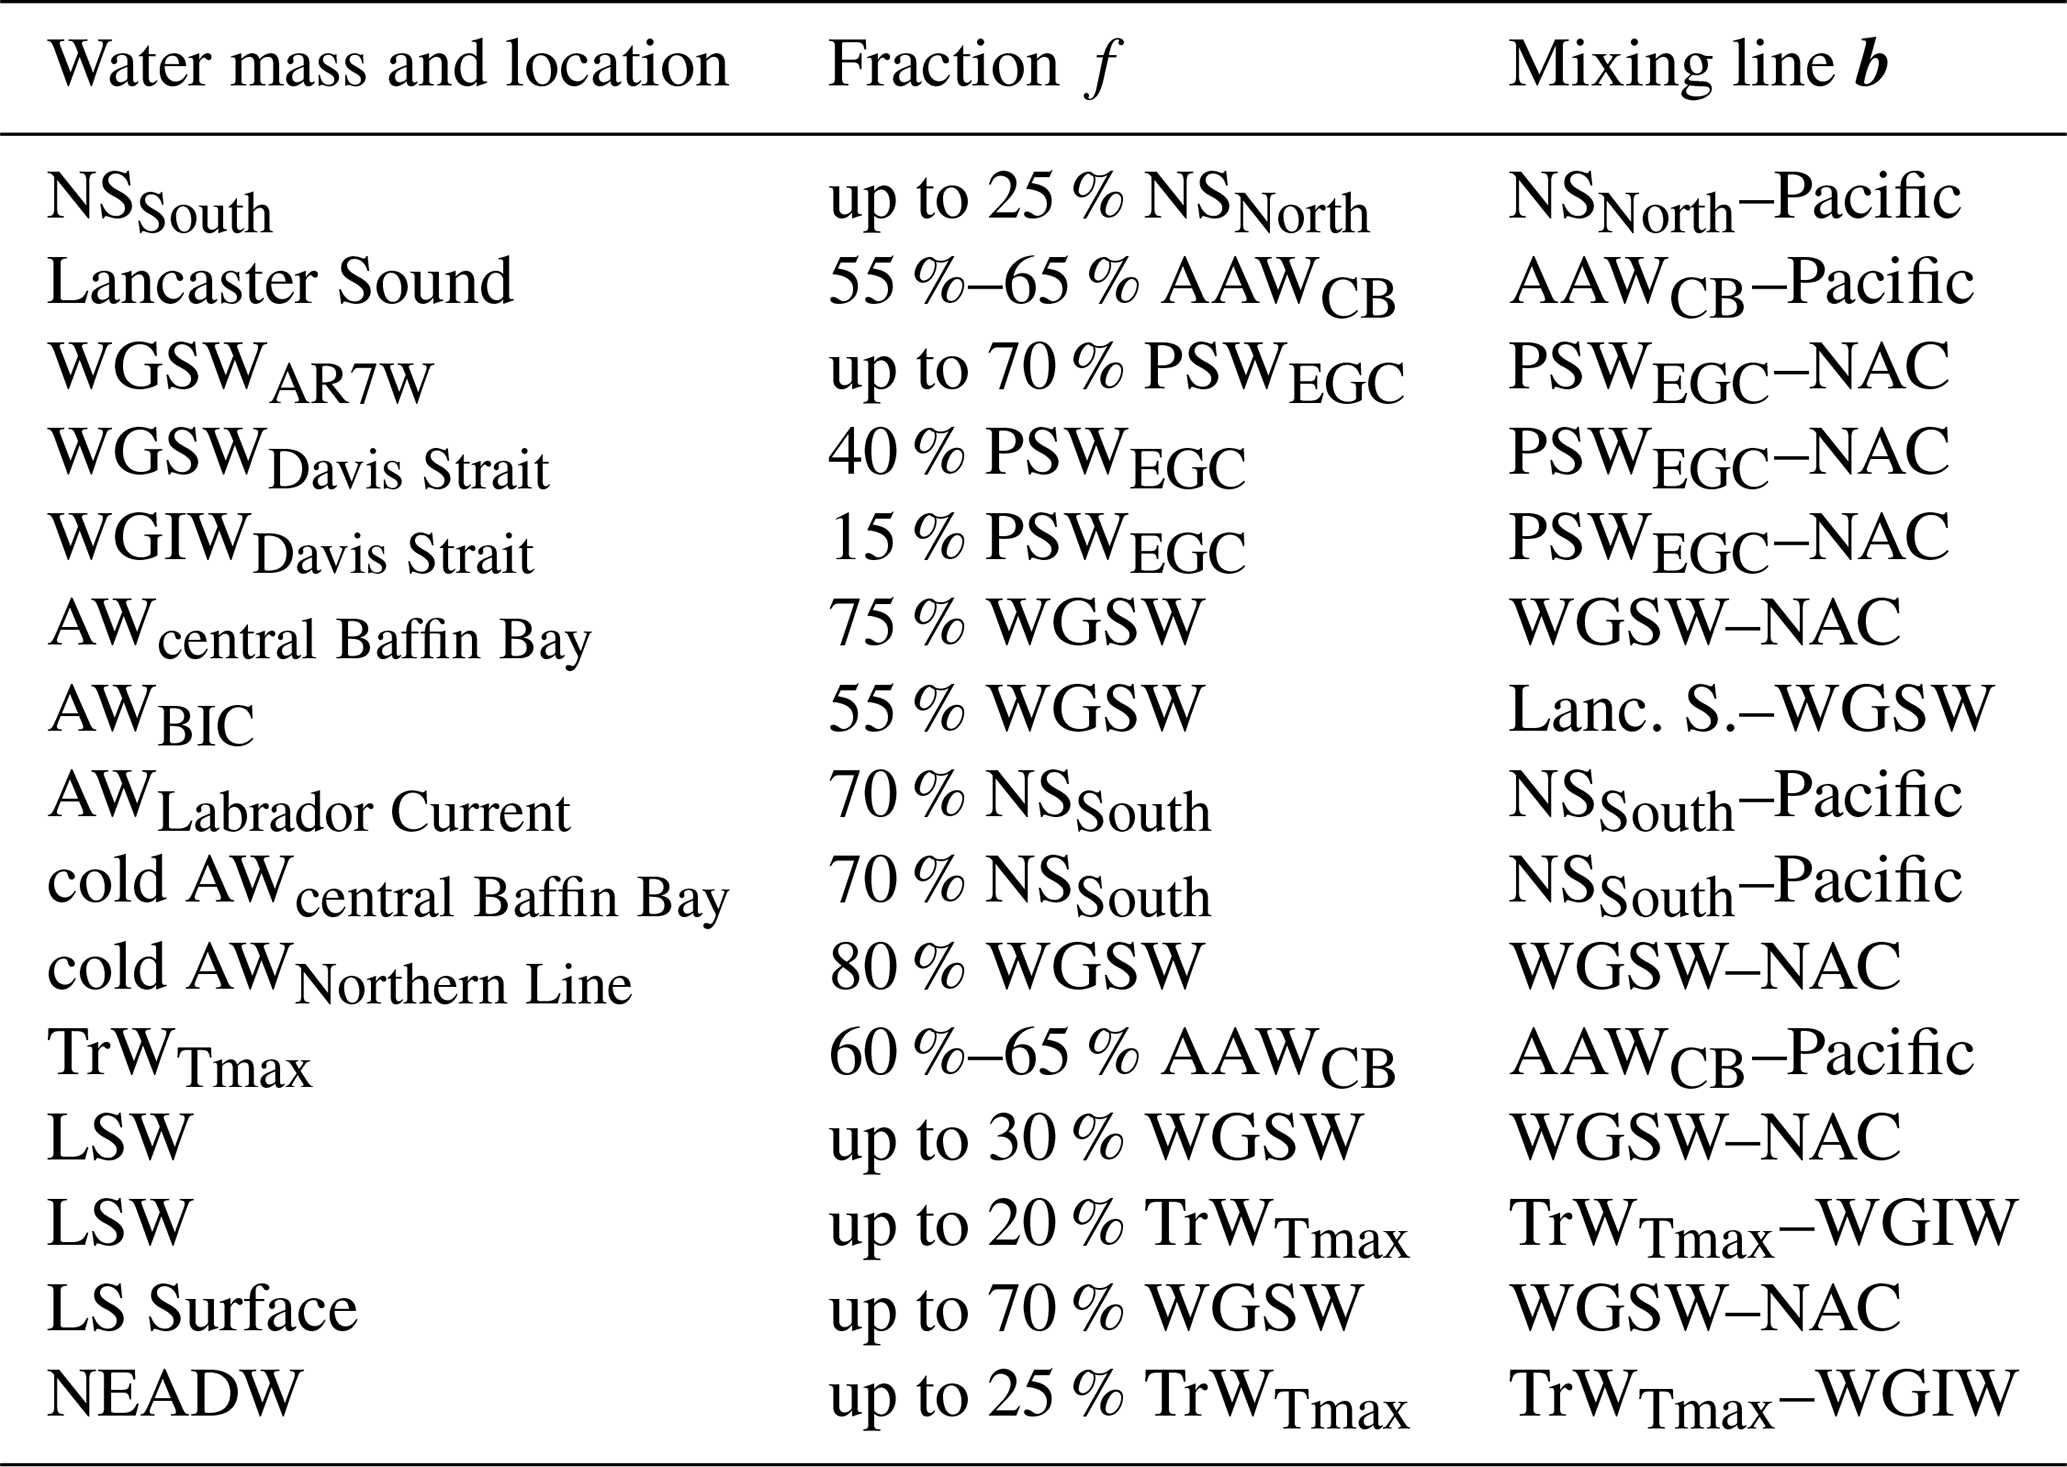
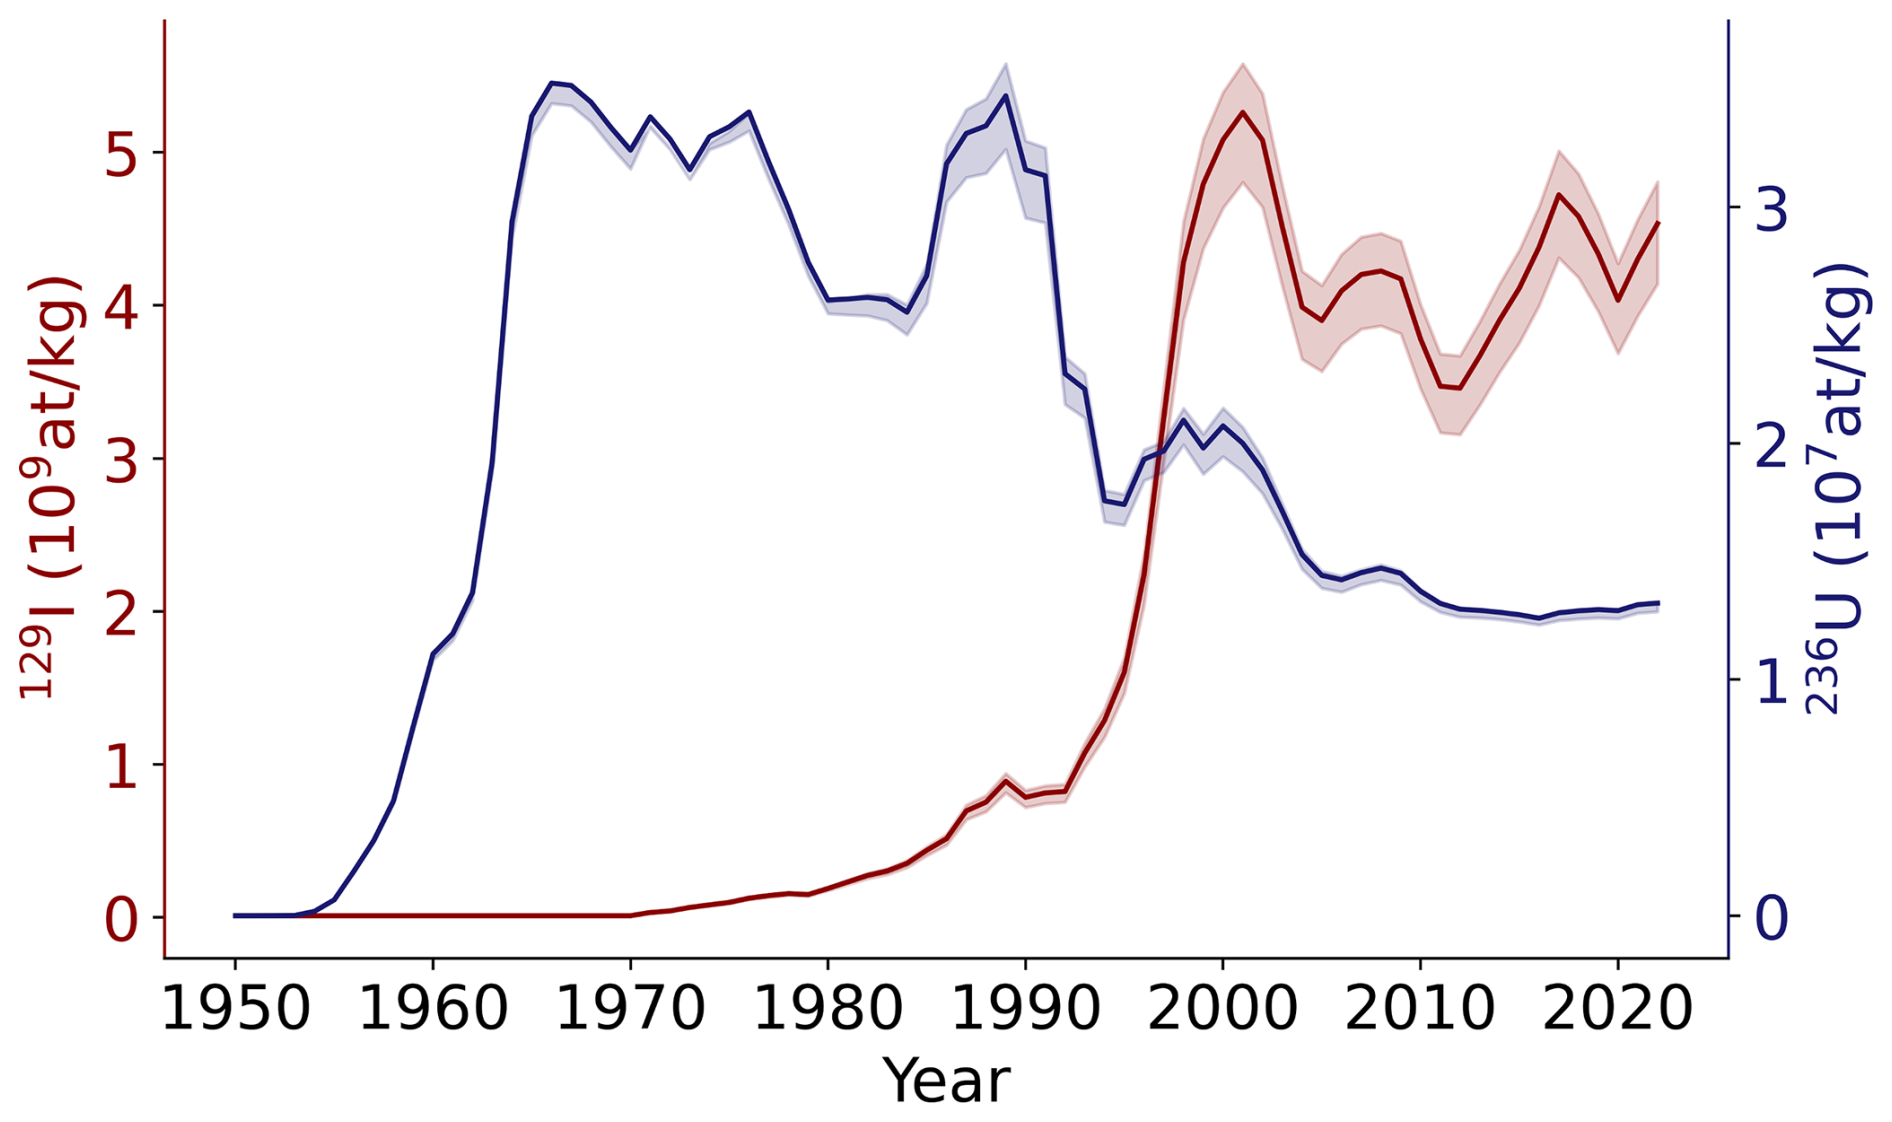
Figure B1Input function of 129I (red) and 236U (blue) defined at 70° N in northern Norway showing the combined input from nuclear fuel reprocessing plants in Sellafield (UK) and La Hague (F), and the global fallout from atmospheric nuclear weapon tests (Wefing et al., 2021; Payne et al., 2024).
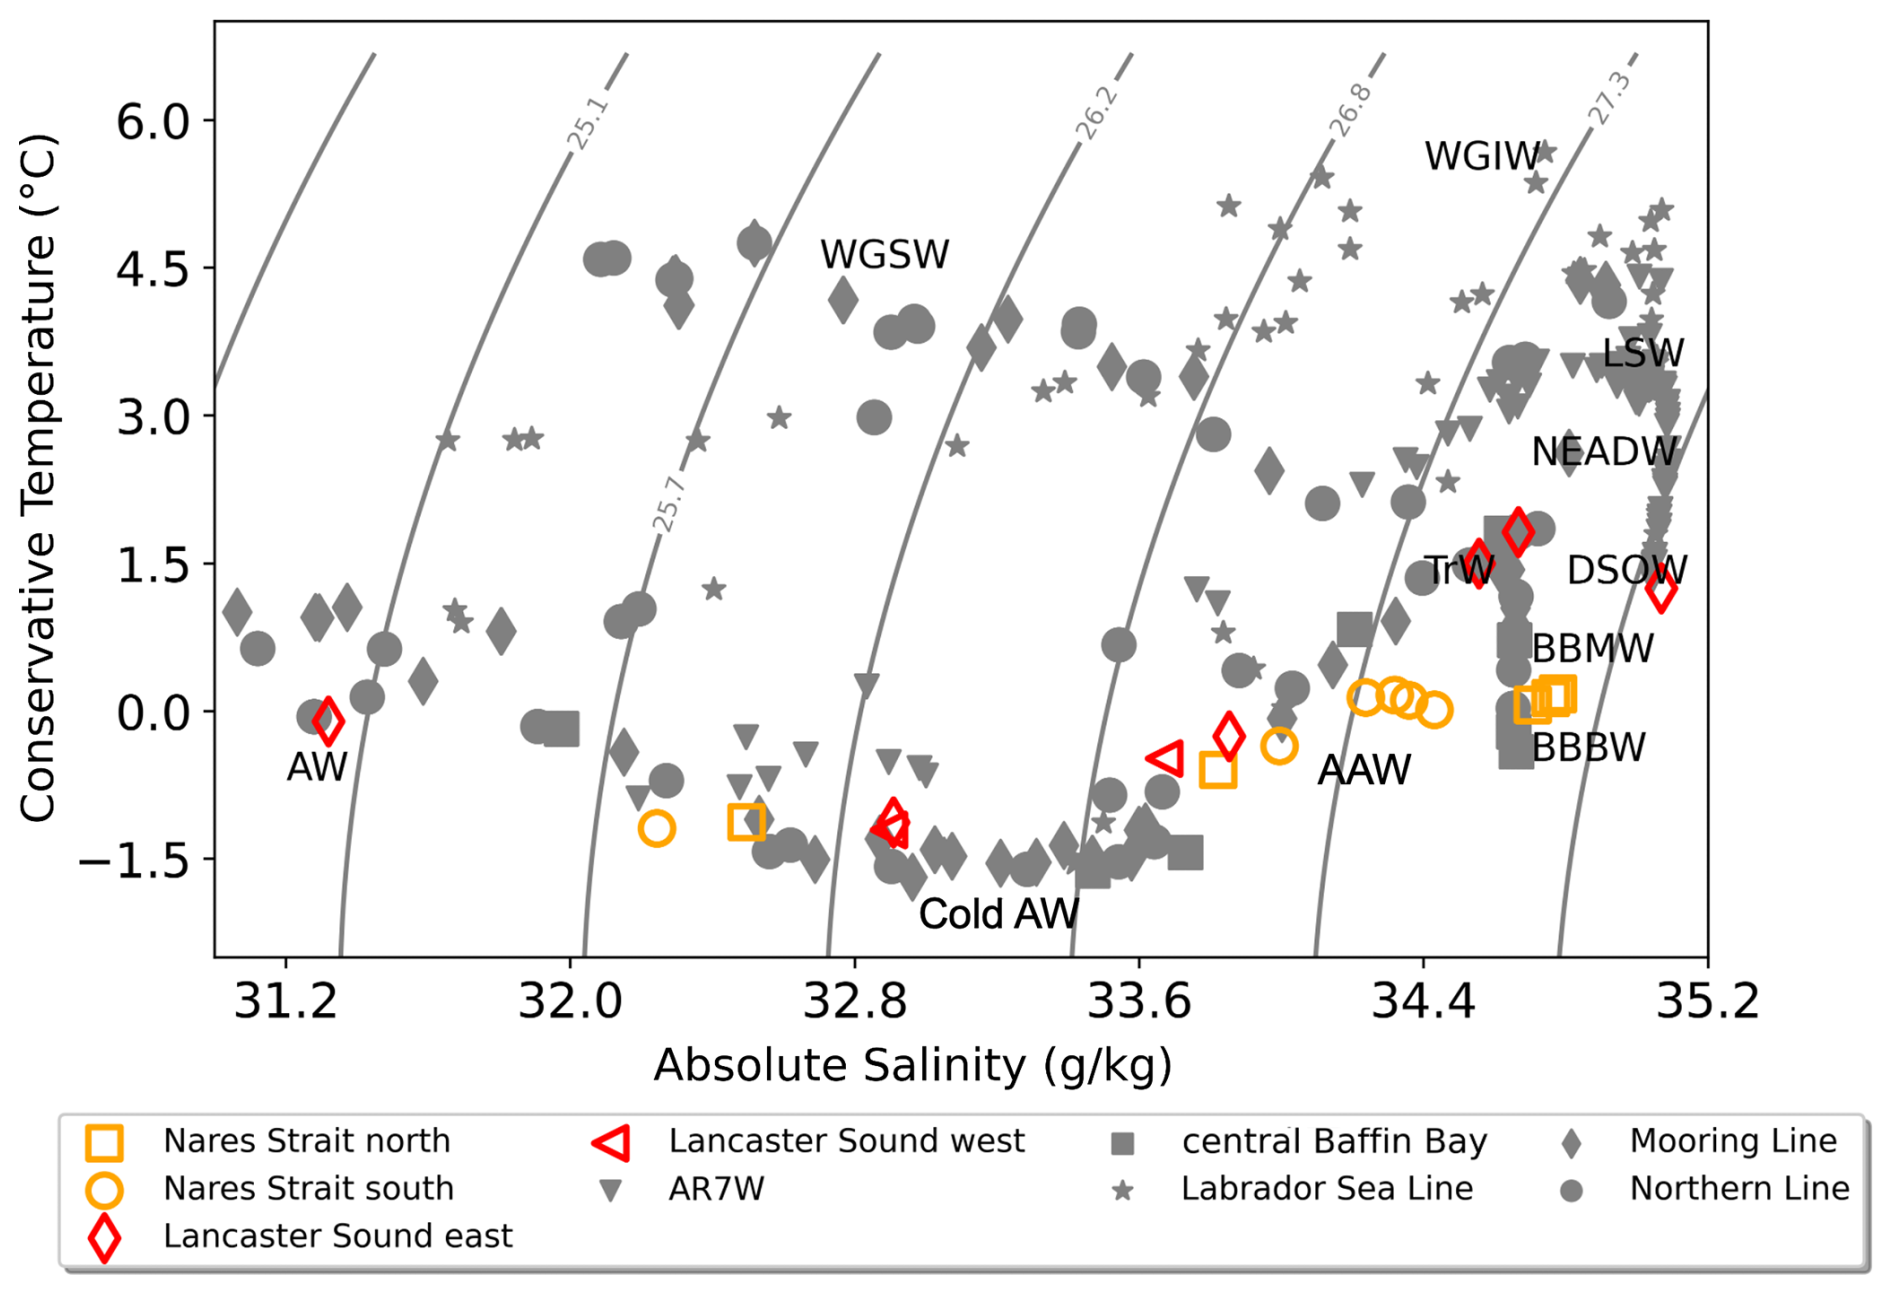
Figure B2T–S diagram of all samples reported in this study. Grey symbols represent the samples covering the four lines and central Baffin Bay sampled in 2022. The red symbols represent samples from Lancaster Sound, while the orange symbols represent the samples from Nares Strait, both sampled in 2024.
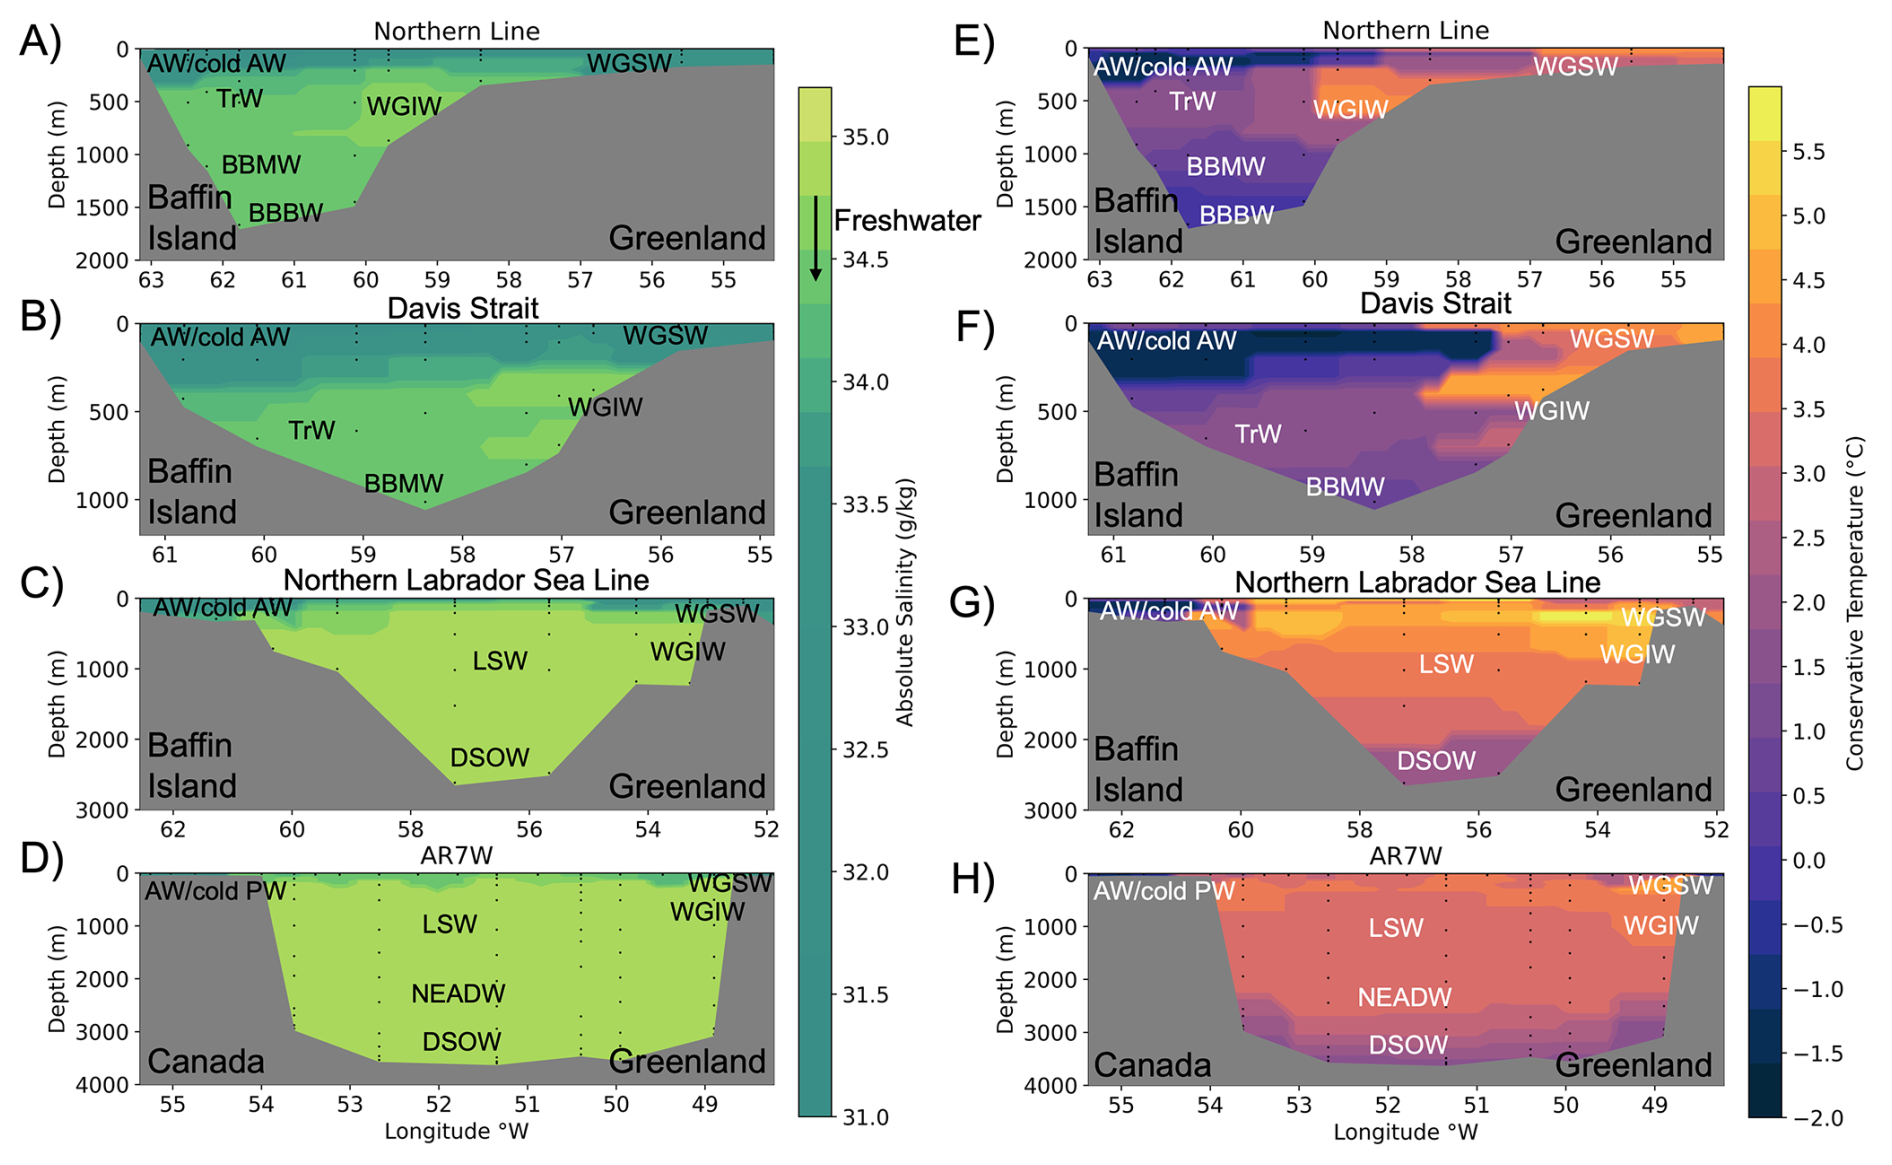
Figure B3Section plots of absolute salinity (A–D) and conservative temperature (E–H), along the Northern Line (A, E), Davis Strait (B, F), Northern Labrador Sea Line (C, G), and AR7W Line (D, H).
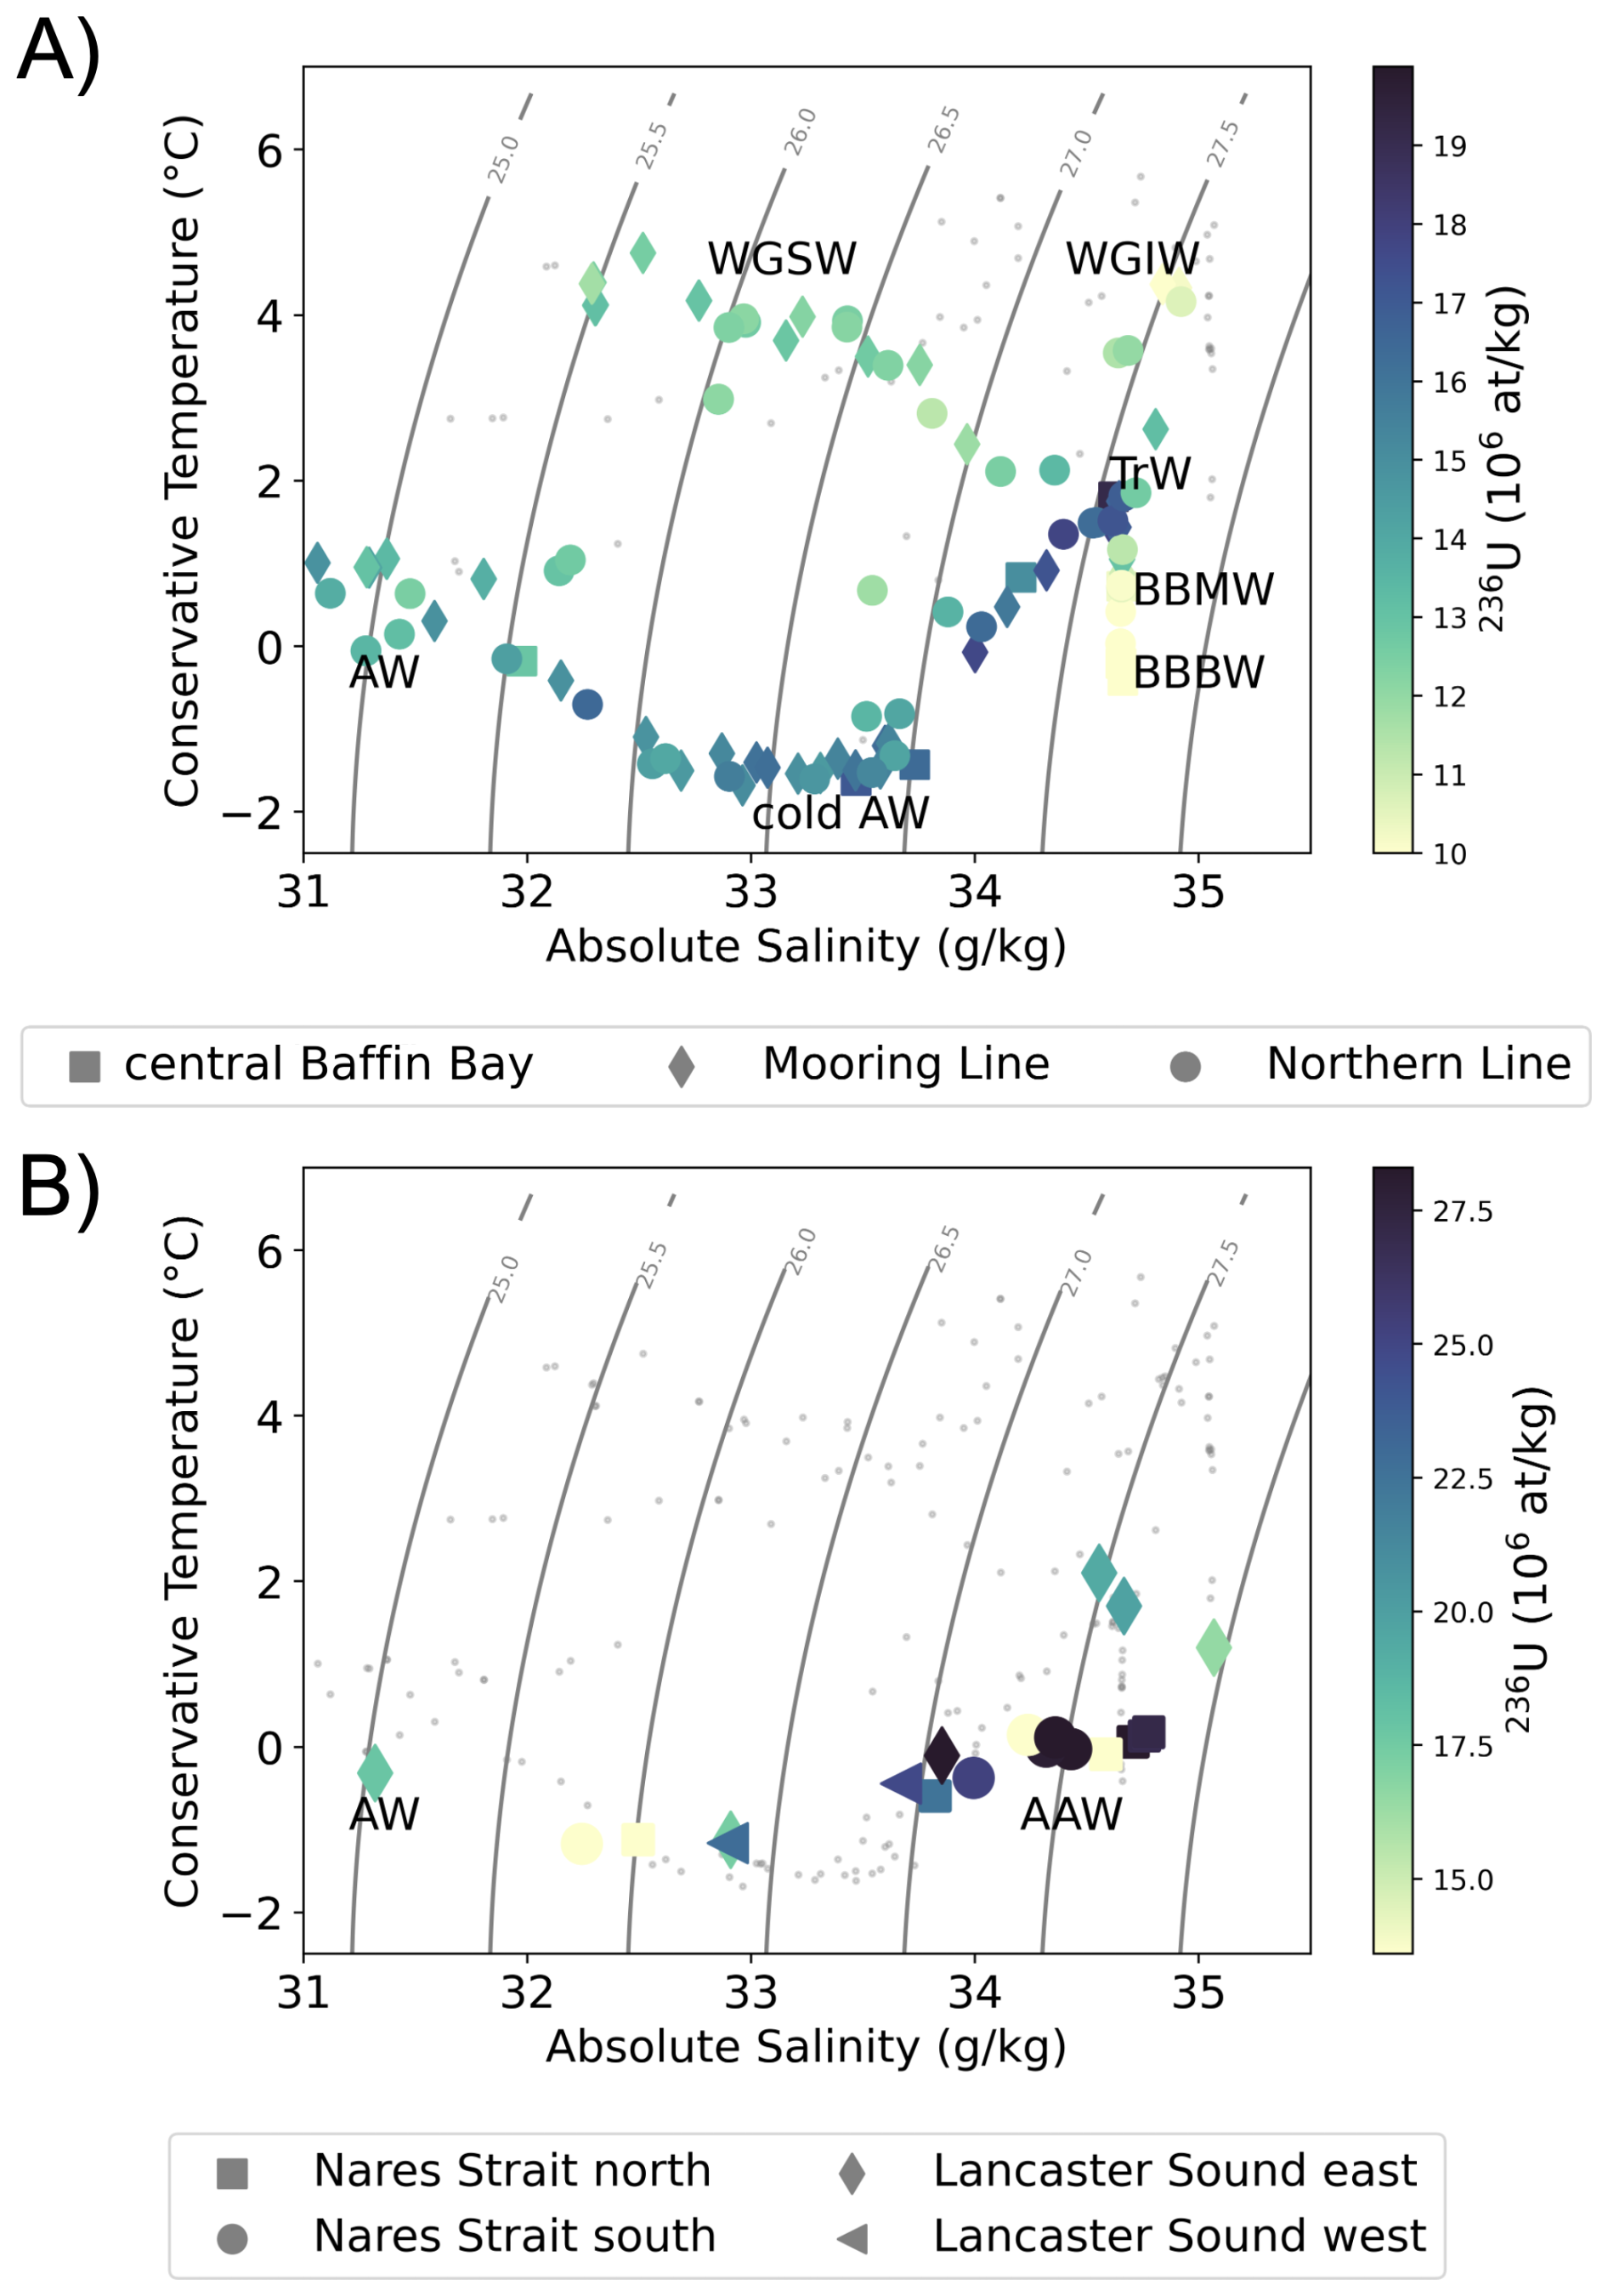
Figure B4T–S diagram with colored 236U concentrations (A) along Davis Strait and Northern Line, and in central Baffin Bay. (B) The single stations at Nares Strait and Lancaster Sound. The grey dots indicate the other samples of this study.
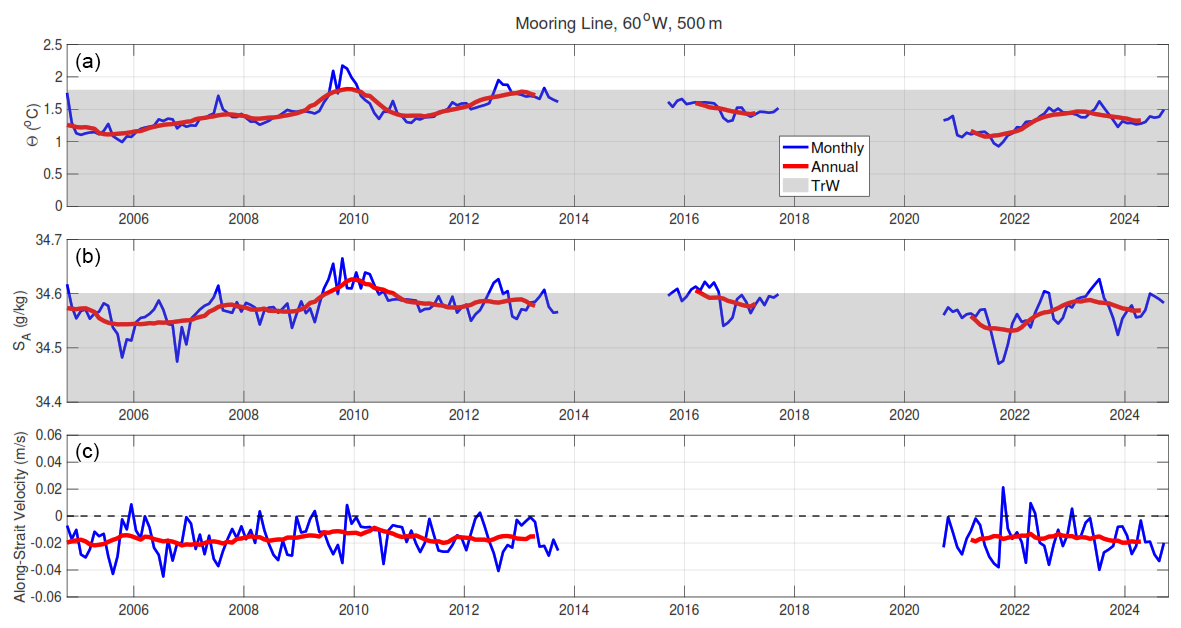
Figure B5Time series of (A) Conservative temperature (Θ), (B) absolute salinity (SA), and (C) along-strait velocity, at 60° W and 500 m depth at Davis Strait. The blue line shows the 30 d running mean and the red line shows the 12-month running mean. The Θ-SA bounds of Transition Water are shown in grey.
The original datasets for this study can be found at the Zenodo database (https://doi.org/10.5281/zenodo.16914587, Leist and Casacuberta, 2025). The CTD data of Lancaster Sound and Nares Strait are provided by Amundsen Science Data Collection (https://doi.org/10.5884/12713, Amundsen Science Data Collection, 2024).
LGTL, MC and NC contributed to the conception and design of the study. LGTL performed the data investigation, formal analysis, and wrote the original draft of the manuscript. The investigation and formal analysis were supported by NC and MC. JL contributed substantially to the interpretation of the results. HT, CV and NC performed AMS measurements. NC and MC supervised the study. NC and LGTL acquired funding. KAS, CL and MR supported sample collection during expeditions and provided hydrographic data. All authors contributed to the manuscript revision and approved the submitted version.
The contact author has declared that none of the authors has any competing interests.
Publisher's note: Copernicus Publications remains neutral with regard to jurisdictional claims made in the text, published maps, institutional affiliations, or any other geographical representation in this paper. The authors bear the ultimate responsibility for providing appropriate place names. Views expressed in the text are those of the authors and do not necessarily reflect the views of the publisher.
The authors acknowledge the chief scientists, the captains and the crew of the R/V Neil Armstrong and the R/V Atlantis. The scientists involved in the sampling are deeply acknowledged. The authors also thank Emmy Hieronimus, who collected the samples at Lancaster Sound aboard of CCGS Amundsen. Kayley Kündig and Simona Staub are thanked for their contributions to ETH-based laboratories. In addition, the authors acknowledge the entire ASOF community and their contribution through various discussions. Maps were created using cartopy and the GEBCO data product.
The PI Núria Casacuberta has received funding from the European Research Council (ERC) under the European Union's Horizon 2020 research and innovation programme (TITANICA project, ERC2020‐COG 101001451) and from the Swiss National Science Foundation (PR00P2‐193091‐TRACEATLANTIC). In addition, Lisa Leist received funding from the Swiss Polar Institute (Polar Access Fund, PAF-2022-03). Jed Lenetsky received funding from the U.S. National Science Foundation awards 1902628 and 1902595. KAS is funded through the OFSI fund, Davis Strait Observing System, by Fisheries and Oceans Canada. Maxi Castrillejo acknowledges funding from the Swiss National Science Foundation project CARVICE (2000021E_214835).
This paper was edited by Anne Marie Treguier and reviewed by two anonymous referees.
Aagaard, K. and Carmack, E. C.: The role of sea ice and other fresh water in the Arctic circulation, J. Geophys. Res.-Oceans, 94, 14485–14498, https://doi.org/10.1029/jc094ic10p14485, 1989. a
Amundsen Science Data Collection: 2024. CTD-Rosette data collected by the CCGS Amundsen in the Canadian Arctic, Processed data, Canadian Cryospheric Information Network (CCIN), Waterloo, Canada [data set], https://doi.org/10.5884/12713, 2024. a
Azetsu‐Scott, K., Clarke, A., Falkner, K., Hamilton, J., Jones, E. P., Lee, C., Petrie, B., Prinsenberg, S., Starr, M., and Yeats, P.: Calcium carbonate saturation states in the waters of the Canadian Arctic Archipelago and the Labrador Sea, J. Geophys. Res.-Oceans, 115, 2009JC005917, https://doi.org/10.1029/2009JC005917, 2010. a
Azetsu‐Scott, K., Petrie, B., Yeats, P., and Lee, C.: Composition and fluxes of freshwater through Davis Strait using multiple chemical tracers, J. Geophys. Res., 117, 2012JC008172, https://doi.org/10.1029/2012JC008172, 2012. a, b, c, d, e, f, g
Bailey, W. B.: On the Origin of Deep Baffin Bay Water, Journal of the Fisheries Research Board of Canada, 13, 303–308, https://doi.org/10.1139/f56-020, 1956. a, b
Bamber, J. L., Tedstone, A. J., King, M. D., Howat, I. M., Enderlin, E. M., Van Den Broeke, M. R., and Noel, B.: Land Ice Freshwater Budget of the Arctic and North Atlantic Oceans: 1. Data, Methods, and Results, J. Geophys. Res.-Oceans, 123, 1827–1837, https://doi.org/10.1002/2017JC013605, 2018. a, b
Bourke, R. H., Addison, V. G., and Paquette, R. G.: Oceanography of Nares Strait and northern Baffin Bay in 1986 with emphasis on deep and bottom water formation, J. Geophys. Res., 94, 8289–8302, https://doi.org/10.1029/JC094iC06p08289, 1989. a, b, c, d, e, f, g, h
Bower, A. S., Lozier, M. S., Gary, S. F., and Böning, C. W.: Interior pathways of the North Atlantic meridional overturning circulation, Nature, 459, 243–247, https://doi.org/10.1038/nature07979, 2009. a
Carmack, E. C., Yamamoto‐Kawai, M., Haine, T. W. N., Bacon, S., Bluhm, B. A., Lique, C., Melling, H., Polyakov, I. V., Straneo, F., Timmermans, M., and Williams, W. J.: Freshwater and its role in the Arctic Marine System: Sources, disposition, storage, export, and physical and biogeochemical consequences in the Arctic and global oceans, J. Geophys. Res.-Biogeosci., 121, 675–717, https://doi.org/10.1002/2015jg003140, 2016. a
Casacuberta, N. and Smith, J. N.: Nuclear Reprocessing Tracers Illuminate Flow Features and Connectivity Between the Arctic and Subpolar North Atlantic Oceans, Annu. Rev. Mar. Sci., 15, 203–221, https://doi.org/10.1146/annurev-marine-032122-112413, 2023. a, b
Casacuberta, N., Masqué, P., Henderson, G., Rutgers van-der Loeff, M., Bauch, D., Vockenhuber, C., Daraoui, A., Walther, C., Synal, H.-A., and Christl, M.: First 236U data from the Arctic Ocean and use of 236U/238U and 129I/236U as a new dual tracer, Earth Planet. Sc. Lett., 440, 127–134, https://doi.org/10.1016/j.epsl.2016.02.020, 2016. a
Castrillejo, M., Casacuberta, N., Christl, M., Vockenhuber, C., Synal, H.-A., García-Ibáñez, M. I., Lherminier, P., Sarthou, G., Garcia-Orellana, J., and Masqué, P.: Tracing water masses with 129I and 236U in the subpolar North Atlantic along the GEOTRACES GA01 section, Biogeosciences, 15, 5545–5564, https://doi.org/10.5194/bg-15-5545-2018, 2018. a, b, c, d, e, f, g, h, i
Chanut, J., Barnier, B., Large, W., Debreu, L., Penduff, T., Molines, J. M., and Mathiot, P.: Mesoscale Eddies in the Labrador Sea and Their Contribution to Convection and Restratification, J. Phys. Oceanogr., 38, 1617–1643, https://doi.org/10.1175/2008JPO3485.1, 2008. a, b
Christl, M., Vockenhuber, C., Kubik, P., Wacker, L., Lachner, J., Alfimov, V., and Synal, H.-A.: The ETH Zurich AMS facilities: Performance parameters and reference materials, Nucl. Instrum. Meth. B, 294, 29–38, https://doi.org/10.1016/j.nimb.2012.03.004, 2013. a
Christl, M., Casacuberta, N., Vockenhuber, C., Elsässer, C., Bailly du Bois, P., Herrmann, J., and Synal, H.: Reconstruction of the 236U input function for the Northeast Atlantic Ocean: Implications for 129I/236U and 236U/238U-based tracer ages, J. Geophys. Res.-Oceans, 120, 7282–7299, https://doi.org/10.1002/2015JC011116, 2015. a
Christl, M., Gautschi, P., Maxeiner, S., Müller, A. M., Vockenhuber, C., and Synal, H.-A.: 236U analyses with the ETH Zurich MILEA prototype system, Nucl. Instrum. Meth. B, 534, 61–71, https://doi.org/10.1016/j.nimb.2022.11.009, 2023. a, b
Clarke, R. A. and Gascard, J.-C.: The Formation of Labrador Sea Water. Part I: Large-Scale Processes, J. Phys. Oceanogr., 13, 1764–1778, https://doi.org/10.1175/1520-0485(1983)013<1764:TFOLSW>2.0.CO;2, 1983. a, b
Cuny, J., Rhines, P. B., Niiler, P. P., and Bacon, S.: Labrador Sea Boundary Currents and the Fate of the Irminger Sea Water, J. Phys. Oceanogr., 32, 627–647, https://doi.org/10.1175/1520-0485(2002)032<0627:LSBCAT>2.0.CO;2, 2002. a, b
Cuny, J., Rhines, P. B., and Ron Kwok: Davis Strait volume, freshwater and heat fluxes, Deep-Sea Res. Pt. I, 52, 519–542, https://doi.org/10.1016/j.dsr.2004.10.006, 2005. a, b, c
Curry, B., Lee, C. M., and Petrie, B.: Volume, Freshwater, and Heat Fluxes through Davis Strait, 2004–05*, J. Phys. Oceanogr., 41, 429–436, https://doi.org/10.1175/2010JPO4536.1, 2011. a, b, c
Curry, B., Lee, C. M., Petrie, B., Moritz, R. E., and Kwok, R.: Multiyear Volume, Liquid Freshwater, and Sea Ice Transports through Davis Strait, 2004–10, J. Phys. Oceanogr., 44, 1244–1266, https://doi.org/10.1175/JPO-D-13-0177.1, 2014. a, b, c, d, e, f, g, h, i, j, k, l, m, n, o, p, q, r, s, t, u
Dale, D., Christl, M., Vockenhuber, C., Macrander, A., Ólafsdóttir, S., Middag, R., and Casacuberta, N.: Tracing Ocean Circulation and Mixing From the Arctic to the Subpolar North Atlantic Using the 129I–236U Dual Tracer, J. Geophys. Res.-Oceans, 129, e2024JC021211, https://doi.org/10.1029/2024JC021211, 2024. a, b, c, d, e, f, g, h, i, j, k, l, m, n, o, p, q
Dickson, R. R. and Brown, J.: The production of North Atlantic Deep Water: Sources, rates, and pathways, J. Geophys. Res.-Oceans, 99, 12319–12341, https://doi.org/10.1029/94JC00530, 1994. a
Dunlap, E. and Tang, C. C.: Modelling the Mean Circulation of Baffin Bay, Atmos. Ocean, 44, 99–109, https://doi.org/10.3137/ao.440107, 2006. a
Duyck, E., Foukal, N. P., and Frajka-Williams, E.: Circulation of Baffin Bay and Hudson Bay waters on the Labrador shelf and into the subpolar North Atlantic, Ocean Sci., 21, 241–260, https://doi.org/10.5194/os-21-241-2025, 2025. a, b
García-Ibáñez, M. I., Pardo, P. C., Carracedo, L. I., Mercier, H., Lherminier, P., Ríos, A. F., and Pérez, F. F.: Structure, transports and transformations of the water masses in the Atlantic Subpolar Gyre, Prog. Oceanogr., 135, 18–36, https://doi.org/10.1016/j.pocean.2015.03.009, 2015. a, b, c, d, e, f
García-Ibáñez, M. I., Pérez, F. F., Lherminier, P., Zunino, P., Mercier, H., and Tréguer, P.: Water mass distributions and transports for the 2014 GEOVIDE cruise in the North Atlantic, Biogeosciences, 15, 2075–2090, https://doi.org/10.5194/bg-15-2075-2018, 2018. a, b, c
Gardner, A. S., Moholdt, G., Wouters, B., Wolken, G. J., Burgess, D. O., Sharp, M. J., Cogley, J. G., Braun, C., and Labine, C.: Sharply increased mass loss from glaciers and ice caps in the Canadian Arctic Archipelago, Nature, 473, 357–360, https://doi.org/10.1038/nature10089, 2011. a
Gelderloos, R., Katsman, C. A., and Drijfhout, S. S.: Assessing the Roles of Three Eddy Types in Restratifying the Labrador Sea after Deep Convection, J. Phys. Oceanogr., 41, 2102–2119, https://doi.org/10.1175/JPO-D-11-054.1, 2011. a
Gou, R., Pennelly, C., and Myers, P. G.: The Changing Behavior of the West Greenland Current System in a Very High‐Resolution Model, J. Geophys. Res.-Oceans, 127, https://doi.org/10.1029/2022JC018404, 2022. a, b, c, d
Grenier, M., Brown, K., Colombo, M., Belhadj, M., Baconnais, I., Pham, V., Soon, M., Myers, P., Jeandel, C., and François, R.: Controlling factors and impacts of river-borne neodymium isotope signatures and rare earth element concentrations supplied to the Canadian Arctic Archipelago, Earth Planet. Sc. Lett., 578, 117341, https://doi.org/10.1016/j.epsl.2021.117341, 2022. a
Haine, T. W., Curry, B., Gerdes, R., Hansen, E., Karcher, M., Lee, C., Rudels, B., Spreen, G., De Steur, L., Stewart, K. D., and Woodgate, R.: Arctic freshwater export: Status, mechanisms, and prospects, Global Planet. Change, 125, 13–35, https://doi.org/10.1016/j.gloplacha.2014.11.013 2015. a, b, c
Holland, D. M., Thomas, R. H., De Young, B., Ribergaard, M. H., and Lyberth, B.: Acceleration of Jakobshavn Isbræ triggered by warm subsurface ocean waters, Nat. Geosci., 1, 659–664, https://doi.org/10.1038/ngeo316, 2008. a
Holliday, N. P., Bacon, S., Allen, J., and McDonagh, E. L.: Circulation and Transport in the Western Boundary Currents at Cape Farewell, Greenland, J. Phys. Oceanogr., 39, 1854–1870, https://doi.org/10.1175/2009JPO4160.1, 2009. a
Huang, J., Pickart, R. S., Bahr, F., McRaven, L. T., Tremblay, J.-R., Michel, C., Jeansson, E., Kopec, B., Welker, J. M., and Ólafsdóttir, S. R.: Water mass evolution and general circulation of Baffin Bay: Observations from two shipboard surveys in 2021, Prog. Oceanogr., 229, 103322, https://doi.org/10.1016/j.pocean.2024.103322, 2024. a, b, c, d, e, f, g, h, i, j, k, l, m, n, o, p, q, r, s, t, u, v, w, x, y, z, aa, ab
Hughes, K. G., Klymak, J. M., Hu, X., and Myers, P. G.: Water mass modification and mixing rates in a 1/12° simulation of the Canadian Arctic Archipelago: MIXING IN THE CANADIAN ARCHIPELAGO, J. Geophys. Res.-Oceans, 122, 803–820, https://doi.org/10.1002/2016JC012235, 2017. a
Hátún, H., Eriksen, C. C., and Rhines, P. B.: Buoyant Eddies Entering the Labrador Sea Observed with Gliders and Altimetry, J. Phys. Oceanogr., 37, 2838–2854, https://doi.org/10.1175/2007JPO3567.1, 2007. a, b
IOC SCOR and IAPSO: The international thermodynamic equation of seawater – 2010: Calculation and use of thermodynamic properties., Intergovernmental Oceanographic Commission, Manuals and Guides No. 56, UNESCO (English), 196 pp., https://www.teos-10.org/pubs/gsw/html/gsw_CT_from_t.html (last access: 26 May 2026), 2010. a
Jackson, J. M., Lique, C., Alkire, M., Steele, M., Lee, C. M., Smethie, W. M., and Schlosser, P.: On the waters upstream of Nares Strait, Arctic Ocean, from 1991 to 2012, Cont. Shelf Res., 73, 83–96, https://doi.org/10.1016/j.csr.2013.11.025, 2014. a, b, c
Jones, E. P., Swift, J. H., Anderson, L. G., Lipizer, M., Civitarese, G., Falkner, K. K., Kattner, G., and McLaughlin, F.: Tracing Pacific water in the North Atlantic Ocean, J. Geophys. Res.-Oceans, 108, https://doi.org/10.1029/2001JC001141, 2003. a, b
Komuro, Y. and Hasumi, H.: Intensification of the Atlantic Deep Circulation by the Canadian Archipelago Throughflow, J. Phys. Oceanogr., 35, 775–789, https://doi.org/10.1175/JPO2709.1, 2005. a
Lavender, K. L., Brechner Owens, W., and Davis, R. E.: The mid-depth circulation of the subpolar North Atlantic Ocean as measured by subsurface floats, Deep-Sea Res. Pt. I, 52, 767–785, https://doi.org/10.1016/j.dsr.2004.12.007, 2005. a
Le Bras, I. A.-A.: Labrador sea water spreading and the Atlantic meridional overturning circulation, Philos. T. Roy. Soc. A, 381, 20220189, https://doi.org/10.1098/rsta.2022.0189, 2023. a
Lehmann, N., Kienast, M., Granger, J., Bourbonnais, A., Altabet, M. A., and Tremblay, J.: Remote Western Arctic Nutrients Fuel Remineralization in Deep Baffin Bay, Global Biogeochem. Cy., 33, 649–667, https://doi.org/10.1029/2018GB006134, 2019. a
Lehmann, N., Kienast, M., Granger, J., and Tremblay, J.: Physical and Biogeochemical Influences on Nutrients Through the Canadian Arctic Archipelago: Insights From Nitrate Isotope Ratios, J. Geophys. Res.-Oceans, 127, e2021JC018179, https://doi.org/10.1029/2021JC018179, 2022. a, b, c, d, e, f, g, h, i, j, k, l, m, n, o, p, q
Leist, L. and Casacuberta, N.: 129I and 236U seawater data collected near Davis Strait and along the AR7W Line, in 2022, Zenodo [data set], https://doi.org/10.5281/zenodo.16914587, 2025. a, b, c
Leist, L. G. T., Castrillejo, M., Smith, J. N., Christl, M., Vockenhuber, C., Velo, A., Lherminier, P., and Casacuberta, N.: 129I and 236U distribution in the subpolar North Atlantic unravels water mass provenance in AR7W and A25 lines, Front. Marine Sci., 11, 1470675, https://doi.org/10.3389/fmars.2024.1470675, 2024. a, b, c, d, e, f, g, h, i, j, k, l, m, n, o
Li, J., Pickart, R. S., Lin, P., Bahr, F., Arrigo, K. R., Juranek, L., and Yang, X.: The Atlantic Water Boundary Current in the Chukchi Borderland and Southern Canada Basin, J. Geophys. Res.-Oceans, 125, e2020JC016197, https://doi.org/10.1029/2020JC016197, 2020. a
Lilly, J. M., Rhines, P. B., Schott, F., Lavender, K., Lazier, J., Send, U., and D'Asaro, E.: Observations of the Labrador Sea eddy field, Prog. Oceanogr., 59, 75–176, https://doi.org/10.1016/j.pocean.2003.08.013, 2003. a, b
Lin, P., Pickart, R. S., Torres, D. J., and Pacini, A.: Evolution of the Freshwater Coastal Current at the Southern Tip of Greenland, J. Phys. Oceanogr., 48, 2127–2140, https://doi.org/10.1175/JPO-D-18-0035.1, 2018. a
Lin, P., Pickart, R. S., Moore, G., Spall, M. A., and Hu, J.: Characteristics and dynamics of wind-driven upwelling in the Alaskan Beaufort Sea based on six years of mooring data, Deep-Sea Res. Pt. II, 162, 79–92, https://doi.org/10.1016/j.dsr2.2018.01.002, 2019. a
Lique, C., Treguier, A. M., Blanke, B., and Grima, N.: On the origins of water masses exported along both sides of Greenland: A Lagrangian model analysis, J. Geophys. Res.-Oceans, 115, https://doi.org/10.1029/2009JC005316, 2010. a
Lobb, J., Carmack, E. C., Ingram, R. G., and Weaver, A. J.: Structure and mixing across an Arctic/Atlantic front in northern Baffin Bay, Geophys. Res. Lett., 30, 2003GL017755, https://doi.org/10.1029/2003GL017755, 2003. a, b, c
Lozier, M. S.: Overturning in the subpolar North Atlantic: a review, Philos. T. Roy. Soc. A, 381, 20220191, https://doi.org/10.1098/rsta.2022.0191, 2023. a
Malles, J.-H., Marzeion, B., and Myers, P. G.: Freshwater input from glacier melt outside Greenland alters modeled northern high-latitude ocean circulation, Earth Syst. Dynam., 16, 347–377, https://doi.org/10.5194/esd-16-347-2025, 2025. a, b, c
Marson, J. M., Myers, P. G., Hu, X., Petrie, B., Azetsu‐Scott, K., and Lee, C. M.: Cascading off the West Greenland Shelf: A numerical perspective, J. Geophys. Res.-Oceans, 122, 5316–5328, https://doi.org/10.1002/2017JC012801, 2017. a, b, c, d
McGeehan, T. and Maslowski, W.: Evaluation and control mechanisms of volume and freshwater export through the Canadian Arctic Archipelago in a high‐resolution pan‐Arctic ice‐ocean model, J. Geophys. Res.-Oceans, 117, 2011JC007261, https://doi.org/10.1029/2011JC007261, 2012. a
Melling, H., Lake, R., Topham, D., and Fissel, D.: Oceanic thermal structure in the western Canadian Arctic, Cont. Shelf Res., 3, 233–258, https://doi.org/10.1016/0278-4343(84)90010-4, 1984. a, b
Melling, H., Gratton, Y., and Ingram, G.: Ocean circulation within the North Water polynya of Baffin Bay, Atmos.-Ocean, 39, 301–325, https://doi.org/10.1080/07055900.2001.9649683, 2001. a
Melling, H., Agnew, T. A., Falkner, K. K., Greenberg, D. A., Lee, C. M., Münchow, A., Petrie, B., Prinsenberg, S. J., Samelson, R. M., and Woodgate, R. A.: Fresh-Water Fluxes via Pacific and Arctic Outflows Across the Canadian Polar Shelf, edited by: Dickson, R. R., Meincke, J., and Rhines, P., Arctic–Subarctic Ocean Fluxes, Springer, Dordrecht, https://doi.org/10.1007/978-1-4020-6774-7_10, 2008. a, b
Myers, P. G.: Impact of freshwater from the Canadian Arctic Archipelago on Labrador Sea Water formation, Geophys. Res. Lett., 32, L06605, https://doi.org/10.1029/2004GL022082, 2005. a, b, c, d, e
Myers, P. G., Donnelly, C., and Ribergaard, M. H.: Structure and variability of the West Greenland Current in Summer derived from 6 repeat standard sections, Prog. Oceanogr., 80, 93–112, https://doi.org/10.1016/j.pocean.2008.12.003, 2009. a
Münchow, A. and Melling, H.: Ocean current observations from Nares Strait to the west of Greenland: Interannual to tidal variability and forcing, J. Mar. Res., 66, https://elischolar.library.yale.edu/journal_of_marine_research/216 (last access: 26 May 2026), 2008. a
Münchow, A., Melling, H., and Falkner, K. K.: An Observational Estimate of Volume and Freshwater Flux Leaving the Arctic Ocean through Nares Strait, J. Phys. Oceanogr., 36, 2025–2041, https://doi.org/10.1175/JPO2962.1, 2006. a, b
Münchow, A., Falkner, K. K., and Melling, H.: Spatial continuity of measured seawater and tracer fluxes through Nares Strait, a dynamically wide channel bordering the Canadian Archipelago, J. Mar. Res., 65, 759–788, 2007. a, b
Münchow, A., Falkner, K. K., and Melling, H.: Baffin Island and West Greenland Current Systems in northern Baffin Bay, Prog. Oceanogr., 132, 305–317, https://doi.org/10.1016/j.pocean.2014.04.001, 2015. a, b
Pacini, A. and Pickart, R. S.: Meanders of the West Greenland Current near Cape Farewell, Deep-Sea Res. Pt. I, 179, 103664, https://doi.org/10.1016/j.dsr.2021.103664, 2022. a
Payne, A.: Anthropogenic Radionuclides as Tracers of Transport, Mixing, Carbon Storage and Freshwater sources in the Canadian Arctic Ocean, PhD thesis, ETH Zurich, https://doi.org/10.3929/ethz-c-000798056, 2026. a
Payne, A., Wefing, A., Christl, M., Vockenhuber, C., Williams, W., Smith, J. N., and Casacuberta, N.: Circulation Timescales and Pathways of Atlantic Water in the Canada Basin: Insights From Transient Tracers 129I and 236U, J. Geophys. Res.-Oceans, 129, e2023JC020813, https://doi.org/10.1029/2023JC020813, 2024. a, b, c, d, e, f, g, h, i, j, k, l, m, n, o, p
Pelle, T., Myers, P. G., Hamilton, A., Mazloff, M., Soderlund, K. M., Beem, L., Blankenship, D. D., Grima, C., Habbal, F., Skidmore, M., and Greenbaum, J. S.: Ocean circulation, sea ice, and productivity simulated in Jones Sound, Canadian Arctic Archipelago, between 2003–2016, Ocean Sci., 22, 187–208, https://doi.org/10.5194/os-22-187-2026, 2026. a, b
Peterson, I., Hamilton, J., Prinsenberg, S., and Pettipas, R.: Wind-forcing of volume transport through Lancaster Sound, J. Geophys. Res.-Oceans, 117, https://doi.org/10.1029/2012JC008140, 2012. a, b, c, d, e, f
Pickart, R. S. and Spall, M. A.: Impact of Labrador Sea Convection on the North Atlantic Meridional Overturning Circulation, J. Phys. Oceanogr., 37, 2207–2227, https://doi.org/10.1175/JPO3178.1, 2007. a, b
Pickart, R. S., Moore, G. W. K., Torres, D. J., Fratantoni, P. S., Goldsmith, R. A., and Yang, J.: Upwelling on the continental slope of the Alaskan Beaufort Sea: Storms, ice, and oceanographic response, J. Geophys. Res.-Oceans, 114, https://doi.org/10.1029/2008jc005009, 2009. a, b
Pickart, R. S., Spall, M. A., and Mathis, J. T.: Dynamics of upwelling in the Alaskan Beaufort Sea and associated shelf–basin fluxes, Deep-Sea Res. Pt. I, 76, 35–51, https://doi.org/10.1016/j.dsr.2013.01.007, 2013. a
Planat, N., Tremblay, L. B., Dufour, C. O., and Straub, D.: Seasonal and Decadal Geostrophic Pathways of Pacific and Atlantic Waters in the Arctic Amerasian Basin From Observations, J. Geophys. Res.-Oceans, 130, e2024JC021560, https://doi.org/10.1029/2024JC021560, 2025. a
Polyakov, I. V., Pnyushkov, A. V., Alkire, M. B., Ashik, I. M., Baumann, T. M., Carmack, E. C., Goszczko, I., Guthrie, J., Ivanov, V. V., Kanzow, T., Krishfield, R., Kwok, R., Sundfjord, A., Morison, J., Rember, R., and Yulin, A.: Greater role for Atlantic inflows on sea-ice loss in the Eurasian Basin of the Arctic Ocean, Science, 356, 285–291, https://doi.org/10.1126/science.aai8204, 2017. a
Polyakov, I. V., Pnyushkov, A. V., Charette, M., Cho, K.-H., Jung, J., Kipp, L., Muilwijk, M., Whitmore, L., Yang, E. J., and Yoo, J.: Atlantification advances into the Amerasian Basin of the Arctic Ocean, Sci. Adv., 11, eadq7580, https://doi.org/10.1126/sciadv.adq7580, 2025. a
Prinsenberg, S. and Hamilton, J.: Monitoring the volume, freshwater and heat fluxes passing through Lancaster sound in the Canadian arctic archipelago, Atmos. Ocean, 43, 1–22, https://doi.org/10.3137/ao.430101, 2005. a, b, c
Rabe, B., Münchow, A., Johnson, H. L., and Melling, H.: Nares Strait hydrography and salinity field from a 3‐year moored array, J. Geophys. Res.-Oceans, 115, 2009JC005966, https://doi.org/10.1029/2009JC005966, 2010. a, b
Rantanen, M., Karpechko, A. Y., Lipponen, A., Nordling, K., Hyvärinen, O., Ruosteenoja, K., Vihma, T., and Laaksonen, A.: The Arctic has warmed nearly four times faster than the globe since 1979, Commun. Earth Environ., 3, 168, https://doi.org/10.1038/s43247-022-00498-3, 2022. a
Rhein, M., Steinfeldt, R., Kieke, D., Stendardo, I., and Yashayaev, I.: Ventilation variability of Labrador Sea Water and its impact on oxygen and anthropogenic carbon: a review, Philos. T. Roy. Soc. A, 375, 20160321, https://doi.org/10.1098/rsta.2016.0321, 2017. a
Rudels, B.: The outflow of polar water through the Arctic Archipelago and the oceanographic conditions in Baffin Bay, Polar Res., 4, 161–180, https://doi.org/10.1111/j.1751-8369.1986.tb00528.x, 1986. a, b
Rudels, B.: Volume and freshwater transports through the Canadian Arctic Archipelago–Baffin Bay system, J. Geophys. Res., 116, C00D10, https://doi.org/10.1029/2011JC007019, 2011. a, b, c, d, e
Rudels, B., Jones, E. P., Anderson, L. G., and Kattner, G.: On the Intermediate Depth Waters of the Arctic Ocean, in: Geophysical Monograph Series, edited by: Johannessen, O. M., Muench, R. D., and Overland, J. E., 33–46, American Geophysical Union, ISBN 978-1-118-66388-2, https://doi.org/10.1029/GM085p0033, 1994. a
Rudels, B., Jones, E. P., Schauer, U., and Eriksson, P.: Atlantic sources of the Arctic Ocean surface and halocline waters, Polar Res., 23, 181–208, https://doi.org/10.3402/polar.v23i2.6278, 2004. a, b, c, d, e, f, g
Rysgaard, S., Boone, W., Carlson, D., Sejr, M. K., Bendtsen, J., Juul‐Pedersen, T., Lund, H., Meire, L., and Mortensen, J.: An Updated View on Water Masses on the pan‐West Greenland Continental Shelf and Their Link to Proglacial Fjords, J. Geophys. Res.-Oceans, 125, https://doi.org/10.1029/2019JC015564, 2020. a
Schmidt, S. and Send, U.: Origin and Composition of Seasonal Labrador Sea Freshwater, J. Phys. Oceanogr., 37, 1445–1454, https://doi.org/10.1175/JPO3065.1, 2007. a
Shadwick, E., Thomas, H., Gratton, Y., Leong, D., Moore, S., Papakyriakou, T., and Prowe, A.: Export of Pacific carbon through the Arctic Archipelago to the North Atlantic, Cont. Shelf Res., 31, 806–816, https://doi.org/10.1016/j.csr.2011.01.014, 2011. a, b, c
Shan, X., Spall, M. A., Pennelly, C., and Myers, P. G.: Seasonal Variability in Baffin Bay, J. Geophys. Res.-Oceans, 129, e2024JC021038, https://doi.org/10.1029/2024JC021038, 2024. a, b, c, d, e, f, g
Sherwood, O. A., Davin, S. H., Lehmann, N., Buchwald, C., Edinger, E. N., Lehmann, M. F., and Kienast, M.: Stable isotope ratios in seawater nitrate reflect the influence of Pacific water along the northwest Atlantic margin, Biogeosciences, 18, 4491–4510, https://doi.org/10.5194/bg-18-4491-2021, 2021. a, b
Shroyer, E. L., Samelson, R. M., Padman, L., and Münchow, A.: Modeled ocean circulation in Nares Strait and its dependence on landfast-ice cover, J. Geophys. Res.-Oceans, 120, 7934–7959, https://doi.org/10.1002/2015JC011091, 2015. a
Straneo, F. and Saucier, F.: The outflow from Hudson Strait and its contribution to the Labrador Current, Deep-Sea Res. Pt. I, 55, 926–946, https://doi.org/10.1016/j.dsr.2008.03.012, 2008. a, b
Sutherland, D. A., Pickart, R. S., Peter Jones, E., Azetsu-Scott, K., Jane Eert, A., and Ólafsson, J.: Freshwater composition of the waters off southeast Greenland and their link to the Arctic Ocean, J. Geophys. Res., 114, C05020, https://doi.org/10.1029/2008JC004808, 2009. a
Tang, C. C., Ross, C. K., Yao, T., Petrie, B., DeTracey, B. M., and Dunlap, E.: The circulation, water masses and sea-ice of Baffin Bay, Prog. Oceanogr., 63, 183–228, https://doi.org/10.1016/j.pocean.2004.09.005, 2004. a, b, c
Tanhua, T.: Spreading of overflow water from the Greenland to the Labrador Sea, Geophys. Res. Lett., 32, L10605, https://doi.org/10.1029/2005GL022700, 2005. a
The IMBIE Team: Mass balance of the Greenland Ice Sheet from 1992 to 2018, Nature, 579, 233–239, https://doi.org/10.1038/s41586-019-1855-2, 2020. a
Top, Z., Clarke, W. B., Eismont, W. C., and Jones, E. P.: Radiogenic helium in Baffin Bay bottom water, J. Mar. Res., 38, 435–452, https://elischolar.library.yale.edu/journal_of_marine_research/1514 (last access: 26 May 2026), 1980. a
Vandecrux, B., Fausto, R. S., Box, J. E., Covi, F., Hock, R., Rennermalm, Å. K., Heilig, A., Abermann, J., van As, D., Bjerre, E., Fettweis, X., Smeets, P. C. J. P., Kuipers Munneke, P., van den Broeke, M. R., Brils, M., Langen, P. L., Mottram, R., and Ahlstrøm, A. P.: Recent warming trends of the Greenland ice sheet documented by historical firn and ice temperature observations and machine learning, The Cryosphere, 18, 609–631, https://doi.org/10.5194/tc-18-609-2024, 2024. a
Vincent, R. F.: A Study of the North Water Polynya Ice Arch using Four Decades of Satellite Data, Sci. Rep., 9, 20278, https://doi.org/10.1038/s41598-019-56780-6, 2019. a
Vockenhuber, C., Casacuberta, N., Christl, M., and Synal, H.-A.: Accelerator Mass Spectrometry of 129I towards its lower limits, Nucl. Instrum. Meth. B, 361, 445–449, https://doi.org/10.1016/j.nimb.2015.01.061, 2015. a
Wang, H., Legg, S., and Hallberg, R.: The Effect of Arctic Freshwater Pathways on North Atlantic Convection and the Atlantic Meridional Overturning Circulation, J. Climate, 31, 5165–5188, https://doi.org/10.1175/JCLI-D-17-0629.1, 2018. a
Wang, Q., Myers, P. G., Hu, X., and Bush, A. B.: Flow Constraints on Pathways through the Canadian Arctic Archipelago, Atmos. Ocean, 50, 373–385, https://doi.org/10.1080/07055900.2012.704348, 2012. a, b
Wang, Q., Shu, Q., Wang, S., Beszczynska-Moeller, A., Danilov, S., Steur, L., Haine, T. W. N., Karcher, M., Lee, C. M., Myers, P. G., Polyakov, I. V., Provost, C., Skagseth, t., Spreen, G., and Woodgate, R.: A Review of Arctic–Subarctic Ocean Linkages: Past Changes, Mechanisms, and Future Projections, Ocean-Land-Atmos. Res., 2, 0013, https://doi.org/10.34133/olar.0013, 2023. a
Wang, Q., Shu, Q., and Wang, F.: Recent emergence of Arctic atlantification dominated by climate warming, Sci. Adv., 10, eadq5235, https://doi.org/10.1126/sciadv.adq5235, 2024. a
Wefing, A., Christl, M., Vockenhuber, C., Rutgers van der Loeff, M., and Casacuberta, N.: Tracing Atlantic Waters Using 129I and 236U in the Fram Strait in 2016, J. Geophys. Res.-Oceans, 124, 882–896, https://doi.org/10.1029/2018JC014399, 2019. a, b, c
Wefing, A.-M., Casacuberta, N., Christl, M., Gruber, N., and Smith, J. N.: Circulation timescales of Atlantic Water in the Arctic Ocean determined from anthropogenic radionuclides, Ocean Sci., 17, 111–129, https://doi.org/10.5194/os-17-111-2021, 2021. a, b, c, d, e
Wefing, A.-M., Payne, A., Scheiwiller, M., Vockenhuber, C., Christl, M., Tanhua, T., and Casacuberta, N.: Changes in water mass composition and circulation in the central Arctic Ocean between 2011 and 2021 inferred from tracer observations, Ocean Sci., 21, 3311–3340, https://doi.org/10.5194/os-21-3311-2025, 2025. a, b, c, d, e, f, g, h
Weijer, W., Haine, T. W. N., Siddiqui, A. H., Cheng, W., Veneziani, M., and Kurtakoti, P.: INTERACTIONS BETWEEN THE ARCTIC MEDITERRANEAN AND THE ATLANTIC MERIDIONAL OVERTURNING CIRCULATION: A REVIEW, Oceanography, 35, 118–127, https://www.jstor.org/stable/27182704 (last access: 26 May 2026), 2022. a
Yamamoto‐Kawai, M., McLaughlin, F. A., Carmack, E. C., Nishino, S., and Shimada, K.: Freshwater budget of the Canada Basin, Arctic Ocean, from salinity, δ18O, and nutrients, J. Geophys. Res.-Oceans, 113, 2006JC003858, https://doi.org/10.1029/2006JC003858, 2008. a
Yang, J.: The Seasonal Variability of the Arctic Ocean Ekman Transport and Its Role in the Mixed Layer Heat and Salt Fluxes, J. Climate, 19, 5366–5387, https://doi.org/10.1175/jcli3892.1, 2006. a
Yao, T. and Tang, C. L.: The formation and maintenance of the North Water Polynya, Atmos. Ocean, 41, 187–201, https://doi.org/10.3137/ao.410301, 2003. a, b
Yashayaev, I.: Changing freshwater content: Insights from the subpolar North Atlantic and new oceanographic challenges, Prog. Oceanogr., 73, 203–209, https://doi.org/10.1016/j.pocean.2007.04.014, 2007. a, b, c, d, e, f, g, h, i
Yashayaev, I.: Intensification and shutdown of deep convection in the Labrador Sea were caused by changes in atmospheric and freshwater dynamics, Commun. Earth Environ., 5, 156, https://doi.org/10.1038/s43247-024-01296-9, 2024. a
Zhang, J., Weijer, W., Steele, M., Cheng, W., Verma, T., and Veneziani, M.: Labrador Sea freshening linked to Beaufort Gyre freshwater release, Nat. Commun., 12, 1229, https://doi.org/10.1038/s41467-021-21470-3, 2021a. a, b, c, d
Zhang, Y., Chen, C., Beardsley, R. C., Gao, G., Lai, Z., Curry, B., Lee, C. M., Lin, H., Qi, J., and Xu, Q.: Studies of the Canadian Arctic Archipelago water transport and its relationship to basin‐local forcings: Results from AO‐FVCOM, J. Geophys. Res.-Oceans, 121, 4392–4415, https://doi.org/10.1002/2016JC011634, 2016. a
Zhang, Y., Chen, C.-S., Shen, X.-Y., Xu, D.-Y., Shao, W.-Z., Beardsley, R. C., Chang, L., and Feng, G.-P.: Role of sea level pressure in variations of the Canadian Arctic Archipelago throughflow, Advances in Climate Change Research, 12, 539–552, https://doi.org/10.1016/j.accre.2021.07.009, 2021b. a
Zou, S., Lozier, M. S., Li, F., Abernathey, R., and Jackson, L.: Density-compensated overturning in the Labrador Sea, Nat. Geosci., 13, 121–126, https://doi.org/10.1038/s41561-019-0517-1, 2020. a
Zou, S., Bower, A. S., Lozier, M. S., and Furey, H. H.: Deep ocean circulation in the subpolar North Atlantic observed by acoustically-tracked floats, Prog. Oceanogr., 211, 102975, https://doi.org/10.1016/j.pocean.2023.102975, 2023. a
Zou, S., Petit, T., Li, F., and Lozier, M. S.: Observation-Based Estimates of Water Mass Transformation and Formation in the Labrador Sea, J. Phys. Oceanogr., 54, 1411–1429, https://doi.org/10.1175/JPO-D-23-0235.1, 2024. a
Zweng, M. M. and Münchow, A.: Warming and freshening of Baffin Bay, 1916–2003, J. Geophys. Res.-Oceans, 111, 2005JC003093, https://doi.org/10.1029/2005JC003093, 2006. a