the Creative Commons Attribution 4.0 License.
the Creative Commons Attribution 4.0 License.
 | 03 Jun 2026
On the fate of the Irminger Current water and its impact on the convection region in the Irminger Sea – a Lagrangian model study
Nora Fried
Renske Gelderloos
Oliver J. Tooth
Caroline A. Katsman
M. Femke de Jong
The Irminger Sea is one of the few places in the North Atlantic where dense water masses are formed through deep convection. In addition to atmospheric forcing, wintertime convection in the Irminger Sea interior can be impacted by the extent of restratification in the preceding years. In the Irminger Sea, the cold central basin is contrasted to the Irminger Current (IC) which carries warm and saline waters of subtropical origin. In this study, we investigate the potential impact of the IC on restratification of the Irminger Sea's deep convection area (DCA), using one-year output of a high-resolution regional model combined with Lagrangian particle tracking. We release particles over the upper 1500 m of the IC in the eastern Irminger Sea and track them forward-in-time for six months. Of those particles, 39 % follow the boundary current circulation and 60 % enter the interior Irminger Sea. Around 1 % leaves the Irminger Sea through Denmark Strait and across the ridge to the Iceland Basin. From all particles released, about 26 % reach the DCA, steered by mesoscale variability. In this model simulation, the majority of those particles (95 %) enter the DCA in the upper 1500 m of the water column. On their way to the DCA, the IC waters cool and freshen but on average remain lighter than waters in the DCA and therefore have the potential to restratify the DCA. This westward spread of light IC waters constrains the extent of the DCA to the western Irminger Sea by enhancing the stratification in the eastern part of the basin.
- Article
(10120 KB) - Full-text XML
- BibTeX
- EndNote


The subpolar North Atlantic is one of the few regions in the world's oceans where dense water formation occurs through ocean deep convection. Recent observations from the Overturning in the Subpolar North Atlantic Program (OSNAP) have shown that during the observational time period from 2014–present deep convection in the Labrador Sea contributes much less to the strength of subpolar overturning than previously thought (Fu et al., 2023; Li et al., 2021; Lozier et al., 2019; Petit et al., 2020). Instead, OSNAP observations have revealed that water mass transformation in the Irminger Sea and Iceland Basin dominates the strength of the Atlantic Meridional Overturning Circulation (AMOC) at subpolar latitudes (Fu et al., 2023; Li et al., 2017; Lozier et al., 2019; Petit et al., 2020). Recent studies have also identified the Irminger Sea as a key source of subpolar overturning variability on interannual to decadal timescales (Chafik and Holliday, 2022; Megann et al., 2021; Sanchez-Franks et al., 2024; Tooth et al., 2023) with important implications for both natural and anthropogenic carbon uptake (Fröb et al., 2016, 2018; Perez et al., 2018). Given these findings, it is critical that we improve our understanding of the processes impacting the strength of deep convection in the Irminger Sea and its potential impact on the AMOC.
The hydrography in the Irminger Sea is characterized by cold and relatively fresh water in the center of the Irminger Sea, compared to the warm and saline Irminger Current (IC) in the eastern part of the basin along the Reykjanes Ridge (Fig. 1, Våge et al., 2011). Some IC waters branch off into the northern part of the basin and exit through Denmark Strait as the North Icelandic Irminger Current (e.g., Jónsson and Valdimarsson, 2012). Most of the IC waters follow a cyclonic path towards the east Greenland coast and then flow southward side-by-side to the East Greenland Current (EGC, Fig. 1, Pickart et al., 2005). Some waters flowing southward along the eastern side of Greenland recirculate back northward with a cyclonic circulation, also known as the Irminger Gyre (Lavender et al., 2000; Våge et al., 2011). Here, we focus on the IC on the western flank of the Reykjanes Ridge to investigate whether warm and saline IC waters enter the Irminger Sea interior, and if so, how they affect restratification in the interior basin.
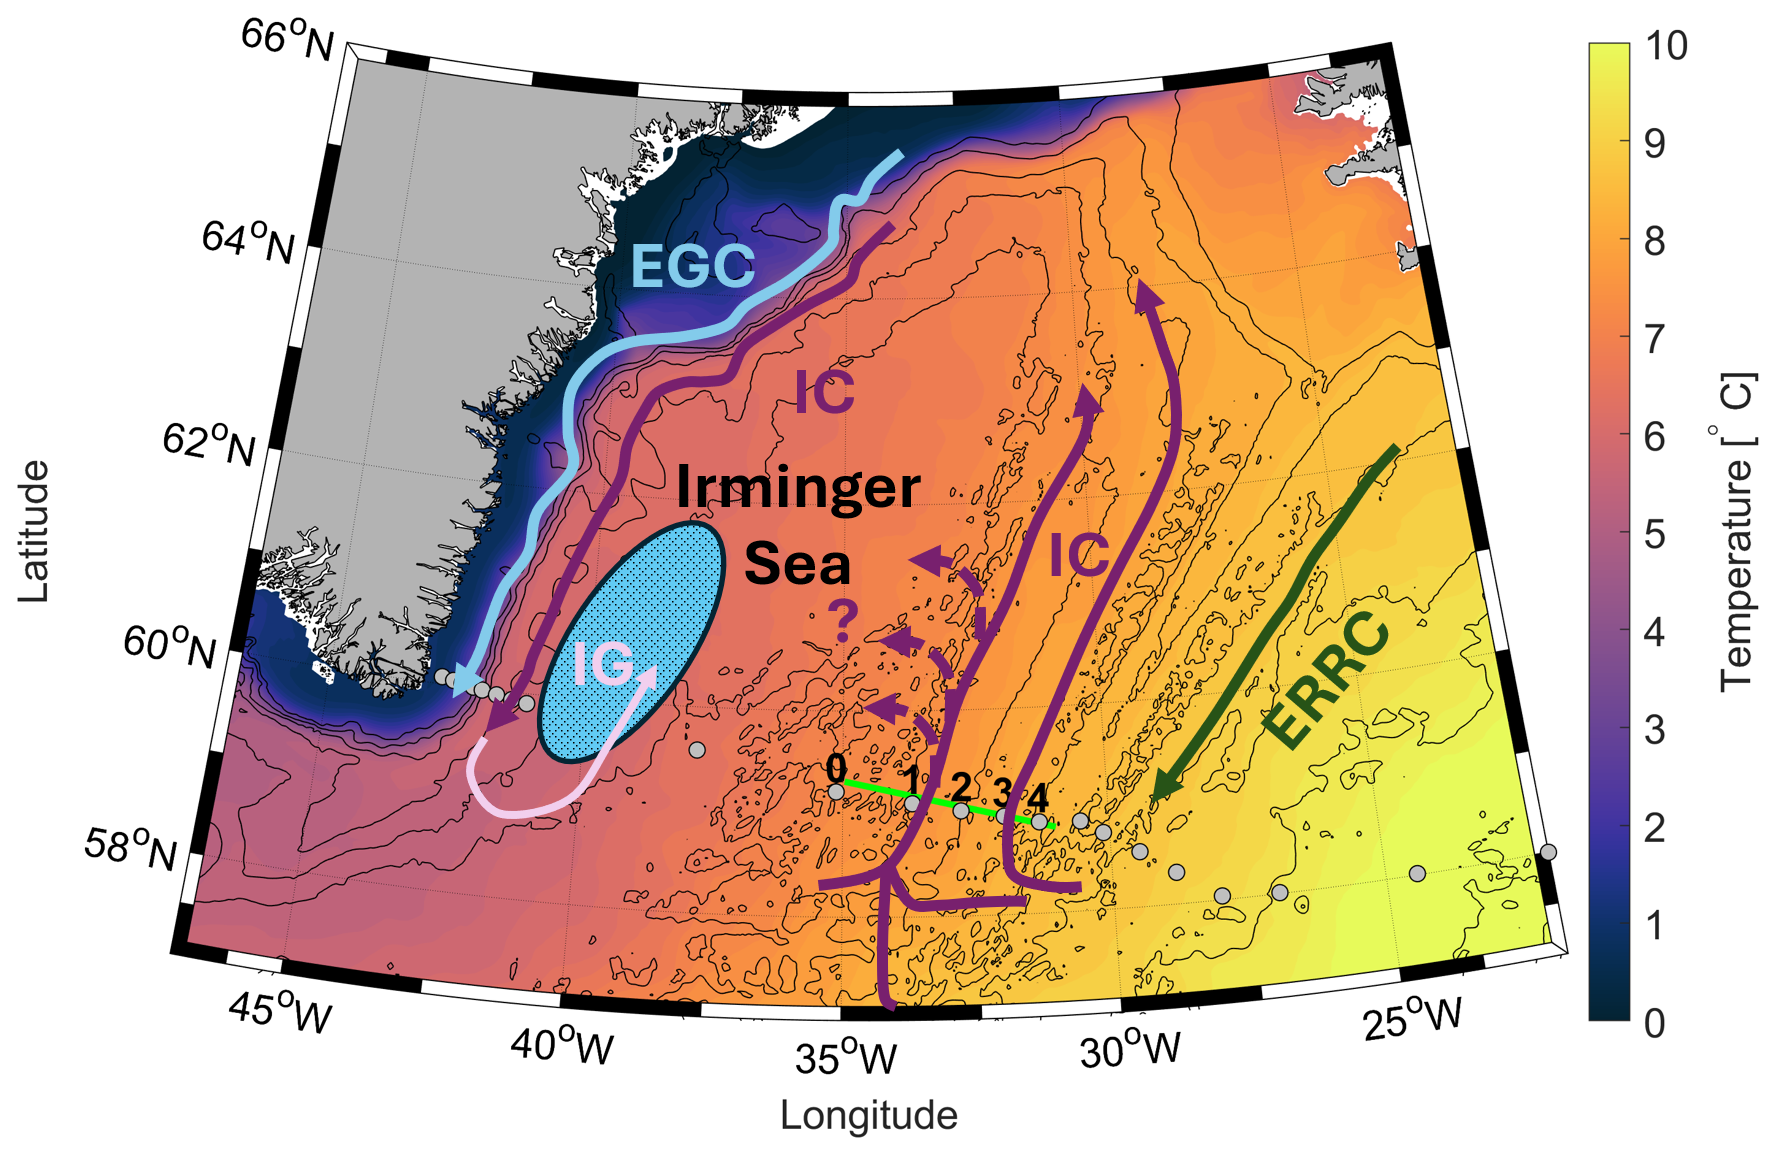
Figure 1Schematic overview of the circulation in the Irminger Sea. Yearly mean average sea surface temperature from the MITgcm model simulation used in this study (shading) and model bathymetry (contours) with a 500 m interval. Lime green line marks the particle release line. Depicted currents are the East Reykjanes Ridge Current (ERRC, dark green), the Irminger Current (IC, dark purple) and the East Greenland Current (EGC, blue). The Irminger Gyre (IG) is depicted in light purple. Grey circles mark the OSNAP East mooring locations; black numbers indicate the IC mooring array. The light blue hatched area schematically represents the deep convection area (DCA) in the Irminger Sea.
The IC has been observed with hydrographic moorings as part of OSNAP East since 2014 (Lozier et al., 2017, 2019). On average, the IC is a surface-intensified two-core current with a weak southward flow in between the two cores at intermediate depth (De Jong et al., 2020; Fried et al., 2024a; Fried and De Jong, 2022; Våge et al., 2011). The same studies show that its western core is relatively cold and fresh compared to the warm and saline eastern core. In Fried et al. (2024b), this difference in hydrographic properties was attributed to the source regions (Irminger Sea and Iceland Basin) of the waters they carry. The IC exhibits a strong interannual transport variability that is related to the basin-wide density gradient as shown by Fried and de Jong (2022) using reanalysis data. So, both the water mass composition and the variable strength of the IC might impact its effect on convection in the Irminger Sea. In this study, we will focus on the impact of the different water mass properties carried by the IC on the convection area rather than on the potential impact of the IC's interannual variability.
In general, convection can occur in basins with a cyclonic gyre circulation with doming isopycnals that brings weakly stratified waters to the surface. During deep convection, strong surface buoyancy loss creates a gradually deepening mixed layer. The main convection sites in the subpolar gyre are the Labrador Sea and the Irminger Sea connected by a region south of Cape Farewell (De Jong et al., 2012, 2018; Fröb et al., 2016; Pickart et al., 2003, 2008; Pickart and Spall, 2007; Piron et al., 2016, 2017; Rühs et al., 2021; Yashayaev, 2007; Zunino et al., 2020). Here, we focus on the convection region in the Irminger Sea. Convection in the Irminger Sea was first described by Nansen (1912). It occurs as open ocean convection in its interior (De Jong et al., 2012, 2018, 2025; De Jong and De Steur, 2016; Piron et al., 2016; Våge et al., 2011), and as slantwise convection at the boundary of the interior Irminger Sea east of Greenland (Le Bras et al., 2022).
In the Irminger Sea, convection can reach maximum depths of around 1500 m (De Jong and De Steur, 2016) but displays a strong year-to-year variability from 280–1500 m (De Jong et al., 2025). The most recent and well-described period of deep convection was the winter 2014–2015, when strong atmospheric forcing resulted in mixed layers down to 1400 m (De Jong et al., 2018; De Jong and De Steur, 2016; Piron et al., 2017). This intense deep convection persisted in consecutive winters until 2018 (Fox et al., 2022; Zunino et al., 2020). Since then, convection in the Irminger Sea has been weaker mainly due to reduced atmospheric forcing (De Jong et al., 2025).
The intensity of convection depends on the stratification of the water column at the end of the summer but to a larger extent on the surface buoyancy forcing in winter (De Jong et al., 2012, 2018, 2025; Gelderloos et al., 2012; Marshall and Schott, 1999; Pickart et al., 2003, 2008). Deep convection can be divided into three phases: the preconditioning, the actual deep convection and the restratification (De Jong et al., 2018; Gelderloos et al., 2011; Jones and Marshall, 1997; Marshall and Schott, 1999). The annual cycle of convection consists of deep convection in winter, that together with the circulation and Ekman pumping preconditions the water column for convection the following winter (Marshall and Schott, 1999). The restratification of the water column after convection happens in spring and summer and works against the preconditioning (De Jong and De Steur, 2016; Nelson et al., 2024; Sterl and De Jong, 2022). The convection area is restratified through surface buoyancy gain from solar radiation and precipitation (De Jong et al., 2018; De Jong and De Steur, 2016), and lateral advection of buoyant waters, mostly originating from the boundary currents (Gelderloos et al., 2011; Georgiou et al., 2019; Jones and Marshall, 1997; Sterl and De Jong, 2022). So, as part of the restratification process boundary-interior exchanges can influence the intensity of deep convection in the Irminger Sea.
This yearly cycle of stratification in the Irminger Sea also exhibits a strong interannual variability as shown by Sterl and de Jong (2022) using reanalysis data. While the upper 100 m experience a strong seasonal cycle, the layer between 100–600 m exhibits a strong interannual variability mainly related to variability in convection. They further state that the interannual variability in restratification has some correlation to the variability in eddy kinetic energy (EKE) in the area where warm and saline mesoscale eddies are shed off the IC. Like the Labrador Sea, where the lateral buoyancy flux carried by these mesoscale eddies contributes to restratification after winter convection (Böning et al., 2016; Gelderloos et al., 2011; Georgiou et al., 2019), the Irminger Sea might be restratified by eddies. In the Labrador Sea, this impact of eddies on restratification has been studied in more detail. There, the warming of the interior waters after convection is a combination of surface warming by the atmosphere after the winter and the lateral heat exchange through eddies (Lilly et al., 1999). Multiple studies find that these warm and saline eddies are an important contributor to the restratification of the interior Labrador Sea by compensating the annual mean heat loss (Cuny et al., 2002; De Jong et al., 2014; Gelderloos et al., 2011; Georgiou et al., 2019; Hátún et al., 2007; Katsman et al., 2004; Kawasaki and Hasumi, 2014; Lilly et al., 1999).
As multiple studies point at the potential of the boundary current to shed off eddies and with that influence restratification in the Irminger Sea's convection area (Fan et al., 2013; Sterl and De Jong, 2022), we here investigate how much of the buoyant IC water reaches the convection area in the Irminger Sea with the potential to impact restratification. We use forward-in-time trajectories of Lagrangian particles released in the upper 1500 m at the OSNAP IC moorings for a maximum tracking time period of six months in a high-resolution regional ocean model.
This paper is structured as follows: Section 2 describes the details of the high-resolution model simulation, the model's representation of the circulation and the hydrography at OSNAP East, and the chosen Lagrangian particle tracking procedure. Section 3 investigates the downstream pathways of the IC from the OSNAP IC moorings, considers the sensitivity of the particle selection process and explores whether entering the convection area depends on where along the release line particles were released. Based on an analysis of only the particles entering the interior Irminger Sea, Sect. 4 explores the IC's connection with the deep convection area and its potential impact on restratification. Finally, Sect. 5 summarizes the results and limitations of this study, discusses the role of mesoscale eddies in bringing waters towards the DCA and considers the relevance of the IC waters for the extent of the deep convection area in the Irminger Sea.
2.1 MITgcm model simulation
To explore the contribution of the IC to the stratification in the interior Irminger Sea, we use output from a high-resolution regional ocean simulation performed with the Massachusetts Institute of Technology General circulation Model (MITgcm; Marshall et al., 1997). This regional setup (described in full in Almansi et al., 2017) covers the eastern subpolar North Atlantic including the Irminger Sea, the Iceland Basin and most of the Nordic Seas (47° W–1° E and 57–76° N). The horizontal resolution varies from 2 km in the center of the model domain to 4 km at the edges. Thus, the central Irminger Sea and the IC area are represented at a resolution of around 2 km. In the Irminger Sea and the Iceland Basin, the resolution required to resolve the baroclinic Rossby deformation radius is typically –° (Hallberg, 2013, their Fig. 1). This corresponds to at least 3 km in the Irminger Sea. With a horizonal grid spacing of 2 km, this model configuration is eddy-resolving in the area of interest. In the vertical, this MITgcm simulation has 216 levels. The resolution increases linearly from 1 to 15 m in the first 120 m and is 15 m at deeper levels. At the surface, the model is forced with the Arctic System Reanalysis forcing (ASR-2; Bromwich et al., 2018), which has a 15 km horizontal resolution. As performing a simulation at such high resolution requires substantial computing capacity and data storage, its length was limited to a one-year period from 1 September 2007 until 31 August 2008. All model output was saved at 6-hourly intervals and is publicly available via SciServer (Medvedev et al., 2016; Taghizadeh-Popp et al., 2020). In this study, we use the data for velocity in three dimensions, temperature and salinity data. The model output was analysed using the OceanSpy v0.1 python package (Almansi and Gelderloos, 2019).
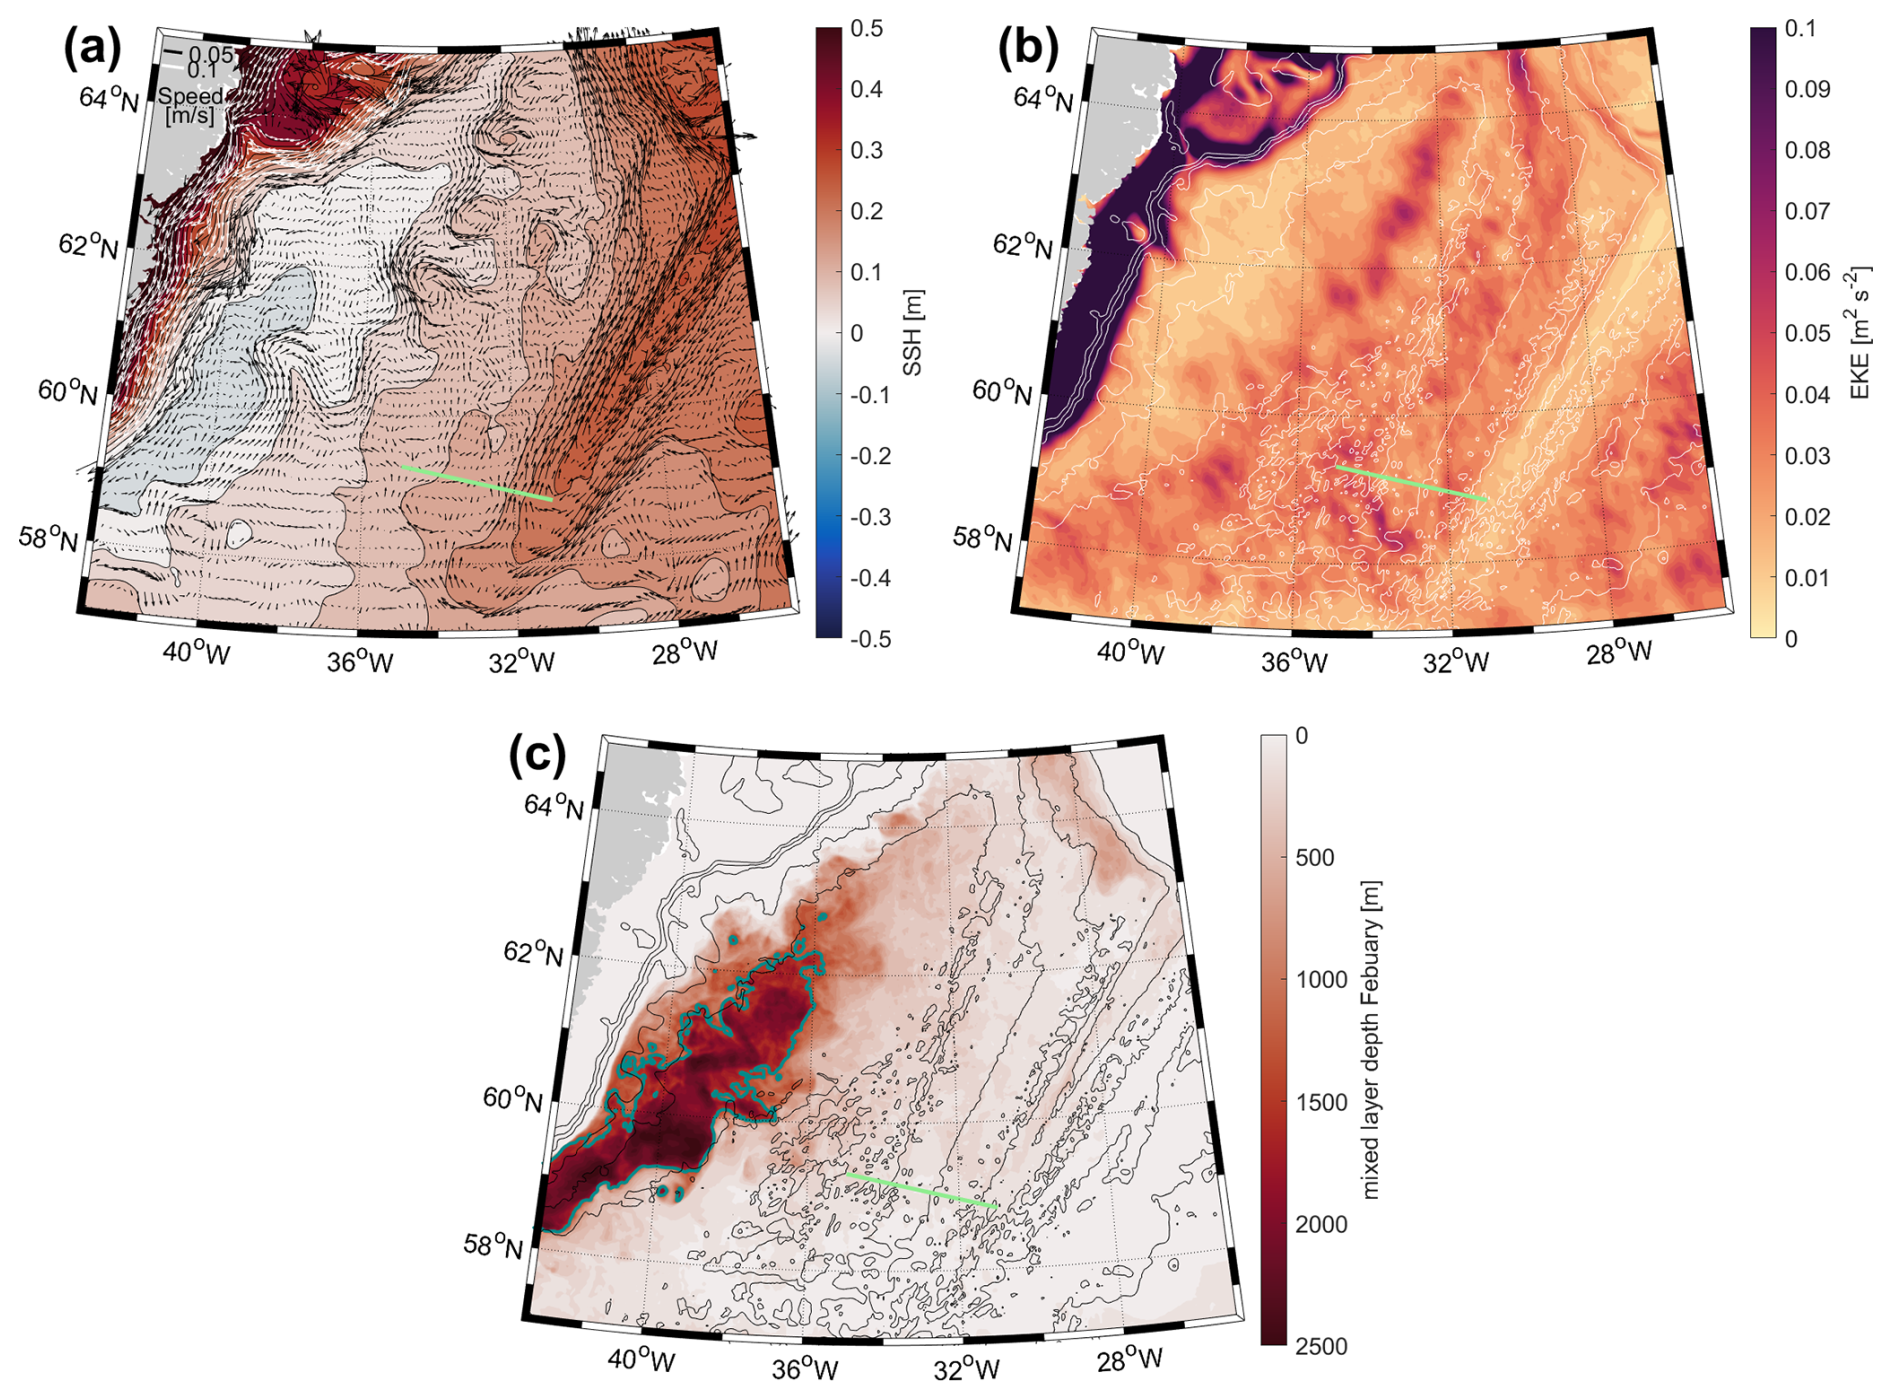
Figure 2Circulation, eddy kinetic energy and mixed layer depth in the Irminger Sea from the MITgcm model simulation. (a) One-year mean sea surface height (SSH, shading) with overlaid one year-averaged circulation over the upper 1500 m (arrows) from the model simulation. Velocities smaller than 0.1 m s−1 are indicated by black arrows, larger velocities by white arrows; we only plot every 8th latitude grid point and every 4th longitude grid point. (b) One-year mean eddy kinetic energy computed from the daily fields compared to the 10 d running mean (shading) with bottom topography (white contours). (c) February mixed layer depth (shading), model bathymetry (black contours) and the 1500 m-contour line of the mixed layer depth (thick turquoise line). In all subpanels the green line marks the particle release line along the OSNAP IC mooring array for reference.
2.2 Model validation in the Irminger Sea
For a basin-wide validation of this simulation, we evaluated the model's surface circulation, the eddy kinetic energy and the mixed layer depth in the Irminger Sea (Fig. 2). The model's mean circulation is averaged over the upper 1500 m and displayed together with the one-year averaged sea surface height (SSH, Fig. 2a). All surface currents, the EGC, the IC and the Irminger Gyre, are well represented in this model simulation as also shown by earlier studies (Almansi et al., 2017, 2020; Foukal et al., 2020; Gelderloos et al., 2017, 2021; Haine, 2010; Håvik et al., 2019; Koszalka et al., 2013; Magaldi et al., 2011; Saberi et al., 2020; Von Appen et al., 2014). Overall, the mean circulation follows the lines of constant SSH. The model simulation reproduces a two-core IC in the eastern Irminger Sea with a strong northward branch of the Irminger Gyre in the center (Fig. 2a). On the western side along the east Greenland shelf, the mean flow averaged over one year follows the bathymetry as the IC, with the EGC on the shelf (Fig. 2a). The mean circulation does not exhibit a direct pathway from the release location in the IC towards the DCA. Instead, the mean flow in between the DCA and the IC is directed northward. In the following sections, we will investigate how waters still enter the DCA. In addition, this simulation shows two times higher eddy kinetic energy along the western side of the Reykjanes Ridge compared to the central Irminger Sea (Fig. 2b), which agrees with observations (Fan et al., 2013; Volkov, 2005), and hints to strong mesoscale activity in the eastern Irminger Sea.
Buoyant IC water contributes to restratification after deep convection only if it reaches the DCA and still carries a positive buoyancy anomaly. Therefore, we validate the location of the DCA based on the mixed layer depth (MLD). We compute the mixed layer depth from the monthly fields using a 0.003 kg m−3 difference in density with respect to a model density at a reference depth of 17 m. This density difference criterion is much smaller than values typically applied in global analysis (0.03 kg m−3 as in de Boyer Montegut et al., 2004), as these less stringent criteria are not appropriate for the weakly stratified waters in the Irminger Sea. A study by Paquin et al. (2016) with a slightly coarser spatial resolution in the Irminger Sea used a density difference criterion of 0.01 kg m−3. The fact that we use an even smaller criterion is related to the higher spatial resolution of this simulation (2 km in the central Irminger Sea) combined with a high vertical resolution. We chose the reference depth just below the surface to avoid an imprint of the diurnal surface mixed layer changes that the model simulation resolves due to its high-temporal resolution, as explained in Rühs et al. (2021). The resulting MLD matches observations in spatial extent and depth to a large degree. In this simulation, the deepest mixed layers occur in February (Fig. 2c) in the center of the Irminger Gyre.
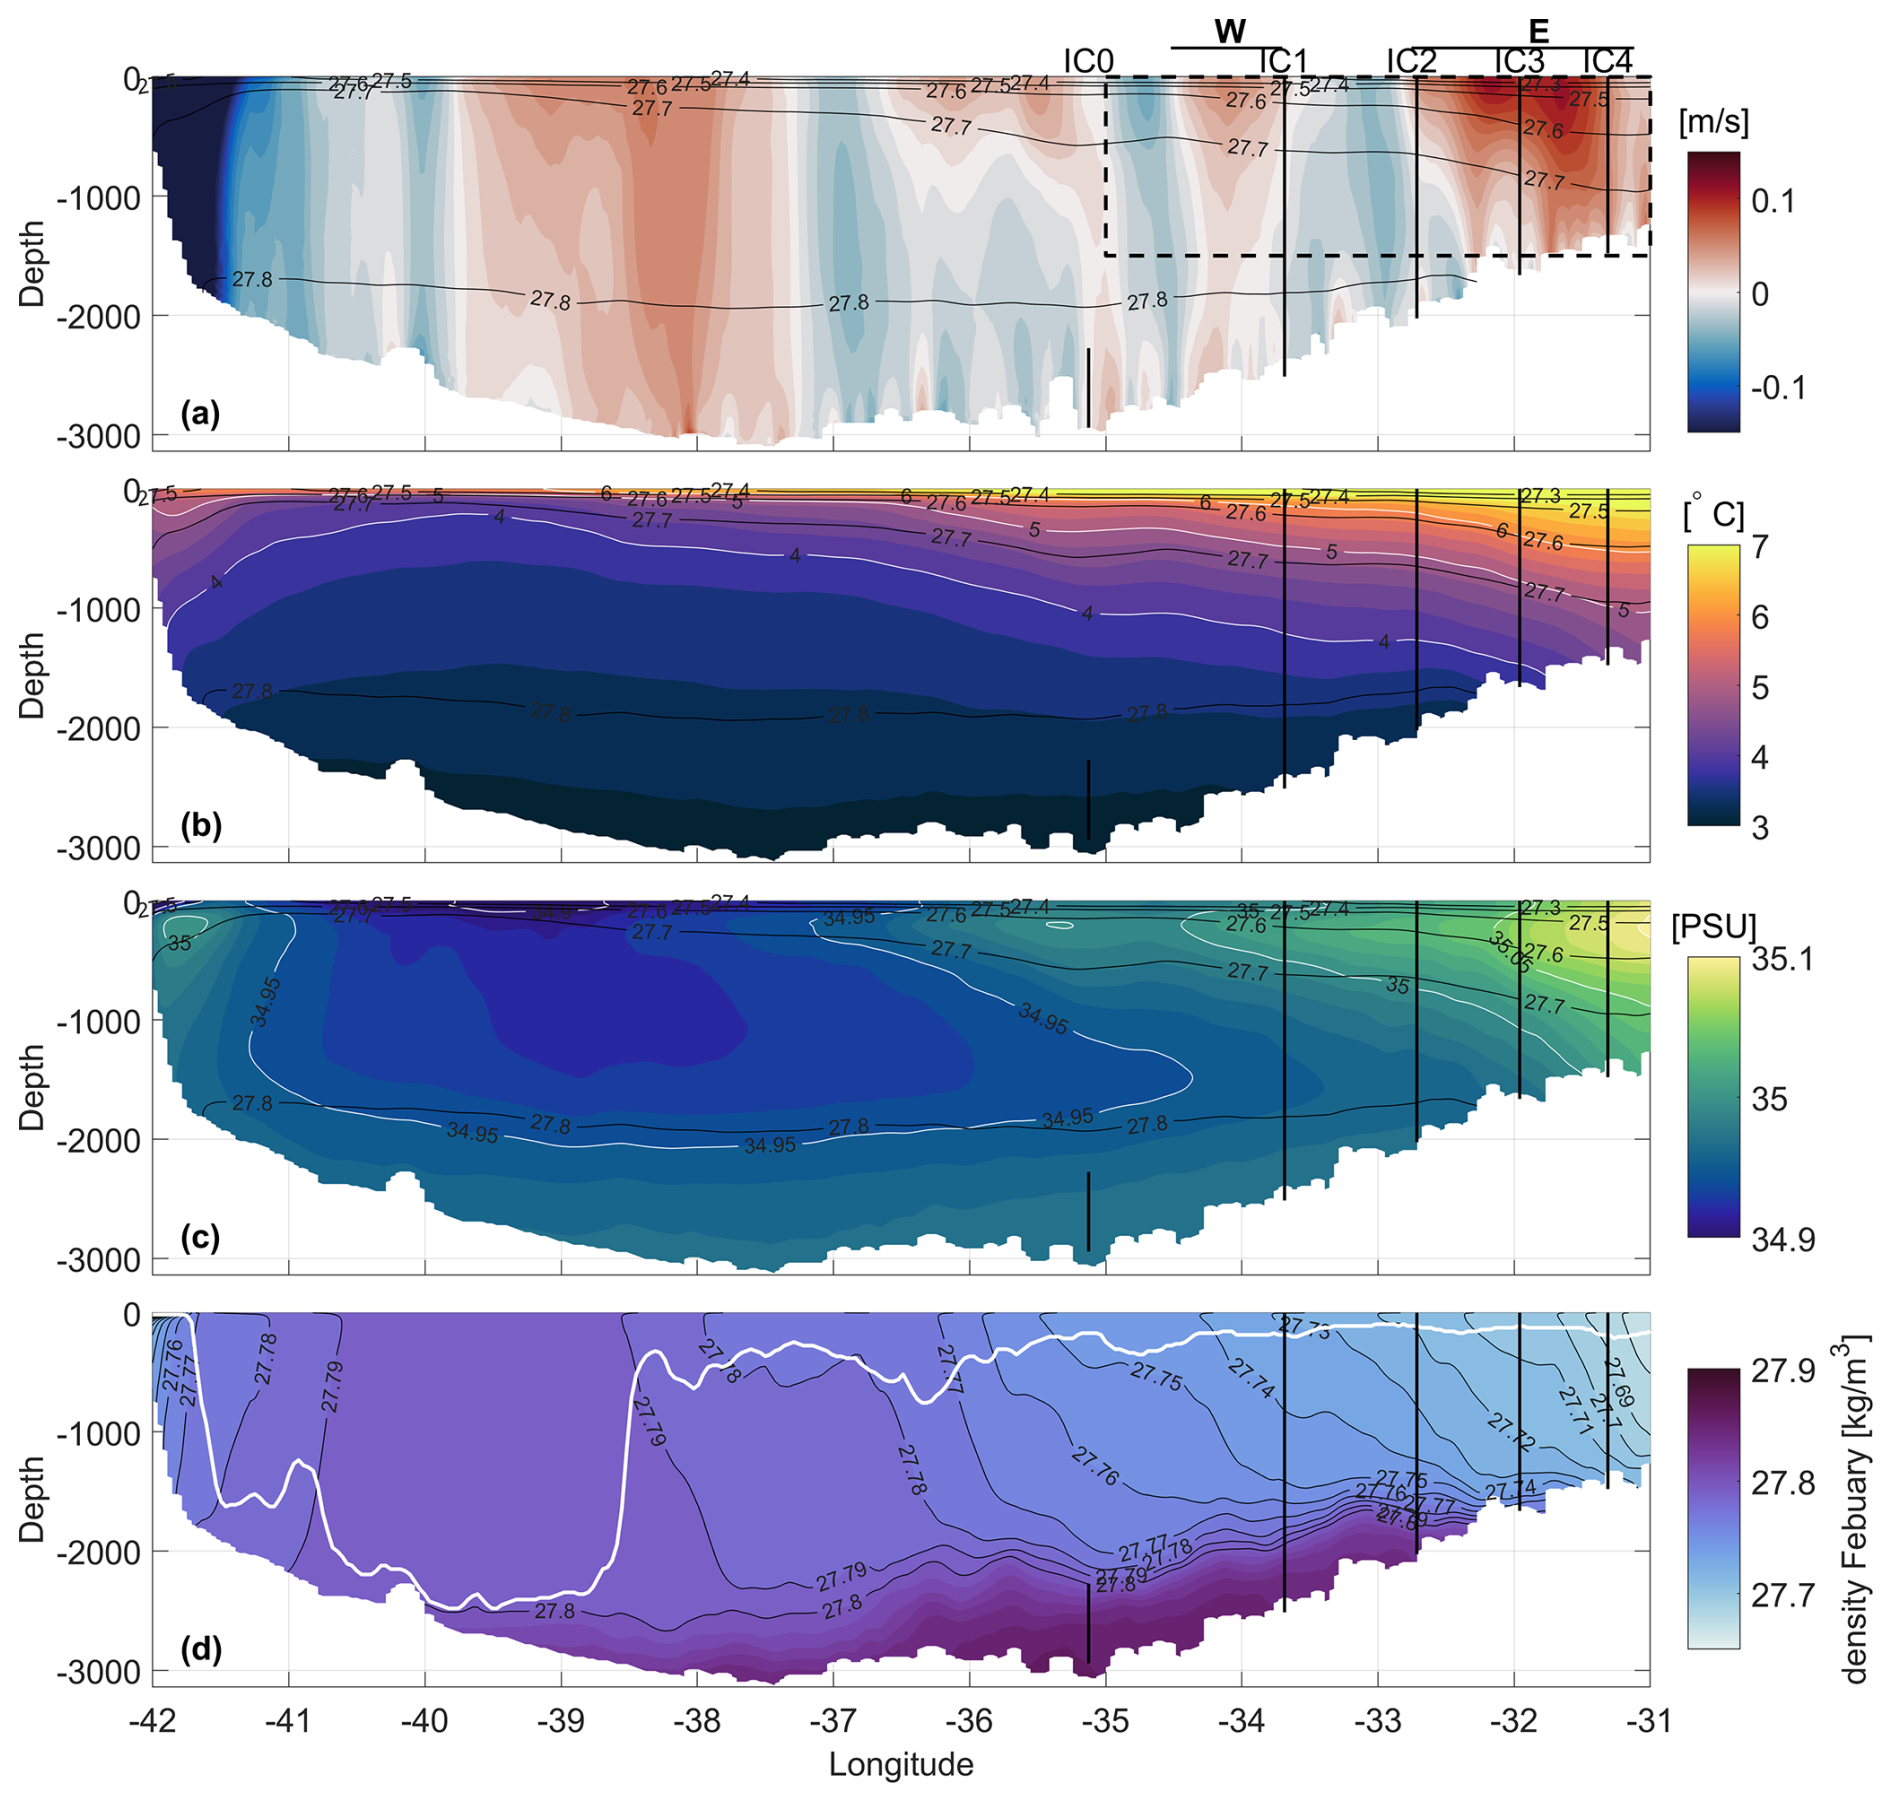
Figure 3Simulated IC properties at the OSNAP East section. (a) One-year average velocity section across OSNAP East (shading) with one-year average isopycnals (contours). The OSNAP array is marked by grey dots in Fig. 1. IC-mooring locations are marked with black vertical lines and mean locations of western (W) and eastern (E) IC core with black horizontal lines; (b) as (a) but for potential temperature with isotherms (white contours); (c) as (a) but for practical salinity with isohalines (white contours). (d) Potential density section along OSNAP East for February (shading), corresponding isopycnals (black contours) and mixed layer depth (MLD, white line). Dashed black line in (a) marks the particle release area.
The model simulation is then validated at the location of the OSNAP East mooring array, to verify that the model reproduces the IC's two-core structure with a realistic east/west gradient in salinity and temperature (the western core being colder and fresher than the IC's eastern core, e.g. De Jong et al., 2020; Fried et al., 2024a; Fried and De Jong, 2022; Våge et al., 2011). Slight differences between this simulation and the observations can be expected due to the much higher spatial resolution in this model simulation compared to the OSNAP mooring array. Also, the IC's structure could have been different during the chosen model year (2007–2008 model simulation versus 2014–2022 observations).
Figure 3 shows sections of one-year average across-section velocity, potential temperature, practical salinity and potential density from the simulation at OSNAP East. For easier reference to observations, we added the location of the hydrographic moorings observing the IC within the OSNAP program as vertical lines (IC0–IC4 from west to east). In the model, we find a strong northward flow with surface-intensified velocities between IC2 and IC4 that can be identified as the eastern IC core (Fig. 3a). Between IC1 and IC2 the model produces southward velocities in line with observations, but over a slightly wider area (De Jong et al., 2020, their Fig. 2). In the model data, the western IC core is visible between mooring locations IC0 and IC1. The fact that its position is slightly shifted compared to its location reported based on observations is not unexpected, as we know from observations that the western IC core displays strong spatial and temporal variability (De Jong et al., 2020; Fried and De Jong, 2022). Therefore, moorings cannot always capture a westward shift of the IC and therefore its strength and location could be underestimated by mooring observations. Further west, the northward flow in the center of the Irminger Sea between 40–37.5° W (Fig. 3a) is known as the main northward branch of the Irminger Gyre from observations (Fig. 1). The strong southward flow at the western side of the basin is the EGC/IC. The currents along the OSNAP East section are in the correct position compared with observations and show a realistic strength (Daniault et al., 2016; Duyck and De Jong, 2021; Le Bras et al., 2018; Våge et al., 2011).
The simulated hydrography of the Irminger Sea along OSNAP East (potential temperature and salinity) is shown in Fig. 3b and c, respectively. Warmer and more saline waters dominate the eastern part of the basin (>7 °C, 35.1 PSU). The central Irminger Sea is characterized by relatively colder and fresher water with seasonally outcropping isopycnals in the convection area between 40–39° W. The strong salinity minimum (34.9 PSU) in the central Irminger Sea reaching down to 1000 m depth marks convectively formed waters. The simulated hydrography in the upper 1500 m along OSNAP East and the lateral gradient compare well to long-term averages from observations (Fried et al., 2024a, b; Fu et al., 2023; Våge et al., 2011). We note here that the model has shortcomings in correctly reproducing deep overflows along the OSNAP East line. Both the deep salinity maximum associated with the Iceland Scotland Overflow Water (Fogelqvist et al., 2003; Fu et al., 2023; Lozier et al., 2019; Våge et al., 2011) and the temperature minimum associated with the Denmark Strait Overflow Water (Dickson and Brown, 1994; Våge et al., 2011) are less pronounced in this model simulation compared to observations.
Lastly, we show a section of potential density with the corresponding mixed layer depth (white line) in February, the month with the deepest mixed layers in this simulation (Fig. 3d). As already shown with the spatial extent of the MLD (Fig. 2c), the deepest mixed layers occur between 41.5 and 39.5° W in the vicinity of the Irminger Gyre. There, isopycnals are outcropping and water convects down to around 2000 m. Even though the location is comparable to observations we want to note here that the model overestimates the MLD according to observations (De Jong and De Steur, 2016; Pickart et al., 2003; Rühs et al., 2021; Våge et al., 2011), maybe related to the deviations in representing the overflow waters. As our following analysis focusses on the upper part of the water column to study the pathways of the main velocity core of the IC and not the convection itself, we consider the location of the DCA more important than the actual depth of the mixed layer. Nevertheless, it should be kept in mind, when interpreting the results.
In summary, we conclude that this simulation is suitable for the purpose of our study as it reproduces the northward flowing two-core IC, as well as the gradient in the temperature and salinity field across the Irminger Sea. In addition, this simulation offers the high spatial and temporal resolution to resolve mesoscale activity and represents the location of the deepest mixed layers well, which is required for this study.
2.3 Lagrangian particle seeding strategy
To find out whether waters from the IC enter the interior Irminger Sea and potentially the deep convection area, we evaluated numerical particle trajectories in the MITgcm simulation calculated using the 3D-particle tracking algorithm presented in Koszalka et al. (2013) and Gelderloos et al. (2016). We released particles in the first six months of the simulation, between 1 September 2007 and 13 February 2008 and track them for six months. Previous tests revealed that a tracking time period of six months is enough for particles to spread through entire Irminger Sea basin (not shown). In each month, we released a five-member ensemble of particles with three days in between individual ensemble members. This choice to release every three days accounts for intra-seasonal variability whilst remaining below typical storm frequency. Accordingly, we released on every 1st, 4th, 7th, 10th, and 13th day of the month. To be able to link our results to available observations of the IC, we released the particles along the OSNAP IC mooring line every 2 km between 35 and 31° W. Particles were released with a 50 m depth interval in the vertical, to resolve the vertical structure in velocity and hydrography (Fig. 3). The focus is on the upper 1500 m, in order to capture the main velocity structure of the IC and the part of the water column that is affected by convection and restratification (dashed rectangle in Fig. 3a).
In this way, we released 3601 particles per ensemble member, which yields a total number of 108 030 released particles. We tracked the particles forward-in-time and recorded their positions every 6 h. In addition, we recorded their temperature and salinity along the track based on the property fields of the model simulation.
To explore the fate of the IC waters downstream from the OSNAP IC moorings, we categorize the particles according to their differing pathways and end locations. Focussing on the interior Irminger Sea pathways, we then study the IC's potential impact on restratification processes in the Irminger Sea's convection area.
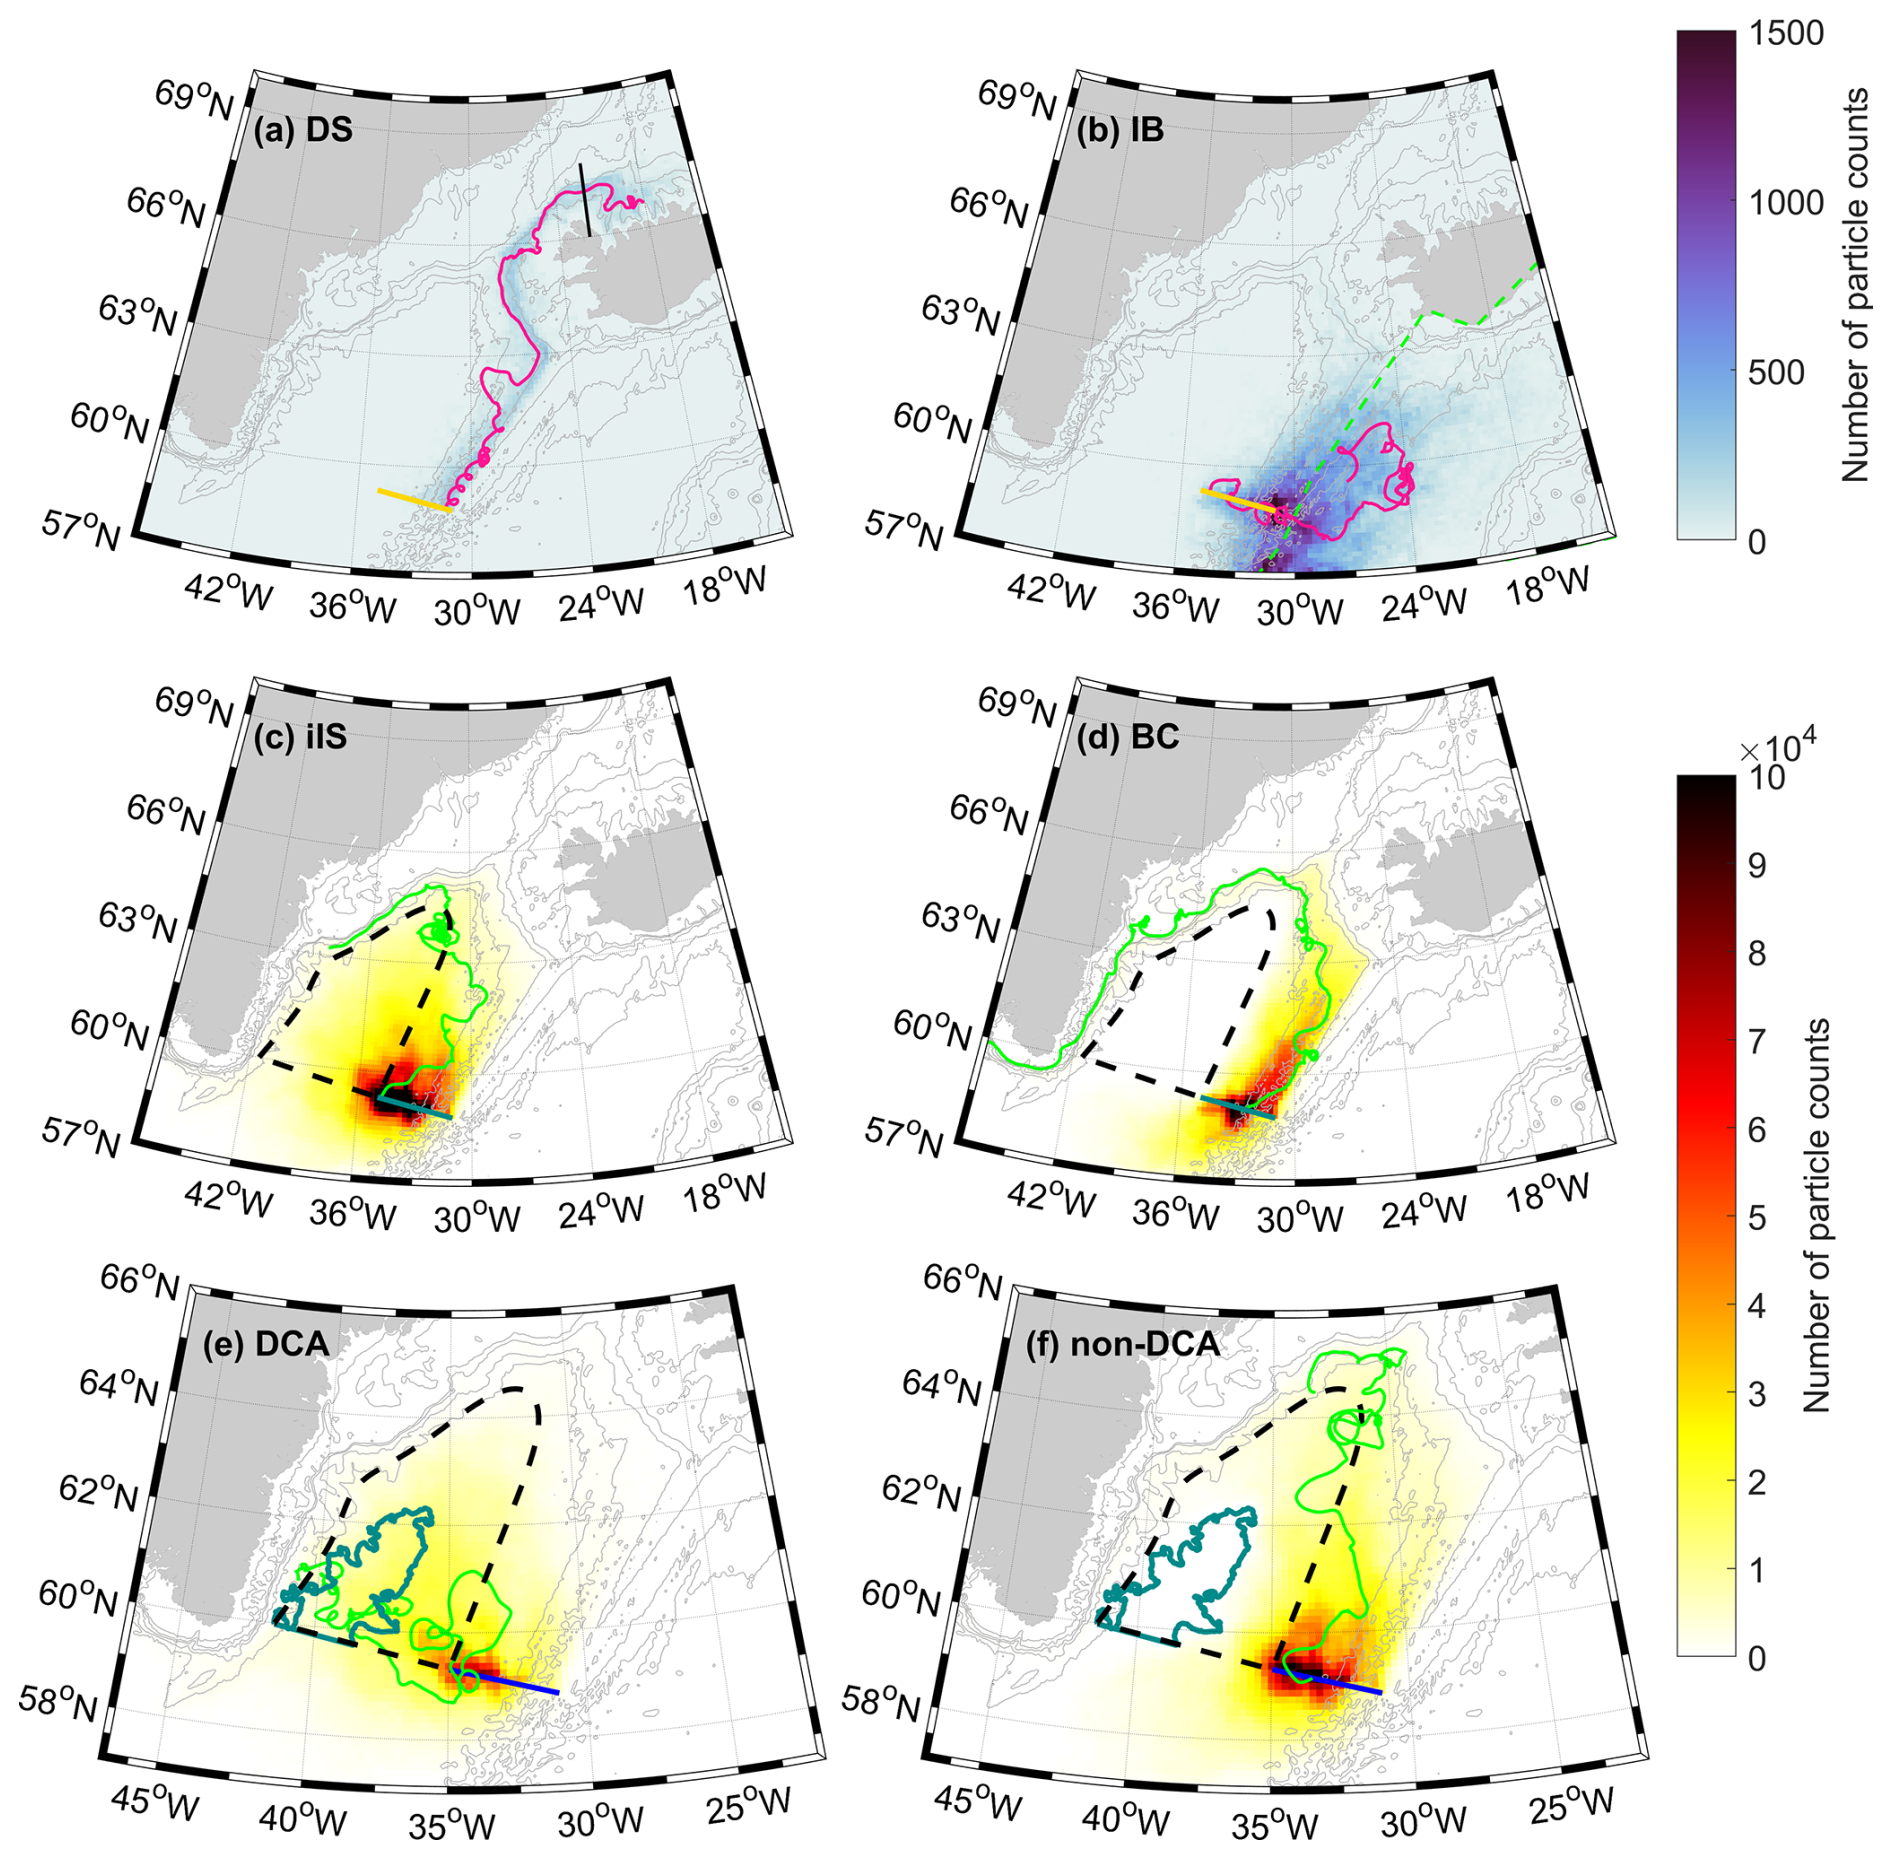
Figure 4Particle density maps of particles released at the OSNAP IC moorings. Particle density distribution for (a) Denmark Strait particles and (b) Iceland Basin particles. The pink line marks an example particle track and the orange line the release line. Dashed black line in (a) and green dashed line in (b) geographically mark the selection criterion for DS and IB respectively. Particle density distribution for (c) interior and (d) boundary current with example particle tracks (green) and interior Irminger Sea definition (dashed line); release line is marked in greyish blue. (e) DCA particles and (f) non-DCA particles with example particle tracks (green), contours defining the interior Irminger Sea (dashed line) and the DCA (blue); dark blue line marks the particle release line. Note the different colorbar limits are used for (a, b) compared to (c–f) because of the large difference in particle amount per grid box.
3.1 Particle classification
Based on where the numerical particles exit the domain and whether they stay in the boundary current or enter the interior, we first split the particles into four categories: Denmark Strait (DS), Iceland Basin (IB), Irminger Current (boundary current, BC) and interior Irminger Sea (iIS). As we are interested in restratification processes in the Irminger Sea, we do not focus on the small number of particles leaving the Irminger Sea through DS (defined as particles that cross 22° W north of 66° N, black line in Fig. 4a; 0.2 %), and across the Reykjanes Ridge to the IB (defined as particles that cross the Reykjanes Ridge towards the east, dashed green line Fig. 4b; 1 %) within the considered 6-months tracking time period. Particles leaving through Denmark Strait did not re-enter the Irminger Sea. Since the exchange across the Reykjanes Ridge is very variable (Fried et al., 2024b), to be counted as IB particles, they need to remain on the eastern side of the ridge for at least 40 consecutive days.
The remaining particles (∼99 %) are classified as either interior Irminger Sea (iIS) or boundary current (BC) particles, based on whether they cross a closed contour defined using the model bathymetry. The western boundary of the interior Irminger Sea region (dashed line in Fig. 4c and d) is defined using the smoothed 2000 m isobath off the east coast of Greenland, with its northernmost point at 64.5° N. Preliminary tests using different isobaths showed that this choice for the interior-region best separates the particle trajectories in the boundary current flow from those reaching the interior by visual inspection (see Sect. 3.2 for additional information on the sensitivity of the particle classification to this choice). The eastern boundary of the region is defined as a straight line that runs parallel to the Reykjanes Ridge from the above northernmost point to the western end of the particle release line. The OSNAP East line is taken as the southern boundary of the interior region. Particles are considered as iIS when they pass this closed contour, irrespective of the time they spend in the interior. Particles classified as iIS enter the interior region at least once but can leave the interior region again after they entered (example track Fig. 4c). Particles classified as BC never reach the interior region.
Based on these selections we show particle density maps for each category in Fig. 4. Particle locations were binned to boxes spanning 0.25° in longitude and 0.125° in latitude and were counted for every occurrence within a certain box. As mentioned earlier, within six months 0.2 % of particles released at OSNAP IC moorings leave the Irminger Sea through Denmark Strait. Most of these DS particles closely follow the western flank of the Reykjanes Ridge, following the eastern IC core as a main pathway (Fig. 4a). The example particle track (pink line) follows the strong northward flow of the eastern IC core until it leaves the Irminger Sea through Denmark Strait.
For particles categorized as IB particles, we also find the highest particle density along the Reykjanes Ridge (Fig. 4b). Within the half-year tracking time period these particles spread into the interior Iceland Basin, but the majority stay near the ridge north of the release location and partly also south of the release line. Some particles re-enter the Irminger Sea after spending 40 d in the Iceland Basin, which highlights the exchange between the two basins across the Reykjanes Ridge north of the release location.
As we are interested in boundary-current-to-interior transport in the Irminger Sea, we focus our analysis on particles that either belong to the BC (39 %, Fig. 4c) or the iIS category (60 %, Fig. 4d). From the release location, particles spread west towards the interior Irminger Sea (Fig. 4c). The example track first follows the boundary circulation northeastward and enters the interior region just north of 63° N, where it gets caught in a mesoscale eddy. It then re-enters the boundary current. This example track illustrates that the strong exchange between the interior Irminger Sea and the boundary current circulation in both directions.
For the BC particles we find a high particle density close to the top of the Reykjanes Ridge, mostly following the eastern IC core northward (Fig. 4d). The example particle is released in the eastern IC core and stays in the eastern IC core going north-eastward. Along the east coast of Greenland, it follows the circulation of the IC along the shelf break.
Buoyant IC water contributes to restratification after deep convection if it reaches the DCA and still carries a positive buoyancy anomaly. So, we now investigate whether iIS particles reach the DCA. As the deepest mixed layers in this model simulation occur in February (Figs. 2c and 3d), we use the spatial extent of the deep mixed layers in that month to define the DCA. We use the 1500 m MLD contour (blueish line Fig. 2c), which resembles best the area of deepest observed mixed layers (e.g. Rühs et al., 2021, and references therein). Here, we only include the part of the DCA north of OSNAP East (Fig. 4e and f). We use the defined DCA contour to further subdivide all interior particles (iIS, Fig. 4c) into particles that enter the convection area (DCA particles, Fig. 4e) and those that stay outside of the convection area (non-DCA particles, Fig. 4f). Similar to the BC particle definition, non-DCA particles never enter the DCA, while DCA particles may leave the DCA again after they entered. From all particles released within the six months tracking time period, 26 % reached the DCA (Fig. 4e) and 34 % stayed outside the DCA in the interior Irminger Sea (Fig. 4f). DCA particles appear in the entire region defined as interior Irminger Sea but show a high particle density in the eastern interior basin (Fig. 4e). Non-DCA particles stay, by definition, in the eastern part of the basin (outside of the DCA) and can re-enter the boundary current after spending time in the interior (Fig. 4f). Both example particle tracks show strongly eddying pathways. Comparing panel (e) and (f) in Fig. 4, non-DCA particles follow the mean northeastward velocity field of the boundary current while the DCA particles tracks have a clear westward component that cannot be immediately linked to the one-year averaged flow field (see Sect. 5 for a more detailed discussion on the pathways).
3.2 Sensitivity of particle classification to the definitions of the interior region and DCA
The outcomes of categorizing the particles are sensitive to the choices made in defining the interior region and the DCA. Here, we discuss how robust those numbers are to slight changes in the various criteria applied.
For the two categories of particles that leave the Irminger Sea through Denmark Strait and into the Iceland Basin, which add up to only around 1 % of all particles released, the categories were defined geographically. The number of DS particles is very robust to changes in the line chosen (black line Fig. 4a). Moving the line west or east from the chosen longitude of 22° W did not significantly change the number of particles leaving through DS. Likewise, the number of particles classified as IB is robust to the chosen 40 d residence time in the Iceland Basin and does not significantly change with small changes (±5 d) to the 40 d. This number is based on a previous study on pathways of the IC showing that particles need a maximum of 50 d to travel the distance between the Irminger Sea and the Iceland Basin across the Reykjanes Ridge (Fried et al., 2024b). In this study, the 40 d residence time appears long enough to separate IB particles from those returning to the Irminger Sea (green dashed line Fig. 4b).
The further split of the remaining particles into BC and iIS is more sensitive to the choice of the definition of the interior region boundaries. As mentioned earlier, particles are considered as iIS when they pass this boundary without considering the time they spend in the interior. This is motivated by the expectation that requiring a minimum residence time in the interior to be counted as iIS particles is largely equivalent to defining a smaller interior region, as the longer particles stay in the interior the farther, they can travel from the chosen boundary. Therefore, instead of testing the sensitivity of the particle classification to moving the boundary region of the interior inwards, we tested against introducing a minimum residence time using the contour outlined in Fig. 4c. With the requirement of a residence time of 10 consecutive days, the number of particles counted as entering the interior reduces from 60 % to 48 %. Even though this is a reduction of 12 %, we decided to not use any time criterion. The reduction when using a time criterion can be seen as like applying a contour line of a smaller region. Without a time criterion we got a clear (visual) separation into iIS and BC particles that gets less clear when introducing a time criterion. Nevertheless, the outcome that percentages of interior and boundary current particles are sensitive to the chosen interior boundaries should be kept in mind when interpreting the results.
The further split of the iIS particles into DCA and non-DCA appears not very sensitive to the chosen MLD depth to define the DCA. We tested the outcomes against two different depths (1400 and 1600 m compared to the chosen 1500 m), that based on Fig. 2c would still characterize the deep mixed layers along the OSNAP East section. Even with a stricter choice, e.g. the 1600 m depth contour, many particles released at the OSNAP IC moorings reach the DCA (1600 m: 23 % DCA; 1500 m: 26 % DCA 1400 m: 37 % DCA).
In conclusion, when using a time criterion or a smaller region more of the iIS particles could be counted as BC particles as some only show a short excursion to the interior. As those particles mostly stay in the non-DCA region they will not have a large impact on restratification in the DCA. Those short excursions are likely related to the strongly meandering circulation in the interior Irminger Sea. The number of DCA particles is less sensitive to the choice of the DCA based on different MLD contour lines, and therefore interpretations based on that number are more robust.
3.3 The importance of the release location within the IC
In the previous section we focused on particle density maps without distinguishing at which location along the release line particles were released. In the horizontal, the IC can be divided into western and eastern velocity cores that are both surface-intensified (Fig. 3a, De Jong et al., 2020; Fried et al., 2024a; Våge et al., 2011). The IC's eastern core is more buoyant than the western core (Fig. 3b and c). If waters from the eastern core enter the DCA, they could potentially contribute more (per volume unit) to restratification than particles from the western IC core. In the vertical, we also find a density gradient in the IC (Fig. 3b–d). Particles released at different depths would therefore carry different hydrographic properties too. Accordingly, it is relevant to assess whether particles in a particular category (BC, iIS, DCA, non-DCA) originated from a certain depth or a certain longitude. In the following, we thus investigate these links between the release location/depth and particle category.
Figure 5 shows the results in terms of volume transport, where the volume transport assigned to each particle is given by the product of its initial velocity and the fractional area of the model grid cell face at which the particle is released (e.g. Fröhle et al., 2022; Schmidt et al., 2021). In practice, this is achieved by interpolating the Eulerian velocity field at the time of release onto a new grid, which consists of one grid cell per particle released in the upper 1500 m. Since each particle is now located at the centre of a grid cell, its volume transport (which we assume to be conserved along its entire trajectory) is given by Vp=(vpdxpdzp) where vp is the initial Eulerian meridional velocity and (dxpdzp) is the grid cell area associated with a particle p. We find close agreement between the upper 1500 m volume transport calculated using the original and regridded Eulerian velocity fields (compare Fig. 5a to Fig. 3a), indicating that this is a feasible method to estimate the volume transports associated with each circulation pathway.
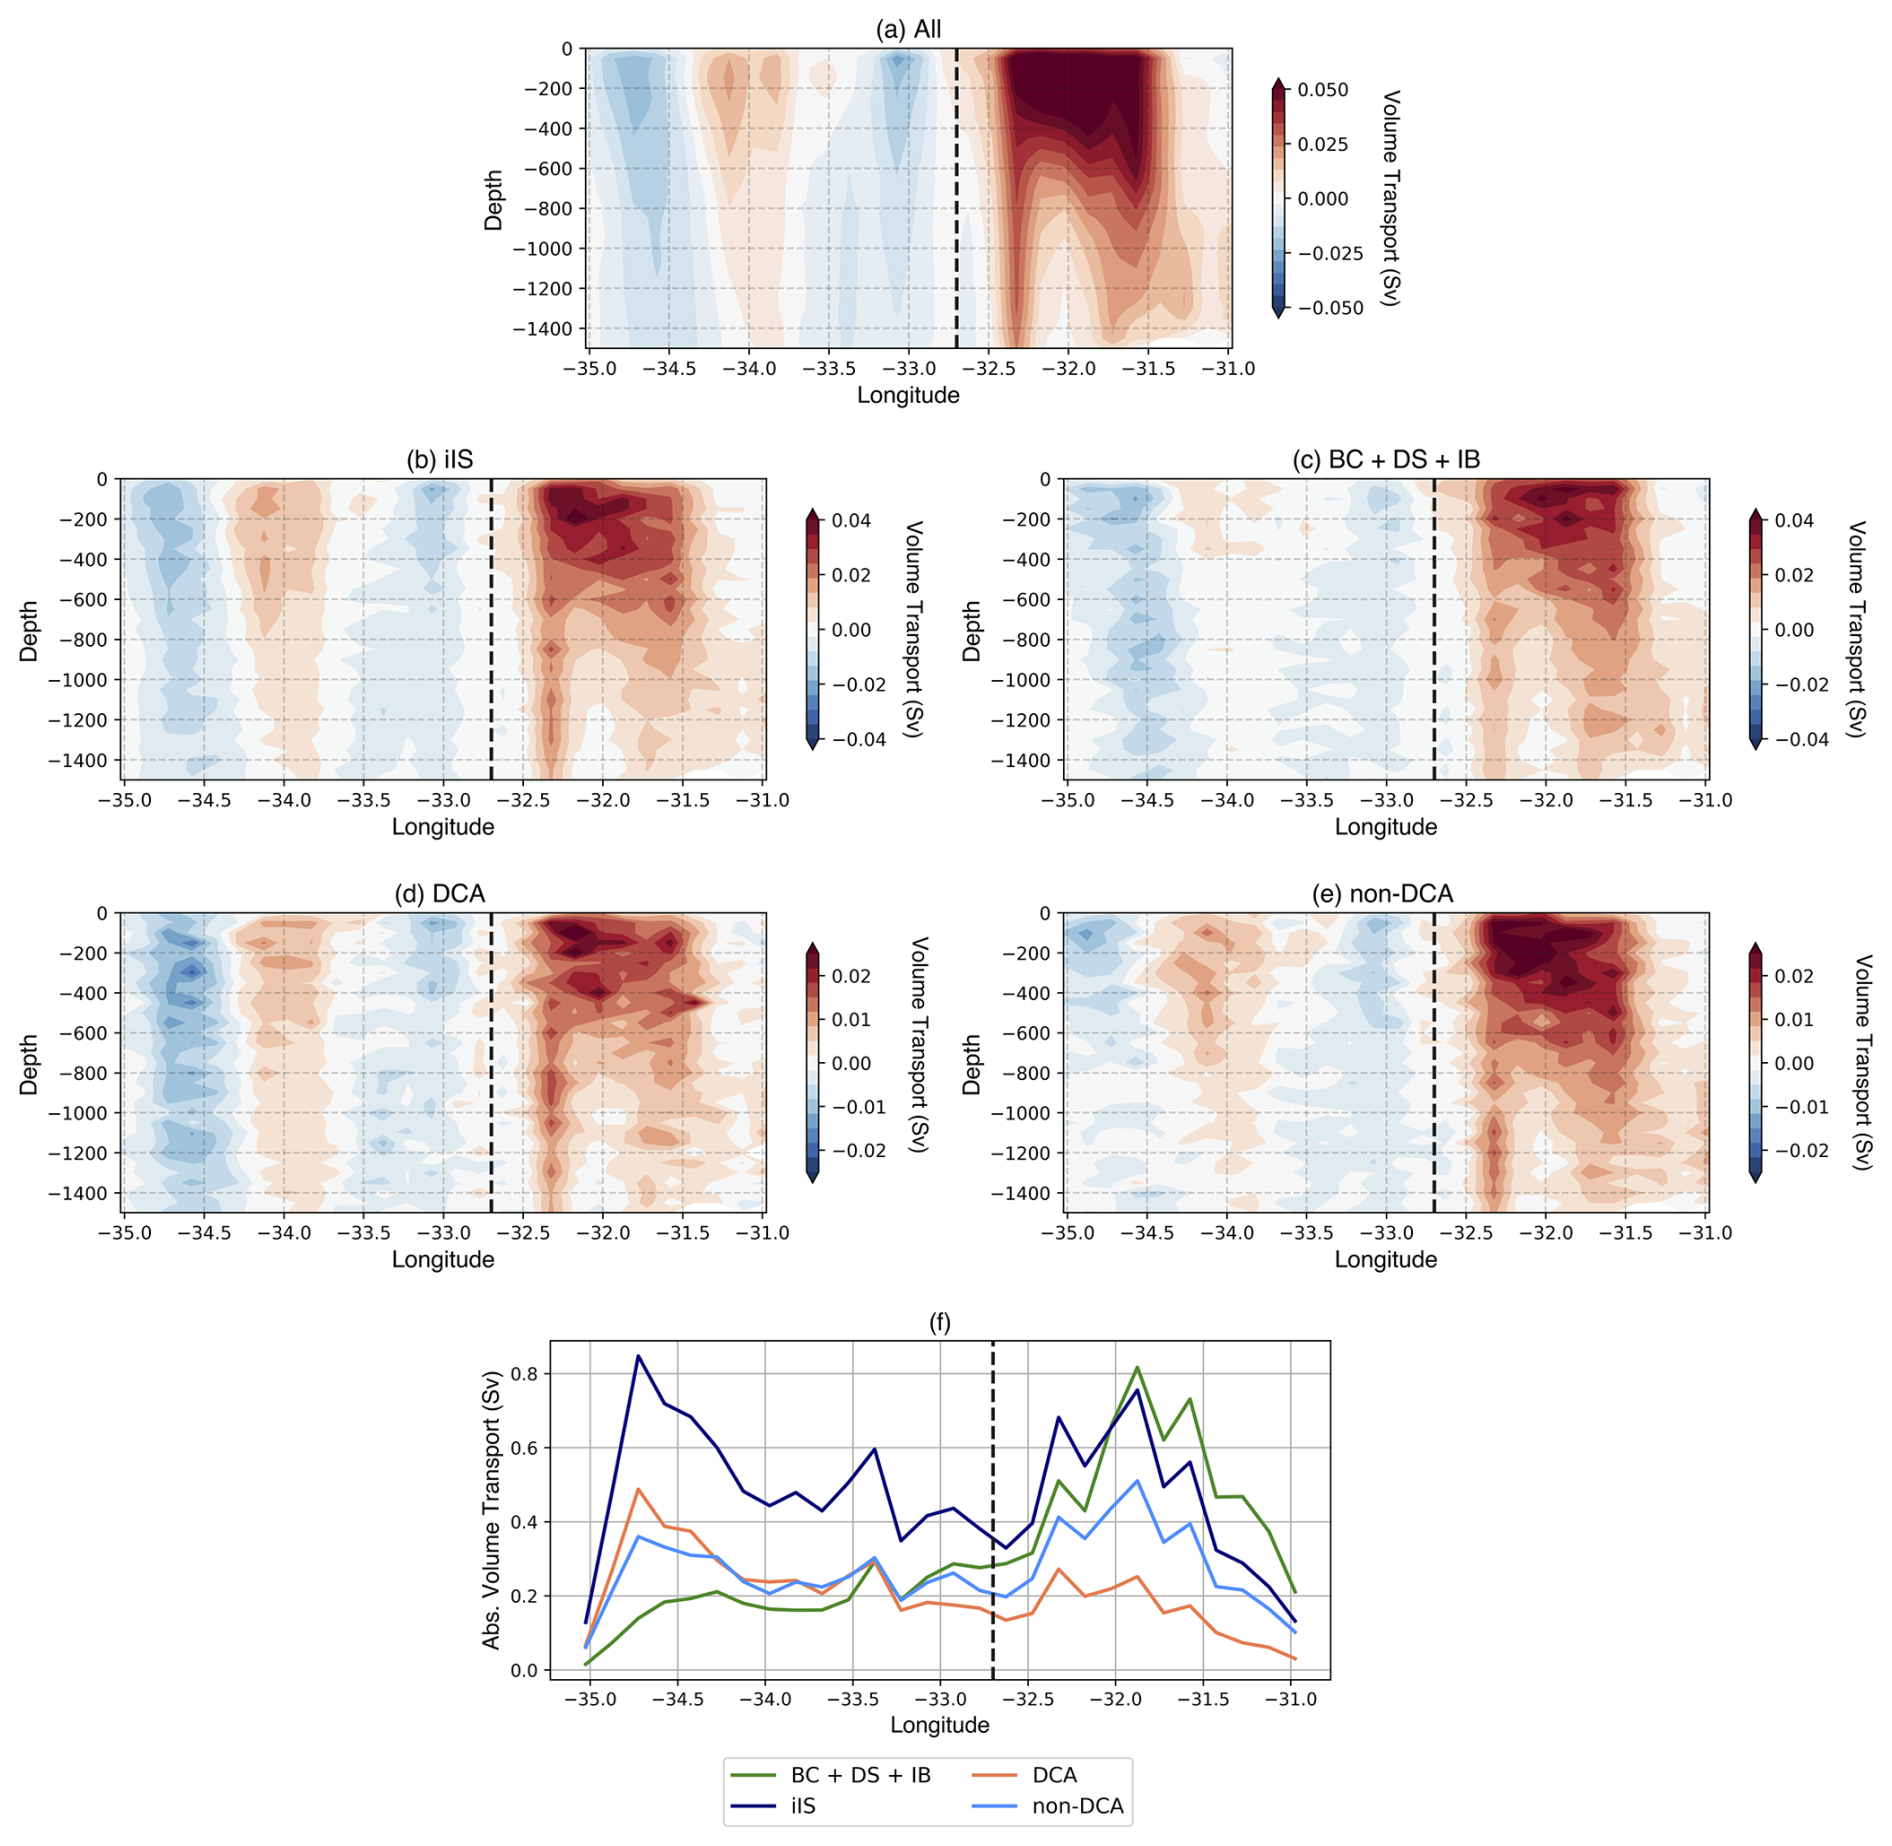
Figure 5Volume transport of particles along the release line. Binned particles per volume transport along the release line for all particles (a), interior Irminger Sea particles (iIS, b), boundary current particles (BC, c), deep convection area (DCA, d) and outside of the deep convectio area (non-DCA, e). The volume transport assigned to each particle is given by the product of its initial velocity and the fractional area of the model grid cell face at which the particle is released. Not that colorbar limits differ for the different panels. (f) Absolute volume transport [Sv] along the release line split into BC (green) and iIS (dark blue). The iIS is then also split into DCA (orange) and non-DCA (light blue). The black dashed line in all panels marks the separation between western and eastern IC core.
To understand whether there is a connection between the location where a particle is released (vertically and horizontally) and its final categorisation, we next split these volume transports into those that enter the interior and those that stay in the boundary current (Fig. 5b and c). As the DS and IB particles also follow the BC circulation and are only a very small number, we combined those with the BC particles. Note that red colors correspond to northward and blue to southward transport. The only small difference between the iIS and BC particles is that particles released in the eastern part of the section (around 31.5° W) follow the BC and do not enter the iIS (Fig. 5c). For particles entering the iIS we find slightly higher volume transports in the western IC core around 34° W, suggesting that particles released here are more likely to enter the iIS (Fig. 5b). The further split of the iIS particles into DCA and non-DCA particles reveals that more non-DCA particles originate from the eastern IC core (Fig. 5d and e). This implies that the seeding location is relevant when considering whether a particle enters the iIS (and DCA or non-DCA) or stays in the BC.
Lastly, we show the absolute volume transport as a vertical sum for all categories to clarify any longitudinal dependencies (Fig. 5f). More waters enter the interior Irminger Sea and the DCA from the western IC core than from the eastern IC core. Particles following the boundary current (green line Fig. 5f) mostly originate from the eastern core (68 %, east of 32.7° W, see dashed line Fig. 5) and only 32 % from the western core (west of 32.7° W). Of those entering the interior (dark blue line Fig. 5f), 57 % were released in the western IC core and only 43 % in the eastern core. The further separation of the interior particles into DCA and non-DCA particles again reveals the difference with more non-DCA particles originating from the eastern IC core (orange and light blue line Fig. 5f). For the particles entering the DCA, the majority was seeded in the western IC core (65 %). Therefore, waters from the IC's western core could potentially have a stronger influence on the restratification in the DCA. In summary, we could not find a connection between particle release depth and a specific category. Instead, there is a connection between the longitudinal release location and the particle category.
To explore whether the water mass properties of those particles entering the DCA can restratify the Irminger Sea interior, we will shift the focus to the water mass properties in the Lagrangian framework in Sect. 4.
From the temperature and salinity sections across the Irminger Sea (Fig. 3b–d) we know that waters become increasingly more buoyant eastwards from the DCA and therefore could potentially restratify the convection area. In Sect. 3 we showed that 26 % (5.9 Sv) of the particles released at the OSNAP IC moorings reach the DCA within six months. However, it is important to understand how their properties evolve along their pathways towards the DCA, and how much of their buoyancy remains upon entering.
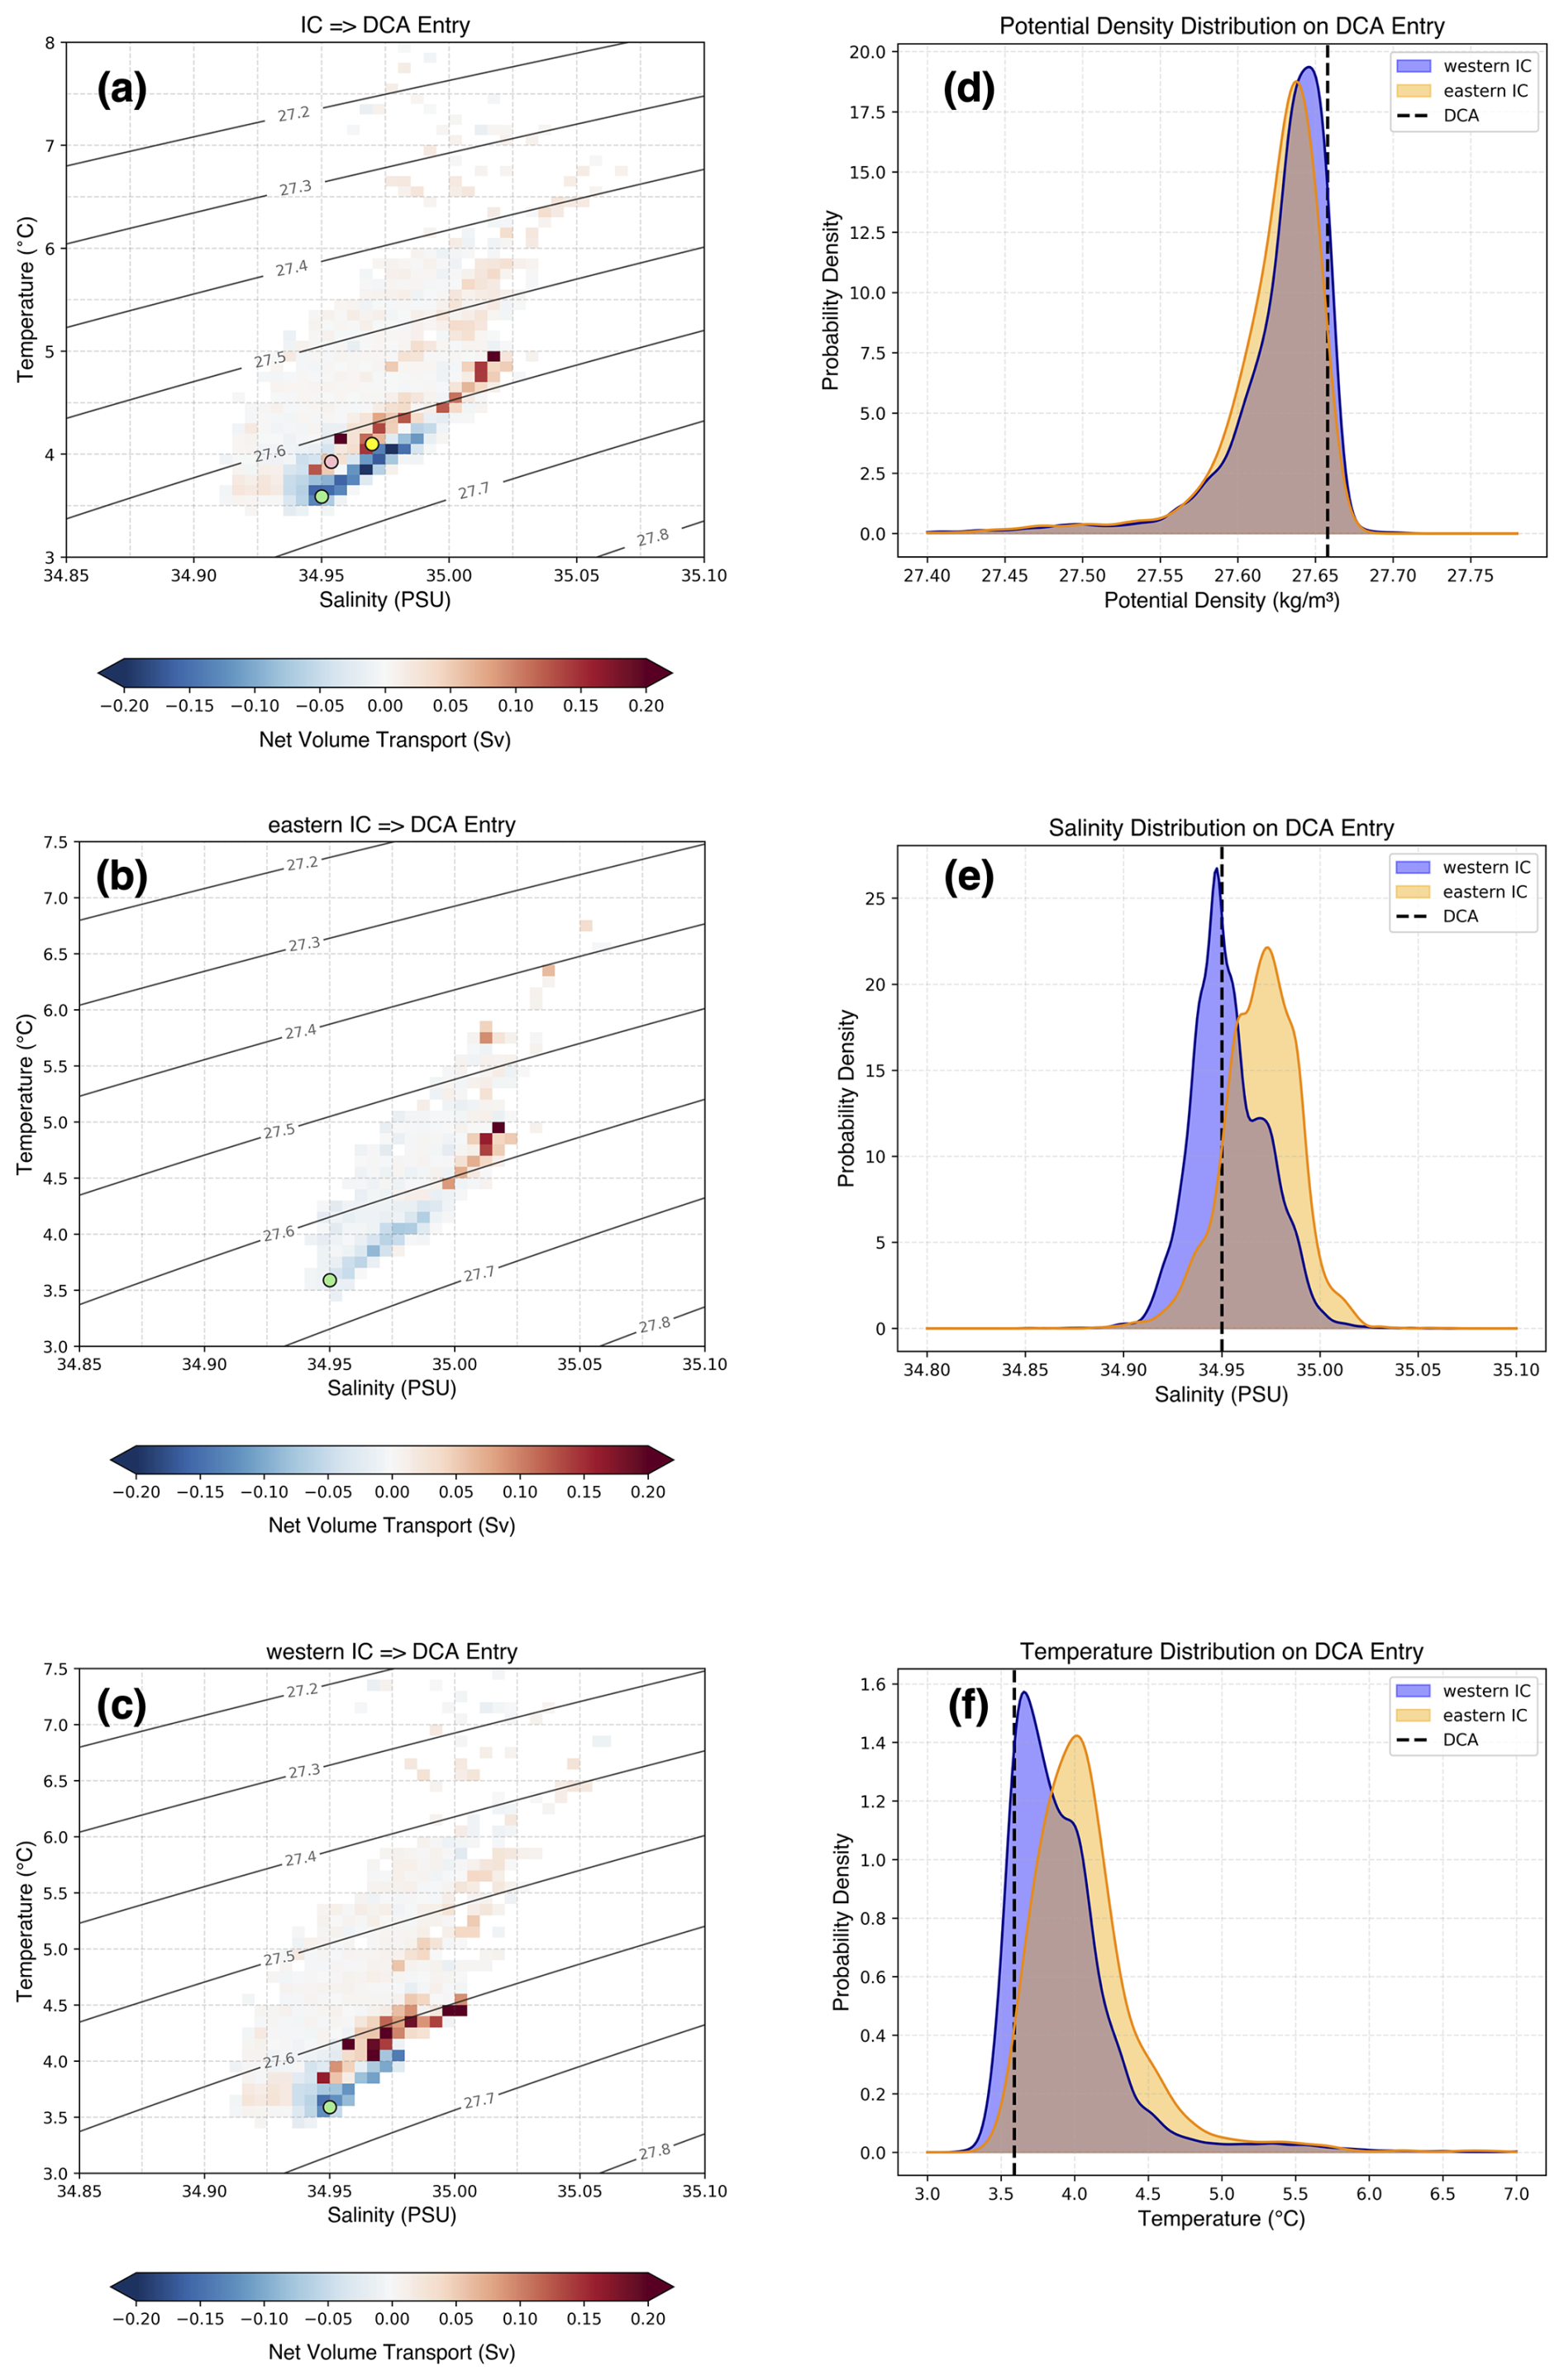
Figure 6(a–c) Binned T-S properties of particles at their release location (a total IC, b eastern core, c western core) compared with those when they subsequently enter the DCA. Net volume transport distribution of DCA-bound particles in discrete potential temperature–salinity coordinates. Red coloured regions show T-S properties of particles upon their release in the IC. Blue coloured regions show properties on first entering the DCA. Contours mark the corresponding isopycnals. The green dot represents the time-mean T-S properties of the DCA during February in the model. The yellow and pink dots represent the mean T-S properties of particles on first entering the DCA for the eastern and western core, respectively. (d–f) Probability density as a function of potential density (d), salinity (e) and temperature (f) at DCA entry for eastern (yellow) and western (blue) IC core. Probability density functions are estimated using kernel density estimation with Gaussian kernels. The dashed line represents the model's averaged DCA properties in February as a reference value.
To investigate this, we first compare properties of particles at the release location in the IC (red) to those once they enter the DCA (blue, Fig. 6a–c). Particles are binned to 0.005 PSU×0.1 °C boxes and are color-coded by volume transport. We show the results for the whole IC (Fig. 6a) and the respective results for eastern and western core (Fig. 6b and c). Next to losing heat to the overlying atmosphere, we find that on their way towards the convection area, particles lose heat and salt to the surrounding waters and with that likely contribute to changes in the stratification outside of the main convection area (Fig. 6a). The change in temperature and salinity on their way to the DCA is higher for particles released in the eastern IC core ( PSU, , Fig. 6b) than for those released in the western IC core ( PSU, , Fig. 6c).
To explore the potential of IC waters for restratification in the convection area, we show the average mixed-layer properties of the DCA for February (green dot in Fig. 6a), the month with strongest convection in this simulation (Fig. 2c). As temperature and salinity within the DCA exhibit little variation (3.59 ± 0.02 °C and 34.95 ± 0.001 PSU), we show the model average over the whole DCA and from the surface to the MLD. In addition, we show the averaged properties of eastern (yellow) and western (pink) IC core on entry to the DCA. When entering the DCA, both cores remain more buoyant compared to the average mixed-layer properties (Fig. 6a) and therefore contribute to the restratification.
To clarify the contribution from temperature and salinity in terms of buoyancy, we show the probability density distribution for density, salinity and temperature for both the eastern (yellow) and the western (blue) IC core (Fig. 6d–f). Notably, we find that in this model simulation more than 95 % of the particles reaching the DCA within six months arrive in the upper 1500 m and hence enter the part of the water column relevant for convection in winter (see DCA MLD definition in Figs. 2c and 3d). When entering the DCA, both cores have a similar density of ∼27.63 kg m−3 that is slightly lighter than the mixed-layer average properties of the DCA (dashed line, Fig. 6d). The higher (lower) salinity in the eastern (western) core is compensated for higher (lower) temperatures (Fig. 6e and f). Particles sourced from both cores share strikingly similar densities on arrival into the DCA. So, when only considering density of both cores, they could have a similar impact on the DCA. But as more particles enter the DCA from the western core (65 %), the western core has greater potential to impact on restratification. Due to the large changes in properties on approach to the DCA, the eastern core (Fig. 6b) is likely to have a stronger impact on the stratification outside of the DCA than the western core (Fig. 6c). We want to note here again that this simulation has a slight bias related to the correct representation of the overflow waters. Especially in the convection region, this could have an impact on the whole water column and therefore impact the mean DCA properties (green dot Fig. 6). This should be kept in mind when interpreting the results.
To summarize, within six months around one quarter of the particles released at the OSNAP IC moorings reach the DCA, mostly from the western core. As they are more buoyant than the average DCA properties during convection, the warm and saline IC waters can contribute to the stratification in the eastern Irminger Sea and to restratification in the DCA.
Due to the significant role of deep convection in the Irminger Sea, understanding the cycle of convection and restratification is important in a broader overturning context. In this study, we investigated the IC's potential contribution to restratification in the Irminger Sea. To do so, we evaluated the forward-in-time trajectories of Lagrangian particles released in the upper 1500 m of the IC at the OSNAP IC moorings in a high-resolution (up to 2 km) regional ocean model.
As a summary of our results, Fig. 7 shows the percentages and summed volume transports of the particles in each category. From the 108 030 (100 %, 22.2 Sv on average) particles released, a small number leaves the Irminger Sea through DS (0.2 %) and to the IB (1 %). Within the 6-month advection period, the overwhelming majority of particles (∼99 %) circulated within the Irminger Sea where they can be divided into two main groups based on their circulation pattern. While 39 % (8.9 Sv on average) of all particles released at the OSNAP IC moorings follow the boundary current circulation, 60 % (13.4 Sv on average) enter the interior Irminger Sea. Approximately 44 % of these interior particles reach the DCA (26 % of all particles released, 5.9 Sv on average) with a potential to add to the restratification there, and the other half (34 %, 8.6 Sv) reach the interior but remain outside of the DCA (non-DCA), likely restricting convective potential there. Of those entering the DCA, 4.0 Sv originate from the western IC core (65 % of all DCA particles). As waters sourced from both cores have similar densities upon entering the DCA, the western IC core has a greater potential to restratify the DCA.
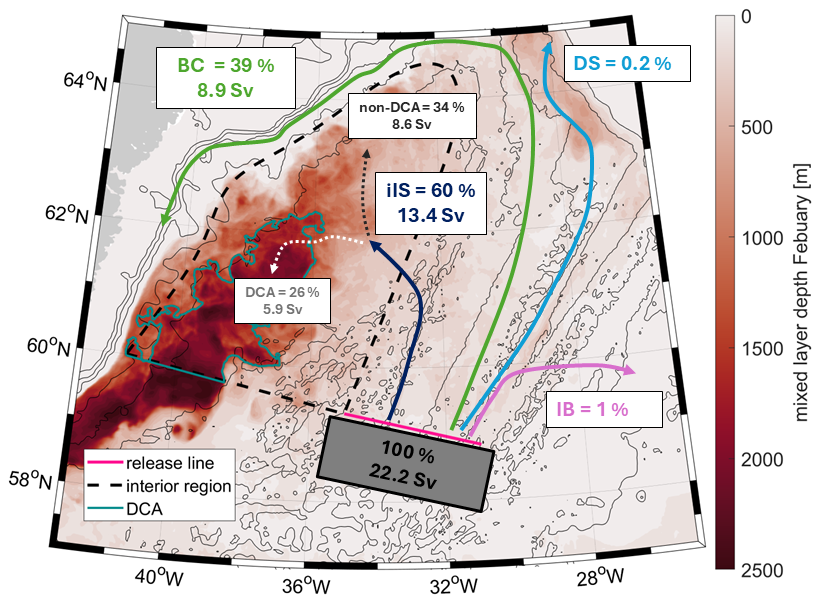
Figure 7Schematic showing the percentages and volume transports of the particle classification in various categories; Denmark Strait (DS) particles leave the Irminger Sea through Denmark Strait, Iceland Basin (IB) particles spend more than 40 d in the Iceland Basin, Boundary Current (BC) particles follow the cyclonic boundary current and never enter the defined interior Irminger Sea region and Interior particles do enter the interior Irminger Sea. A second selection step further subdivides these interior Irminger Sea particles into those entering the Deep Convection Area (DCA, compare Figs. 2c and 4) and those staying outside of the defined DCA (non-DCA). Note that these volume transports represent the time-mean absolute volume transport released within six months across the OSNAP IC section. In the background, the February mixed layer depth (shading), model bathymetry (grey contours) and the 1500 m-contour line of the mixed layer depth (thick turquoise line). The pink line marks the particle release line along the OSNAP IC mooring array for reference.
This study further shows that particles released at the OSNAP IC moorings do primarily circulate within the Irminger Sea during the 6-month advection period considered. As we do not find a high number of particles exiting through Denmark Strait in this simulation (<1 %), waters feeding the North Icelandic Irminger Current (e.g., Jónsson and Valdimarsson, 2012) likely originate from another source region. Possibly, these are waters from the Iceland Basin that enter the Irminger Sea north of the chosen release location (Koman et al., 2020). A study adopting a different seeding strategy, for example releasing particles along the Reykjanes Ridge or backtracking from the North Icelandic Irminger Current, could further explore this.
We found enhanced EKE along the entire western side of the Reykjanes Ridge, around the western IC core and the whole northeastern part of the interior region (Fig. 2b). The particle tracks entering the interior and the DCA also revealed strongly eddying features, in line with this enhanced EKE (see example tracks Fig. 4). It appears that in this simulation, in contrast to the mean flow, the instantaneous flow is directed westward regularly. Potentially this flow is caused by mesoscale variability, probably eddies that are shed off the IC's western core, and results in a high number of particles entering the DCA from the east. To support this, we additionally show two example monthly velocity fields (September, Fig. 8a; May, Fig. 8b) together with the related SSH. Those two maps show increased SSH together with anticyclonic circulations that resemble eddies in between the IC and the DCA. Those eddies appear throughout the year (not shown) and could be the mechanism to bring waters from the IC towards the DCA as already proposed by earlier studies (e.g., Sterl and De Jong, 2022). Those anticyclonic eddies could bring warm water in the center of the eddy (elevated SSH in the center, Fig. 8) towards the DCA. So, the instantaneous flow field that is impacted by mesoscale variability is the likely mechanism to bring water from the IC towards the interior Irminger Sea and the DCA. Enhanced EKE in the eastern Irminger Sea has already been reported by observational studies (Fan et al., 2013; Volkov, 2005) and has been proposed as a mechanism to bring buoyant boundary current water to the deep convection area in the Irminger Sea (Sterl and De Jong, 2022). Especially along the OSNAP East line, a recent study using mooring data from the IC array showed that the intensity and location of the western IC core is influenced by mesoscale eddies (Fried and De Jong, 2022). Our study strengthens the argument of mesoscale variability being a driver to bring boundary current waters into the DCA.
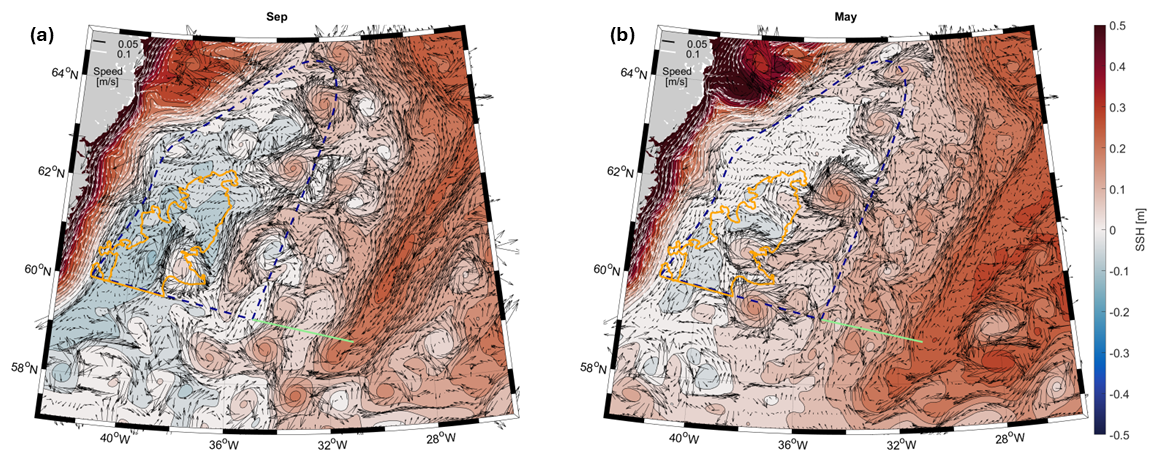
Figure 8Eddy activity in the Irminger Sea from the MITgcm model simulation. Monthly mean sea surface height (SSH, shading) with overlaid one year-averaged circulation over the upper 1500 m (arrows) from the model simulation for (a) September and (b) May. Velocities smaller than 0.1 m s−1 are indicated by black arrows, larger velocities by white arrows; we only plot every 8th latitudinal grid point and every 4th longitudinal grid point for clarity. In all subpanels the green line marks the release line, the dashed line the interior region and the orange line the DCA.
We found that the IC likely contributes to restratification in both the eastern interior Irminger Sea and the DCA. This is because, although particles lose buoyancy on leaving the boundary current, they reach the DCA lighter than the average February properties of the convection area and hence represent a source of buoyancy for the upper water column. Using a high-resolution ocean ice-model, Paquin et al. (2016) showed that convection in the Irminger Sea is mainly driven by atmospheric forcing (especially by Greenland tip jets) but to a second order by preconditioning of the water column. In their simulation, this preconditioning is in turn strongly linked to the restratification after deep convection the previous year(s). Paquin et al. (2016) further find a strong interannual variations in the density structure of the gyre which seems to be wind-driven but also to a large degree impacted by the lateral buoyancy fluxes due to mesoscale activity. This agrees with our results that showed that likely mesoscale activity brings buoyant IC water into the convection area. Our findings are also in line with several studies focussing on restratification and convection in the Labrador Sea (Böning et al., 2016; Gelderloos et al., 2011; Georgiou et al., 2019; Katsman et al., 2004). Those studies find that buoyancy fluxes by mesoscale eddies limit the area of deep convection in the Labrador Sea to the southwestern part of the central basin and that deep convection is therefore strongest in the area that is less easily reached by eddies combined with strong atmospheric forcing. We showed that in the Irminger Sea water from the OSNAP IC moorings added to the stratification in the eastern part of the basin, which likely limits the size of deep convection area in the western part of the basin like in the Labrador Sea.
The connection between light boundary current waters transported by the IC towards the DCA is especially interesting in the context of freshwater anomalies that could reach the DCA via the IC. The most recent freshwater anomaly (Holliday et al., 2020) that arrived in the eastern core of the IC in late 2016 decreased the salinity of the IC by 0.06 g kg−1 over a large part of the water column (Fried et al., 2024a). In addition, the IC does not only show a variability related to water mass properties but also exhibits a strong interannual transport variability that is related to changes in the basin wide density gradient (Fried and De Jong, 2022). As about one quarter of the IC waters reach the DCA, variability in the IC water properties and strength could therefore impact the restratification in the Irminger Sea.
Our results are based on one model year spanning the period from September 2007 to August 2008. The deep mixed layers that the model simulated for the winter 2007–2008 in the Irminger Sea are consistent with observations (De Jong et al., 2012). It is very likely that the IC's strong connectivity to the DCA holds when using a different model year or a longer time series, but it remains to be shown how variable this relationship is and thus how robust the presented numbers are over time (Fig. 7). But as restratification in the Irminger Sea always occurs in late spring even during years with weaker convection (Nelson et al., 2024; Sterl and De Jong, 2022), the connection between the IC and the DCA will also likely occur every year. Still, the variability in the IC, in both transport and hydrographic properties (Fried et al., 2024a; Fried and De Jong, 2022), will have an impact on how much the IC impacts the restratification in the DCA.
To conclude, this study has shown that waters from the OSNAP IC moorings mainly follow the eastern IC core cyclonically around the interior Irminger Sea, and the western IC core towards the interior Irminger Sea and the DCA. On their way towards the DCA the IC waters stratify the eastern Irminger Sea, thus limiting the area and depth of convection in the Irminger Sea to the western part of the basin. Therefore, future changes in the water mass properties advected by the IC in a warming climate have the potential to substantially influence the strength of deep convection in the Irminger Sea.
The MITgcm numerical model simulation used in this study can be accessed via the SciServer (https://sciserver.org/, last access: 16 September 2025), developed by the Institute for Data Intensive Engineering and Science at the Johns Hopkins University. Instructions for accessing the datasets can be found at: https://oceanspy.readthedocs.io/en/latest/datasets.html (last access: 16 September 2025). The Lagrangian particles tracks are published under https://doi.org/10.5281/zenodo.20154901 (Gelderloos, 2026).
The analysis of Lagrangian trajectories was performed using the Lagrangian Trajectories Toolbox, an open-source Python library developed by Tooth (2025, https://doi.org/10.5281/zenodo.15838857).
NF, MFdJ and CAK conceptualized the analysis. NF, RG and OJT designed the methodology and performed the analysis. NF wrote the manuscript, with advice and critical feedback from all authors. All authors discussed the results and finalized the paper.
The contact author has declared that none of the authors has any competing interests.
Publisher's note: Copernicus Publications remains neutral with regard to jurisdictional claims made in the text, published maps, institutional affiliations, or any other geographical representation in this paper. The authors bear the ultimate responsibility for providing appropriate place names. Views expressed in the text are those of the authors and do not necessarily reflect the views of the publisher.
. We thank the two anonymous reviewers for their constructive comments that improved the clarity of the manuscript.
This project was funded by the European Union seventh Framework Program (FP7 2007–2013) under Grant 308299 (NACLIM), Horizon 2020 Research and Innovation Program under Grant 727852 (Blue-Action), the Innovational Research Incentives Scheme of the Netherlands Organization for Scientific Research (NWO) under Grant 016.Vidi.189.130, and the Royal Netherlands Institute for Sea Research. Renske Gelderloos was partially supported by the US National Science Foundation under Grant OCE-2148838. Oliver J. Tooth is grateful for the financial support of the UK Natural Environment Research Council (grant no. NE/S007474/1).
This paper was edited by Karen J. Heywood and reviewed by two anonymous referees.
Almansi, M. and Gelderloos, R.: OceanSpy: A Python package to facilitate ocean model data analysis and visualization, J. Open Source Softw., 4, https://doi.org/10.21105/joss.01491, 2019.
Almansi, M., Haine, T. W. N., Pickart, R. S., Magaldi, M. G., Gelderloos, R., and Mastropole, D.: High-Frequency Variability in the Circulation and Hydrography of the Denmark Strait Overflow from a High-Resolution Numerical Model, J. Phys. Oceanogr., 47, 2999–3013, https://doi.org/10.1175/JPO-D-17-0129.1, 2017.
Almansi, M., Haine, T. W. N., Gelderloos, R., and Pickart, R. S.: Evolution of Denmark Strait Overflow Cyclones and Their Relationship to Overflow Surges, Geophys. Res. Lett., 47, e2019GL086759, https://doi.org/10.1029/2019GL086759, 2020.
Böning, C. W., Behrens, E., Biastoch, A., Getzlaff, K., and Bamber, J. L.: Emerging impact of Greenland meltwater on deepwater formation in the North Atlantic Ocean, Nat. Geosci., 9, 523–527, https://doi.org/10.1038/ngeo2740, 2016.
Bromwich, D. H., Wilson, A. B., Bai, L., Liu, Z., Barlage, M., Shih, C.-F., Maldonado, S., Hines, K. M., Wang, S.-H., Woollen, J., Kuo, B., Lin, H.-C., Wee, T.-K., Serreze, M. C., and Walsh, J. E.: The Arctic System Reanalysis, Version 2, B. Am. Meteorol. Soc., 99, 805–828, https://doi.org/10.1175/BAMS-D-16-0215.1, 2018.
Chafik, L. and Holliday, N. P.: Rapid Communication of Upper-Ocean Salinity Anomaly to Deep Waters of the Iceland Basin Indicates an AMOC Short-Cut, Geophys. Res. Lett., 49, e2021GL097570, https://doi.org/10.1029/2021GL097570, 2022.
Cuny, J., Rhines, P. B., Niiler, P. P., and Bacon, S.: Labrador Sea Boundary Currents and the Fate of the Irminger Sea Water, J. Phys. Oceanogr., 32, 627–647, https://doi.org/10.1175/1520-0485(2002)032<0627:LSBCAT>2.0.CO;2, 2002.
Daniault, N., Mercier, H., Lherminier, P., Sarafanov, A., Falina, A., Zunino, P., Pérez, F. F., Ríos, A. F., Ferron, B., Huck, T., Thierry, V., and Gladyshev, S.: The northern North Atlantic Ocean mean circulation in the early 21st century, Prog. Oceanogr., 146, 142–158, https://doi.org/10.1016/j.pocean.2016.06.007, 2016.
De Boyer Montégut, C., Madec, G., Fischer, A. S., Lazar, A., and Iudicone, D.: Mixed layer depth over the global ocean: An examination of profile data and a profile-based climatology, J. Geophys. Res.-Oceans, 109, 2004JC002378, https://doi.org/10.1029/2004JC002378, 2004.
De Jong, M. F. and De Steur, L.: Strong winter cooling over the Irminger Sea in winter 2014–2015, exceptional deep convection, and the emergence of anomalously low SST, Geophys. Res. Lett., 43, 7106–7113, https://doi.org/10.1002/2016GL069596, 2016.
De Jong, M. F., Van Aken, H. M., Våge, K., and Pickart, R. S.: Convective mixing in the central Irminger Sea: 2002–2010, Deep-Sea Res. Pt. I, 63, 36–51, https://doi.org/10.1016/j.dsr.2012.01.003, 2012.
De Jong, M. F., Bower, A. S., and Furey, H. H.: Two Years of Observations of Warm-Core Anticyclones in the Labrador Sea and Their Seasonal Cycle in Heat and Salt Stratification, J. Phys. Oceanogr., 44, 427–444, https://doi.org/10.1175/JPO-D-13-070.1, 2014.
De Jong, M. F., Oltmanns, M., Karstensen, J., and De Steur, L.: Deep Convection in the Irminger Sea Observed with a Dense Mooring Array, Oceanography, 31, 50–59, https://doi.org/10.5670/oceanog.2018.109, 2018.
De Jong, M. F., De Steur, L., Fried, N., Bol, R., and Kritsotalakis, S.: Year-Round Measurements of the Irminger Current: Variability of a Two-Core Current System Observed in 2014–2016, J. Geophys. Res.-Oceans, 125, e2020JC016193, https://doi.org/10.1029/2020JC016193, 2020.
De Jong, M. F., Fogaren, K. E., Le Bras, I., McRaven, L., and Palevsky, H. I.: Atmospheric Forcing Dominates the Interannual Variability of Convection Strength in the Irminger Sea, J. Geophys. Res.-Oceans, 130, e2023JC020799, https://doi.org/10.1029/2023JC020799, 2025.
Dickson, R. R. and Brown, J.: The production of North Atlantic Deep Water: Sources, rates, and pathways, J. Geophys. Res.-Oceans, 99, 12319–12341, https://doi.org/10.1029/94JC00530, 1994.
Duyck, E. and De Jong, M. F.: Circulation Over the South-East Greenland Shelf and Potential for Liquid Freshwater Export: A Drifter Study, Geophys. Res. Lett., 48, e2020JB020886, https://doi.org/10.1029/2020GL091948, 2021.
Fan, X., Send, U., Testor, P., Karstensen, J., and Lherminier, P.: Observations of Irminger Sea Anticyclonic Eddies, J. Phys. Oceanogr., 43, 805–823, https://doi.org/10.1175/JPO-D-11-0155.1, 2013.
Fogelqvist, E., Blindheim, J., Tanhua, T., Østerhus, S., Buch, E., and Rey, F.: Greenland–Scotland overflow studied by hydro-chemical multivariate analysis, Deep-Sea Res. Pt. I, 50, 73–102, https://doi.org/10.1016/S0967-0637(02)00131-0, 2003.
Foukal, N. P., Gelderloos, R., and Pickart, R. S.: A continuous pathway for fresh water along the East Greenland shelf, Sci. Adv., 6, eabc4254, https://doi.org/10.1126/sciadv.abc4254, 2020.
Fox, A. D., Handmann, P., Schmidt, C., Fraser, N., Rühs, S., Sanchez-Franks, A., Martin, T., Oltmanns, M., Johnson, C., Rath, W., Holliday, N. P., Biastoch, A., Cunningham, S. A., and Yashayaev, I.: Exceptional freshening and cooling in the eastern subpolar North Atlantic caused by reduced Labrador Sea surface heat loss, Ocean Sci., 18, 1507–1533, https://doi.org/10.5194/os-18-1507-2022, 2022.
Fried, N. and De Jong, M. F.: The Role of the Irminger Current in the Irminger Sea Northward Transport Variability, J. Geophys. Res.-Oceans, 127, e2021JC018188, https://doi.org/10.1029/2021JC018188, 2022.
Fried, N., Biló, T. C., Johns, W. E., Katsman, C. A., Fogaren, K. E., Yoder, M., Palevsky, H. I., Straneo, F., and De Jong, M. F.: Recent Freshening of the Subpolar North Atlantic Increased the Transport of Lighter Waters of the Irminger Current From 2014 to 2022, J. Geophys. Res.-Oceans, 129, e2024JC021184, https://doi.org/10.1029/2024JC021184, 2024a.
Fried, N., Katsman, C. A., and De Jong, M. F.: Where do the Two Cores of the Irminger Current Come From? A Lagrangian Study Using a ° Ocean Model Simulation, J. Geophys. Res.-Oceans, 129, e2023JC020713, https://doi.org/10.1029/2023JC020713, 2024b.
Fröb, F., Olsen, A., Våge, K., Moore, G. W. K., Yashayaev, I., Jeansson, E., and Rajasakaren, B.: Irminger Sea deep convection injects oxygen and anthropogenic carbon to the ocean interior, Nat. Commun., 7, 13244, https://doi.org/10.1038/ncomms13244, 2016.
Fröb, F., Olsen, A., Pérez, F. F., García-Ibáñez, M. I., Jeansson, E., Omar, A., and Lauvset, S. K.: Inorganic carbon and water masses in the Irminger Sea since 1991, Biogeosciences, 15, 51–72, https://doi.org/10.5194/bg-15-51-2018, 2018.
Fröhle, J., Handmann, P. V. K., and Biastoch, A.: Major sources of North Atlantic Deep Water in the subpolar North Atlantic from Lagrangian analyses in an eddy-rich ocean model, Ocean Sci., 18, 1431–1450, https://doi.org/10.5194/os-18-1431-2022, 2022.
Fu, Y., Lozier, M. S., Biló, T. C., Bower, A. S., Cunningham, S. A., Cyr, F., De Jong, M. F., deYoung, B., Drysdale, L., Fraser, N., Fried, N., Furey, H. H., Han, G., Handmann, P., Holliday, N. P., Holte, J., Inall, M. E., Johns, W. E., Jones, S., Karstensen, J., Li, F., Pacini, A., Pickart, R. S., Rayner, D., Straneo, F., and Yashayaev, I.: Seasonality of the Meridional Overturning Circulation in the subpolar North Atlantic, Commun. Earth Environ., 4, 181, https://doi.org/10.1038/s43247-023-00848-9, 2023.
Gelderloos, R.: Lagrangian Particle tracks in the Irminger Sea [Data set], Zenodo [data set], https://doi.org/10.5281/zenodo.20154901, 2026.
Gelderloos, R., Katsman, C. A., and Drijfhout, S. S.: Assessing the Roles of Three Eddy Types in Restratifying the Labrador Sea after Deep Convection, J. Phys. Oceanogr., 41, 2102–2119, https://doi.org/10.1175/JPO-D-11-054.1, 2011.
Gelderloos, R., Straneo, F., and Katsman, C. A.: Mechanisms behind the Temporary Shutdown of Deep Convection in the Labrador Sea: Lessons from the Great Salinity Anomaly Years 1968–71, J. Climate, 25, 6743–6755, https://doi.org/10.1175/JCLI-D-11-00549.1, 2012.
Gelderloos, R., Szalay, A. S., Haine, T. W. N., and Lemson, G.: A fast algorithm for neutrally-buoyant Lagrangian particles in numerical ocean modeling, in: 2016 IEEE 12th International Conference on e-Science (e-Science), 381–388, https://doi.org/10.1109/eScience.2016.7870923, 2016.
Gelderloos, R., Haine, T. W. N., Koszalka, I. M., and Magaldi, M. G.: Seasonal Variability in Warm-Water Inflow toward Kangerdlugssuaq Fjord, J. Phys. Oceanogr., 47, 1685–1699, https://doi.org/10.1175/JPO-D-16-0202.1, 2017.
Gelderloos, R., Haine, T. W. N., and Almansi, M.: Coastal Trapped Waves and Other Subinertial Variability along the Southeast Greenland Coast in a Realistic Numerical Simulation, J. Phys. Oceanogr., 51, 861–877, https://doi.org/10.1175/JPO-D-20-0239.1, 2021.
Georgiou, S., Van Der Boog, C. G., Brüggemann, N., Ypma, S. L., Pietrzak, J. D., and Katsman, C. A.: On the interplay between downwelling, deep convection and mesoscale eddies in the Labrador Sea, Ocean Model., 135, 56–70, https://doi.org/10.1016/j.ocemod.2019.02.004, 2019.
Haine, T. W. N.: High-frequency fluctuations in Denmark Strait transport, Geophys. Res. Lett., 37, 2010GL043272, https://doi.org/10.1029/2010GL043272, 2010.
Hallberg, R.: Using a resolution function to regulate parameterizations of oceanic mesoscale eddy effects, Ocean Model., 72, 92–103, https://doi.org/10.1016/j.ocemod.2013.08.007, 2013.
Hátún, H., Eriksen, C. C., and Rhines, P. B.: Buoyant Eddies Entering the Labrador Sea Observed with Gliders and Altimetry, J. Phys. Oceanogr., 37, 2838–2854, https://doi.org/10.1175/2007JPO3567.1, 2007.
Håvik, L., Almansi, M., Våge, K., and Haine, T. W. N.: Atlantic-Origin Overflow Water in the East Greenland Current, J. Phys. Oceanogr., 49, 2255–2269, https://doi.org/10.1175/JPO-D-18-0216.1, 2019.
Holliday, N. P., Bersch, M., Berx, B., Chafik, L., Cunningham, S., Florindo-López, C., Hátún, H., Johns, W., Josey, S. A., Larsen, K. M. H., Mulet, S., Oltmanns, M., Reverdin, G., Rossby, T., Thierry, V., Valdimarsson, H., and Yashayaev, I.: Ocean circulation causes the largest freshening event for 120 years in eastern subpolar North Atlantic, Nat. Commun., 11, 585, https://doi.org/10.1038/s41467-020-14474-y, 2020.
Jones, H. and Marshall, J.: Restratification after Deep Convection, J. Phys. Oceanogr., 27, 2276–2287, https://doi.org/10.1175/1520-0485(1997)027<2276:RADC>2.0.CO;2, 1997.
Jónsson, S. and Valdimarsson, H.: Water mass transport variability to the North Icelandic shelf, 1994–2010, ICES J. Mar. Sci., 69, 809–815, https://doi.org/10.1093/icesjms/fss024, 2012.
Katsman, C. A., Spall, M. A., and Pickart, R. S.: Boundary Current Eddies and Their Role in the Restratification of the Labrador Sea, J. Phys. Oceanogr., 34, 1967–1983, https://doi.org/10.1175/1520-0485(2004)034<1967:BCEATR>2.0.CO;2, 2004.
Kawasaki, T. and Hasumi, H.: Effect of freshwater from the West Greenland Current on the winter deep convection in the Labrador Sea, Ocean Model., 75, 51–64, https://doi.org/10.1016/j.ocemod.2014.01.003, 2014.
Koman, G., Johns, W. E., and Houk, A.: Transport and Evolution of the East Reykjanes Ridge Current, J. Geophys. Res.-Oceans, 125, e2020JC016377, https://doi.org/10.1029/2020JC016377, 2020.
Koszalka, I. M., Haine, T. W. N., and Magaldi, M. G.: Fates and Travel Times of Denmark Strait Overflow Water in the Irminger Basin, J. Phys. Oceanogr., 43, 2611–2628, https://doi.org/10.1175/JPO-D-13-023.1, 2013.
Lavender, K. L., Davis, R. E., and Owens, W. B.: Mid-depth recirculation observed in the interior Labrador and Irminger seas by direct velocity measurements, Nature, 407, 66–69, https://doi.org/10.1038/35024048, 2000.
Le Bras, I. A., Straneo, F., Holte, J., and Holliday, N. P.: Seasonality of Freshwater in the East Greenland Current System From 2014 to 2016, J. Geophys. Res.-Oceans, 123, 8828–8848, https://doi.org/10.1029/2018JC014511, 2018.
Le Bras, I. A.-A., Callies, J., Straneo, F., Biló, T. C., Holte, J., and Johnson, H. L.: Slantwise Convection in the Irminger Sea, J. Geophys. Res.-Oceans, 127, e2022JC019071, https://doi.org/10.1029/2022JC019071, 2022.
Li, F., Lozier, M. S., and Johns, W. E.: Calculating the Meridional Volume, Heat, and Freshwater Transports from an Observing System in the Subpolar North Atlantic: Observing System Simulation Experiment, J. Atmos. Ocean. Tech., 34, 1483–1500, https://doi.org/10.1175/JTECH-D-16-0247.1, 2017.
Li, F., Lozier, M. S., Bacon, S., Bower, A. S., Cunningham, S. A., De Jong, M. F., deYoung, B., Fraser, N., Fried, N., Han, G., Holliday, N. P., Holte, J., Houpert, L., Inall, M. E., Johns, W. E., Jones, S., Johnson, C., Karstensen, J., Le Bras, I. A., Lherminier, P., Lin, X., Mercier, H., Oltmanns, M., Pacini, A., Petit, T., Pickart, R. S., Rayner, D., Straneo, F., Thierry, V., Visbeck, M., Yashayaev, I., and Zhou, C.: Subpolar North Atlantic western boundary density anomalies and the Meridional Overturning Circulation, Nat. Commun., 12, 3002, https://doi.org/10.1038/s41467-021-23350-2, 2021.
Lilly, J. M., Rhines, P. B., Visbeck, M., Davis, R., Lazier, J. R. N., Schott, F., and Farmer, D.: Observing Deep Convection in the Labrador Sea during Winter 1994/95, J. Phys. Oceanogr., 29, 2065–2098, https://doi.org/10.1175/1520-0485(1999)029<2065:ODCITL>2.0.CO;2, 1999.
Lozier, M. S., Bacon, S., Bower, A. S., Cunningham, S. A., De Jong, M. F., De Steur, L., deYoung, B., Fischer, J., Gary, S. F., Greenan, B. J. W., Heimbach, P., Holliday, N. P., Houpert, L., Inall, M. E., Johns, W. E., Johnson, H. L., Karstensen, J., Li, F., Lin, X., Mackay, N., Marshall, D. P., Mercier, H., Myers, P. G., Pickart, R. S., Pillar, H. R., Straneo, F., Thierry, V., Weller, R. A., Williams, R. G., Wilson, C., Yang, J., Zhao, J., and Zika, J. D.: Overturning in the Subpolar North Atlantic Program: A New International Ocean Observing System, B. Am. Meteorol. Soc., 98, 737–752, https://doi.org/10.1175/BAMS-D-16-0057.1, 2017.
Lozier, M. S., Li, F., Bacon, S., Bahr, F., Bower, A. S., Cunningham, S. A., De Jong, M. F., De Steur, L., deYoung, B., Fischer, J., Gary, S. F., Greenan, B. J. W., Holliday, N. P., Houk, A., Houpert, L., Inall, M. E., Johns, W. E., Johnson, H. L., Johnson, C., Karstensen, J., Koman, G., Le Bras, I. A., Lin, X., Mackay, N., Marshall, D. P., Mercier, H., Oltmanns, M., Pickart, R. S., Ramsey, A. L., Rayner, D., Straneo, F., Thierry, V., Torres, D. J., Williams, R. G., Wilson, C., Yang, J., Yashayaev, I., and Zhao, J.: A sea change in our view of overturning in the subpolar North Atlantic, Science, 363, 516–521, https://doi.org/10.1126/science.aau6592, 2019.
Magaldi, M. G., Haine, T. W. N., and Pickart, R. S.: On the Nature and Variability of the East Greenland Spill Jet: A Case Study in Summer 2003, J. Phys. Oceanogr., 41, 2307–2327, https://doi.org/10.1175/JPO-D-10-05004.1, 2011.
Marshall, J. and Schott, F.: Open-ocean convection: Observations, theory, and models, Rev. Geophys., 37, 1–64, https://doi.org/10.1029/98RG02739, 1999.
Marshall, J., Adcroft, A., Hill, C., Perelman, L., and Heisey, C.: A finite-volume, incompressible Navier Stokes model for studies of the ocean on parallel computers, J. Geophys. Res.-Oceans, 102, 5753–5766, https://doi.org/10.1029/96JC02775, 1997.
Medvedev, D., Lemson, G., and Rippin, M.: SciServer Compute: Bringing Analysis Close to the Data, in: Proceedings of the 28th International Conference on Scientific and Statistical Database Management, SSDBM '16, 1–4, https://doi.org/10.1145/2949689.2949700, 2016.
Megann, A., Blaker, A., Josey, S., New, A., and Sinha, B.: Mechanisms for Late 20th and Early 21st Century Decadal AMOC Variability, J. Geophys. Res.-Oceans, 126, e2021JC017865, https://doi.org/10.1029/2021JC017865, 2021.
Nansen, F.: Das Bodenwasser und die Abkühlung des Meeres. Mit 12 Abbildungen im Text, Int. Rev. Ges. Hydrobiol. Hydrogr., 5, 1–42, https://doi.org/10.1002/iroh.19120050102, 1912.
Nelson, M., Straneo, F., Purkey, S. G., and De Jong, M. F.: Delayed Recovery of the Irminger Interior From Cooling in 2015 Due To Widespread Buoyancy Loss and Suppressed Restratification, Geophys. Res. Lett., 51, e2023GL106501, https://doi.org/10.1029/2023GL106501, 2024.
Paquin, J.-P., Lu, Y., Higginson, S., Dupont, F., and Garric, G.: Modelled Variations of Deep Convection in the Irminger Sea during 2003–10, J. Phys. Oceanogr., 46, 179–196, https://doi.org/10.1175/JPO-D-15-0078.1, 2016.
Perez, F. F., Fontela, M., García-Ibáñez, M. I., Mercier, H., Velo, A., Lherminier, P., Zunino, P., De La Paz, M., Alonso-Pérez, F., Guallart, E. F., and Padin, X. A.: Meridional overturning circulation conveys fast acidification to the deep Atlantic Ocean, Nature, 554, 515–518, https://doi.org/10.1038/nature25493, 2018.
Petit, T., Lozier, M. S., Josey, S. A., and Cunningham, S. A.: Atlantic Deep Water Formation Occurs Primarily in the Iceland Basin and Irminger Sea by Local Buoyancy Forcing, Geophys. Res. Lett., 47, e2020GL091028, https://doi.org/10.1029/2020GL091028, 2020.
Pickart, R. S. and Spall, M. A.: Impact of Labrador Sea Convection on the North Atlantic Meridional Overturning Circulation, J. Phys. Oceanogr., 37, 2207–2227, https://doi.org/10.1175/JPO3178.1, 2007.
Pickart, R. S., Spall, M. A., Ribergaard, M. H., Moore, G. W. K., and Milliff, R. F.: Deep convection in the Irminger Sea forced by the Greenland tip jet, Nature, 424, 152–156, https://doi.org/10.1038/nature01729, 2003.
Pickart, R. S., Torres, D. J., and Fratantoni, P. S.: The East Greenland Spill Jet, J. Phys. Oceanogr., 35, 1037–1053, https://doi.org/10.1175/JPO2734.1, 2005.
Pickart, R. S., Våge, K., Moore, G. W. K., Renfrew, I. A., Ribergaard, M. H., and Davies, H. C.: Convection in the Western North Atlantic Sub-Polar Gyre: Do Small-Scale Wind Events Matter?, in: Arctic–Subarctic Ocean Fluxes, edited by: Dickson, R. R., Meincke, J., and Rhines, P., Springer Netherlands, Dordrecht, 629–652, https://doi.org/10.1007/978-1-4020-6774-7_27, 2008.
Piron, A., Thierry, V., Mercier, H., and Caniaux, G.: Argo float observations of basin-scale deep convection in the Irminger sea during winter 2011–2012, Deep-Sea Res. Pt. I, 109, 76–90, https://doi.org/10.1016/j.dsr.2015.12.012, 2016.
Piron, A., Thierry, V., Mercier, H., and Caniaux, G.: Gyre-scale deep convection in the subpolar North Atlantic Ocean during winter 2014–2015, Geophys. Res. Lett., 44, 1439–1447, https://doi.org/10.1002/2016GL071895, 2017.
Rühs, S., Oliver, E. C. J., Biastoch, A., Böning, C. W., Dowd, M., Getzlaff, K., Martin, T., and Myers, P. G.: Changing Spatial Patterns of Deep Convection in the Subpolar North Atlantic, J. Geophys. Res.-Oceans, 126, e2021JC017245, https://doi.org/10.1029/2021JC017245, 2021.
Saberi, A., Haine, T. W. N., Gelderloos, R., De Jong, M. F., Furey, H., and Bower, A.: Lagrangian Perspective on the Origins of Denmark Strait Overflow, J. Phys. Oceanogr., 50, 2393–2414, https://doi.org/10.1175/JPO-D-19-0210.1, 2020.
Sanchez-Franks, A., Holliday, N. P., Evans, D. G., Fried, N., Tooth, O., Chafik, L., Fu, Y., Li, F., De Jong, M. F., and Johnson, H. L.: The Irminger Gyre as a Key Driver of the Subpolar North Atlantic Overturning, Geophys. Res. Lett., 51, e2024GL108457, https://doi.org/10.1029/2024GL108457, 2024.
Schmidt, C., Schwarzkopf, F. U., Rühs, S., and Biastoch, A.: Characteristics and robustness of Agulhas leakage estimates: an inter-comparison study of Lagrangian methods, Ocean Sci., 17, 1067–1080, https://doi.org/10.5194/os-17-1067-2021, 2021.
Sterl, M. F. and De Jong, M. F.: Restratification Structure and Processes in the Irminger Sea, J. Geophys. Res.-Oceans, 127, e2022JC019126, https://doi.org/10.1029/2022JC019126, 2022.
Taghizadeh-Popp, M., Kim, J. W., Lemson, G., Medvedev, D., Raddick, M. J., Szalay, A. S., Thakar, A. R., Booker, J., Chhetri, C., Dobos, L., and Rippin, M.: SciServer: A science platform for astronomy and beyond, Astron. Comput., 33, 100412, https://doi.org/10.1016/j.ascom.2020.100412, 2020.
Tooth, O.: oj-tooth/lt_toolbox: v0.1.0 (v0.1), Zenodo [code], https://doi.org/10.5281/zenodo.15838857, 2025.
Tooth, O. J., Johnson, H. L., Wilson, C., and Evans, D. G.: Seasonal overturning variability in the eastern North Atlantic subpolar gyre: a Lagrangian perspective, Ocean Sci., 19, 769–791, https://doi.org/10.5194/os-19-769-2023, 2023.
Våge, K., Pickart, R. S., Sarafanov, A., Knutsen, Ø., Mercier, H., Lherminier, P., Van Aken, H. M., Meincke, J., Quadfasel, D., and Bacon, S.: The Irminger Gyre: Circulation, convection, and interannual variability, Deep-Sea Res. Pt. I, 58, 590–614, https://doi.org/10.1016/j.dsr.2011.03.001, 2011.
Volkov, D. L.: Interannual Variability of the Altimetry-Derived Eddy Field and Surface Circulation in the Extratropical North Atlantic Ocean in 1993–2001, J. Phys. Oceanogr., 35, 405–426, https://doi.org/10.1175/JPO2683.1, 2005.
Von Appen, W.-J., Koszalka, I. M., Pickart, R. S., Haine, T. W. N., Mastropole, D., Magaldi, M. G., Valdimarsson, H., Girton, J., Jochumsen, K., and Krahmann, G.: The East Greenland Spill Jet as an important component of the Atlantic Meridional Overturning Circulation, Deep-Sea Res. Pt. I, 92, 75–84, https://doi.org/10.1016/j.dsr.2014.06.002, 2014.
Yashayaev, I.: Hydrographic changes in the Labrador Sea, 1960–2005, Prog. Oceanogr., 73, 242–276, https://doi.org/10.1016/j.pocean.2007.04.015, 2007.
Zunino, P., Mercier, H., and Thierry, V.: Why did deep convection persist over four consecutive winters (2015–2018) southeast of Cape Farewell?, Ocean Sci., 16, 99–113, https://doi.org/10.5194/os-16-99-2020, 2020.
- Abstract
- Introduction
- Data and methods
- Pathways of the Irminger Current downstream from the OSNAP IC moorings
- On the impact of the IC on the deep convection area
- Discussion and conclusion
- Code and data availability
- Author contributions
- Competing interests
- Disclaimer
- Acknowledgements
- Financial support
- Review statement
- References
This study investigates how much warm and saline subtropical-origin water flowing in the Irminger Current (IC) can enter the Irminger Sea convection region by releasing virtual particles in an ocean model. We show that one quarter of IC waters enter the convection region with the potential to increase local stratification. Our results suggest that changes in the water mass properties of the IC have the potential to influence the strength of deep convection in the Irminger Sea.
This study investigates how much warm and saline subtropical-origin water flowing in the...
- Abstract
- Introduction
- Data and methods
- Pathways of the Irminger Current downstream from the OSNAP IC moorings
- On the impact of the IC on the deep convection area
- Discussion and conclusion
- Code and data availability
- Author contributions
- Competing interests
- Disclaimer
- Acknowledgements
- Financial support
- Review statement
- References