the Creative Commons Attribution 4.0 License.
the Creative Commons Attribution 4.0 License.
 | 29 Apr 2026
Transient tracer observations in the Gulf of St. Lawrence reveal shift from younger to older inflow waters
Toste Tanhua
William A. Nesbitt
Samuel W. Stevens
Douglas W. R. Wallace
The deep waters of the Gulf of St. Lawrence (GSL) have experienced a significant reduction in dissolved oxygen content during the past decades. One widely documented driver of this deoxygenation is a change in the composition of the deep inflowing water that ventilates the Gulf, which consists of a mixture of warmer, less-oxygenated North Atlantic Central Waters (NACW) and cooler, more-oxygenated Labrador Current Waters (LCW). While previous studies have inferred changes in this inflow from hydrographic and biogeochemical observations, direct constraints on deep-water ventilation timescales have been lacking.
Here, we present the first spatially-comprehensive measurements of transient tracers (SF6 and CFC-12) in the GSL, allowing direct estimates of tracer-derived mean ages and ventilation timescales throughout the deep layer. Mean ages increase systematically with density and exhibit a pronounced along-channel gradient, with younger waters (30–40 years) in the Lower St. Lawrence Estuary and older waters (50–60 years) toward Cabot Strait. This west-east increase in ventilation age is more gradual than corresponding changes in temperature and salinity, indicating that tracer-derived ages respond differently to variations in source water composition than hydrographic properties.
The observed gradual age structure is consistent with a greater influence of older, earlier ventilated NACW in the eastern Gulf, while younger ages inland reflect a continued contribution of LCW. These results demonstrate that, as of 2022, the shift toward longer deep-water ventilation timescales, and associated changes in inflow properties toward higher NACW composition, is ongoing rather than having reached a steady end state, contrary to earlier predictions.
- Article
(7564 KB) - Full-text XML
-
Supplement
(3481 KB) - BibTeX
- EndNote


Ocean ventilation is a physical process that involves the dynamic exchange of properties like heat and dissolved gases, including oxygen, between the atmosphere and the ocean's interior (Azetsu-Scott et al., 2005; Fine, 2011; Talley et al., 2016). It describes the transport of surface waters into the ocean interior, and vice-versa, a process commonly characterized using the concept of water-mass age, defined as the time since a water parcel was last in contact with the atmosphere. This process is, for example, important in transporting oxygen to deeper ocean layers and in shaping long-term properties of water masses in the interior. Ventilation studies often rely on measurements of transient tracers, such as sulfur hexafluoride (SF6) and chlorofluorocarbon-12 (CFC-12) to characterize the relevant time-scales. These are anthropogenic gases that are inert once dissolved in seawater and whose input can be characterized by known variations of concentrations in the atmosphere (e.g. Khatiwala et al., 2001; Stöven et al., 2015). SF6 and CFC-12 are particularly useful and widely applied in oceanography because their atmospheric history is well constrained; by measuring their concentration in seawater and comparing them to atmospheric input functions, it is possible to estimate how long water has been isolated from the atmosphere, i.e., its “ventilation age”. CFC-12 with its longer atmospheric history, is effective for tracing somewhat older water, while SF6 is more sensitive to recently ventilated waters. After surface water is shielded from the atmosphere by transport into the interior, abiotic transient tracer concentrations are affected only by interior mixing processes, since these compounds are stable in seawater under most conditions. The combined use of both tracers enables the resolution of water mass formation and mixing processes, which in turn support interpretation of circulation patterns and distribution of biogeochemical properties, such as oxygen. Ventilation has been well-studied in certain regions of the world's oceans using transient tracers, but remains largely unexplored in others, particularly in marginal seas such as the Gulf of St. Lawrence (GSL) where, to our knowledge, no CFC or SF6 samples have previously been collected.
Recently, the GSL region has garnered attention due to a significant decline in dissolved oxygen (DO) concentrations within the deep layer (e.g. Blais et al., 2024; Genovesi et al., 2011; Gilbert et al., 2005; Thibodeau et al., 2006), leaving a growing area persistently hypoxic, i.e. DO < 62.5 µmol L−1 (micromoles of O2 molecules present in 1 L of seawater) (Jutras et al., 2023b). Among other property changes, it was reported that the annual average of DO at 300 m depth in the Estuary of the Gulf dropped to 37 µmol L−1 in 2023 (12 % saturation) (Blais et al., 2024). This phenomenon has been observed increasingly in coastal zones worldwide during the past few decades (Diaz and Rosenberg, 2008; Gilbert et al., 2005), for example due to benthic respiration (Lehmann et al., 2009), upwelling of low-oxygen waters (Grantham et al., 2004), and long residence times in ocean channels enhancing hypoxia (Fennel and Testa, 2019). In the well-studied region at the head of the Lower St. Lawrence Estuary (LSLE), deep layer DO values decreased from 130 to 60 µmol L−1 between 1930 and 1984 where they then remained stable until about 2019. In 2020, concentrations rapidly decreased to an annual minimum of 35 µmol L−1 (Jutras et al., 2023b), with further, slight decrease observed in 2022 and 2023 by Blais et al. (2023, 2024), down to 34 µmol L−1. Based on extensive measurements in this region, the hypoxic zone was first documented in the LSLE (Gilbert et al., 2005), with two-thirds of the decrease in DO since 1930 being estimated to be caused by a change in the composition of the deep water masses entering the GSL from the North Atlantic, and the other third being due to eutrophication (Gilbert et al., 2005; Mucci et al., 2011). The oceanic inflow supplies the deep-water layers of the GSL with oxygen, and is known to consist of a mix of well-oxygenated Labrador Current Water (LCW) and less-oxygenated North Atlantic Central Water (NACW). Several studies, such as Gilbert et al. (2005) and Jutras et al. (2020), identified a shift in the composition of the deep-water inflow toward a larger fraction of NACW using physical and chemical parameters, as well as inverse methods such as water mass analysis.
Previous estimates of LCW and NACW fractions at Cabot Strait have shown considerable temporal variability. For instance, Gilbert et al. (2005) reported a shift from 72 % LCW and 28 % NACW in 1930 to 53 % LCW and 47 % NACW over the period of 1980 to 2003, consistent with earlier estimates from Bugden (1988) when using their definition of LCW, which incorporates temperature, salinity and oxygen characteristics. More recently studies have continued to document this evolution. Jutras et al. (2020) reported LCW fractions of less than 10 % on the σΘ = 27.3 kg m−3 isopycnal in 2017, and around 50 % at σΘ = 27.5 kg m−3, indicating a stronger LCW influence at greater depths. In Jutras et al. (2023b), LCW fractions at Cabot Strait were reported as 0 % in 2021, with only small LCW influence at intermediate depths (∼ 250 m) within the Laurentian Channel from a longitude of Anticosti Island to the LSLE. Together these studies suggest a progressive but variable transition toward increased NACW contribution over the past decades.
This study uses transient tracer measurements (SF6 and CFC-12) to quantify ventilation timescales in the GSL and to assess ongoing changes in the deep-water mass properties along the Laurentian Channel. Applying a transit time distribution (TTD) framework, we derive mean ages and examine their spatial variability alongside observed temperature and salinity patterns to evaluate evidence for the continued influence of LCW on the deep waters of the GSL (see Sect. 4.1).
We further explore how tracer-derived mean ages can be incorporated into, and add to, water-mass analysis approaches, including a linear fraction model and a two-inverse-Gaussian (2-IG) TTD framework, with particular emphasis on the sensitivity of such analyses to source water endmember selection, and assess the robustness of inferred water-mass fractions across a range of plausible endmember scenarios (see Sect. 4.2).
The St. Lawrence Estuary and Gulf is one of the largest semi-enclosed estuaries in the world and consists of three components: the Upper Estuary ranging from Île d'Orléans to Tadoussac, the LSLE spanning from Tadoussac to Pointe-des-Monts, and finally the GSL. The GSL is a large marginal sea (approximate area of 240 000 km2) located at the east coast of North America, and is connected to the Atlantic Ocean through Cabot Strait between Nova Scotia and Newfoundland in the southeast, and to the Newfoundland and Labrador Shelf via the Strait of Belle Isle in the northeast (see Fig. 1). Due to its depth, Cabot Strait is the main entry point for North Atlantic water, which enters as a deep inflow (Koutitonsky and Budgen, 1991).
The GSL includes itself three channels (slightly darker blue areas in Fig. 1), one south of Anticosti Island (Laurentian Channel), connecting the GSL to the Atlantic Ocean, one north of the Island (Anticosti Channel) and one channel toward the Strait of Belle Isle (Esquiman Channel), all bordering extensive shelf areas.
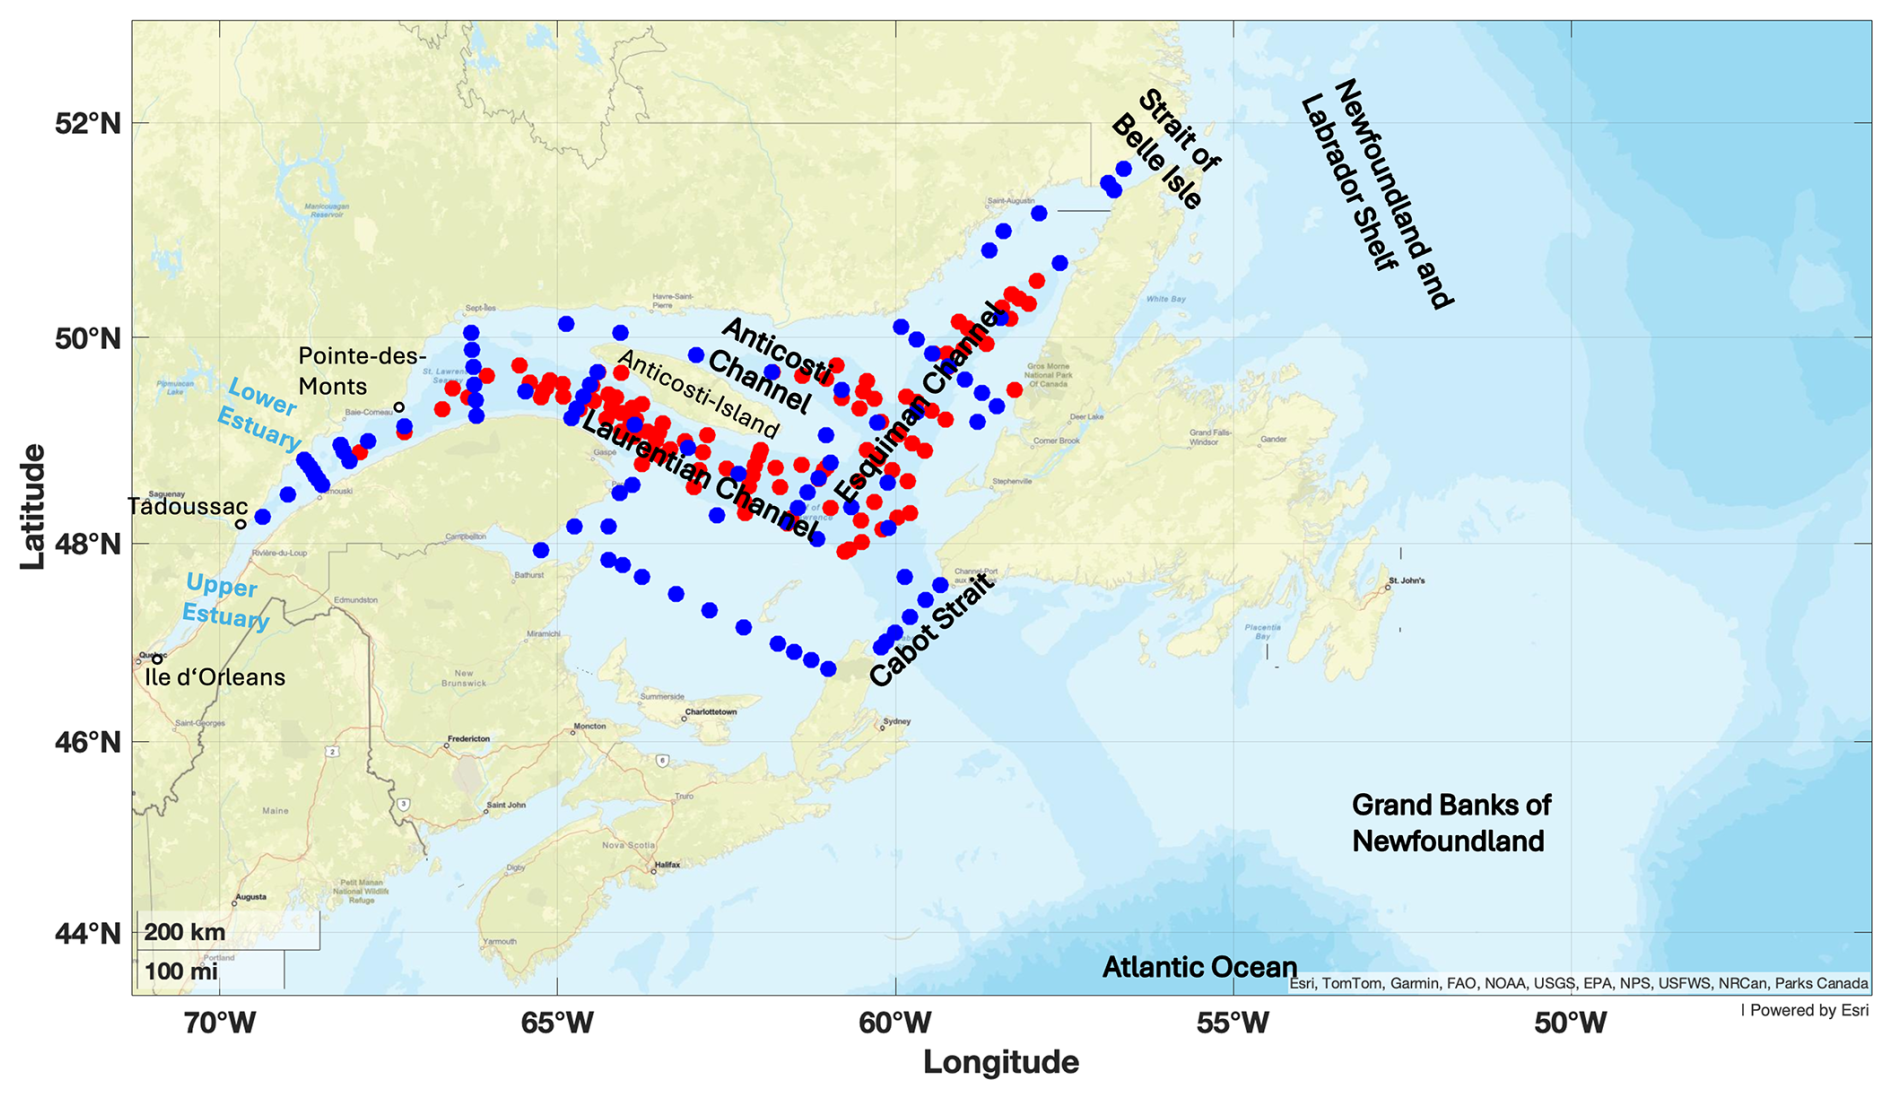
Figure 1The Gulf of St. Lawrence, with its main Channels and Straits identified, together with the Lower and Upper Estuary. Sampling stations from the expeditions in June 2022 (TReX 2 – red dots) and November 2022 (DFO's AZMP survey/TReX 4 – blue dots) are displayed.
The current that feeds deep water into the Gulf of St. Lawrence from the Atlantic Ocean carries two constituents, LCW and NACW, and enters at depths exceeding 200 m through Cabot Strait, forming the relatively warm and saline deep water of the GSL (θ= 1 °C to > 7 °C and Sp= 32.5 to 35) (Galbraith et al., 2024; Lauzier and Trites, 1958; McLellan, 1957). These source waters mix primarily at the tail of the Grand Banks, south of Newfoundland, where the Labrador Current and the Gulf Stream interact, and the resulting water mass is transported into the GSL via the Laurentian Channel (Brickman et al., 2018).
In addition to the deep water entering the Gulf through Cabot Strait, the water column structure consists of an intermediate layer and a surface layer. The cold (< 1 °C) intermediate layer (CIL), is mainly formed locally during winter due to interior water mixing when cooling and formation of sea ice increases the density of the surface water (Galbraith, 2006). A small fraction of the CIL also originates from the inflow of cold water from the Labrador Shelf through the Strait of Belle Isle and an even smaller contribution originates through Cabot Strait at intermediate depths (Galbraith, 2006; Shaw and Galbraith, 2023). The intermediate water layer in the LSLE and Upper St. Lawrence Estuary consists of less salty water, which is renewed by saltier CIL water moving inland from the Gulf in spring (Galbraith, 2006). The relatively warm (> 1 °C, although with large seasonal variability) and low salinity surface water flows mainly seaward, thereby transporting the continental runoff freshwater from the Estuary, and water from the north shore rivers towards the Atlantic Ocean (Galbraith, 2006; Gilbert and Pettigrew, 1997). This outflow leaves the Gulf through the southern edge of Cabot Strait, as the inflow mainly occurs around the northern boundary of the strait (Galbraith et al., 2024).
Using ocean models, the transit times of the deep water within the Laurentian Channel from Cabot Strait until the head of the channel range from 2 to 7 years, depending on the depth (Saucier et al., 2003). For instance, Gilbert (2004) estimated water at depths of 250 m to flow inland from the Atlantic Ocean with a speed of 1 cm s−1, reaching Cabot Strait after 1 year and the Estuary after 3.5 years, i.e. a transit time of 2.5 years from Cabot Strait to the Estuary. Recently, Rousseau et al. (2025) provided and integrated estimates for the transit time of the entire deep-water column (> 225 m), being 3.2 ± 0.7 years from Cabot Strait to the head of the Laurentian Channel. The transit time was analyzed in detail by Stevens et al. (2024) including measurements of a deliberately released tracer experiment (TReX), that estimated the time for the first water parcels to reach the head of the Gulf to be 1.7 years from Cabot Strait, with the bulk of the water arriving after around 4.7 years (in approximate agreement with the earlier estimates of Bugden, 1988). This estimate represents waters centred around the density surface of σΘ= 27.26 kg m−3, representing the water layer from ≈ 250–310 m within the Laurentian Channel.
As the transient tracer measurements that we present in this study were collected in tandem with data collected for the TReX tracer experiment, as detailed in Stevens et al. (2024), we use the advection timescales presented in that study to inform our analyses. Furthermore, we also chose the same density surface of σΘ = 27.26 kg m−3 to represent the core of the deep-water inflow.
3.1 Surveys
The data analyzed in this study was obtained during two field campaigns, one in June 2022 (TReX 2) and one in November 2022 (DFO's AZMP Survey/TReX 4), both carried out on the Canadian research vessel “R/V Coriolis II”. The primary objective of the TReX 2 field campaign was to track the deliberately-released tracer trifluoromethyl sulfur pentafluoride (SF5CF3), which was released in October of 2021 on the density surface of σΘ = 27.26 kg m−3 within the Laurentian Channel, as part of the TReX experiment aiming at monitoring the transport pathways for the deep water in the GSL. Since the released tracer and the transient tracers focused on in this study, CFC-12 and SF6, were measured simultaneously, sampling was concentrated primarily on this density layer, resulting in an uneven depth-distribution of transient tracer observations.
The June cruise was supported by the Marine Environmental Observation, Prediction and Response Network (MEOPAR) and Réseau Québec Maritime (RQM), whereas the November cruise was conducted by the Department of Fisheries and Oceans, Canada (DFO) as part of the Atlantic Zone Monitoring Program (AZMP). The AZMP leads regular surveys along fixed sections since 1999 to monitor physical and biological processes in the St. Lawrence Seaway and the coastal shelf of Eastern Canada, around Nova Scotia and Newfoundland.
Both cruises sampled sections in the Laurentian Channel, the Anticosti Channel, the Esquiman Channel, and the later cruise included sampled stations at Cabot Strait (see Fig. 1) (Blais et al., 2023).
3.2 Observation parameters
The observed tracer concentrations of CFC-12 and SF6, measured simultaneously throughout both 2022 cruises covering the entire GSL and LSLE, were used to estimate water mass mean ages. By comparing the measured concentrations in seawater to the known time-varying atmospheric concentrations of these tracers, it is possible to estimate the time elapsed since a water parcel was last in contact with the atmosphere, providing a robust measure of ventilation and water mass age. Assuming a saturation state that reflects equilibrium between surface water and atmosphere, knowing the solubility, and the tracers' atmospheric concentration as a function of time (Bullister et al., 2002; Bullister and Warner, 2017; Warner and Weiss, 1985), it is possible to reconstruct the historical input functions of each tracer at the sea surface. Since the concentration of SF6 continues to increase in the atmosphere, it can be used to estimate ventilation over approximately the last 40 years. CFC-12, on the other hand, is more appropriate for slightly older water masses, as its production started around 1940, but its atmospheric concentration has decreased since 2002 (see Fig. S1 in the Supplement). Nevertheless, measurements of more than one tracer are needed to provide information on ventilation patterns and determine, for example, if this process is more advectively or diffusively dominated (e.g. Stöven et al., 2015).
Both tracers were measured concurrently on board of the research vessel with a gas chromatographic – electron capture detector system attached to a custom purge and trap unit (GC-ECD/PT5) (Bullister et al., 2002; Gerke et al., 2024; Tanhua et al., 2004, 2005b). The system has a detection limit of approximately 0.03 fmol kg−1 and 0.02 pmol kg−1 for SF6 and CFC-12, respectively (Stöven et al., 2015), and all measured concentrations during the two surveys showed values well above the system's detection limits. For details on the GC-ECD/PT5 system and data calibrations, see Appendix A.
The TTD (transit time distribution) method is a well-established and widely used concept to represent ventilation and allows calculation of various characteristics of the age distribution for a parcel of water in the ocean, including its mean age (e.g. Hall and Plumb, 1994; Shao et al., 2016; Trossman et al., 2012). As described in detail in Appendix B, we constrained the most suitable TTD for this region using our measured tracers' concentrations in combination with a time dependent saturation estimated by Raimondi et al. (2021) and a -ratio (width of the distribution to mean age ratio) of 1.2. As only relatively young water is present within the Gulf, we calculated the final mean ages using the measured SF6 concentrations in combination with the TTD which was determined through the use of both tracers. Note that in this study the term “age” refers to the time elapsed since a water parcel was last in contact with the atmosphere, i.e. since it was ventilated, not the time since it entered the GSL.
Uncertainties in the mean age values arise from various factors, including uncertainties in the tracer measurements (≈ 2 %), uncertainties in constraining the TTD, and most significantly from the input functions used (i.e. atmospheric concentration and saturation assumption). Considering all these factors, an uncertainty of 10 % is applied to the calculated mean ages. See Appendix C for details on each of the uncertainty factors.
We use potential temperature (θ) and practical salinity (Sp) to infer the composition of the Gulf inflow waters, and the transient tracers to analyze the ventilation timescale of these waters. The θ and Sp data was obtained via CTD sensors during both surveys (e.g. Blais et al., 2023).
To provide context on water masses before entering the GSL, we used data from the GLODAPv2.2022 (Global Ocean Data Analysis Project version 2) data product (Lauvset et al., 2022), which compiles globally quality-controlled measurements of transient tracers and other oceanographic parameters from cruises worldwide. GLODAP covers measurements in the broader North Atlantic and allows characterization of water masses, such as LCW and NACW, before they enter the GSL. We focused specifically on data collected after 2010 in the region around the Grand Banks, where the entering deep water is formed, while still representing LCW and NACW as distinct unmixed water masses (see Fig. S2). Mean ages were primarily computed from CFC-12 measurements due to higher abundance of this tracer in those regions. The same saturation and -ratio, as determined earlier were considered for the calculation, being consistent with conditions in LCW and NACW, as water residence times before entering the Gulf are relatively short. However, because only CFC-12 was measured in these regions, it was not possible to derive local -ratio directly, which introduces some uncertainty to the age estimates.
3.3 Water mass analysis
3.3.1 Linear fraction model
To obtain information on the water mass composition of the deep water, we use a linear fraction model including the three parameters, mean age (Γ), θ and Sp (see Eqs. 1–4) and solve it for a least square solution of fractions.
Here, the observed values represent the measured parameters within the GSL (Γobs; θobs; ) during 2022, fLCW and fNACW display the individual fractions of the two mixing water masses and ΓLCW, ΓNACW, θLCW, θNACW, and indicate the endmembers of the two water masses before mixing. The endmembers for temperature and salinity are set to be the mean of the θ and Sp range of LCW and NACW, respectively, as presented in Jutras et al. (2020). For the mean age endmembers, we observed tracer data measured outside the GSL since 2010 in the respective temperature, salinity and density ranges, and regions representing largely unmixed LCW and NACW. The endmembers used in the main analysis were computed as the mean of the calculated mean ages within the respective water mass (see Table 1). In addition, the full observed range of mean ages was considered in a sensitivity analysis, pairing the lowest and highest observed tracer-derived mean ages of LCW and NACW in opposite combinations to span the full range of plausible endmember values (see Table S1). All parameters are considered quasi-conservative (i.e., not affected by biogeochemical processes) given the short transit time from immediately outside the GSL to the Laurentian Channel, making the use of mean age endmembers plausible (Tanhua et al., 2005a).
Table 1Endmembers of θ, Sp and Γ used for the water mass analysis alongside each water mass fraction range. Note that the mean age endmembers are represented by the mean of all computed values, not representing the middle of the range.
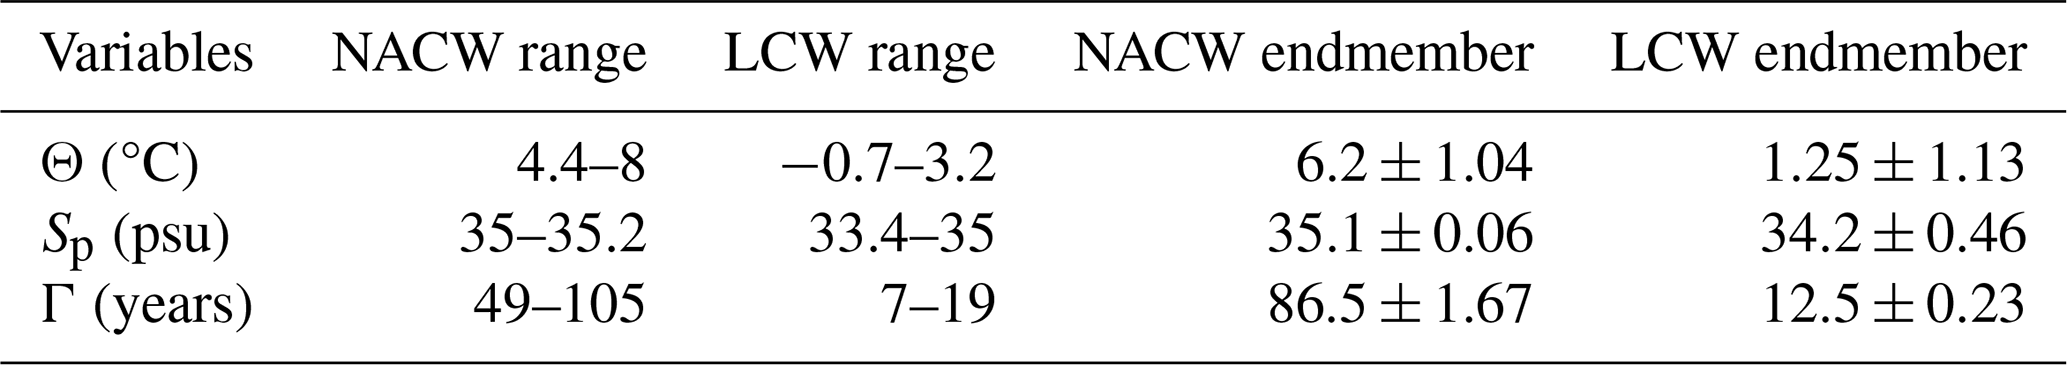
This linear approach bears uncertainties, such as the selection of the individual endmembers, uncertainty in the parameter observations used for the fraction calculation, and structural model assumptions, including the equal weighting of parameters in a simple least square solution.
To quantify the impact of endmember selection uncertainty, the two sensitivity case studies described above were used solely to assess the sensitivity of the fraction value estimates to endmember selection (see Table S1 and Fig. S3). In addition, the statistical uncertainty associated with the selection of the mean age endmembers was quantified as the standard error of the mean (SEM) of the individual tracer-based age estimates within each water mass in the Atlantic Ocean, resulting in uncertainties of 1.67 years for NACW and 0.23 years for LCW. For temperature and salinity endmembers, uncertainties were approximated using uniform distributions across the reported parameter ranges, resulting in uncertainties of 1.04 and 1.13 °C for NACW and LCW temperatures, respectively, and 0.06 and 0.46 psu for NACW and LCW salinities. The mean age observations within the Gulf, included in the fraction analysis, were assigned a relative uncertainty of 10 %, as previously specified, while errors in temperature and salinity observations were considered negligible. An additional 20 % relative uncertainty was introduced to account for structural assumptions in the simple linear mixing model. All uncertainties were jointly propagated using a Monte Carlo approach (N= 10 000) (JCGM, 2008), yielding in an overall LCW fraction uncertainty of approximately 21 %. A detailed uncertainty budget analysis is provided in Appendix D.
Despite these uncertainties, this method offers a comparison to the ventilation timescales derived from the transient tracer measurements and provides additional insights into water mass composition by more effectively capturing temporal changes and mixing processes in comparison to the other methods solely relying on hydrographic parameters.
3.3.2 2-IG-TTD approach
As this study utilized measurements of multiple tracers, we also applied a two-inverse Gaussian transit time distribution (2-IG-TTD) approach to analyze the water mass composition. This method accounts for the presence of two water masses with distinct age characteristics mixing within the same density surface (for details, see Stöven and Tanhua, 2014). In this framework, the tracer concentration c(t,r) at location r and time t is represented as a linear combination of two IG distributions (see Eq. 5).
where Γ1 and Γ2 represent the mean ages of the two endmember water masses, Δ1 and Δ2 their respective widths of the distributions, and α the mixing fraction that corresponds to the water mass fraction controlling their relative contributions.
The mean age of the resulting mixed water parcel can be expressed as a linear combination of the endmember mean ages (see Eq. 6).
In this study, Γ represents the observed mean age within the GSL, derived from transient tracer measurements. Γ1 is chosen to represent the mean age endmember for LCW and Γ2 for NACW.
Equation (6) is inverted to solve for the water mass fraction α:
yielding the fraction of LCW, with 1−α representing the corresponding NACW fraction.
3.4 Deep water time proxy at Cabot Strait
A proxy time series of mean ages at Cabot Strait was constructed to better resolve temporal changes. This approach provides a clearer view of long-term trends compared to basin-wide observations based on single-year measurements. Rather than sampling repeatedly at a fixed station, measurements from 2022 along the Laurentian Channel were combined with the estimated deep water transit time from Stevens et al. (2024) to infer when each water parcel would have passed Cabot Strait. For each sample, the distance to a fixed reference location within Cabot Strait (47.2° N; 59.7° W) was used together with an average transit speed of 0.5 cm s−1 to assign an equivalent passage date through Cabot Strait. This allowed construction of a time series representative of inflowing water over multiple years.
4.1 Ventilation and hydrographic data analysis along the Laurentian Channel
During both 2022 cruises, all three water layers of the GSL, the warm and fresh surface, the cold intermediate and deep water, defined as in Galbraith et al. (2024), were clearly present (see Fig. 2).
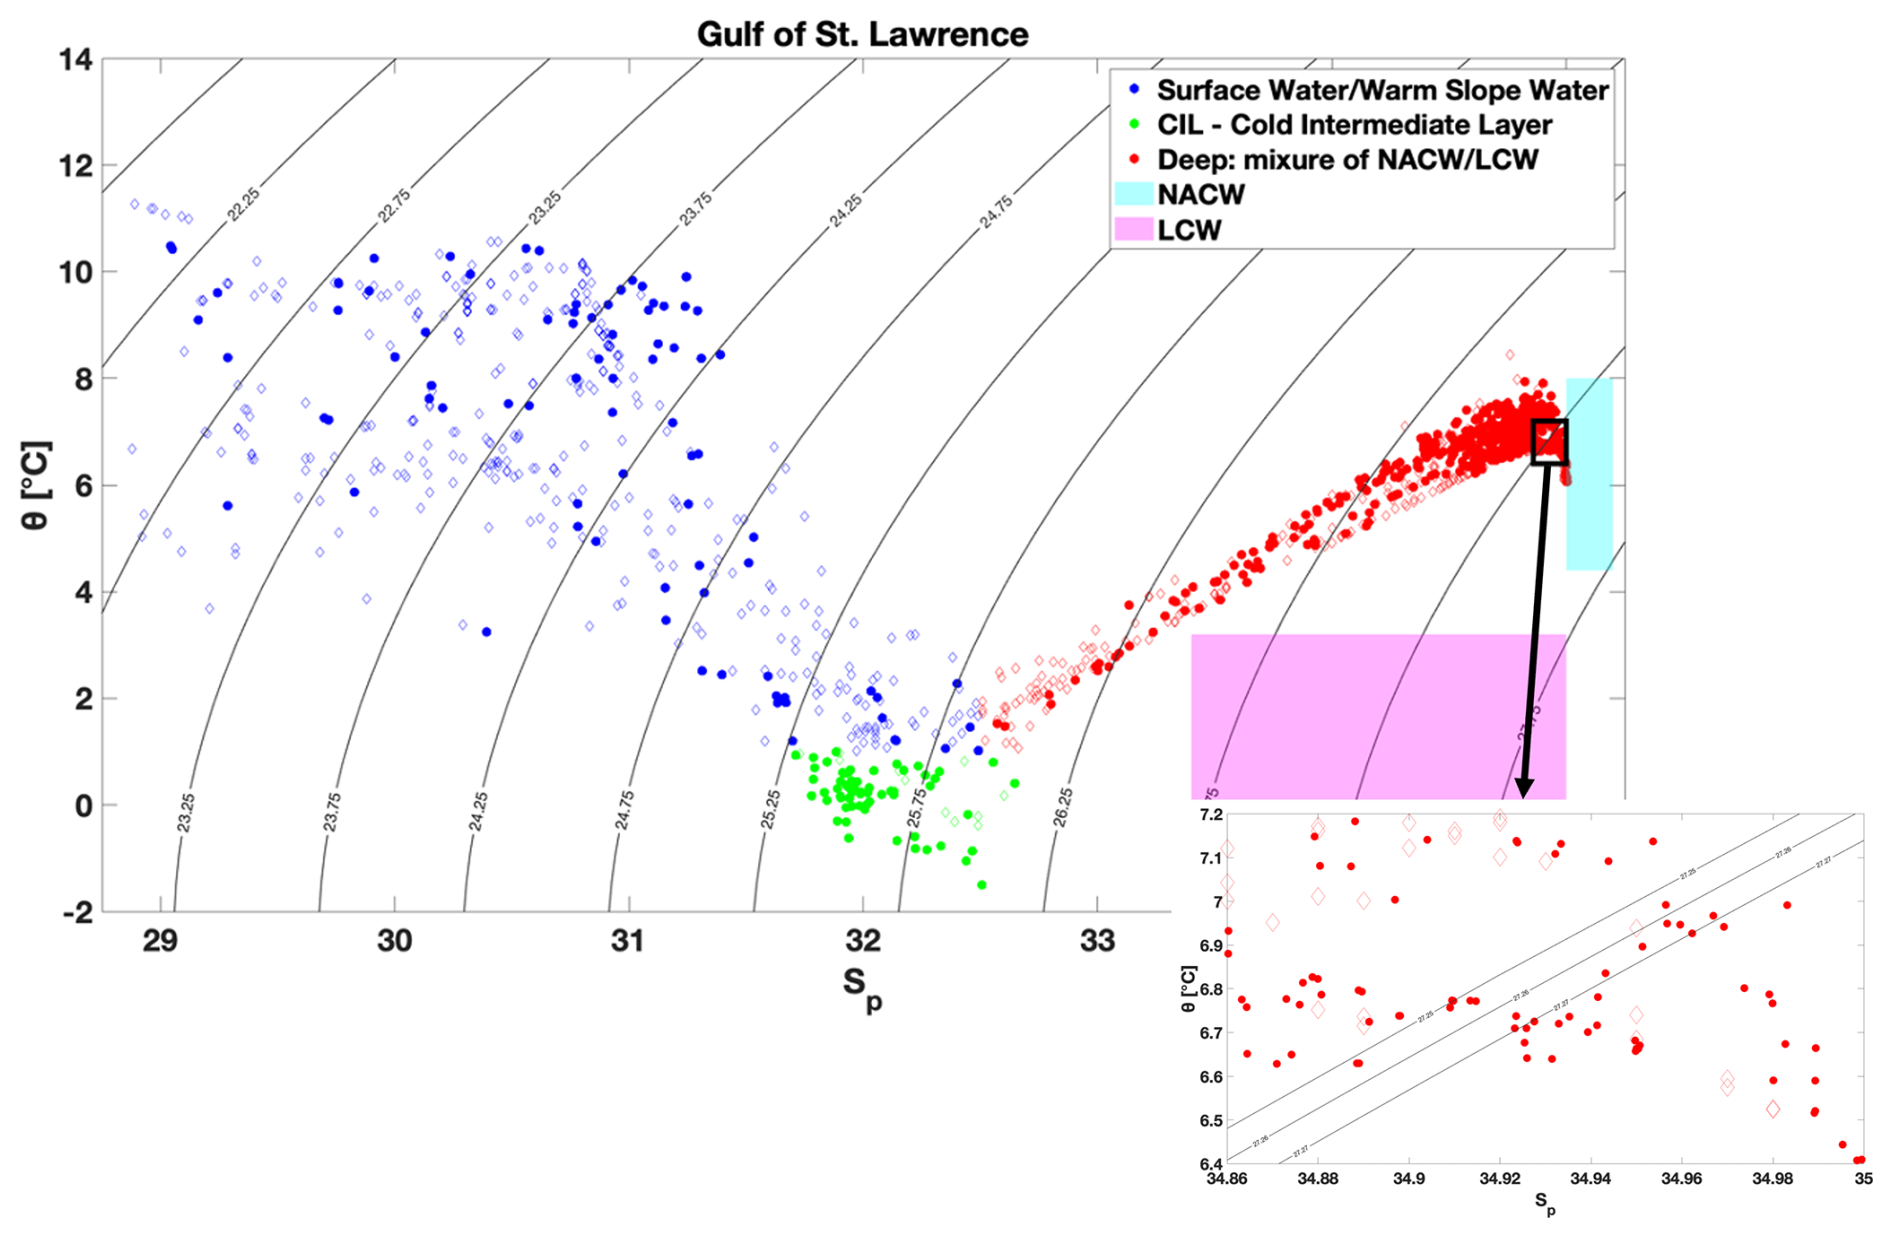
Figure 2Potential Temperature (θ) vs Practical Salinity (Sp) plot from the bottle data of the two cruises in 2022, showing the three main layers of the GSL, as indicated by different colors with density lines of σΘ (TReX 2 – dots; DFO's AZMP survey/TReX 4 – diamonds). The pink and the cyan areas represent the θ vs. Sp ranges of LCW and NACW, as defined in Jutras et al. (2020). In addition, a zoomed in area around the density of σΘ= 27.26 kg m−3 is shown, with density lines at 27.25, 27.26 and 27.27.
The temperature and salinity structure throughout the water column was similar during both cruises (see Fig. 2 – dots and diamonds) with the deep temperature maximum (8 °C) present at depths between 200 and 300 m in the Laurentian Channel. In recent years, the temperature at these depths has increased from an average of 5.2 °C in 2009 to 7 °C in 2022, with the warmest water being observed near Cabot Strait, where temperatures exceeding 7 °C were measured as early as 2012 (Galbraith et al., 2024).
As our study and the sampling strategy of TReX 2 focus on the region's deep layer, hydrographic properties and mean ages derived from transient tracer observations are examined in detail for densities greater than 26.25 kg m−3 (deep water layer). Across the full deep-water range, temperature, salinity, and mean age all increase with density and show higher values further east at similar densities (see Fig. 3a, d, and g).
A detailed look at the vertical structure of all properties along the Laurentian Channel (see Fig. 4) shows colder, fresher, and younger water overlie warmer, saltier, and older waters, with relatively flat isopycnals along most of the channel. The deepest isopycnals gradually disappear inland due to bathymetric shallowing, suggesting vertical mixing along the channel. Nevertheless, this is limited, consistent with Stevens et al. (2024), who reported a basin-wide vertical diffusivity of 10−5 m2 s−1 over one year in the GSL.
On the deep-water isopycnal of σΘ = 27.26 kg m−3, which was the core sampling focus during TReX 2, the same trends remain (see Fig. 3b, e, and h), showing warmer, saltier and older water further east. On this isopycnal, temperature ranges from approximately 6.4 to 7.5 °C, salinity varies from 34.7 to 34.95, and mean ages range from 25 to 50 years. Although the mean ages exceed the direct atmospheric history of CFC-12 (tracer age), the values are plausible because the mean age is derived from the IG-TTD, which reflects a full distribution of transit times, including its older tail (see also Guo et al. (2025), who showed that water masses with ideal ages up to 200 years can be well represented by CFC-12 based on IG-TTD analysis).
Mapping the σΘ = 27.26 kg m−3 measurements across the GSL (see Fig. 3c, f, and i) shows a sharp change in temperature and salinity at ∼ 63° W, corresponding to the eastern tip of Anticosti Island. Mean ages, however, increase more gradually eastward from the LSLE to Cabot Strait, with older waters near Cabot Strait (∼ 60 years) and younger waters (∼ 30–40 years) further inland.
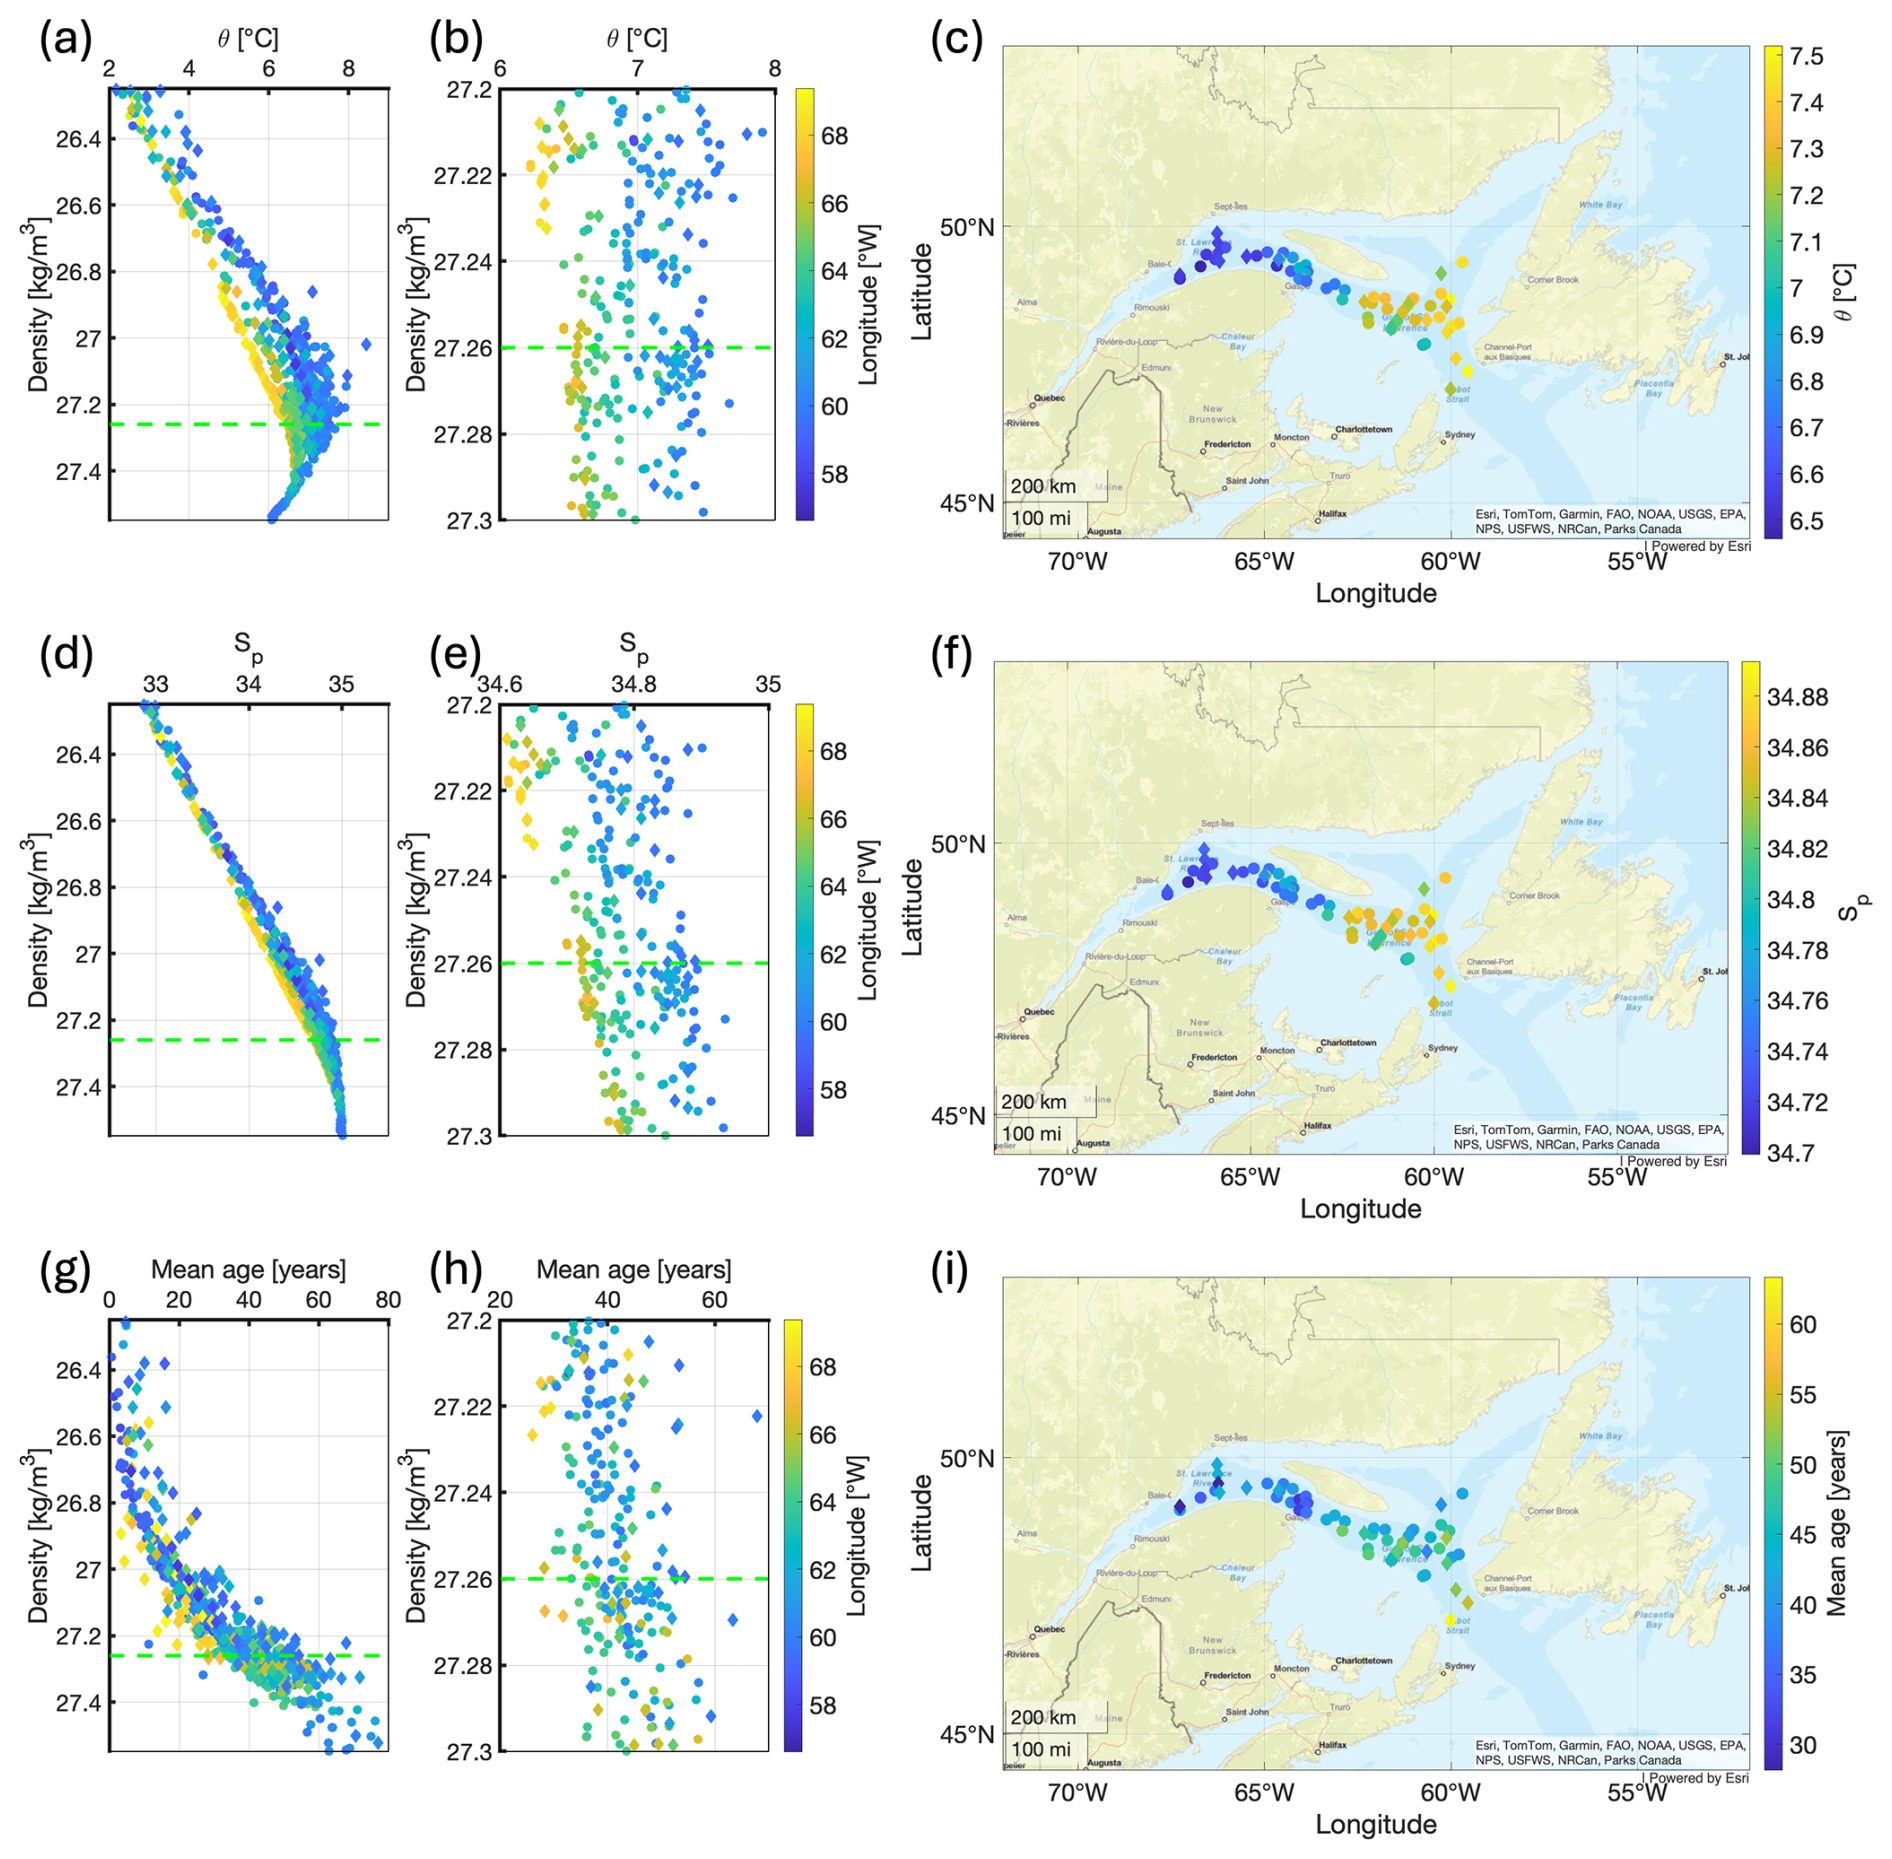
Figure 3Potential Temperature (a), Practical Salinity (d), and Mean ages (g) measured within the deep-water layer in the GSL (density > 26.25 kg m−3), with the colorbar representing the longitude. Panels (b), (e), and (h) represent a zoomed in area around the σΘ= 27.26 kg m−3 isopycnal (green dotted line), respectively, and plots (c), (f), and (i) show the properties interpolated onto the 27.26 isopycnal from observations with densities between 27.25 and 27.27, mapped over the GSL. All the data presented here was collected during the two surveys in 2022, with the dots represent the measurements from TReX2 survey, and the diamonds the measurements from the DFO AZMP survey/TReX 4 cruise.
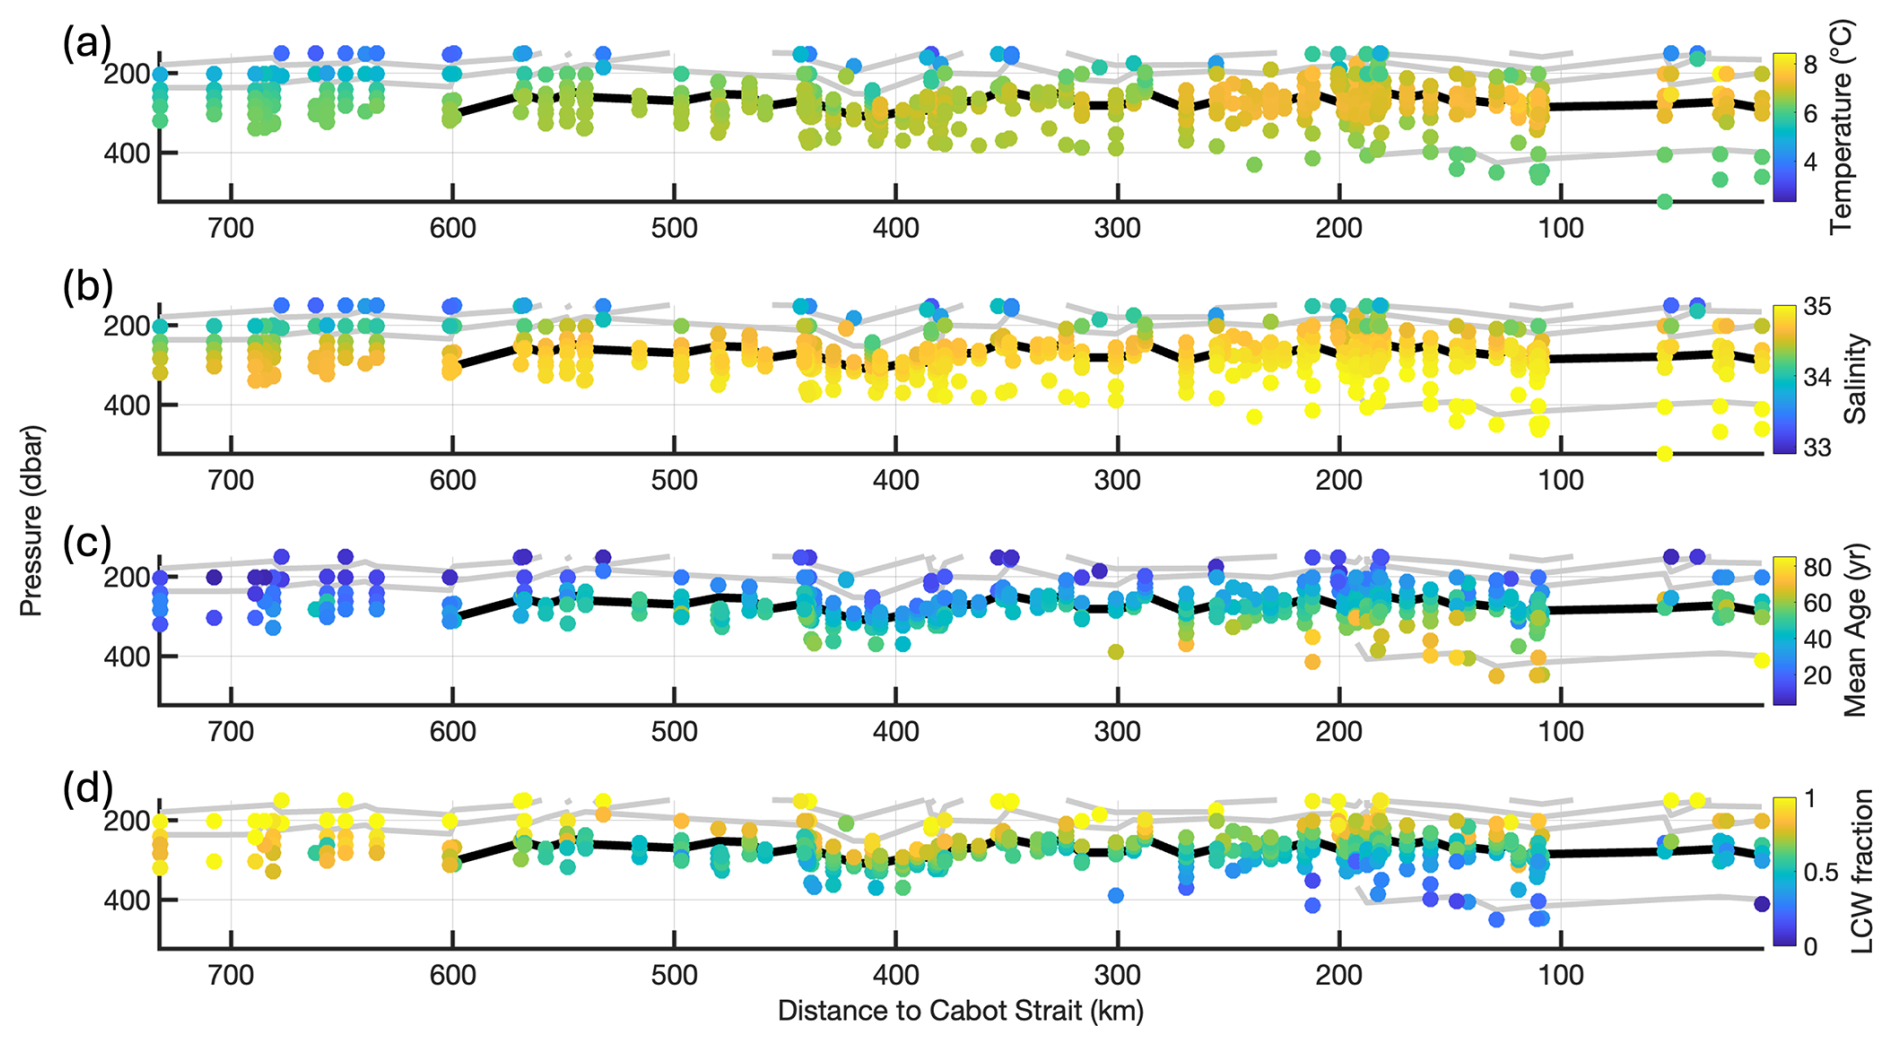
Figure 4Display of (a) Temperature, (b) Salinity, (c) Mean age and (d) LCW fraction throughout the Laurentian Channel (shown as distance from Cabot Strait, calculated as described in Sect. 3.4, where greater distance corresponds to samples collected further toward the LSLE) versus depth. The LCW fractions here are calculated using the linear fraction model, with endmembers of all properties being the mean of each range. The black line indicates the σΘ = 27.26 kg m−3 isopycnal and grey lines represent the 26.5, 26.75, 27, and 27.5 isopycnals. (As a reference, the LSLE starts approximately at a distance of 600 km from Cabot Strait).
This west to east along-channel gradient of increasing tracer-derived mean ages (i.e. lower transient tracer concentrations) is opposite to what would be expected from the general estuarine circulation pathway along the Laurentian Channel (Dickie and Trites, 1983). Deep water would become progressively older toward the west as it is transported from Cabot Strait toward the LSLE (e.g. Stevens et al., 2024). This apparent reversal in the mean age pattern does not necessarily imply a change in the estuarine circulation though, but could rather reflect changes in the water mass composition of the inflowing deep water, considering the limited vertical mixing within the GSL deep water. Because tracer-derived mean ages reflect integrated ventilation history of source waters rather than in-situ modification, this pattern indicates that changes in inflow composition could dominate over along-channel transport effects.
The deep-water inflow to the GSL is known to consist of a mix of warm, saline, and older NACW and cooler, fresher, and younger LCW (e.g. Gilbert et al., 2005; Jutras et al., 2020). The systematic increase in mean age toward the east, coincident with higher temperature and salinity, therefore suggests a progressively stronger contribution of NACW within the deep inflow waters entering through Cabot Strait, whereas younger ages observed toward the LSLE indicate that these waters have a larger fraction of LCW. This interpretation is consistent with the general hypothesis of previous studies suggesting a change in the composition of the Gulf of St. Lawrence's deep inflow toward an increased NACW composition (Galbraith et al., 2024; Jutras et al., 2020). However, recent studies, such as Jutras et al. (2023b), suggest that since 2021 the deep water within the Laurentian Channel has been almost entirely composed of NACW. This contrasts with the gradual west to east age increase along the Laurentian Channel observed in this study, implying that the transition toward NACW dominance is ongoing rather than complete, as of 2022, refining previous interpretations based solely on hydrographic data.
The inclusion of transient tracers (SF6 and CFC-12) in this study allows, for the first time, a direct quantification of ventilation timescales in the GSL, providing independent evidence for the ongoing temporal evolution and compositional shift of entering deep water. Consistent with this, the more gradual eastward increase in mean age, compared to the sharp transition observed in hydrographic parameters at ∼ 63° W (corresponding to a distance of ∼ 290 km from Cabot Strait – see Fig. 4), indicates that ventilation-related tracers respond differently to changes in source-water composition than hydrographic parameters alone, even though all parameters differ substantially between the source waters.
As the deep-water flows from Cabot Strait toward the LSLE, the already older water in the eastern part of the Gulf will flow inland and further increase the mean age of the deep water in the western part of the Gulf and possibly also increase hypoxia slightly. Given the transit time of around 4.7 years (Stevens et al., 2024) for the bulk of water to travel from Cabot Strait to the LSLE, oxygen levels in the LSLE are expected to continue to drop over the next few years (Nesbitt et al., 2025), even in the absence of further changes in the inflow composition. Over large space and time scales, the observed change in the inflow composition may be linked to a northward shift of the Gulf Stream, which has been suggested in numerous modelling studies (e.g. Claret et al., 2018; Joyce and Zhang, 2010). This northward Gulfstream shift contracts the subpolar gyre and increases the retroflection of LCW, reducing the south-westward transport of LCW toward the mouth of the Laurentian Channel, with implications for the supply of oxygen to the GSL (Jutras et al., 2023a).
4.2 Water mass analysis
Transient tracer-derived mean ages provide an additional parameter to include ventilation timescales of deep waters in the GSL, together with hydrographic properties, to explore plausible mixtures of source waters entering through Cabot Strait. Here, we apply a simplified two-endmember linear water mass fraction analysis along the σΘ = 27.26 kg m−3 isopycnal to assess whether the observed tracer-derived age gradients are consistent with mixtures of NACW and LCW. This analysis is intended as an interpretive complement to the tracer results presented above, rather than as a definitive quantification of water-mass fractions.
Mean age endmembers for NACW and LCW were defined from the mean of post-2010 observations in regions where these water masses are largely unmixed (see Table 1 and Sect. 3.3.1). As with any water-mass fraction analysis, the inferred fractions depend strongly on endmember selection, particularly when endmember properties span wide ranges, as is the case here for temperature, salinity, and mean age.
The resulting LCW fraction map along the σΘ = 27.26 kg m−3 isopycnal (see Fig. 5) shows a clear and consistent along-channel pattern, with higher LCW fractions toward the LSLE and increasing NACW influence toward Cabot Strait. While some samples near the LSLE yield LCW fractions approaching unity, these values should be interpreted cautiously. They likely reflect the combined effects of endmember uncertainty and the progressively shallower water column toward the western Gulf, rather than the presence of purely unmixed LCW at depth. As the deepest isopycnals are progressively truncated by the bottom, weak upward entrainment or vertical mixing can introduce slightly colder, LCW-like properties into the σΘ = 27.26 kg m−3 isopycnal layer. This process can bias the linear mixing calculations toward higher LCW estimates additionally.
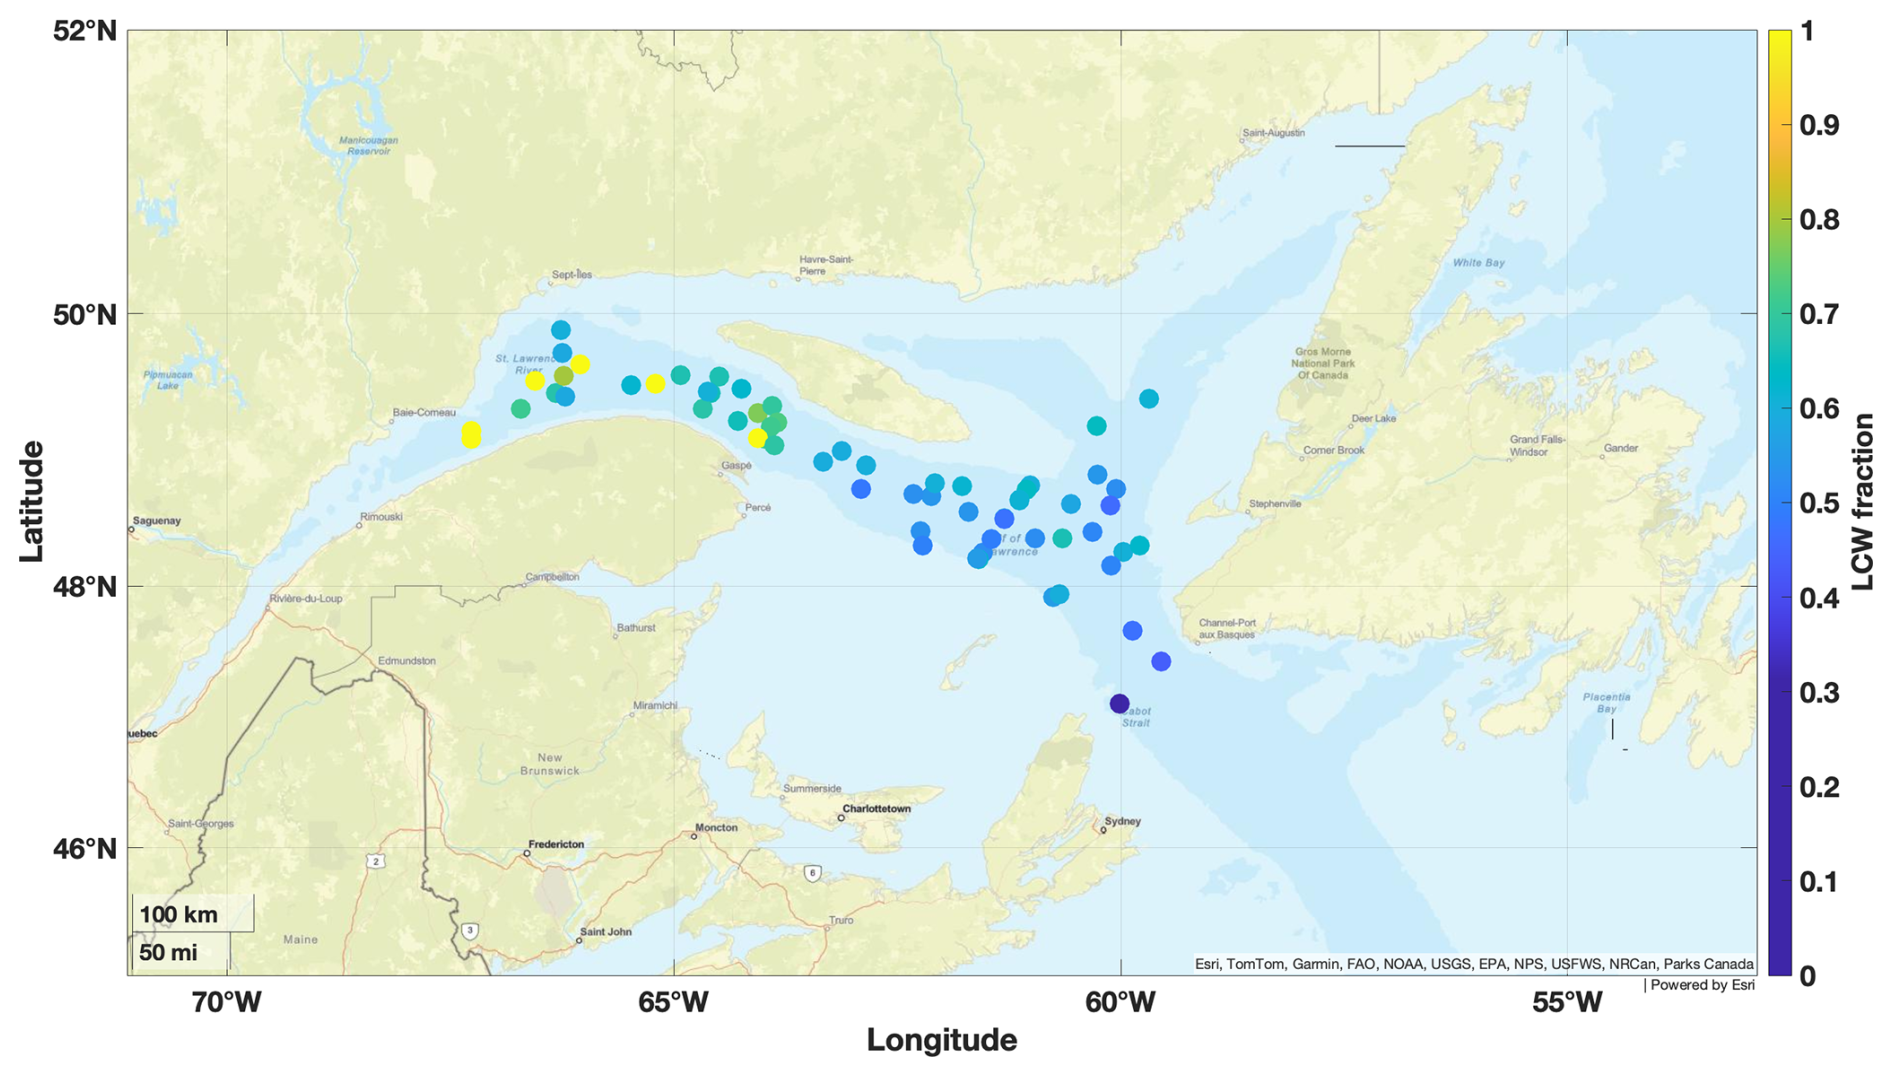
Figure 5LCW fraction on the σΘ = 27.26 kg m−3 isopycnal deep water in the Laurentian Channel calculated using the linear fraction model with θ, Sp and mean age (Γ) observations, plotted on a map. The endmembers used in the calculations are provided in Table 1 with all the data presented here being collected during the two TReX surveys in 2022.
Sensitivity tests spanning the full plausible range of NACW and LCW mean age endmember properties (see Table S1 and Fig. S3) demonstrate that absolute LCW fraction values vary substantially depending on endmember choice. For example, at Cabot Strait inferred fractions range from near zero to approximately 0.5 under extreme scenarios. In contrast, LCW fractions toward the LSLE remain consistently higher across all sensitivity cases (∼ 0.3 to 0.8). Although this variability limits the quantitative interpretation of individual fraction values, the qualitative spatial gradient, indicating the continued presence of LCW throughout the Laurentian Channel as of 2022, is robust.
To further explore temporal changes in the composition of deep inflow waters, we constructed a proxy time series of mean ages and LCW fractions at Cabot Strait. This approach provides an inferred view of how inflowing water properties may have evolved over the past several years, showing an increase in tracer derived mean ages from 2018 to 2022 (see Fig. S4), suggesting that the deep inflow water to the GSL has become progressively older in recent years. Despite substantial variability in absolute LCW fraction values across extreme endmember scenarios, both sensitivity cases consistently indicate a decrease in LCW contributions at Cabot Strait from 2018 to 2022, supporting the robustness of the inferred temporal trend.
The 2-IG-TTD approach produces very similar spatial patterns of LCW fractions along the σΘ = 27.26 kg m−3 isopycnal as the linear fraction model (see Fig. S3). In contrast, water-mass analysis based solely on θ and Sp show no detectable LCW contribution on this isopycnal within the Laurentian Channel (see Fig. S5), consistent with previous studies that estimated water mass fractions using basic hydrographic parameters (temperature, salinity, nutrients, oxygen, etc.) combined, for example, with an eOMP (extended optimum multiparameter) analysis (e.g. Gilbert et al., 2005; Jutras et al., 2020, 2023b). This difference does not imply that transient tracer-based methods are inherently superior to hydrographic approaches, but rather that ventilation-related tracers provide complementary information that is not captured by thermohaline properties alone. Moreover, the individual θ and Sp trends suggest ongoing changes (see Fig. 3c and f) and the θ vs. Sp plot (see Fig. 2) shows no overlap with the NACW range, indicating that analysis using only two variables may provide an incomplete picture (Liu and Tanhua, 2021).
Overall, the water-mass analysis reinforces the central tracer-based result of this study: LCW remains present within the deep waters of the Laurentian Channel as of 2022, despite a growing influence of NACW. While uncertainties in endmember definition limit the precision of inferred fractions, the consistency of spatial and temporal patterns across sensitivity tests support the robustness of this conclusion. When interpreted cautiously, transient tracer-derived mean ages provide a valuable additional parameter on deep-water ventilation and source-water influence, complementing hydrographic analyses.
Transient tracers (SF6 and CFC-12) were measured for the first time in the GSL, providing direct, spatially resolved estimates of deep-water ventilation timescales throughout the Laurentian Channel. Tracer-derived mean ages increase systematically with density and show a west-east gradient along the channel, with younger waters (∼ 30–40 years) in the LSLE and substantially older waters (∼ 50–60 years) toward Cabot Strait. This pattern contrasts with the expectation based on along-channel advection, but is consistent with spatial variations in the, over the last decades observed, compositional change of the inflowing deep waters.
The observed increasing mean ages toward Cabot Strait, coincide with higher temperature and salinity observations, indicating to a progressively stronger influence of older NACW on the inflowing deep water, while younger ages further inland reflect a higher contribution of LCW. The persistence of the along-channel age gradient in 2022 suggests that the shift toward longer ventilation timescales, associated with increased NACW influence, is ongoing rather than having reached a steady end state, refining earlier interpretations based solely on hydrographic data (Jutras et al., 2023b).
Comparison between tracer-derived mean ages and hydrographic properties shows the ventilation age evolving more gradually along the Laurentian Channel than temperature and salinity, which exhibit sharper transitions. This indicates that ventilation-related tracers and thermohaline properties respond differently to variations in source-water composition and mixing. As a result, tracer-derived mean ages provide a complementary and independent constraint on the temporal evolution of deep waters in the GSL that cannot be inferred from hydrographic observations alone.
The observed increase in ventilation age has direct implications for deep water oxygen supply. Older, less recently ventilated waters in the east carry less DO, and continued advection of these waters toward the LSLE in the next years is expected to further increase hypoxia (Blais et al., 2024).
Overall, these results underscore the value of transient tracers for resolving deep-water ventilation timescales and diagnosing ongoing changes in the composition of the GSL inflowing deep waters. Incorporating tracer-derived mean ages alongside hydrographic observations is essential for accurately assessing long-term deoxygenation trends.
The gas chromatographic – electron capture detector (GC-ECD) system consisted of a precolumn packed with 30 cm Porasil C and 60 cm Molesieve 5A, followed by a main column packed with 200 cm Carbograph 1AC and 20 cm Molsieve 5A. Throughout the measurement, these components were kept at a constant temperature of 50 °C. The function of these columns was to separate the various analytes before concentration determination with the electron capture detector.
Before the analysis, the purge and trap unit extracted the analytes from the water sample by bubbling N2 gas though the sample and trapping them on a column of 100 cm tubing, packed with 70 cm Heysep D. To ensure efficient trapping, this column was kept at −60 to −70 °C using liquid nitrogen and subsequently heated to 100 °C to desorb the analytes onto the precolumn.
The water samples were collected in 250 mL glass syringes directly from the Niskin bottles and after temporal storage in a 0 °C water bath, 200 mL of the sample volume was injected into the purge and trap unit.
The system was calibrated by measuring precise volumes of a calibrated gaseous standard containing known analyte concentrations. A calibration curve was recorded at the beginning of each cruise and to determine any drift in the detector, point calibration was carried out daily.
Due to high variations and unusual high concentrations reported during DFO's AZMP Survey/TReX 4, we compared the results to measured samples during TReX 2 at similar density and location. This resulted in a scaling of the CFC-12 measurements by −20 % and SF6 by −14 % in order to achieve internal consistency between the values (see Fig. S6). We conclude that the measured values from TReX 2 are more accurate, as they show tracer concentrations in the surface layer close to 100 % saturation with the atmospheric values of 2022 and in general have less scatter in the data compared to TReX 4. This shift of the November cruise measurements toward plausible and similar values, and only having two datasets throughout the year limits the analysis of any interannual variability, but allows us to perform a Gulf-wide analysis of the age distribution.
The transit time distribution (TTD) is a well-established concept looking at ventilation timescales via mean age calculation using measured transient tracer concentrations. Thereby, additionally achieving knowledge on the ratio between advective and diffusive transport of water masses from the surface into the interior ocean (e.g. Stöven and Tanhua, 2014; Waugh et al., 2003). TTD determination is possible using a tracer couple sampled at the same location and time with significant different input functions, as being the case for SF6 and CFC-12 during the two cruises analyzed in this study.
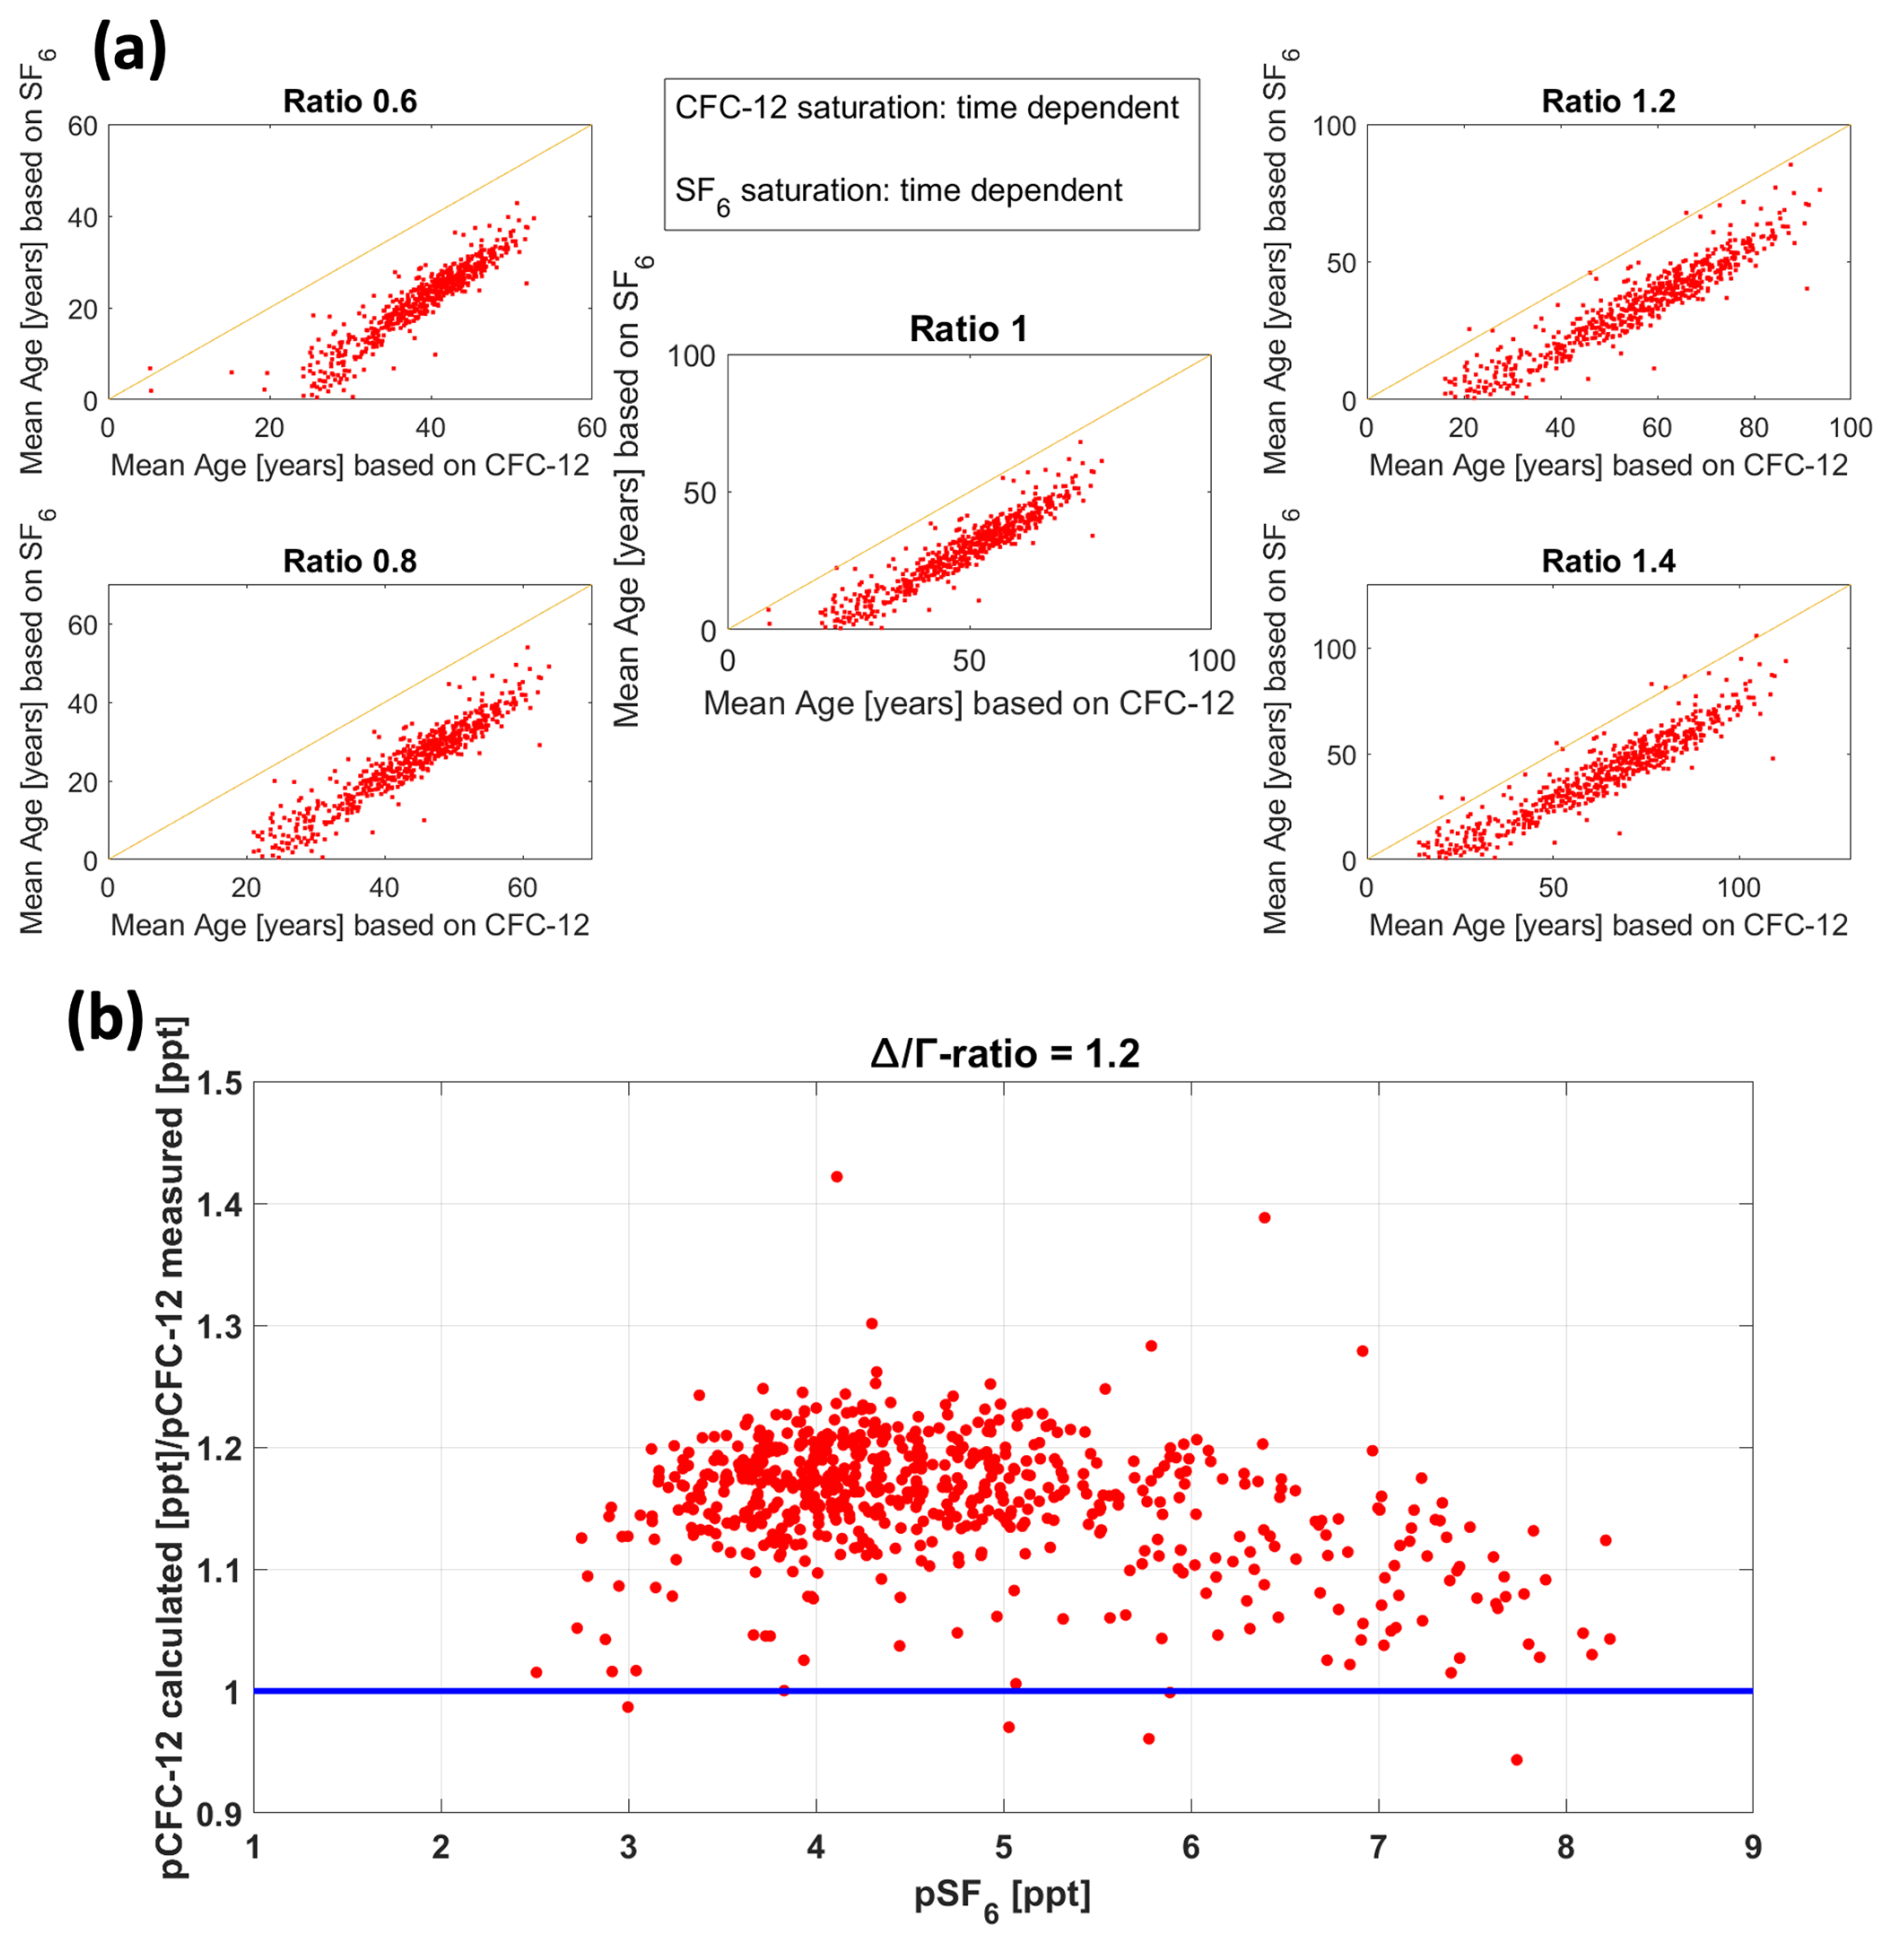
Figure B1(a) Comparison of calculated mean ages from CFC-12 and SF6 with different -ratio. The saturations for each tracer were assumed to be time dependent. (b) Display of the relationship between calculated and measured pCFC-12 against pSF6 concentrations using a ratio of 1.2 for the calculations.
The method is based on a function describing the concentration of a single tracer at a certain location (c(ts,r)), calculated using boundary concentrations of this tracer, related to their input function, and Green's function (G(t,r)) (see Eq. B1).
Applying four assumptions, being (1) a steady state, (2) a single source region, (3) no inner water interactions affecting the concentration of the tracer and (4) a one-dimensional flow, and assuming an inverse Gaussian (IG) age distribution, the Inverse Gaussian Transit Time Distribution (IG-TTD) provides one solution for the TTD. Considering distinct sampling points of a tracer, Green's function (G(t)) at a particular time can be characterized by the mean age (Γ) and the width of the distribution (Δ), excluding the location (see Eq. B2) (Schneider et al., 2012; Sonnerup et al., 2013; Stöven and Tanhua, 2014; Waugh et al., 2002).
The ratio of width to mean age (), describes the above-mentioned relationship of advective to diffusive flow. A -ratio of 1.0 is the unity ratio, -ratio > 1 indicate a diffusive dominating process and a -ratio < 1 a more advective ventilation of a water parcel.
The initial attempt to constrain the TTD in this study and gain information on the -ratio involved a standard approach of comparing mean ages derived from CFC-12 to SF6 measurements at the same location and time (see Fig. B1a). This method compares the mean ages derived from the individual tracers under varying -ratios. Agreement between the two tracer-derived mean ages (yellow lines in Fig. B1a) indicates that the chosen -ratio would reflect local advective and diffusive transport characteristics well. However, this method did not yield sufficient results across all ratios, as in all cases the CFC-12 based mean ages were generally higher than those derived from SF6 (optimal outcomes would align the data points on top or close to the 1:1 line). One potential reason for this discrepancy could be the assumption of a steady state in ventilation, which is not the case in the Gulf (see main part of the paper). Additionally, uncertainties may arise from the assumed inverse Gaussian shape of the TTD, which might not be practical to use in this area and/or from the presence of only rather young waters, affecting the calculations from CFC-12 measurements, given the tracer's atmospheric history of declining concentrations since 2002 (see Fig. S1).
To test this last hypothesis, we compared measured and calculated CFC-12 concentrations (again under varying -ratios) relative to observed SF6 concentrations measured at the same location and time. We derived mean ages from SF6 concentrations and back calculated the corresponding CFC-12 concentrations, which were then compared to the actual measured concentrations. Figure B1b shows the difference between expected to measured CFC-12 concentrations as a function of the SF6 partial pressures for a -ratio of 1.2 (see Figs. S7 and S8 for other -ratios). The calculated values were consistently slightly higher than the measured values (above the blue line, representing a perfect match of calculated and measured CFC-12) across the full range of SF6 concentrations (2–8 ppt), with no systematic trend toward higher SF6 values representing recently ventilated waters. We therefore conclude that the influence of decreasing CFC-12 in the atmosphere is not a relevant factor for our TTD analysis in this region. Thus, the difficulty in constraining the TTD mainly arises from the assumptions made for the calculation, being the steady state, the single source region and the inverse Gaussian shape.
Both methods applied indicate the best results with increasing -ratio, either by mean ages converging toward the 1:1 yellow line (method 1) or by calculated to measured concentration ratios approaching unity (blue line – method 2), suggesting a diffusive dominated transport. The most suitable result from these analyses is obtained with a -ratio of > 1.8, indicated by datapoints being closest to the yellow and blue lines. However, Stöven et al. (2015) concluded that with increasing -ratios, the calculated mean ages become more sensitive to deviations in saturation and tracer age. Consequently, we selected a -ratio of 1.2 as an optimal balance, along with the time dependent saturation analyzed by Raimondi et al. (2021) in the Labrador Sea, for the calculation of mean ages in this study. This choice reflects a slightly diffusive dominated transport (-ratio > 1) while avoiding excessive age deviations (-ratio > 1.6).
To further assess the plausibility of our chosen ratio, we examined results derived from a one-dimensional Gaussian pipe model describing the spreading of the CF3SF5 tracer analyzed in Stevens et al. (2024). In this model, is calculated from the advective (Δ= ut) and diffusive (Γ= (2 kt)) terms, yielding values of 1.2 and 1.5 for the two surveys (TReX 2 and DFO's AZMP Survey/TReX 4), respectively. These values fall within the same range as the ratio applied in this study, thus providing additional support for our choice.
For the data inside the Gulf of St. Lawrence, we primarily focus on the mean ages calculated from SF6 concentrations due to rather young waters, but for the data outside the Gulf we also include data from CFC-12 concentrations due to the larger quantity of available measurements.
The uncertainty in the derived mean ages arises from several factors: measurement errors in the transient tracer concentrations, uncertainties in constraining the TTD using various assumptions, and uncertainties in the input function, including atmospheric concentrations and saturation levels. The uncertainty in the transient tracer concentration involves analytical measurement errors, calibration biases (≈ 1 %), and errors arising from the use of a fixed purge efficiency in the calibration (for CFC-12 ≈ 2 %) (Stöven and Tanhua, 2014).
The uncertainty increases when using these tracer concentrations to determine ventilation dynamics and calculating mean ages. Consistent with previous studies, we estimate that the input function contributes a bias to the calculations with 5 %–10 % (DeGrandpre et al., 2006; Haine and Richards, 1995; Stöven and Tanhua, 2014; Tanhua et al., 2008). This primarily involves the use of a fixed saturation, here the time dependent saturation from the Labrador Sea (Raimondi et al., 2021), as this varies especially at higher latitudes. Additionally, it includes the assumption of non-linearity in tracer solubility, which is influenced by mixing of different water masses in different ways. A minor contribution to the error caused by the input function is using a mean atmospheric concentration derived from measurements at various facilities in the northern hemisphere (Walker et al., 2000). Although this only introduces a bias of less than 1 %.
The assumptions applied to constrain the TTD, such as steady state conditions, a single source region, no inner water interaction, and an inverse Gaussian shape of the distribution, add another source of uncertainty to the calculation of mean ages. The actual distribution may deviate, particularly due to the mixing of various water masses with different time histories, as seen in the merging of the NACW and LCW. Another source of uncertainty arises from the choice of a specific -ratio, which determines the balance between advective and diffusive flows.
Overall, the combined error, which includes uncertainties from the use of a fixed input function and measurement inaccuracies (the largest contributors), results in an uncertainty of up to 10 %. This error is included in the mean age results in this study.
Another uncertainty arises from the application of the uniform -ratio (1.2) to regions outside the Gulf of St. Lawrence (NACW and LCW), where only CFC-12 measurements were available. This limitation prevents direct determination of local values from tracer pairs and may introduce biases when applying a fixed ratio, as discussed by Guo et al. (2025).
To account for uncertainties in the water mass fraction analysis, we developed a detailed uncertainty budget that explicitly incorporates individual sources of uncertainty. All sources were simultaneously propagated using a Monte Carlo simulation with 10 000 realizations.
The first source of uncertainty comes from the choice of the endmembers for each parameter, including mean age, temperature and salinity. The mean age endmembers were determined by calculating the mean of all measurements since 2010 for each water mass in the Atlantic Ocean. Therefore, the associated error was computed as the standard error of the mean (SEM), as follows:
-
NACW.
- a.
Endmember range of all included measurements: 49–105 years,
- b.
Mean of all included measurements: 86.5 years,
- c.
Standard deviation: ,
- d.
- e.
- a.
-
LCW.
- a.
Endmember range of all included measurements: 7–19 years,
- b.
Mean of all included measurements: 12.5 years,
- c.
Standard deviation: ,
- d.
- e.
- a.
For salinity and temperature endmembers, the range for each water mass were taken from Jutras et al. (2020), and the uncertainty were derived as the standard deviation of a uniform distribution over these ranges (see Eq. D5 through Eq. D8):
-
NACW temperature.
- a.
Endmember range: 4.4–8 °C (±0.2 °C),
- b.
Middle of range: 6.2 °C (±0.2 °C),
- c.
Standard deviation of uniform distribution:
- a.
-
LCW temperature.
- a.
Endmember range: −0.7–3.2 °C (±0.2 °C),
- b.
Middle of range: 1.25 °C (±0.2 °C),
- c.
Standard deviation of uniform distribution:
- a.
-
NACW salinity.
- a.
Endmember range: 35–35.2 psu (±1.2 psu),
- b.
Middle of range: 35.1 psu (±1.2 psu),
- c.
Standard deviation of uniform distribution:
- a.
-
LCW salinity.
- a.
Endmember range: 33.4–35 psu (±0.5 psu),
- b.
Middle of range: 34.2 psu (±0.5 psu),
- c.
Standard deviation of uniform distribution:
- a.
Furthermore, the mean ages observed within the GSL and used in the fraction analysis were assigned a relative uncertainty of 10 % (see Appendix C). To account for model simplifications associated with using a simple linear mixing model and a least square solution, an additional 20 % relative uncertainty was included.
All uncertainties were then jointly propagated using a Monte Carlo simulation with 10 000 realizations (JCGM, 2008), resulting in a final relative uncertainty of approximately 21 % for the estimated LCW fractions.
The transient tracer and CTD data of the two cruises analyzed in this study will be made available through the open research repository “Canadian Integrated Ocean Observing System – St. Lawrence Global Observatory” (CIOOS-SLGO) (https://doi.org/10.26071/d6f3fdfc-788d-48ff; Nesbitt et al., 2026). These datasets are part of an integrated data product documenting a 20-year biogeochemical time series in the Gulf of St. Lawrence region. The metadata is already publicly accessible, while the data itself will be released following the submission of a related data manuscript. Additionally, the CTD data from the DFO AZMP survey can be requested at https://open.canada.ca/en (last access: 16 April 2026). Historical transient tracer data used from the GLODAPv2.2022 data product can be found at https://www.ncei.noaa.gov/access/ocean-carbon-acidification-data-system/oceans/GLODAPv2_2022/ (last access: 15 June 2023).
The supplement related to this article is available online at https://doi.org/10.5194/os-22-1391-2026-supplement.
LG, WAN, SWS and TT conceived the study. LG, WAN, SWS and DWRW coordinated and conducted at-sea campaigns. LG conducted analysis and wrote the manuscript with writing and editorial contributions from all authors.
The contact author has declared that none of the authors has any competing interests.
Publisher's note: Copernicus Publications remains neutral with regard to jurisdictional claims made in the text, published maps, institutional affiliations, or any other geographical representation in this paper. The authors bear the ultimate responsibility for providing appropriate place names. Views expressed in the text are those of the authors and do not necessarily reflect the views of the publisher.
We are grateful to REFORMAR and the captains and crew of the R/V Coriolis II for support on the cruises. We want to thank the National Research Council's Oceans program and the Department of Fisheries and Oceans for providing additional ship time support for the TReX Deep experiment. Specifically, thanks to Dr. Marjolaine Blais for allowing us to participate on the 2022 AZMP cruise and for sharing the data. Finally, we would also like to acknowledge other researchers on board for their support, especially Adriana Reitano, Marshal Thrasher, and Jeshua Becker, and all scientists and technicians who contributed to the data in GLODAPv2.2022.
Financial support for the TReX project was provided by the Marine Environmental Observation, Prediction and Response (MEOPAR) Network of centres of excellence, as well as the Réseau Québec Maritime (RQM) and its Odyssée Saint-Laurent ship-time project. Partial support for student personnel and technical assistance was provided by a NSERC Discovery Grant to Douglas W. R. Wallace (RGPIN-2021-04332). We would like to recognize the financial support of the Government of Nova Scotia to William A. Nesbitt in the form of a four-year NSGS-D scholarship. Samuel W. Stevens participation was supported by a TReX Graduate Award, a UBC Four-Year fellowship, and a postdoctoral fellowship from the Tula Foundation. Lennart Gerke was supported by the Deutsche Forschungsgesellschaft (DFG) through the project “Der arktische Ozean 2020 – Ventilationszeitskalen, anthropogener Kohlenstoff und Variabilität in einer verändernden Umgebung” (TA 317/8-1 and AE 93/21-1).
The article processing charges for this open-access publication were covered by the GEOMAR Helmholtz Centre for Ocean Research Kiel.
This paper was edited by Katsuro Katsumata and reviewed by Mathilde Jutras and two anonymous referees.
Azetsu-Scott, K., Jones, E. P., and Gershey, R. M.: Distribution and ventilation of water masses in the Labrador Sea inferred from CFCs and carbon tetrachloride, Mar. Chem., 94, 55–66, https://doi.org/10.1016/j.marchem.2004.07.015, 2005.
Blais, M., Galbraith, P. S., Plourde, S., and Fisheries, C. L.: Chemical and Biological Oceanographic Conditions in the Estuary and Gulf of St. Lawrence during 2022, Can. Tech. Rep. Hydrogr. Ocean Sci., 357, https://doi.org/10.13140/RG.2.2.24613.88806, 2023.
Blais, M., Galbraith, P. S., Lizotte, M., Clay, S. A., and Starr, M.: Chemical and Biological Oceanographic Conditions in the Estuary and Gulf of St. Lawrence During 2023, report, Can. Tech. Rep. Hydrogr. Ocean Sci., 385, 84 pp., 2024.
Brickman, D., Hebert, D., and Wang, Z.: Mechanism for the recent ocean warming events on the Scotian Shelf of eastern Canada, Cont. Shelf Res., 156, 11–22, https://doi.org/10.1016/j.csr.2018.01.001, 2018.
Bugden, G. L.: Oceanographic conditions in the deeper waters of the Gulf of St. Lawrence in relation to local and oceanic forcing, NAFO Scientific Council Studies Documents, 88, 1–36, 1988.
Bullister, J. L. and Warner, M. J.: Atmospheric Histories (1765–2022) for CFC-11, CFC-12, CFC-113, CCl4, SF6 and N2O (NCEI Accession 0164584), [CFC-12, SF6], NOAA National Centers for Environmental Information [data set], https://doi.org/10.3334/cdiac/otg.cfc_atm_hist_2015, 2017.
Bullister, J. L., Wisegarver, D. P., and Menzia, F. A.: The solubility of sulfur hexafluoride in water and seawater, Deep-Sea Res. Pt. I, 49, 175–187, https://doi.org/10.1016/S0967-0637(01)00051-6, 2002.
Claret, M., Galbraith, E. D., Palter, J. B., Bianchi, D., Fennel, K., Gilbert, D., and Dunne, J. P.: Rapid coastal deoxygenation due to ocean circulation shift in the northwest Atlantic, Nat. Clim. Change, https://doi.org/10.1038/s41558-018-0263-1, 2018.
DeGrandpre, M. D., Körtzinger, A., Send, U., Wallace, D. W. R., and Bellerby, R. G. J.: Uptake and sequestration of atmospheric CO2 in the Labrador Sea deep convection region, Geophys. Res. Lett., 33, https://doi.org/10.1029/2006GL026881, 2006.
Diaz, R. J. and Rosenberg, R.: Spreading Dead Zones and Consequences for Marine Ecosystems, Science, 321, 926–929, https://doi.org/10.1126/science.1156401, 2008.
Dickie, L. and Trites, R.: The Gulf of St. Lawrence, in: Ecosystems of the World: Estuaries and enclosed seas, edited by: Ketchum, B., Elsevier, New York, NY, ISBN 0-444-41921-7, 1983.
Fennel, K. and Testa, J. M.: Biogeochemical Controls on Coastal Hypoxia, Annu. Rev. Mar. Sci., 11, 105–130, https://doi.org/10.1146/annurev-marine-010318-095138, 2019.
Fine, R. A.: Observations of CFCs and SF6 as ocean tracers, Annu. Rev. Mar. Sci., 3, 173–195, https://doi.org/10.1146/annurev.marine.010908.163933, 2011.
Galbraith, P. S.: Winter water masses in the Gulf of St. Lawrence, J. Geophys. Res.-Atmos., 111, https://doi.org/10.1029/2005JC003159, 2006.
Galbraith, P. S., Chassé, J., Shaw, J.-L., Dumas, J., and Bourassa, M.-N.: Physical Oceanographic Conditions in the Gulf of St. Lawrence during 2023, report, Can. Tech. Rep. Hydrogr. Ocean Sci., 378, 91 pp., 2024.
Genovesi, L., de Vernal, A., Thibodeau, B., Hillaire-Marcel, C., Mucci, A., and Gilbert, D.: Recent changes in bottom water oxygenation and temperature in the gulf of st. Lawrence: Micropaleontological and geochemical evidence, Limnol. Oceanogr., 56, 1319–1329, https://doi.org/10.4319/lo.2011.56.4.1319, 2011.
Gerke, L., Arck, Y., and Tanhua, T.: Temporal Variability of Ventilation in the Eurasian Arctic Ocean, J. Geophys. Res.-Oceans, 129, https://doi.org/10.1029/2023JC020608, 2024.
Gilbert, D.: Propagation of temperature signals from the northwest Atlantic continental shelf edge into the Laurentian Channel, in: ICES Council Meeting, N:07, 12 pp., 2004.
Gilbert, D. and Pettigrew, B.: Interannual variability (1948–1994) of the CIL core temperature in the Gulf of St. Lawrence, Can. J. Fish. Aquat. Sci., 54, 57–67, 1997.
Gilbert, D., Sundby, B., Gobeil, C., Mucci, A., and Tremblay, G. H.: A seventy-two-year record of diminishing deep-water oxygen in the St. Lawrence estuary: The northwest Atlantic connection, Limnol. Oceanogr., 50, 1654–1666, https://doi.org/10.4319/lo.2005.50.5.1654, 2005.
Grantham, B. A., Chan, F., Nielsen, K. J., Fox, D. S., Barth, J. A., Huyer, A., Lubchenco, J., and Menge, B. A.: Upwelling-driven nearshore hypoxia signals ecosystem and oceanographic changes in the northeast Pacific, Nature, 429, 749–754, https://doi.org/10.1038/nature02605, 2004.
Guo, H., Koeve, W., Oschlies, A., He, Y.-C., Kemena, T. P., Gerke, L., and Kriest, I.: Dual-tracer constraints on the inverse Gaussian transit time distribution improve the estimation of water mass ages and their temporal trends in the tropical thermocline, Ocean Sci., 21, 1167–1182, https://doi.org/10.5194/os-21-1167-2025, 2025.
Haine, T. W. N. and Richards, K. J.: The influence of the seasonal mixed layer on oceanic uptake of CFCs, J. Geophys. Res., 100, 10727–10744, 1995.
Hall, T. M. and Plumb, R. A.: Age as a diagnostic of stratospheric transport, J. Geophys. Res.-Atmos., 99, 1059–1070, 1994.
Joint Committee for Guides in Metrology (JCGM): Evaluation of measurement data-Supplement 1 to the “Guide to the expression of uncertainty in measurement” – Propagation of distributions using a Monte Carlo method, https://doi.org/10.59161/JCGM101-2008, 2008.
Joyce, T. M. and Zhang, R.: Notes and correspondence: On the Path of the Gulf Stream and the Atlantic meridional overturning circulation, J. Climate, 23, 3146–3154, https://doi.org/10.1175/2010JCLI3310.1, 2010.
Jutras, M., Dufour, C. O., Mucci, A., Cyr, F., and Gilbert, D.: Temporal Changes in the Causes of the Observed Oxygen Decline in the St. Lawrence Estuary, J. Geophys. Res.-Oceans, 125, https://doi.org/10.1029/2020JC016577, 2020.
Jutras, M., Dufour, C. O., Mucci, A., and Talbot, L. C.: Large-scale control of the retroflection of the Labrador Current, Nat. Commun., 14, https://doi.org/10.1038/s41467-023-38321-y, 2023a.
Jutras, M., Mucci, A., Chaillou, G., Nesbitt, W. A., and Wallace, D. W. R.: Temporal and spatial evolution of bottom-water hypoxia in the St Lawrence estuarine system, Biogeosciences, 20, 839–849, https://doi.org/10.5194/bg-20-839-2023, 2023b.
Khatiwala, S., Visbeck, M., and Schlosser, P.: Age tracers in an ocean GCM, Deep-Sea Res. Pt. I, 48, 1423–1441, 2001.
Koutitonsky, V. G. and Budgen, G. L.: The physical oceanography of the Gulf of St. Lawrence : a review with emphasis on the synoptic variability of the motion, Can. Spec. Publ. Fish. Aquat. Sci., 113, 57–90, 1991.
Lauvset, S. K., Lange, N., Tanhua, T., Bittig, H. C., Olsen, A., Kozyr, A., Alin, S., Álvarez, M., Azetsu-Scott, K., Barbero, L., Becker, S., Brown, P. J., Carter, B. R., da Cunha, L. C., Feely, R. A., Hoppema, M., Humphreys, M. P., Ishii, M., Jeansson, E., Jiang, L.-Q., Jones, S. D., Lo Monaco, C., Murata, A., Müller, J. D., Pérez, F. F., Pfeil, B., Schirnick, C., Steinfeldt, R., Suzuki, T., Tilbrook, B., Ulfsbo, A., Velo, A., Woosley, R. J., and Key, R. M.: GLODAPv2.2022: the latest version of the global interior ocean biogeochemical data product, Earth Syst. Sci. Data, 14, 5543–5572, https://doi.org/10.5194/essd-14-5543-2022, 2022.
Lauzier, L. M. and Trites, R. W.: The Deep Waters in the Laurentian Channel, J. Fish. Res. Board Can., 15, 1247–1257, https://doi.org/10.1139/f58-068, 1958.
Lehmann, M. F., Barnett, B., Geĺinas, Y., Gilbert, D., Maranger, R. J., Mucci, A., Sundby, B., and Thibodeau, B.: Aerobic respiration and hypoxia in the lower st. lawrence estuary: Stable isotope ratios of dissolved oxygen constrain oxygen sink partitioning, Limnol. Oceanogr., 54, 2157–2169, https://doi.org/10.4319/lo.2009.54.6.2157, 2009.
Liu, M. and Tanhua, T.: Water masses in the Atlantic Ocean: characteristics and distributions, Ocean Sci., 17, 463–486, https://doi.org/10.5194/os-17-463-2021, 2021.
McLellan, H. J.: On the Distinctness and Origin of the Slope Water off the Scotian Shelf and its Easterly Flow South of the Grand Banks, J. Fish. Res. Board Can., 14, 213–239, https://doi.org/10.1139/f57-011, 1957.
Mucci, A., Starr, M., Gilbert, D., and Sundby, B.: Acidification of Lower St. Lawrence estuary bottom waters, Atmos. Ocean, 49, 206–218, https://doi.org/10.1080/07055900.2011.599265, 2011.
Nesbitt, W. A., Stevens, S. W., Mucci, A. O., Gerke, L., Tanhua, T., Chaillou, G., and Wallace, D. W. R.: The coupled oxygen and carbon dynamics in the subsurface waters of the Gulf and Lower St. Lawrence Estuary and implications for artificial oxygenation, Ocean Sci., 21, 2179–2195, https://doi.org/10.5194/os-21-2179-2025, 2025.
Nesbitt, W., Mucci, A., Tanhua, T., Gelinas, Y., Tremblay, J.-É., Chaillou, G., Pascal, L., Fradette, C., Gerke, L., Stevens, S., Jutras, M., Blais, M., Lizotte, M., Starr, M., and Wallace, D.: Gulf of St. Lawrence and Estuary Dataset: A Quality-Controlled Data Product for Biogeochemistry, St. Lawrence Global Observatory [data set], https://doi.org/10.26071/d6f3fdfc-788d-48ff, 2026.
Raimondi, L., Tanhua, T., Azetsu-Scott, K., Yashayaev, I., and Wallace, D. W. R.: A 30-Year Time Series of Transient Tracer-Based Estimates of Anthropogenic Carbon in the Central Labrador Sea, J. Geophys. Res.-Oceans, 126, https://doi.org/10.1029/2020JC017092, 2021.
Rousseau, S., Lavoie, D., Jutras, M., and Chassé, J.: Transit time of deep and intermediate waters in the Gulf of St. Lawrence, Ocean Model., 195, https://doi.org/10.1016/j.ocemod.2025.102526, 2025.
Saucier, F. J., Roy, F., Gilbert, D., Pellerin, P., and Ritchie, H.: Modeling the formation and circulation processes of water masses and sea ice in the Gulf of St. Lawrence, Canada, J. Geophys. Res.-Oceans, 108, https://doi.org/10.1029/2000jc000686, 2003.
Schneider, A., Tanhua, T., Körtzinger, A., and Wallace, D. W. R.: An evaluation of tracer fields and anthropogenic carbon in the equatorial and the tropical North Atlantic, Deep-Sea Res., 67, 85–97, https://doi.org/10.1016/j.dsr.2012.05.007, 2012.
Shao, A. E., Mecking, S., Thompson, L. A., and Sonnerup, R. E.: Evaluating the use of 1-D transit time distributions to infer the mean state and variability of oceanic ventilation, J. Geophys. Res.-Oceans, 121, 6650–6670, https://doi.org/10.1002/2016JC011900, 2016.
Shaw, J. L. and Galbraith, P. S.: Climatology of Transport in the Strait of Belle Isle, J. Geophys. Res.-Oceans, 128, https://doi.org/10.1029/2022JC019084, 2023.
Sonnerup, R. E., Mecking, S., and Bullister, J. L.: Transit time distributions and oxygen utilization rates in the Northeast Pacific Ocean from chlorofluorocarbons and sulfur hexafluoride, Deep-Sea Res. Pt. I, 72, 61–71, https://doi.org/10.1016/j.dsr.2012.10.013, 2013.
Stevens, S. W., Pawlowicz, R., Tanhua, T., Gerke, L., Nesbitt, W. A., Drozdowski, A., Chassé, J., and Wallace, D. W. R.: Deep inflow transport and dispersion in the Gulf of St. Lawrence revealed by a tracer release experiment, Commun. Earth Environ., 5, 1–13, https://doi.org/10.1038/s43247-024-01505-5, 2024.
Stöven, T. and Tanhua, T.: Ventilation of the Mediterranean Sea constrained by multiple transient tracer measurements, Ocean Sci., 10, 439–457, https://doi.org/10.5194/os-10-439-2014, 2014.
Stöven, T., Tanhua, T., Hoppema, M., and Bullister, J. L.: Perspectives of transient tracer applications and limiting cases, Ocean Sci., 11, 699–718, https://doi.org/10.5194/os-11-699-2015, 2015.
Talley, L. D., Feely, R. A., Sloyan, B. M., Wanninkhof, R., Baringer, M. O., Bullister, J. L., Carlson, C. A., Doney, S. C., Fine, R. A., Firing, E., Gruber, N., Hansell, D. A., Ishii, M., Johnson, G. C., Katsumata, K., Key, R. M., Kramp, M., Langdon, C., Macdonald, A. M., Mathis, J. T., McDonagh, E. L., Mecking, S., Millero, F. J., Mordy, C. W., Nakano, T., Sabine, C. L., Smethie, W. M., Swift, J. H., Tanhua, T., Thurnherr, A. M., Warner, M. J., and Zhang, J.-Z.: Changes in Ocean Heat, Carbon Content, and Ventilation: A Review of the First Decade of GO-SHIP Global Repeat Hydrography, Annu. Rev. Mar. Sci., 8, 185–215, https://doi.org/10.1146/annurev-marine-052915-100829, 2016.
Tanhua, T., Anders Olsson, K., and Fogelqvist, E.: A first study of SF 6 as a transient tracer in the Southern Ocean, Deep-Sea. Res. Pt. II, 51, 2683–2699, https://doi.org/10.1016/j.dsr2.2001.02.001, 2004.
Tanhua, T., Olsson, K. A., and Jeansson, E.: Formation of Denmark Strait overflow water and its hydro-chemical composition, J. Marine Syst., 57, 264–288, https://doi.org/10.1016/j.jmarsys.2005.05.003, 2005a.
Tanhua, T., Bulsiewicz, K., and Rhein, M.: Spreading of overflow water from the Greenland to the Labrador Sea, Geophys. Res. Lett., 32, 1–4, https://doi.org/10.1029/2005GL022700, 2005b.
Tanhua, T., Waugh, D. W., and Wallace, D. W. R.: Use of SF6 to estimate anthropogenic CO2 in the upper ocean, J. Geophys. Res.-Oceans, 113, https://doi.org/10.1029/2007JC004416, 2008.
Thibodeau, B., de Vernal, A., and Mucci, A.: Recent eutrophication and consequent hypoxia in the bottom waters of the Lower St. Lawrence Estuary: Micropaleontological and geochemical evidence, Mar. Geol., 231, 37–50, https://doi.org/10.1016/j.margeo.2006.05.010, 2006.
Trossman, D. S., Thompson, L., Mecking, S., and Warner, M. J.: On the formation, ventilation, and erosion of mode waters in the North Atlantic and Southern Oceans, J. Geophys. Res.-Oceans, 117, https://doi.org/10.1029/2012JC008090, 2012.
Walker, S. J., Weiss, R. F., and Salameh, P. K.: Reconstructed histories of the annual mean atmospheric mole fractions for the halocarbons CFC-11, CFC-12, CFC-113, and carbon tetrachloride, J. Geophys. Res.-Oceans, 105, 14285–14296, https://doi.org/10.1029/1999jc900273, 2000.
Warner, M. J. and Weiss, R. F.: Solubilities of chlorofluorocarbons 11 and 12 in water and seawater, Deep-Sea Res., 32, 1485–1497, https://doi.org/10.1016/0198-0149(85)90099-8, 1985.
Waugh, D. W., Vollmer, M. K., Weiss, R. F., Haine, T. W. N., and Hall, T. M.: Transit time distributions in Lake Issyk-Kul, Geophys. Res. Lett., 29, https://doi.org/10.1029/2002gl016201, 2002.
Waugh, D. W., Hall, T. M., and Haine, T. W. N.: Relationships among tracer ages, J. Geophys. Res., 108, https://doi.org/10.1029/2002jc001325, 2003.
- Abstract
- Introduction
- Hydrography
- Data and Methods
- Results and Discussion
- Conclusions
- Appendix A: Analysis system
- Appendix B: Transit time distribution (TTD) analysis
- Appendix C: Uncertainty estimates for mean age determination
- Appendix D: Uncertainty budget for linear water mass fraction analysis
- Data availability
- Author contributions
- Competing interests
- Disclaimer
- Acknowledgements
- Financial support
- Review statement
- References
- Supplement