the Creative Commons Attribution 4.0 License.
the Creative Commons Attribution 4.0 License.
 | 10 Apr 2026
Distributed optical fibre sensing in physical oceanography: emergence and future prospects
Alberto C. Naveira Garabato
Carl P. Spingys
Andrew J. Lucas
Tiago S. Dotto
Christian T. Wild
Scott W. Tyler
Ted A. Scambos
Christopher B. Kratt
Giuseppe Cappelli
Ethan F. Williams
Mariona Claret
Hannah E. Glover
Meagan E. Wengrove
Madison M. Smith
Michael G. Baker
Giuseppe Marra
Max Tamussino
Zitong Feng
David Lloyd
Liam Taylor
Mikael Mazur
Maria-Daphne Mangriotis
Aaron Micallef
Jennifer Ward Neale
Oleg A. Godin
Matthew H. Alford
Emma P. M. Gregory
Michael A. Clare
Hamid Shiri
Angel Ruiz Angulo
Kathryn L. Gunn
Ben I. Moat
Isobel A. Yeo
Afonso Loureiro
Alessandro Silvano
Arthur Hartog
Mohammad Belal
Distributed optical fibre sensing (DOFS) is a technology that enables continuous, real-time measurements of a range of environmental parameters along the length of a fibre optic cable. In this article, we review the recently emerged applications of DOFS techniques in physical oceanography and offer a perspective on the technology's potential for future growth within the field. The introduction of DOFS to physical oceanography is contextualised with a brief history of the technology, which spun off primarily from the use of seafloor-laid optical fibres for telecommunications purposes. The key components and underpinning physics of a DOFS system are outlined and, on their basis, the suite of variables that are observable with DOFS are discussed. The implementation factors of DOFS, which include trade-offs between measurement accuracy and spatio-temporal resolutions and ranges, are also examined. The physical oceanographic applications of DOFS to date are then illustrated with case examples of four distinct DOFS techniques: distributed temperature sensing (DTS), which can provide ocean temperature observations; distributed static strain sensing (DSS) and distributed acoustic sensing (DAS), which are sensitive to temperature, cable strain and strain-associated variables, such as pressure and ocean velocity; and ultra-long-range observations of ocean currents with optical interferometry. The forthcoming prospects of DOFS in physical oceanography are considered, and are proposed to include new fibre optic-based approaches to sense ocean salinity and measure through the water column. We conclude with reflections on the future role of DOFS within the Global Ocean Observing System, and highlight the opportunities provided by the existing world-wide network of seafloor-laid optical fibres.
- Article
(15518 KB) - Full-text XML
- BibTeX
- EndNote


Distributed optical fibre sensing (DOFS) is a suite of techniques that use light to determine the spatial distribution of a physical parameter along a section of optical fibre (Hartog, 2017). DOFS entails the repeated firing of coherent light signals by an optoelectronic device (called an interrogator) placed at one end of the fibre. As each light signal propagates along the fibre, inhomogeneities in the fibre introduced by its manufacturing process (or, in some cases, reflective elements deliberately inserted into the fibre) cause the light to scatter from different fibre segments back toward the interrogator, which samples the returning light. The properties of this returned light contain information on the physical characteristics of the cable segment from which the light was backscattered and the segment's environment. Unravelling the precise relationships between backscattered light properties and environmental variables – a fundamental challenge of DOFS – enables such variables to be measured by the fibre optic cable, often at high effective spatial and temporal resolutions [down to O(1 m) and O(1 s), respectively], over long distances and periods [up to O(10–1000 km) and several years], and in near real time.
Seafloor cables have a long history of use for observations of along-cable average or integrated oceanic variables. The few examples of such cable operations include measurements of average seafloor temperature, available from 1906 to 1962 (Hansen et al., 1994); and a daily record of the integrated Florida Current transport, obtained since 1982 under a requirement of frequent calibration (Larsen and Sanford, 1985). The exploitation of seafloor cables for distributed sensing of ocean properties is, however, a new development. An explosion of DOFS applications – to be reviewed and illustrated in this article – is currently underway in physical oceanography. Yet, while their emergence in this field is recent, DOFS approaches have been in use in other areas of environmental science and engineering since at least the 1990s, with a breadth of applications in the energy and resource exploration industries (Ashry et al., 2022), urban environmental monitoring (Fakhruzi et al., 2025; Liu et al., 2025b), seismology and geohazards research (Anjana et al., 2024; Donadello et al., 2024), soil science (Sun et al., 2022) and glaciology (Kobs et al., 2014; Law et al., 2021), amongst others. This richness of applications across multiple disciplines is enabling rapid progress in the uptake and adaptation of DOFS approaches for the observation of ocean physics, especially near (within tens of kilometres of) coastlines. Such applications often benefit from having the interrogator based on land in benign environmental conditions and with the ability to provide real-time data access. Concurrently, fresh developments in fibre optic technologies promise to open up new measurement possibilities, by potentially expanding the suite of observable variables and the spatio-temporal domain and resolution of sampling. These developments include: air-guided fibres, which provide substantially lower energy loss than conventional fibres (Petrovich et al., 2025); few-mode fibres capable of guiding several distinct modes (Lu et al., 2022), offering improved signal quality and, in some cases, cleaner discrimination between measured variables; and multicore fibres (Xu et al., 2025), which can sense the shape of the backscattered light signal. Importantly, these technologies use the optical fibre at the core of a seafloor cable as the sensor, thereby facilitating the application of DOFS approaches to the existing global cable network. This stands in contrast to the usage of cables for localised ocean observations, such as in the SMART (Science Monitoring And Reliable Telecommunications) initiative (Howe et al., 2022) – a contrast that can offer interesting observing synergies.
The range of existing and emerging DOFS techniques with relevance to physical oceanography is synthesised in Fig. 1, within the context of the ocean circulation's spatio-temporal scales and main dynamical features. This synthesis highlights the rather unique niche that DOFS is beginning to fill in ocean observation. With its capacity to simultaneously sample almost all of the ocean's space-time spectrum, DOFS can provide information on the dynamical connections between oceanic motions and property changes across a breadth of scales. Elucidating these connections lies at the heart of many unresolved fundamental problems and pressing challenges in physical oceanography – from the multi-faceted roles of submesoscale and small-scale turbulent processes in the ocean's energy cycle (Naveira Garabato et al., 2022; Schubert et al., 2023) to the representation of complex surface and bottom boundary layer physics in climate-scale ocean models (Fox-Kemper et al., 2019; Sane et al., 2023). As illustrated in Fig. 1, the majority of DOFS approaches that have already been demonstrated in an oceanographic setting can obtain measurements of temperature and/or pressure (or pressure-manifested variables, such as ocean velocity and cable strain) only in the immediate proximity of a fibre optic cable deployed along the ocean floor. Such acute near-cable confinement of the observable domain may appear as a major limitation; however, other techniques are capable (at least in principle) of providing depth-resolved or depth-integrated measurements over the water column from bottom-placed cables, by exploiting the fibre's sensitivity to pressure signals and propagating acoustic waves. Thus, there is potential for DOFS and associated techniques to help tackle extant blindspots in the ocean circulation observing system.
In this article, we review the fundamentals of DOFS and its breadth of applications to the measurement of ocean physics, and provide a perspective on the technology's future prospects in the field. We commence by outlining the historical context of the development of DOFS, the optical physics governing DOFS approaches, and the key implementation factors that must be considered in applying these techniques to observing the ocean (Sect. 2). We then illustrate each existing field-proven DOFS approach with a real-world application, to introduce the reader to the type of data and oceanic phenomena that each DOFS technique can capture (Sect. 3). In Sect. 4, we discuss a range of emergent and over-the-horizon DOFS approaches that may in future expand what, where and when can be observed with fibre optic cables. Finally, we offer concluding thoughts in Sect. 5.
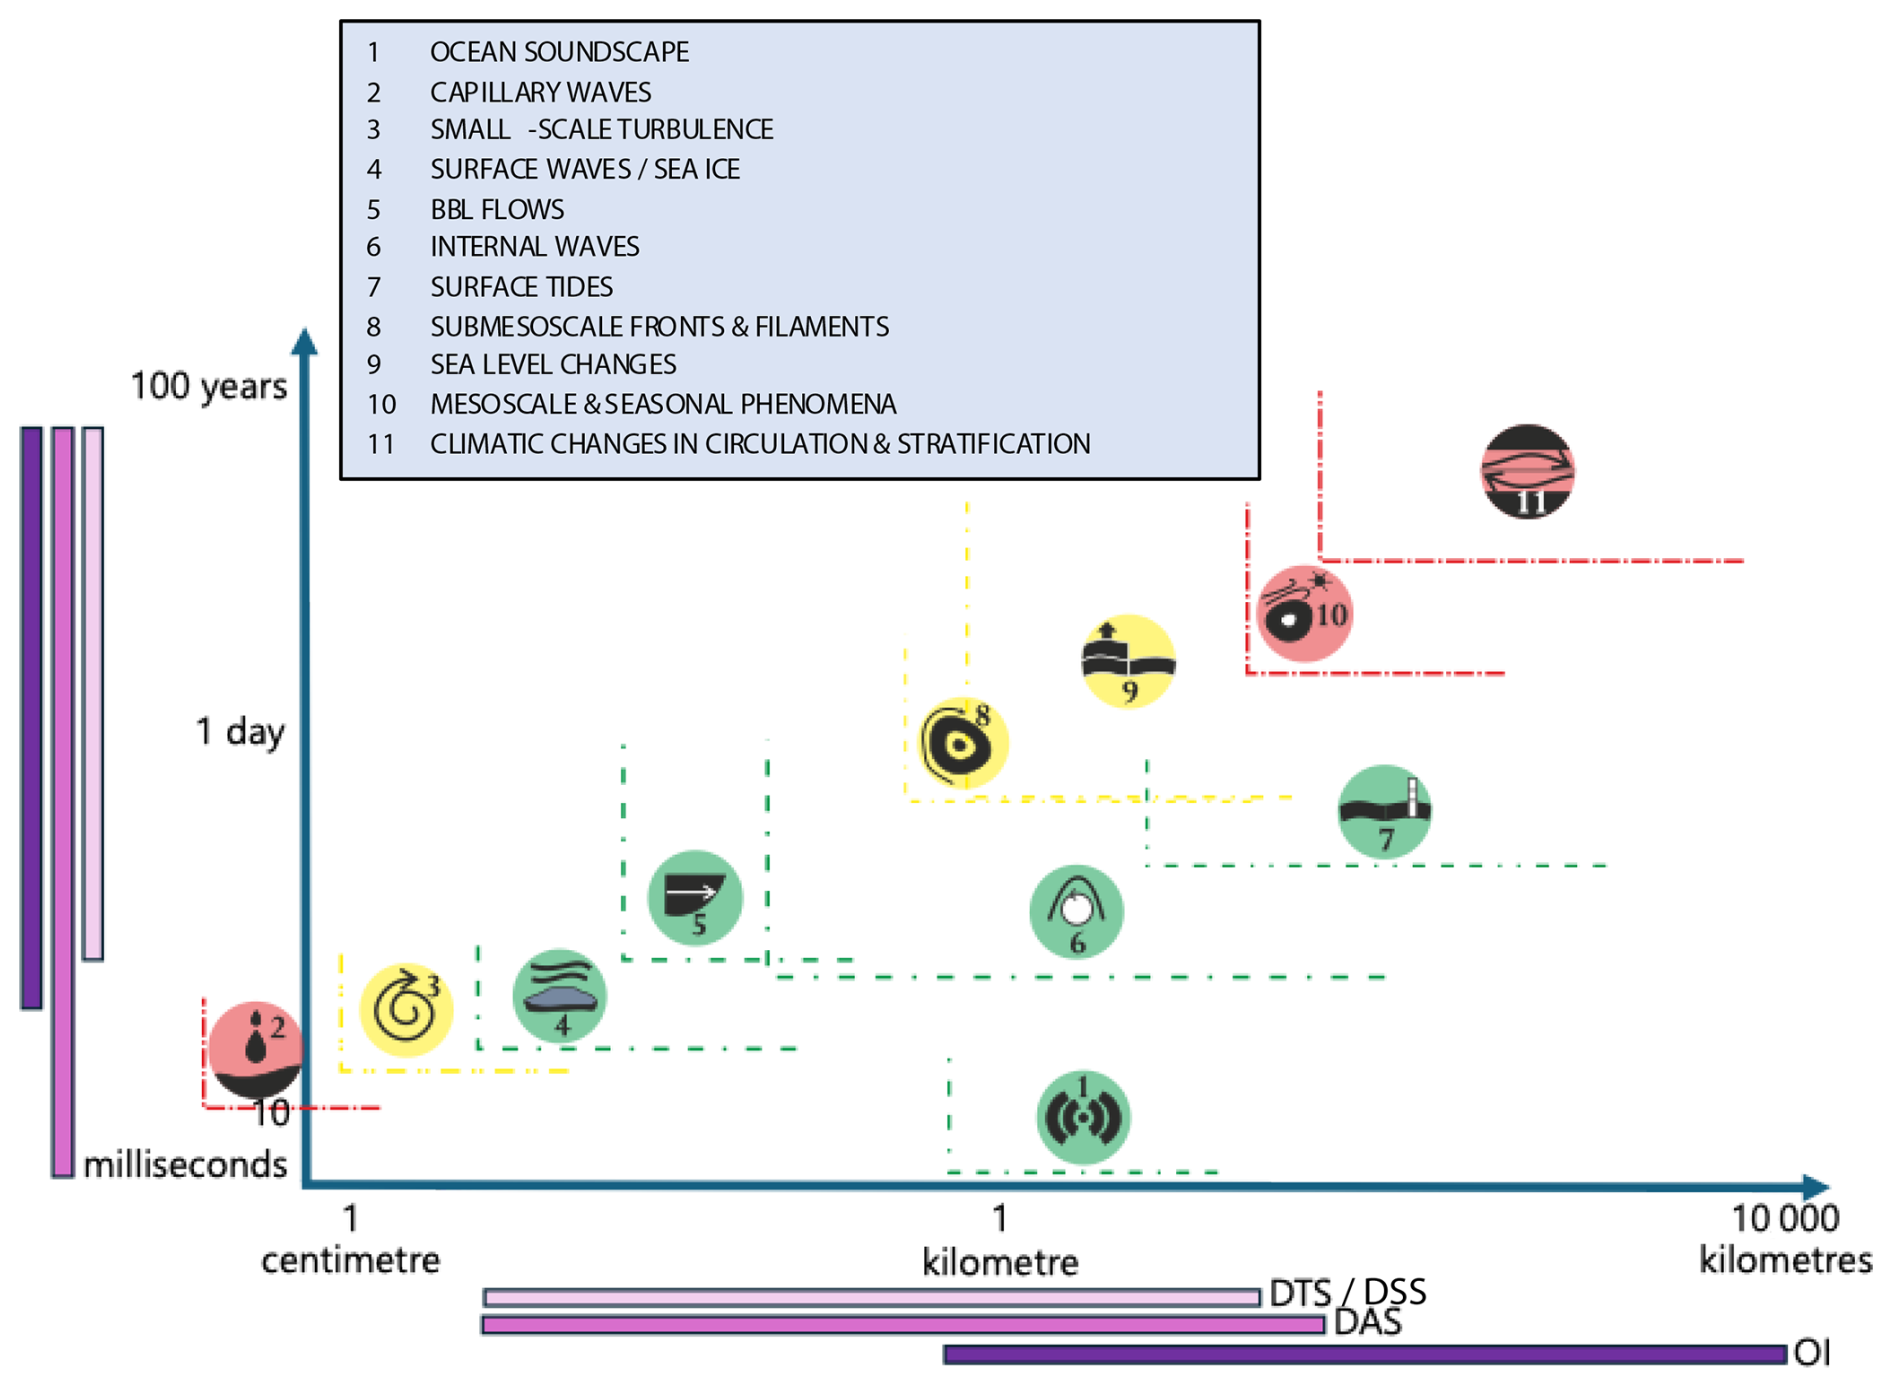
Figure 1Stommel diagram illustrating the alignment between characteristic spatial and temporal scales of different oceanic phenomena (shown by the numbered pictograms, with phenomena defined in the box at the top of the figure, and each phenomenon's range of scales marked by the dashed axes) and the various DOFS techniques (indicated by the coloured bars on each figure axis; DTS: distributed temperature sensing; DSS: distributed static strain sensing; DAS: distributed acoustic sensing; OI: optical interferometry). The colour of each pictogram denotes the technology readiness level (TRL; see e.g., Manning, 2023) of DOFS as a tool to observe the corresponding phenomenon. (Note that, in most cases, the DOFS interrogation hardware and data processing are well established and commercially available, equivalent to a TRL 9; however, physical oceanographic applications of DOFS usually have a much lower TRL, as this figure illustrates.) Green shading indicates that DOFS measurements of the process have been demonstrated in the relevant environment (TRL 3–4). Yellow shading refers to a preliminary state of readiness (TRL 2). Red shading signifies that the phenomenon is expected to be measurable with DOFS, but that such observation has not yet been demonstrated (TRL 1).
In this section, we begin by providing a brief historical framing of DOFS, for readers interested in how this technology came about. Other readers may skip to Sect. 2.2, in which we introduce the system components of, and physics governing, DOFS.
2.1 A brief history of DOFS
Technological advancements are rarely isolated. Rather, they build upon key, preceding innovations and breakthroughs. The rapid progress of any field depends on fundamental discoveries, critical refinements and, often, the convergence of multiple disciplines. The field of DOFS is no exception to this narrative. The emergence of DOFS has been driven by developments in optical fibre communications, including low-loss silica fibres, high-power laser diodes, optical amplifiers, and advanced signal processing techniques. These technologies not only revolutionised data transmission, but also unlocked new capabilities in sensing, enabling optical fibres to serve as distributed sensors for monitoring structural health (Bado and Casas, 2021), environmental conditions (Sun et al., 2021; Rovera et al., 2023), and security threats (Jaaskelainen, 2009). Understanding the innovations that led to these advancements illustrates the important interplay between fundamental research and real-world applications.
Although DOFS has flourished in the 21st century, its initial demonstration and deployments date from the 1980s and 1990s, and were preceded by several foundational breakthroughs. For example, the optical waveguide, which is essential to the concept of DOFS, can be traced back to the mid 19th century (Colladon, 1842). Lasers, which provide the coherent light essential for DOFS, were developed more than a century later (Schawlow and Townes, 1958; Gould, 1959). Another major milestone was the practical development of glass fibres for guiding light, which was catalysed by the seminal work of Kao and Hockham (1966). Their research demonstrated the feasibility of a complete communication system using low-loss silica-based optical fibres, thus laying the foundations for modern fibre optic technology. Specifically, they showed that the transmission loss of silica was well below the then accepted maximum threshold of 20 dB km−1, which had been identified as the requirement to compete with microwave free-space transmission. At that time, commercially available optical fibres exhibited losses of around 4000 dB km−1 but, with just six years of intensive research, such losses were reduced to 4 dB km−1 (Keck et al., 1973). A further six years of advances brought attenuation close to the fundamental limit for silica-based glass, reaching 0.2 dB km−1 (Miya et al., 1979). This value translated into a mere order-of-magnitude signal loss over 50 km, and so enabled the widespread adoption of the optical fibre as a transmission medium. Further sustained developments followed, e.g.: in-line optical amplification (Mears et al., 1987, Desurvire et al., 1987, Poole et al., 1986); operation in the low-loss transmission window around 1550 nm (Miya et al., 1979); the widespread adoption of coherent detection (Yamamoto and Kimura, 1981), implemented via new narrow-linewidth lasers; polarization control and multiplexing; and improvements in spectral efficiency, with fibre capacities now reaching multiple terabits per second (Tb s−1) via ever more sophisticated multiplexing and coding schemes (Hillerkuss et al., 2011). All such advances have made optical fibres a critical tool for global communications, supporting from fibre-to-the-home to massive intercontinental data transmission capacity.
Galvanised by these telecommunication-focussed advances, the potential of optical fibres to be used as sensing elements – where the properties of the light propagating through the fibre are modulated by one or more environmental variables, and the backscattered light measured and analysed by a detection and acquisition system (the interrogator) to sense such variables – began to be explored as early as the 1970s. It was then that Vali and Shorthill (1976) proposed the incorporation of optical fibres into a Sagnac interferometer to develop a compact gyroscope, which could be used to measure the evolving orientation of the fibre. From that moment on, optical fibres became increasingly available in laboratories, and a number of research programmes set off to investigate the fibres' sensing attributes. This included important early marine applications through the development of optical fibre hydrophones and associated hydrophone arrays deployed on the seafloor (Bucaro et al., 1977; Cranch et al., 2004; Meng et al., 2021). Some of the initial results from the U.S. Naval Research Laboratory, a pioneer in this field, were summarised by Giallorenzi et al. (1982). All in all, these results reaffirmed the excellent prospects of optical fibres as sensors, and motivated the emergence of an industry centred on the development and exploitation of the fibres' sensing capabilities. The energy sector's requirement for distributed measurements in deep boreholes, in particular, provided significant impetus for technological progress in fibre sensing.
The optical fibre sensing industry was enabled by the widespread adoption across human society of fibre telecommunications. The mass production of fibres, light sources, receivers and other telecommunication-essential components has drastically reduced costs, making fibre-based sensors viable despite their relatively small market size. Without these economies of scale, the cost of developing and manufacturing optical fibre sensors would be prohibitively high. However, this dependence on telecommunications has also imposed certain constraints on optical fibre sensors, such as standardisation around specific operating wavelengths and fibre designs. Concurrently, the telecommunications sector has also benefitted from advances driven by the sensing industry, with e.g., some optical components (such as fibre couplers/power splitters) being developed and refined for sensor applications before their routine use in telecommunications (Sheem, 1981; Sheem and Giallorenzi, 1979). When optical fibre sensors require components that diverge from telecommunications standards, costs can increase significantly. For example, standard telecommunication fibres are typically designed for operation at up to 70 °C, a limitation dictated by their primary coatings. In contrast, high-temperature-resistant fibres capable of withstanding 300 °C or more are commercially available but, as they are produced in much smaller quantities with slower on-line coating processes, their prices are up to two orders of magnitude higher than those of standard telecommunication fibres. Thus, the specifics of the interplay between the telecommunications and sensing industries can place some practical constraints on the design of DOFS systems.
2.2 DOFS system components and governing physics
As outlined in Sect. 1, a DOFS system (Fig. 2a) has the function of repeatedly measuring the spatial distribution of a physical quantity (often termed the measurand in the DOFS literature) along the length of an optical fibre. The system has three main components: (i) the sensing fibre, which is deployed in the environment of interest, and acts as both the sensor and the transmission medium for optical signals; (ii) the interrogator, an optoelectronic instrument that injects probe light into the fibre, detects the returning signal, and processes it to estimate the spatial distribution of the measurand along the fibre; and (iii) a software module performing the signal post-processing for event detection, classification, localisation and final conversion to the pertinent inferred measurand. By recurrently sampling the sensing fibre with light signals, the DOFS system can record observations of the temporal changes in the spatial distribution of the measurand. The system's spatially distributed nature stems from each fibre segment acting as an independent sensing element. Typically, time-of-flight measurements (i.e. measurements of the time elapsed between firing and return of a given light signal) are used to map the measurand's distribution along the fibre, using a technique known as optical time-domain reflectometry (Hartog, 2017).
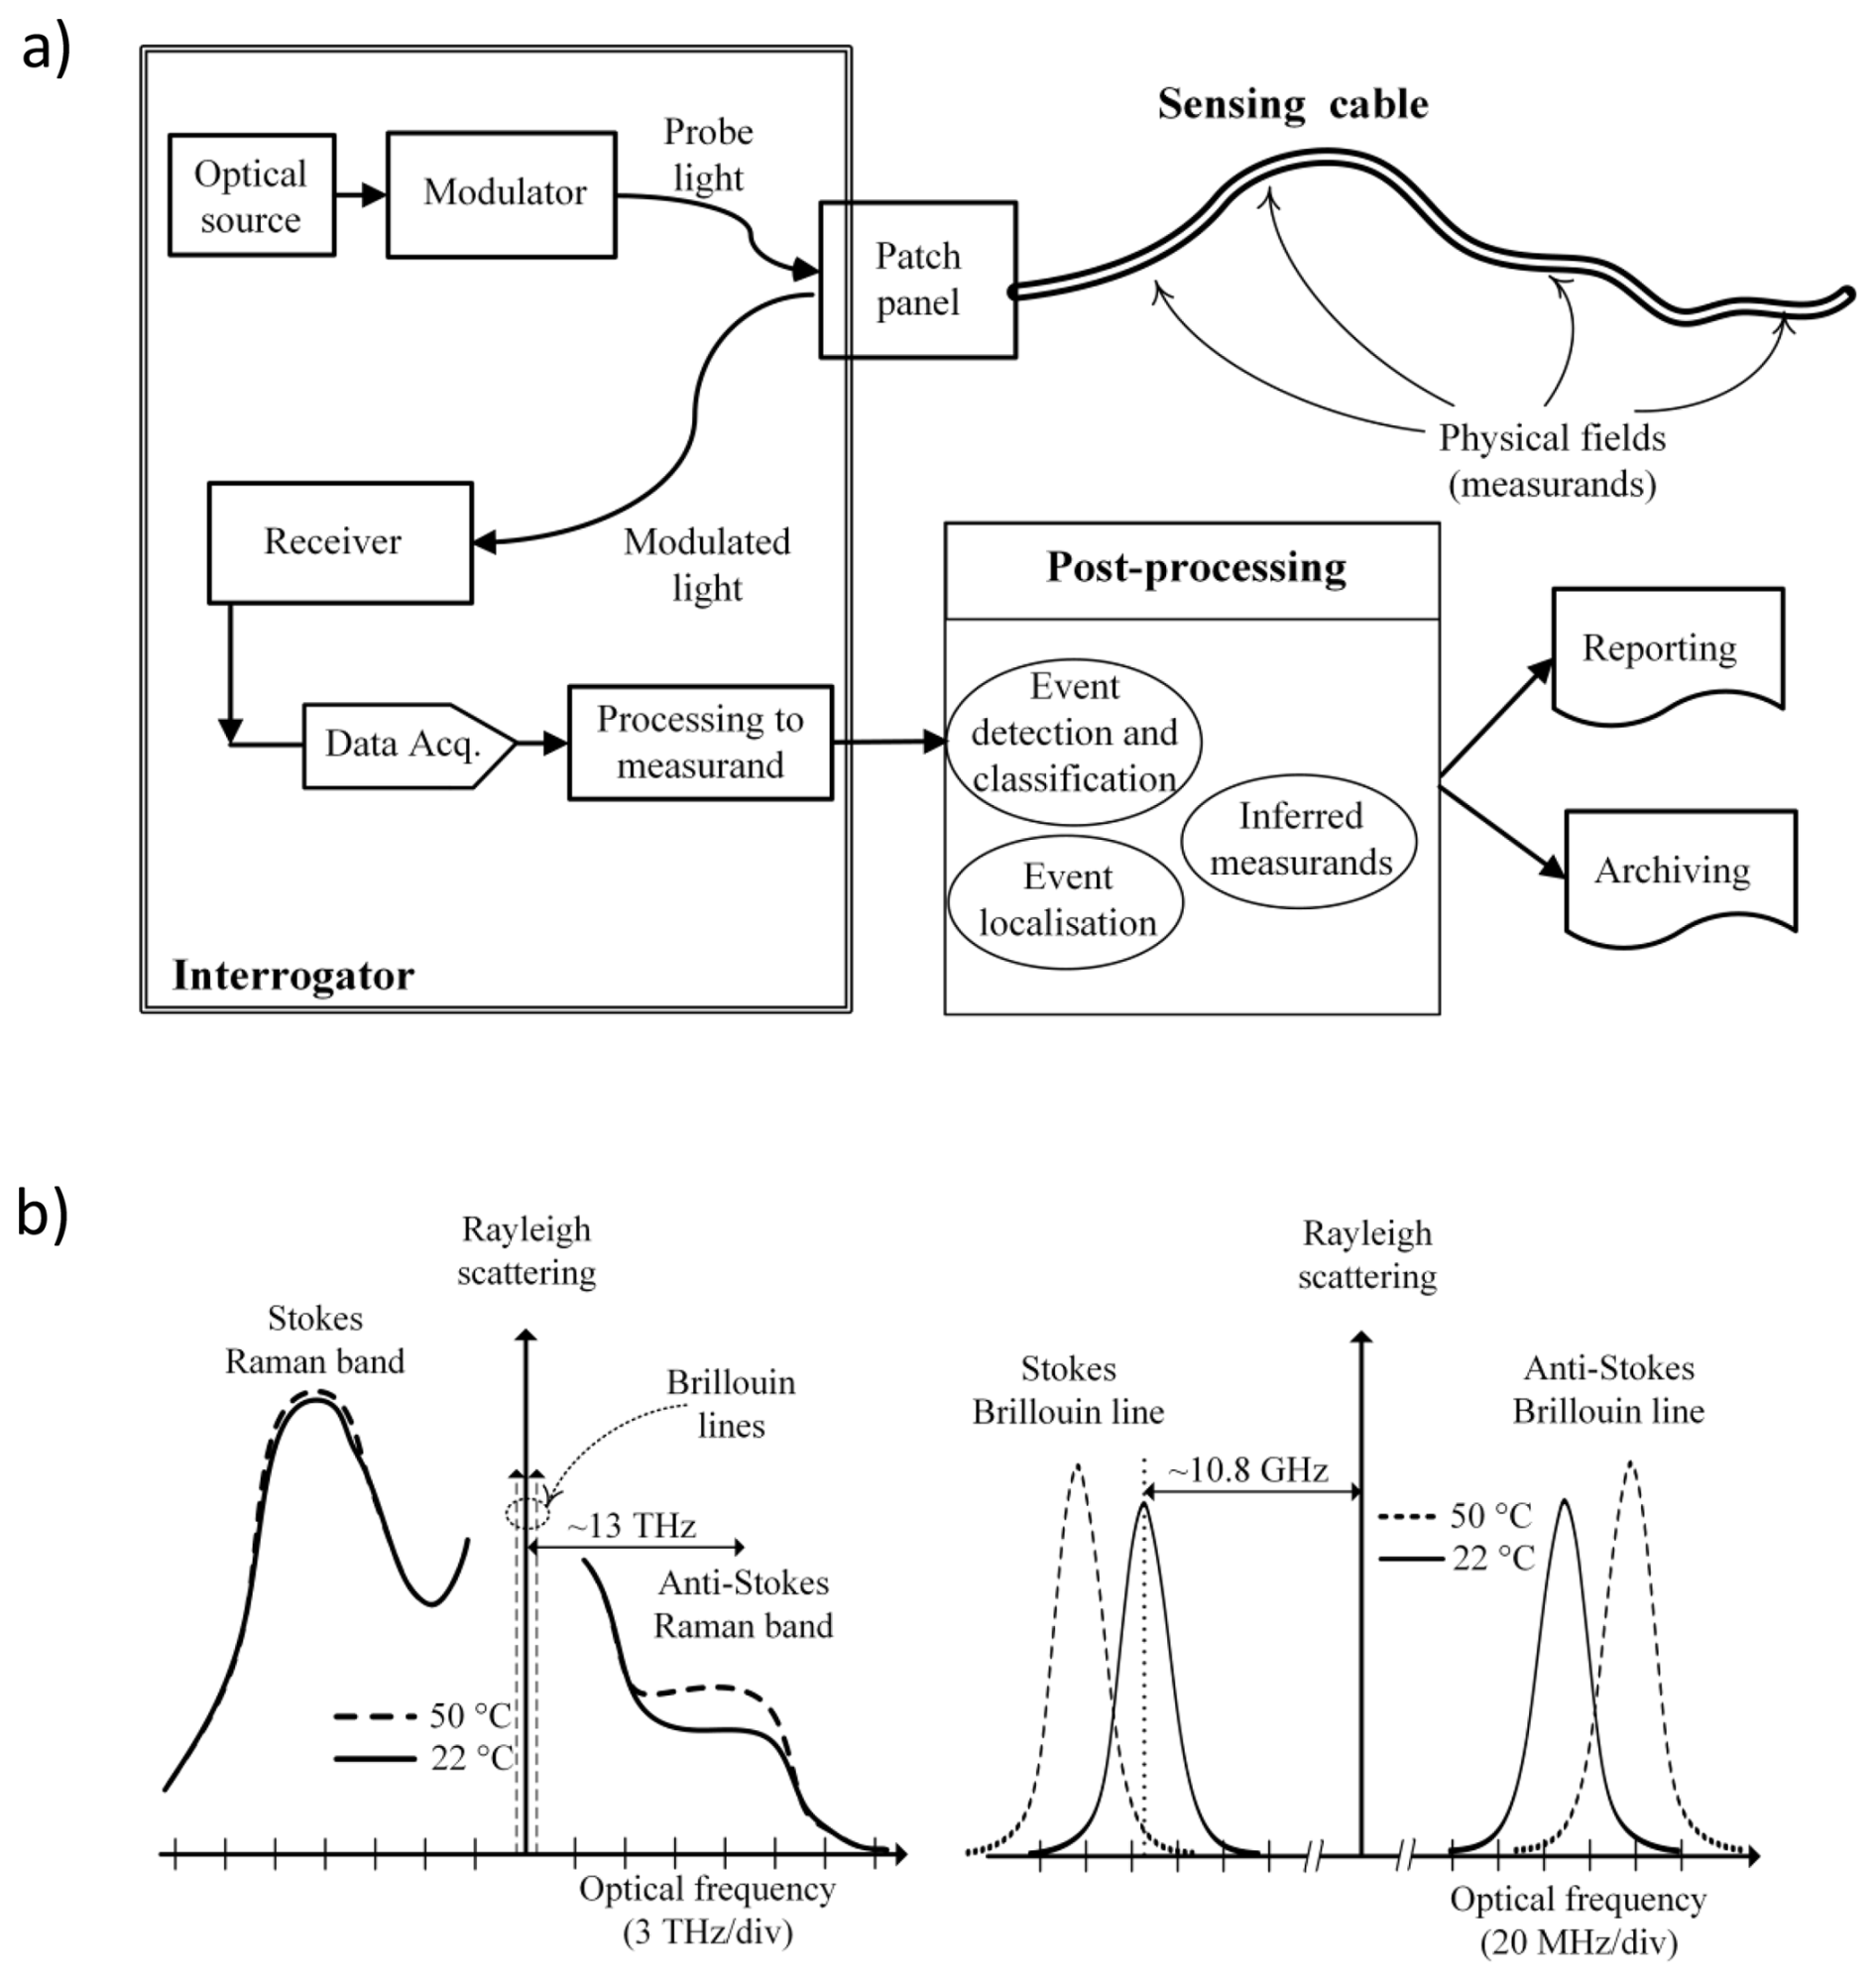
Figure 2(a) Schematic of a DOFS system, its components and processes. (b) Spectral illustration of the scattering phenomena used by DOFS, with the vertical axis representing the intensity of each scattering signal. The right panel is a zoomed in version of the box bounded by the dashed line on the left panel.
The sensing process at the heart of DOFS hinges on the return of an interrogator-transmitted light signal from each discernible point along the optical fibre. Such return entails, first, the backscattering of the light from density inhomogeneities in the fibre; and, second, the interrogator's recapturing of the backscattered light, even at extremely low levels. This extreme sensitivity enables precise, high-resolution sensing over long distances. The properties of the returned light (e.g., intensity, polarisation, phase, propagation time, optical spectrum and coherence) are measured by the interrogator commonly through a process of optical heterodyning (Ip et al., 2008) and can be related to external influences, i.e. to a range of environmental variables affecting the fibre via thermal, mechanical and/or electromagnetic forcings. To determine the exact relationships between the variables that we wish to observe and the measured light properties, it is essential to understand the physics governing the backscattering of the probe light.
Scattering takes place when a wave travels through a medium with local inhomogeneities, which cause variations in the wave's propagation speed. In optical fibres, scattering arises specifically due to local fluctuations in the fibre's refractive index. Variations in the refractive index of modern fibres occur on sub-wavelength scales (typically tens of nanometres), i.e. on along-fibre distances much smaller than the probe light's wavelength (typically 1530–1625 nm). Three main scattering mechanisms (represented schematically in Fig. 2b) underpin the vast majority of DOFS approaches, namely:
-
Rayleigh scattering, a form of elastic (i.e. preserving the incident photons' energy or, equivalently, frequency) scattering caused by microscopic, random density fluctuations in the fibre's glass structure.
-
Brillouin scattering, a form of inelastic (i.e. implicating changes to the photons' energy or frequency, typically by 11 GHz) scattering that results from interaction between light and thermally-induced acoustic waves (termed phonons) within the fibre.
-
Raman scattering, a form of inelastic scattering (with a characteristic frequency shift of 13 THz) that arises from the incident light's interaction with molecular vibrations within the fibre material.
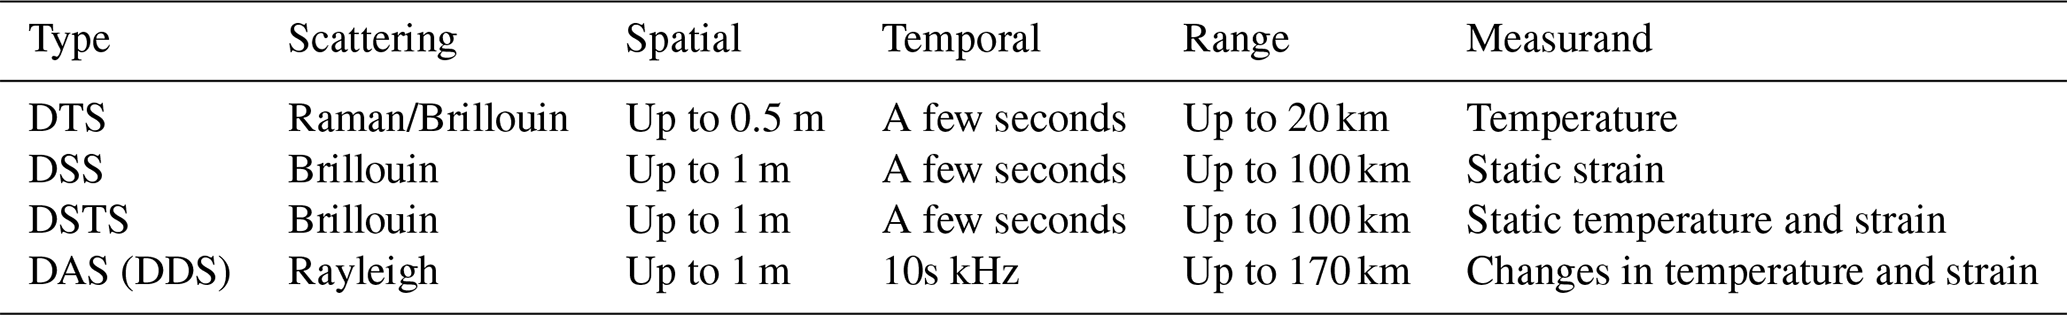
Each of the above scattering mechanisms enables different measurands (e.g., temperature, strain or acoustic/vibration properties) to be sensed, and underpins one or several distinct types of DOFS technologies1, summarised in Table 1:
-
Distributed Temperature Sensing (DTS), which exploits the thermal sensitivity of Raman and/or Brillouin scatterings (Fig. 2b) to derive the temperature along the fibre.
-
Distributed Static Strain Sensing (DSS), which uses Brillouin scattering (specifically, the Brillouin frequency shift; Fig. 2b) to sense strain variations along the fibre. However, since such frequency shift also has thermal sensitivity, DSS measurements can be influenced by changes in the temperature of the fibre. This provides the rationale for DSTS, outlined next.
-
Distributed Static Temperature and Strain Sensing (DSTS), which relies on Brillouin scattering (in this case, both the Brillouin frequency shift and signal intensity; Fig. 2b) to assess the coupled temperature and strain changes along the fibre.
-
Distributed Dynamic Sensing (DDS), which uses Rayleigh scattering to detect changes in temperature, pressure and strain, as well as vibrations, along the fibre. DDS is most often referred to in the literature as Distributed Vibration Sensing (DVS) or Distributed Acoustic Sensing (DAS). As the latter term is the most common, we will adopt it in the remainder of this article.
Table 1Overview of DOFS technologies and their basic characteristics. In the case of DTS, the range can depend strongly on the scattering process (Raman vs. Brillouin), measurement precision target, fibre type (single-mode vs. multimode), and processing technique choices (e.g., Soto et al., 2011; Li et al., 2025b). Note that the ultra-long-range optical interferometry approach outlined in Sect. 3.4 is not included in this table, due to the technique's non-dependence on a scattering process.
In the following, we will briefly review the range of factors that must be considered in implementing any of these DOFS technologies.
2.3 Implementation factors of DOFS
The outputs from DOFS systems vary significantly depending on the scattering mechanism and measurement of interest for a particular application. Generally, the performance of a DOFS system can be evaluated in terms of four factors, which must be taken into account to optimise the system's fitness for purpose: the spatial resolution, temporal resolution, range, and quality of reproduction of the measurand. These are discussed in sequence next.
-
Spatial resolution. One of the strengths of DOFS for oceanographic research is the near-continuous spatial sampling, enabled by the backscattering of each optical signal from many contiguous small segments along the fibre. The spatial resolution of DOFS typically ranges from 1 to 10 m, depending on the specifics of the application – as the distribution of heterogeneities in the fibre is unknown, and it is necessary to integrate along a length. However, under specialised conditions, resolutions as fine as 10 mm have been demonstrated (Hotate, 2019; Tanner et al., 2011). In some cases, this spatial resolution can be increased through the geometry of the fibre; e.g., tightly wrapping a fibre around a cylinder has achieved resolutions of less than 1 cm (Selker et al., 2006; Hilgersom et al., 2016). It is important to note that the spatial resolution of measurements made by these systems represents the average along a segment of cable, in contrast to many oceanographic instruments that make measurements at a specific point. This can lead to an under-reporting of extreme values where the spatial scale of the change in a measurand is less than the spatial resolution of the sampling. The finite length of the sensing element also introduces a low-pass filter in the sensor response, which can be advantageous for the detection of low-magnitude, low-frequency signals (such as seismic signals; Dean et al., 2017). Conversely, the localisation of point sensors can lead to information being undetected between sensor positions. Thus, overall, DOFS combines the advantage of near-continuous coverage with the trade-off of limited sub-segment localisation.
-
Temporal resolution. The temporal resolution of DOFS exceeds that of most traditional oceanographic instruments. This temporal resolution can be considered as conflating two distinct components: the sampling rate of the system, and its measurement time. The sampling rate is the rate at which the DOFS system's interrogator is able to make measurements from a single optical signal. The measurement time is the time between separate measurements of the target measurand. In some cases the sampling rate and measurement time are the same, such as for DAS, where outputs are often generated for each optical signal. Other techniques typically average many individual optical signals to produce an output with greater quality, as required by the measurand. For example, in DTS, it is common to average hundreds to thousands of individual optical signals to generate a single along-fibre temperature profile. The fine temporal resolution of DOFS also enables the simultaneous collection of data on multiple environmental signals with different frequency ranges. These distinct frequency signals can then be extracted through the use of basic filters. For example, a DAS unit can simultaneously record acoustic vibrations from whale calls (10–20 Hz; Wilcock et al., 2023) and surface gravity waves (0.04–0.5 Hz; Glover et al., 2024).
-
Range. The maximum distance along the length of the fibre that can be sampled is set by the progressive energy loss affecting the optical signal as it propagates along the fibre, with the propagation length being double the range to account for the return to the interrogator. The single-mode fibres that are common in telecommunication applications have typical losses of around 0.3 dB km−1, although specialist reduced-loss fibres are available. For sufficiently long distances, the significance of these losses is such that the energy returned to the interrogator is too weak to measure; for a typical pulsed DAS system, this limits the range to ∼80 km. Above an optical power of around 23 dBm, the signal generated by the source becomes unstable and unusable for distributed sensing due to onset of optical nonlinearities, capping the maximum possible energy within a signal of a suitable length for DOFS applications (typically tens of nanoseconds). Longer ranges may be achieved by adding enhanced backscattering at a cable's far end (112 km), performing inline amplification of the optical signal (108 km), or using higher-energy (longer) signals through linear frequency modulation (171 km) (Waagaard et al., 2021). However, many telecommunication cables have uni-directional amplifiers every 50–70 km that block the backscattered light, unless special considerations are taken to enable long-range sensing. The range parameter is also tightly tied to the sampling rate of the DOFS system: a single optical signal must make it to the far end of the sensing range and back to the interrogator before the following signal is transmitted, in order to avoid interference between consecutive signals. This greatly reduces the range for Raman scattering-based sensors (e.g., DTS), where typical ranges are significantly less than 10 km.
-
Quality of reproduction of the measurand. The fidelity with which a DOFS system can reproduce the true value of a measurand is determined by its resolution, accuracy and precision. These three metrics respectively quantify: the number of decimal places that the system can report; how close a series of measurements are to the true value of the measurand; and how close a series of measurements are to each other. Using the popular analogy of a target with a series of marks on it, these metrics represent the size of the marks (resolution), the closeness of the middle of a cluster of marks to the bullseye (accuracy), and the amount of scatter associated with a cluster of marks (precision).
While these four properties of a DOFS system have been hitherto discussed separately, they are closely intertwined in the system's design. There are trade-offs between the properties that must be balanced to achieve the desired DOFS measurement. For example, to increase the precision of the measurand, the spatial and temporal averaging of the return optical signals could be increased, so as to achieve more accurate measurements at the expense of spatial and/or temporal resolutions. Another choice that must be made is regarding the balance between spatial and temporal resolutions, where enhancing one entails reducing the other. A final key consideration when optimising the properties of DOFS measurements concerns the requirement for storage or transmission of potentially very large data sets. In many real-world applications, this imposes serious constraints on the balance between spatio-temporal resolution, range, and measurement time. A tailored choice of this suite of factors can enhance the performance of a DOFS system for either specific problems or a broad range of applications, depending on the user's goals.
Sampling factor considerations aside, a further important facet in the implementation of DOFS technologies relates to the characteristics of the fibre optic cable employed for sensing. Initial developmental work in DOFS was designed around using bespoke cables for specific engineering applications. This continues to provide a range of sensing options with distinct cable design choices. Such choices can include bespoke cable coatings or the incorporation of microstructures into the optical fibre, to provide enhanced sensitivity to specific measurands (Osório et al., 2017). Additionally, a fibre optic cable can be single-mode or multimode. Single-mode fibres have a smaller core diameter (typically 9 µm) and propagate a single light mode; accordingly, they enable comparatively long-distance and high-bandwidth applications. In contrast, multimode fibres have a larger core (typically ≥50 µm in diameter), support multiple light modes, and are better suited for shorter-distance and lower-bandwidth transmissions.
Increasingly, DOFS applications in physical oceanography seek to leverage existing seafloor infrastructure. In the ocean, this infrastructure includes: (i) a large seafloor cable network used for telecommunications, with approximately 1.7 million km of cable globally in service (Clare et al., 2025); and (ii) more localised cables associated with certain coastal facilities, including marine renewable energy generation plants. These existing cables typically consist of single-mode fibre optimised for long-range communications. While such extensive cable infrastructure represents an opportunity to generate a new ocean observing network, the cables' use does present some challenges additional to those of sensing-purposed fibres. For example, the specific route coordinates and physical configuration of the cables can be unclear, especially for older cables, such as concerns their intentional burial, burial by natural sediment movement, biofouling-induced changes in the cables' mechanical properties, or the inadvertent occurrence of physical damage to the cables.
The impact of uncertainty in the precise seafloor position and burial state of fibre-optic cables depends strongly on the physical variable and spatial scales of interest. For slowly varying, path-integrated quantities such as temperature or long-period strain, modest uncertainty in absolute cable position (tens to hundreds of metres) generally introduces limited error, as the measurements reflect averaged environmental conditions along the fibre. In contrast, applications that depend on spatial gradients, directionality, or coupling – such as current-induced vibration, wave-field reconstruction, or seismic and acoustic localisation – are more sensitive to positional uncertainty, which can affect inferred wave speeds, arrival angles, and amplitude-distance relationships. For seismic and acoustic sensing, uncertainty in cable geometry primarily influences absolute localisation and angular interpretation, rather than detection capability itself. Relative measurements along the cable remain robust, and many analyses rely on internally referenced spatial coherence rather than absolute geographic positioning. Ongoing efforts to infer cable routing and coupling state directly from DOFS data, jointly with the integration of ancillary bathymetric information, provide pathways to mitigate these uncertainties and improve interpretability. For example, a possible approach to reliably assess measurands in existing cables entails combining different scattering regimes, preliminarily in static conditions, so as to inform subsequent processing choices for dynamic measurements (Belal et al., 2009; Belal and Newson, 2010, 2011, 2012).
In this section, we review how each DOFS technology has been applied in physical oceanography. We do this by, first, outlining the basic theoretical concepts that enable us to connect the properties of backscattered light to the oceanic parameter(s) of interest in the pertinent DOFS category; and, second, providing illustrations of the type of phenomena that are currently observable with that technology.
3.1 Measuring ocean temperature with DTS
3.1.1 Overview of DTS
Most DTS systems operate by sending short pulses of laser light through a fibre optic cable and measuring the backscattered light produced by Raman scattering (Fig. 2b). When a photon interacts with a molecule in the fibre, it can scatter inelastically, producing a photon with shifted energy (or, equivalently, frequency). If the molecule is initially in the ground vibrational state, the scattered photon has lower energy (Stokes scattering). Conversely, molecules already in an excited vibrational state scatter photons with higher energy (anti-Stokes scattering). For any temperature above absolute zero, the incident photons will interact with molecules both at the ground and excited states, such that both the Stokes and anti-Stokes scatterings occur simultaneously.
The probability of a molecule occupying a given vibrational energy level follows the Boltzmann distribution:
where Ei is the energy of the state, kb is Boltzmann's constant, and T is the absolute temperature. Because the intensity of the anti-Stokes scattering component depends on the population of excited vibrational states, which increases with temperature, the ratio of Stokes to anti-Stokes backscattered intensities provides a temperature-dependent signal:
where PS and PaS are the measured intensities of the Stokes and anti-Stokes components, respectively, and ΔE is the energy gap elicited by the scattering process. This fundamental relationship enables Raman-scattering DTS systems to infer temperature along the fibre by measuring the relative backscatter intensity of these two components.
For a single-ended fibre optic cable, that is, a cable without a return path to the instrument (Hartog, 2017), the temperature T(d,t) at a distance d along the fibre and time t is derived from the ratio of Raman backscatter intensities using (Suárez et al., 2011; Hausner et al., 2011):
where
is a constant with units of Kelvin that relates the energy gap, ΔE, to thermal energy via Boltzmann's constant. The term C(t) is a calibration parameter determined for each DTS laser, and Δα (m−1) represents the differential optical attenuation between anti-Stokes and Stokes signals.
The Stokes and anti-Stokes backscatter intensities (PS and PaS, respectively) are determined along the fibre length d from time-of-flight measurements of the backscattered light. The free parameters in Eq. (3) – γ, C(t) and – are established by in situ calibration. A comprehensive description of in situ calibration approaches for DTS is provided in Sinnett et al. (2020). A minimum of three reference temperatures is needed to determine the three free parameters in Eq. (3). Greatest reduction in root-mean-squared error is attained when the calibration sensors span the full temperature range experienced by the cable (typically achieved using coils of fibre in an ice bath, and a warm bath near the interrogator) and with a third sensor at the maximum separation in range between calibration points (to account for the attenuation parameter; Sinnett et al., 2020). Establishing the latter reference is facilitated by a double-ended returning cable configuration, where the cable-end reference can be applied at the interrogator, with the trade-off that the maximum length of a double-ended cable is one half that of a single-ended cable. Finally, while three reference points is a minimum, actual deployments are often improved by more reference sensors, since variable strain along the deployed fibre (e.g., at anchor points or cable turns) can lead to a nonlinear attenuation rate as a function of distance along the cable (Sinnett et al., 2020).
Raman-scattering DTS has relatively high temperature precision and is unaffected by acoustic waves, making it an effective tool for ocean temperature measurements. However, these improved characteristics usually come with the trade-offs of limited range (< 10 km, and often less than 2 km) and the need to use multimode fibres. Typically, this implies that Raman-scattering DTS measurements are made on specialised cables, laid for the purpose of collecting such observations.
The first effective uses of DOFS to study coastal and open-ocean dynamics were made with this Raman-scattering DTS approach in the mid-2010s (Connolly and Kirincich, 2019; Sinnett et al., 2020; Davis et al., 2020; Lucas and Pinkel, 2022; Pinkel et al., 2023). At that point, short-range, high-precision, commercially available Raman-scattering DTS systems could provide ∼0.1 K temperature accuracy and ∼0.01 K precision with 1 m by 1 min space/time averaging, over a 2 km multimode cable (Sinnett et al., 2020). With these characteristics, the DTS systems became capable of quantifying temperature in the wavenumber-frequency space that is dominated by internal waves and stratified turbulence – at least within the upper ocean, where the temperature imprint of those flows is sufficiently large to be resolved.
Early experiments were conducted in shallow water (<100 m), in sand bottom (Lucas and Pinkel, 2022) and coral reef (Davis et al., 2020) environments. In deep water, DTS interrogation of towed multimode fibre was used to track high-frequency internal waves (Pinkel et al., 2023). These studies demonstrated the capability of Raman-scattering DTS systems to observe coherent structures with frequency and wavenumber aperture that is difficult or impossible to achieve with traditional approaches.
3.1.2 DTS case study I: Observations of nonlinear internal waves
Nonlinear internal waves play an important role in the transfer of energy from the internal wave field toward turbulent scales (Whalen et al., 2020), and are well known to impact sediments, ecosystems and marine infrastructures. Internal wave energy incident on a sloping seafloor can undergo rapid nonlinear evolution into highly turbulent pulses (van Haren et al., 2022; Whitley and Wenegrat, 2025). In analogy to the surf-zone, where ocean surface waves break and dissipate, an internal swash zone arises in stratified waters over the continental shelf. Variously described as bores, solibores or boluses, these nonlinear motions are the final stages of offshore internal wave energy moving from the internal wave continuum to turbulence. The dissipation of energy during this process means that these regions are mixing hotspots, with relevance to the overturning circulation in the deep ocean, and to the ocean ecosystem and sediment budget in shallower waters.
In the “internal wave surf-zone”, Lucas and Pinkel (2022) used DTS observations to investigate the details of the shoaling and dissipation of nonlinear internal waves. The strongly temperature-stratified waters off La Jolla provide a compelling use case, with temperature gradients of 10 K over vertical scales of 10 m. These strong signals are readily detected using Raman-scattering DTS, even with “high-resolution” spatio-temporal averaging of 30 s by 1 m, achieving a precision of approximately (±0.1 K).
Offshore of Scripps Pier, solitary-like waves of depression transformed to elevation waves inshore of the 25 m isobath (Fig. 3). The DTS allowed tracking of these individual elevation waves across the inner shelf, quantifying the run-up process. The pulses of subthermocline water had a cross-shore footprint of only 10 m, but propagated coherently for hundreds of meters upslope. Because DTS allowed continuous tracking of the “core” temperature of the shoaling bolus during run-up, Lucas and Pinkel (2022) showed quantitatively that such core temperature change was too rapid to arise from diffusive mixing. This implied that the entrainment of the warm, upslope ambient waters into the “leaky” wave core facilitates the rapid exchange between surface and subthermocline waters.
Most surprisingly, the DTS observations showed that individual shoaling waves were trailed by an intricate wake of coherent structures (Fig. 3c, d). These structures arose during the shoaling process, and were oriented perpendicular to the propagating wave. The transverse (∼ along-shore) scale was roughly similar to the cross-shore footprint of the wave, and was regular in the along-crest direction, suggesting a coherent along-crest scale to the shoaling-related instability. The observations inspired non-hydrostatic modelling of solitary-like waves advancing on slopes in shallow water. These simulations suggest that the vortical circulations that arise during shoaling can drive isotherm displacements matching the patterns reconstructed from the DTS observations; Fig. 3). This serves to illustrate how continuous DOFS sampling approaches can unlock a previously unsampled realm.
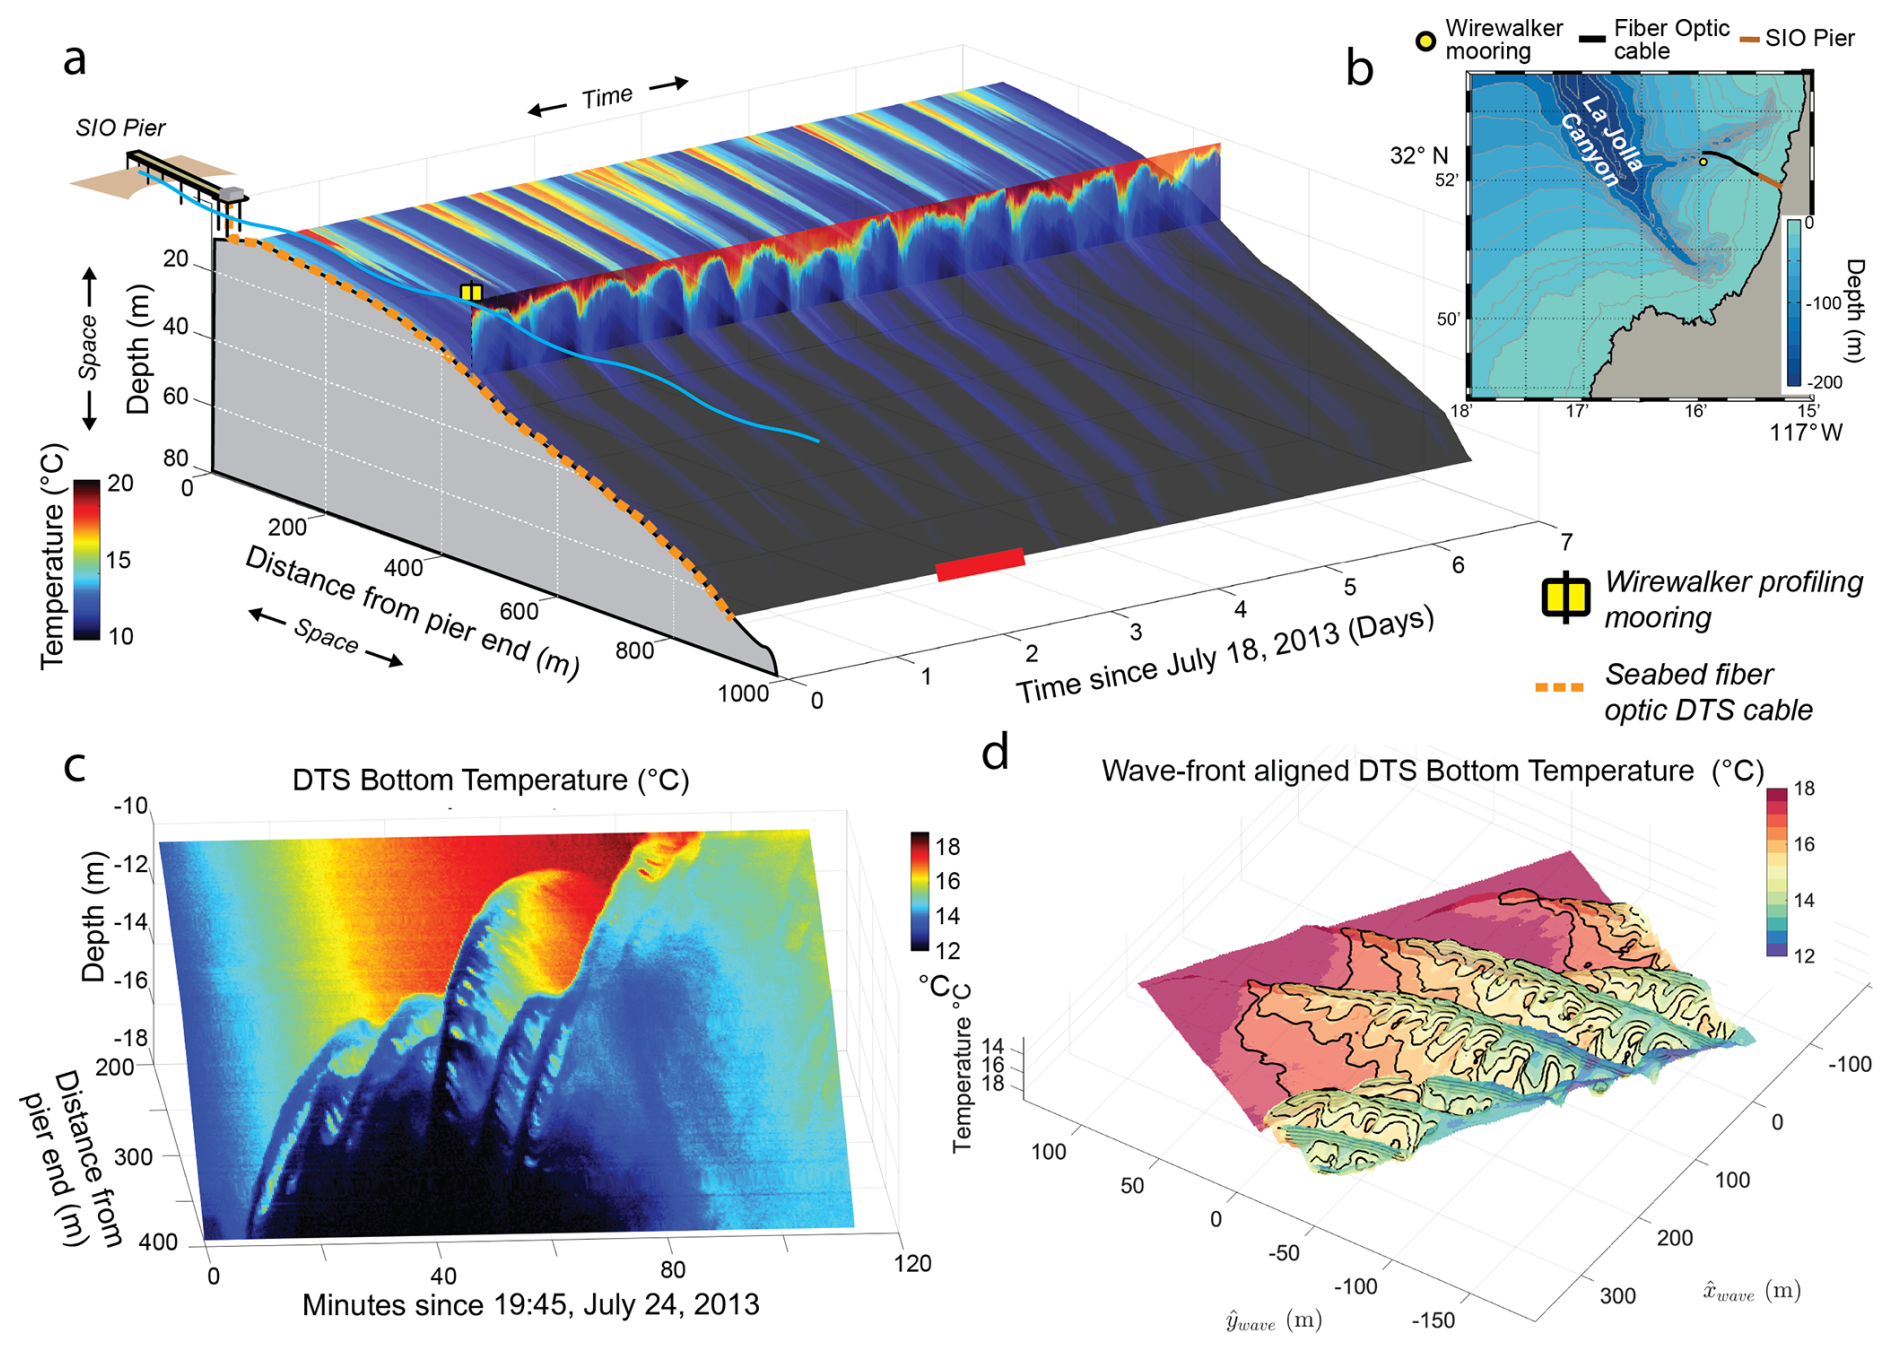
Figure 3Raman-scattering DTS temperature measurements collected offshore of Scripps Pier, La Jolla, California. (a) Bottom temperature as measured from the Pier-mounted DTS system and a vertical profiling mooring over 7 d (14 cycles of the M2 internal tide). (b) Map of the study area, inshore of the La Jolla Submarine Canyon. (c) A 2 h close-up of DTS bottom temperature, showing the arrival of a train of nonlinear internal waves of elevation. (d) A time-for-space transformation of DTS bottom temperature, assuming a constant across cable drift of 2 cm s−1. This transformation shows how a line sensor like a fibre optic cable can be used to reconstruct the 3-D structure of a propagating and advecting signal.
The continuous line sensing afforded by DOFS approaches allows more than tracking of temperature and strain structures (Fig. 3d). Thus, in Lucas and Pinkel (2022), the along-shore structure of the shoaling wave was sensed by a fibre optic cable oriented in the cross-shore direction. This was made possible by the along-shore current generated by the obliquely incident wave, which slowly advected the waveform past the cable. Using Taylor's frozen field hypothesis and a knowledge of the rate of along-shore advection of the wave signature, a time-for-space transformation could be made to estimate the scale of features aligned orthogonal to the cable direction. Since the advection rate was quite slow, the cross-axis spatial resolution was correspondingly high. A similar “scanning” approach is used, for example, in ultra-high resolution atomic force microscopy (Eaton and West, 2010). These early uses of Raman-scattering DTS showcase the possibilities of creative DOFS approaches that may exploit the continuous measurements in both time and space, so as to image the 4-D variability of the flow field.
3.1.3 DTS case study II: Observations of an Antarctic ice shelf cavity
Several Antarctic ice shelves are melting and thinning at an accelerated rate, driven by the contact of their ice bases with relatively warm ocean waters that intrude the sub-ice shelf cavities (Adusumilli et al., 2020; Naughten et al., 2023; Bradley and Hewitt, 2024). However, ocean circulation, water mass properties and, most critically, ice-ocean boundary dynamics within sub-ice shelf cavities remain poorly known, largely due to their complexity and the challenges associated with direct instrumentation. In this context, the high vertical and temporal resolutions of DOFS offer a powerful tool to sample and understand sub-ice shelf cavities, especially finescale processes occurring within the thin ice-ocean boundary layer (Fig. 4a).
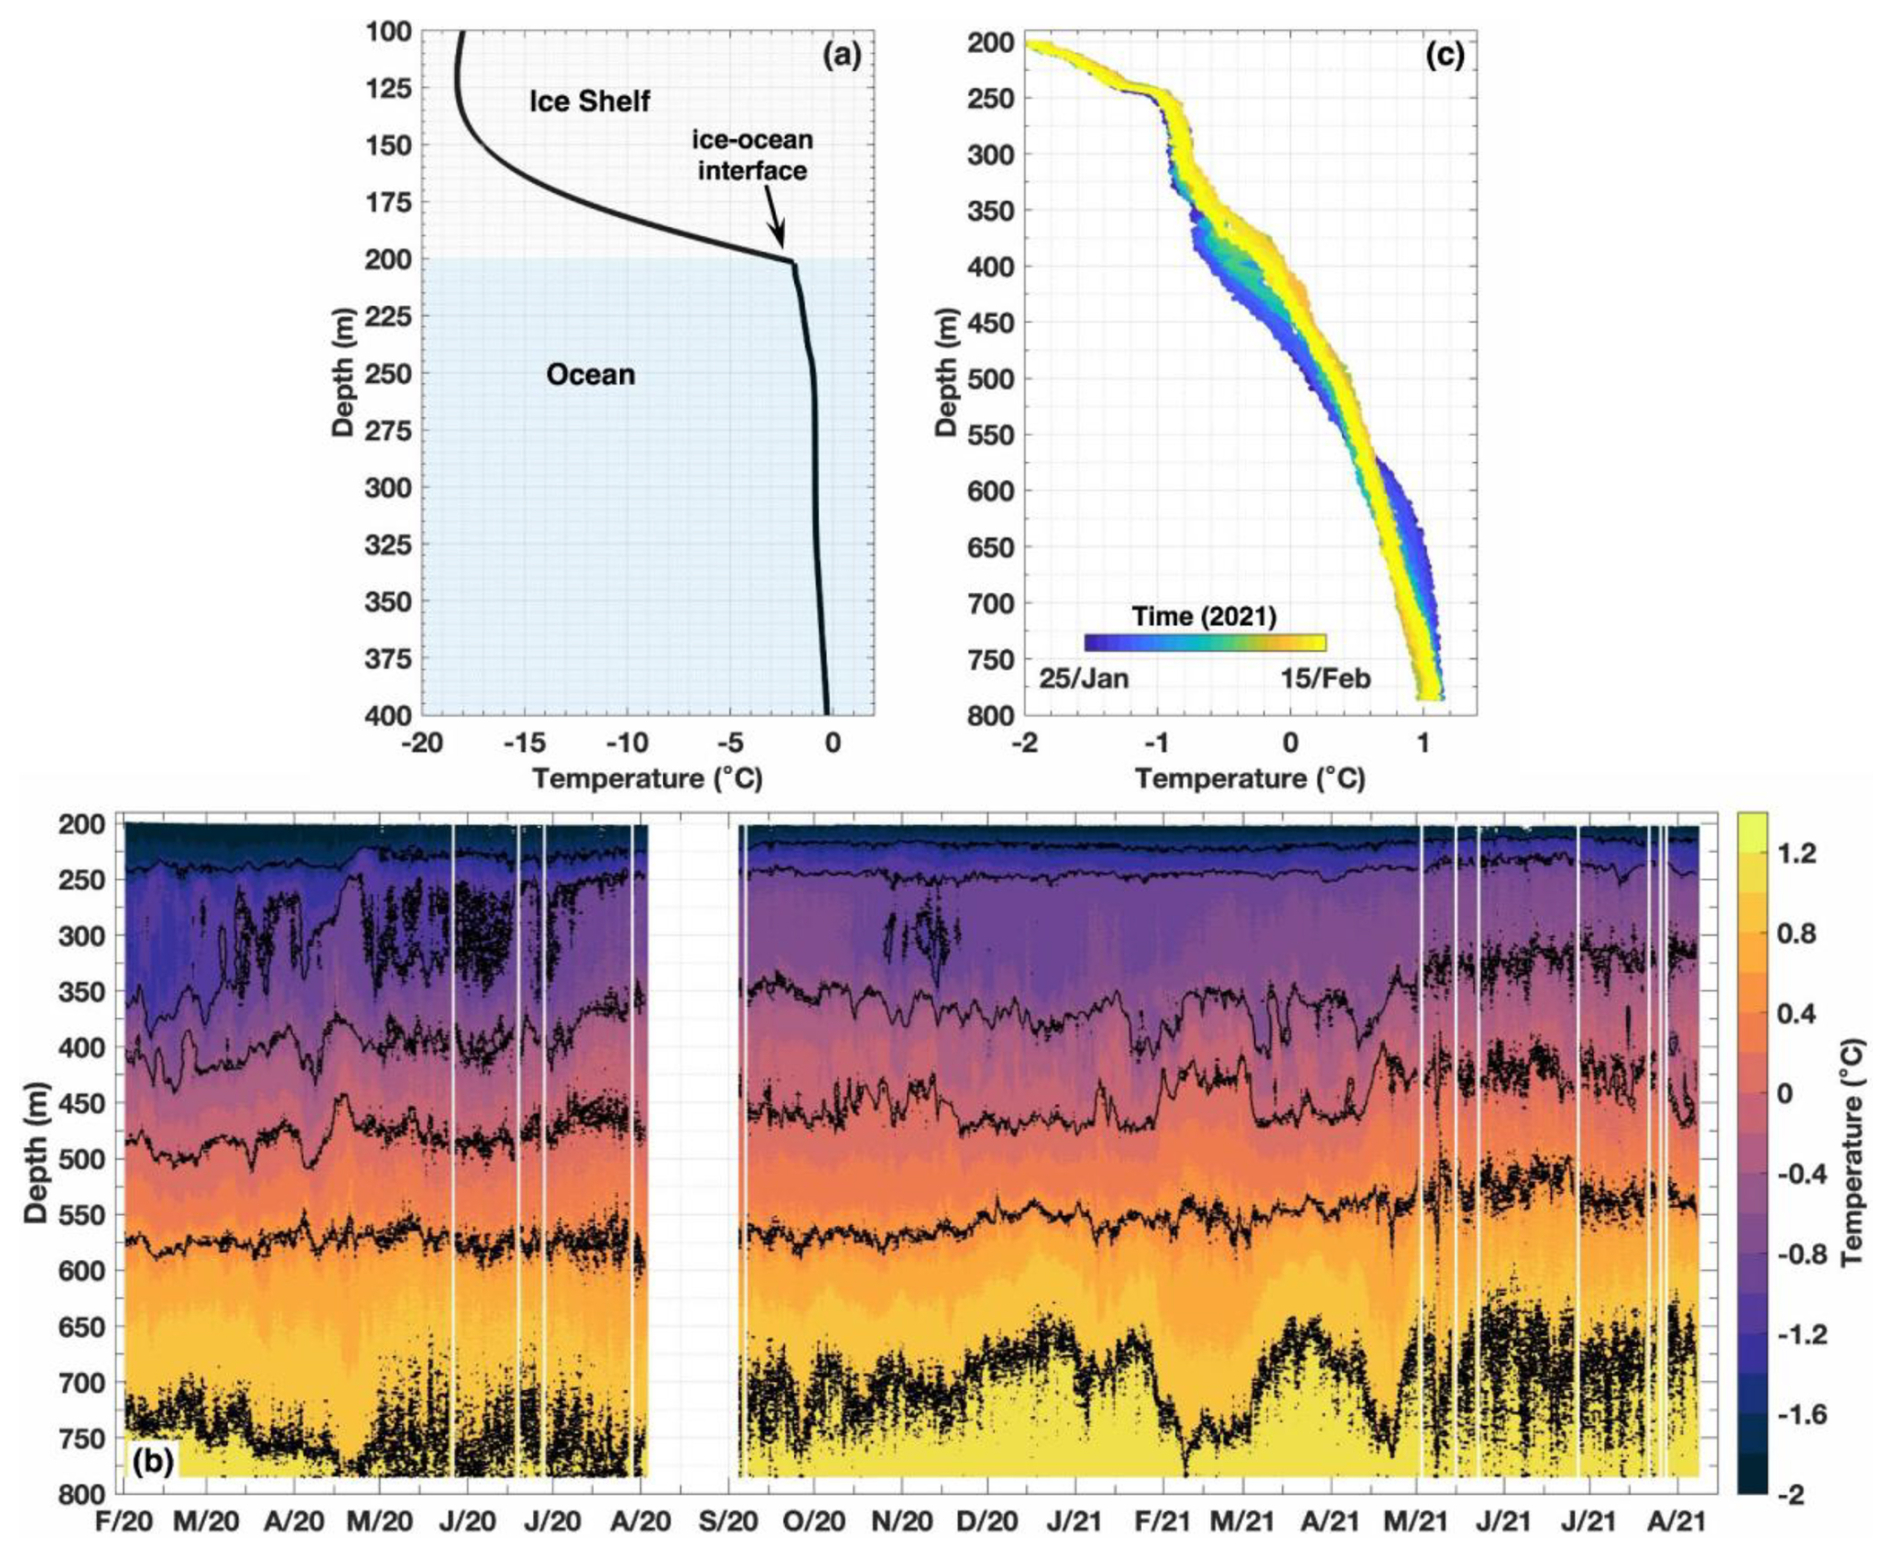
Figure 4Temperature in the Thwaites Eastern Ice Shelf cavity. (a) 2020–2021 averaged temperature profile measured by a Raman-scattering DTS system installed through the ice into the ocean. The ice-ocean interface is identified by the change in the vertical temperature gradient and shown by the arrow. (b) Time series of daily temperature at the sub-ice shelf channel between February 2020 and August 2021. Data gaps were caused either by (i) failed telemetry, (ii) bad weather, or (iii) low power in the system (Scambos et al., 2025a). Isotherms of 1.0 to −1.5 °C, spaced at 0.5 °C intervals, are shown in black. (c) An example of one of the “events” showing warming below 350 m and simultaneous cooling below 600 m (modified from Wild et al., 2025). Note the different ranges in depth among the panels.
The earliest ice shelf applications of DOFS began in the 2010s for temperature measurement in both ice and the underlying water column, using fibre in metal tube (FIMT) cables. These were deployed in concert with traditional oceanographic sensors measuring conductivity, temperature and depth in mooring configurations. Deployments typically occurred through floating ice shelves following hot water drilling operations that penetrated through the ice and allowed the structure to freeze into place. DTS mooring deployments have been successfully installed through the ice and into the ocean beneath the Amery Ice Shelf (Warner et al., 2012), McMurdo Ice Shelf (Tyler et al., 2013; Kobs et al., 2014) and Thwaites Eastern Ice Shelf (Fig. 4; Dotto et al., 2022; Scambos et al., 2025a; Wild et al., 2025), with operational lifespans ranging from several months to multiple years. Recently, similar deployment strategies have been successfully adapted for exploring sub-glacial lakes in the Antarctic (Siegfried et al., 2023).
The Raman-scattering DTS installations beneath the McMurdo and Thwaites Eastern ice shelves operated with vertical resolutions of 25–50 cm, yielding unprecedented insights about the vertical structures of ice and ocean temperatures in these contrasting sub-ice-shelf environments. For instance, Stern et al. (2013) documented the intrusion of a ∼200 m thick layer of summer-warmed surface water (up to ∼1 °C above the in situ melting point) immediately beneath the McMurdo Ice Shelf between January and April 2012. This intrusion of shallow waters led to a peak in basal melt rates of 8.6 mm d−1 (Kobs et al., 2014). Basal melting can be inferred from the DTS records at the ice-ocean interface, with melt rate resolution as low as 1 mm d−1 (Kobs et al., 2014). More recently, Dotto et al. (2022) used DTS to assess the depth of the ice-ocean interface beneath the Thwaites Eastern Ice Shelf and detected very low basal melt rates at the instrument site, consistent with satellite-based observations (Adusumilli et al., 2020; Alley et al., 2021). At greater depths within the same ice-shelf cavity, Wild et al. (2025) described a dynamic regime characterised by rapid warming and salinity increase near the thermocline, with events occurring over time scales from days to weeks. Over the same period, cooling and freshening of the modified Circumpolar Deep Water layer at still-greater depths was observed. These changes were linked to periods when mobile sea ice cover temporarily replaced the long-term cover by landfast ice at the ocean surface (Fig. 4c). The full DTS time series beneath the Thwaites Eastern Ice Shelf shows several events of shoaling and deepening isotherms at different depths (Fig. 4b), which may be associated with the passage of mesoscale eddies within the cavity. Such eddy-driven circulation has the potential to enhance heat advection toward the ice shelf base (e.g., Shrestha et al., 2024). However, strong stratification immediately below the ice base suppresses ocean heat transport toward the ice base, thus contributing to the low basal melting observed at the DTS installation site (Dotto et al., 2022; Wild et al., 2025; see also Davis et al., 2023). During the 18-month operational period of the DTS installation beneath the Thwaites Eastern Ice Shelf, a gradual warming trend was also observed throughout almost the entire water column below ∼250 m (Fig. 4b). The combined use of DTS and DAS with novel methods to estimate salinity (Sect. 4.1) and turbulence (Sect. 3.3.3) has the potential to greatly enhance our knowledge of the density structure (and thus stratification) in sub-ice shelf cavities, and of the key processes governing basal melting. These advances are essential for refining parameterisations of the ice-ocean boundary layer in coupled ocean-ice sheet models.
3.2 Measuring ocean temperature changes with DSS
3.2.1 Overview of DSS
DSS systems typically operate on the basis of Brillouin optical time-domain reflectometry, which is sensitive to both mechanical strain (i.e. axial elongation or shortening of the cable) and to temperature fluctuations. Photons propagating in a glass fibre inelastically scatter with lattice phonons, causing their frequency to change by ∼11 GHz (Fig. 2b). The precise frequency change depends on the phonon's moment, which relates to the fibre's density and refractive index. Such properties of the fibre are themselves sensitive to mechanical deformation and thermal fluctuation, which drive a shift in the central frequency of the Brillouin peak, Δν, as:
where Δϵ denotes the relative change in the fibre length between two instants in time; ΔT refers to the temperature change over the same period; and Cϵ=0.048 MHz/μϵ (1 μϵ is an elongation of 1 µm per unit length of 1 m) and CT=1.06 MHz K−1 are empirically constrained coefficients (VIAVI, 2017). A limitation of DSS is, hence, that a given Δν signal may be caused by either mechanical strain or a temperature change, such that DSS measurements are ambiguous in principle. However, in practice, this ambiguity may be resolved through knowledge of each specific cable's setting, which can result in mechanical and thermal signals with distinct temporal characteristics (Gutscher et al., 2025).
3.2.2 DSS case study: Monitoring long-term changes in bottom water temperature
An illustration of the potential of DSS for observing the evolution of bottom water temperatures on climate-relevant, multi-annual time scales is provided by Fig. 5. In this case example, DSS measurements were performed on the unused fibres of a commercially active network of submarine cables connecting the islands of the Guadeloupe archipelago, in the Lesser Antilles (Fig. 5a; Gutscher et al., 2025). A first set of measurements was conducted in June 2022 to establish Brillouin frequency baselines on all cable segments (vertical dotted line in Fig. 5b). For the subsequent 2 years, measurements were performed at regular intervals approximately every 6 months (coloured circles with error bars in Fig. 5b), with additional observations in September 2024 and March 2025 to respectively capture the maximum and minimum annual ocean temperatures. Then, from June 2025, continuous DSS monitoring began at intervals of 3 h (Fig. 5c).
While this data set contains some abrupt, short-wavelength (<1 km) shifts that are caused by mechanical strain linked to near-bottom currents (not shown; Gutscher et al., 2025), signals integrated over longer cable segments (such as those shown in Fig. 5) are primarily determined by temperature changes. To consolidate this interpretation, a comparison is made with the local sea surface temperature record acquired by satellites. A high degree of coherence between the sea surface temperature observations and the seasonal-to-interannual variability in bottom temperature documented by DSS is apparent, with only the occasional modest discrepancy (e.g., in March 2025) that is explained by elevated temperature stratification at that time (Gutscher et al., 2025). The DSS measurements also reveal the penetration to the seafloor of marine heatwaves – e.g., the 1.5 °C warming signal between 2022 and 2024 – detected by satellites, thus showcasing the usefulness of DOFS to characterise the vertical extent of such extreme climate events.
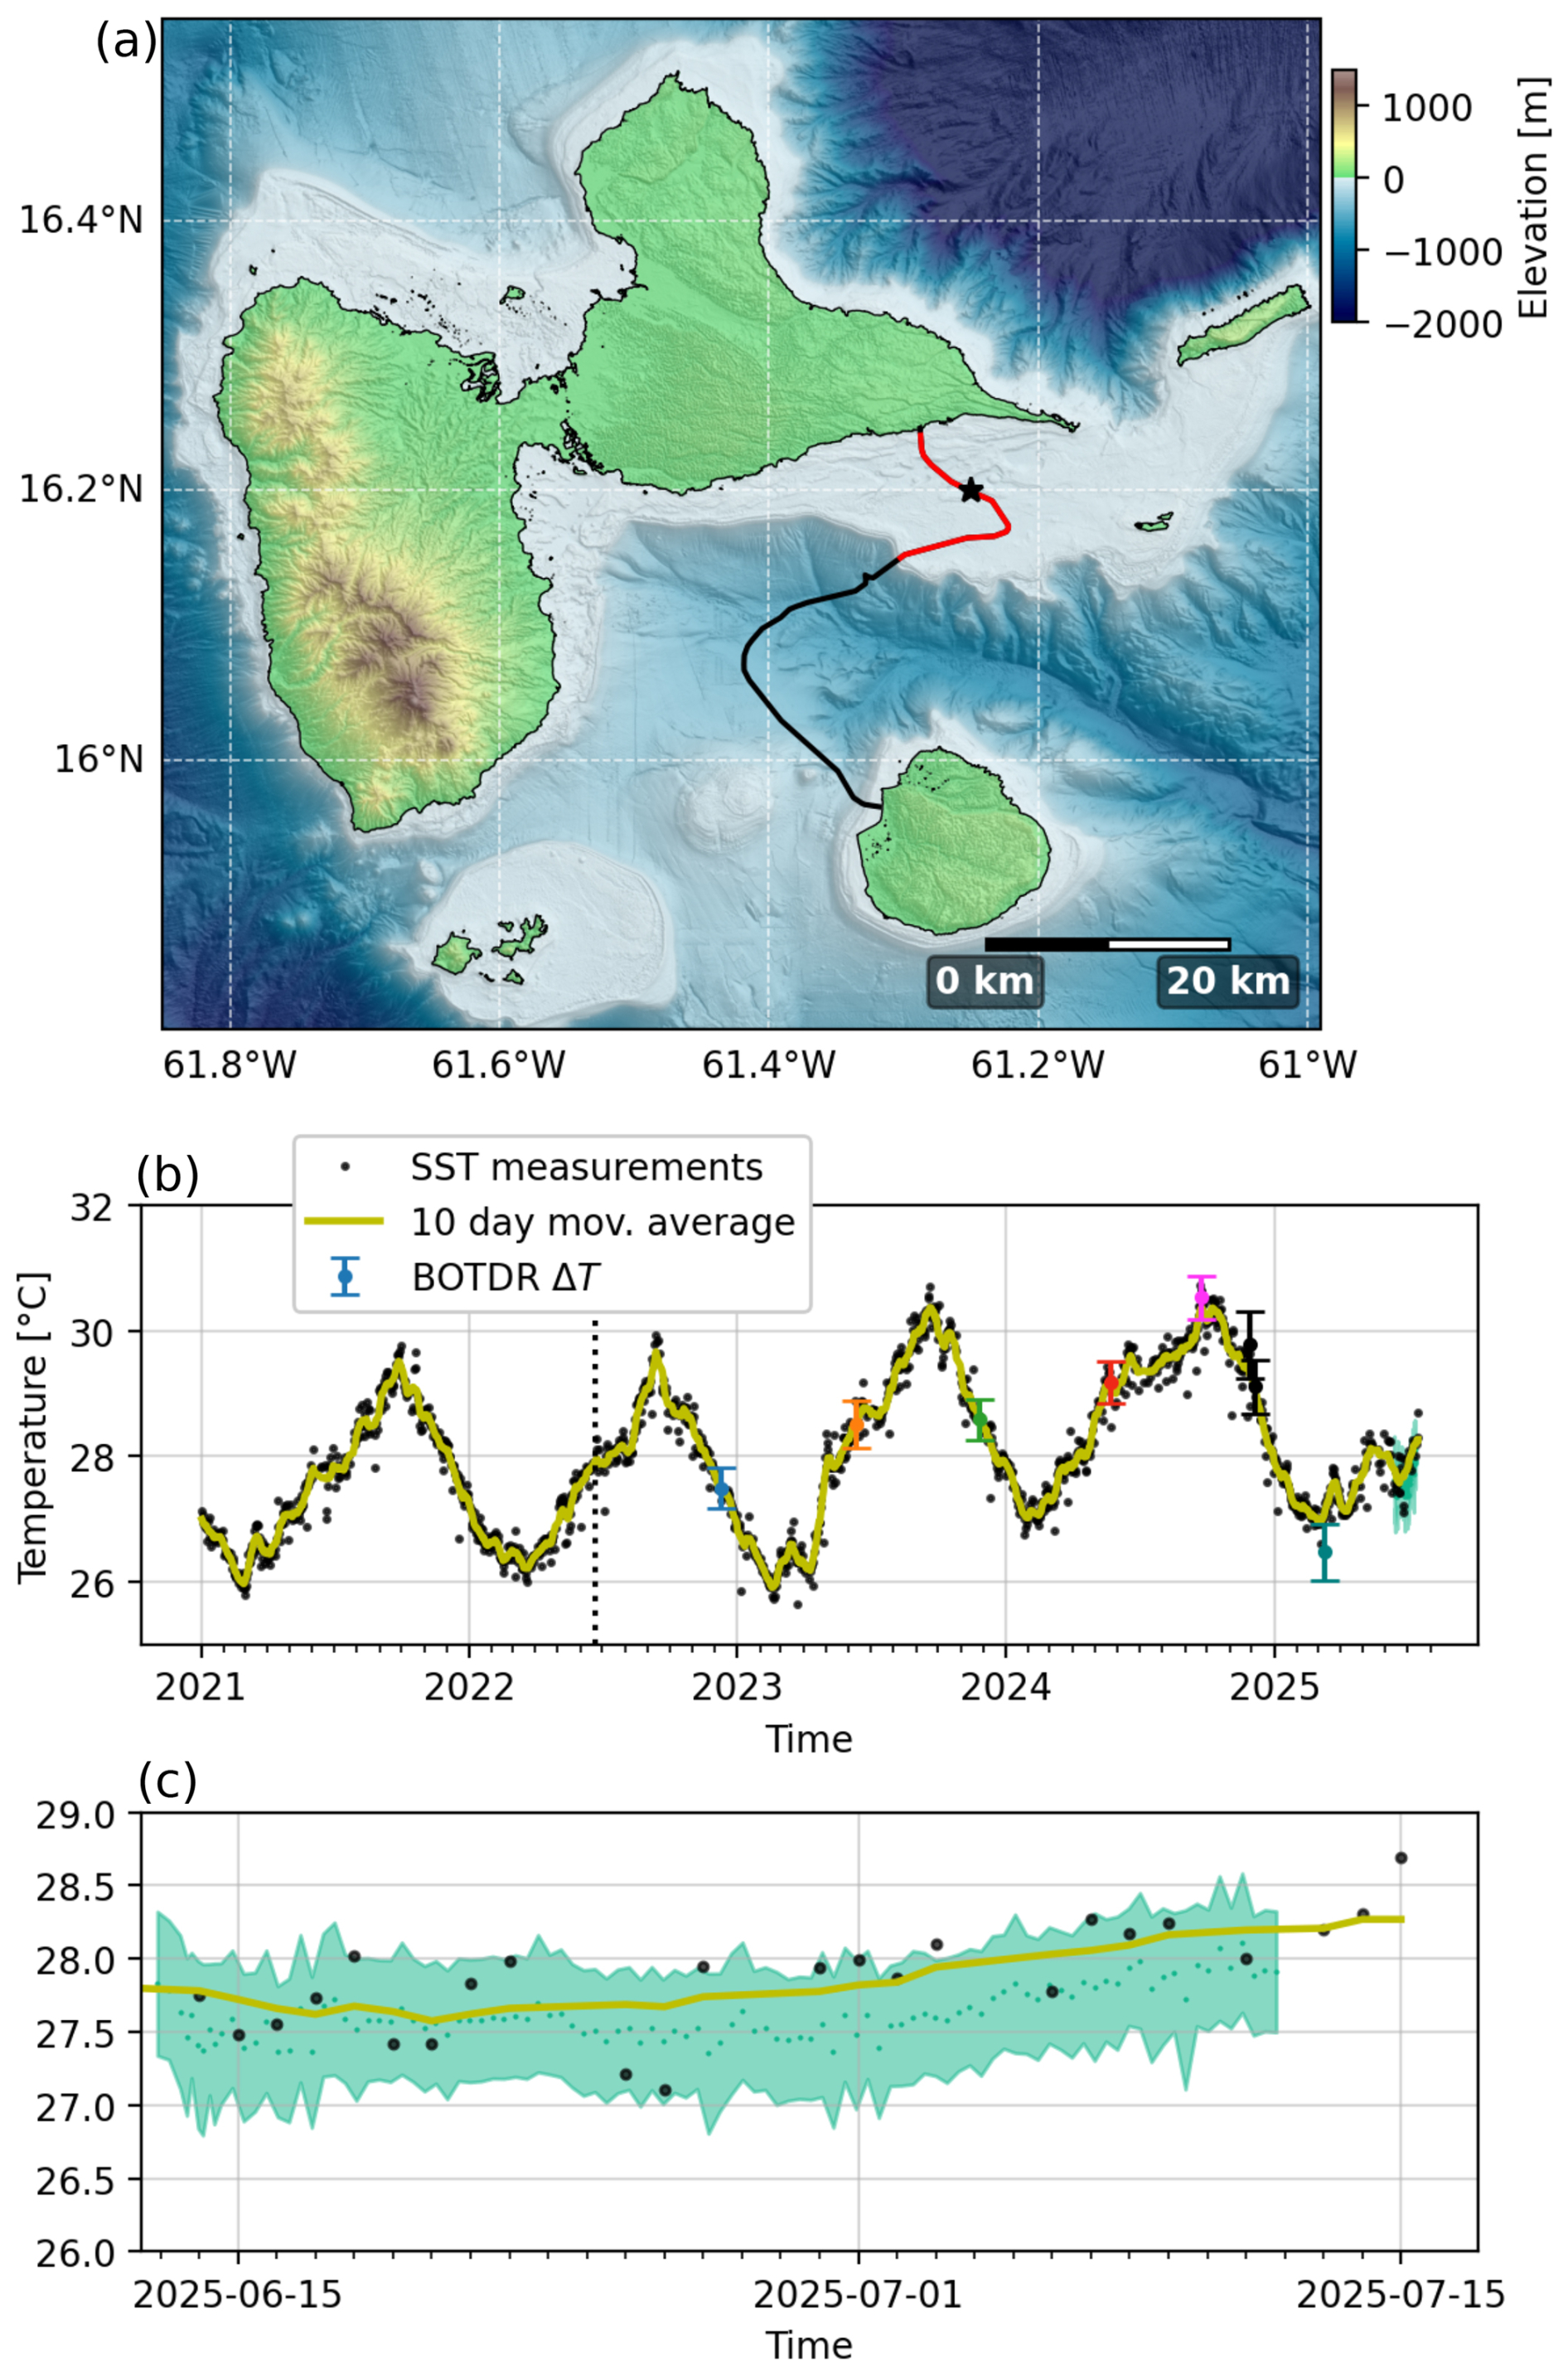
Figure 5Bottom temperature change measured off the Guadeloupe archipelago (Lesser Antilles) using DSS. (a) Map of the Guadeloupe archipelago, showing the submarine telecom cable connecting two of the islands (red and black line). The black star indicates the location of sea surface temperature (SST) observations shown in panel (b) (data source: Copernicus Marine Service, 2024). (b) Daily SST observations at the location marked by the black star in (a), shown as black dots, with a 10 d moving average in yellow. Coloured circles with error bars represent temperature changes (mean ± standard deviation) derived from episodic Brillouin optical time-domain reflectometry (BOTDR) measurements acquired every 3–6 months, referenced to the baseline on 20 June 2022 (vertical dotted line). These values are averaged over the 20 km cable segment located 2–22 km offshore (highlighted in red in panel (a). (c) Four weeks of continuous BOTDR measurements over the same 20 km offshore cable segment: mean temperature change (dots) and ±1 standard deviation (shaded area), compared with daily SST and its 10 d moving average.
3.3 Measuring ocean temperature changes and cable strain with DAS
3.3.1 Overview of DAS
DAS (or DDS) refers to a family of DOFS approaches that uses the Rayleigh backscatter signal to measure changes in optical path length, most often a variety of phase-sensitive optical time-domain reflectometry (Fernández-Ruiz et al., 2020; Zhan, 2020). DAS interrogators repeatedly probe a single-mode optical fibre (at a typical pulse rate of 500 Hz to 10 kHz) and measure perturbations in the phase of Rayleigh backscattered light as a function of position. The minimum resolution along the fibre is the gauge length – the increment of distance over which the phase is measured, typically on the order of 5 to 10 m but potentially as small as 1 m. This limitation stems from the distribution of the density heterogeneities in the fibre being unknown, which makes it necessary to integrate measurements along finite lengths of the sensing element. The measured differential phase (ΔΦ) associated with a perturbation in optical path length may arise from either a change in the physical fibre length, ΔL, or the refractive index, Δn:
in which n is refractive index, L is the gauge length, λ is the wavelength of laser light, the leading factor of 2 accounts for the two-way propagation path of backscattered light, and any intrinsic phase (i.e. the phase of light at the beginning of the gauge length) is neglected (e.g., Hocker, 1979; Hartog, 2017). For a mechanical strain along the fibre axis and letting , this becomes
where ξL=0.79 is sometimes called the Pockel's coefficient. This coefficient approximates the photoelastic effect – a small decrease in the refractive index with extensional strain of the fibre – under several assumptions (Budiansky et al., 1979; Hocker, 1979; Kuvshinov, 2016; Williams and Lipovsky, 2024). Similarly, a change in temperature ΔT will perturb both the physical length of the fibre (by the thermo-elastic effect) and the refractive index (by the thermo-optic effect), yielding
with K−1 and K−1 (Hocker, 1979; Sidenko et al., 2022). Hence, the thermal coefficient is K−1, and the thermo-optic effect dominates. It follows that the relative sensitivity of DAS between strain and temperature is
so the same change in optical path length is observed for a 1 K temperature transient as for a 10−5 m m−1 mechanical strain (Zumberge et al., 1988). However, the transfer from temperature to strain is not instantaneous, and tests have shown that fibre-optic cable response times to temperature changes in water are 12±3 s (Sinnett et al., 2020).
Because strain and temperature perturbations are both observed through a single measurand (i.e. optical phase), the two quantities are not necessarily straightforward to separate in field data (e.g., Liu et al., 2025a). While it is possible to design bespoke cables or instruments with different sensitivity to strain and temperature (e.g., Zumberge et al., 2018), the vast majority of oceanographic DAS experiments have relied on pre-existing subsea fibre-optic cables. Identifying temperature signals therefore requires some a priori understanding of ocean dynamics and seafloor vibrations. Most seismic and acoustic signals from global microseisms, small earthquakes, whale vocalisations, and anthropogenic sources are short-period (≲ 20 s). By contrast, ocean temperature fluctuations at these periods are vanishingly small: following the analogy of Corrsin (1951), the cut-off time scale below which turbulent temperature fluctuations are rapidly homogenized can be deduced from the Kolmogorov time scale () as s, for kinematic viscosity m2 s−1, Prandtl number Pr≈10 and turbulent kinetic energy dissipation rates W kg−1. Consequently, it is generally safe to assume that temperature does not contribute appreciable bias to seismic and acoustic studies with ocean-bottom DAS. The separation is less clear at low frequencies, as seafloor strain transients from solid-Earth tides, low-frequency seismic surface waves from distant earthquakes, deformation near fault zones, and slope movement overlap the same broad period band as internal waves and ocean turbulence (Garrett and Munk, 1972; Moum, 2021). Ocean currents may also drive the vibrations of free-hanging cable segments or directly deform the cable through viscous drag, further complicating the interpretation (Mata Flores et al., 2023; Spingys et al., 2024b).
The two most useful approaches to distinguish strain and temperature at long periods are (i) the spatio-temporal resolution of DAS measurements, and (ii) the relative amplitude sensitivity of DAS to strain and temperature. Internal waves have typical phase speeds (, where ω is frequency and κ is wavenumber) of 0.01–1 m s−1, which is many orders of magnitude slower than seismic (c>200 m s−1) or acoustic (c>1500 m s−1) waves (Hamilton, 1979; Godin and Chapman, 1999). Array analysis exploiting the along-cable sampling of DAS may therefore easily distinguish among ocean gravity and seismic/acoustic waves. High phase speed translates into long wavelength (λ) at any given frequency; consequently, horizontal strain () of the solid Earth is typically very small. For example, the horizontal strain amplitude of the solid-Earth tides is typically m m−1 (e.g., Berger and Wyatt, 1973), which, by Eq. (9), is equivalent to a 0.005 K temperature signal in DAS data (cf. temperature changes one-to-two orders of magnitude larger are characteristic of internal waves and mesoscale flows in the deep ocean); e.g., van Haren et al., 2001). DAS is therefore much more sensitive to temperature than strain, and it is generally expected that temperature will dominate on unburied seafloor cables at long periods.
3.3.2 DAS case study I: Observing the temperature signals of internal waves
A number of DAS observations of the temperature signals of internal waves have been obtained in recent years across various oceanic environments. The first such observations were reported by Ide et al. (2021) from a cabled observatory offshore Cape Muroto, Japan. Temperature fluctuations up to 2 K with a dominant semidiurnal periodicity were observed where the cable passes over the steep topography of Tosabae Ridge around 300–800 m depth, indicating the presence of an internal tide. Subsequently, Peláez Quiñones et al. (2023) reported temperature signals in DAS data acquired on a research cable in the Mediterranean Sea near Toulon, France, up to 5 K in shallow water diminishing to < 1 K off the continental shelf, consistent with near-inertial waves and internal bores. Comparison of DAS data with a nearby shallow-water thermistor chain over a two-week period supported this interpretation (Peláez Quiñones et al., 2023).
Temperature fluctuations up to 4 K in amplitude associated with internal wave trains were observed by Williams et al. (2023) with DAS on a power cable across the Strait of Gibraltar, and are shown in Fig. 6a–c. These solitary waves of depression warm the cable by displacing shallow water downward. The signal disappears around 200 m depth, where the thermal stratification is weak (Fig. 6b). On a telecommunication cable offshore the island of Gran Canaria, Williams et al. (2023) also observed temperature fluctuations up to 2 K in amplitude with a dominant semidiurnal periodicity (Fig. 6d–f). Throughout each tidal cycle, a series of thermal fronts with a sharp temperature contrast up to 1 K over a distance of only a few hundred meters form, rapidly propagating up the near-critical slope before weakening and relaxing back (Fig. 6f). Recently, two studies have verified the reliability of DAS observations of internal wave-induced temperature variability in situ with collocated instrumentation. Claret et al. (2024) deployed a mooring beside the Gran Canaria telecommunication cable shown in Fig. 6d–f with a thermistor ∼ 9 m above the seafloor, measuring internal tide temperature fluctuations in phase with the DAS records and a strain-to-temperature amplitude ratio within a factor of two of Eq. (8). In turn, Gräff et al. (2025) used two fibres in a bespoke cable deployed in a Greenland glacial fjord to record concurrently with DAS and Raman-scattering DTS. These revealed a similar phase and amplitude correspondence for temperature transients associated with large-amplitude internal waves.
While these ground-truthing exercises serve to showcase the potential of DAS temperature observations for studies of internal waves and turbulence, several challenges remain in reconciling such observations with those of conventional oceanographic approaches, including:
-
In contrast to the fast-response thermistors typically employed in observing internal waves and turbulence (e.g., van Haren et al., 2001), the response of DAS temperature measurements is highly dependent on the fibre optic cable construction and state of burial, which may be unknown. Since the thermal diffusivity of marine sediments is low, burial beyond a few millimeters can insulate the cable from temperature transients across the complete internal wave continuum band. For example, internal waves disappear on buried segments of the Strait of Gibraltar power cable shown in Fig. 6b, and uneven burial is likely responsible for the irregular signals observed on the southern section of the cable, at 24–28 km (Williams et al., 2023).
-
The gauge length resolution of DAS, which is of O(10 m), is greater than or similar to the Ozmidov scale. This long averaging length, together with the long time response, causes turbulence to be significantly under-resolved compared to faster in situ sensors.
-
Because DAS can only measure perturbations in temperature (not absolute temperature) and typically exhibits an instrumental noise floor that scales with period (Vidal-Moreno et al., 2022), drift of DAS phase at long periods can be significant. Combination of DAS with comparatively insensitive but statically stable DTS or DSTS, as demonstrated by Peláez Quiñones et al. (2023) and Gräff et al. (2025), may be an effective solution to this issue – as could be the integration of DAS with SMART point sensors.
-
The location of subsea cables within the bottom boundary layer is, on the one hand, very attractive for physical oceanography, since few conventional oceanographic approaches can extensively sample this layer. On the other hand, such location also complicates the interpretation of the measured temperature signals, as a result of the many highly nonlinear processes (e.g., internal wave breaking and boundary flow instabilities) occurring in close vicinity of the seabed. Boundary layer theory suggests that the flow at a point near the ocean-sediment boundary is exponentially smaller than the flow incrementally above, so no straightforward framework exists for interpretation of advective temperature variability exactly at the seafloor (e.g., Fig. 6e, f). The complex patterns of turbulent boundary layer mixing driven by e.g., internal wave breaking are also depth-dependent (van Haren and Gostiaux, 2012), such that observations at the bottom may be blind to boundary-interior exchanges, and turbulence parameters measured at the bottom may not readily generalise.
3.3.3 DAS case study II: Strain-based measurements of bottom boundary layer currents and turbulence
The bottom boundary layer – the layer typically O(1–100 m) thick that is directly affected by the drag of ocean currents on the seafloor – plays a key role in ocean circulation. This role entails extracting energy and momentum from the circulation (Trowbridge and Lentz, 2018), and acting as a focus of turbulent mixing and upwelling over rough and steep bottom topography (Charnock, 1959, Taylor and Sarkar, 2007; Trowbridge and Lentz, 2018; de Lavergne et al., 2016; Ferrari et al., 2016, Wynne-Cattanach et al., 2024). Bottom boundary layer physics are notoriously varied and complex (Polzin and McDougall, 2021). Their observation is challenging due to the characteristically small spatio-temporal scales of near-bottom flows, compounded with the technological difficulties of high-resolution sampling close to the seafloor. Recent work has highlighted the promise of DOFS in helping address this observational gap, by illustrating how DAS-based strain measurements can provide quantitative information on bottom boundary layer currents and turbulence.
One such example is contributed by a pair of studies that analysed DAS-acquired strain data from a fibre optic cable at a tidal turbine test site, placed within a channel with very strong (>3 m s−1) tides (Fig. 7a). This channel is shallow (less than 30 m) and has strong tidal flows, leading to a well-mixed water column and a signal expected to be dominated by strain rather than temperature fluctuations. The first of these works (Spingys et al., 2024b) documented the tight relationship between variations in the bulk strain recorded by the cable and the component of the tidal flow parallel to the cable (Fig. 7b). The authors proposed that this relation stems from the flow's drag on the skin of the cable acting to stretch or compress the cable relative to its end, which is fixed at the shore. This result implies a quadratic relationship between the strain and the ocean flow, with a range of coefficients relating to both the properties of the optical measurement and the engineering of the seafloor cable. Note, though, that while this work provides promising evidence for the potential of DOFS to measure ocean currents at one location, it is unclear how widely applicable this methodology would be to other sites.
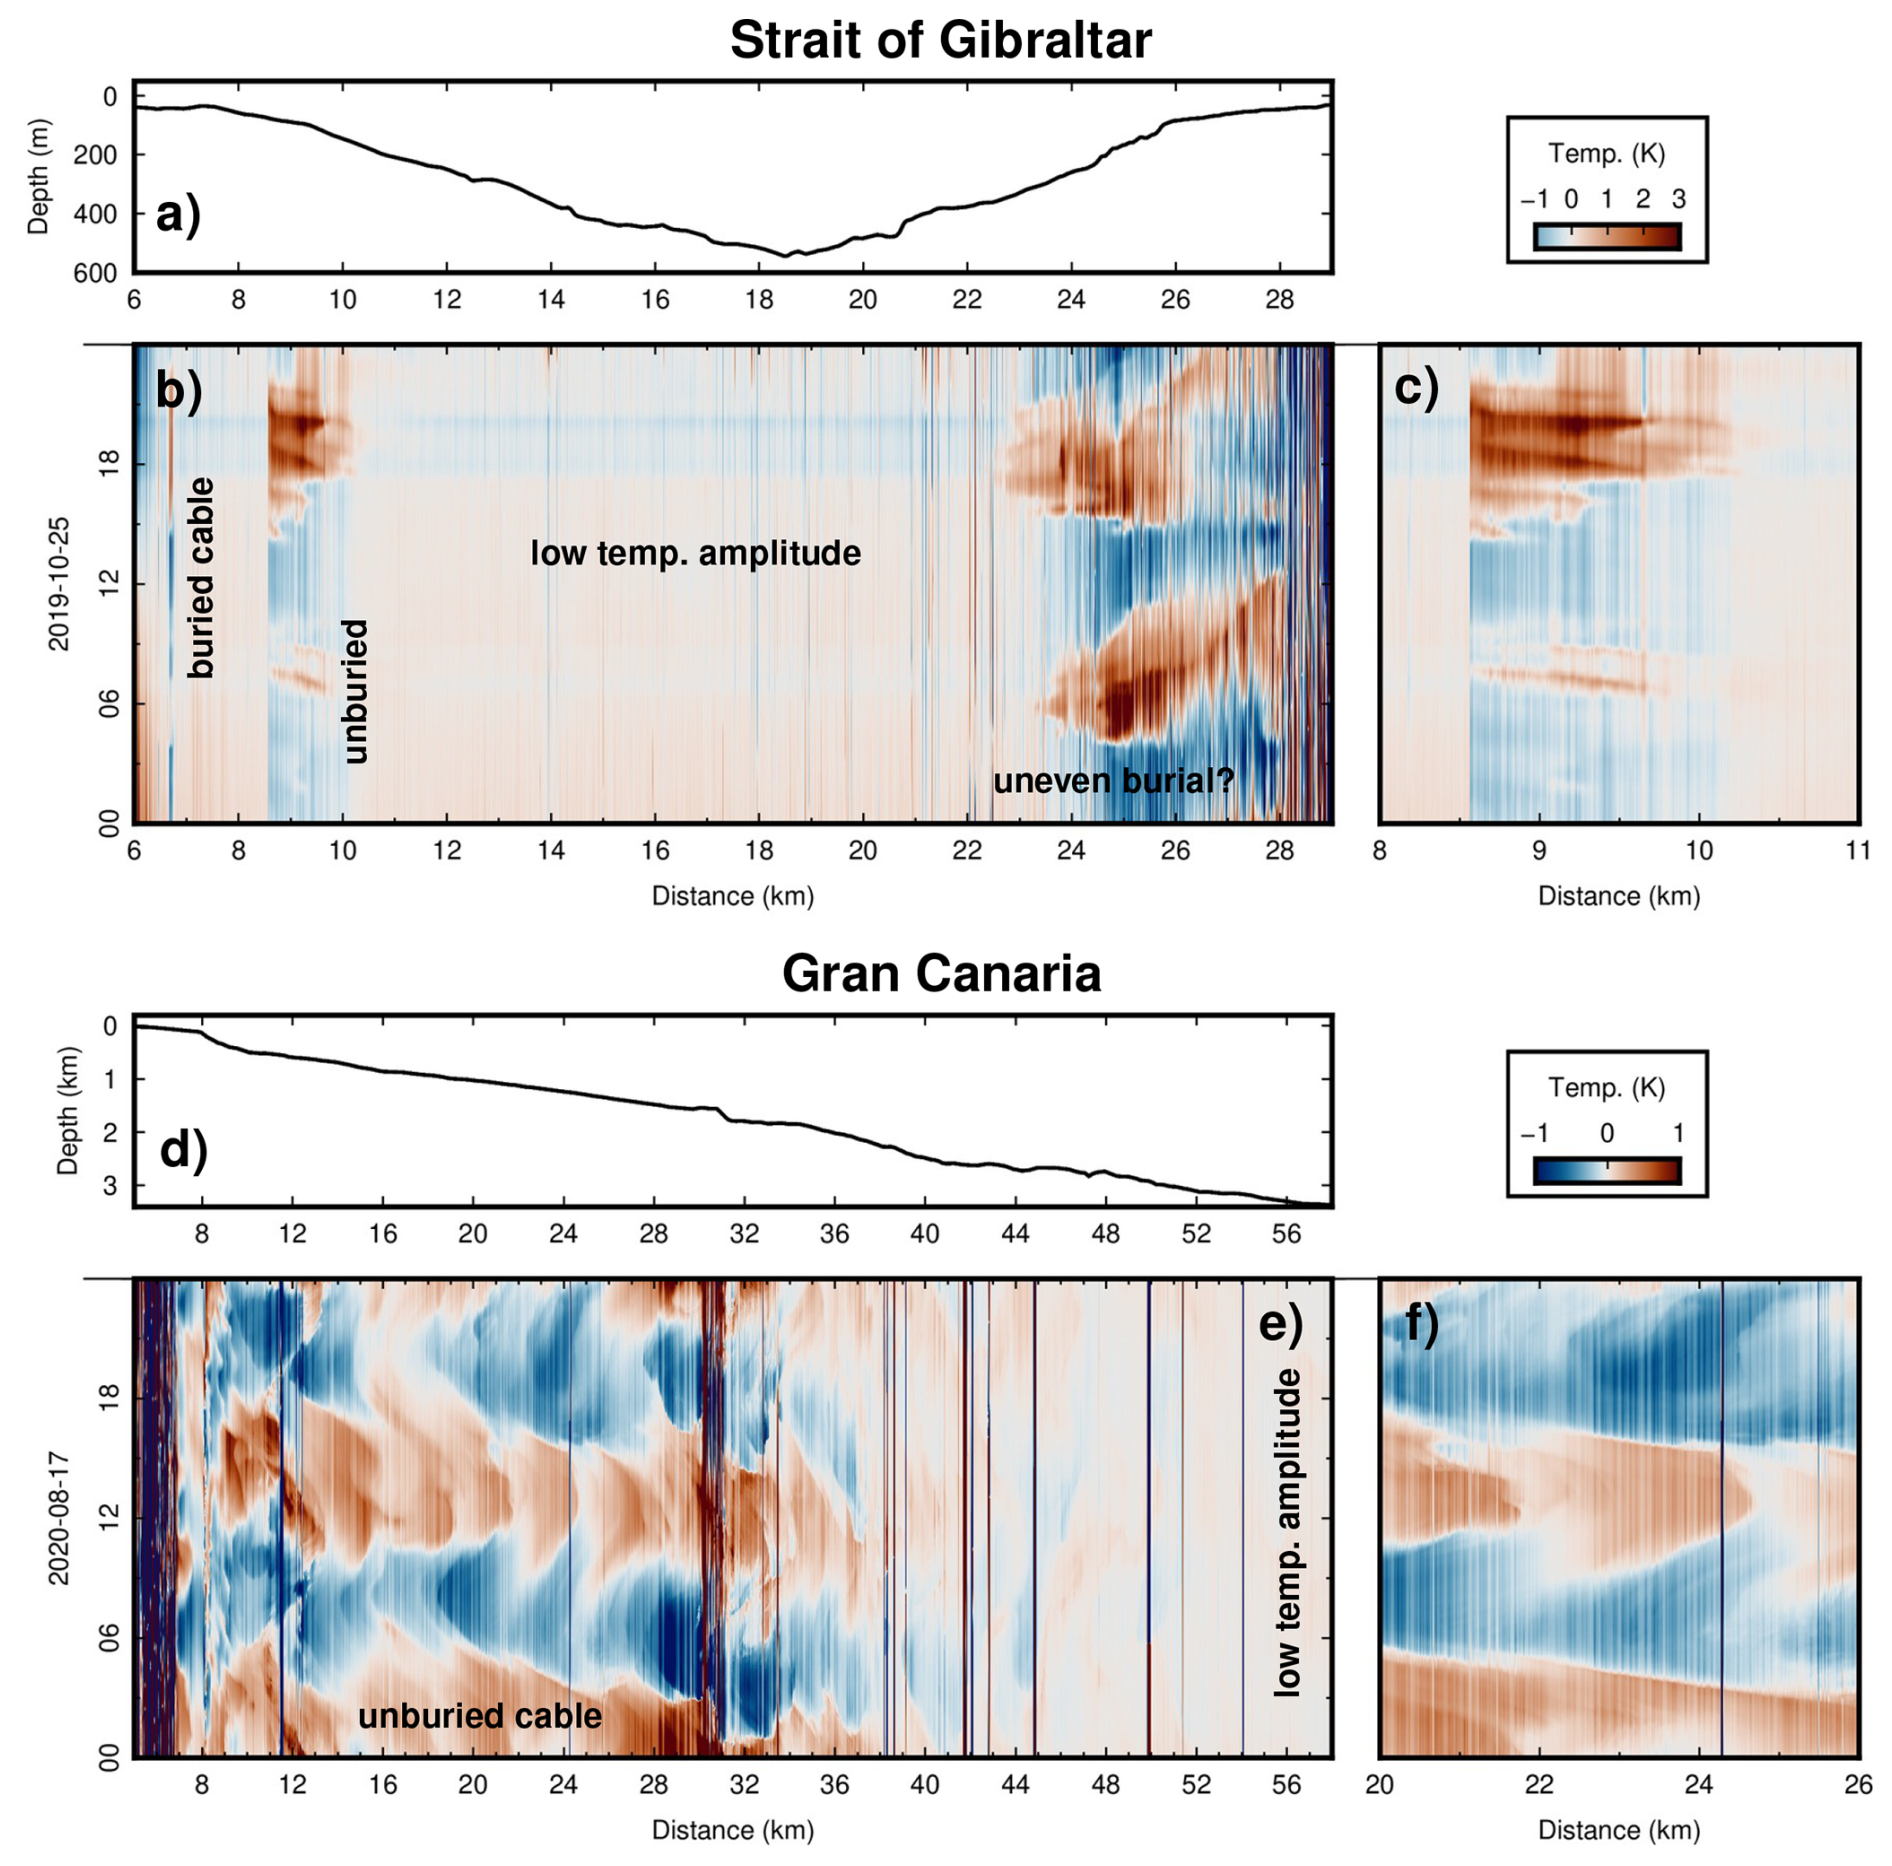
Figure 6Temperature fluctuations (3 d mean subtracted at each location) recorded with ocean-bottom DAS, modified from Williams et al. (2023). (a–c) One day of data from a power cable across the Strait of Gibraltar, showing periodic warming of the cable by passing trains of internal solitary waves of depression. (d–f) One day of data from a telecommunication cable offshore the island of Gran Canaria, showing a series of sharp temperature fronts from the steepened internal tide on a near-critical slope. Channels that appear as dark or light vertical stripes in this image represent channels with anomalously high noise or diminished temperature sensitivity, respectively.
A follow-up study at the same location demonstrated the capability of DAS-derived strain to capture turbulent-frequency (O(0.1) to O(10) s) ocean processes (Spingys et al., 2024a). Specifically, the authors' analysis showed that the measured frequency spectra of strain were consistent with forcing of the cable by flows in the inertial subrange of turbulence for the more energetic sections of the data set, although the spectra were less clear for less energetic sections – possibly due to reaching the instrument's noise floor (Fig. 7c). Other observational data sets have indicated that the horizontal scales of oceanic inertial-subrange turbulence can exceed 100 m (Klymak and Moum, 2007), potentially helping to overcome the limitations set by a relatively large gauge length. Based on the inertial subrange spectra, the turbulent kinetic energy dissipation rate, ϵ, could be estimated (Spingys et al., 2024a). This assessment of ϵ required an ad hoc calibration (effectively, a constant scaling of the output dissipation rates) to be applied, due to lack of understanding of the transfer functions between ocean processes and seafloor cables. The thus-obtained time series of ϵ exhibits a comparable structure and range to the dissipation rate expected from a bottom drag parameterisation (Fig. 7d). Future work will fully characterise the relationship and calibration across a wider range of cables, to examine the robustness and generality of these results.
An alternative approach to estimating bottom boundary layer flows from DAS-derived strain observations exploits well-established relationships between the vibrations induced by vortex shedding and the intensity of the cable-impinging flow, often called vortex-induced vibrations (VIV). In this approach, the frequency of the induced vibrations is linearly related to the speed of the flow past a suspended section of cable and the diameter of the cable, with a well determined coefficient (called the Strouhal number) that holds over a wide range of Reynolds numbers. This technique was demonstrated for suspended sections of a cable offshore Toulon, southern France (Mata Flores et al., 2023). The authors showed the good agreement between the flow speeds derived from VIV frequencies and a nearby conventional current meter.
A final technique to gain insight into bottom boundary layer flows, currently under development, examines the flows' impact on sediment transports. Since cable burial depth has been established to affect DAS sensitivity (Harmon et al., 2025), changes in such sensitivity could in principle be linked to the temporal evolution of burial depth – thus providing information on the variability of sediment transports and their underpinning near-bottom flows.
To conclude, going beyond the bottom boundary layer, the flow may also be assessed from DAS strain records using ocean surface wave interferometry. This approach exploits measurements of the dispersion relationship of surface waves propagating in opposite directions from seafloor cables (see also Sect. 3.3.4). This makes it possible to calculate the depth-averaged flow from the difference between the dispersion relationships (effectively, the wave propagation speeds) for the forward- and backward-propagating waves due to the Doppler shift (Williams et al., 2022). The approach has been applied and successfully validated in a range of regimes, including tidal flows at the Strait of Gibraltar (Williams et al., 2022), in the western Pacific Ocean under typhoon conditions (Lin et al., 2024), and in very shallow water at the Yellow River Delta (Song et al., 2024).
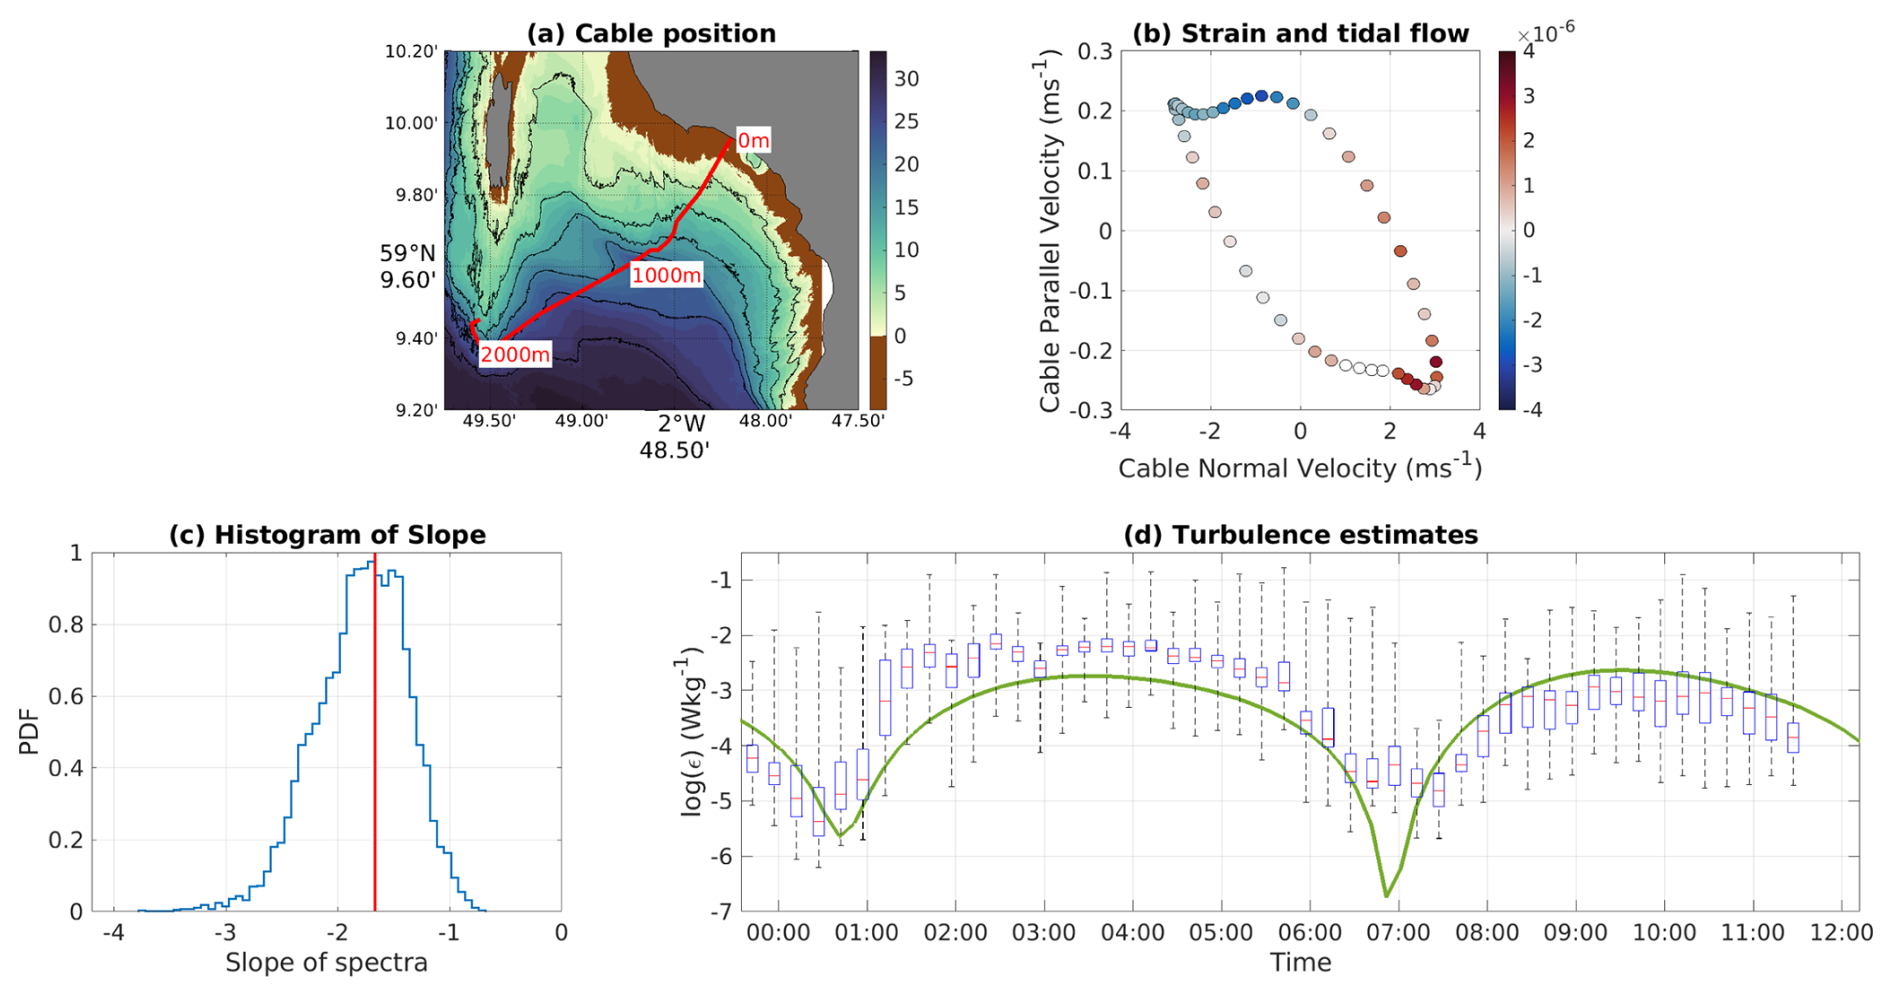
Figure 7Examples of DAS-based assessment of the tidal flow and turbulent intensity from cable data. (a) Map showing the location of the cable used, in the Orkney Islands. (b) Depth-averaged velocity taken from a nearby ADCP (axes) and averaged cable strain data filtered for periods above 1 h (colours). (c) Histogram of the slope in the strain spectra from the offshore section of the cable (blue line) and line marking frequency to the power of spectral slope (red line). (d) The estimated turbulent intensity taken from the offshore section of the cable data using inertial subrange methods and an ad hoc calibration (box markers), and taken from a bottom drag parameterisation (green line). Modified from Spingys et al. (2024a, b).
3.3.4 DAS case study III: Strain-based observations of surface gravity waves
Typically, waves are measured at point locations using fixed or free-floating sensors that record pressure, water surface elevation, and/or velocity (Dean and Dalrymple, 1984; Ardhuin et al., 2019). Although these types of measurements provide high-fidelity records, the deployment duration and spatial coverage of point measurements are generally limited by logistical constraints. Remote sensing techniques, such as radar, LiDAR, cameras and satellites can provide 2-D arrays of high-resolution spatial information (Holman and Haller, 2013), but these measurements target the sea surface and do not provide concurrent insights into near-bed processes. Most of these techniques are also affected by weather conditions, daylight, sea state and/or ice coverage, limiting our ability to acquire in situ observations in energetic or polar environments. DAS is emerging as a measurement tool that can bridge these observational gaps.
DAS-derived measurements of cable strain have recently been empirically calibrated to measure surface gravity waves in the incident band (0.04–0.4 Hz) in the nearshore and on the continental shelf to ∼ 50 water depth (Smith et al., 2023; Glover et al., 2024; Meulé et al., 2024; Ifju, 2025). These DAS-derived measurements of waves have been collected in a wide variety of conditions, including in polar environments under sea ice and during storm events, using both custom-installed cables and dark fibres in existing telecommunication cables. Thus far, these DAS-derived measurements of waves have been generated by empirically calibrating strain to seafloor pressure using in situ point measurements from traditional seafloor and sea-surface instrumentation. This empirical conversion assumes that the dominant strain signal in the 0.04–0.4 Hz frequency band is created by the dynamic pressure due to surface waves, where dynamic pressure is defined as the deviation from hydrostatic pressure. A correction factor is calculated uniquely for each channel, and is frequency-dependent:
where Cx(f) is the correction factor for channel x, P(f,t) is the power spectral density (PSD) of the dynamic pressure from a reference instrument over a representative time window (typically 20–30 min), and E(f,t) is the PSD of the strain at channel x over the same time window. The temporal median of many calculations of this ratio is used to generate a representative correction factor, because any given PSD ratio will have uncertainty and error. The frequency dependence accounts for the fact that DAS-derived strain is fundamentally an integrated measurement of strain over a full gauge length. Consequently, the relationship between the gauge length and the wavelength will impact the magnitude of recorded strain (Hubbard et al., 2022; Vantassel et al., 2022).
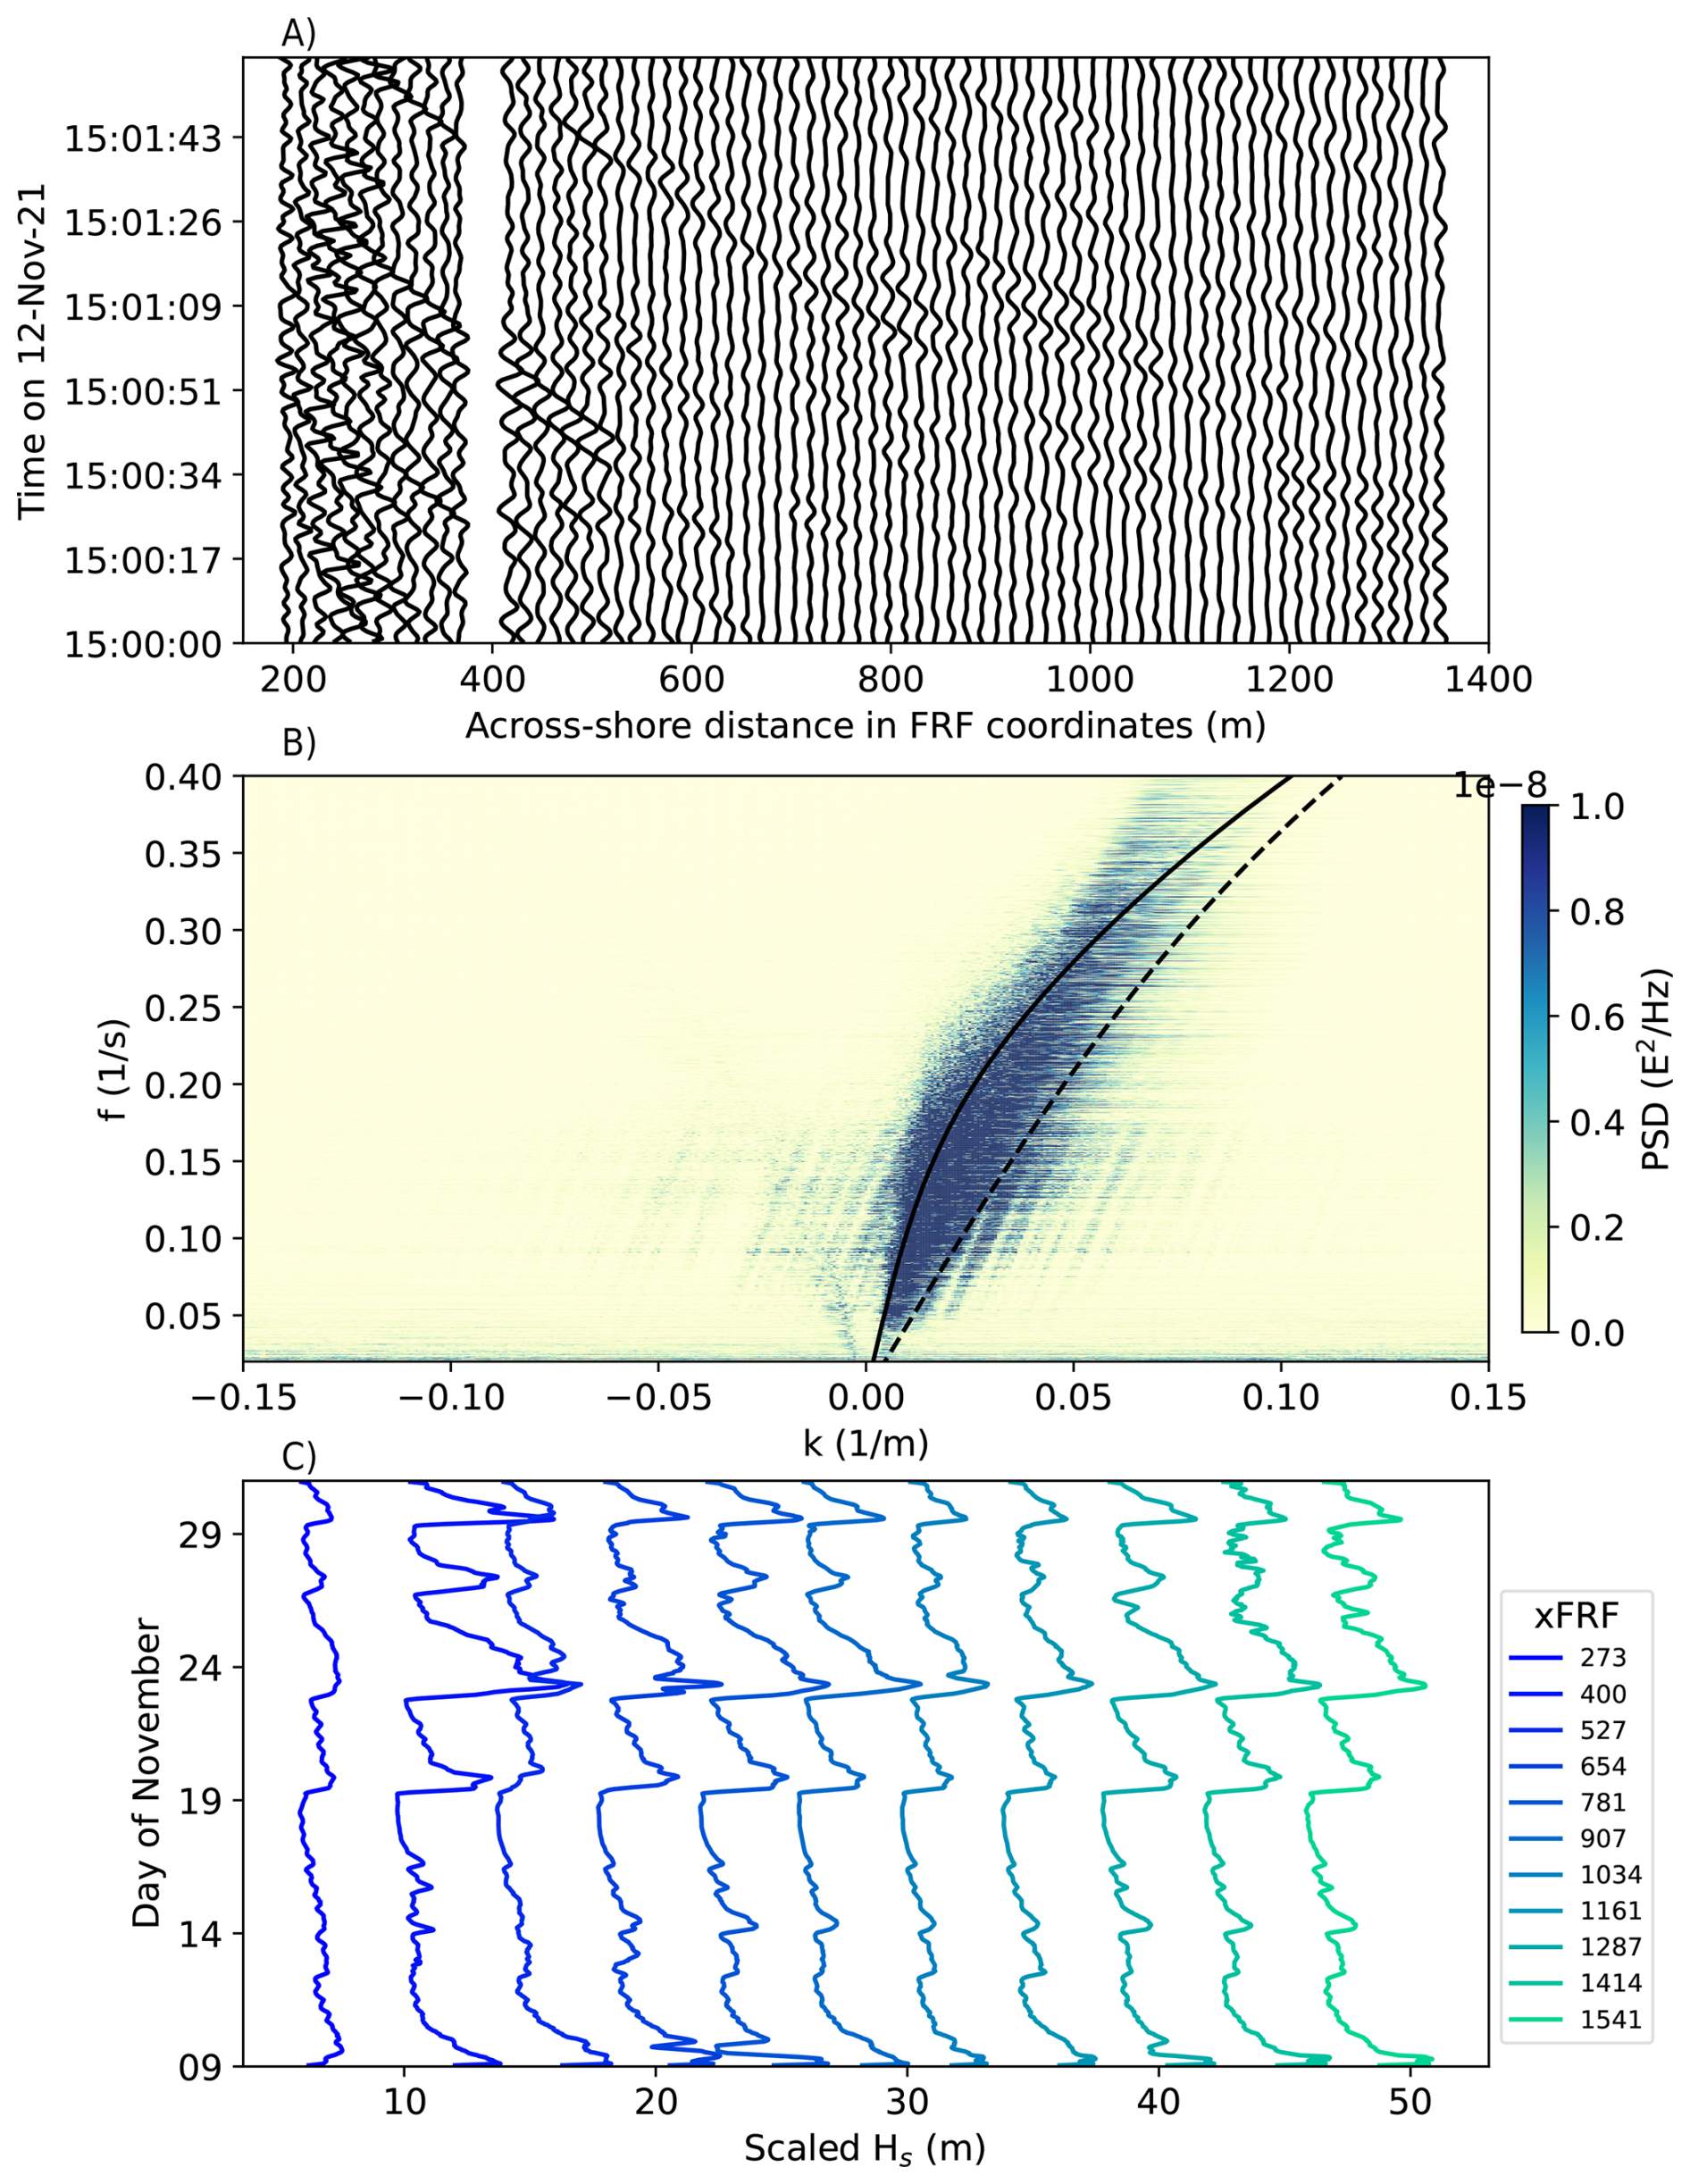
Figure 8Demonstration of waves recorded by DAS at the USACE Field Research Facility in November 2021. (a) Example of raw strain, where each strain time series is arbitrarily but uniformly scaled to highlight wave propagation onshore. Data from every 5th channel is shown. (b) 2-D power spectral density (PSD) of strain over a 30 min period. The dispersion relation is shown for 2 m (dashed black line) and 15 m (solid black line) water depths. (c) Significant wave height in November 2021 calculated from strain using an empirical correction. The wave height is only shown for every 30th channel, and is separated by a uniform distance to highlight wave evolution.
The ability of DAS to measure near-shore surface gravity waves has been demonstrated at the USACE Field Research Facility in Duck, North Carolina, USA (Fig. 8). A custom fibre-optic cable was laid cross-shore from the dune toe to ∼ 15 m water depth; the cable was trenched into the beach and weighted to self-bury offshore. Data were collected at 500 Hz with 3.2 m gauge length from November 2021 to February 2022 (Glover et al., 2024). The raw strain was dominated by surface gravity waves, which appear as coherently propagating bands of compression and extension. The dominance of surface waves can be further confirmed by examining frequency-wavenumber (f-k) spectra, where the energy signature is consistent with the dispersion relation for the range of water depths in which the cable was deployed (Fig. 8b). The DAS-based strain data from this experiment were empirically calibrated to near-bed pressure using Acoustic Wave and Current Meters (AWACs) deployed on the seafloor at 4.5, 6, and 11 m water depths. The DAS-derived pressure was successfully used to calculate bulk wave statistics every 30 min at 3.2 m intervals along the cable (Fig. 8c). Collecting DAS data along a cross-shore fibre like this enabled detailed investigations of wave evolution and reflection in both space and time (Glover et al., 2024).
Acquiring good-quality ground-truth measurements is the most significant challenge in using DAS strain data to quantitatively measure waves cross-shore. The magnitude of strain recorded at each channel is affected by changes in cable burial depth, seafloor coupling, cable composition, and optical fading. These changes in signal magnitude must be incorporated into the correction factor, while not altering any real-world differences in the wave-field amplitude. A single ground-truth instrument may not provide enough information about shoaling or nonlinear wave evolution to accurately calibrate every channel (Ifju, 2025). Consequently, this empirical calibration method often requires multiple ground-truth measurements with high fidelity. The number of ground-truth measurements needed to generate an accurate calibration will depend on the bathymetric complexity of the site (Glover et al., 2026). Geolocating each channel and measuring the water depth is also critical for the empirical calibration. Standard terrestrial methods of geolocation (i.e. “tap testing”) do not typically work for submarine cables, but recent work has provided new approaches for submarine geolocation (Holman et al., 2025; Growe et al., 2025). However, the post-processing burden of these methods is still high for individual projects.
Additional challenges in using DAS to measure surface gravity waves can primarily be addressed through experimental design. For example, it is important to set the gauge length as short as possible, to reduce the loss of sensitivity to higher-frequency waves. It is also important to consider the angle θ between the wave ray and the cable heading, since the magnitude of strain on a buried cable will decay with the incidence angle as cos 2 θ (Martin et al., 2021). This angle is generally not a significant source of error for near-shore measurements with a cross-shore cable, where the range of wave angles is limited by the shoreline. The exact depth limitations for measuring surface waves using DAS strain will depend on the attenuation of the wave-induced dynamic pressure with depth.
In a similar vein, DAS records have been used to obtain observations of tsunami waves (Tonegawa and Araki, 2024). The along-cable strain signals seen in these DAS data sets are thought to originate from the pressure variations associated with high-frequency tsunamis, as well as the seafloor deformation due to tsunami-induced pressure changes. Temperature contributions to the DAS records are inferred to be insignificant in the tsunami frequency range considered (Tonegawa and Araki, 2024). Although the exploitation of DAS for tsunami monitoring holds significant promise, further technical developments are required – particularly in accessing lower frequencies and establishing quantitative comparisons with more established geophysical approaches. Additionally, an operational tsunami monitoring network would likely require technological advances in DAS techniques, as the current interrogators cannot collect data through telecommunication repeaters. These repeaters are located at ∼ 50 to ∼ 100 km from shore, functionally limiting cross-shore DAS range for dark fibres in telecommunication cables.
These preliminary studies highlight the strong potential for using DAS-based strain data to quantitatively measure surface gravity waves in the incident band, but many methodological questions remain. The most significant advance would be provided by an analytical relationship between recorded strain and dynamic pressure. A fully analytical transfer function would incorporate the effect of stress-strain parameters for each component of the fibre optic cable, strain transfer between cable layers, seafloor composition and compliance, cable burial depth, temperature, and any interrogator signal-processing settings that impact the strain phase or magnitude. Progress is being made in all of these fields, but a complete, analytical transfer function has not yet been demonstrated. It is also important to note that the parameters listed above may not be obtainable for any given submarine DAS experiment (e.g., cable burial depth and seafloor sediment composition may not be known along the full cable length). An empirical or semi-empirical calibration may be the best method for many future applications of DAS to measure surface gravity waves. Given the need for ground-truth calibration measurements, submarine DAS should for now be viewed as a method to complement, not replace, existing oceanographic instruments.
3.3.5 DAS case study IV: Strain-based observations of sea ice
In seasonally sea ice-covered regions, fibre optic cables deployed along the seafloor can provide insight into sea ice physical properties and processes. The high spatio-temporal resolution of fibre-optic methods is well-suited to capturing the variability and heterogenity of sea ice in coastal regions. Typically, sea ice forms and grows through the fall and winter via both thermodynamic thickening and ridging, and then melts beginning in spring through to the sea ice minimum, usually in late summer. In addition to thermodynamic changes, dynamic changes associated with wind forcing and drift, as well as interactions with surface gravity waves, drive spatial and temporal variability in the sea ice field.
To date, fibre optic sensing of sea ice has primarily used DAS-based strain to observe changes in sea ice state and dynamic processes, especially interactions with surface gravity waves. Variability in the standard seasonal cycle at a given site can be qualitatively captured by the power spectrum of strain, where the spectral levels measured by seafloor cables are notably higher in open water than under sea ice (Peña Castro et al., 2023; Baker and Abbott, 2022) – as ice damps waves and associated noise. This is demonstrated by example data from Olitkok Point, Alaska, shown in Fig. 9, where the comparison of mean DAS power from different parts of the cable with satellite products for sea ice coverage suggests that lingering spring sea ice is inconsistently captured by products. During the relatively quiescent part of the year when sea ice cover is thicker, DAS-based strain observations of flexural gravity waves at the seafloor may be used to derive sea ice thickness (Baker et al., 2023) (Fig. 9c). This passive method for observing ice thickness is limited to shallow water depths, and is best suited to relatively homogeneous and thick ice due to the relatively coarse spatial resolution of the method. In the periods of the year with thinner or more diffuse ice cover, seafloor cables can similarly be used for sensing surface gravity waves (Smith et al., 2023); the DAS-measured strain responds to pressure from the waves, enabling assessment of wave parameters at high spatio-temporal resolution (see Sect. 3.3.4). Attenuation rates of surface gravity waves can be derived along the seafloor cable, serving as a proxy for new sea ice concentration or thickness (see Fig. 9d). All in all, the evolution of sea ice over space and time can be a useful indicator of surface forcing by waves and currents.
While most published sea ice-related work thus far has relied on existing seafloor cables, successful derivation of lake ice properties with an on-ice deployed cable interrogated with DAS (Castongia et al., 2017) suggests that this could be an effective approach to observe sea ice too (e.g., Serripierri et al., 2022). These types of technique are currently being tested in the field.
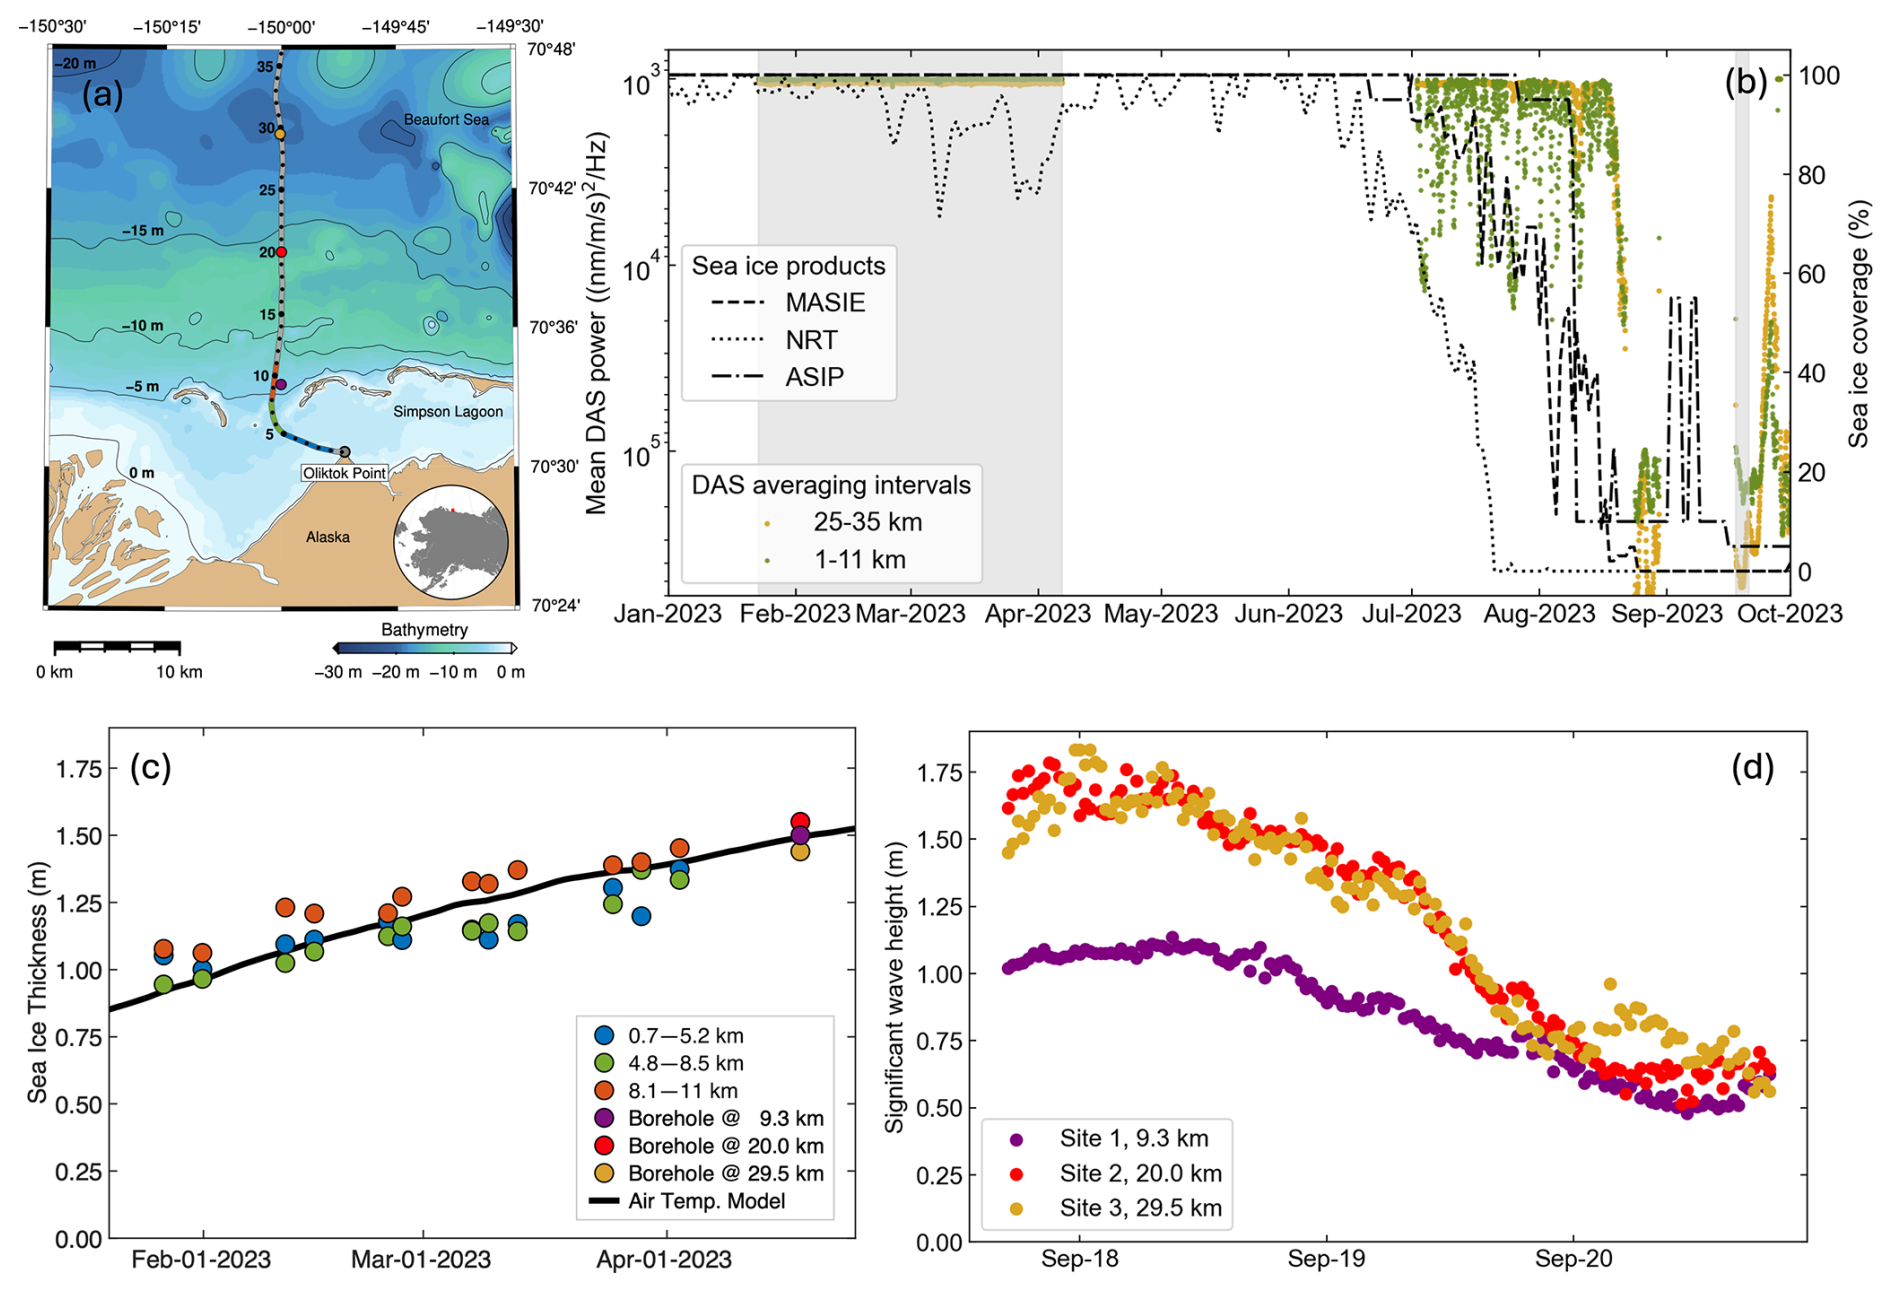
Figure 9Seafloor DAS can be used to understand sea ice evolution and processes, as demonstrated by an example dataset from Oliktok Point, Alaska (Stanciu et al., 2023). (a) Map shows location of cable on which DAS dataset was collected over 2023 (adapted from Baker and Abbott, 2022). (b) DAS mean power (full cable, and from discrete sections; note inverted log scale) suggests changes in landfast sea ice coverage on finer spatial resolution than is captured by large-scale sea ice products (e.g., MASIE; Fetterer et al., 2010). (c) Winter data (grey shading in (b)) can be used to estimate sea ice thickness evolution over time (adapted from Baker et al., 2023). Fibre optic-derived estimates compare well with simple model estimate using air temperature freezing-days (black line) and borehole measurements (blue markers). (d) Example time series of significant wave height at three sites in September (ice-free) demonstrate how summer and fall data can be used to observe surface wave variability and attenuation over space and time, with or without sea ice.
3.4 Ultra-long-range observations
Although the work undertaken thus far using DOFS has provided significant insight into a breadth of oceanographic processes, a key limitation remains: the along-fibre range. The longest-range DOFS systems currently available have a range that is at least one order of magnitude less than the width of ocean basins (up to 200 km range, cf. a typical basin width of 4000 km in the Atlantic Ocean or up to 20 000 km in the Pacifc Ocean). Initial attempts to close the gap between these two scales have focussed on making optical measurements integrated over the entire length of a cable, often with applications to detection of earthquakes (e.g., Marra et al., 2018; Zeng et al., 2021). These approaches have overcome the challenge of making basin-scale observations, but their inability to separate signals in space is somewhat restrictive in the identification of oceanographic processes in the data. The fundamentals and outstanding challenges of such emerging ultra-long-range DOFS techniques are outlined next.
3.4.1 Ultra-long-range observations of ocean currents with optical interferometry
The relatively limited, near-shore range of spatially-resolved DOFS was first overcome by Marra et al. (2022), at the expense of a lower spatial resolution. In those tests, the authors demonstrated the cable-based detection of ocean-bottom currents at distances up to several thousand kilometres from the coast. In contrast with DAS, which uses Rayleigh backscatter, the optical interferometry-based technique uses forward-propagating light. This leads to significantly higher signal-to-noise ratio in optical measurements than possible with the much weaker Rayleigh backscatter signal, enabling long-distance sensing. The technique implements an array of environmental sensors by exploiting a return optical path within the optical repeaters. A telecommunication optical link always consists of two fibres (transmitting, TX; and receiving, RX), one for each direction of propagation. In modern seafloor cables, a lossy return path within the optical repeaters, commonly referred to as High-Loss Loop-Back, is used to periodically check the health of the optical amplifiers. Light injected in the TX fibre is returned by a Fibre Bragg Grating (FBG, consisting of a short segment of optical fibre that reflects particular wavelengths and transmits all others) reflector in each of the repeaters, through the RX fibre. By performing ultra-stable interferometric measurements, the environmentally-induced optical path length changes on each of these TX-repeater-RX loops can be measured.
Specifically, the phase of the injected and returned light is compared through a process known as heterodyne interferometry, to assess environmentally-induced optical path length changes within each TX-repeater-RX loop. Similar to Eq. (6), the phase difference (ΔΦ) between the injected and received light can be linked to an optical path length or delay, in this case the loop-back path (L) or the loop-back path round-trip time (τ):
where Φ(t) and Φ(t−τ) are the phases of the injected and received light, respectively; ν is the laser frequency; c is the speed of light; λ is the wavelength of the laser light; and n is the effective refractive index. For simplicity, in Eq. (11), the laser frequency is assumed to be fixed. Indeed, if a sufficiently stable laser source is used, its frequency changes contribute negligibly to the measured environmentally-induced phase changes. Variations in temperature, pressure and mechanical deformation of the optical fibre within the cable will cause changes in τ. By (i) measuring changes in Φ on each loop, and (ii) subtracting the phase measurements from two consecutive loops to isolate the repeater-to-repeater cable section (termed “span”) changes, an array of environmental sensors is implemented. In contrast with DAS, which performs distributed measurements, the interferometric technique conducts an integrated measurement of the environmentally-induced optical phase changes over the span length. Although the resulting spatial resolution is significantly lower than that of DAS, the technique enables ocean-spanning coverage.
In the work by Marra at al. (2022), the team tested the technique on a 5860 km-long intercontinental seafloor cable between the UK and Canada. The cable accounts for 128 repeaters, with approximately one repeater every 46 km. While in its first demonstration only a fraction of the available cable spans were used, the team successfully showed the detection of earthquakes and ocean currents across thousands of kilometres from the UK end of the cable. In Fig. 10, tidal current-induced signals are shown, as measured on a cable span approximately 1600 km from the UK coast (Southport) on the Mid-Atlantic Ridge and at an average water depth of 3000 m. One potential interpretation of this signal is that the optical path length change could originate from the “strumming”, induced by the deep-water currents, of suspended sections of the cable between high points on the uneven seafloor (e.g., Mata Flores et al., 2023). Of course, the validity of this interpretation depends on a large proportion of the considered section of cable being suspended, which is unlikely to be the case in areas with a smoother seabed than the Mid-Atlantic Ridge, such as the abyssal plains. Surface storm signals were also identified and validated against data available from conventional near-shore sensors. In Fig. 4b of Marra et al. (2022), the passage of Hurricane Larry in 2021 was detected by the cable under test, and favourably compared to the wave height measured by buoy data in the Irish Sea.
By showcasing capacity to perform environmental sensing on ocean-spanning distances, this technique demonstrates the potential that ultra-sensitive optical measurements can unlock when applied to the existing seafloor telecommunication infrastructure, expanding monitoring capabilities from land to ocean. As for other cable-based sensing techniques, more research is needed to understand how to accurately convert these optical signals into oceanographic data, but their proven sensitivity to important oceanographic processes is encouraging.
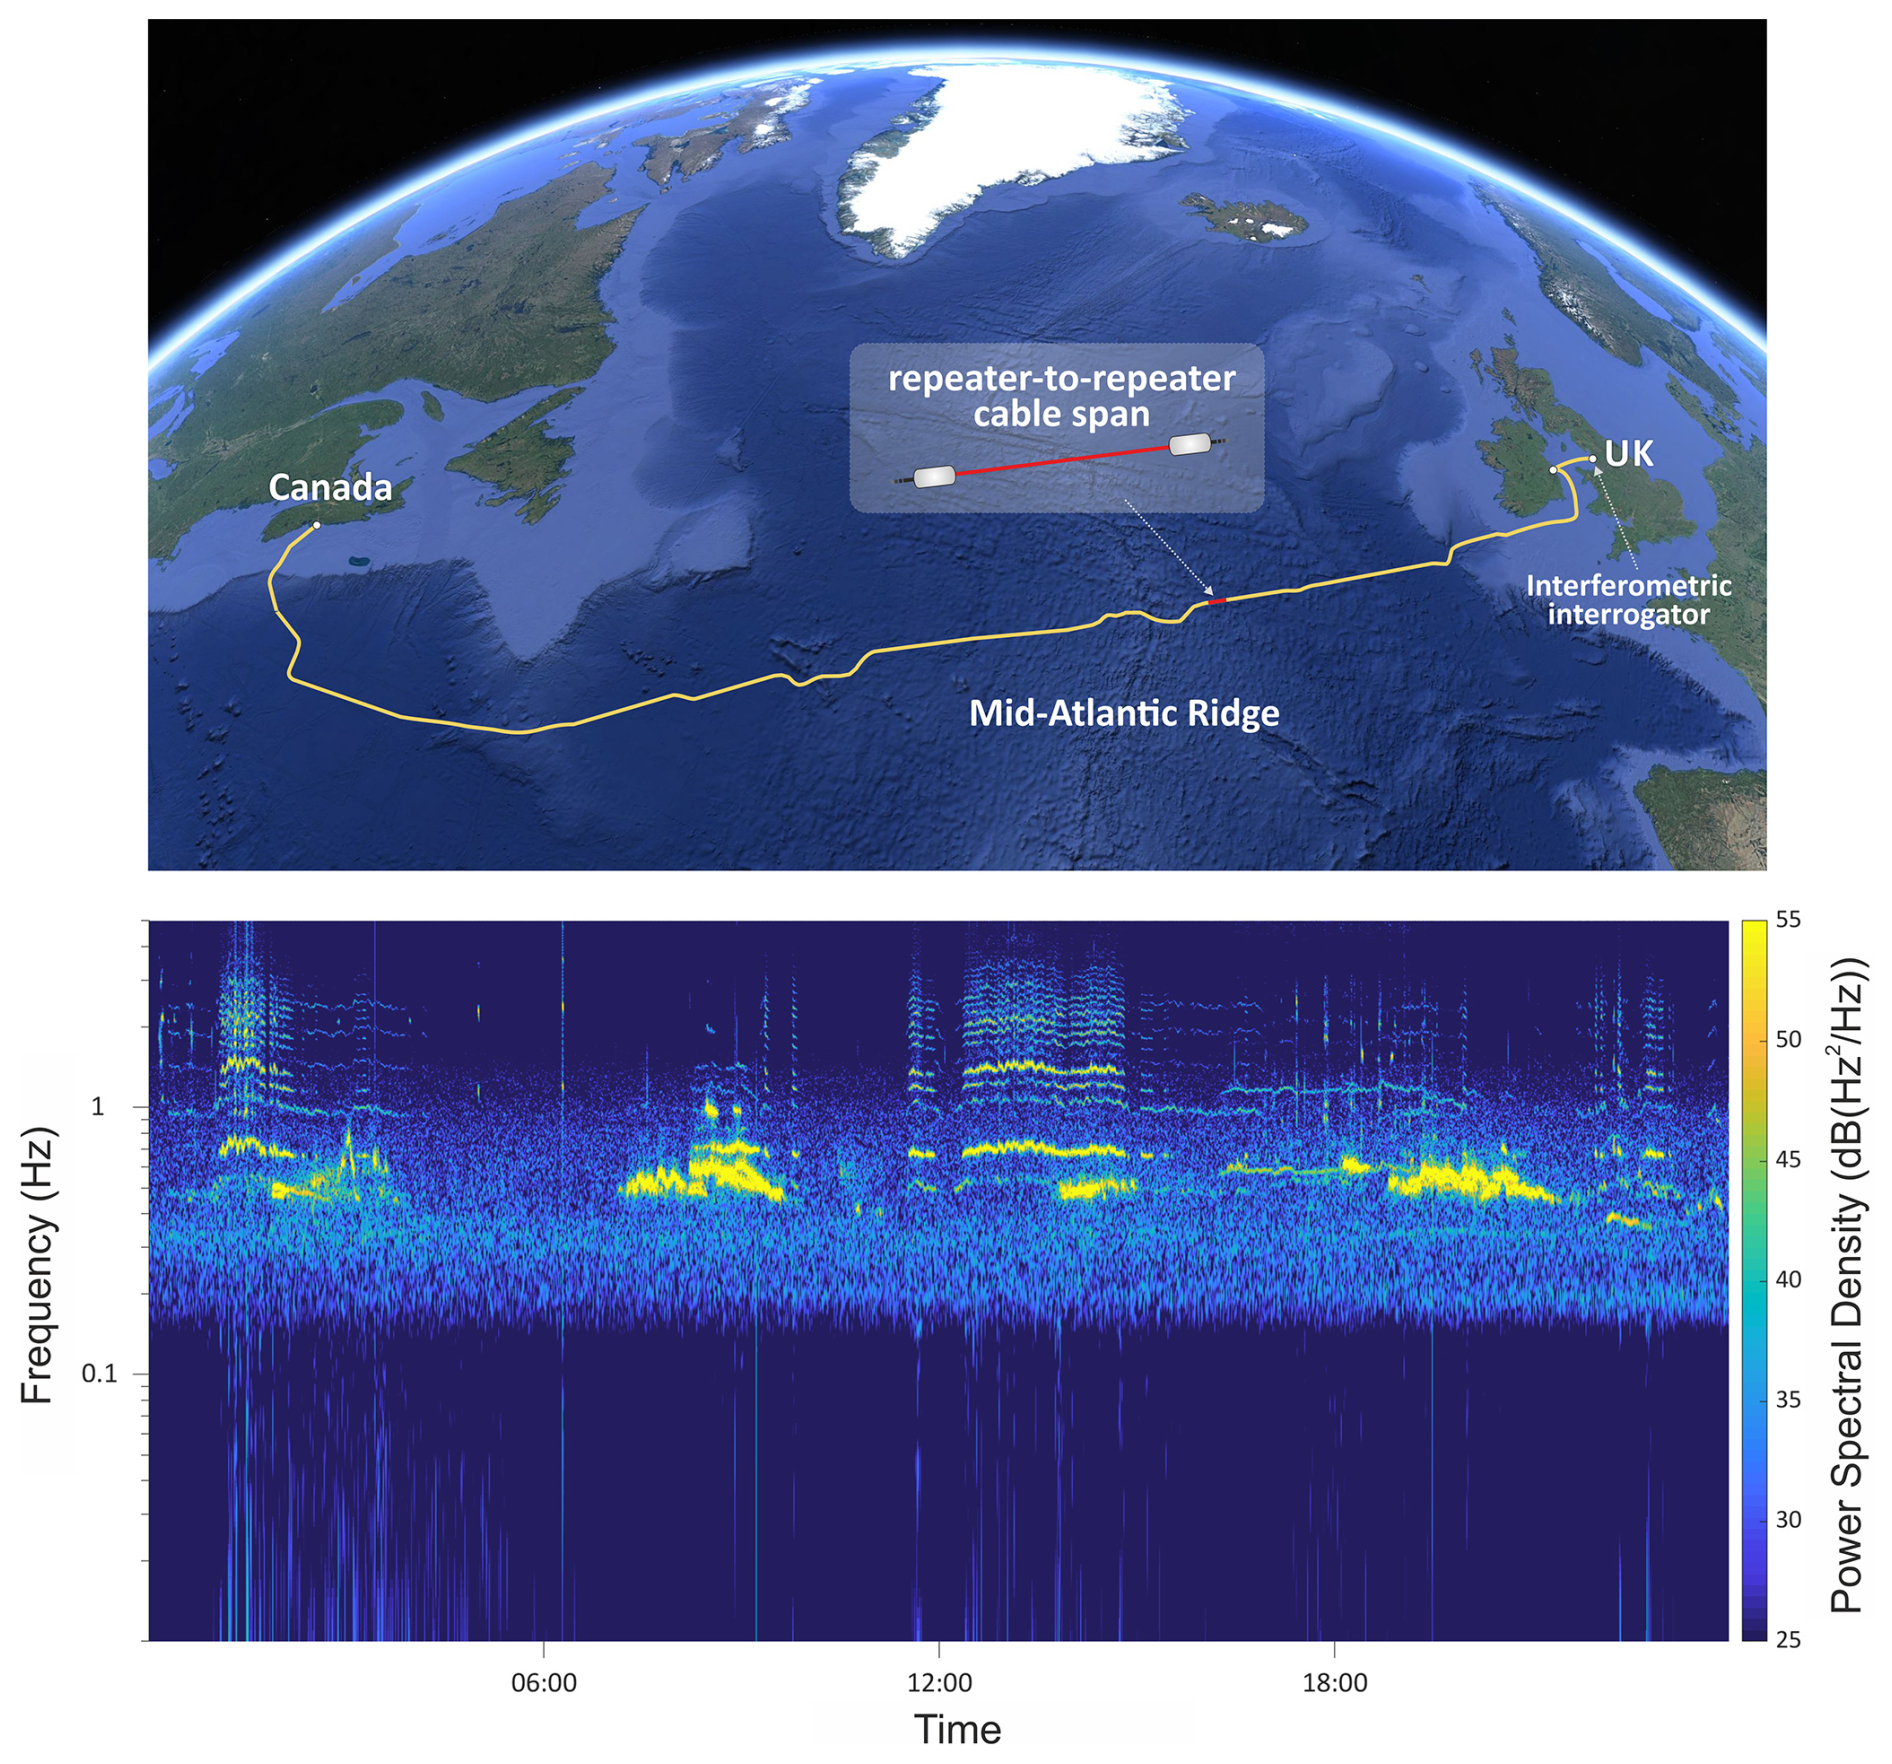
Figure 10(a) Map of the 5860 km-long seafloor cable between the U.K. and Canada, used for the National Physical Laboratory's long-range interferometric tests. (b) Spectrogram of the environmentally-induced optical frequency changes over the course of 1 d detected on a single span near the Mid-Atlantic Ridge, highlighted in (a). Tidal currents interacting with and causing strumming of the cable are visible. Similar signals are apparent on other repeater-to-repeater spans along the cable.
3.4.2 Recent developments in ultra-long-range sensing
Recent work has demonstrated the potential of new alternative methodologies to overcome the spatial resolution limitations of optical interferometry, which provides only spatially integrated measurements between repeaters. This work includes the development of long-range DAS systems that have successfully made measurements over several thousands of kilometres of repeatered cable, with a spatial resolution of 100 m or less and temporal sampling of up to 1 kHz. The combination of ultra-long range and relatively high resolution has been realised using two innovative optoelectronic interrogation techniques (Mazur et al., 2023, 2024; Rønnekleiv et al., 2025). The first technique (Mazur et al., 2023, 2024) is based on optical frequency-domain reflectometry (Eickhoff and Ulrich, 1981), where a frequency-swept pulse and high-sensitivity detection are used to continuously sample phase changes at a long range along a fibre, with a characteristic gauge length of 100 m and sampling rate of 100 Hz. This is distinct from optical time-domain reflectometry-based DAS measurements, in that the range from the interrogator and the phase are encoded and recovered using the frequency – and effectively wavelength – of the backscattered light (rather than using time, as in conventional DAS systems). The second technique (Rønnekleiv et al., 2025) is an extension of a conventional DAS system over thousands of kilometres using existing subsea networks, by firing many DAS pulses with different wavelengths in a single fibre. The method then creates an “effective interrogator” with typical DAS characteristics at a repeater, by exploiting the ability to separate and combine specific wavelengths so as to amplify the backscatter at that repeater, with the rest of the cable (from the source to the repeater of choice) acting only to carry the source pulse and returned backscatter.
While these approaches are in the early stages of development, their demonstration in geophysics – including detection of earthquakes and tsunamis (Mazur et al., 2025) – shows promise for physical oceanographic applications. Considerable efforts are currently being devoted to leveraging telecommunication monitoring techniques (developed to enable backscatter-based fault localization and performance tracking) for sensing. The rapid progress in this area suggests that the current near-shore limitations of DAS may be surpassed in the medium-term future, thus extending the applicability of DOFS further into the open ocean.
As illustrated in the previous section, there is now substantial evidence of the capabilities of DOFS to measure temperature, its gradients, and a suite of pressure-related variables in the vicinity of fibre optic cables deployed along the seafloor. It is expected that the reliability, accuracy and physical interpretability of these DOFS observations will develop rapidly over coming years, as targeted intercomparison exercises with standard oceanographic instrumentation, and other DOFS ground-truthing experiments, are increasingly performed both in the field and in controlled environments (such as flume tanks). A salient testbed for upcoming intercomparison efforts will be provided by two SMART systems with DOFS capability to be deployed in 2027 (the Atlantic CAM connecting Lisbon, the Azores and Madeira in a closed loop, with one dedicated fibre bypassing the first repeater at eight locations; and the Tamtam system connecting New Caledonia and Vanuatu). In the wake of these endeavours, DOFS is likely to become part of the mainstream technological toolkit in physical oceanography, significantly expanding the spatio-temporal reach and granularity of the oceanic phenomena that we are able to observe. However, despite all their promise, the DOFS techniques discussed to this point suffer from two notable limitations. On the one hand, they omit to consider one of the ocean's key state variables: salinity. And on the other, they are mostly incapable of measuring the water column, their sensing being usually confined to the immediate vicinity of the seafloor-laid cable. In this section, we touch on a range of prospective approaches that may enable DOFS to overcome such limitations.
4.1 Can DOFS measure ocean salinity?
Although observing salinity via DOFS in the field currently appears a distant prospect, laboratory-based research suggests that it may become possible in the future. One foundation of such research is provided by point-based fibre optic sensors, such as FBGs and long-period gratings (LPGs, a type of fibre optic structure with properties varying periodically along the fibre, allowing for spectrally selective light energy loss). This family of sensors has been shown to deliver high sensitivity to salinity in specific conditions (e.g., Alford et al., 2006). The expansion of this concept to distributed sensing is, however, more challenging, due to the subtle nature of salinity-induced changes in the properties of light propagating along a fibre optic cable. Ongoing research initiatives are exploring the development of bespoke cable coatings or materials that respond more significantly to salinity variations (Hadjiloucas et al., 1995).
In essence, fibre optic-based sensing of salinity leverages the occurrence of perturbations in the fibre's optical characteristics (such as its refractive index, dielectric constant, or strain) that result from dissolved salt-induced interactions. In polymer-coated FBGs, osmotic effects cause the polymer to swell or contract with changing salinity, thereby altering the grating period and shifting the reflected Bragg wavelength. Alternatively, an FBG sensor could conceivably be designed to detect changes in the refractive index of the surrounding medium, which correlates with salinity variations. This would likely entail etching the fibre cladding, in order to enable evanescent field interactions with the external environment, i.e. salinity sensing in seawater (Hadjiloucas et al., 1995; Liang et al., 2022). The same sensing principle can be exploited with LPGs and similar devices, such as fibre interferometers (e.g., Mach-Zehnder or Fabry-Perot configurations). These have been demonstrated to detect salinity variations by measuring changes in the refractive index induced by the ionic concentration in the adjacent fluid (Li et al., 2023; Yang et al., 2019). Drawbacks of the breadth of salinity-sensing techniques outlined above include their reliance on bespoke fibres, which limits their incorporation to commercial telecommuncation cables; and their potential vulnerability to biofouling, which may impact their longevity.
Another DOFS approach to determining ocean salinity could exploit high-precision measurements of both temperature and speed of sound throughout the water column. Speed of sound in water is a known function of the fluid's pressure, temperature and salinity; hence, to resolve salinity, a combination of DAS and DTS measurements in a vertical cable could enable the acquisition of unambiguous salinity measurements. If active sound sources were to be deployed (see Sect. 4.3) alongside DAS on a vertical cable, it would be relatively straightforward to estimate the speed of sound as a function of depth, using layer stripping (layer-by-layer tomography reconstruction as a function of depth). The vertical increment for salinity estimation would likely need to be somewhat greater than the typical DAS gauge length, i.e. around 5–10 m. Some errors would be expected at water column segments with steep thermal gradients, in which the assumption of uniform conditions over each depth increment would break down. Since the sensitivity of the speed of sound to a temperature change of 1 °C is ∼3 times greater than its sensitivity to a salinity change of 1 psu or to a pressure change of 1 dbar, we would expect combined DAS and DTS to resolve temperature and salinity, but possibly not pressure. While this approach has not yet been experimentally tested, the efficiency of the installation and repeatability of the measurements make it potentially appealing for estimating major salinity variations over depth and time.
The combination of DAS and DTS measurements is hence the most obvious potential solution to resolve the ambiguity between temperature and salinity variations in DAS records. At any rate, DAS measurements alone could be further scrutinised beyond travel times (i.e. for speed of sound estimates) to include analysis of acoustic reflection amplitudes, should those be interpretable in the DAS data. As shown by Bornstein et al. (2013), within the framework of “seismic oceanography” (described in more detail in Sect. 4.3) and, specifically, the application of acoustic full-waveform inversion methods, it is possible to separate temperature and salinity signals without assuming an empirical relationship between the two. The basic requirement for this approach to perform well would be for the ocean stratification to be substantial, such that it could support sufficiently large discontinuities in acoustic impedance (i.e. the product of ocean density and acoustic velocity) to generate detectable acoustic reflections and refractions.
Thus, all sensing options considered, there are reasons to expect that an ocean-worthy DOFS approach to measure salinity may be achievable.
4.2 DOFS for water column observations: Unconventional cable configurations
To date, the vast majority of physical oceanographic studies using DOFS have used a fibre optic cable laying on the seafloor as the sensing platform. This has been motivated by either the exploitation of legacy infrastructure, or the adoption of a relatively simple system configuration. However, little in DOFS technologies precludes the possibility of deploying cables with alternative geometries, better suited to readily provide observations in the water column. Such alternative configurations include: vertically suspended cables, as could be incorporated into an oceanographic mooring (see e.g., example in Sect. 3.1.3); cables towed behind crewed or autonomous platforms; or combinations of vertical and horizontal cable sections to create mesh or spoke-and-wheel designs.
These alternative DOFS system configurations will involve additional engineering challenges, solutions to which are currently being explored by several teams world-wide. For example, as these systems would often be disconnected from land-based facilities, they would require smaller and less power-hungry interrogators than are available in the market at present, as well as novel strategies to manage the very large volume of data acquired in a remote setting. Previous experience from ice shelf installations has shown that systems can be operated in harsh and remote environments for durations from several months to multiple years. While these systems were primarily focused on measuring temperature, and hence produced data volumes far less than a combined DAS/DTS system would, techniques have been developed for data compression and data management that may provide insights into remote ocean deployments (Scambos et al., 2025a). Considerable thought will also need to be given to making complex-geometry designs sufficiently robust for deployment and recovery at sea.
Should these challenges be overcome, the alternative DOFS configurations will expectedly provide a means of observing oceanic processes that either lie beyond our existing measurement capabilities, or require highly specialised and expensive instrumentation that is not widely available. To offer some illustrations, we anticipate that a DOFS system deployed in a vertical mooring configuration (e.g., Saw et al., 2025) would enable sampling of the vertical profile of (at least) temperature and several metrics of small-scale turbulence with near-unprecedented spatio-temporal resolution and range, including in highly inaccessible marine environments (such as e.g., under drifting sea ice or in ice shelf cavities). Similarly, a mesh-shaped DOFS would provide an ideal approach to observe interactions between distinct classes of oceanic motions that are manifested on overlapping spatio-temporal scales, and that require extensive, continuous sampling to be adequately characterised (e.g., submesoscale fronts and internal waves). Analogous examples of fruitful deployments of unconventional (e.g., mesh-configured or mobile) DOFS systems can be found in the atmospheric (Dexheimer et al., 2019; Cheng et al., 2017, 2020; Drake et al., 2021; Morrison et al., 2021; Thomas and Selker, 2021; Goetz et al., 2023) and earthquake monitoring (Kawaguchi et al., 2008) literatures.
An additional advantage of new DOFS configurations is that, in moving beyond fixed infrastructure, a clear gain is achieved in system flexibility and responsiveness. For example, one approach currently in consideration involves portable DOFS systems designed for short-term seafloor deployments. These would operate for days or weeks using battery power, and potentially longer if continuous power is available. Such systems are well suited to environments where episodic activity demands rapid, targeted observation. Their small footprint and modular design reduce logistical burden, but challenges remain, including ensuring reliable acoustic coupling between the fibre and seafloor, and accurately interpreting data in complex, variable field conditions where noise and overlapping signals can obscure the underlying processes. Concurrently, autonomous mobile platforms are being developed with the capability to tow light-weight fibre optic cables paired with compact DAS interrogators. These vehicles can record distributed acoustic signals as they travel, offering a way to follow and observe propagating oceanic phenomena (e.g., internal wave packets or shifting acoustic fronts) in real time. The platforms' mobility opens up access to complex terrains, such as submarine canyons or under-ice environments. That said, engineering trade-offs must be addressed, namely minimising noise from vehicle motion, ensuring good cable-water coupling, and storing/processing large volumes of data efficiently onboard. While typically limited to a few hundred metres to a few kilometres in cable length, these systems are well suited for deployment in pilot studies and rapid-response campaigns. With robust engineering and deployment strategies, unconventional DOFS configurations are poised to complement fixed networks and expand the scope of physical oceanography.
Cable geometry considerations aside, bespoke cable designs also have potential to enable significant advances in fibre optic sensing. For example, at present, DOFS in oceanic environments typically uses heavily armoured cables to protect the delicate optical fibres from damage. Whether specifically designed for ocean observations, or when using existing telecommunications cables, the need for robust cable armouring both dramatically increases the cost of installation, and reduces the fibre's coupling to the environment through either thermal damping or physical suppression of the external strain signals. The issue of coupling continues to be a challenge for all DOFS, and is a topic of significant ongoing research in DAS-related seismology (see Li et al. (2021) and examples therein). Recent testing and application of bare fibre – glass fibre with only a thin layer of acrylate coating – for DTS and DAS in ocean and ice have shown promising results for short-term monitoring. As DTS relies heavily on the fibre's attenuation characteristics, using bare fibre in an ocean setting would expose the fibre to a very wide range of fluid pressures, which could affect attenuation properties. Experience from deep-ocean remotely operated vehicles, where bare fibre has successfully been used for communication to depths as great as those of the Mariana Trench (exceeding 11 000 m), suggests that bare fibres could continue to function under such pressures and within the water column (Fletcher et al., 2009; Whitcomb et al., 2010). To further evaluate the attenuation characteristics under pressures typical of the deep-ocean and deep-ice environments, Tyler et al. (2024) tested both single-mode and multimode bare fibres at hydrostatic pressures ranging up to 517 bars. For single-mode fibres, there was no statistical change in differential (between the Stokes and anti-Stokes signals) attenuation with pressure, confirming that single-mode bare-fibre DTS could successfully be used in deep-ocean settings. For multimode bare fibres, there was a very slight sensitivity of differential attenuation to pressure. However, for a 6000 m-mooring installation using multimode bare fibre, Tyler et al. (2024) demonstrated that the absolute error in temperature estimate would be <0.2 °C in a single-ended configuration. These results indicate that, for short-term ocean deployments or where the logistics of an armoured cable are not practical or cost-efficient, bare fibre can be successfully used for both DTS and DAS applications, thus greatly expanding the potential range of experiments where DOFS can be deployed.
4.3 DOFS for water column observations: Passive and active acoustic techniques
An alternative approach to obtaining water column measurements using DOFS is to exploit the capacity of optical fibres to remotely sense sound. Various kinds of underwater sound have been recorded using DAS and analysed to identify and track ships, whales, storms, earthquake-generated T-waves, and man-made acoustic signals such as airguns (Matsumoto et al., 2021; Rivet et al., 2021; Landrø et al., 2022; Wilcock et al., 2023; Shen and Wu, 2024; Loureiro et al., 2025). Sensitivity of DAS measurements to ambient (passive) and active underwater sound may, in principle, enable observations of the water column by tracing the ray paths of acoustic signals reaching a fibre optic cable deployed along the seafloor, and relating those paths to the properties of their intersected water parcels.
For any two points in the ocean, sound can typically propagate along several acoustic ray paths between them. Alternatively, sound can be considered as propagating as a combination of normal modes travelling through a channel. The sound speed (which is largely a function of temperature, pressure and, to a lesser extent, salinity) and flow velocity encountered along each path determines the acoustic travel time between the two points. By combining travel times across multiple paths, properties of the water column can be determined using tomographic techniques (Munk et al., 1995). Tomography with active noise sources is well established (Munk et al., 1995; Howe et al., 2019b) but has not become a widespread means of monitoring the ocean due to the cost of maintaining sources, as well as concerns about the impact on marine life. In contrast, using ambient noise sources, in a technique known as acoustic noise interferometry (ANI) (Weaver and Lobkis, 2004; Roux et al., 2004; Godin, 2006, 2018; (Wapenaar and Fokkema, 2006; Larose et al., 2006) replaces active sound sources with passive measurements of the ocean's ambient noise, and thereby avoids such concerns. Both active and passive techniques are well established in other fields, particularly in seismological studies of the Earth's subsurface.
Underpinning ANI is the phenomenon that the Green's function – which describes how a wave propagates between two points – can be approximated by cross correlating the ambient noise recorded at two locations. This turns these locations into a virtual source-receiver pair, and the resulting noise cross correlation function (NCCF) has peaks corresponding to the travel time of the acoustic wave propagating between the two stations in either direction. The emergence of these peaks requires the averaging of NCCFs over time and/or space, in order to overcome the low signal-to-noise ratios typically associated with ambient noise. This reduces the temporal resolution of this technique. Inverting the travel times over many station pairs allows for sound speed, and temperature, profiles to be ascertained (Godin et al., 2010; Yang et al., 2019; Tan and Godin, 2021; Tan et al., 2020; Goncharov et al., 2016). Flow velocity can be retrieved by using nonreciprocity of the NCCF, which is the difference in acoustic travel times between the two directions of propagation (Godin et al., 2014; Goncharov et al., 2016). ANI-based ocean acoustic tomography and thermometry (essentially a simplified form of tomography that foregoes spatial resolution in favour of a higher temporal resolution of spatially averaged temperature variations) have been successfully demonstrated using noise recorded on hydrophones (Godin et al., 2010, 2014, 2017; Brown et al., 2014, 2016; Woolfe et al., 2015; Goncharov et al., 2016; Qin et al., 2017; Yang et al., 2019, 2020; Tan et al., 2019; 2020; Tan and Godin, 2021, 2022; Wang et al., 2021; Ragland et al., 2024).
There are, however, challenges and limitations around the application of ANI to ocean remote sensing using these traditional instruments. Combining ANI with DOFS (in this case, DAS) (Fig. 11) has the potential to address the key challenges of current implementations of ANI for passive acoustic remote sensing, including:
-
clock synchronization and sub-millisecond clock accuracy, which DOFS interrogators routinely sustain;
-
increasing temporal resolution (hours to days in current ANI systems) to ∼1 min, by supplementing time averaging of noise with statistical averaging over multiple virtual DOFS sensor pairs;
-
real-time data collection from DOFS sensors on or near the seafloor.
Despite these points of promise, accurately geolocating individual DAS channels on a submarine cable may pose some difficulties. Geolocating methods reliant on acoustic sources (Shen et al., 2024; Lin et al., 2025) or surface gravity waves (Holman et al., 2025) may be useful in overcoming this challenge. At any rate, accurate positioning of DAS channels is expected to become important when using signals from compact or active sources, but less so for ANI, where travel time (and changes in travel time) between channels is used.
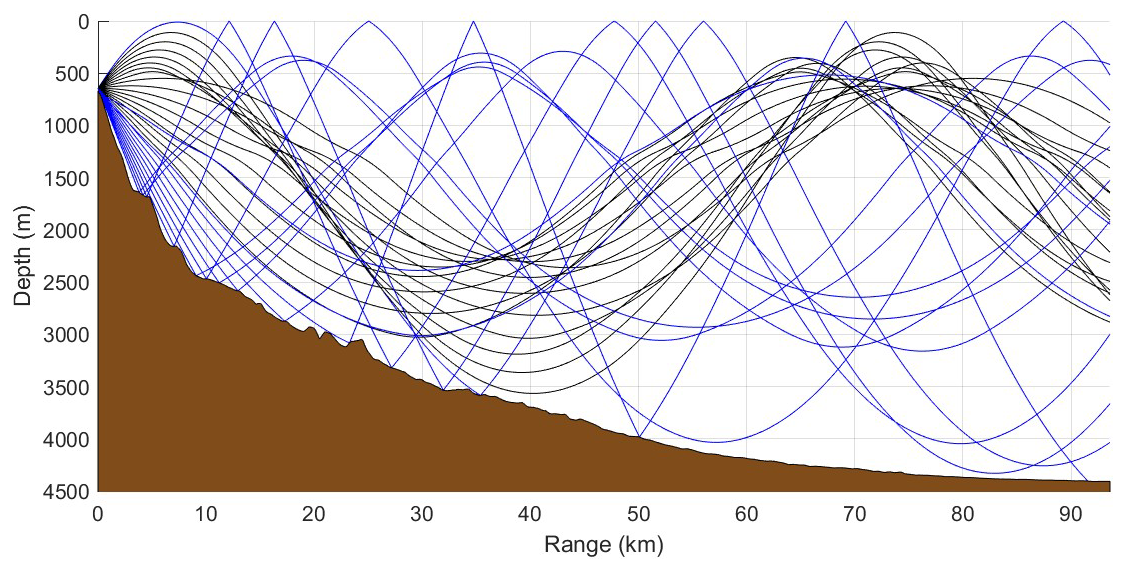
Figure 11Cross section showing rays providing reliable acoustic paths between a point at 670 m depth and other points along a seafloor cable off Madeira (blue), where an ANI-DAS experiment by a subset of the authors is ongoing. Rays emanating from the same point but not returning to the seafloor are shown in black.
The dense spacing of the sensing points made available in a DOFS system will dramatically increase the number and variety of acoustic paths available, which in turn may provide unprecedented horizontal resolution, and enhance the vertical resolution, of the inverted ocean temperature and velocity profiles to below the 10–100 m that is currently achievable with only a few or few dozen hydrophone pairs (Godin et al., 2010, 2014; Goncharov et al., 2016; Yang et al., 2019; Tan et al., 2019, 2020; Tan and Godin, 2021). With such space-time resolution over a cable length of tens of kilometres, the application of ANI to DAS data has potential to capture ocean processes across a very wide range of temporal and spatial scales.
By providing path-averaged measurements of sound speed and current velocity, ANI will complement and mutually enhance point oceanographic measurements, e.g., by temperature sensors on Argo floats and by temperature, pressure and seismic seafloor sensors deployed as part of the SMART cables network (Howe et al., 2019, 2022a). A particularly promising future observing capability in this area entails the application of ANI to DAS measurements with conventional fibre optic cables that are combined with seismic sensors on SMART cables. This approach would take advantage of both types of data being synchronised and available on shore in real time. Along a single straight cable, ANI-DAS would provide measurements on a vertical plane in line with the cable, up to approximately 100 km from shore. The deployment of sensors on SMART cables may afford an opportunity to extend the reach of ANI-DAS. In this case, DAS measurements would be correlated with acoustic receivers at SMART cable nodes. With appropriate averaging over multiple DAS channels (accounting for range variation), this would enable probing further offshore and/or attaining horizontal resolution in the cross-cable direction. Although this application remains to be demonstrated, wave interferometry – in essence, a simplified form of ANI – has already been successfully showcased on DAS records of surface gravity waves (Williams et al., 2022). Demonstrations of ANI-DAS and efforts to establish the conditions under which it delivers valuable environmental information are the focus of ongoing research.
In addition to exploiting ambient sound to probe the water column via ANI, the sensitivity of DAS to dynamic pressure changes due to active source acoustic waves can also be used to measure both spatially resolved and spatial averages of ocean sound speed, and hence temperature, up to basin scales. Three different techniques could be utilised here: ocean acoustic thermometry; active-source ocean acoustic imaging and tomography (similar to seismic oceanography); and modal tomography. Ocean acoustic thermometry (Mikhalevsky and Gavrilov, 2001; Dushaw et al., 2009) measures acoustic travel times between a powerful, compact sound source at a known location and a set of receivers. In contrast to ocean acoustic tomography, which strives for spatially resolved measurements, acoustic thermometry aims to quantify long-term temporal trends in the spatially averaged water temperature and ocean heat content. The probing acoustic signals can be either broadband pulses generated by a dedicated human-made sound source (Mikhalevsky and Gavrilov, 2001; Dushaw et al., 2009; Gemba et al., 2023) or T-waves generated by pseudo-repeating earthquakes (Peng et al., 2024; Shen and Wu, 2024), as proposed by Wu et al. (2020). Using DOFS for ocean acoustic thermometry would not only dramatically expand the geographic coverage of measurements compared with sparse traditional receivers, but could also lead to more robust estimates of temperature trends courtesy of averaging over multiple channels along a fibre optic cable.
Regarding active-source ocean acoustic tomography, the well established “seismic oceanography” leverages acoustic source and receiver set-ups traditionally utilised for subsurface seismic reflection studies (e.g., airguns and a long hydrophone streamer towed behind a vessel). This technique uses reflections of sound off discontinuities in sound speed and density within the ocean to build up an image of water column structure and stratification (Dickinson and Gunn, 2022). The data can be further analysed and inverted to provide 2-D or 3-D estimates of sound speed, ocean temperature, and salinity (Papenberg et al., 2010; Bornstein et al., 2013), as well as assessments of specific ocean dynamics such as mixing rates (Sheen et al., 2009). Previous work has demonstrated that DAS has the potential to be used in lieu of a hydrophone streamer for subsurface active-source seismic experiments, both on land (Daley et al., 2013; Bakulin et al., 2020; Song et al., 2023) and at sea (Matsumoto et al., 2021; Taweesintananon et al., 2021). Although there may be challenges to overcome, such as poor signal-to-noise ratio and other reflection processing difficulties (e.g., Taweesintananon et al., 2021), these advances illustrate how DAS measurements from seafloor-laid fibre optic cables could be used for seismic oceanography experiments, allowing high-resolution (∼10 m) imaging of ocean structure, physical properties and dynamics over the length of the fibre (tens to hundreds of kilometres). The third technique, modal tomography, has some cross-over with ocean thermometry, which may also use modal theory. In this case, modal tomography considers sound travelling as acoustic modes through the water column between source and receivers, and inverts their characteristics to yield sound speed profiles as opposed to singular, averaged temperature estimates. Modal analysis adapted to DAS could yield sound speed and density profiles using modal eigenvalues (Rajan, 1998; Tan et al., 2019, 2020), and may further provide information on their lateral variations, as demonstrated by Rajan and Frisk (2020).
As showcased by the range of applications in Sect. 3, DOFS is an emerging reality in physical oceanography. DOFS techniques (including DTS, DSS, DAS and ultra-long-range optical interferometry) have been shown to be able to measure the temperature, pressure and/or velocity signatures of oceanic phenomena with spatio-temporal scales spanning 6–8 orders of magnitude – from the O(1 cm, 1 s) signals of small-scale turbulence to the O(1000 km, 10 d) fingerprints of basin-scale tides (Fig. 1). These observations were typically acquired using legacy optical fibre cables deployed along the seafloor, and sampled water properties in the cables' immediate environment, representative of either the bottom boundary layer (Sect. 3.1.2, 3.2.2, 3.3.2–3.3.3 and 3.4.1) or the ocean surface (Sect. 3.3.4–3.3.5). While the combination of fine resolution and large range in many of these demonstrations represents a significant expansion of modern observational capability in physical oceanography, it appears likely that more is yet to come. We can offer at least three reasons for such positive outlook.
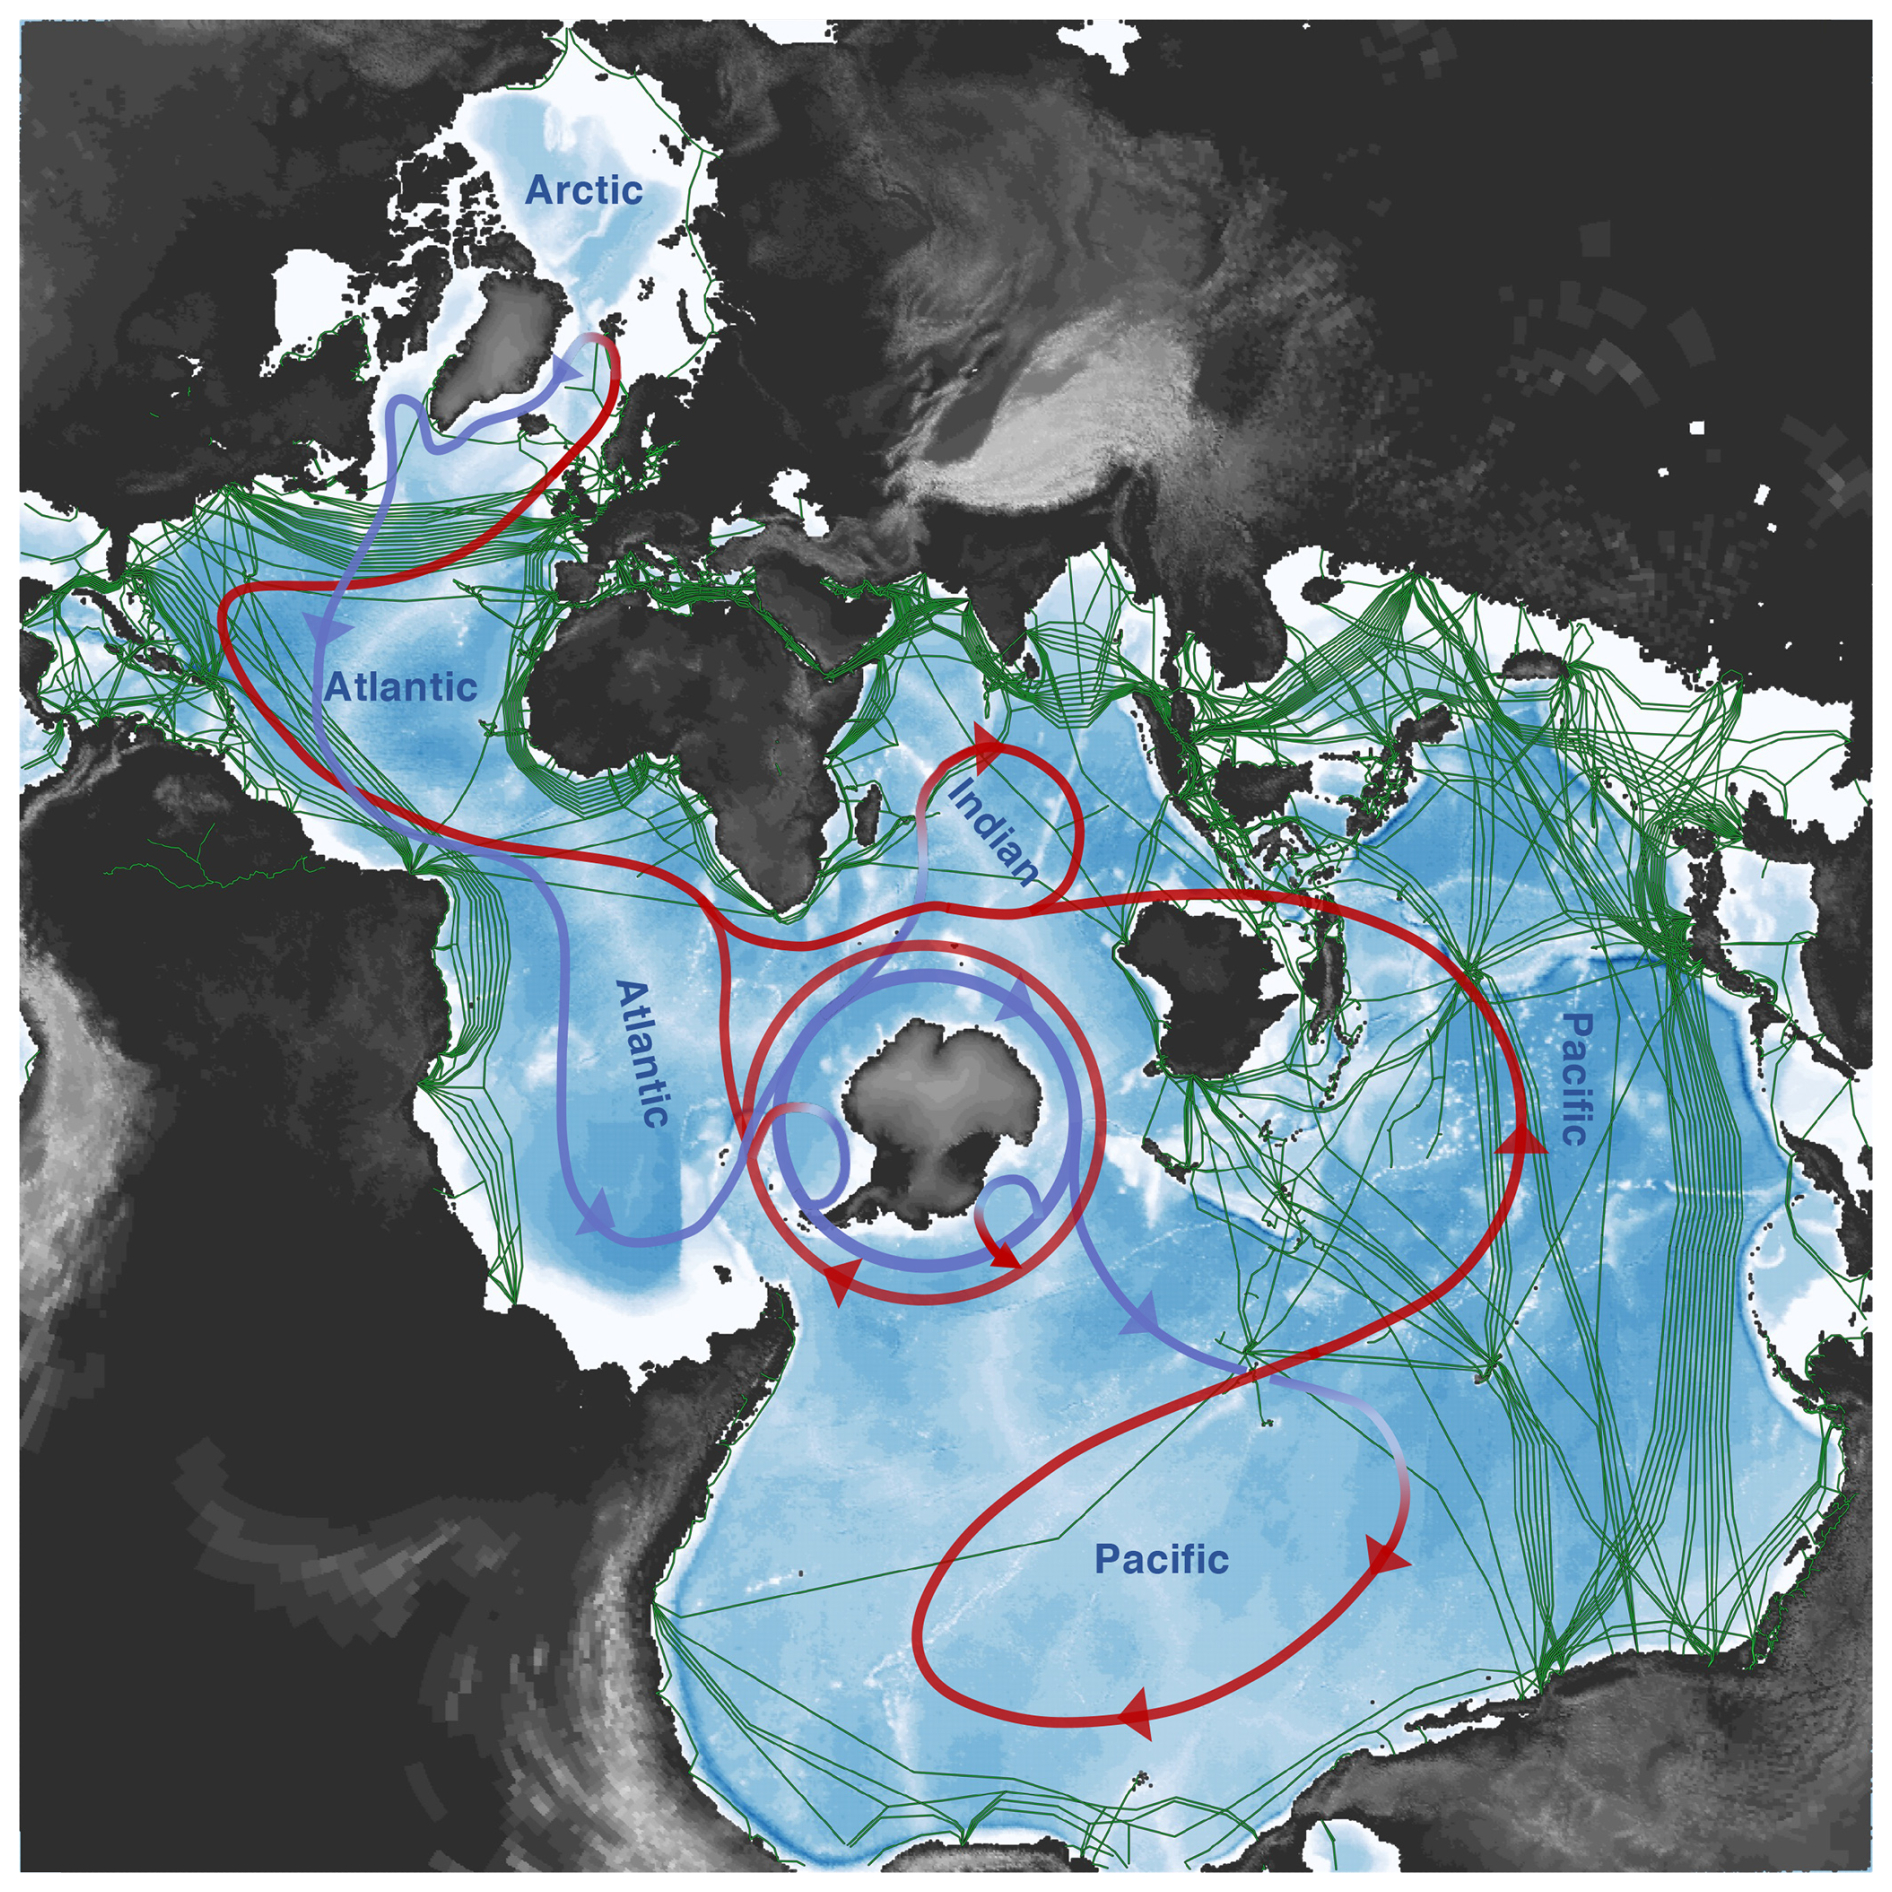
Figure 12Current global distribution of the subsea fibre optic cable network (in green; source: https://www.submarinecablemap.com, last access: June 2025), displayed in a Spilhaus square projection (Spilhaus, 1942) and including a simplified representation of the global overturning circulation (GOC; blue and red pathways respectively represent denser and lighter branches of the GOC). The subsea cables traverse many of the key GOC pathways, including those of the Atlantic Meridional Overturning Circulation.
First, the vast potential of current, field-trialled DOFS techniques is still mostly untapped. Due to the opportunistic nature of many sensing campaigns to date, much remains to be learned on the physical interpretation of DOFS observations. A range of ground-truthing initiatives are presently underway to advance interpretability, based on contrasting the outcomes of various cable configurations and data sampling and analysis approaches with measurements from established oceanographic instruments. A key challenge common to many DOFS applications is to understand the connection between the cable and the seabed, as cable burial can fundamentally shape ocean-cable interactions. It is expected that, as these initiatives bear fruit, DOFS will progressively become a focal technology in ocean monitoring and process-targeted experiments, helping to fill the high-resolution/large-domain blindspot that has long afflicted the traditional ocean observations toolbox.
Second, the breadth of emergent techniques discussed in Sect. 4 promises to significantly expand the scope of DOFS in physical oceanography, by developing the capabilities to measure salinity and acquire observations within the water column. If either or both of these possibilities are realised, DOFS may provide a solution to an even wider range of observational challenges that lie at or beyond the edge of current technological capacity. Such challenges include the measurement of extreme and hazardous oceanic environments (e.g., under ice shelves (see Sect. 3.1.3), near hydrothermal vents, or in topographic constrictions with severe turbulence), which could be observed in situ with highly resistant fibres, or remotely via ANI applied to data from cables deployed some safe distance away. Regardless of the degree of success of future technical developments, DOFS will predictably be key in enabling continuous observations across the ocean's boundaries with the atmosphere, cryosphere and solid Earth, by capitalising on the technology's proven ability to measure in each of those media (e.g., Anjana et al., 2024; Donadello et al., 2024; Kobs et al., 2014; Law et al., 2021). Continuous cross-environment observations are important for many topical issues in Earth system science – from ocean-atmosphere energy exchanges (Josey et al., 2013; Seo et al., 2023) to the melting of the Antarctic and Greenland ice sheets (Rosevear et al., 2025) – but are notoriously complex, when not impossible, to obtain with existing instrumentation.
Finally, DOFS does not just represent a novel technology to measure the ocean over a range of scales that is arguably unmatched by other approaches. It is also a technology for which extensive, global-scale infrastructure is already in place (Fig. 12). A world-wide network of seafloor-laid optical fibre cables exists that criss-crosses ocean basins over tens of thousands of kilometres, in order to support communications and data transmission between different regions of Earth (Clare et al., 2025). By coupling an interrogator to its land terminus, any cable in this network could conceivably be used for DOFS applications, without interfering with the cable's primary telecommunications purpose. This statement also applies to cables that may no longer be in use, but that remain in the ocean due to the excessive cost of recovery operations. Thus, there is considerable potential to generate a new strand of global ocean observation with multiple scientific applications at comparatively modest financial and environmental expense. We recognise, of course, that executing this vision poses several serious challenges; e.g., the gaining of access to (privately-owned) cables, the development of a regulatory framework for data acquisition, and the management of the vast volumes of data produced by DOFS. Overcoming these challenges will require a collaborative, international approach across academia, business and government, so as to generate a mutually beneficial system that includes provision of vital engineering data to cable operators and monitoring of anthropogenic noise sources. Useful lessons on the leveraging of these synergies are available from the exemplar of the SMART cables network (Howe et al., 2019a, 2022). At a time of diminishing resources for oceanography, and increasing drive toward minimising the field's environmental impact, DOFS provides an exceptional low-cost/low-carbon opportunity to both enrich and augment the Global Ocean Observing System (GOOS; Moltmann et al., 2019), plausibly extending its reach to oceanic scales and phenomena eluding current global platforms.
To elaborate on the potential role of DOFS within the GOOS, we anticipate that fibre sensing will provide highly-resolved near-bottom and deep-ocean measurements across oceanographically important areas that are beyond the reach of existing ocean observing platforms, and without reliance on expensive research vessels. The wider deployment of DOFS is especially synergistic with the SMART cable initiative, whose embedded point sensors may support calibration of fibre-sensed temperature, pressure or seismic measurements. SMART sensors include calibrated devices for directly measuring temperature (initial accuracy of 1 mK and stability of 2 mK yr−1), pressure and seismicity (via a three-axis accelerometer and seismometers) (Howe et al., 2019a, 2022). More generally, the use of co-located measurements obtained through other GOOS platforms (e.g., Argo floats and fixed moorings) or the range of cabled observatories that exist worldwide will assist in calibrating, validating and building confidence in DOFS ocean monitoring approaches. Such confidence is required to exploit DOFS observations in data-assimilative ocean models, future decision-making and early warning systems. To take the major step forward to a system readiness framework, new approaches will be required to deal with vast data volumes generated in real time, and in often unfamiliar formats to those used to receiving, managing and diseminating ocean data products. Accurately assessing confidence levels, ensuring robust signal identification and interpretation, and meaningfully transitioning rapidly-evolving DOFS research into operational systems remain major challenges for the marine science community – challenges that will only be surmountable via wide collaboration with operational response organisations and agencies, and dedicated and sustained funding. Recent examples of DOFS monitoring on land have demonstrated its efficacy in informing real-time disaster planning, with DAS signals having been used as the basis for successful early warnings and evacuation orders prior to volcanic eruptions in Iceland in 2023–2024 (Li et al., 2025a). The rapidity of transition from fundamental research to a societally-applicable warning system there provides reassurance that, while the complexities of such a transition should not be underestimated, it is within our community's reach to overcome them.
The underlying software code used in analysing the various data sets presented in this article can be accessed via the articles in which each data set was originally presented, namely:
-
Figure 3: see Lucas and Pinkel (2022).
-
Figure 4: see Wild et al. (2025).
-
Figure 5: see Gutscher et al. (2025).
-
Figure 6: see Williams et al. (2023).
-
Figure 7: see Spingys et al. (2024a, b).
-
Figure 8: see Glover et al. (2024).
-
Figure 9: see Baker and Abbott (2022) and Baker et al. (2023).
-
Figure 10: see Marra et al. (2022).
The data presented in this article can be accessed via the articles in which each data set was originally presented, namely:
-
Figure 3: see Lucas and Pinkel (2022).
-
Figure 4: see Wild et al. (2025).
-
Figure 5: see Gutscher et al. (2025).
-
Figure 6: see Williams et al. (2023).
-
Figure 7: see Spingys et al. (2024a, b).
-
Figure 8: see Glover et al. (2024).
-
Figure 9: see Baker and Abbott (2022) and Baker et al. (2023).
-
Figure 10: see Marra et al. (2022).
A. C. Naveira Garabato, C. P. Spingys and M. Belal jointly coordinated the manuscript, and led Sects. 1, 2, 3.2.3, 4.1, 4.2 and 5. The following authors were also leads of, or major contributors to, specific sections: A. Hartog (Sect. 2); A. J. Lucas (Sect. 3.1.1–3.1.2); T. S. Dotto, C. T. Wild, S. W. Tyler, T. A. Scambos and C. B. Kratt (Sects. 3.1.3, 4.1 and 4.2); G. Cappelli (Sect. 3.2); E. F. Williams and M. Claret (Sect. 3.3.1–3.3.2); H. E. Glover and M. E. Wengrove (Sect. 3.3.4); M. M. Smith and M. G. Baker (Sect. 3.3.5); G. Marra, M. Tamussino, D. Lloyd, L. Taylor, M. Mazur and M.-D. Mangriotis (Sect. 3.4); A. Micallef (Sect. 4.2); J. Ward Neale, O. A. Godin, M. H. Alford and E. P. M. Gregory (Sect. 4.3); M. A. Clare and A. Ruiz Angulo (Sect. 5). All authors provided feedback on all sections of the article.
The contact author has declared that none of the authors has any competing interests.
Publisher's note: Copernicus Publications remains neutral with regard to jurisdictional claims made in the text, published maps, institutional affiliations, or any other geographical representation in this paper. The authors bear the ultimate responsibility for providing appropriate place names. Views expressed in the text are those of the authors and do not necessarily reflect the views of the publisher.
This article is part of the special issue “Ocean Science Jubilee: reviews and perspectives”. It is not associated with a conference.
A.C.N.G. acknowledges UK Research and Innovation (UKRI) guarantee funding for a European Research Council Advanced Grant (EP/X025136/1). A.C.N.G. and M.B. further acknowledge UKRI support for grants NE/Z000408/1 and NE/Y003365/1. C.P.S., G.M., M.T., E.P.M.G., M.A.C., M-D.M. and M.B. acknowledge funding from the Advanced Research + Invention Agency (ARIA). T.S.D. was funded by the UKRI via grants NE/S006419/1 and NE/Y005589/1. M.C. was funded by the European Union (HORIZON-MSCA-2021-PF MOORING, grant agreement no. 101064423). A.M. was supported by the David and Lucile Packard Foundation. The Channel AMIGOS DTS data set in Sect. 3.1.3 is found at the USAP-DC repository (ID 601938; https://doi.org/10.15784/601938, Scambos et al., 2025b), and it is linked to the project https://www.usap-dc.org/view/project/p0010162 (last access: May 2025).
Research presented in Sect. 3.2.5 was supported by the Laboratory Directed Research and Development Program at Sandia National Laboratories. Sandia National Laboratories is a multimission laboratory managed and operated by National Technology and Engineering Solutions of Sandia, LLC, a wholly owned subsidiary of Honeywell International Inc., for the US Department of Energy's National Nuclear Security Administration under contract DE-NA0003525. This paper describes objective technical results and analysis. Any subjective views or opinions that might be expressed in the paper do not necessarily represent the views of the US Department of Energy or the United States Government.
A.L. acknowledges support from the ECHO project (https://doi.org/10.54499/2024.13655.PEX), ARDITI – Agência Regional para o Desenvolvimento da lnvestigação, Tecnologia e lnovação, the EU SUBMERSE project (GA 101095055), and FCT, I.P./MCTES through national funds (PIDDAC): LA/P/0068/2020 (https://doi.org/10.54499/LA/P/0068/2020), UID/50019/2025 (https://doi.org/10.54499/UID/50019/2025), UID/PRR2/50019/2025 (https://doi.org/10.54499/UID/PRR/50019/2025).
C. Ofelio (University of Portsmouth & International University of Valencia) provided illustration expertise in Fig. 1.
We are grateful to B. M. Howe, M.-A. Gutscher and an anonymous reviewer for their helpful feedback on an earlier version of this article.
A.C.N.G. acknowledges UK Research and Innovation (UKRI) guarantee funding for a European Research Council Advanced Grant (EP/X025136/1). A.C.N.G. and M.B. further acknowledge UKRI support for grants NE/Z000408/1 and NE/Y003365/1. C.P.S., G.M., M.T., E.P.M.G., M.A.C., M-D.M. and M.B. acknowledge funding from the Advanced Research + Invention Agency (ARIA). T.S.D. was funded by the UKRI via grants NE/S006419/1 and NE/Y005589/1. M.C. was funded by the European Union (HORIZON-MSCA-2021-PF MOORING, grant agreement no. 101064423). A.M. was supported by the David and Lucile Packard Foundation. Research presented in Sect. 3.2.5 was supported by the Laboratory Directed Research and Development Program at Sandia National Laboratories. A.L. acknowledges support from the ECHO project (https://doi.org/10.54499/2024.13655.PEX), ARDITI – Agência Regional para o Desenvolvimento da lnvestigação, Tecnologia e lnovação, the EU SUBMERSE project (GA 101095055), and FCT, I.P./MCTES through national funds (PIDDAC): LA/P/0068/2020, UID/50019/2025, UID/PRR2/50019/2025.
This paper was edited by Bernadette Sloyan, and reviewed by Bruce Howe and one anonymous referee.
Adusumilli, S., Fricker, H. A., Medley, B., Padman, L., and Siegfried, M. R.: Interannual variations in meltwater input to the Southern Ocean from Antarctic ice shelves, Nat. Geosci., 13, 616–620. https://doi.org/10.1038/s41561-020-0616-z, 2020.
Alford, M. H., Gerdt, D. W., and Adkins, C. M.: An ocean refractometer: Resolving millimeter-scale turbulent density fluctuations via the refractive index, J. Atmos. Ocean. Technol., 23, 121–137, https://doi.org/10.1175/jtech1830.1, 2006.
Alley, K. E., Wild, C. T., Luckman, A., Scambos, T. A., Truffer, M., Pettit, E. C., Muto, A., Wallin, B., Klinger, M., Sutterley, T., Child, S. F., Hulen, C., Lenaerts, J. T. M., Maclennan, M., Keenan, E., and Dunmire, D.: Two decades of dynamic change and progressive destabilization on the Thwaites Eastern Ice Shelf, The Cryosphere, 15, 5187–5203, https://doi.org/10.5194/tc-15-5187-2021, 2021.
Anjana, K., Herath, M., and Epaarachchi, J.: Optical fibre sensors for geohazard monitoring – A review, Measurement, 235, 114846, https://doi.org/10.1016/j.measurement.2024.114846, 2024.
Ardhuin, F., Stopa, J. E., Chapron, B., Collard, F., Husson, R., Jensen, R. E., Johannessen, J., Mouche, A., Passaro, M., Quartly, G. D., Swail, V. and Young, I.L Observing Sea States, Front. Mar. Sci., 6, 124, https://doi.org/10.3389/fmars.2019.00124, 2019.
Ashry, I., Mao, Y., Wang, B., Hveding, F., Bukhamsin, A., Ng, T. K., and Ooi, B. S.: A review of distributed fiber-optic sensing in the oil and gas industry, J. Lightwave Technol., 40, 1407–1431, https://doi.org/10.1109/jlt.2021.3135653, 2022.
Bado, M. F. and Casas, J. R.: A review of recent distributed optical fiber sensors applications for civil engineering structural health monitoring, Sensors, 21, 1818, https://doi.org/10.3390/s21051818, 2021.
Baker, M. G. and Abbott, R. E.: Rapid refreezing of a marginal ice zone across a seafloor distributed acoustic sensor, Geophys. Res. Lett., 49, e2022GL099880, https://doi.org/10.1029/2022GL099880, 2022.
Baker, M. G., Abbott, R. E., and O'Rourke, W. T.: The Cryosphere/Ocean Distributed Acoustic Sensing (CODAS) Experiment, Technical Report, Sandia National Laboraties (SNL-NM), Albuquerque, NM, USA, https://doi.org/10.2172/2430275, 2023.
Bakulin, A., Silvestrov, I., and Pevzner, R.: Surface seismics with DAS: An emerging alternative to modern point-sensor acquisition, Lead. Edge, 39, 808–818, https://doi.org/10.1190/tle39110808.1, 2020.
Belal, M. and Newson, T. P.: Enhanced performance of a temperature-compensated submeter spatial resolution distributed strain sensor, IEEE Photonics Technol. Lett., 22, 1705–1707, https://doi.org/10.1109/LPT.2010.2082515, 2010.
Belal, M. and Newson, T. P.: A 5 cm spatial resolution temperature compensated distributed strain sensor evaluated using a temperature controlled strain rig, Opt. Lett., 36, 4728, https://doi.org/10.1364/OL.36.004728, 2011.
Belal, M. and Newson, T. P.: Experimental examination of the variation of the spontaneous Brillouin power and frequency coefficients under the combined influence of temperature and strain, J. Light. Technol., 30, 1250–1255, https://doi.org/10.1109/JLT.2011.2169393, 2012.
Belal, M., Cho, Y. T., Ibsen, M., and Newson, T. P.: A temperature-compensated high spatial resolution distributed strain sensor, Meas. Sci. Technol., 21, 015204, https://doi.org/10.1088/0957-0233/21/1/015204, 2009.
Berger, J. and Wyatt, F.: A discussion on the measurement and interpretation of changes of strain in the Earth – Some observations of earth strain tides in California, Philos. T. R. Soc. Lond. A, 274, 267–277, https://doi.org/10.1098/rsta.1973.0052, 1973.
Bornstein, G., Biescas, B., Sallarès, V., and Mojica, J. F.: Direct temperature and salinity acoustic full waveform inversion, Geophys. Res. Lett., 40, 4344–4348, https://doi.org/10.1002/GRL.50844, 2013.
Bradley, A. T. and Hewitt, I. J.: Tipping point in ice-sheet grounding-zone melting due to ocean water intrusion, Nat. Geosci., 17, 631–637, https://doi.org/10.1038/s41561-024-01465-7, 2024.
Brown, M. G., Godin, O. A., Williams, N. J., Zabotin, N. A., Zabotina, L., and Banker, G. J.: Acoustic Green's function extraction from ambient noise in a coastal ocean environment, Geophys. Res. Lett., 41, 5555–5562. https://doi.org/10.1002/2014GL060926, 2014.
Brown, M. G., Godin, O. A., Zang, X., Ball, J. S., Zabotin, N. A., Zabotina, L. Y., and Williams, N. J.: Ocean acoustic remote sensing using ambient noise: Results from the Florida Straits, Geophys. J. Int., 206, 574–589, https://doi.org/10.1093/gji/ggw170, 2016.
Bucaro, J. A., Dardy, H. D., and Carome, E. F.: Fiber-optic hydrophone, J. Acoust. Soc. Am., 62, 1302–1304, https://doi.org/10.1121/1.381624, 1977.
Budiansky, B., Drucker, D. C., Kino, G. S., and Rice, J. R.: Pressure sensitivity of a clad optical fiber, Appl. Opt., 18, 4085–4088, https://doi.org/10.1364/AO.18.004085, 1979.
Castongia, E., Wang, H. F., Lord, N., Fratta, D., Mondanos, M., and Chalari, A.: An experimental investigation of distributed acoustic sensing (DAS) on lake ice, J. Environ. Eng. Geophys., 22, 167–176, https://doi.org/10.2113/JEEG22.2.167, 2017.
Charnock, H.: Tidal friction from currents near the seabed, Geophys. J. Int., 2, 215–221, https://doi.org/10.1111/j.1365-246X.1959.tb05794.x, 1959.
Cheng, Y., Sayde, C., Li, Q., Basara, J., Selker, J., Tanner, E., and Gentine, P.: Failure of Taylor's hypothesis in the atmospheric surface layer and its correction for eddy-covariance measurements, Geophys. Res. Lett., 44, 4287–4295, https://doi.org/10.1002/2017GL073499, 2017.
Cheng, Y., Li, Q., Argentini, S., Sayde, C., and Gentine, P.: A model for turbulence spectra in the equilibrium range of the stable atmospheric boundary layer, J. Geophys. Res., 125, e2019JD032191, https://doi.org/10.1029/2019JD032191, 2020.
Clare, M. A., Yeo, I. A., Nash, J., Hunt, J. E., Panuve, S., Wilkie, A., Williams, R., Dowey, N., Rowley, P., Barclay, J., and Phillips, J.: Volcanic eruptions and the global subsea telecommunications network, Bull. Volcanol., 87, 1–31, https://doi.org/10.1007/s00445-025-01832-1, 2025.
Claret, M., Ugalde, A., Winters, K., Vladoiu, A., Williams, E., Salvador, J., Hoareau, N., Martins, H., Latorre, H., Vidal-Moreno, P. J., González-Herráez, M., and Pelegrí, J. L.: Constraining fiber-optic cable observations of internal waves with conventional oceanographic measurements, EGU General Assembly 2024, Vienna, Austria, 14–19 Apr 2024, EGU24-15421, https://doi.org/10.5194/egusphere-egu24-15421, 2024.
Colladon, J.-D.: On the reflections of a ray of light inside a parabolic liquid stream, Compt. Rend., 15, 800, 1842.
Connolly, T. P. and Kirincich, A. R.: High-resolution observations of subsurface fronts and alongshore bottom temperature variability over the inner shelf, J. Geophys. Res., 124, 593–614, https://doi.org/10.1029/2018JC014454, 2019.
Copernicus Marine Service: Product: SST_GLO_SST_L3S_NRT_OBSERVATIONS_010_010, Data: IFREMER-GLOB-SST-L3-NRT-OBS_FULL_TIME_SERIE, https://marine.copernicus.eu (last access: October 2025), 2024.
Corrsin, S.: On the Spectrum of Isotropic Temperature Fluctuations in an Isotropic Turbulence, J. Appl. Phys., 22, 469–473, https://doi.org/10.1063/1.1699986, 1951.
Cranch, G. A., Crickmore, R., Kirkendall, C. K., Bautista, A., Daley, K., Motley, S., Salzano, J., Latchem, J., and Nash, P. J.: Acoustic performance of a large-aperture, seabed, fiber-optic hydrophone array, J. Acoust. Soc. Am., 115, 2848–2858, https://doi.org/10.1121/1.1710504, 2004.
Daley, T. M., Freifeld, B. M., Ajo-Franklin, J., Dou, S., Pevzner, R., Shulakova, V., Kashikar, S., Miller, D. E., Goetz, J., Henninges, J., and Lueth, S.: Field testing of fiber-optic distributed acoustic sensing (DAS) for subsurface seismic monitoring, Lead. Edge, 32, 699–706, https://doi.org/10.1190/TLE32060699.1, 2013.
Davis, K. A., Arthur, R. S., Reid, E. C., Rogers, J. S., Fringer, O. B., DeCarlo, T. M., and Cohen, A. L.: Fate of internal waves on a shallow shelf, J. Geophys. Res., 125, e2019JC015377, https://doi.org/10.1029/2019JC015377, 2020.
Davis, P. E., Nicholls, K. W., Holland, D. M., Schmidt, B. E., Washam, P., Riverman, K. L., Arthern, R. J., Vaňková, I., Eayrs, C., Smith, J. A., Anker, P. G., Mullen, A. D., Dichek, D., Lawrence, J. D., Meister, M. M., Clyne, E., Basinski-Ferris, A., Rignot, E., Queste, B. Y., Boehme, L., Heywood, K. J., Anandakrishnan, S., and Makinson, K.: Suppressed basal melting in the eastern Thwaites Glacier grounding zone, Nature, 614, 7948, https://doi.org/10.1038/s41586-022-05586-0, 2023.
Dean, R. G. and Dalrymple, R. A.: Water Wave Mechanics for Engineers and Scientists, Prentice-Hall, Englewood Cliffs, NJ, ISBN 9814365696, 9789814365697, 1984.
Dean, T., Cuny, T., and Hartog, A. H.: The effect of gauge length on axially incident P-waves measured using fibre optic distributed vibration sensing, Geophys. Prospect., 65, 184–193, https://doi.org/10.1111/1365-2478.12419, 2017.
de Lavergne, C., Madec, G., Le Sommer, J., Nurser, A. J. G., and Naveira Garabato, A. C.: On the consumption of Antarctic Bottom Water in the abyssal ocean, J. Phys. Oceanogr., 46, 635–661, https://doi.org/10.1175/JPO-D-14-0201.1, 2016.
Desurvire, E., Simpson, J. R., and Becker, P. C.: High-gain erbium-doped traveling-wave fiber amplifier, Opt. Lett., 12, 888–890, https://doi.org/10.1364/ol.12.000888, 1987.
Dexheimer, D., Airey, M., Roesler, E., Longbottom, C., Nicoll, K., Kneifel, S., Mei, F., Harrison, R. G., Marlton, G., and Williams, P. D.: Evaluation of ARM tethered-balloon system instrumentation for supercooled liquid water and distributed temperature sensing in mixed-phase Arctic clouds, Atmos. Meas. Tech., 12, 6845–6864, https://doi.org/10.5194/amt-12-6845-2019, 2019.
Dickinson, A. and Gunn, K. L.: The next decade of seismic oceanography: Possibilities, challenges and solutions, Front. Mar. Sci., 9, 504, https://doi.org/10.3389/FMARS.2022.736693, 2022.
Donadello, S., Clivati, C., Govoni, A., Margheriti, L., Vassallo, M., Brenda, D., Hovsepyan, M., Bertacco, E., Concas, R., Levi, F., Mura, A., Herrero, A., Carpentieri, F., and Calonico, D.: Seismic monitoring using the telecom fiber network, Commun. Earth Environ., 5, 178, https://doi.org/10.1038/s43247-024-01338-2, 2024.
Dotto, T. S., Heywood, K. J., Hall, R. A., Scambos, T. A., Zheng, Y., Nakayama, Y., Hyogo, S., Snow, T., Wåhlin, A. K., Wild, C., Truffer, M., Muto, A., Alley, K. E., Boehme, L., Bortolotto, G. A., Tyler, S. W., and Pettit, E.: Ocean variability beneath Thwaites Eastern Ice Shelf driven by the Pine Island Bay Gyre strength, Nat. Commun., 13, 7840, https://doi.org/10.1038/s41467-022-35499-5, 2022.
Drake, S., Higgins, C., and Pardyjak, E.: Distinguishing Time Scales of Katabatic Flow in Complex Terrain, Atmosphere, 12, 1651, https://doi.org/10.3390/atmos12121651, 2021.
Dushaw, B. D., Worcester, P. F., Munk, W. H., Spindel, R. C., Mercer, J. A., Howe, B. M., Metzger Jr., K., Birdsall, T. G., Andrew, R. K., Dzieciuch, M. A., and Cornuelle, B. D.: A decade of acoustic thermometry in the North Pacific Ocean, J. Geophys. Res., 114, C07021, https://doi.org/10.1029/2008JC005124, 2009.
Eaton, P. and West, P.: Atomic Force Microscopy, Oxford Academic, https://doi.org/10.1093/acprof:oso/9780199570454.001.0001, 2010.
Eickhoff, W. and Ulrich, R.: Optical frequency domain reflectometry in single-mode fiber, Appl. Phys. Lett., 39, 693–695, https://doi.org/10.1063/1.92872, 1981.
Fakhruzi, I., Titos, M., Benítez, C., and García, L.: Urban traffic monitoring through Distributed Acoustic Sensing: Trial analysis of a potent monitoring tool, Measurement, 253, 117668, https://doi.org/10.1016/j.measurement.2025.117668, 2025.
Fernández-Ruiz, M. R., Soto, M. A., Williams, E. F., Martín-López, S., Zhan, Z., González-Herraez, M., and Martins, H. F.: Distributed acoustic sensing for seismic activity monitoring, APL Photonics, 5, 3, https://doi.org/10.1063/1.5139602, 2020.
Ferrari, R., Mashayek, A., McDougall, T. J., Nikurashin, M., and Campin, J.-M.: Turning ocean mixing upside down, J. Phys. Oceanogr., 46, 2239–2261, https://doi.org/10.1175/JPO-D-15-0244.1, 2016.
Fetterer, F., Savoie, M., Helfrich, S., Clemente-Colón, P., and U.S. National Ice Center and National Snow and Ice Data Center: Multisensor analyzed sea-ice extent Northern Hemisphere (MASIE-NH), version 1, National Snow and Ice Data Center [data set], https://doi.org/10.7265/N5GT5K3K, 2010.
Fletcher, B., Bowen, A., Yoerger, D. R., and Whitcomb, L. L.: Journey to the Challenger Deep: 50 years later with the Nereus hybrid remotely operated vehicle, Mar. Technol. Soc. J., 43, 65–76, https://doi.org/10.4031/MTSJ.43.5.26, 2009.
Fox-Kemper, B., Adcroft, A., Böning, C. W., Chassignet, E. P., Curchitser, E., Danabasoglu, G., Eden, C., England, M. H., Gerdes, R., Greatbatch, R. J., Griffies, S. M., Hallberg, R. W., Hanert, E., Heimbach, P., Hewitt, H. T., Hill, C. N., Komuro, Y., Legg, S., Le Sommer, J., Masina, S., Marsland, S. J., Penny, S. G., Qiao, F., Ringler, T. D., Treguier, A. M., Tsujino, H., Uotila, P., and Yeager, S. G.: Challenges and prospects in ocean circulation models, Front. Mar. Sci., 6, https://doi.org/10.3389/fmars.2019.00065, 2019.
Garrett, C. and Munk, W.: Space-time scales of internal waves, Geophys. Fluid Dyn., 3, 225–264, https://doi.org/10.1080/03091927208236082, 1972.
Gemba, K. L., Durofchalk, N. C., Dall'Osto, D. R., Andrew, R. K., Leary, P., Howe, B. M., and Smith, K. B.: Basin scale coherence of Kauai-Beacon m-sequence transmissions received at Wake Island and Monterey, CA, JASA Express Lett., 3, 08080.1, https://doi.org/10.1121/10.0020514, 2023.
Giallorenzi, T. G., Bucaro, J. A., Dandridge, A., Siegel Jr., G. H., Cole, J. H., Rashleigh, S. C., and Priest, R. G.: Optical fiber sensor technology, IEEE J. Quantum Electron., 18, 626–665, https://doi.org/10.1109/TMTT.1982.1131089, 1982.
Glover, H. E., Wengrove, M. E., and Holman, R.: Measuring hydrodynamics and exploring nearshore processes using distributed sensing of fiber-optic cable strain, Coast. Eng., 190, 104487, https://doi.org/10.1016/j.coastaleng.2024.104487, 2024.
Glover, H. E., Smith, M. M., Wengrove, M. E., Williams, E. F., Thomson, J., Ifju, M., and Lipovsky, B. P.: Comparisons of Seafloor Distributed Fiber-Optic Sensing Datasets and Empirical Calibrations for Inferring Ocean Surface Gravity Waves, J. Atmos. Ocean. Tech., 43, 289–307, https://doi.org/10.1175/JTECH-D-24-0112.1, 2026.
Godin, O. A.: Recovering the acoustic Green's function from ambient noise cross correlation in an inhomogeneous moving medium, Phys. Rev. Lett., 97, 054301, https://doi.org/10.1103/PhysRevLett.97.054301, 2006.
Godin, O. A.: Acoustic noise interferometry in a time-dependent coastal oceana, J. Acoust. Soc. Am., 143, 595–604, https://doi.org/10.1121/1.5022287, 2018.
Godin, O. A. and Chapman, D. M.: Shear-speed gradients and ocean seismo-acoustic noise resonances, J. Acoust. Soc. Am., 106, 2367–2382, https://doi.org/10.1121/1.428074, 1999.
Godin, O. A., Zabotin, N. A., and Goncharov, V. V.: Ocean tomography with acoustic daylight, Geophys. Res. Lett., 37, L13605, https://doi.org/10.1029/2010GL043623, 2010.
Godin, O. A., Brown, M. G., Zabotin, N. A., Zabotina, L. Y., and Williams, N. J.: Passive acoustic measurement of flow velocity in the Straits of Florida, Geosci. Lett., 1, 16, https://doi.org/10.1186/s40562-014-0016-6, 2014.
Godin, O. A., Katsnelson, B. J., Qin, J., Brown, M. G., Zabotin, N. A., and Zang, X.: Application of time reversal to passive acoustic remote sensing of the ocean, Acoust. Phys., 63, 309–320, https://doi.org/10.1134/S1063771017020038, 2017.
Goetz, J. D., Kalnajs, L. E., Deshler, T., Davis, S. M., Bramberger, M., and Alexander, M. J.: A fiber-optic distributed temperature sensor for continuous in situ profiling up to 2 km beneath constant-altitude scientific balloons, Atmos. Meas. Tech., 16, 791–807, https://doi.org/10.5194/amt-16-791-2023, 2023.
Goncharov, V. V., Shurup, A. S., Godin, O. A., Zabotin, N. A., Vedenev, A. I., Sergeev, S. N., Brown, M. G., and Shatravin, A. V.: Tomographic inversion of measured cross-correlation functions of ocean noise in shallow water using ray theory, Acoust. Phys., 62, 436–446, https://doi.org/10.1134/S1063771016040072, 2016.
Gould, G.: The LASER, light amplification by stimulated emission of radiation, The Ann Arbor Conference on Optical Pumping, University of Michigan, 15, 128, 1959.
Gräff, D., Lipovsky, B. P., Vieli, A., Dachauer, A., Jackson, R., Farinotti, D., Schmale, J., Ampuero, J.-P., Berg, E., Dannowski, A., Kneib-Walter, A., Köpfli, M., Kopp, H., van der Loo, E., Mata Flores, D., Mercerat, D., Moser, R., Sladen, A., Walter, F., Wasser, D., Welty, E., Wetter, S., and Williams, E. F.: Calving-driven fjord dynamics resolved by seafloor fibre sensing, Nature, 644, 404–412, https://doi.org/10.1038/s41586-025-09347-7, 2025.
Growe, K., Thiem, L., Landrø, M., and Raknes, E. B.: Determination of marine fibre-optic cable position and acquisition time-shift using direct wave travel time inversion, Geophys. J. Int., 243, https://doi.org/10.1093/gji/ggaf301, 2025.
Gutscher, M.-A., Cappelli, G., Quetel, L., Philippon, M., Lebrun, J.-F., Nativelle, C., Vitalis-Simon, S., and Autret, E.: Monitoring long-term seafloor water temperature changes using fiber optic sensing on submarine telecommunication cables, Geophys. Res. Lett., 52, e2025GL119348, https://doi.org/10.1029/2025GL119348, 2025.
Hadjiloucas, S., Keating, D. A., Usher, M. J., Michie, W. C., Culshaw, B., Konstantaki, M., Graham, N. B., and Moran, C. R.: Hydrogel based distributed fibre optic sensor for measuring soil salinity and soil water potentials, IEE Colloquium on Progress in Fibre Optic Sensors and Their Applications, https://doi.org/10.1049/ic:19951217, 1995.
Hamilton, E. L.: Vp/Vs and Poisson's ratios in marine sediments and rocks: J. Acoust. Soc. Am., 66, 1093–1101, https://doi.org/10.1121/1.383344, 1979.
Hansen, B., Joensen, H. P., and Michelsen, V. E.: Bottom temperature between Iceland and Shetland 1906–1962 measured in telegraph cables, ICES Paper CM, 5, 1994/S, ICES, https://www.pure.fo/en/publications/bottom-temperature-between-iceland-and-shetland-1906-1962-measure/ (last access: May 2025), 1994.
Harmon, N., Belal, M., Mangriotis, M.-D., Spingys, C., and Rychert, C. A.: Distributed Acoustic Sensing along a shallow water energy cable, IEEE J. Ocean. Eng., 50, 1772–1781, https://doi.org/10.1109/JOE.2024.3523363, 2025.
Hartog, A. H.: An introduction to Distributed Optical Fibre Sensors, CRC Press, Boca Ratón), https://doi.org/10.1201/9781315119014, 2017.
Hausner, B., Suárez, F., Glander, K. E., van de Giesen, N., Selker, J. S., and Tyler, S. W.: Calibrating single-ended fiber-optic Raman spectra distributed temperature sensing data, Sensors, 11, 10859–10879, https://doi.org/10.3390/s111110859, 2011.
Hilgersom, K., van Emmerik, T., Solcerova, A., Berghuijs, W., Selker, J., and van de Giesen, N.: Practical considerations for enhanced-resolution coil-wrapped distributed temperature sensing, Geosci. Instrum. Method. Data Syst., 5, 151–162, https://doi.org/10.5194/gi-5-151-2016, 2016.
Hillerkuss, D., Schmogrow, R., Schellinger, T., Jordan, M., Winter, M., Huber, G., Vallaitis, T., Bonk, R., Kleinow, P., Frey, F., Roeger, M., Koenig, S., Ludwig, A., Marculescu, A., Li, J., Hoh, M., Dreschmann, M., Meyer, J., Ben Ezra, S., Narkiss, N., Nebendahl, B., Parmigiani, F., Petropoulos, P., Resan, B., Oehler, A., Weingarten, K., Ellermeyer, T., Lutz, J., Moeller, M., Huebner, M., Becker, J., Koos, C., Freude, W., and Leuthold, J.: 26 Tbit s−1 line-rate super-channel transmission utilizing all-optical fast Fourier transform processing, Nat. Geosci., 5, 364–371, https://doi.org/10.1038/nphoton.2011.74, 2011.
Hocker, G. B.: Fiber-optic sensing of pressure and temperature, Appl. Opt., 18, 1445–1448, https://doi.org/10.1364/AO.18.001445, 1979.
Holman, R. and Haller, M. C.: Remote sensing of the nearshore, Annu. Rev. Mar. Sci., 5, 95–113, https://doi.org/10.1146/annurev-marine-121211-172408, 2013.
Holman, R., Glover, H., Wengrove, M., Ifju, M., Honegger, D., and Haller, M.: Geolocation of distributed acoustic sampling channels using X-band radar and optical remote sensing, Remote Sens., 17, 3142, https://doi.org/10.3390/rs17183142, 2025.
Hotate, K.: Brillouin optical correlation-domain technologies based on synthesis of optical coherence function as fiber optic nerve systems for structural health monitoring, Appl. Sci., 9, 187, https://doi.org/10.3390/app9010187, 2019.
Howe, B. M., Arbic, B. K., Aucan, J., Barnes, C. R., Bayliff, N., Becker, N., Butler, R., Doyle, L., Elipot, S., Johnson, G. C., Landerer, F., Lentz, S., Luther, D. S., Müller, M., Mariano, J., Panayotou, K., Rowe, C., Ota, H., Song, Y. T., Thomas, M., Thomas, P. N., Thompson, P., Tilmann, F., Weber, T., and Weinstein, S: SMART cables for observing the global ocean: Science and implementation, Front. Mar. Sci., 6, 424, https://doi.org/10.3389/fmars.2019.00424, 2019a.
Howe, B. M., Miksis-Olds, J., Rehm, E., Sagen, H., Worcester, P. F., and Haralabus, G.: Observing the oceans acoustically, Front. Mar. Sci., 6, 426, https://doi.org/10.3389/fmars.2019.00426, 2019b.
Howe, B., Angove, M., Aucan, J., Barnes, C. R., Barros, J. R., Bayliff, N., Becker, N. C., Carrilho, F., Fouch, M. J., Fry, B., Jamelot, A., Janiszewski, H., Kong, L. S. L., Lentz, S., Luther, D. S., Marinaro, G., Matias, L. M., Rowe, C. A., Sakya, A. E., Salaree, A., Thiele, T., Tilmann, F. J., von Hillebrandt-Andrade, C., Wallace, L., Weinstein, S., and Wilcock, W.: SMART subsea cables for observing the Earth and ocean, mitigating environmental hazards, and supporting the blue economy, Front. Earth Sci., 9, https://doi.org/10.3389/feart.2021.775544, 2022.
Hubbard, P. G., Vantassel, J. P., Cox, B. R., Rector, J. W., Yust, M. B. S., and Soga, K.: Quantifying the surface strain field induced by active sources with Distributed Acoustic Sensing: Theory and practice, Sensors, 22, 4589, https://doi.org/10.3390/s22124589, 2022.
Ide, S., Araki, E., and Matsumoto, H.: Very broadband strain-rate measurements along a submarine fiber-optic cable off Cape Muroto, Nankai subduction zone, Japan, EPS, 73, 1–10, https://doi.org/10.1186/s40623-021-01385-5, 2021.
Ifju, M.: Using Distributed Acoustic Sensing to Investigate Wave Group Amplitude and Velocity Modulation across the Oregon Continental Shelf, Oregon State University, https://ir.library.oregonstate.edu/concern/graduate_thesis_or_ dissertations/n8710118q (last access: January 2025), 2025.
Ip, E., Pak Tao Lau, A., Barros, D. J. F., and Kahn, J.: Coherent detection in optical fiber systems, Opt. Express, 16, 753–791, https://doi.org/10.1364/OE.16.000753, 2008.
Jaaskelainen, M.: Fiber optic distributed sensing applications in defense, security and energy, Proceedings of SPIE – The International Society for Optical Engineering, 7316, https://doi.org/10.1117/12.820327, 2009.
Josey, S. A., Gulev, S., and Yu, L.: Exchanges through the ocean surface, Int. Geophys., 103, 115–140, https://doi.org/10.1016/B978-0-12-391851-2.00005-2, 2013.
Kao, K. C. and Hockham, G. A.: Dielectric-fibre surface waveguides for optical frequencies, Proceedings of the Institution of Electrical Engineers, 113, https://doi.org/10.1049/piee.1966.0189, 1966.
Kawaguchi, K., Kaneda, Y., and Araki, E.: The DONET: A real-time seafloor research infrastructure for the precise earthquake and tsunami monitoring, in: OCEANS 2008-MTS/IEEE Kobe Techno-Ocean, IEEE, 1–4, https://doi.org/10.1109/OCEANSKOBE.2008.4530918, 2008.
Keck, D. B., Maurer, R. D., and Schultz, P. C.: On the ultimate lower limit of attenuation in glass optical waveguides, Appl. Phys. Lett., 22, 307–309, https://doi.org/10.1063/1.1654649, 1973.
Klymak, J. M. and Moum, J. N.: Oceanic isopycnal slope spectra. Part II: Turbulence, J. Phys. Oceanogr., 37, 1232–1245, https://doi.org/10.1175/JPO3074.1, 2007.
Kobs, S., Holland, D. M., Zagorodnov, V., Stern, A., and Tyler S. W.: Novel monitoring of Antarctic ice shelf basal melting using a fiber-optic distributed temperature sensing mooring, Geophys. Res. Lett., 41, 6779–6786, https://doi.org/10.1002/2014GL061155, 2014.
Kuvshinov, B. N.: Interaction of helically wound fibre-optic cables with plane seismic waves, Geophys. Prospect., 64, 671–688, https://doi.org/10.1111/1365-2478.1230, 2016.
Landrø, M., Bouffaut, L., Kriesell, H. J., Potter, J. R., Rørstadbotnen, R. A., Taweesintananon, K., Johansen, S. E., Brenne, J. K., Haukanes, A., Schjelderup, O., and Storvik, F.: Sensing whales, storms, ships and earthquakes using an Arctic fibre optic cable, Sci. Rep., 12, 19226, https://doi.org/10.1038/s41598-022-23606-x, 2022.
Larose, E., Margerin, L., Derode, A., van Tiggelen, B., Campillo, M., Shapiro, N., Paul, A., Stehly, L., and Tanter, M.: Correlation of random wavefields: An interdisciplinary review, Geophysics, 71, SI11–SI21, https://doi.org/10.1190/1.2213356, 2006.
Larsen, J. C. and Sanford, T. B.: Florida Current volume transports from voltage measurements, Science, 227, 302–304, https://doi.org/10.1126/science.227.4684.302, 1985.
Law, R., Christoffersen, P., Hubbard, B., Doyle, S. H., Chudley, T. R., Schoonman, C. M., Bougamont, M., des Tombe, B., Schilperoort, B., Kechavarzi, C., Booth, A., and Young, T. J.: Thermodynamics of a fast-moving Greenlandic outlet glacier revealed by fiber-optic distributed temperature sensing, Sci. Adv., 7, https://doi.org/10.1126/sciadv.abe7136, 2021.
Li, F., Wang, K., Yang, X., Zhang, B., and Zhang, Y.: Passive ocean acoustic thermometry with machine learning, Appl. Acoust., 181, 108167, https://doi.org/10.1016/j.apacoust.2021.108167, 2021. Li, Y., Karrenbach, M., and Ajo-Franklin, J. B. (Eds.): Distributed Acoustic Sensing in Geophysics: Methods and Applications, Geophysical Monograph Series, American Geophysical Union, https://doi.org/10.1002/9781119521808, 2021.
Li, G., Wang, Y., Shi, A., Liu, Y., and Li, F.: Review of seawater fiber optic salinity sensors based on the refractive index detection principle, Sensors, 23, 2187, https://doi.org/10.3390/s23042187, 2023.
Li, J., Biondi, E., Heimisson, E. R., Puel, S., Zhai, Q., Zhang, S., Hjörleifsdóttir, V., Wei, X., Bird, E., Klesh, A., and Kamalov, V.: Minute-scale dynamics of recurrent dike intrusions in Iceland with fiber-optic geodesy, Science, 388, 1189–1193, https://doi.org/10.1126/science.adu02, 2025a.
Li, J., Zhang, F., Li, L., Cao, K., and Zhang, M.: Overcoming the longstanding challenge of long-range Raman Distributed Optical Fiber Sensing through Golay-encoded autocorrelation and waveform reconstruction, Nature Portfolio [preprint], https://doi.org/10.21203/rs.3.rs-6664562/v1, 2025b.
Liang, H., Wang, J., Zhang, L., Liu, J., and Wang, S.: Review of optical fiber sensors for temperature, salinity, and pressure sensing and measurement in seawater, Sensors, 22, 5363, https://doi.org/10.3390/s22145363, 2022.
Lin, J., Fang, S., He, R., Tang, Q., Qu, F., Wang, B., and Xu, W.: Monitoring ocean currents during the passage of Typhoon Muifa using optical-fiber distributed acoustic sensing, Nat. Commun., 15, 1111, https://doi.org/10.1038/s41467-024-45412-x, 2024.
Lin, J., Wang, Q., Zhang, W., Shu, J., Zhang, L. and Tang, Q.: Estimation of submarine cable location using optical-fiber distributed acoustic sensing combined with ship-borne sound sources, J. Lightwave Technol., 43, 8917–8926, https://doi.org/10.1109/JLT.2025.3588069, 2025.
Liu, M., Costa, L., Mertz, P., Varughese, S., Edirisinghe, S., Kamalov, V., and Zhan, Z.: Trans-oceanic distributed sensing of tides over telecommunication cable between Portugal and Brazil, Geophys. Res. Lett., 52, e2024gl114414, https://doi.org/10.1029/2024GL114414, 2025a.
Liu, J., Li, H., Noh, H. Y., Santi, P., Biondi, B., and Ratti, C.: Urban sensing using existing fiber-optic networks, Nat. Commun., 16, 3091, https://doi.org/10.1038/s41467-025-57997-y, 2025b.
Loureiro, A., Schlaphorst, D., Matias, L., Pereira, A., Corela, C., Gonçalves, S., and Caldeira, R.: First DAS observations from the GeoLab fibre in Madeira, Portugal, Seismica, 4, 2, https://doi.org/10.26443/seismica.v4i2.1482, 2025.
Lu, B., Gu, J., Wang, Z., Ye, L., Liu, Y., and Yang, J.: Ultra-low-noise MIMO distributed acoustic sensor using few-mode optical fibers, J. Light. Technol., 40, https:/doi.org/10.1109/jlt.2022.3144191, 2022.
Lucas, A. J. and Pinkel, R.: Observations of coherent transverse wakes in shoaling nonlinear internal waves, J. Phys. Oceanogr., 52, 1277–1293, https://doi.org/10.1175/JPO-D-21-0059.1, 2022.
Manning, C. G.: Technology Readiness Levels, https://www.nasa.gov/directorates/somd/space-communications-navigation-program/technology-readiness-levels/ (last access: January 2026), 2023.
Marra, G., Clivati, C., Luckett, R., Tampellini, A., Kronjäger, J., Wright, L., Mura, A., Levi, F., Robinson, S., Xuereb, A., Baptie, B., and Calonico, D.: Ultrastable laser interferometry for earthquake detection with terrestrial and submarine cables, Science, 361, 486–490, https://doi.org/10.1126/science.aat4458, 2018.
Marra, G., Fairweather, D. M., Kamalov, V., Gaynor, P., Cantono, M., Mulholland, S., Baptie, B., Castellanos, J. C., Vagenas, G., Gaudron, J. O., Kronjäger, J., Hill, I. R., Schioppo, M., Barbeito Edreira, I., Burrows, K. A., Clivati, C., Calonico, D., and Curtis A.: Optical interferometry-based array of seafloor environmental sensors using a transoceanic submarine cable, Science, 376, 874–879, https://doi.org/10.1126/science.abo193, 2022.
Mata Flores, D., Sladen, A., Ampuero, J.-P., Mercerat, E. D., and Rivet, D.: Monitoring deep sea currents with seafloor distributed acoustic sensing, Earth Space Sci., 10, e2022EA002723, https://doi.org/10.1029/2022EA002723, 2023.
Matsumoto, H., Araki, E., Kimura, T., Fujie, G., Shiraishi, K., Tonegawa, T., Obana, K., Arai, R., Kaiho, Y., Nakamura, Y., Yokobiki, T., Kodaira, S., Takahashi, N., Ellwood, R., Yartsev, V., and Karrenbach, M.: Detection of hydroacoustic signals on a fiber-optic submarine cable, Sci. Rep., 11, 1–12, https://doi.org/10.1038/S41598-021-82093-8, 2021.
Mazur, M., Fontaine, N. K., Kelleher, M. L., Kamalov, V., Ryf, R., Dallachiesa, L., Chen, H., Neilson, D., and Quinlan, F.: Advanced distributed submarine cable monitoring and environmental sensing using constant power probe signals and coherent detection, arXiv, https://doi.org/10.48550/arXiv.2303.06528, 2023.
Mazur, M., Fontaine, N. K., Ryf, R., Pilgrim, P., Chodkiewicz, T., Sosa, G., Carter, S. D., Jasso, S. V., Naik, J., Padmaraju, K., Mistry, A., Winter, D., Dallachiesa, L., Chen, H., and Neilson, D. T.: Real-time in-line coherent distributed sensing over a legacy submarine cable, in: Optical Fiber Communication Conference (OFC) 2024, Technical Digest Series (Optica Publishing Group, 2024), paper Th4B.8, https://doi.org/10.1364/OFC.2024.Th4B.8, 2024.
Mazur, M., Fontaine, N. K., Ryf, R., Karrenbach, M., McLaughlin, K., Sperry, B., Butler, A., Kamalov, V., Dallachiesa, L., Burrows, E., Winter, D., Chen, H., Naik, J., Padmaraju, K., Mistry, A., and Neilson, D.: Submarine cable deep-ocean observation of mega-thrust earthquake and tsunami with 44,000 100-m spaced sensors, 2025 European Conference on Optical Communications (ECOC), Copenhagen, Denmark, 2025, 1–4, https://doi.org/10.1109/ECOC66593.2025.11263003, 2025.
Mears, R. J., Reekie, L., Jauncey, I. M., and Payne, D. N.: Low-noise erbium-doped fibre amplifier operating at 1.54 μm, Electron. Lett., 23, https://doi.org/10.1049/el:19870719, 1987.
Meng, Z., Chen, W., Wang, J., Hu, X., Chen, M., and Zhang, Y.: Recent progress in fiber-optic hydrophones, Photonic Sens., 11, 109–122, https://doi.org/10.1007/s13320-021-0618-5, 2021.
Meulé, S., Peláez-Quiñones, J., Bouchette, F., Sladen, A., Ponte, A., Maier, A., Lior, I., and Coyle, P.: Reconstruction of nearshore surface gravity wave heights from Distributed Acoustic Sensing data, ESS, 11, https://doi.org/10.1029/2024EA003589, 2024.
Mikhalevsky, P. N. and Gavrilov, A. N.: Acoustic thermometry in the Arctic Ocean, Polar Res., 20, 185–192, https://doi.org/10.3402/polar.v20i2.6516, 2001.
Miya, T., Terunuma, Y., Hosaka, T., and Miyashita, T.: Ultimate low-loss single-mode fibre at 1.55 μm, Electron. Lett., 15, https://doi.org/10.1049/el:19790077, 1979.
Moltmann, T., Turton, J., Zhang, H. M., Nolan, G., Gouldman, C., Griesbauer, L., Willis, Z., Piniella, Á. M., Barrell, S., Andersson, E., and Gallage, C.: A global ocean observing system (GOOS), delivered through enhanced collaboration across regions, communities, and new technologies, Front. Mar. Sci., 6, 291, https://doi.org/10.3389/fmars.2019.00291, 2019.
Morrison, T., Calaf, M., Higgins, C. W., Drake, S. A., Perelet, A., and Pardyjak, E.: The impact of surface temperature Heterogeneity on near-surface heat transport, Bound. Layer Meteorol., 180, 247–272, https://doi.org/10.1007/s10546-021-00624-2, 2021.
Moum, J. N.: Variations in ocean mixing from seconds to years, Annu. Rev. Mar. Sci., 13, 201–226, https://doi.org/10.1146/annurev-marine-031920-122846, 2021.
Munk, W. H., Worcester, P., and Wunsch, C.: Ocean acoustic tomography, in: Cambridge Monographs on Mechanics, Cambridge University Press, https://doi.org/10.1017/CBO9780511666926, 1995.
Naveira Garabato, A. C., Yu, X., Callies, J., Barkan, R., Polzin, K. L., Frajka-Williams, E. E., Buckingham, C. E., and Griffies, S. M.: Kinetic energy transfers between mesoscale and submesoscale motions in the open ocean's upper layers, J. Phys. Oceanogr., 52, 75–97, https://doi.org/10.1175/JPO-D-21-0099.1, 2022.
Naughten, K. A., Holland, P. R., and De Rydt, J.: Unavoidable future increase in West Antarctic ice-shelf melting over the twenty-first century, Nat. Clim. Change., 13, 1222–1228, https://doi.org/10.1038/s41558-023-01818-x, 2023.
Osório, J. H., Chesini, G., Serrão, V. A., Franco, M. A. R., and Cordeiro, C. M. B.: Simplifying the design of microstructured optical fibre pressure sensors, Sci. Rep., 7, 2990, https://doi.org/10.1038/s41598-017-03206-w, 2017.
Papenberg, C., Klaeschen, D., Krahmann, G., and Hobbs, R. W.: Ocean temperature and salinity inverted from combined hydrographic and seismic data, Geophys. Res. Lett., 37, https://doi.org/10.1029/2009GL042115, 2010.
Peláez Quiñones, J. D., Sladen, A., Ponte, A., Lior, I., Ampuero, J.-P., Rivet, D., Meulé, S., Bouchette, F., Pairaud, I., and Coyle, P.: High-resolution seafloor thermometry for internal wave and upwelling monitoring using Distributed Acoustic Sensing, Sci. Rep., 13, 17459, https://doi.org/10.1038/s41598-023-44635-0, 2023.
Peña Castro, A. F., Schmandt, B., Baker, M. G., and Abbott, R. E.: Tracking local sea ice extent in the Beaufort Sea using distributed acoustic sensing and machine learning, TSR, 3, 200–209, https://doi.org/10.1785/0320230019, 2023.
Peng, S., Callies, J., Wu, W., and Zhan, Z.: Seismic ocean thermometry of the Kuroshio Extension region, J. Geophys. Res., 129, e2023JC020636, https://doi.org/10.1029/2023JC020636, 2024.
Petrovich, M., Fokoua, E. N., Chen, Y., Sakr, H., Adamu, A. I., Hassan, R., Wu, D., Ando, R. F., Papadimopoulos, A., Sandoghchi, S. R., Jasion, G., and Poletti, F.: First broadband optical fibre with an attenuation lower than 0.1 decibel per kilometre, arXiv:2503.21467, https://doi.org/10.48550/arXiv.2503.21467, 2025.
Pinkel, R., Nguyen, S., Smith, J. A., Lucas, A. J., Reineman, B. D., and Waterhouse, A. F.: Vertical momentum transport by internal gravity waves above the Equatorial Undercurrent at 140° W, Geophys. Res. Lett., 50, e2022GL101630, https://doi.org/10.1029/2022GL101630, 2023.
Polzin, K. L. and McDougall, T. J.: Mixing at the ocean’s bottom boundary, in: Ocean Mixing Drivers Mechanisms and Impacts, edited by: Meredith, M. and Naveira Garabato, A., 145–180, https://doi.org/10.1016/B978-0-12-821512-8.00014-1, 2021.
Poole, S. B., Payne, D. N., Mears, R. J., and Fermann, M.: Fabrication and characterization of low-loss optical fibers containing rare-earth ions, J. Light. Technol., 4, 870–876, https://doi.org/10.1109/JLT.1986.1074811, 1986.
Qin, J.-X., Katsnelson, B., Godin, O., and Li, Z.-L.: Geoacoustic inversion using time reversal of ocean noise, Chin. Phys. Lett., 34, 094301, https://doi.org/10.1088/0256-307X/34/9/094301, 2017.
Ragland, J., Abadi, S., and Sabra, K.: Using ocean ambient sound to measure local integrated deep-ocean temperature, Geophys. Res. Lett., 51, e2024GL108943, https://doi.org/10.1029/2024GL108943, 2024.
Rajan, S. D.: Simultaneous reconstruction of compressional wave speed and density profiles from modal eigenvalues, J. Comput. Acoust., 6, 257–267, https://doi.org/10.1142/S0218396X98000181, 1998.
Rajan, S. D. and Frisk, G. C.: Estimation of three-dimensional water column sound speed profiles and sediment compressional wave speed and density profiles using a distributed network of buoys, J. Acoust. Soc. Am., 147, 1392–1403, https://doi.org/10.1121/10.0000794, 2020.
Rivet, D., de Cacqueray, B., Sladen, A., Roques, A., and Calbris, G.: Preliminary assessment of ship detection and trajectory evaluation using distributed acoustic sensing on an optical fiber telecom cable, J. Acoust. Soc. Am., 149, 2615–2627, https://doi.org/10.1121/10.0004129, 2021.
Rønnekleiv, E., Sørgård, T., Klimentov, D., Tolstik, N., Waagaard, O. H., Jacobsen, J., Stabo-Eeg, F., Ait Sab, O., Calsat, A., Plantady, P., and Brenne, J. K.: Range-scalable distributed acoustic sensing with EDFA repeaters demonstrated over 2227 km, Opt. Lett., 50, 25–28, https://doi.org/10.1364/OL.542267, 2025.
Rosevear, M. G., Gayen, B., Vreugdenhil, C. A., and Galton-Fenzi, B. K.: How does the ocean melt Antarctic ice shelves?, Annu. Rev. Mar. Sci., 16, 1–30, https://doi.org/10.1146/annurev-marine-040323-074354, 2025.
Rovera, A., Tancau, A., Boetti, N., dalla Vedova, M. D. L., Maggiore, P., and Janner, D.: Fiber optic sensors for harsh and high radiation environments in aerospace applications, Sensors, 23, 2512, https://doi.org/10.3390/s23052512, 2023.
Roux, P., Kuperman, W. A., and the NPAL Group: Extracting coherent wave fronts from acoustic ambient noise in the ocean, J. Acoust. Soc. Am., 116, 1995–2003, https://doi.org/10.1121/1.1797754, 2004.
Sane, A., Reichl, B. G., Adcroft, A., and Zanna, L.: Parameterizing vertical mixing coefficients in the ocean surface boundary layer using neural networks, J. Adv. Model. Earth Syst., 15, e2023MS003890, https://doi.org/10.1029/2023MS003890, 2023.
Saw, J., Luo, L., Chu, K., Ryan, J., Soga, K., and Wu, Y.: Distributed Acoustic Sensing for whale vocalization monitoring: A vertical deployment field test, Seismol. Res. Lett., 96, 801–815, https://doi.org/10.1785/0220240389, 2025.
Scambos, T. A., White, T., Wallin, B., Truffer, M., Collao-Barrios, G., Kratt, C., Tyler, S., Pettit, E. C., Wild, C. T., Arora, S., Edwards, S., Fotherby, R., Meha, C., Soltys, J., Tomlinson, E., Weatherby, R., Ross, R., Wåhlin, A., Dotto, T. S., Alley, K., and Muto, A.: AMIGOS-3 multi-sensor stations and the climate, ice, and ocean conditions at Thwaites Eastern Ice Shelf during 2020-2022, J. Glaciol., 71, e60, https://doi.org/10.1017/jog.2024.96, 2025a.
Scambos, T., Kratt, C., Tyler, S., Wallin, B., and White, T.: “Channel AMIGOS Distributed Temperature Sensing (DTS) complete record”, U.S. Antarctic Program (USAP) Data Center [data set], https://doi.org/10.15784/601938, 2025b.
Schawlow, A. L. and Townes, C. H.: Infrared and optical masers, Phys. Rev., 112, 1940–1949, 1958.
Schubert, R., Vergara, O., and Gula, J.: The open ocean kinetic energy cascade is strongest in late winter and spring, Commun. Earth Environ., 4, 450, https://doi.org/10.1038/s43247-023-01111-x, 2023.
Selker, J. S., Thévenaz, L., Huwald, H., Mallet, A., Luxemburg, W., van de Giesen, N., Stejskal, M., Zeman, J., Westhoff, M., and Parlange, M. B.: Distributed fiber-optic temperature sensing for hydrologic systems, Water Resour. Res., 42, W12202, https://doi.org/10.1029/2006WR005326, 2006.
Seo, H., O’Neill, L. W., Bourassa, M. A., Czaja, A., Drushka, K., Edson, J. B., Fox-Kemper, B., Frenger, I., Gille, S. T., Kirtman, B. P., Minobe, S., Pendergrass, A. G., Renault, L., Roberts, M. J., Schneider, N., Small, R. J., Stoffelen, A., and Wang, Q.: Ocean mesoscale and frontal-scale ocean–atmosphere interactions and influence on Large-scale climate: A Review, J. Clim., 36, 1981–2013, https://doi.org/10.1175/JCLI-D-21-0982.1, 2023.
Serripierri, A., Moreau, L., Boue, P., Weiss, J., and Roux, P.: Recovering and monitoring the thickness, density, and elastic properties of sea ice from seismic noise recorded in Svalbard, The Cryosphere, 16, 2527–2543, https://doi.org/10.5194/tc-16-2527-2022, 2022.
Sheem, S. K.: Optical fiber interferometers with [3 × 3] directional couplers: Analysis, J. Appl. Phys., 52, 3865–3872, https://doi.org/10.1063/1.329853, 1981.
Sheem, S. K. and Giallorenzi, T. G.: Single-mode fiber-optical power divider: encapsulated etching technique, Opt. Lett., 4, 29–31, https://doi.org/10.1364/OL.4.000029, 1979.
Sheen, K. L., White, N. J., and Hobbs, R. W.: Estimating mixing rates from seismic images of oceanic structure, Geophys. Res. Lett., 36, https://doi.org/10.1029/2009GL040106, 2009.
Shen, Z. and Wu, W.: Ocean bottom distributed acoustic sensing for oceanic seismicity detection and seismic ocean thermometry, J. Geophys. Res. Solid Earth, 129, e2023JB027799, https://doi.org/10.1029/2023JB027799, 2024.
Shen, Z., Wu, W., and Lin, Y. T.: High-resolution observations of shallow-water acoustic propagation with distributed acoustic sensing, J. Acoust. Soc. Am., 156, 2237–2249, https://doi.org/10.1121/10.0030400, 2024.
Shrestha, K., Manucharyan, G. E., and Nakayama, Y.: Submesoscale variability and basal melting in ice shelf cavities of the Amundsen Sea, Geophys. Res. Lett., 51, e2023GL107029, https://doi.org/10.1029/2023GL107029, 2024.
Sidenko, E., Tertyshnikov, K., Lebedev, M., and Pevzner, R.: Experimental study of temperature change effect on distributed acoustic sensing continuous measurements, Geophysics, 87, D111–D122, https://doi.org/10.1190/geo2021-0524.1, 2022.
Siegfried, M. R., Venturelli, R. A., Patterson, M. O., Arnuk, W., Campbell, T. D., Gustafson, C. D., Michaud, A. B., Galton-Fenzi, B. K., Hausner, M. B., Holzschuh, S. N., Huber, B., Mankoff, K. D., Schroeder, D. M., Summers, P. T., Tyler, S., Carter, S. P., Fricker, H. A., Harwood, D. M., Leventer, A., Rosenheim, B. E., Skidmore, M. L., and Priscu, J. C.: The life and death of a subglacial lake in West Antarctica, Geology, 51, 434–438, https://doi.org/10.1130/G50995.1, 2023.
Sinnett, G., Davis, K. A., Lucas, A. J., Giddings, S. N., Reid, E., Harvey M. E., and Stokes, I.: Distributed temperature sensing for oceanographic applications, J. Atmos. Ocean. Technol., 37, 1987–1997, https://doi.org/10.1175/JTECH-D-20-0066.1, 2020.
Smith, M. M., Thomson, J., Baker, M. G., Abbott, R. E., and Davis, J.: Observations of ocean surface wave attenuation in sea ice using seafloor cables, Authorea, https://doi.org/10.22541/essoar.168889938.88368062/v1, 2023.
Song, A., Ren, J., Liu, A., Zhang, G., and Lei, X.: Active seismic surveys based on distributed acoustic sensing in near-surface active fault exploration: A test in Datong Basin, North China, J. Appl. Phys., 213, 105041, https://doi.org/10.1016/J.JAPPGEO.2023.105041, 2023.
Song, Z., Zeng, X., Ni, S., Chi, B., Xu, T., Wei, Z., Jiang, W., Chen, S., and Xie, J.: Near real-time in situ monitoring of nearshore ocean currents using distributed acoustic sensing on submarine fiber-optic cable, ESS, 11, e2024EA003572, https://doi.org/10.1029/2024EA003572, 2024.
Soto, M. A., Nannipieri, T., Signorini, A., Bolognini, G., Di Pasquale, F., Lazzeri, A., Baronti, F., and Roncella, R.: Advanced cyclic coding technique for long-range Raman DTS systems with meter-scale spatial resolution over standard SMF, Sensors, 2011 IEEE, 878–881, https://doi.org/10.1109/ICSENS.2011.6127331, 2011.
Spilhaus, A. F.: Maps of the whole World Ocean, Geogr. Rev., 32, 431–435, https://doi.org/10.2307/210385, 1942.
Spingys, C. P., Naveira Garabato, A. C., and Belal, M.: Optical fibre sensing of turbulent-frequency motions in the oceanic environment, Sci. Rep., 14, 20276, https://doi.org/10.1038/s41598-024-70720-z, 2024a.
Spingys, C. P., Naveira Garabato, A. C., and Belal, M.: Distributed optical fiber sensing for high space-time resolution ocean velocity observations: A case study from a macrotidal channel, Earth Space Sci., 11, e2023EA003315, https://doi.org/10.1029/2023EA003315, 2024b.
Stanciu, A. C., Frederick, J. M., Baker, M. G., Abbott, M. G., Conley, E. W., Solomon, E., and Jones, K.: Using Distributed Acoustic and Temperature Sensing to Characterize the Rapidly Changing Nearshore Arctic Ocean (PEMDATS), presented at 2023 SSA Annual Meeting, 64, San Juan, Puerto Rico, 17–20 April 2023.
Stern, A. A., Dinniman, M. S., Zagorodnov, V., Tyler, S. W., and Holland, D. M.: Intrusion of warm surface water beneath the McMurdo Ice Shelf, Antarctica, J. Geophys. Res.-Oceans, 118, 7036–7048, https://doi.org/10.1002/2013JC008842, 2013.
Suárez, F., Aravena, J. E., Hausner, M. B., Childress, A. E., and Tyler, S. W.: Assessment of a vertical high-resolution distributed-temperature-sensing system in a shallow thermohaline environment, Hydrol. Earth Syst. Sci., 15, 1081–1093, https://doi.org/10.5194/hess-15-1081-2011, 2011.
Sun, M.-Y., Shi, B., Guo, J.-Y., Zhu, H.-H., Jiang, H.-T., Liu, J., Wei, G.-Q., and Zheng, X.: Development and application of fiber-optic sensing technology for monitoring soil moisture field, Front. Sens., 2, 2021, 2022.
Sun, Y., Liu, J., Xue, Z., Li, Q., Fan, C., and Zhang, X.: A critical review of distributed fiber optic sensing for real-time monitoring geologic CO2 sequestration, J. Nat. Gas Eng., 88, 103751, https://doi.org/10.1016/j.jngse.2020.103751, 2021.
Tan, T. W. and Godin, O. A.: Passive acoustic characterization of sub-seasonal sound speed variations in a coastal ocean, J. Acoust. Soc. Am., 150, 2717–2737, https://doi.org/10.1121/10.0006664, 2021.
Tan, T. W. and Godin, O. A.: Ambient sound directionality and rapid estimation of empirical Green's functions in a coastal ocean, J. Acoust. Soc. Am., 152, A153, https://doi.org/10.1121/10.0015861, 2022.
Tan, T. W., Godin, O. A., Brown, M. G., and Zabotin, N. A.: Characterizing the seabed in the Straits of Florida by using acoustic noise interferometry and time warping, J. Acoust. Soc. Am., 146, 2321–2334, https://doi.org/10.1121/1.5127846, 2019.
Tan, T. W., Godin, O. A., Katsnelson, B. G., and Yarina, M.: Passive geoacoustic inversion in the Mid-Atlantic Bight in the presence of strong water column variability, J. Acoust. Soc. Am., 147, EL453–EL459, https://doi.org/10.1121/10.0001333, 2020.
Tanner, M. G., Dyer, S. D., Baek, B., Hadfield, R. H., and Nam, S. W.: High-resolution single-mode fiber-optic distributed Raman sensor for absolute temperature measurement using superconducting nanowire single-photon detectors, Appl. Phys. Lett., 99, 201110, https://doi.org/10.1063/1.3656702, 2011.
Taweesintananon, K., Landrø, M., Brenne, J. K., and Haukanes, A.: Distributed acoustic sensing for near-surface imaging using submarine telecommunication cable: A case study in the Trondheimsfjord, Norway, Geophysics, 86, https://doi.org/10.1190/GEO2020-0834.1, 2021.
Taylor, J. R. and Sarkar, S.: Internal gravity waves generated by a turbulent bottom Ekman layer, J. Fluid Mech., 590, 331–354, https://doi.org/10.1017/S0022112007008087, 2007.
Thomas, C. K. and Selker, J.: Optical fiber-based distributed sensing methods, in: Springer Handbook of Atmospheric Measurements, edited by: Foken, T., Springer Handbooks, Springer, Cham, https://doi.org/10.1007/978-3-030-52171-4_20, 2021.
Tonegawa, T. and Araki, E.: High-frequency tsunamis excited near Torishima Island, Japan, observed by Distributed Acoustic Sensing, Geophys. Res. Lett., 51, e2024GL108714, https://doi.org/10.1029/2024GL108714, 2024.
Trowbridge, J. H. and Lentz, S. J.: The bottom boundary layer, Annu. Rev. Mar. Sci., 10, 397–420, https://doi.org/10.1146/annurev-marine-121916-063351, 2018.
Tyler, S. W., Holland, D. M., Zagorodnov, V., Stern, A. A., Sladek, C., Kobs, S., White, S., Suárez, F., and Bryenton, J.: Using distributed temperature sensors to monitor an Antarctic ice shelf and sub-ice-shelf cavity, J. Glaciol., 59, 583–591, https://doi.org/10.3189/2013JoG12J207, 2013.
Tyler, S. W., Silvia, M. E., Jakuba, M. V., Durante, B. M., and Winebrenner, D. P.: Impacts of hydrostatic pressure on distributed temperature sensing optical fibers for extreme ocean and ice environments, Photonics, https://doi.org/10.3390/photonics11070630, 2024.
Vali, V. and Shorthill, R. W.: Fiber ring interferometer, Appl. Opt., 15, 1099–1100, https://doi.org/10.1364/AO.15.001099, 1976.
van Haren, H. and Gostiaux, L.: Detailed internal wave mixing above a deep-ocean slope, J. Mar. Res., 70, 173–197, https://doi.org/10.1357/002224012800502363, 2012.
van Haren, H., Groenewegen, R., Laan, M., and Koster, B.: A fast and accurate thermistor string, J. Atmos. Ocean. Technol., 18, 256–265, https://doi.org/10.1175/1520-0426(2001)018<0256:AFAATS>2.0.CO;2, 2001.
van Haren, H., Voet, G., Alford, M. H., and Torres, D.: Internal wave breaking near the foot of a steep East-Pacific continental slope, Prog. Oceanogr., 205, 102817, https://doi.org/10.1016/j.pocean.2022.102817, 2022.
Vantassel, J. P., Cox, B. R., Hubbard, P. G., and Yust, M.: Extracting high-resolution, multi-mode surface wave dispersion data from distributed acoustic sensing measurements using the multichannel analysis of surface waves, J. Appl. Geophys., 205, 1–13, https://doi.org/10.1016/j.jappgeo.2022.104776, 2022.
VIAVI: Fiber sensing module DTSS Module (strain and temperature) user manual, 2017.
Vidal-Moreno, P. J., Rochat, E., Fermoso, P., Fernández-Ruiz, M. R., Martins, H., Martín-López, S., Ocaña, M., and González-Herraez, M.: Cancellation of reference update-induced 1/f noise in a chirped-pulse DAS, Opt. Lett., 47, 3588–3591, https://doi.org/10.1364/OL.465367, 2022.
Waagaard, O. H., Rønnekleiv, E., Haukanes, A., Stabo-Eeg, F., Thingbø, D., Forbord, S., Aasen, S. E., and Brenne, J. K.: Real-time low noise distributed acoustic sensing in 171 km low loss fiber, OSA Continuum, 4, 688–701, https://doi.org/10.1364/OSAC.408761, 2021.
Wapenaar, K. and Fokkema, J.: Green's function representations for seismic interferometry, Geophysics, 71, SI33–SI46, https://doi.org/10.1190/1.2213955, 2006.
Wang, L., Wang, Y. J., Song, S., and Li, F.: Overview of fibre optic sensing technology in the field of physical oceanography, Front. Phys., 9, 745487, https://doi.org/10.3389/fphy.2021.745487, 2021.
Warner, R. C., Craven, M., Galton-Fenzi, B., Elcheikh, A., Christensen, A., and Vogel, S. W.: Distributed temperature sensing in the Amery Ice shelf and the sub ice shelf ocean, in: Book of Abstracts of 26th International Forum for Research into Ice Shelf Processes (FRISP), edited by: Hanke, M. and Kirchner, N., 12–14 June 2012, Stockholm Archipelago, Sweden, http://urn.kb.se/resolve?urn=urn:nbn:se:su:diva-88405 (last access: May 2025), 2012.
Weaver, R. L. and Lobkis, O. I.: Diffuse fields in open systems and the emergence of the Green's function (L), J. Acoust. Soc. Am., 116, 2731–2734, https://doi.org/10.1121/1.1810232, 2004.
Whalen, C. B., de Lavergne, C., Naveira Garabato, A. C., Klymak, J. M., MacKinnon, J. A., and Sheen, K. L.: Internal wave-driven mixing: governing processes and consequences for climate, Nat. Rev. Earth Environ., 1, 606–621, https://doi.org/10.1038/s43017-020-0097-z, 2020.
Whitcomb, L. L., Jakuba, M. V., Kinsey, J. C., Martin, S. C., Webster, S., Howland, J. C., Taylor, C. L., Gómez-Ibáñez, D., and Yoerger, D. R.: Navigation and control of the Nereus hybrid underwater vehicle for global ocean science to 10,903 m depth: Preliminary results, in: Proceedings of the IEEE International Conference on Robotics and Automation, Anchorage, AK, USA, 3–7 May 2010, 594–600, https://doi.org/10.1109/ROBOT.2010.5509265, 2010.
Whitley, V. and Wenegrat, J.: Breaking internal waves on sloping topography: Connecting parcel displacements to overturn size, interior-boundary exchanges, and mixing, J. Phys. Oceanogr., 55, 645–661, https://doi.org/10.1175/JPO-D-24-0052.1, 2025.
Wilcock, W. S., Abadi, S., and Lipovsky, B. P.: Distributed acoustic sensing recordings of low-frequency whale calls and ship noise offshore Central Oregon, JASA Express Lett., 3, 026002, https://doi.org/10.1121/10.0017104, 2023.
Wild, C. T., Snow, T., Dotto, T. S., Davis, P. E. D., Tyler, S., Scambos, T. A., Pettit, E. C., and Heywood, K. J.: Thwaites Eastern Ice Shelf Cavity Observations Reveal Multi-year Sea Ice Dynamics and Deep-Water Warming in Pine Island Bay, West Antarctica, EGUsphere [preprint], https://doi.org/10.5194/egusphere-2025-1675, 2025.
Williams, E. F. and Lipovsky, B. P.: Toward cable response for DAS, 2024 IEEE Photonics Society Summer Topicals Meeting Series, 1–2, https://doi.org/10.1109/SUM60964.2024.10614499, 2024.
Williams, E. F., Zhan, Z., Martins, H. F., Fernández-Ruiz, M. R., Martín-López, S., González-Herráez, M., and Callies, J.:: Surface gravity wave interferometry and ocean current monitoring with ocean-bottom DAS, J. Geophys. Res., 127, e2021JC018375, https://doi.org/10.1029/2021JC018375, 2022.
Williams, E. F., Ugalde, A., Martins, H. F., Becerril, C. E., Callies, J., Claret, M., Fernández-Ruiz, M. R., González-Herraez, M., Martín-López, S., Pelegrí, J. L., Winters, K. B., and Zhan, Z.: Fiber-optic observations of internal waves and tides, J. Geophys. Res., 128, e2023JC019980, https://doi.org/10.1029/2023JC019980, 2023.
Woolfe, K. F., Lani, S., Sabra, K. G., and Kuperman, W. A.:. Monitoring deep-ocean temperatures using acoustic ambient noise, Geophys. Res. Lett., 42, 2878–2884, https://doi.org/10.1002/2015GL063438, 2015.
Wu, W., Zhan, Z., Peng, S., Ni, S., and Callies, J.: Seismic ocean thermometry, Science, 369, 1510–1515, https://doi.org/10.1126/science.abb9519, 2020.
Wynne-Cattanach, B. L., Couto, N., Drake, H. F., Ferrari, R., Le Boyer, A., Mercier, H., Messias, M.-J., Ruan, X., Spingys, C., van Haren, H., Voet, G., Polzin, K., Naveira Garabato, A., and Alford, M.: Observations of diapycnal upwelling within a sloping submarine canyon, Nature, 630, 884–890, https://doi.org/10.1038/s41586-024-07411-2, 2024.
Xu, Z., Chen, T., Wang, L., and Tang, M.: High-precision colonoscope image guidance using OFDR shape sensing with right-angle core configuration in multicore fiber, Proc. SPIE 13639, 29th International Conference on Optical Fiber Sensors, 1363914, https://doi.org/10.1117/12.3059576, 2025.
Yamamoto, Y. and Kimura, T.: Coherent optical fiber transmission systems, IEEE J. Quantum Electron., 17, 919–935, https://doi.org/10.1109/JQE.1981.1071225, 1981.
Yang, F., Hlushko, R., Wu, D., Sukhishvili, S. A., Du, H., and Tian, F.: Ocean salinity sensing using long-period fiber gratings functionalized with layer-by-layer hydrogels, ACS Omega, 4, 2134–2141, https://doi.org/10.1021/acsomega.8b02823, 2019.
Yang, X., Li, F., Zhang, B., and Luo, W.: Seasonally-invariant head wave speed extracted from ocean noise cross-correlation, J. Acoust. Soc. Am., 147, EL241–EL245, https://doi.org/10.1121/10.0000877, 2020.
Zhan, Z.: Distributed acoustic sensing turns fiber-optic cables into sensitive seismic antennas, Seismol. Res. Lett., 91, 1–15, https://doi.org/10.1785/0220190112, 2020.
Zhongwen, Z., Cantono, M., Kamalov, V., Mecozzi, A., Müller, R., Yin, S., and Castellanos, J. C.: Optical polarization–based seismic and water wave sensing on transoceanic cables, Science, 371, 931–936, https://doi.org/10.1126/science.abe6648, 2021.
Zumberge, M. A., Wyatt, F. K., Yu, D. X., and Hanada, H.: Optical fibers for measurement of earth strain, Appl. Opt., 27, 4131–4138, https://doi.org/10.1364/AO.27.004131, 1988.
Zumberge, M. A., Hatfield, W., and Wyatt, F. K.: Measuring seafloor strain with an optical fiber interferometer, Earth Space Sci., 5, 371–379, https://doi.org/10.1029/2018EA000418, 2018.
These definitions are physically-motivated, and are thus framed in terms of the pertinent scattering process(es) and measurand(s). They may differ slightly from the terminology used commercially. For example, most major vendors currently use DSS or DSTS to refer to Brillouin-scattering DTS.
- Abstract
- Introduction
- Fundamentals of distributed optical fibre sensing
- Physical oceanographic applications of DOFS
- Prospects of DOFS in physical oceanography
- Conclusions
- Code availability
- Data availability
- Author contributions
- Competing interests
- Disclaimer
- Special issue statement
- Acknowledgements
- Financial support
- Review statement
- References