the Creative Commons Attribution 4.0 License.
the Creative Commons Attribution 4.0 License.
 | 30 Mar 2026
Increased ocean heat transport to the central Arctic despite a well working Barents Sea Cooling Machine
Shaun A. Eisner
James A. Carton
Leon Chafik
Lars H. Smedsrud
The Barents Sea is a primary gateway for Atlantic Water entering the central Arctic Ocean and ubiquitous water-mass transformation on the Barents shelf is key for mitigating increases in heat transport to the central Arctic through the St. Anna Trough. Using a mesoscale-permitting reanalysis spanning 40 years, we derive the first long-term estimate of heat transport through the St. Anna trough, finding that it has increased by 0.11 TW yr−1 since 1980. However, this is only half of the 0.23 TW yr−1 trend in the heat transport into the Barents Sea through the Barents Sea Opening. Decomposing the heat transports reveals that these trends are entirely due to warming temperatures at the sections with no discernible trend in the volume transports. We find that a northward migration of the largest heat fluxes from the ocean to the atmosphere have partially mitigated the increased temperature of Atlantic Water entering through the Barents Sea Opening, resulting in the less dramatic temperature trend in the waters exiting through the St. Anna Trough. Finally, we present evidence for a revised version of the “ocean feedback” hypothesis, which modulates volume transport into and out of the Barents Sea on sub-decadal timescales. The revised “ocean feedback” hypothesis relies on denser waters in the northeastern Barents Sea associated with increases in salinity and sufficient cooling from inflowing Atlantic Water. We find that these denser, more saline waters create lower sea surface height relative to the permanently elevated Kara Sea. The resulting gradient enhances downslope flow into the St. Anna Trough, driving increased inflow of saline Atlantic Water through the Barents Sea Opening and sustaining the feedback loop.
- Article
(4682 KB) - Full-text XML
-
Supplement
(8440 KB) - BibTeX
- EndNote


The Barents Sea is situated at the entrance to the deep central Arctic Ocean. Along with the Fram strait, this relatively shallow shelf sea is a primary gateway for warm Atlantic Water (AW) flowing northwards. Warm and salty AW enters the Barents Sea through the Barents Sea Opening (BSO), which serves as a major moderator of heat and salt transport to the central Arctic (Skagseth et al., 2008; Smedsrud et al., 2010) (See Fig. 1). Despite exporting heat to the central Arctic, the Barents Sea has historically served as a “cooling machine”, with strong heat fluxes from the ocean to the atmosphere that cool the inflowing AW and transform it into denser, cooler water masses (Smedsrud et al., 2010, 2013; Skagseth et al., 2020; Årthun et al., 2025). In recent decades, the Barents Sea has experienced a number of climatic changes which fall under the umbrella of “Atlantification”, including loss of sea ice, rapid warming, and “Borealization” of it's shelf ecosystems (Smedsrud et al., 2022; Ingvaldsen et al., 2021; Onarheim et al., 2018; Onarheim and Årthun, 2017). It has been suggested that ongoing warming and sea ice loss in the Barents has partially been amplified by a slowdown of the “Barents Sea Cooling Machine” (Skagseth et al., 2020), while others suggest that the cooling machine may instead be migrating northward (Shu et al., 2021). Any changes in the efficiency of the Barents Sea cooling will have outsized downstream impacts on the future warming of the Arctic due to the outflow of water from the Barents Sea into the Arctic Circumpolar Boundary Current (ACBC) which transports this water from the St. Anna Trough as far as the Amerasian Basin (Rudels et al., 1999; Woodgate et al., 2001; Aksenov et al., 2011). Correctly assessing long-term changes in the Barents Sea cooling system and the effect that these changes have on the properties of water exiting the Barents Sea through the St. Anna Trough is therefore necessary to understanding the implications of Atlantification on the broader Arctic.
The Barents Sea is a complex system with decadal-scale air-ice-ocean oscillations (Ikeda, 1990) that requires feedback processes to operate. Smedsrud et al. (2013) evaluated two primary feedback mechanisms working to collectively maintain the “Barents Sea Cooling Machine” – a “Wind Feedback” and an “Ocean Feedback”. The wind feedback mechanism postulates that increases in the heat transport of AW entering through the BSO results in greater heat loss from the ocean to the atmosphere, resulting in lower surface pressures and stronger westerly winds which in turn continue to drive increased AW inflow. This mechanism has been adressed using models and observations (Bengtsson et al., 2004; Cai et al., 2022), but the increased cycloninc winds were not found to be causing increased AW inflow by Heukamp et al. (2023). The ocean feedback mechanism postulates that the same increases in AW heat transport through the BSO which result in increased heat loss from the ocean to the atmosphere also drive an increase in the formation of dense water. This sets up an SSH gradient between the northeastern Barents Sea and the Eurasian Basin that drives a barotropic flow through the Barents Sea that strengthens the inflow through BSO and outflow through STA.
Unlike the wind feedback mechanism, there has been little discussion and no direct observational evidence of the proposed ocean feedback mechanism, due primarily to a lack of sustained observations in the northeastern Barents Sea in the vicinity of St. Anna Trough (although there are some observations, which have allowed for estimates of time mean quantities, such as in Schauer et al., 2002). Recent discussions regarding the Barents Sea cooling machine have focused on the warming inflow through the BSO and a reduction in ocean heat loss associated with warmer waters in the Barents Sea (Skagseth et al., 2020). Again, sparse observations in the northeastern Barents Sea limit the ability to assess whether changes to the location or efficiency of the cooling machine manifest in the transport of water from the Barents Sea through the St. Anna trough and ultimately into the central Arctic, a key point we focus on in this study.
Reanalyses present a potential solution to the problem of assessing long-term changes in the export of water from the Barents Sea and assessing the ocean feedback mechanism of Smedsrud et al. (2013). Historically, reanalyses have been used effectively to produce long-term estimates of ocean heat and volume transports (Carton and Santorelli, 2008; Karspeck et al., 2017). Comparison studies however, such as that of Uotila et al. (2019), have shown that many reanalyses lack sufficient vertical and horizontal resolution to adequately capture the structure and dynamics of the polar region. In this study we use the new, mesoscale-permitting SODA4 reanalysis, which builds upon the Regional Arctic Reanalysis (RARE) (Chepurin et al., 2025a; Carton and Chepurin, 2023). SODA4 improves upon the vertical and horizontal resolution of existing reanalyses and we assess its consistency with observations in the Barents Sea region. We use SODA4 to study trends in heat transport through the Barents Sea Opening and St. Anna Trough from 1980–2020. Additionally, we assess how changes in the Barents Sea cooling processes have affected the heat of the Barents Sea outflow waters and the evidence supporting the proposed ocean feedback hypothesis.
2.1 Reanalysis Construction
The SODA4 reanalysis is a global , 75 vertical level ocean state estimate spanning the period from 1980 to the near present. The base model is a coupled MOM5.1/SIS1 ice-ocean model on an Arakawa B-grid with displaced poles. The reanalysis assimilates temperature and salinity profiles from the 2023 World Ocean Database (Mishonov et al., 2024) as well as ICOADS 3.0 (Freeman et al., 2017) and NOAA nighttime L3 Sea Surface Temperatures (Jonasson et al., 2022b, a; Chepurin et al., 2025a). In the Barents Sea, St. Anna Trough, and surrounding regions, SODA4 assimilates ∼75 000 individual profiles from the world ocean database over the period of coverage. Atmospheric forcing is provided by the ERA-5 atmospheric reanalysis (Hersbach et al., 2020). For more information on the construction of SODA, we refer the reader to Carton and Giese (2008) or Chepurin et al. (2025a).
While SODA4 is available at 5-daily temporal frequency, for this study, the monthly frequency output is used. Temperature, salinity, velocity, sea surface height (SSH), and mixed layer depth (using the de Boyer Montégut et al. (2004) density criterion) are all obtained directly from the SODA4 monthly output. While total surface heat fluxes are available from the SODA4 reanalysis, in this study they are obtained directly from the ERA-5 reanalysis so that they can be separated into turbulent (Latent and Sensible) and radiative (Short-wave and Long-wave) components.
In order to assess long-term changes in hydrographic properties, heat content, and atmospheric heat fluxes, time means of each quantity are computed over each decade: 1980–1989, 1990–1999, 2000–2009, 2010–2019, and 2020–2024. Heat flux and other rate of change quantities are first annually integrated and the annual integrals are then averaged over the appropriate decadal period, while direct hydrographic properties such as temperature and salinity are simply averaged over the entire decadal period.
In order to assess the coupling in the hypothesized ocean feedback mechanism, the SSH gradient is considered, which supposedly drives the associated barotropic flow through the Barents Sea. For this assessment, we consider the spatial average of the magnitude of the SSH gradient, ∇SSH across the Barents Sea.
2.2 In Situ Observations
Annual time series of 0–200 m depth averaged temperature and salinity are obtained from the Bear Island and Kola section time series (obtained from the ICES database: https://ocean.ices.dk/iroc/, last access: 10 December 2025) and directly compared to annually and depth averaged temperature and salinity from the SODA4 output (Gonzalez-Pola et al., 2023). Time-mean hydrographic properties of the SODA4 output are also directly compared to the World Ocean Atlas 2023 climatology (Reagan et al., 2023).
2.3 Transport and Sections
Net heat and volume transports are evaluated over a number of key sections, including the BSO, the Fram Strait (FS), the St, Anna Trough (STA), and across the ACBC. The extent of these sections are indicated in Table 1 and Fig. 1. All transports are depth-integrated to a maximum depth of 1000 m. This cutoff depth is chosen as the data assimilation is poorly constrained in the Arctic at depths below 1000 m. This yields a heat transport DQ:
where u is the horizontal velocity vector and is the unit normal vector to the surface through which the transport is calculated. In the case of our sections, the unit normal is always either directly zonal or directly meridional, reducing the normal component of the horizontal velocity to either u or v.
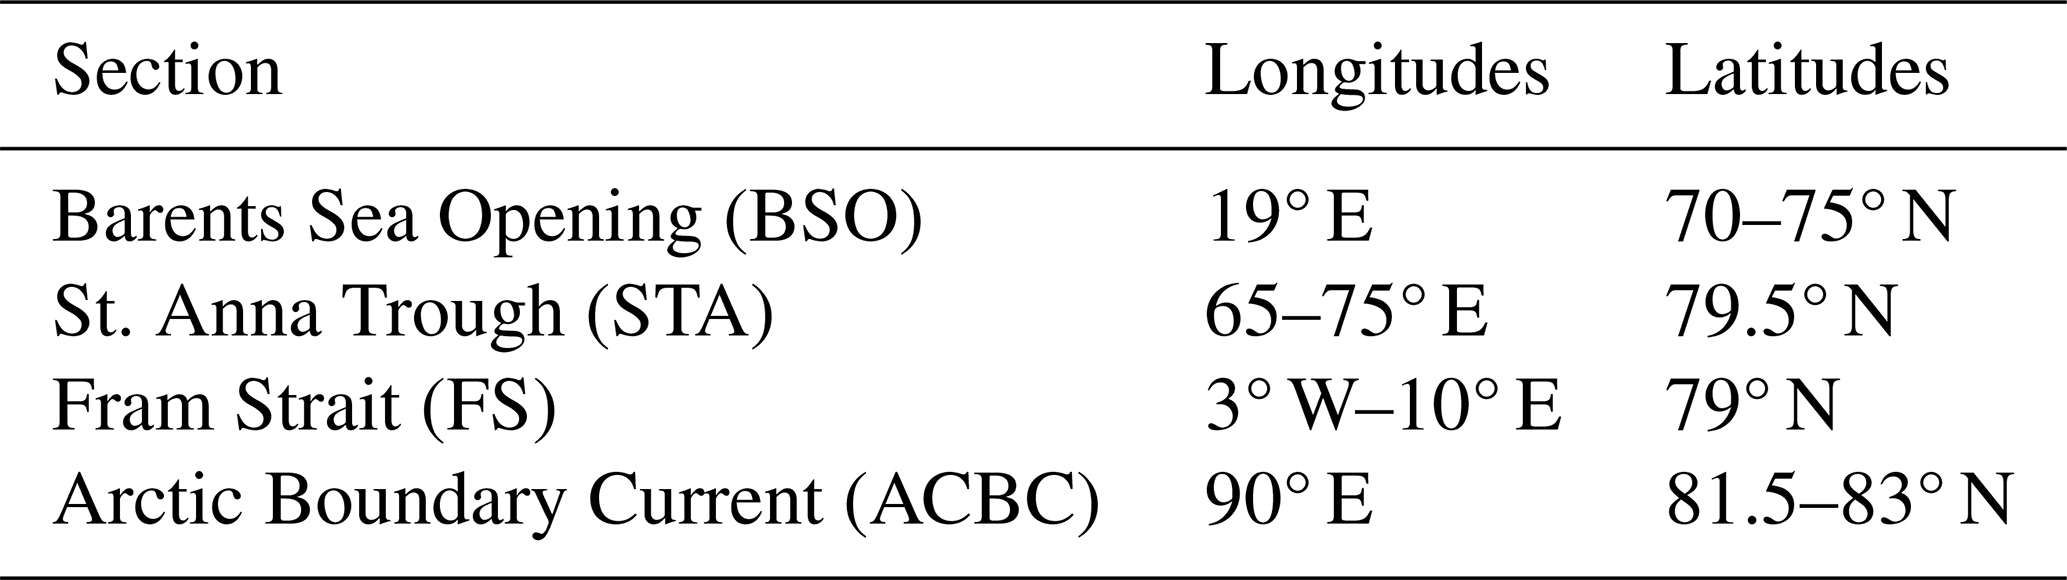
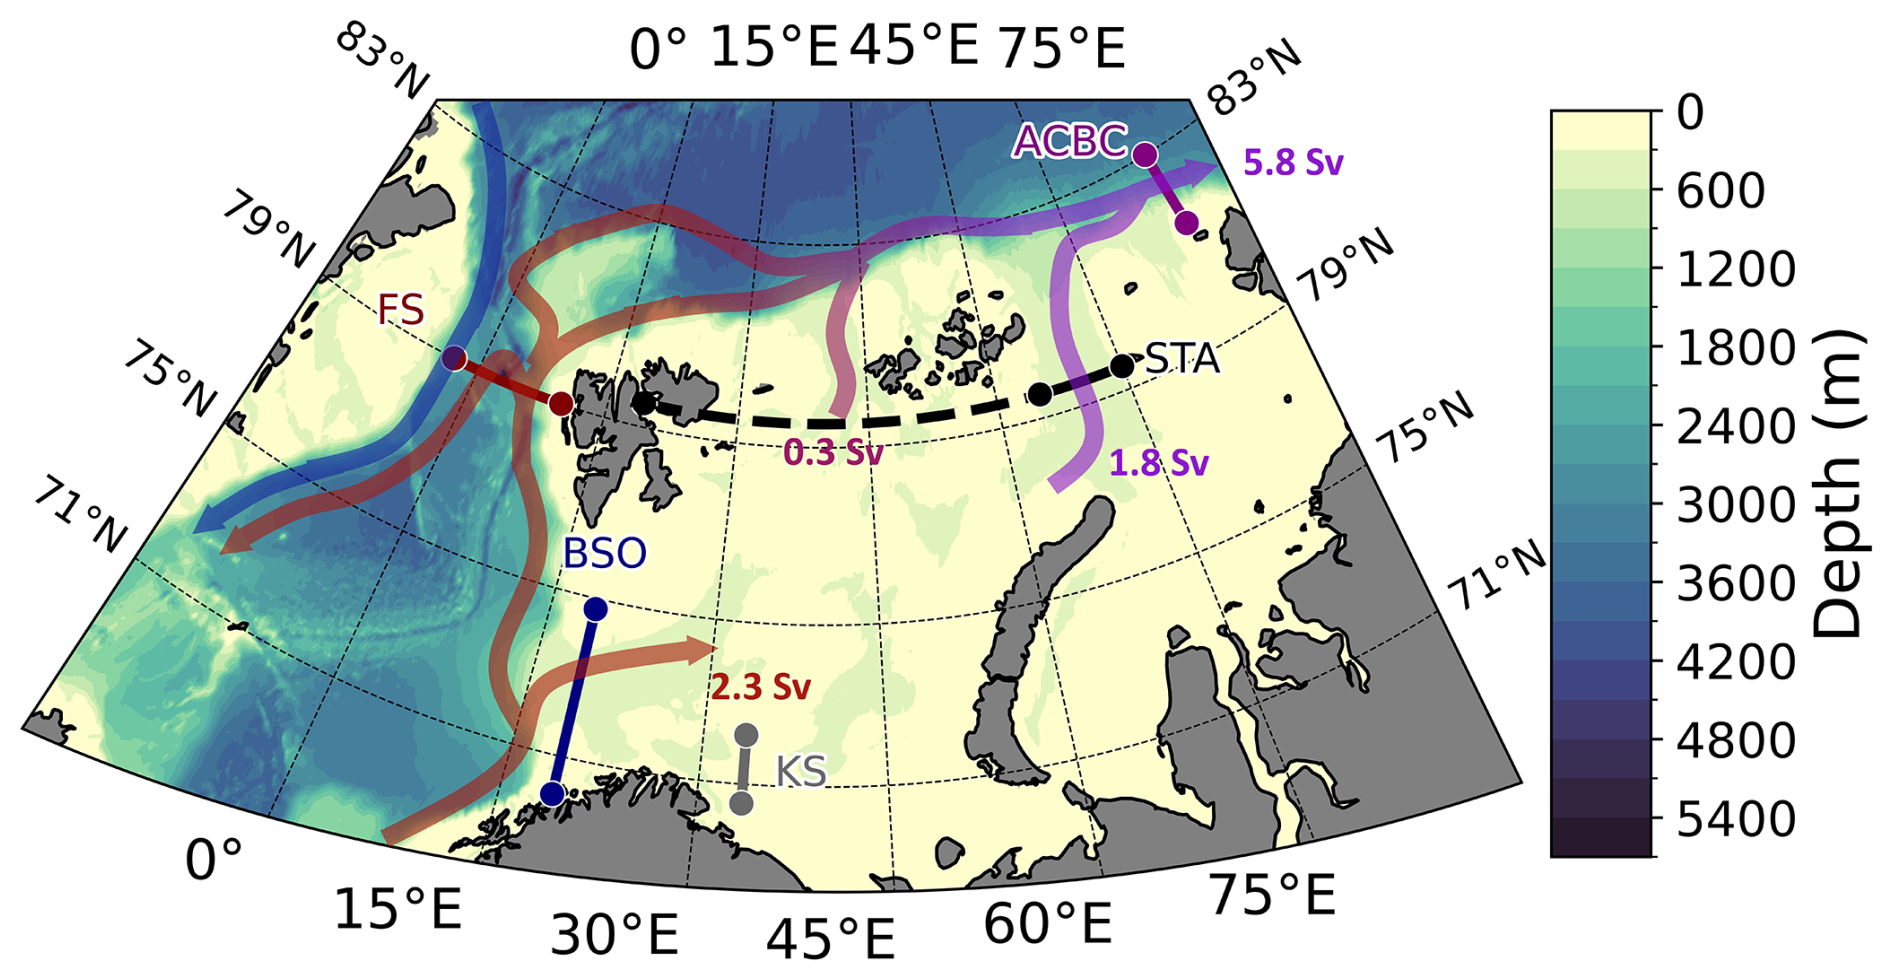
Figure 1The Barents Sea bathymetry and the analyzed sections; The Barents Opening (BSO), Fram Strait (FS), St. Anna Trough (STA), the Arctic Circumpolar Boundary Current (ACBC) and the Kola Section (KS). The northern boundary (19–75° E, 79.5° N) is also indicated as a dashed line. Colored red/purple arrows indicate the path of Atlantic Water as it traverses the shelfbreak, enters, and leaves the Barents Sea. Colored blue arrows indicate outflow of Arctic water via the East Greenland Current. Volume transports of the major inflows and outflows are used from Smedsrud et al. (2010) and Pnyushkov et al. (2018b).
While a reference temperature of 0 °C has traditionally been used for heat transport calculations in the Barents Sea region (Smedsrud et al., 2010), we adopt a reference temperature of −1.8 °C in accordance with Woodgate et al. (2001) and Pnyushkov et al. (2018b, 2021) so as to avoid any confusion in transport trends or direction resulting from temperatures in the vicinity of 0 °C. −1.8 °C is a natural lower limit for the reference temperature, as it is close to the freezing-point. To provide direct comparison with prior estimates regardless of reference temperature, we compute the true heat flux convergence of the Barents Sea, following Smedsrud et al. (2010). The true heat flux convergence is defined as the integrated divergence of heat over the entire volume, but can be rewritten in terms of the sum of heat transports across each of the boundaries using Green's Theorem:
Therefore, the true heat flux convergence to the Barents Sea is independent of reference temperature as long as the volume budget is closed, but the absolute values at each section vary with this choice. In SODA4, the volume budget is approximately closed when considering flow through BSO and the entire northern boundary (19–75° E, 79.5° N), so the true heat convergence in SODA4 is approximately the sum of and , where NB represents the northern boundary (see Fig. 1 for the location of the northern boundary and BSO). For reference, we also compute the heat convergence and time mean heat transports for the well-known GLORYS12 reanalysis (Lellouche et al., 2021) (See Table S1 in the Supplement).
3.1 Decadal Changes in Hydrography
To assess the reliability of SODA4, we provide comparison to the annual time series of temperature and salinity at the Bear Island and Kola sections. In the vicinity of the BSO, SODA4 has a cold bias, while in the vicinity of Kola section, it has a slight warm bias. The same pattern of temperature bias is evident when comparing the time mean SODA4 hydrography to the World Ocean Atlas 2023, but is less pronounced in amplitude (see Fig. S1 in the Supplement). There is a 1–2 °C warm bias in the Kara Sea and in the vicinity of Novaya Zemlya, with intermittent regions of 1–1.5 °C cold bias throughout the Southern Barents, near the BSO. Despite the evident biases when compared with observations, the annual anomalies of temperature and salinity in SODA4 are well correlated with those present in the Bear Island and Kola section time series (see Fig. 2). Additionally, the same positive trends in temperature that are evident in observations are reproduced in the SODA4 hydrography. This supports the idea that despite the biases, the anomalies (and trends) in temperature are still consistent between the reanalysis and observations, allowing us to assess trends in the heat transport. This is further supported by a realistic time mean heat convergence for the Barents Sea in SODA4, which is further discussed in the following section.
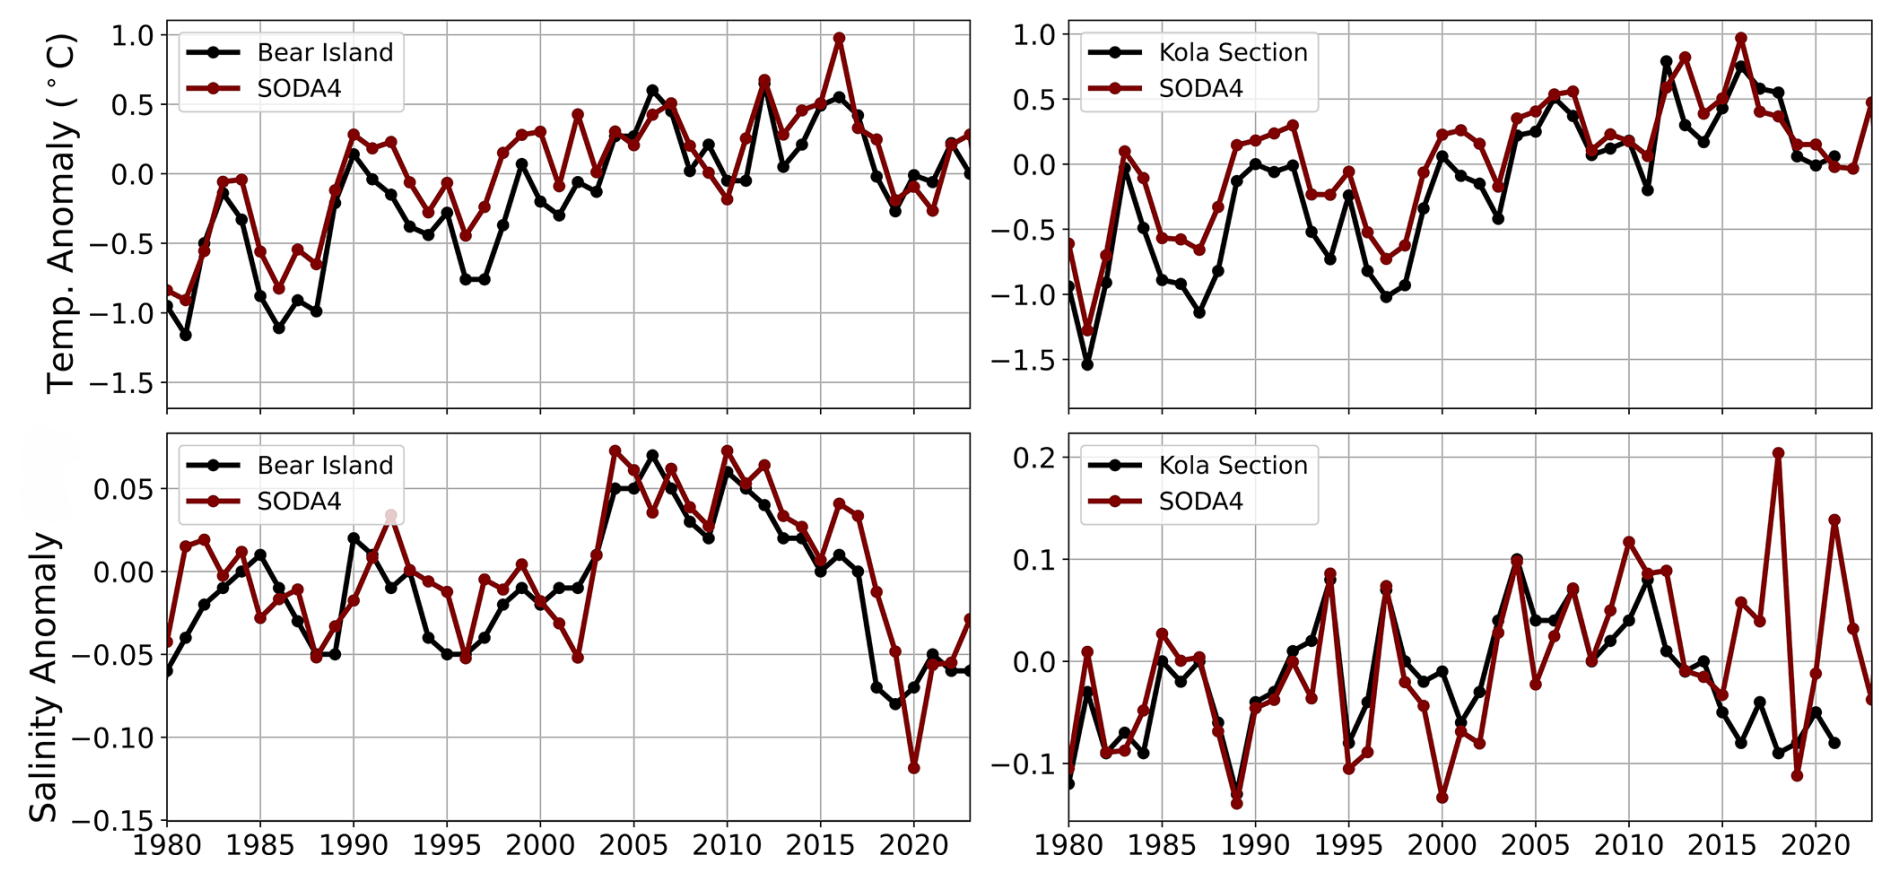
Figure 2Time Series of annual anomalies of Potential Temperature (Top) and Salinity (Bottom) at Bear Island (Left) and Kola section (Right) relative to the 1980–2023 time mean.
It is worth noting that there is a distinct negative trend in salinity at both Bear Island and Kola section beginning in 2010. This appears consistent with the “great salinity anomaly” identified by Holliday et al. (2020). In SODA4, this anomaly is evident at Bear Island, but is not evident at the Kola section. For this reason, SODA4 deviates from observed salinity anomalies at Kola section by up to 0.2 beginning in 2015. This same pattern does not appear in the temperature anomalies.
After assessing consistency of SODA4 with the observations at Bear Island and Kola sections, we assess changes in the decadally-averaged vertical profiles of hydrographic properties as well as the change in the 2020s decadally averaged heat content relative to the 1980s. The heat content is computed per grid cell by integrating the heat from surface to bottom in each grid cell and the total heat content is obtained by spatially integrating the per grid cell heat content over the entire region shown in Fig. 4a. Relative to the 1980s, the 2020s Barents-Kara sea heat content increased by 1.1 ZJ. This is consistent with a steady ∼0.2 °C increase in potential temperature each decade. Notably, the increases in potential temperature appear depth-amplified. While surface salinity and potential density decreased by 0.5 and 1 kg m−3 respectively (Fig. 3), the trend is not steady and appears dominated by the signal in the Kara Sea and northeastern Barents Sea. In the southern Barents Sea, both salinity and density have increased steadily since the 1980s.
Figure 3Simulated Barents Sea properties over time. Vertical profiles of spatially averaged hydrographic properties over the entire Barents Sea domain for each decade. 1σ standard deviations for each decade are also indicated via shading. Potential temperature increases relatively uniformly each decade and is slightly depth intensified. Changes in salinity and density are largely dominated by decreases in the Eastern Kara Sea and Eurasian shelfbreak due to ice melt and increased river freshwater export.
3.2 Heat Transport
Increases in heat content are ubiquitous in the Barents Sea with the greatest increases in the vicinity of the Barents Sea Opening, St. Anna Trough, and west of Novya Zemlaya (Fig. 4a). Additionally, heat transport through the BSO and STA have increased over the 40 year period. However, the rate of increase of heat transport through the St. Anna trough (0.11 TW yr−1) is roughly half that of the increase through the Barents Sea Opening (0.23 TW yr−1), indicating that at least half of the additional heat advected into the Barents Sea through BSO is mitigated prior to exiting through STA (Fig. 5). The additional heat that does get transported through STA appears to be the primary source of increased heat in the core of the ACBC, which carries water out of the Barents Sea, exiting through STA along the Eurasian shelf. There is a clear positive trend in the average temperature of water transported through the ACBC section (∼0.025 °C yr−1), but no discernible trend in heat transport through Fram Strait (Fig. 5). This indicates that the increases in heat transport through the STA are the primary advective source of increased heat transported to the central Arctic. It is worth noting however, that despite a lack of a trend in heat transport through Fram Strait, we do find a slight trend (∼0.012 °C yr−1) in the average temperature of water flowing through Fram Strait. This is similar to the findings of Beszczynska-Möller et al. (2012), who identified a 0.06 °C yr−1 trend. A potential reason for discrepencies in the magnitude of the trend could be a mismatch in the sections considered, as we exclude the westernmost portion of Fram Strait so as not to count recirculating AW or the East Greenland Current.
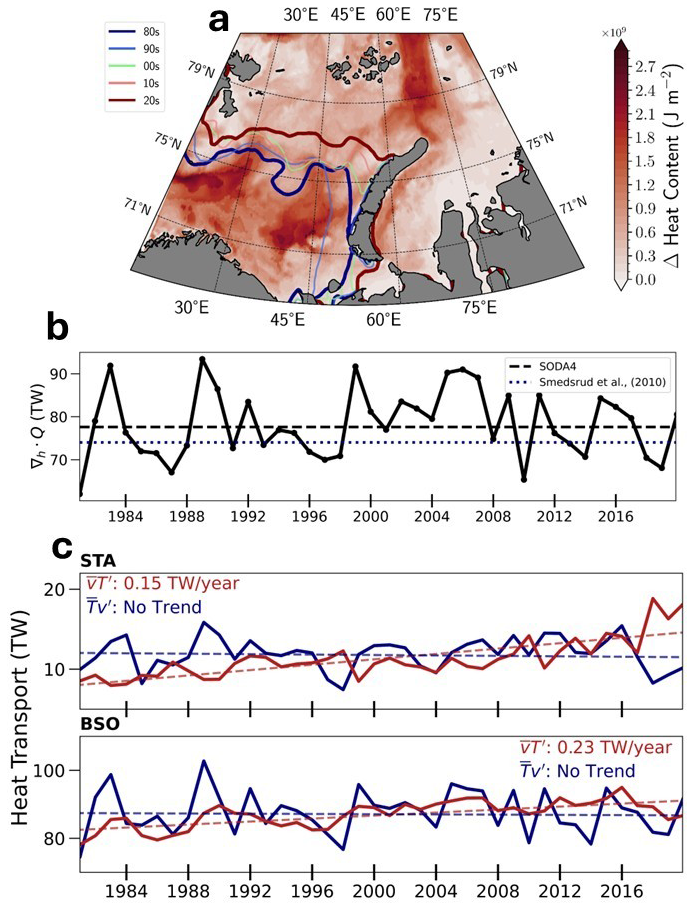
Figure 4(a) The change in decadally-averaged Ocean Heat Content in the 2020s relative to the 1980s. There are three “hotspots” located at the Barents Sea Opening, just west of Novaya Zemlya, and in the St. Anna trough. The mean ice edge for each decade is indicated. (b) Time series of the “true” heat convergence ∇h⋅Q of the Barents Sea in SODA4. The heat convergence of Smedsrud et al. (2010) is also indicated. (c) Time series of the temperature and volume decomposed heat transports ( and through St. Anna Trough (STA) and Barents Sea Opening (BSO). Trend lines are indicated as well. There is no discernible trend in the volume component of heat transport through either opening, but trends in the temperature components of both the BSO and STA heat transports.
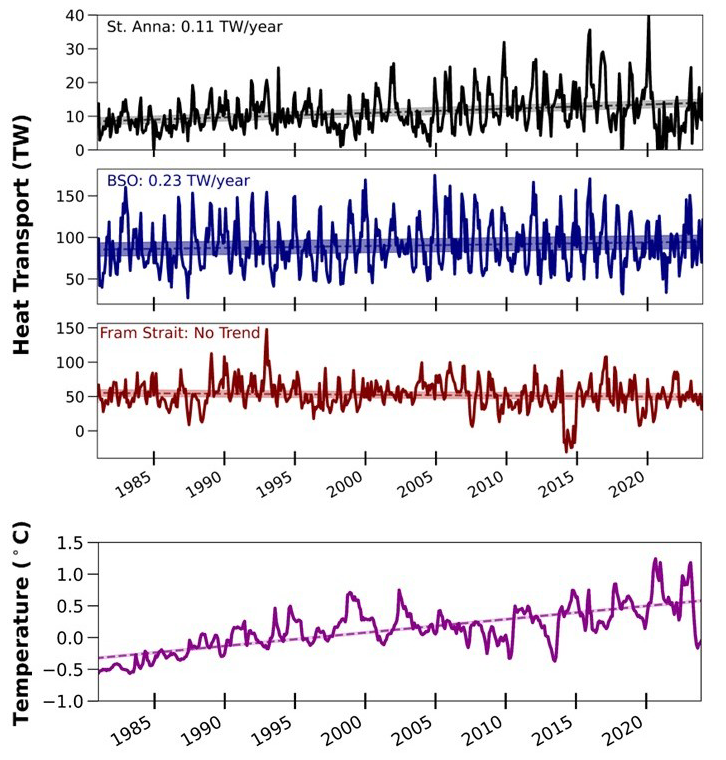
Figure 5Time series of heat transport through the Barents Sea Opening (BSO), St. Anna Trough and Fram Strait. Average temperature along a section of the (bottom) Arctic Circumpolar Boundary Current (ACBC) is also indicated (the extent of this section is given in Table 1). Linear trends are indicated with dashed lines. There are increasing trends in heat transport through St. Anna Trough and the average temperature through the ACBC section but no discernible trend in heat transport through Fram Strait.
The true heat convergence to the Barents Sea in SODA4 when averaged over the entire reanalysis period (1980–2024) is 77.6±10 TW. This is within uncertainty of the results of Smedsrud et al. (2010), which estimated a true heat convergence for the Barents Sea of ∼73 TW. The Smedsrud et al. (2010) estimate was obtained by synthesizing and averaging all available prior observational estimates of volume transport and temperature through each of the boundaries of the Barents-Sea. When referenced to a temperature of −1.8 °C, 86.8 TW enters through the BSO and 15.9 TW exits through the northern boundary extending from Svalbard to the easternmost edge of STA in SODA4. The vast majority (11.2 TW) of this exiting heat leaves through the STA itself between 65–75° E. The close matching of the true heat convergence indicates that the temperature biases in SODA4 have little impact on the modelled heat convergence in the Barents Sea (Fig. 4b).
Decomposing heat transport through the BSO and STA reveals that the increases in heat transport are entirely the result of changes in temperature, rather than changes in the volume transport (Fig. 4c). The average potential temperature of the inflow through BSO has increased by 0.05 °C yr−1, with a 0.02 °C yr−1 increase in the average temperature of the outflow through STA, despite no significant trends in the volume transport through either opening (Fig. S2 in the Supplement). It should be noted however that there are caveats to this interpretation. Although there is no discernible trend in the net volume transport through BSO or STA, there could indeed be trends in the separate branches which enter and exit through these openings. In particular, the BSO is known to also have an outflowing branch south of Bear Island. The lack of a trend in the net volume transport through BSO certainly does not preclude the existence of a trend in the individual inflowing and outflowing branches in the BSO. Instead, it only requires that those trends must cancel in their contributions to the net transport.
Looking at the relative magnitude of the trends in depth-averaged temperature shows that the trend through STA (0.02 °C yr−1) is nearly as large as the total trend in the ACBC (0.025 °C yr−1) section along the Eurasian shelfbreak. Both the STA and ACBC trends are nearly double the magnitude of the slight trend in temperature through Fram Strait (0.012 °C yr−1), further reinforcing the fact that the increasing temperature of waters exiting through STA, rather than those entering through Fram Strait, is the primary advective source of heat to the ACBC core and thus downstream to the central Arctic basins.
3.3 Heat Fluxes
We assess the change in decadally-averaged turbulent, radiative, and total heat fluxes in the 2020s relative to the 1980s. There is a clear pattern in both the turbulent and total heat fluxes of a reduction in the amount of cooling in the Southern Barents Sea alongside an increase in the amount of cooling in the central/northeastern Barents Sea (Fig. 6a and c). Therefore, while atmospheric cooling efficiency is decreased in the vicinity of the BSO, there is an overcompensating increase in the northeastern Barents Sea. This dipolar pattern is largely the result of the wintertime (DJF) heat flux pattern and appears characteristic of ice edge retreat (Fig. S3 in the Supplement). When the ice edge retreats, water which was south of the ice edge now experiences warmer surface air temperatures and transfer less heat to the atmosphere, while newly ice-free waters remain warmer than surface air temperatures and are now exposed to intense atmospheric forcing, allowing for increased heat loss to the atmosphere. It is also consistent with the modelled pattern of heat flux changes in Shu et al. (2021).
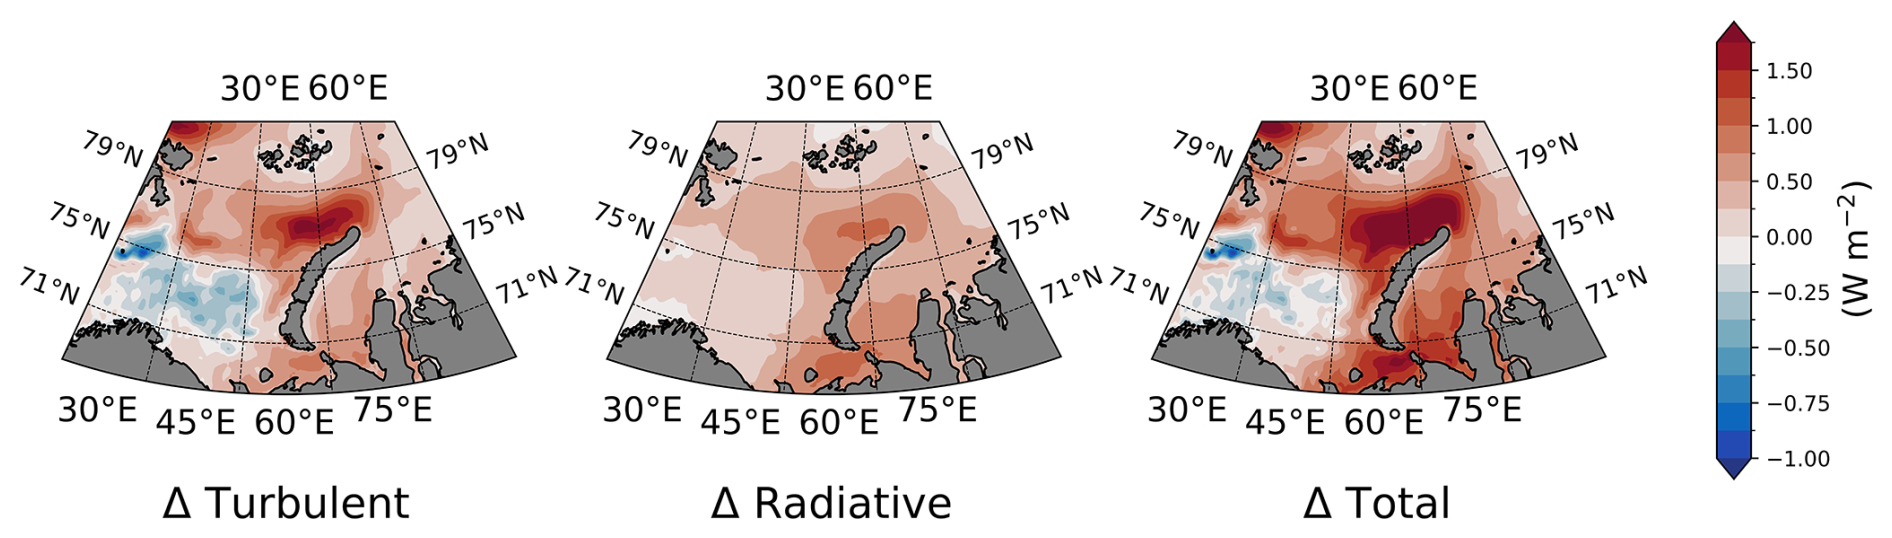
Figure 6Change in decadally-averaged Turbulent, Radiative, and total heat fluxes in the 2020s relative to the 1980s (positive values indicate upward heat flux out of the ocean). Changes in total heat fluxes resemble changes in turbulent heat flux, with increased heat leaving the ocean (resulting in increased cooling) in the northeastern Barents Sea, northwest of Novaya Zemlya, and decreased heat leaving the ocean in the southern Barents Sea (resulting in decreased cooling).
3.4 Denser Waters in the Northeastern Barents Sea
Skagseth et al. (2020) found that heat loss in the southern Barents had decreased, while the overall density had remained constant. We investigate the change in decadally-averaged density in the 2020s relative to the 1980s. Our results agree with the findings of Skagseth et al. (2020) that density in the Southern Barents has remained relatively constant over the previous 40 years, so the warming has been compensated by an increased salinity here. However, a hotspot of increasing density is evident in the northeastern Barents Sea in the vicinity of the new ice edge (Fig. 7a). The increased density is consistent with an increase in mixed layer depth and decrease in base of ML stratification in the northeastern Barents Sea, indicating that the denser waters have resulted in increased vertical mixing and erosion of near-surface stratification (Fig. 7c and d). The ultimate source of this increase in density appears to be an increase in the average salinity of waters in the central Barents Sea (see Fig. S5 in the Supplement). Along with the increase in average temperature of AW entering the Barents Sea, this is consistent with a fingerprint of “Atlantification” whereby the Barents Sea is becoming warmer and more saline, consistent with the properties of Atlantic Water. We note that the changes in salinity in SODA4 (between 0.8–2) are sufficient to explain the large observed changes in density (up to ∼1 kg m−3) over the 40 year period when we evaluate these changes using the TEOS-10 for standard Atlantic Water properties (0–2 °C, >34). In the vicinity of the Bear Island and Kola sections, we can have confidence that the salinity anomalies are likely fairly realistic. However, it is difficult to assess whether the SODA4 salinity anomalies are realistic in regions further away from the Bear Island and Kola sections. Given the sparse observations in the Kara Sea, Eurasian shelfbreak, and St. Anna Trough and the potentially significant freshwater input from river runoff and ice melt, salinity anomalies in the extreme northeastern Barents Sea and St. Anna Trough may be unconstrained.
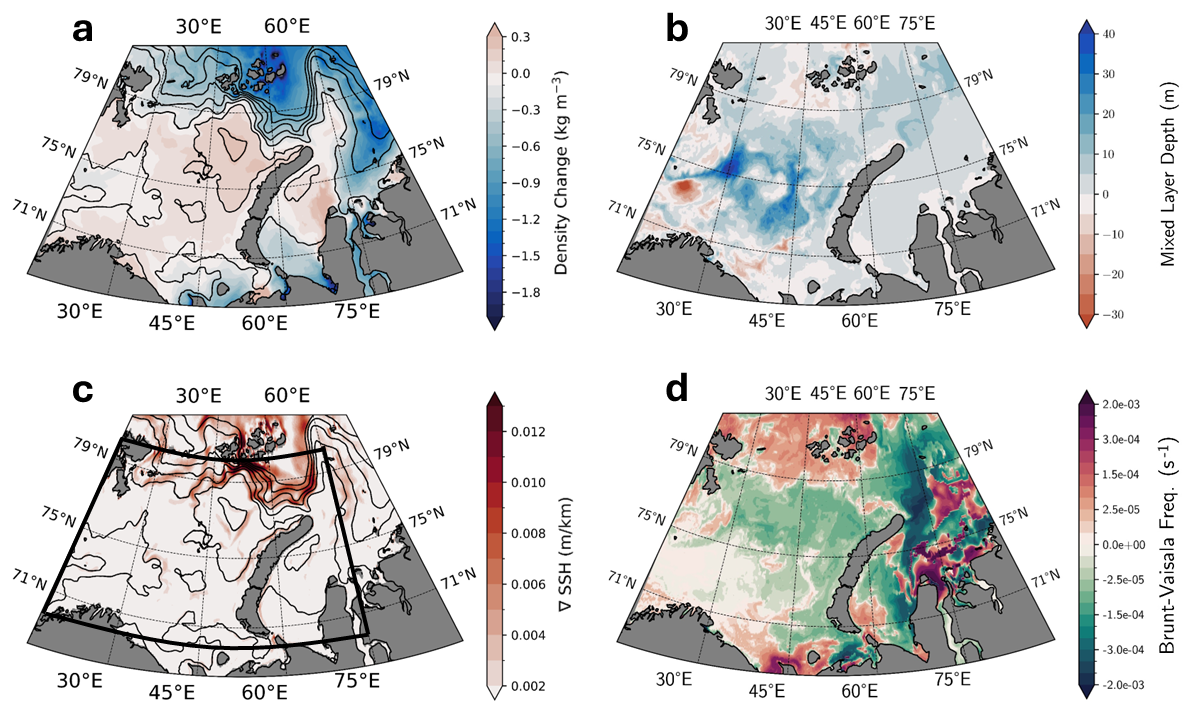
Figure 7Change in decadally-averaged depth-averaged (a) density, (b) mixed layer depth, (c) SSH gradient, and (d) Brunt-Vaisala Frequency for the 2020s relative to the 1980s. SSH anomaly contours are shown as well on (a) and (c). A region of increased density and SSH depression is evident in the northeastern Barents Sea and northern Kara Sea. A black border in panel (c) indicates the region over which SSH gradient is evaluated for the correlation plots in Fig. 8.
3.5 The Ocean Feedback Mechanism
We assess the correlations between the SSH gradient and the outflow through St. Anna Trough over the 40 year time period. There is a positive correlation between the two, with r=0.7 (Fig. 8a). Additionally, there is a positive correlation between the outflow through STA and the inflow through BSO (r=0.87) (Fig. 8b). To assess the time scales over which this relationship acts, the correlation and associated significance between STA and BSO transport and SSH gradient and STA transport are assessed as a function of low-frequency cutoff (Fig. 9). SSH-STA transport correlations fall off sharply after 1 year, becoming insignificant beyond this point. Meanwhile, BSO-STA transport correlations fall off at 4 years, becoming insignificant past this point. Together, these indicate that the relationships between the SSH gradient, STA outflow, and BSO inflow are only coherent at interannual to subdecadal timescales (Fig. 9). The lack of correlation between the BSO inflow and STA outflow at greater-than-interannual timescales is also consistent with the findings that there is no significant trend in the volume transport through either opening over the 40 year period.
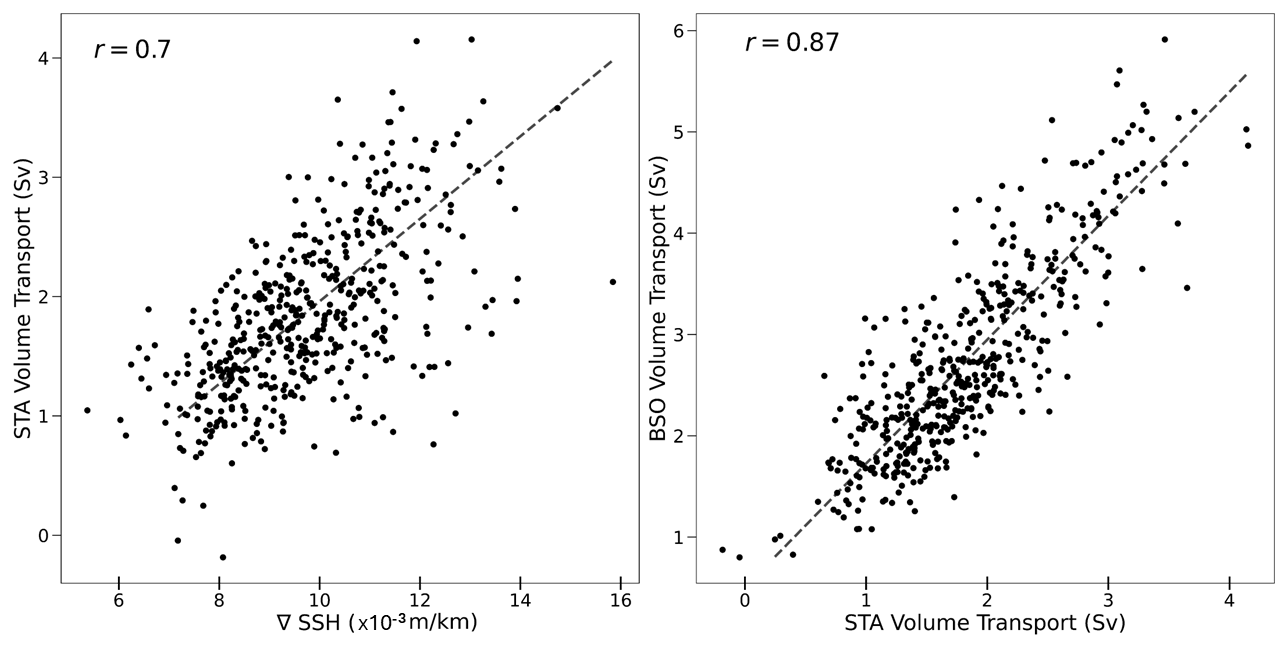
Figure 8Scatter plots of ∇SSH in the NE Barents Sea vs. Volume Transport through STA (left) and Volume Transport through STA vs. Volume transport through BSO (right) with no low frequency cutoff. There is a linear relationship between SSH gradient in the NE Barents and the outflow through STA, as well a linear relationship between the BSO inflow and STA outflow.
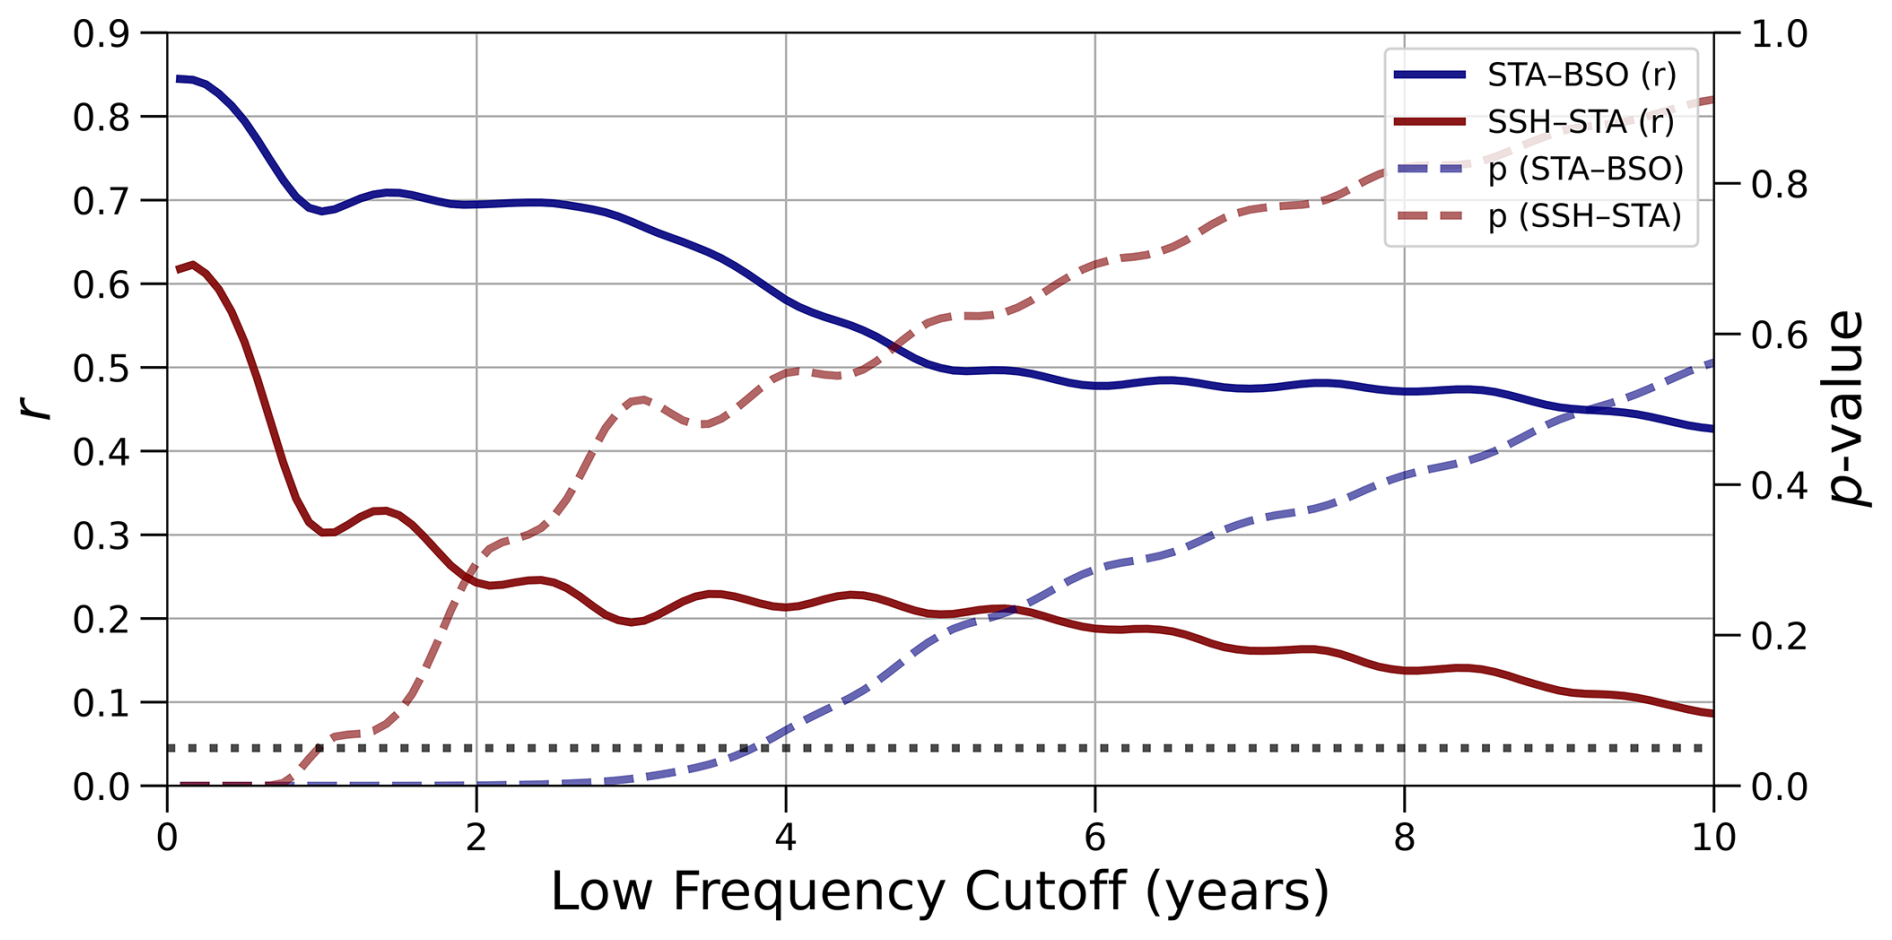
Figure 9Pearson's r and associated significance (p-value) between the low frequency components of the BSO-STA outflows and the SSH-STA outflow as a function of the low frequency cutoff. A p=0.05 threshold is also indicated. There are maxima for both values at the shortest timescales. SSH-STA correlations fall off sharply after 1 year, while BSO-STA correlations become insignificant by the 4 year cutoff.
Collectively with the findings of Sect. 3.4, this produces a revised picture of the ocean feedback mechanism whereby anomalies of denser waters associated with increased salinity drive a depression in SSH in the northeastern Barents Sea resulting in an SSH gradient between the SSH low in the Barents Sea and the SSH high in the Kara Sea. The SSH gradient is clearly evident in the time mean state of SSH, where there is a depression in the Barents Sea and an elevation in the Kara Sea creating an east-west gradient, increasing the northward flow of water from the Barents Sea into the St. Anna Trough (see Fig. S6 in the Supplement). This then incites a barotropic flow through BSO by mass continuity, which brings with it more warm, saline Atlantic Water, which further increases density, reinforcing the feedback loop. The coupling between the BSO net volume transport and STA net volume transport is coherent over slightly longer timescales (up to 4 years), likely because of the multi-year flushing time which is experienced from when water masses enter the Barents Sea to when they leave (a back of the envelope calculation based on the average volume transport of 2.3 Sv from Smedsrud et al. (2010) would suggest this flushing time is ∼4 years).
Notably, when examining the long-term change in each of the components of the feedback, we see that while the salinity and density have both increased (see Figs. 7a and S5), thus reinforcing their contributions to the feedback, SSH has lowered not just in the Barents Sea but in the northern Kara Sea as well (Figs. 7c and S7 in the Supplement). The result of this is a change in the direction of the SSH gradient from a predominantly northward time mean flow to a predominantly recirculating flow where waters from the Kara Sea flow northward into St. Anna Trough but then waters from the St. Anna Trough flow southwest-ward towards the northern Barents Sea. Alongside the increases in salinity and average density, this shift in the SSH field makes the future of the ocean feedback uncertain. Increased salinity and denser waters would support an enhancement of the feedback over time, whereas the long-term shift in SSH would act to weaken the prevailing time-mean SSH gradient.

Figure 10Diagram of the proposed and more detailed modified ocean feedback loop from Smedsrud et al. (2013). Increased salinity and sufficient cooling of incoming AW drives the SSH depression, which along with a persistent SSH high in the Kara sea maintains the northward flow from the Barents Sea into the St. Anna Trough. The processes which drive the feedback are coherent only on sub-decadal timescales.
The Barents Sea is a key moderator of heat and salt transport to the central Arctic Ocean. Historically, the Barents Sea has served as a “cooling machine” where incoming warm and saline AW is cooled into denser water masses before emptying into the Eurasian Basin. However, recent studies have questioned the ongoing efficiency of the cooling machine. Despite its importance to the heat budget of the broader Arctic Ocean and understanding the mechanisms driving the Barents Sea cooling machine, there remain no long-term observational records of heat transport exiting the Barents Sea. To address this lack of observational information, we use the SODA4 reanalysis to assess multi-decadal trends in transport and hydrography in the Barents Sea. We also provide evidence to support a modified version of Smedsrud's original “ocean feedback” mechanism (Smedsrud et al., 2013), which we find to be restricted to sub-decadal timescales.
SODA4 depicts a clear positive trend in the heat transport through both the Barents Sea Opening (0.23 TW yr−1) and the St. Anna Trough (0.11 TW yr−1), which are entirely the result of increases in the average temperature, with little to no change in volume transport over the 40 year period. Of particular note is that despite a decrease in heat loss to the atmosphere in the southern Barents, temperature changes in the 20s relative to the 80s are bottom amplified. This implies that the inflowing water from the Nordic Seas is the primary warming source. The temperature anomalies of SODA4 are consistent with those of the Bear Island and Kola section time series, suggesting that the increase in heat transport as a result of increasing water temperature is also consistent with observations. While the increasing heat transport through BSO is consistent with prior studies, such as Skagseth et al. (2008, 2020), Årthun and Schrum (2010), Wang et al. (2019), it is difficult to compare the magnitude of the trend due to the limited temporal availability of observations which produces significant uncertainty in trend estimates. The primary time series of observations is the Bear Island section which does show the identified increase in mean temperature but does not span the entire BSO and thus cannot be used to estimate the time series of heat transport. While prior studies do find some trend in volume transport (notably the modelling experiments of Wang et al., 2019), these studies also find that there is an even stronger trend in the temperature of the inflow, consistent with our finding that the trend in BSO heat transport is temperature, rather than volume dominated. The trend in heat transport has contributed to a significant warming of the water in the ACBC core, predominantly by reducing the capability of the outflowing water from the Barents Sea to cool overlying AW transported from Fram Strait (which has remained fairly constant in its heat transport). Future work however should be conducted with fully mesoscale-resolving numerical models to understand the exact mechanisms for heat exchange between the Fram Strait Branch and Barents Sea Branch once they combine into the ACBC. A number of studies suggest that mesoscale eddies play an important role in diapycnal mixing along the Eurasian shelfbreak and while these effects may be present in SODA4 and other modern reanalyses, they are certainly not fully resolved (Spall, 2013; Pnyushkov et al., 2018a).
Despite a mitigation in heat exiting the Barents Sea through the STA, the observed trend in STA heat transport still manifests in downstream increases in heat content. These manifestations are evident in the time series of depth-averaged temperature in the ACBC section along the Eurasian shelfbreak, where we identify that the average temperature of the waters in the ACBC have risen by ∼0.025 °C yr−1. This is consistent with the recent findings of Polyakov et al. (2025) which identified that temperatures at observational sections further downstream across the shelfbreak had also increased from the early 2000s to present day. It also provides a potential upstream explanation for the observed increase in heat transport to the Amerasian Basin identified by Eisner et al. (2025).
The ocean feedback mechanism proposed by Smedsrud et al. (2013) suggested that an increase in dense water formation in the Barents Sea sets up an SSH gradient that drives barotropic flow through the Barents Sea, increasing inflow through BSO and outflow through STA. Our results support this hypothesis but only on sub-decadal timescales (see Fig. 9) and provide a modification and more details to the feedback structure. At longer timescales, the outflow through the STA is decoupled from both the BSO inflow and the SSH gradient. Additionally, we find that the dense water formation is associated with surface cooling and high average salinity which drives an SSH depression and subsequent flow from the northeastern Barents Sea into the St. Anna trough. Furthermore, we find that this increase in flow from the Barents Sea into the St. Anna Trough is contingent on the existence of an SSH high in the Kara Sea. This SSH pattern is evident in the time mean structure of SSH, reinforcing that the feedback is a prominent part of the existing circulation. However, the long term changes in SSH show anomalously low SSH in both the Barents and Kara seas, reversing the SSH gradient and associated geostrophic flow. Thsi long-term shift in the SSH gradient should act to weaken the prevailing time-mean geostrophic flow from BSO to STA, but the increases in salinity and denser waters would act to enhance the feedback, thus leaving the future fate of the feedback mechanism uncertain.
These results have significant implications for future understandings of heat transport into the central Arctic. Our results suggest that warming of inflowing AW will continue to be at least partially offset by the Barents Sea cooling machine but that at some point, the excess warming will become great enough so as to overwhelm the capacity of the cooling machine. We also note the relative importance of the Kara Sea and average salinity in maintaining the ocean component of the cooling machine. Therefore, continued modelling efforts from models capable of adequately resolving the Arctic mesoscale as well as observations in the Barents Sea and Kara Sea are critical for determining the ultimate fate of the cooling machine and it's downstream effects on the central Arctic basins.
Time series from Kola and Bear Island Sections (S and T) are available at https://ocean.ices.dk/iroc/ (last access: 10 December 2025). SODA4 output is available at https://dsrs.atmos.umd.edu/DATA (Chepurin et al., 2025b). GLORYS12 was obtained from the E.U. Copernicus Marine Service (https://doi.org/10.48670/moi-00021, E.U. Copernicus Marine Service Information, 2023).
The supplement related to this article is available online at https://doi.org/10.5194/os-22-1073-2026-supplement.
SAE: Conceptualization, Methodology, Software, Formal Analysis, Investigation, Data Curation, Writing – Original Draft, Writing – Review and Editing, Visualization. JAC: Conceptualization, Methodology, Data Curation, Writing – Review and Editing, Resources, Supervision, Project Administration, Funding Acquisition. LC: Data Curation, Methodology, Writing – Review and Editing, Validation, Resources, Supervision, Funding Acquisition. LHS: Methodology and Heat Transport calculations, Writing – Review and Editing.
The contact author has declared that none of the authors has any competing interests.
Publisher's note: Copernicus Publications remains neutral with regard to jurisdictional claims made in the text, published maps, institutional affiliations, or any other geographical representation in this paper. The authors bear the ultimate responsibility for providing appropriate place names. Views expressed in the text are those of the authors and do not necessarily reflect the views of the publisher.
L. Chafik was supported by the ECO2NORSE project funded by the Swedish National Space Agency (Dnr 2022-00172).
L. H. Smedsrud was supported by the Overturning circulation in the new Arctic (ArMOC) project funded by the Norwegian Research Council (Grant 335255).
J. A. Carton and S. E. Eisner were supported by the Physical Oceanography Program (PhOD) of the National Science Foundation (grant no. OCE1948952).
This paper was edited by Agnieszka Beszczynska-Möller and reviewed by two anonymous referees.
Aksenov, Y., Ivanov, V. V., Nurser, A. J. G., Bacon, S., Polyakov, I. V., Coward, A. C., Naveira-Garabato, A. C., and Beszczynska-Moeller, A.: The Arctic Circumpolar Boundary Current, J. Geophys. Res.-Oceans, 116, https://doi.org/10.1029/2010JC006637, 2011. a
Årthun, M. and Schrum, C.: Ocean surface heat flux variability in the Barents Sea, J. Marine Syst., 83, 88–98, https://doi.org/10.1016/j.jmarsys.2010.07.003, 2010. a
Årthun, M., Brakstad, A., Dörr, J., Johnson, H. L., Mans, C., Semper, S., and Våge, K.: Atlantification drives recent strengthening of the Arctic overturning circulation, Science Advances, 11, eadu1794, https://doi.org/10.1126/sciadv.adu1794, 2025. a
Bengtsson, L., Semenov, V. A., and Johannessen, O. M.: The early twentieth-century warming in the Arctic–A possible mechanism, J. Climate, 17, 4045–4057, https://doi.org/10.1175/1520-0442(2004)017<4045:TETWIT>2.0.CO;2, 2004. a
Beszczynska-Möller, A., Fahrbach, E., Schauer, U., and Hansen, E.: Variability in Atlantic water temperature and transport at the entrance to the Arctic Ocean, 1997–2010, ICES J. Mar. Sci., 69, 852–863, https://doi.org/10.1093/icesjms/fss056, 2012. a
Cai, Z., You, Q., Chen, H. W., Zhang, R., Chen, D., Chen, J., Kang, S., and Cohen, J.: Amplified wintertime Barents Sea warming linked to intensified Barents oscillation, Environ. Res. Lett., 17, 044068, https://doi.org/10.1088/1748-9326/ac5bb3, 2022. a
Carton, J. A. and Chepurin, G. A.: RARE: The Regional Arctic Reanalysis, J. Climate, 36, 2333–2348, https://doi.org/10.1175/JCLI-D-22-0340.1, 2023. a
Carton, J. A. and Giese, B. S.: A Reanalysis of Ocean Climate Using Simple Ocean Data Assimilation (SODA), Mon. Weather Rev., 136, 2999–3017, https://doi.org/10.1175/2007MWR1978.1, 2008. a
Carton, J. A. and Santorelli, A.: Global decadal upper-ocean heat content as viewed in nine analyses, J. Climate, 21, 6015–6035, https://doi.org/10.1175/2008JCLI2489.1, 2008. a
Chepurin, G. A., Carton, J. A., Sun, L., and Penny, S. G.: SODA4: a mesoscale ocean/sea ice reanalysis 1980–2024, EGUsphere [preprint], https://doi.org/10.5194/egusphere-2025-3810, 2025a. a, b, c
Chepurin, G., Carton, J., Sun, L., and Penny, S.: SODA4: a mesoscale ocean/sea ice reanalysis 1980–2024, University of Maryland [data set], https://dsrs.atmos.umd.edu/DATA, last access: 1 December 2025b. a
de Boyer Montégut, C., Madec, G., Fischer, A. S., Lazar, A., and Iudicone, D.: Mixed layer depth over the global ocean: An examination of profile data and a profile-based climatology, J. Geophys. Res.-Oceans, 109, https://doi.org/10.1029/2004JC002378, 2004. a
Eisner, S. A., Carton, J. A., and Chafik, L.: Atlantic Water Heat Transport Variability and Trends Into the Amerasian Basin: A First Look Using SODA4, J. Geophys. Res.-Oceans, 130, e2025JC023382, https://doi.org/10.1029/2025JC023382, 2025. a
E.U. Copernicus Marine Service Information: Global Ocean Physics Reanalysis, Marine Data Store [data set], https://doi.org/10.48670/moi-00021, 2023. a
Freeman, E., Woodruff, S. D., Worley, S. J., Lubker, S. J., Kent, E. C., Angel, W. E., Berry, D. I., Brohan, P., Eastman, R., Gates, L., Gloeden, W., Ji, Z., Lawrimore, J., Rayner, N. A., Rosenhagen, G., and Smith, S. R.: ICOADS Release 3.0: a major update to the historical marine climate record, Int. J. Climatol., 37, 2211–2232, https://doi.org/10.1002/joc.4775, 2017. a
Gonzalez-Pola, C., Larsen, K. M. H., Fratantoni, P., and Beszczynska-Möller, A.: ICES Report on Ocean Climate 2021, https://doi.org/10.17895/ices.pub.24755574.v1, 2023. a
Hersbach, H., Bell, B., Berrisford, P., Hirahara, S., Horányi, A., Muñoz-Sabater, J., Nicolas, J., Peubey, C., Radu, R., Schepers, D., Simmons, A., Soci, C., Abdalla, S., Abellan, X., Balsamo, G., Bechtold, P., Biavati, G., Bidlot, J., Bonavita, M., De Chiara, G., Dahlgren, P., Dee, D., Diamantakis, M., Dragani, R., Flemming, J., Forbes, R., Fuentes, M., Geer, A., Haimberger, L., Healy, S., Hogan, R. J., Hólm, E., Janisková, M., Keeley, S., Laloyaux, P., Lopez, P., Lupu, C., Radnoti, G., de Rosnay, P., Rozum, I., Vamborg, F., Villaume, S., and Thépaut, J.-N.: The ERA5 global reanalysis, Q. J. Roy. Meteor. Soc., 146, 1999–2049, https://doi.org/10.1002/qj.3803, 2020. a
Heukamp, F. O., Kanzow, T., Wang, Q., Wekerle, C., and Gerdes, R.: Impact of cyclonic wind anomalies caused by massive winter sea ice retreat in the Barents Sea on Atlantic Water transport toward the Arctic: A model study, J. Geophys. Res.-Oceans, 128, e2022JC019045, https://doi.org/10.1029/2022JC019045, 2023. a
Holliday, N. P., Bersch, M., Berx, B., Chafik, L., Cunningham, S., Florindo-López, C., Hátún, H., Johns, W., Josey, S. A., Larsen, K. M. H., Mulet, S., Oltmanns, M., Reverdin, G., Rossby, T., Thierry, V., Valdimarsson, H., and Yashayaev, I.: Ocean Circulation Causes the Largest Freshening Event for 120 Years in Eastern Subpolar North Atlantic, Nat. Commun., 11, 585, https://doi.org/10.1038/s41467-020-14474-y, 2020. a
Ikeda, M.: Decadal oscillations of the air-ice-ocean system in the Northern Hemisphere, Atmos. Ocean, 28, 106–139, https://doi.org/10.1080/07055900.1990.9649369, 1990. a
Ingvaldsen, R. B., Assmann, K. M., Primicerio, R., Fossheim, M., Polyakov, I. V., and Dolgov, A. V.: Physical manifestations and ecological implications of Arctic Atlantification, Nature Reviews Earth and Environment, 2, 874–889, https://doi.org/10.1038/s43017-021-00228-x, 2021. a
Jonasson, O., Gladkova, I., and Ignatov, A.: Towards global daily gridded super-collated SST product from low earth orbiting satellites (L3S-LEO-Daily) at NOAA, in: Ocean Sensing and Monitoring XIV, vol. 12118, SPIE, 40–51, https://doi.org/10.1117/12.2620103, 2022a. a
Jonasson, O., Ignatov, A., Pryamitsyn, V., Petrenko, B., and Kihai, Y.: JPSS VIIRS SST Reanalysis Version 3, Remote Sens.-Basel, 14, 3476, https://doi.org/10.3390/rs14143476, 2022b. a
Karspeck, A. R., Stammer, D., Köhl, A., Danabasoglu, G., Balmaseda, M., Smith, D. M., Fujii, Y., Zhang, S., Giese, B., Tsujino, H., and Rosati, A.: Comparison of the Atlantic Meridional Overturning Circulation between 1960 and 2007 in Six Ocean Reanalysis Products, Clim. Dynam., 49, 957–982, https://doi.org/10.1007/s00382-015-2787-7, 2017. a
Lellouche, J.-M., Eric, G., Romain, B.-B., Gilles, G., Angélique, M., Marie, D., Clément, B., Mathieu, H., Olivier, L. G., Charly, R., Candela, T., Testut, C.-E., Gasparin, F., Ruggiero, G., Benkiran, M., Drillet, Y., and Le Traon, P.-Y.: The Copernicus global 1/12 oceanic and sea ice GLORYS12 reanalysis, Front. Earth Sci., 9, 698876, https://doi.org/10.3389/feart.2021.698876, 2021. a
Mishonov, A. V., Boyer, T. P., Baranova, O. K., Bouchard, C. N., Cross, S. L., Garcia, H. E., Locarnini, R. A., Paver, C. R., Reagan, J. R., Wang, Z., Seidov, D., Grodsky, A. I., and Beauchamp, J. G.: World Ocean Database 2023, https://doi.org/10.25923/z885-h264, 2024. a
Onarheim, I. H. and Årthun, M.: Toward an ice-free Barents Sea, Geophys. Res. Lett., 44, 8387–8395, https://doi.org/10.1002/2017GL074304, 2017. a
Onarheim, I. H., Eldevik, T., Smedsrud, L. H., and Stroeve, J. C.: Seasonal and regional manifestation of Arctic sea ice loss, J. Climate, 31, 4917–4932, https://doi.org/10.1002/2017GL074304, 2018. a
Pnyushkov, A., Polyakov, I. V., Padman, L., and Nguyen, A. T.: Structure and dynamics of mesoscale eddies over the Laptev Sea continental slope in the Arctic Ocean, Ocean Sci., 14, 1329–1347, https://doi.org/10.5194/os-14-1329-2018, 2018a. a
Pnyushkov, A. V., Polyakov, I. V., Rember, R., Ivanov, V. V., Alkire, M. B., Ashik, I. M., Baumann, T. M., Alekseev, G. V., and Sundfjord, A.: Heat, salt, and volume transports in the eastern Eurasian Basin of the Arctic Ocean from 2 years of mooring observations, Ocean Sci., 14, 1349–1371, https://doi.org/10.5194/os-14-1349-2018, 2018b. a, b
Pnyushkov, A. V., Polyakov, I. V., Alekseev, G., Ashik, I., Baumann, T. M., Carmack, E., Ivanov, V., and Rember, R.: A steady regime of volume and heat transports in the eastern Arctic Ocean in the early 21st century, Frontiers in Marine Science, 8, 705608, https://doi.org/10.3389/fmars.2021.705608, 2021. a
Polyakov, I. V., Pnyushkov, A. V., Charette, M., Cho, K.-H., Jung, J., Kipp, L., Muilwijk, M., Whitmore, L., Yang, E. J., and Yoo, J.: Atlantification advances into the Amerasian Basin of the Arctic Ocean, Science Advances, 11, eadq7580, https://doi.org/10.1126/sciadv.adq7580, 2025. a
Reagan, J. R., Boyer, T. P., García, H. E., Locarnini, R. A., Baranova, O. K., Bouchard, C., Cross, S. L., Mishonov, A. V., Paver, C. R., Seidov, D., Wang, Z., and Dukhovskoy, D.: World Ocean Atlas 2023, https://doi.org/10.25921/va26-hv25, 2023. a
Rudels, B., Friedrich, H. J., and Quadfasel, D.: The Arctic circumpolar boundary current, Deep-Sea Res. Pt. II, 46, 1023–1062, https://doi.org/10.1016/S0967-0645(99)00015-6, 1999. a
Schauer, U., Loeng, H., Rudels, B., Ozhigin, V. K., and Dieck, W.: Atlantic water flow through the Barents and Kara Seas, Deep-Sea Res. Pt. I, 49, 2281–2298, https://doi.org/10.1016/S0967-0637(02)00125-5, 2002. a
Shu, Q., Wang, Q., Song, Z., and Qiao, F.: The poleward enhanced Arctic Ocean cooling machine in a warming climate, Nat. Commun., 12, 2966, https://doi.org/10.1038/s41467-021-23321-7, 2021. a, b
Skagseth, Ø., Furevik, T., Ingvaldsen, R., Loeng, H., Mork, K. A., Orvik, K. A., and Ozhigin, V.: Volume and heat transports to the Arctic Ocean via the Norwegian and Barents Seas, in: Arctic–subarctic ocean fluxes: Defining the role of the northern seas in climate, 45–64, https://doi.org/10.1007/978-1-4020-6774-7_3, 2008. a, b
Skagseth, Ø., Eldevik, T., Årthun, M., Asbjørnsen, H., Lien, V. S., and Smedsrud, L. H.: Reduced efficiency of the Barents Sea cooling machine, Nat. Clim. Change, 10, 661–666, https://doi.org/10.1038/s41558-020-0772-6, 2020. a, b, c, d, e, f
Smedsrud, L. H., Ingvaldsen, R., Nilsen, J. E. Ø., and Skagseth, Ø.: Heat in the Barents Sea: transport, storage, and surface fluxes, Ocean Sci., 6, 219–234, https://doi.org/10.5194/os-6-219-2010, 2010. a, b, c, d, e, f, g, h, i
Smedsrud, L. H., Esau, I., Ingvaldsen, R. B., Eldevik, T., Haugan, P. M., Li, C., Lien, V. S., Olsen, A., Omar, A. M., Otterå, O. H., Risebrobakken, B., Sandø, A. B., Semenov, V. A., and Sorokina, S. A.: The role of the Barents Sea in the Arctic climate system, Rev. Geophys., 51, 415–449, https://doi.org/10.1002/rog.20017, 2013. a, b, c, d, e, f
Smedsrud, L. H., Muilwijk, M., Brakstad, A., Madonna, E., Lauvset, S. K., Spensberger, C., Born, A., Eldevik, T., Drange, H., Jeansson, E., Li, C., Olsen, A., Skagseth, Ø., Slater, D. A., Straneo, F., Våge, K., and Årthun, M.: Nordic Seas Heat Loss, Atlantic Inflow, and Arctic Sea Ice Cover Over the Last Century, Rev. Geophys., 60, e2020RG000725, https://doi.org/10.1029/2020RG000725, 2022. a
Spall, M. A.: On the circulation of Atlantic Water in the Arctic Ocean, J. Phys. Oceanogr, 43, 2352–2371, https://doi.org/10.1175/JPO-D-13-079.1, 2013. a
Uotila, P., Goosse, H., Haines, K., Chevallier, M., Barthélemy, A., Bricaud, C., Carton, J., Fučkar, N., Garric, G., Iovino, D., Kauker, F., Korhonen, M., Lien, V. S., Marnela, M., Massonnet, F., Mignac, D., Peterson, K. A., Sadikni, R., Shi, L., Tietsche, S., Toyoda, T., Xie, J., and Zhang, Z.: An Assessment of Ten Ocean Reanalyses in the Polar Regions, Clim. Dynam., 52, 1613–1650, https://doi.org/10.1007/s00382-018-4242-z, 2019. a
Wang, Q., Wang, X., Wekerle, C., Danilov, S., Jung, T., Koldunov, N., Lind, S., Sein, D., Shu, Q., and Sidorenko, D.: Ocean heat transport into the Barents Sea: Distinct controls on the upward trend and interannual variability, Geophys. Res. Lett., 46, 13180–13190, https://doi.org/10.1029/2019GL083837, 2019. a, b
Woodgate, R. A., Aagaard, K., Muench, R. D., Gunn, J., Björk, G., Rudels, B., Roach, A., and Schauer, U.: The Arctic Ocean boundary current along the Eurasian slope and the adjacent Lomonosov Ridge: Water mass properties, transports and transformations from moored instruments, Deep-Sea Res. Pt. I, 48, 1757–1792, https://doi.org/10.1016/S0967-0637(00)00091-1, 2001. a, b