the Creative Commons Attribution 4.0 License.
the Creative Commons Attribution 4.0 License.
 | 06 Jul 2022
Nonlocal and local wind forcing dependence of the Atlantic meridional overturning circulation and its depth scale
Tim Rohrschneider
Johanna Baehr
Veit Lüschow
Dian Putrasahan
Jochem Marotzke
We use wind sensitivity experiments to understand the wind forcing dependencies of the level of no motion as the depth of maximum overturning and the e-folding pycnocline scale, as well as their relationship to northward transport of the mid-depth Atlantic meridional overturning circulation (AMOC) which extends vertically to the depth of maximum overturning of the upper AMOC cell. In contrast to previous studies, we investigate the interplay of nonlocal and local wind effects on a decadal timescale. We use 30-year simulations with a high-resolution ocean general circulation model (OGCM) which is an eddy-resolving version of the Max Planck Institute for Meteorology ocean model (MPIOM). Our findings deviate from the common perspective that the AMOC is a nonlocal phenomenon only, because northward transport and its depth scales depend on both nonlocal Southern Ocean wind effects and local wind effects in the Northern Hemisphere downwelling region where Ekman pumping takes place. Southern Ocean wind forcing predominantly determines the magnitude of the pycnocline scale throughout the basin, whereas Northern Hemisphere winds additionally influence the level of no motion locally. In that respect, the level of no motion is a better proxy for northward transport and mid-depth velocity profiles than the pycnocline scale, since the wind forcing dependencies of the level of no motion and maximum overturning are equal. The changes in maximum overturning with wind forcing are explained by the changes in the level of no motion only. This is because wind-driven Ekman compensation is baroclinic and occurs above the level of no motion, and the internal vertical velocity shear that is not influenced by the external Ekman cells stays approximately constant. The analysis of the wind experiments suggests a hemisphere-dependent scaling of the strength of AMOC. We put forward the idea that the ability of numerical models to capture the spatial and temporal variations of the level of no motion is crucial to reproduce the mid-depth cell in an appropriate way both quantitatively and dynamically.
- Article
(6148 KB) - Full-text XML
- BibTeX
- EndNote


To date and despite a wide range of theoretical and experimental studies, we do not fully understand inter-hemispheric overturning of the mid-depth cell in the Atlantic and the role of Southern and Northern Hemisphere processes like the response to changes in the surface winds. Current understanding of the Atlantic meridional overturning circulation (AMOC) suggests an interplay between adiabatic pole-to-pole overturning (e.g., Toggweiler and Samuels, 1995; Wolfe and Cessi, 2011) and low-latitude diabatic forcing that establishes a balance between downwelling of heat and upwelling of deep waters (e.g., Munk and Wunsch, 1998; Marotzke, 1997). Especially in connection to Southern Ocean processes and the Antarctic circumpolar current (ACC), the effect of winds on the AMOC and basin-wide density stratification has gained considerable attention during the past two decades (e.g., Marshall and Speer, 2012; Johnson et al., 2019). Poorly understood, however, is the influence of winds on inter-hemispheric overturning in the Atlantic away from the surface Ekman layer. This paper presents an analysis of wind sensitivity experiments in order to provide insight into the wind forcing dependence of the inter-hemispheric circulation by understanding the behavior of the depth scale(s) of the AMOC. We focus on the response of the AMOC to wind forcing on a decadal timescale, after the realization of major adjustments.
We focus on the inter-hemispheric region 30∘ S–30∘ N and analyze the interplay of nonlocal wind forcing over the Southern Ocean and local wind forcing in the Northern Hemisphere downwelling region where Ekman pumping takes place. The wind forcing dependence of the AMOC is thus analyzed away from the lateral boundaries. The absence of continental barriers in the Southern Ocean and the strong input of momentum at the surface establishes a deep-reaching Ekman overturning cell. The steepening of isopycnals, which is compensated by baroclinic instability that induces an eddy field, is thought to influence deep stratification and northward transport throughout the basin (e.g., Vallis, 2000; Klinger and Cruz, 2009; Allison et al., 2011). The zonal periodicity of the ACC boosts the strength of the AMOC in response to an increase in Southern Ocean wind forcing (Klinger et al., 2003, 2004). By contrast, the local influence of Northern Hemisphere winds on the AMOC is less understood, and previous results do not agree with each other. Tsujino and Suginohara (1998) propose an enhancement of the thermohaline circulation due to a wind-driven buoyancy gain in the upwelling region of the Northern Hemisphere north of the inter-hemispheric region, whereas Cessi (2018) finds that the inter-hemispheric cell weakens in response to increased westerlies at the northern high latitudes. These studies consider the influence of the subpolar gyre on the AMOC. When considering the Northern Hemisphere downwelling region at low and mid-latitudes, the local influence of Northern Hemisphere wind forcing on the AMOC is commonly ignored. An exception is Cabanes et al. (2008) who indicate that wind stress curl variations may play a crucial role in setting the AMOC shear component, which is altered by the surface forcing according to their study. We address the question of how changes in both nonlocal and local wind forcing influence the AMOC. We hypothesize that the influence of Northern Hemisphere winds on AMOC strength and depth is substantial.
We postulate that we can understand the wind forcing dependence of the AMOC by the behavior of its depth scales. Theoretical scaling relationships provide conceptual understanding and provide an estimate of the strength of the AMOC in response to different forcings. Nowadays, the most common analytical model to describe meridional overturning of the upper branch of the AMOC is the pycnocline model (Gnanadesikan, 1999). According to this model, the vertically integrated northward transport in the Northern Hemisphere is proportional to the basin-averaged e-folding pycnocline scale, a measure for density stratification. The deeper the pycnocline scale, the stronger the transport, with the assumption that zonal or meridional density gradients are fixed. The depth scale itself is determined by Southern Ocean winds and eddies, diapycnal upwelling in the tropics, and North Atlantic deep water formation. In the same manner, a wide range of theoretical studies or scaling arguments rely on the assumption that the pycnocline scale translates a zonal or meridional density gradient into horizontal force that drives northward flow (e.g., Robinson and Stommel, 1959; Bryan, 1987; Marotzke, 1997; Marotzke and Klinger, 2000). The majority of the different scalings use the thermal wind relation which is based on the geostrophic and hydrostatic approximations of the momentum equations. The left-hand side represents the vertical shear of the zonal-mean meridional velocity, Δρx is the west–east density difference, g is the gravitational force, ρ0 is a reference density, f is the Coriolis parameter, and Lx is the zonal extent. The thermal wind relation is also key for reconstructing the AMOC strength using observations of boundary densities (Hirschi et al., 2003; Baehr et al., 2004; Hirschi and Marotzke, 2007; Baehr et al., 2009). In general, the theoretical and experimental studies have in common that they integrate vertical shear or zonal or meridional density gradients twice in the vertical, ψ∝Δρ η2, where ψ is the strength of northward overturning, Δρ is the density gradient, and η is the depth scale. Different assumptions like advective-diffusive balance modify the simple scaling relationship considered here.
The nonequivalence of different depth scales of the AMOC has first been noted in Scott (2000), and recent studies put into question whether the pycnocline scale is the appropriate depth scale to estimate the AMOC strength. For instance, Levermann and Fuerst (2010) find that the pycnocline scale and meridional density gradients are mutually independent. Using a coarse-resolution model, Griesel and Maqueda (2006) show that the pycnocline scale does not scale northward transport in experiments in which density gradients are artificially modified. In this connection, DeBoer et al. (2010) find that the depth of maximum overturning (level of no motion) is a more appropriate parameter to scale maximum overturning. Shakespeare and Hogg (2012) use the depth scales of the overturning extrema to build an analytical model for both the mid-depth cell and the abyssal ocean. Finally, Marshall and Johnson (2017) combine the depth of maximum overturning and the e-folding pycnocline scale to express the relative strength of the ACC and the AMOC. The present study addresses the wind forcing dependencies of the level of no motion, pycnocline scale, and northward transport. Understanding the wind forcing dependence of the AMOC by understanding its depth scales represents a 2-fold research question. On the one hand, the changing depth scales can be a stepping stone toward understanding the wind forcing dependence of the AMOC; on the other hand, we discuss whether the depth scales are valid proxies for northward transport. We hypothesize that the level of no motion is a proxy for northward transport in the inter-hemispheric cell because the background vertical velocity shear of the meridional velocity may stay constant under changing wind forcing. We demonstrate that, using the level of no motion, the flow can be subdivided into internal flow and external flow, because the wind-forced Ekman cells, which give the Ekman transport and its compensation, are found to be baroclinic and cancel out by vertical integration above the level of no motion. The internal flow is directly related to the AMOC wind forcing dependence.
To answer the specific questions that are outlined above, we use 30-year wind experiments with a high-resolution ocean general circulation model (OGCM). We expect a robust response of the AMOC on a decadal timescale because major adjustments by basin-wide wave propagation are realized on this timescale. The basin-wide transmission of density signals by wave propagation occurs on a pentadal and decadal timescale. Limiting the analysis to the adjustment on a decadal timescale makes it possible to use presumably more realistic eddy-resolving wind experiments rather than fully equilibrated low-resolution model runs. In this way we avoid uncertainties introduced by eddy parameterization. High-resolution model output is needed because we analyze the relationships between depth scales as reference depths and meridional transport and its vertical velocity shear. These relationships depend sensitively on the vertical and horizontal model resolution as wave propagation of density signals does.
To the best of our knowledge and despite a wide range of theoretical and modeling studies on the Atlantic circulation, the research questions of this study have never been answered in an explicit way. We analyze whether the depth scales are proxies for northward transport in the inter-hemispheric cell, and we ask whether we should adopt a more nonlocal or local perspective with respect to inter-hemispheric overturning and hemispheric differences.
In the following section we briefly describe the different experiments and the experimental strategy. In Sect. 3 we describe the differences in density stratification with the changes in wind forcing as well as the wind forcing dependencies of the level of no motion, the pycnocline scale, and northward transport. In Sect. 4 we analyze the relationship between velocity profiles or shear and the depth scales.
2.1 Numerical model and experiments
We use wind experiments conducted with a vertically and horizontally high-resolution, eddying configuration of the Max Planck Institute for Meteorology ocean model (MPIOM). The version is called TP6ML80 and has been developed within the German Consortium project STORM (von Storch et al., 2012). It is based on a tripolar grid with a horizontal resolution of 0.1∘ and a vertical resolution of 80 unevenly spaced levels. Compared with low-resolution MPIOM versions, we assume better model physics in terms of the resolution of mesoscale eddies as well as wave propagation. Gutjahr et al. (2019) already indicate that the high-resolution MPIOM configuration reveals the most realistic simulation compared with low-resolution MPIOM versions in terms of the mean state of the ocean. For instance, a cold bias in sea surface temperature over the Southern Ocean is strongly reduced, because the resolved eddies better influence the flattening and cropping of isopycnals compared with the Gent–McWilliams thickness diffusivity parameterization (Gent et al., 1995). We do not expect that the wind forcing dependence of the AMOC depth scales differs between high- and low-resolution model runs; however, the horizontal transmission of density signals is sensitive to the horizontal model grid, and the accumulation of vertical shear is sensitive to the vertical model grid.
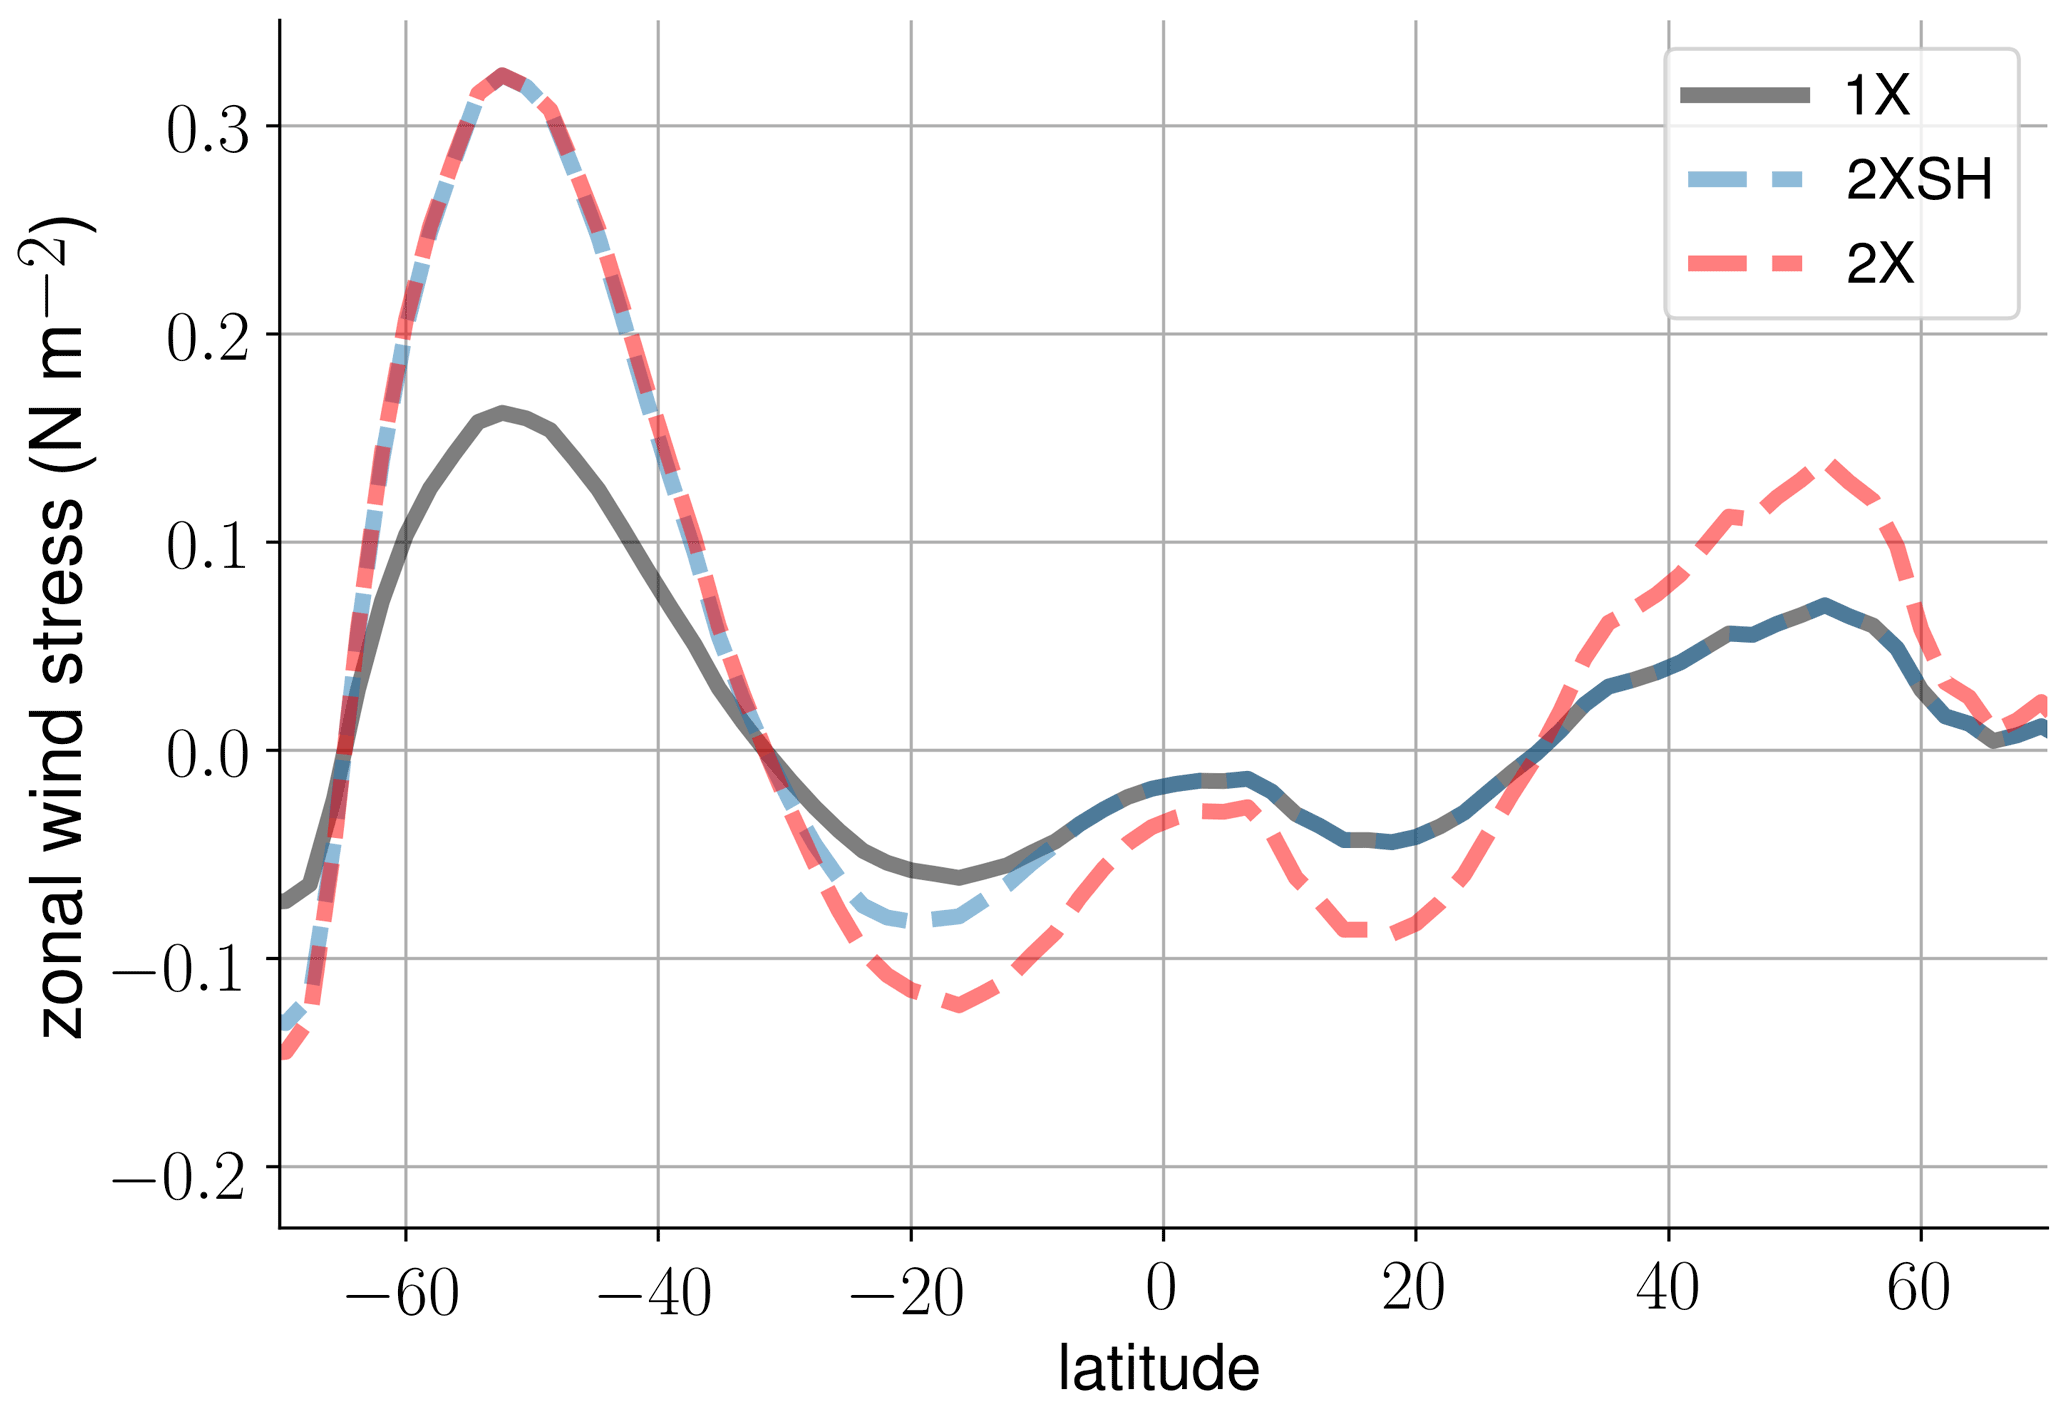
Figure 1The zonal-mean zonal wind stress in the 1X experiment (black), 2XSH experiment (blue), and 2X experiment (red) (from Lüschow et al., 2021).
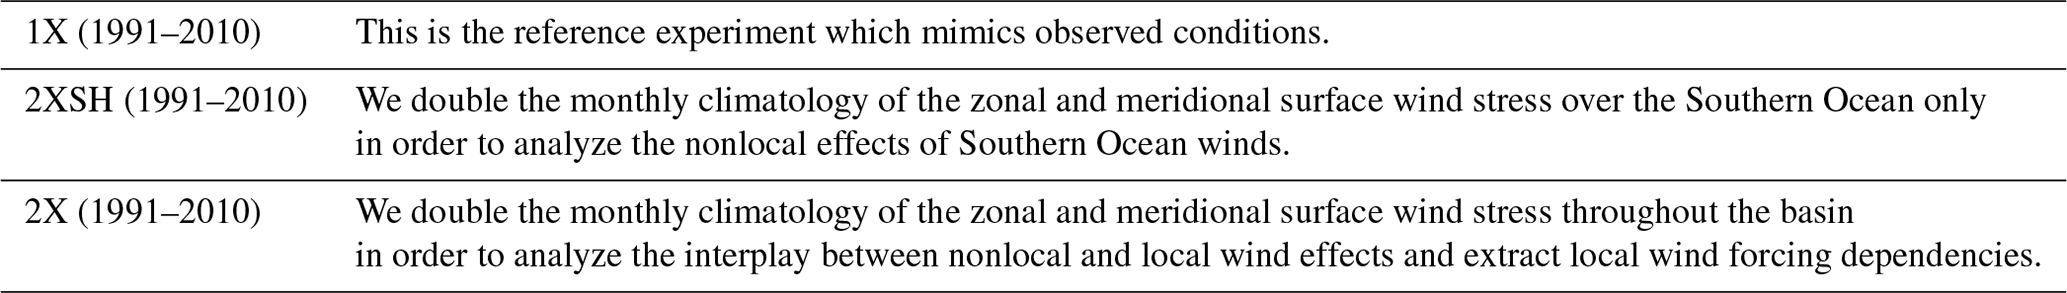
We have available three different wind experiments with realistic geometry (Table 1) (Lüschow et al., 2021). In the 1X experiment, the standard surface momentum and buoyancy fluxes from NCEP–NCAR reanalysis-1 (Kalnay et al., 2018) are applied. We are not interested in high-frequency variability and therefore change the monthly-mean climatology of the surface wind stress only. We add them to the daily anomalies. In the 2XSH experiment, the monthly climatology of the zonal and meridional surface wind stress is doubled only over the Southern Ocean. By applying a sine function which declines to zero towards the Equator in the Southern Hemisphere, we obtain a smooth transition of the surface wind stress towards the original surface momentum fluxes. In the 2X experiment, we double the monthly climatology of the zonal and meridional surface wind stress in both the northern and Southern Hemispheres throughout the basin. Figure 1 shows the climatology of the zonal surface wind stress of the different experiments. The wind experiments are initialized with the state of the 1X experiment, and the wind forcing is switched on at year 1980. Because the computational costs for an eddy-resolving simulation are still large, the simulation period is only until year 2010. Using monthly-mean output, we focus on the time window 1991–2010 after the realization of major adjustments to the changes in the surface wind stress, in order to analyze the AMOC response to forcing. That is, we allow for a decadal adjustment of the AMOC and density field towards stationarity before using the model time series. Analyzing the decadal response of the AMOC to Southern Ocean wind forcing, Klinger and Cruz (2009) show that the AMOC in the source region adjusts on an inter-annual timescale. Lüschow et al. (2021) discuss the adequacy of the wind experiments in terms of integration length.
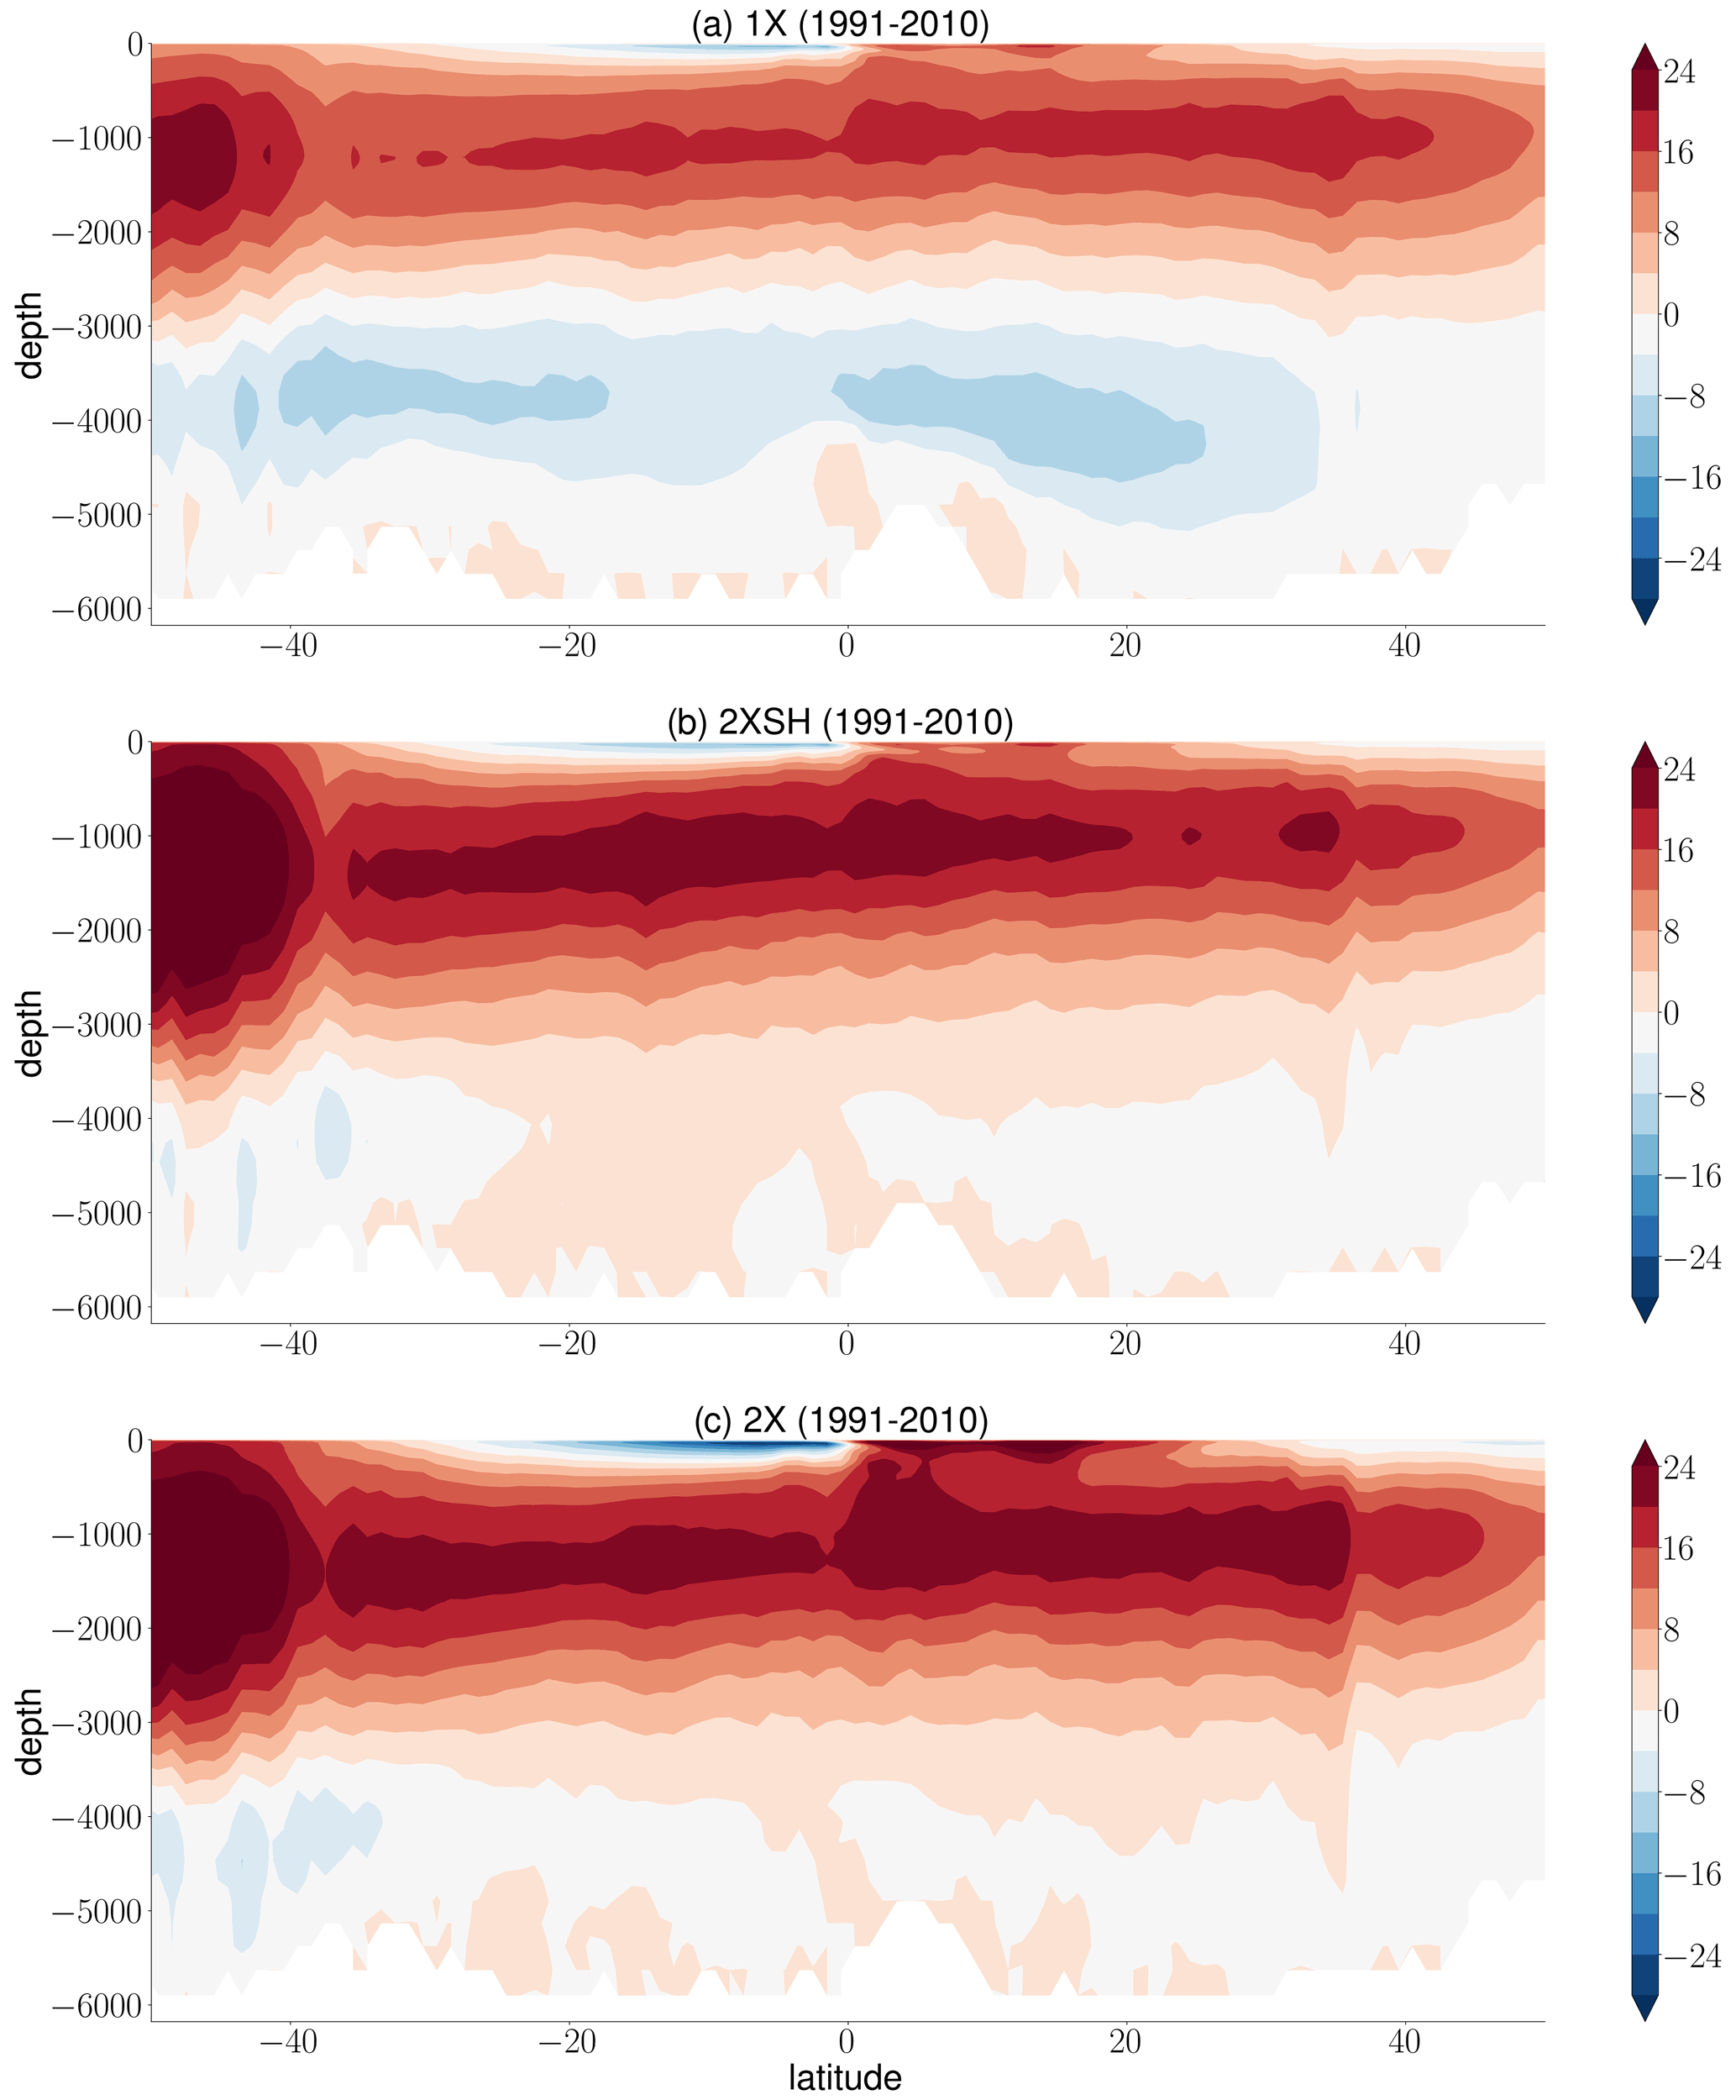
Figure 2The time-mean AMOC streamfunctions (1991–2010) in the (a) 1X experiment, (b) 2XSH experiment, and (c) 2X experiment.
2.2 Experimental strategy and quantities
The AMOC is described by the overturning streamfunction in the latitude-depth section, , where v is the meridional velocity, z is the depth with D the depth at the bottom of the ocean column, and xe and xw are the eastern and western boundaries of the Atlantic basin.
We focus on the upper, northward flowing branch of the mid-depth cell which rotates clockwise, viewed from the east. Figure 2a–c show the time-mean (1991–2010) overturning cells in the wind experiments. Analyzing the AMOC in the inter-hemispheric region 30∘ S–30∘ N south and north of the Equator, we explore the nonlocal response to changes in Southern Ocean winds and local wind effects in the downwelling region of the Northern Hemisphere. In general, the mid-depth cell strengthens with higher wind forcing over the Southern Ocean. However, from Fig. 2 alone we cannot capture the details of the meridional velocities in terms of spatial variations that may influence the relationship between overturning and its depth. The northward flow seems to be continuous and contiguous throughout the basin, but regional dynamics may give rise to local wind forcing dependencies of the AMOC which can be hardly identified away from the surface Ekman layer. The surface Ekman flux, for instance, is compensated by an interior return flow which changes the meridional transport at different depths. Furthermore, the wind stress curl over the basin imposes a forcing that may change stratification and the meridional transport and its depth locally.
We limit our analysis of the different experiments to a set of quantities (Table 2). The level of no motion of the mid-depth cell is the depth of maximum overturning where zonally averaged velocities reverse in sign, ηψ=zψ(max). We use the monthly-mean outcome of the related quantities and subsequently take the time mean (1991–2010). In doing so, we describe in more detail the behavior of the level of no motion and its relationship to northward transport. Note that the level of no motion incorporates nonlinearities because it is an integrated quantity and related to the zonal-mean meridional velocity. The level of no motion is not a zonal-mean quantity that is averaged over the zonal extent. Furthermore, we prevent the algorithm from selecting a model level within the depth range of the surface Ekman layer or perturbations that emerge from equatorial upwelling.
The pycnocline scale is the single-mode e-folding scale for vertical density stratification, and the profile of the latter is assumed to be exponential and self-similar. We use the following fitting algorithm at each grid cell and subsequently take the zonal and temporal mean, (Gnanadesikan, 1999; Gnanadesikan et al., 2007; DeBoer et al., 2010). The reference depth is m, and ρr is the potential density at the reference depth. Using this algorithm we take the e-folding scale twice. In this way, 80 %–90 % of the vertical density change is scaled, which scales the upper branch of the mid-depth cell. In some regions, especially at the lateral margins of the basin, the profile for vertical density stratification may become more linear and deviate from an exponential profile. However, such deviations from a perfectly exponential profile do not restrict the ability of the pycnocline scale to characterize density stratification in different regions in the sense that it is an independent measure as long as density increases with depth.
We use a third depth scale and compute the advective depth ηw in order to provide the linkages between the differences in the wind stress curl, the differences in the density field ρ, and the depth scales. The advective depth scale gives the vertical depth range for local Ekman pumping and thereby scales the maximum change in density stratification associated with changing wind stress curl. Theory of wind-driven changes in stratification can be traced back to the development of the planetary geostrophic equations (e.g., Welander, 1959; Bryan, 1987) and the related theory on the ventilated thermocline in the subtropical region (Luyten et al., 1983). Classical scaling of the thermocline equations suggests that the advective depth scale is directly proportional to the square root of the local Ekman pumping velocity WE (e.g., Vallis, 2000), , where f is the Coriolis parameter, L is the basin width, and g′ is the reduced gravity. We compute the local Ekman pumping velocity WE from the wind stress data of the wind experiments.
During the course of our study we analyze both the total maximum overturning streamfunction ψt and the geostrophic approximation of the maximum overturning streamfunction ψg, defined as the total streamfunction minus the surface Ekman flux. We compute both ψt and ψg because their wind forcing dependencies should be fundamentally different due to the interior, geostrophic return flow of the surface Ekman flux. In this way, we analyze the relationship between overturning and its depth using vertically integrated transport that may depend on the ageostrophic surface component.
We use the zonal surface wind stress τx to compute the strength of the surface meridional Ekman transport, , where ρ0 is the reference density and f the Coriolis parameter. We do not subtract the interior return flow of the surface Ekman flux. For the sake of simplicity a range of studies assumes that the interior return flow of the surface Ekman flux is barotropic even on longer than a monthly timescale (e.g., Hirschi and Marotzke, 2007; Moreno-Chamarro, al., 2016). Based on an idealized experiment with an OGCM, a recent study demonstrates that the return flow is baroclinic and has strong contributions at the upper levels of the ocean on the timescale considered here (Williams and Roussenov, 2014). On a monthly timescale, anomalies of the return flow are barotropic because the density field does not adjust (e.g., Jayne and Marotzke, 2001), but these anomalies are negligible in the setup presented in this study and by their nature do not change the time-mean outcome. Later, in Sect. 4, we support the perspective that the interior return flow of the surface Ekman flux is baroclinic. This finding has been demonstrated theoretically by McCreary and Lu (1994).
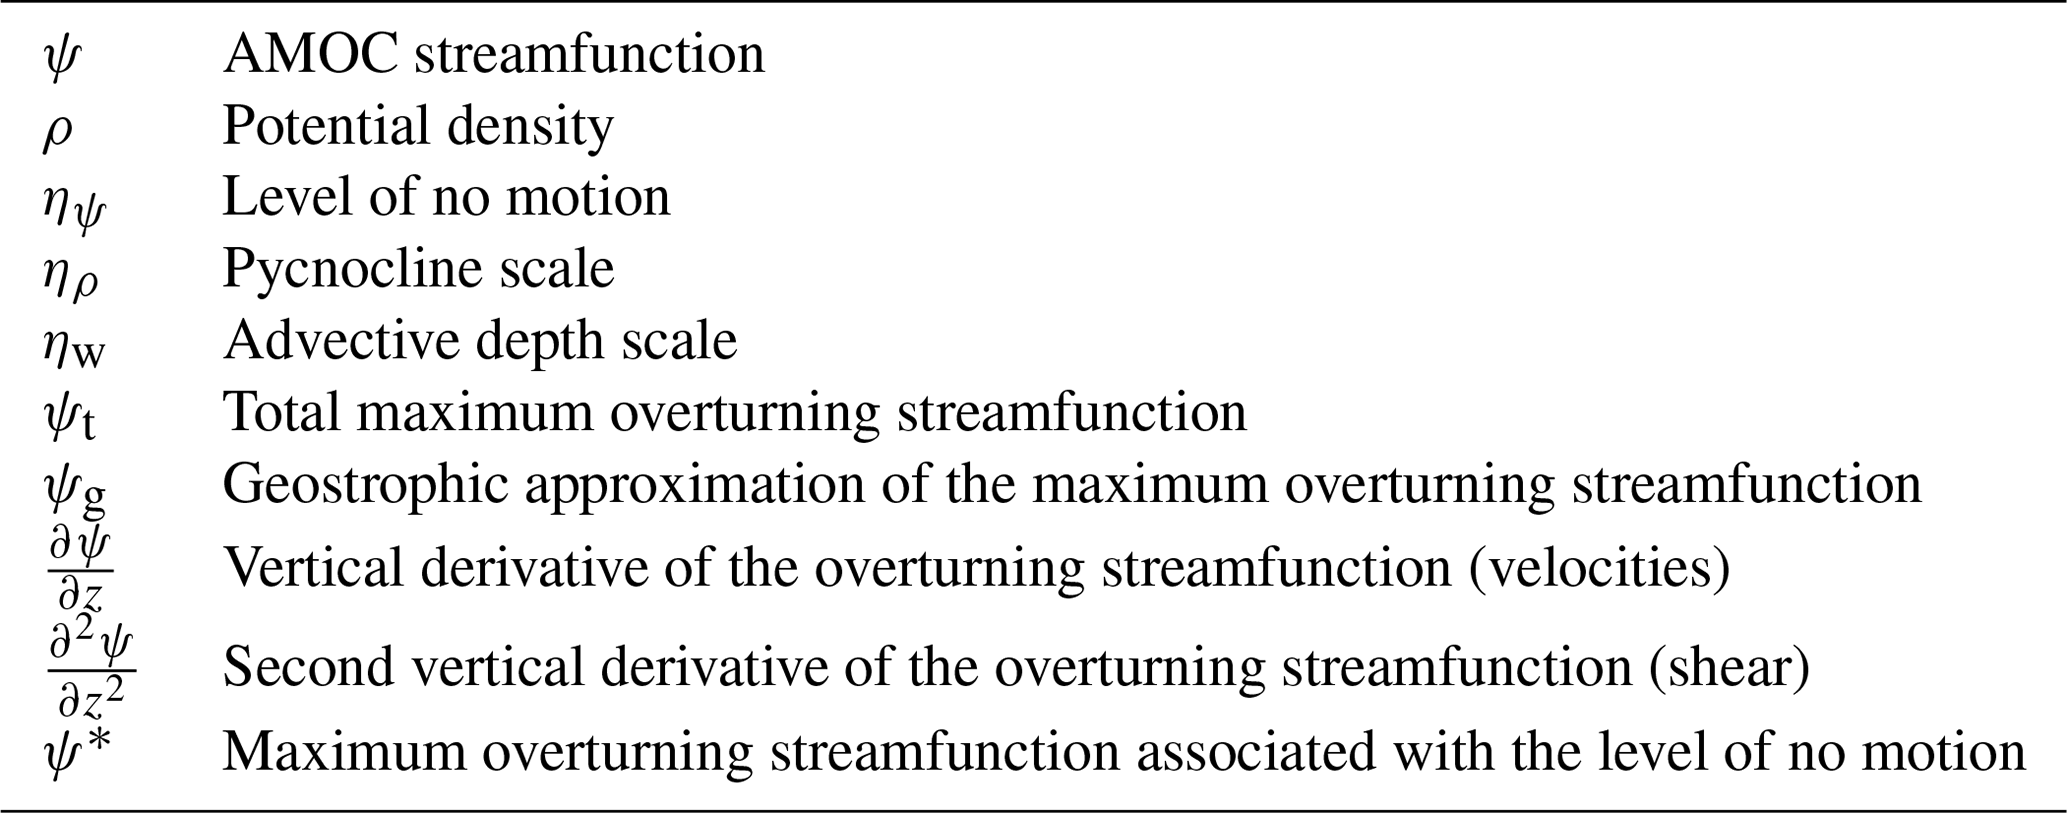
Finally, we analyze whether there are causal linkages between the changes in the depth scales and northward transport at different depths. Therefore, we compute the vertical derivative of the AMOC streamfunction , which represents the zonal-mean meridional velocity scaled by the basin width. We then compute the second derivative of the AMOC streamfunction , which represents the vertical velocity shear scaled by the basin width. In this way, we analyze to which degree the changes in the northward transport of the mid-depth cell are directly related to the displacement of the level of no motion. The computation of and below the surface Ekman layer is independent of the way how we approximate the maximum overturning streamfunctions ψt and ψg. To finish our analysis, we compute the maximum overturning streamfunction ψ* that is associated with the level of no motion only. We use the time-mean vertical velocity shear of the 1X reference experiment and integrate vertically from the level of no motion in the 2XSH and 2X experiments to the top. Before averaging over the 20 years, we use the highest temporal resolution and compute the integral with the reference depth for each month in order to ensure the robustness of the results.
3.1 Wind-driven changes in stratification
As a starting point, we highlight the differences in density stratification in the Atlantic basin between the wind experiments. Afterwards, we relate these differences to the level of no motion ηψ and the pycnocline scale ηρ. We normalize the zonal-mean potential density to highlight the differences in density stratification between the wind experiments, , with the reference density ρ0=1025 kg m−3. Figure 3a, b show the time-mean difference in density stratification between the 2XSH and 1X experiment and the 2X and 1X experiment. Figure 3c illustrates the advective depth scale ηw in the Atlantic. Within the range of the advective depth scale ηw, isopycnals shoal towards the Equator due to equatorial divergence and deepen in the subtropical region towards higher latitudes due to the local forcing that is imposed by the wind stress curl. Deep stratification below ηw but within the depth range of the upper, northward flowing branch of the mid-depth cell reveals the same behavior in the Southern Hemisphere, but isopycnals rise constantly towards the region of North Atlantic deep water formation.
The time-mean differences in density stratification between the wind experiments mirror the experimental set-up of the present study. In general, Fig. 3a and b suggest that the difference in density stratification between the 2XSH experiment and the 1X experiment is driven by the wind stress curl over the Southern Ocean, which has a strong influence in the Southern Hemisphere, but deep isopycnals deeper than 500 m change even in the Northern Hemisphere. The change in the 2X experiment relative to the 1X experiment is driven by the change in the climatology of the wind stress curl in both hemispheres. Local Ekman pumping displaces isopycnals downward also north of the Equator with a maximum change in the subtropical region, and this displacement is scaled by ηw (Fig. 3c). The influence of the local wind forcing prevails, but deep isopycnals are also influenced nonlocally below ηw. Both nonlocal and local wind effects change the density field, and their relative influence on stratification depends on location and depth. In the following, we analyze how these changes in density stratification translate into changes in both depth scales ηψ and ηρ and maximum overturning ψ. Afterwards, in Sect. 4, we discuss how the changes in wind forcing translate into changes in the level of no motion ηψ.
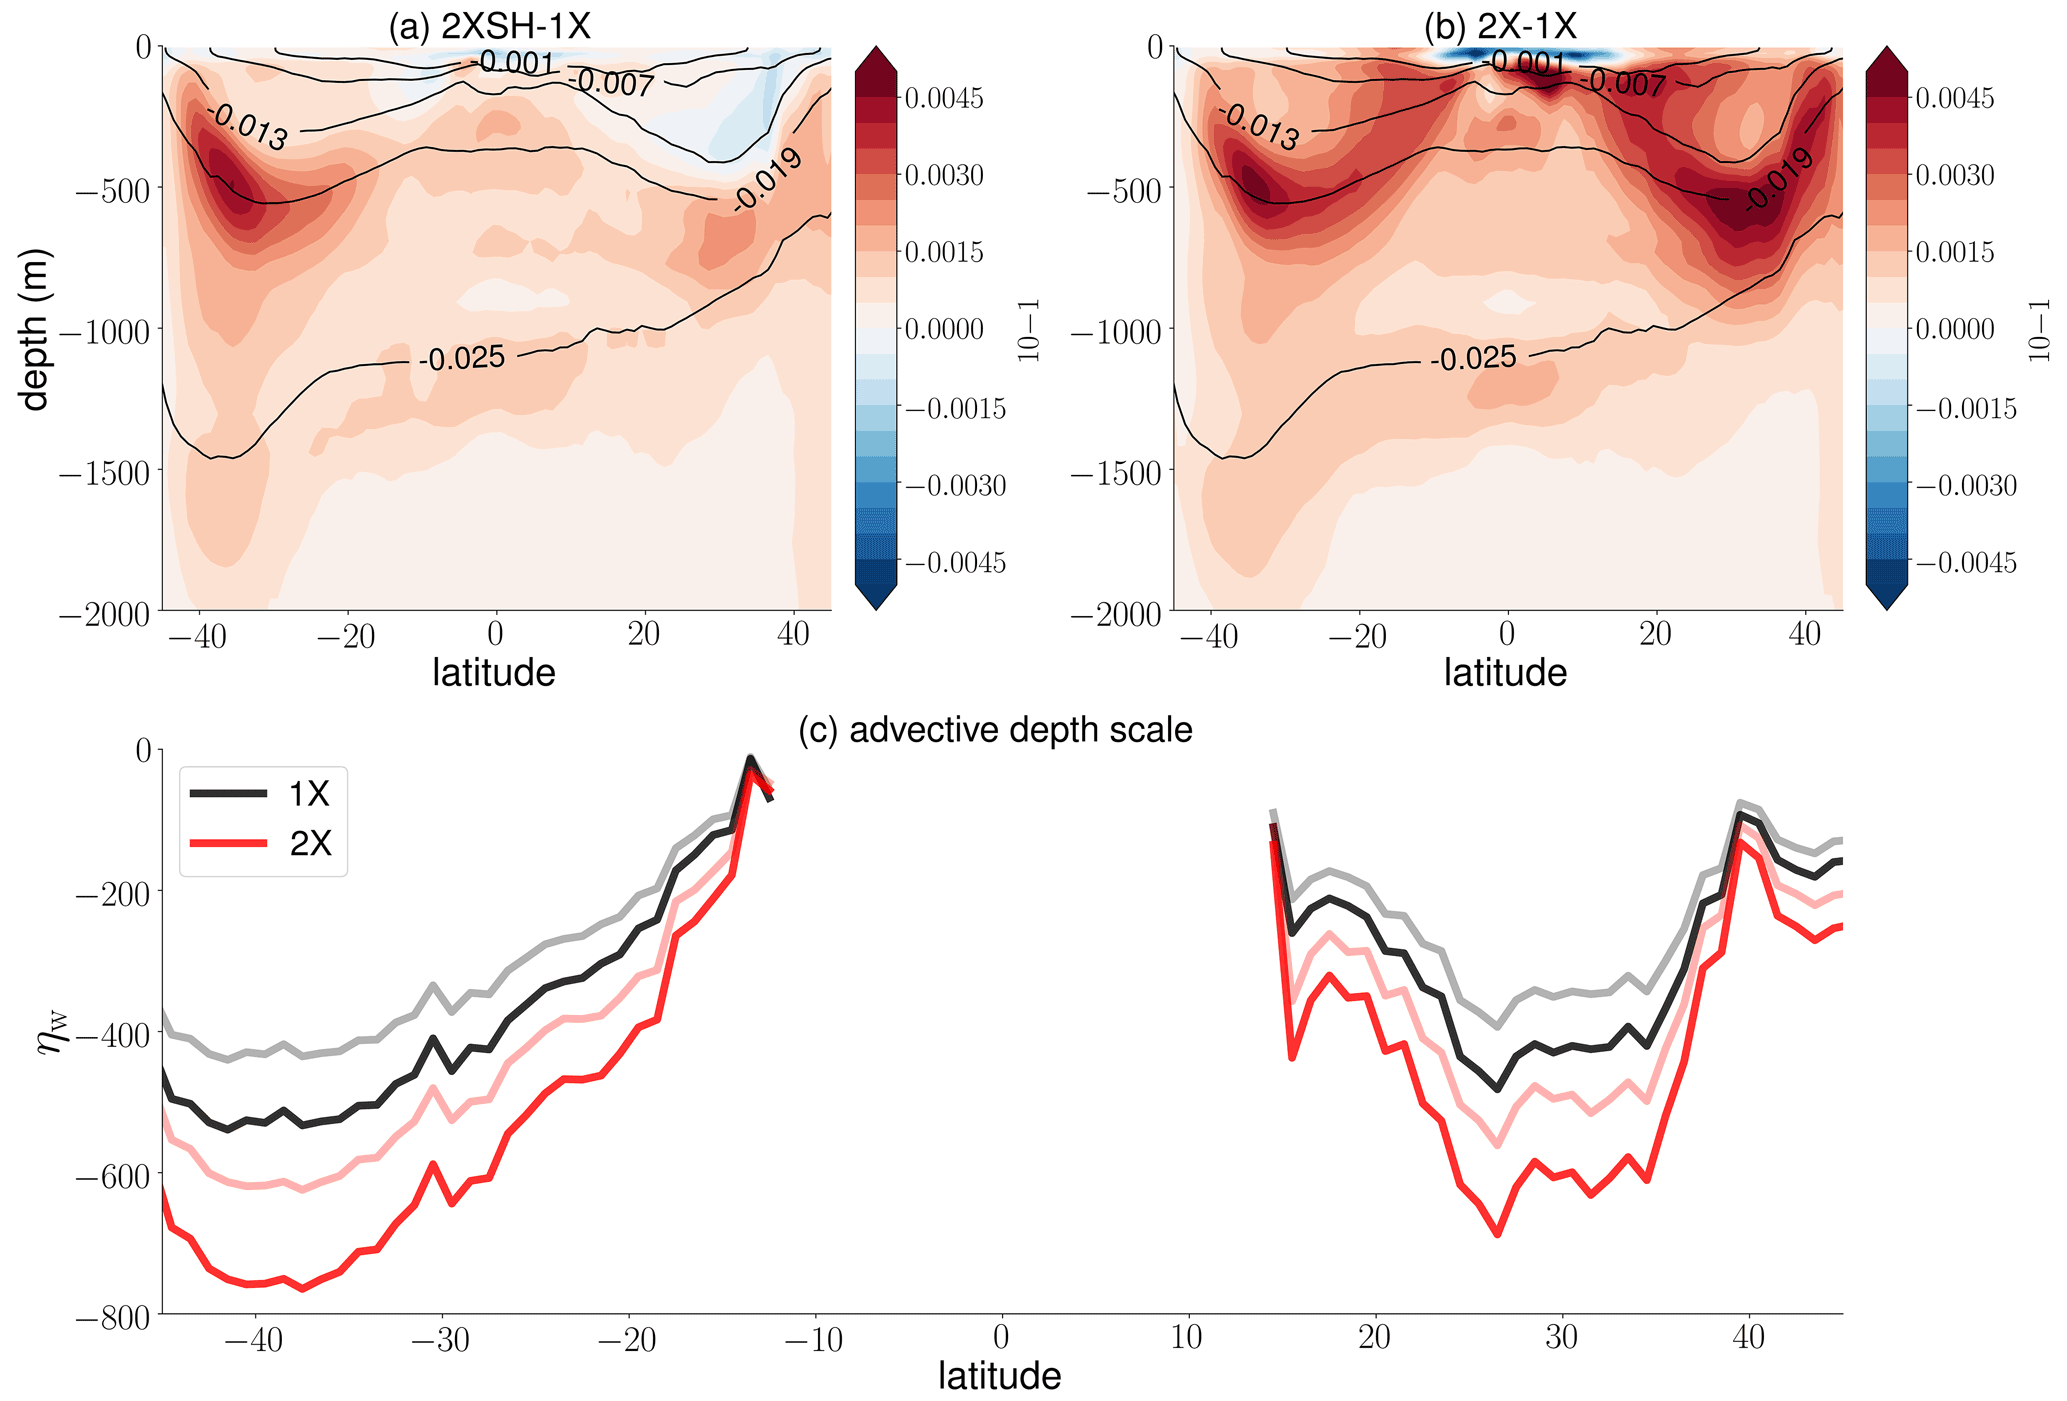
Figure 3Differences in the zonal-mean density stratification averaged over the years 1991–2010: (a) the difference between the 2XSH and 1X experiments, and (b) the difference between the 2X and 1X experiments. The black contour lines represent the zonal-mean density stratification (10−1) in the 1X reference experiment. Density stratification is computed by , with the reference density ρ0=1025 kg m−3. Panel (c) shows the advective depth scale ηw (in meters) in the 1X experiment (black) and the 2X experiment (red), with the reduced gravity set to (opaque) and m s−2 (transparent). The smaller the value for the reduced gravity, the deeper the advective depth scale ηw.
3.2 Level of no motion and pycnocline scale
Figure 4 shows the meridional dependence of the level of no motion ηψ and the zonal-mean pycnocline scale ηρ in the wind experiments in order to explore the wind forcing dependencies of the depth scales. In the 1X experiment, the spatial variations of ηψ and ηρ coincide in the sense that both shoal towards the Equator in the Southern Hemisphere and stay more or less constant, or change slightly, in the Northern Hemisphere. This similarity in meridional behavior is noteworthy because the pycnocline scale ηρ measures how density stratification unfolds over the ocean column, whereas the level of no motion is a single layer at a certain depth.
The wind forcing dependencies of the level of no motion and the pycnocline scale differ. The pycnocline scale ηρ deepens in the 2XSH and 2X experiments relative to the 1X reference experiments throughout the basin. The pycnocline scales ηρ in the 2XSH and 2X experiments are congruent, and ηρ is mainly determined by the wind stress over the Southern Ocean. Local changes in the wind forcing at lower latitudes and in the Northern Hemisphere do not change ηρ significantly. In the Northern Hemisphere, density stratification approximately unfolds at the same scale despite the differences in density stratification at the depth of ηw. In the Southern Hemisphere, the wind forcing dependence of the level of no motion ηψ corresponds to the wind forcing dependence of pycnocline scale ηρ. However, we find considerable differences between the wind experiments in the Northern Hemisphere due to an additional dependence on the local wind forcing. Wind forcing over the Southern Ocean nonlocally deepens the level of no motion ηψ in the Northern Hemisphere. Yet, in addition to this nonlocal effect, a local effect acts on the level of no motion ηψ because we observe differences in the Northern Hemisphere subtropical region between the 2XSH and 2X experiments. The findings on the wind forcing dependencies of ηψ correspond to those findings on the differences in density stratification between the wind experiments. The level of no motion ηψ is connected to the advective depth scale ηw and Ekman pumping locally.
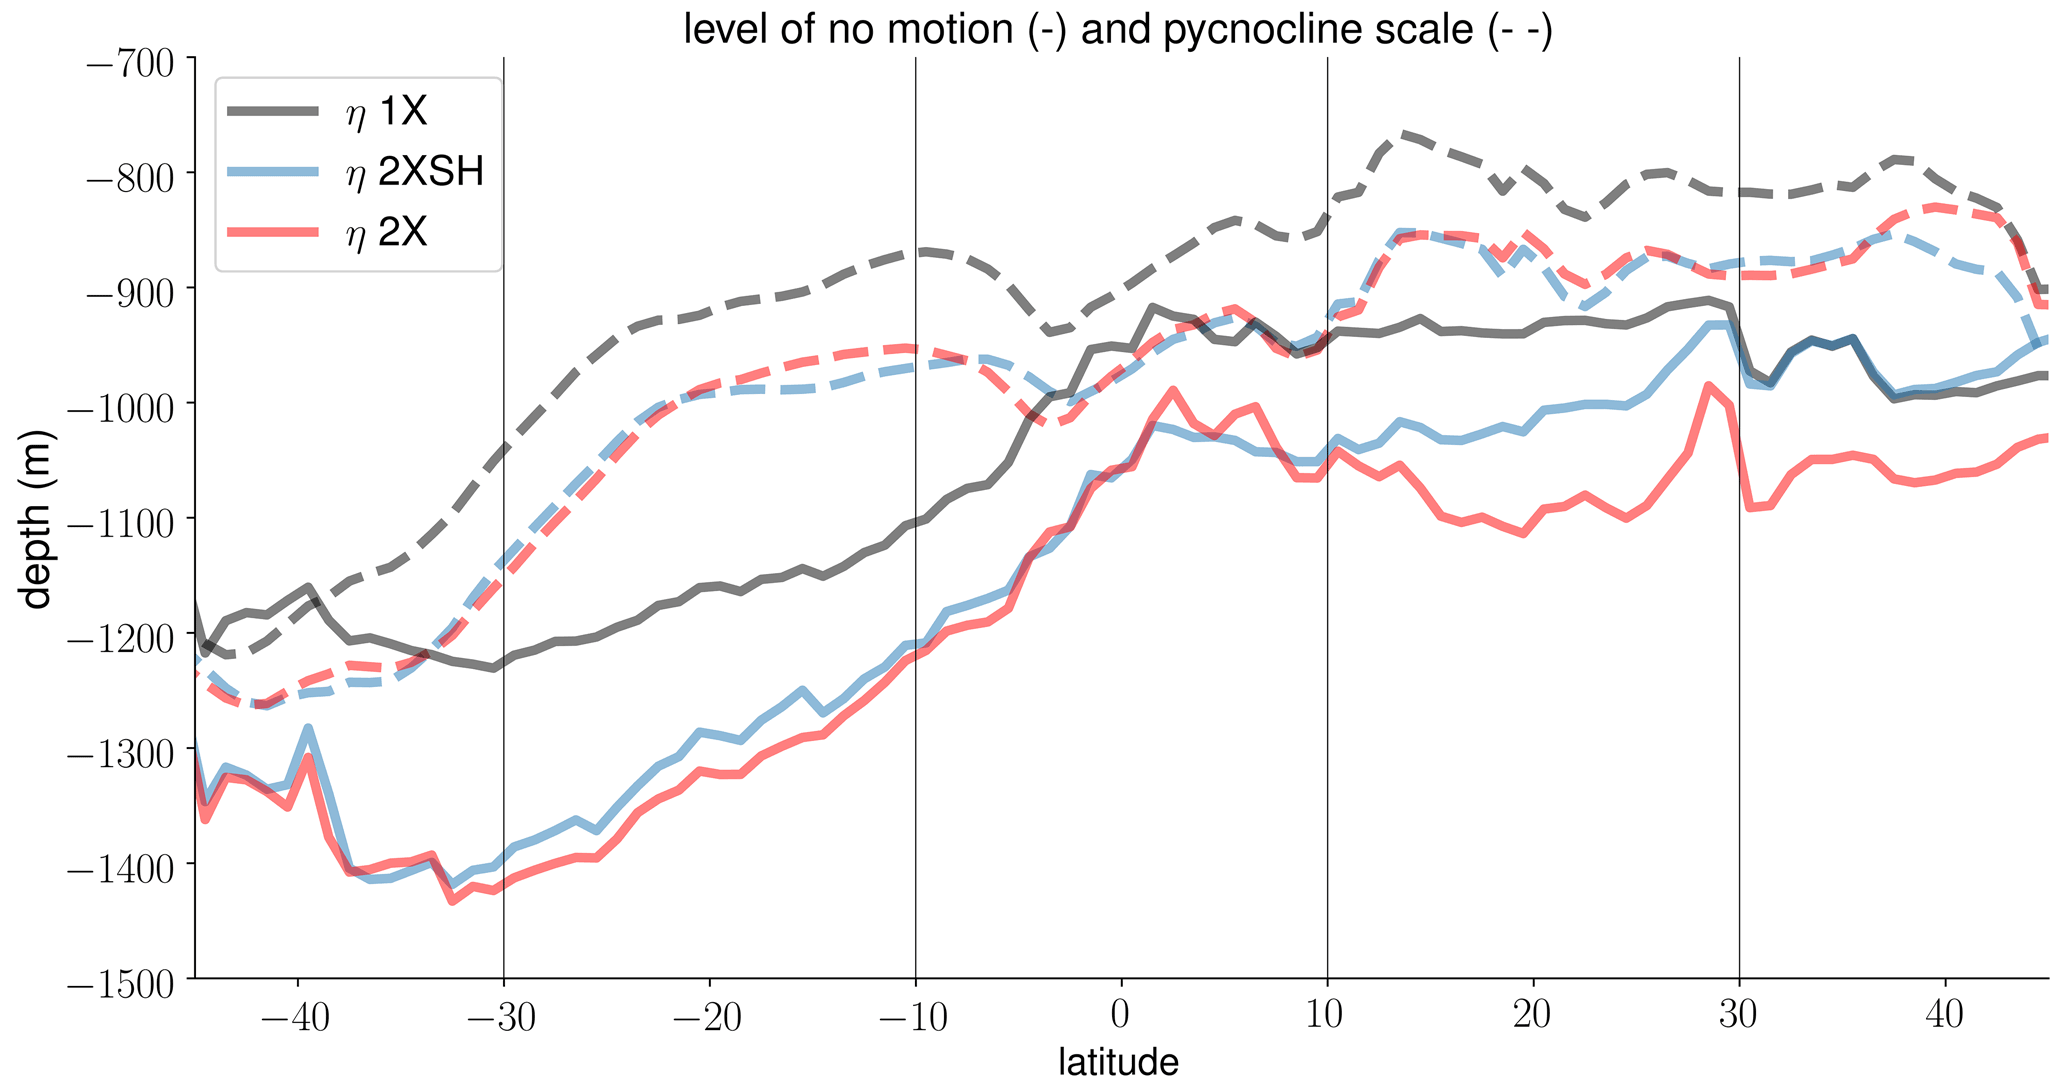
Figure 4The time-mean (1991–2010) wind forcing dependencies of the level of no motion ηψ (solid) and the pycnocline scale ηρ (dashed) with respect to the 1X experiment (black), the 2XSH experiment (blue), and the 2X experiment (red).
3.3 Maximum overturning and its depth
We now analyze the wind forcing dependence of the northward flowing branch of the mid-depth cell. We compute the total maximum overturning streamfunction ψt and the geostrophic maximum overturning streamfunction ψg. Conceptually, the differences between ψt and ψg provide insight on the degree to which the depth scale(s) are proxies for the strength of the AMOC. Computing the geostrophic maximum overturning streamfunction ψg, the level of no motion is unchanged, but the clockwise (upper) and counterclockwise (lower) rotating overturning cells are substantially altered. The maximum streamfunction ψt includes the surface Ekman flux and the maximum streamfunction ψg excludes the surface Ekman flux. However, the surface Ekman fluxes have to be compensated by an interior return flow that changes the relationship between overturning and its depth. With this section we simply answer the question of whether the depth scale scales overturning over the full depth range of the upper AMOC branch, including the surface Ekman layer, or whether the depth scale scales overturning only below the surface Ekman layer. An answer to this question not only provides insight into whether the depth scale is a proxy for northward flow but also indicates why the level of no motion scales northward overturning and why there is a certain relationship between overturning and its depth.
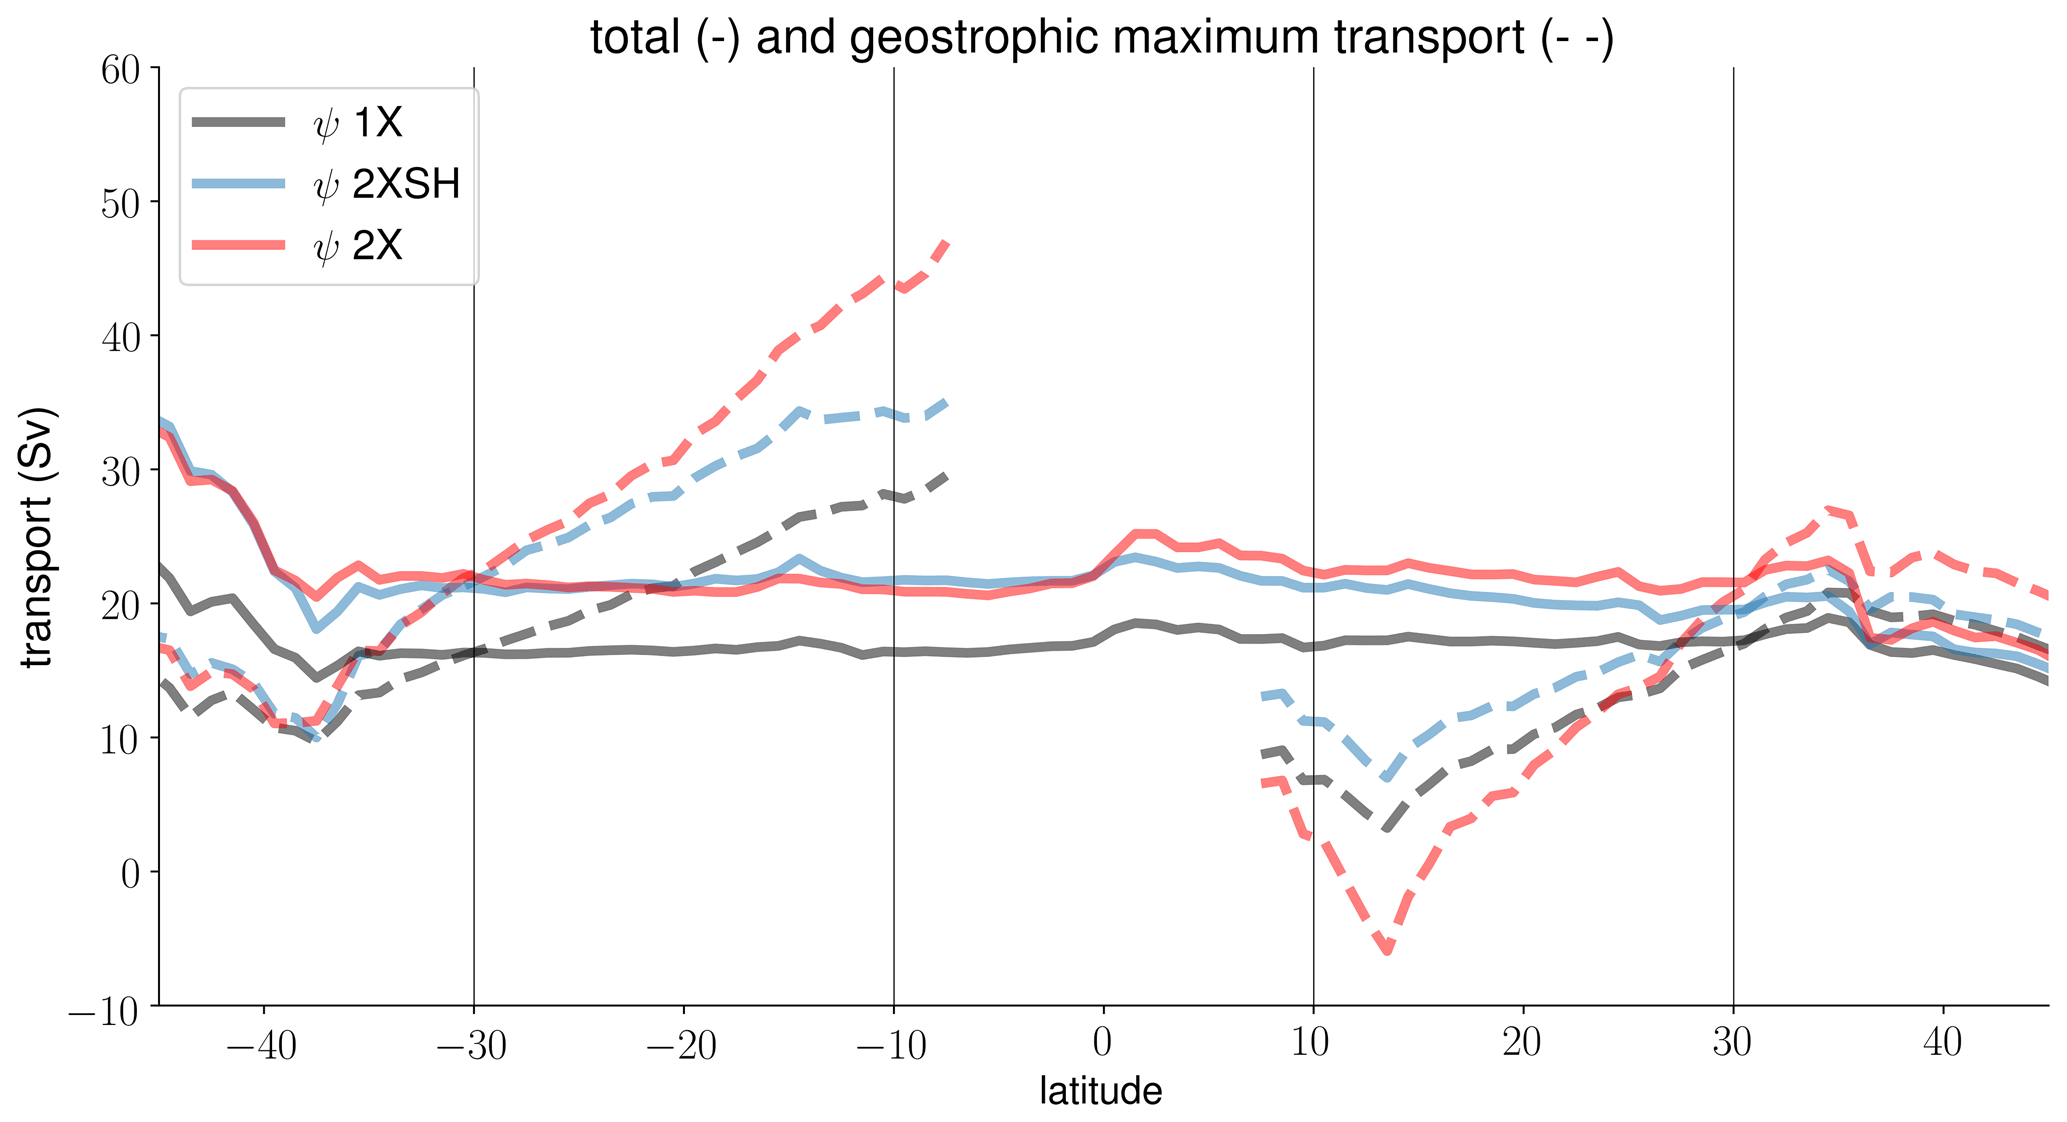
Figure 5The time-mean (1991–2010) wind forcing dependencies of the total maximum overturning streamfunction ψt (solid) and the geostrophic maximum overturning streamfunction ψg (dashed) in the 1X experiment (black), the 2XSH experiment (blue), and the 2X experiment (red). Considering ψg, we exclude the equatorial band where the approximation of the surface Ekman flux breaks down.
The wind forcing dependencies of the level of no motion and the total maximum overturning streamfunction are equal in the sense that they coincide. By contrast, the wind forcing dependencies of the level of no motion and the geostrophic maximum overturning streamfunction differ. As we will show, this behavior helps understand whether and why the level of no motion is a proxy for northward flow. Figure 5 shows the meridional dependence of both the total and geostrophic maximum overturning streamfunction (ψt,ψg). Considering ψt, the southern latitudes of the Southern Hemisphere are strongly influenced by the surface Ekman flux which scales with the zonal wind stress. Northward of the Southern Ocean (30–10∘ S), the AMOC becomes increasingly geostrophic. In the Southern Hemisphere, the strength of the mid-depth cell increases with higher wind forcing, and we find a stronger transport in the 2XSH and 2X experiments than in the 1X experiment. In this region, the total maximum streamfunctions ψt of the 2XSH and 2X experiments are approximately equal. However, ψt intensifies north of the Equator. In the subtropical region (10–30∘ N), ψt increases with higher wind forcing, and the integrated transport of the 2X experiment is stronger than the integrated transport of the 2XSH experiment.
In contrast to ψt, the geostrophic maximum overturning streamfunction ψg is relatively weak near the Southern Ocean but constantly increases towards the Equator. North of the Southern Ocean (30–10∘ S), ψg is increasingly dependent on the geostrophic return flow that compensates the southward surface Ekman flux locally. As a result of the interior return flow, ψg becomes stronger with higher wind forcing, with markedly higher values in the 2X experiment compared with the 2XSH experiment. At the low and mid-latitudes of the Northern Hemisphere (10–30∘ N), the interior return flow of the surface Ekman flux is directed southward and strongest at roughly 15∘ N. At these latitudes, ψg of the 2X experiment is weaker than both the geostrophic transport of the 1X reference experiment and the 2XSH experiment. Comparing ψt and ψg, the Ekman cells play a crucial role in setting the relationship between overturning and its depth. We discuss the role of the Ekman cells and the possible explanations for the differences in maximum overturning besides the Ekman return flow later, in Sect. 4. First, we highlight the relationships between the maximum overturning streamfunctions and the depth scales in order to bring together their spatial dependencies.

Figure 6The time-mean (1991–2010) relationship between maximum overturning and its depth, the level of no motion (as plotted on the y axis), in the Southern Hemisphere and the Northern Hemisphere. The markers represent the meridional averages (30–10∘ S) (stars) and (10–30∘ N) (triangles). The figure shows both the total maximum overturning streamfunction (ψt, opaque) and the geostrophic maximum overturning streamfunction (ψg, transparent). The qualitative behavior does not differ when plotting the pycnocline scale ηρ (not shown) instead of the level of no motion ηψ, except that the pycnocline scales of the 2XSH and 2X experiments are congruent throughout the basin. The thin gray lines indicate the vertical model grid.
Combining our findings from Figs. 4 and 5, we describe the relationship between northward overturning and its depth from a more nonlocal perspective on hemispheric differences. To highlight the hemispheric differences in the inter-hemispheric region, we show the meridional averages of ψt and ψg against ηψ (30–10∘ S) and (10–30∘ N) (Fig. 6). We also show the vertical model grid in order to provide an indication for the importance of only a single-layer change as well as the ability of the depth scales to account for the details in the accumulation of vertical shear. Figure 6 summarizes the relationship between overturning and its depth. In the Southern Hemisphere, the level of no motion ηψ of the 2XSH and 2X experiments fall into the same model layer, and the associated maximum streamfunctions ψt are not notably different. In this region, ψg increases with higher wind forcing. South of the Equator, the wind forcing dependencies of the level of no motion ηψ as well as the pycnocline scale ηρ (not shown) are in line with the wind forcing dependencies of ψt, in the sense that a broader depth scale is related to stronger northward overturning.
Insights on the Northern Hemisphere are not as simple as in the Southern Hemisphere. The level of no motion ηψ deepens with higher wind forcing due to the downward displacement of isopycnals at mid-depth, whereas ηρ (not shown) reveals the same wind forcing dependencies as in its southern counterpart. The differences in the depth of the level of no motion ηψ between the wind experiments are important, although they are set by one model layer only, because even a small change in the model layers implies a change in the accumulation of vertical velocity shear, and the pycnocline scale ηρ does not account for these details. As in the southern counterpart, the differences in the level of no motion ηψ do not represent the changes in ψg, but the changes in ψt are consistent with the common assumption that the northward transport of the mid-depth cell becomes stronger with a deeper level of no motion ηψ.
At this point, we summarize why it is important to distinguish between the pycnocline scale and the level of no motion considering the scaling of maximum overturning. The pycnocline scale does not scale maximum overturning, whereas the level of no motion does. In addition, the pycnocline scale cannot capture the details of stratification, and at the same time we cannot capture the wind forcing dependence of the AMOC when only knowing how density unfolds vertically. The pycnocline scale is commonly taken as an appropriate depth scale in the current literature, but actually it does not reflect the wind forcing dependence of the AMOC. The level of no motion does reflect the wind forcing dependence of the AMOC and is thus more appropriate to scale the strength of the northward flow. Based on these results, in the following we focus on the level of no motion only. Furthermore, the pycnocline scale cannot provide any detailed information about the relationship between overturning and vertical velocity shear of the meridional velocity, which is needed to understand the wind forcing dependence of the AMOC as we will learn in Sect. 4. Even a difference of one grid layer likely makes a significant difference in the accumulation of vertical shear as we have identified above.
In general, the differences between ψt and ψg in the inter-hemispheric region suggest that the interior return flow of the surface Ekman flux is baroclinic and mostly compensated above the level of no motion ηψ. If so, the level of no motion is a proxy for ψt only, rather than a proxy for ψg in the case that the vertical velocity shear stays approximately constant with wind forcing. This raises the questions of how well the total and geostrophic maximum overturning streamfunctions represent interior flow despite the surface Ekman flux or its geostrophic return, and how well the level of no motion represents transport at different depths. In order to answer these questions, we analyze meridional velocity profiles () and shear ().
The depth scales can be related to vertical velocity profiles and shear . To discuss changes in the velocity profiles with respect to the level of no motion and the pycnocline scale, we first compute the vertical derivative of the AMOC streamfunction (the zonal-mean meridional velocity scaled by the basin width). Neglecting the surface Ekman layer and integrating from the level of no motion ηψ to the top gives the geostrophic approximation of the maximum overturning streamfunction that approximately represents the geostrophic conditions in the interior. Analyzing is a perspective on force balance, and we disentangle different contributions.

Figure 7The time-mean (1991–2010) vertical derivative of the AMOC streamfunction in the (a) 1X experiment, (b) 2XSH experiment, and (c) 2X experiment. We further show the difference in between the (d) 2XSH and 1X experiments, (e) the 2X and 1X experiments, and (f) the 2X and 2XSH experiments. The black line in (a)–(c) represents the level of no motion ηψ. We exclude the surface Ekman layer.
Figure 7 shows the zonal-mean meridional velocities in the wind experiments and the difference in between these wind experiments. It shows the importance of the Ekman cells for the meridional flow and that these Ekman cells cancel out above the level of no motion. Considering the relationship between maximum overturning and the level of no motion, we can think of internal flow in which the Ekman cells are canceled as subsequent analysis reveals. This, in turn, explains the wind forcing dependence of the AMOC. The differences in between the wind experiments are strongest near the Equator at the upper levels where the vertical velocity shear changes drastically. Taking the difference between the 2X and 1X experiments, we find an increase in south of the Equator and a decrease north of the Equator. To a substantial extent, these changes can be attributed to the strengthening of the local Ekman cells. The differences in at the upper levels between the different experiments demonstrate that the Ekman return flow is baroclinic and occurs mostly above ηψ. The strong influence of the Ekman cells near the surface suggests that, at these levels, the external wind-driven flow associated with the Ekman cells superposes the internal flow that is associated with the level of no motion. These considerations support the perspective that ηψ is a proxy for ψt rather than a proxy for ψg. Small differences in ψt emerge in cases of weak compensation of the surface Ekman flux below ηψ.
In Fig. 7 we further find differences in at mid-depth below the surface Ekman layer and above the level of no motion that are associated with the nonlocal wind forcing over the Southern Ocean. These changes can be inferred from the difference between the 2XSH and 1X experiments. The difference between these experiments is related to the enhanced inflow from the Southern Hemisphere into the Northern Hemisphere, which in turn can be related to the strengthening of the western boundary current with an increase in wind forcing (not shown). In the 2X experiment, however, the perturbation associated with the Ekman cells is stronger than the perturbation associated with the strengthening of the western boundary current. The Ekman cells south and north of the Equator further obscure the influence of the local Ekman pumping velocity WE on stratification and transport at the advective depth ηw, which can hardly be identified in Fig. 7. The changes in the wind stress curl with changing wind forcing must be translated into the changes in the level of no motion ηψ, and next we analyze explicitly how different depths of the level of no motion ηψ result in different velocity profiles.
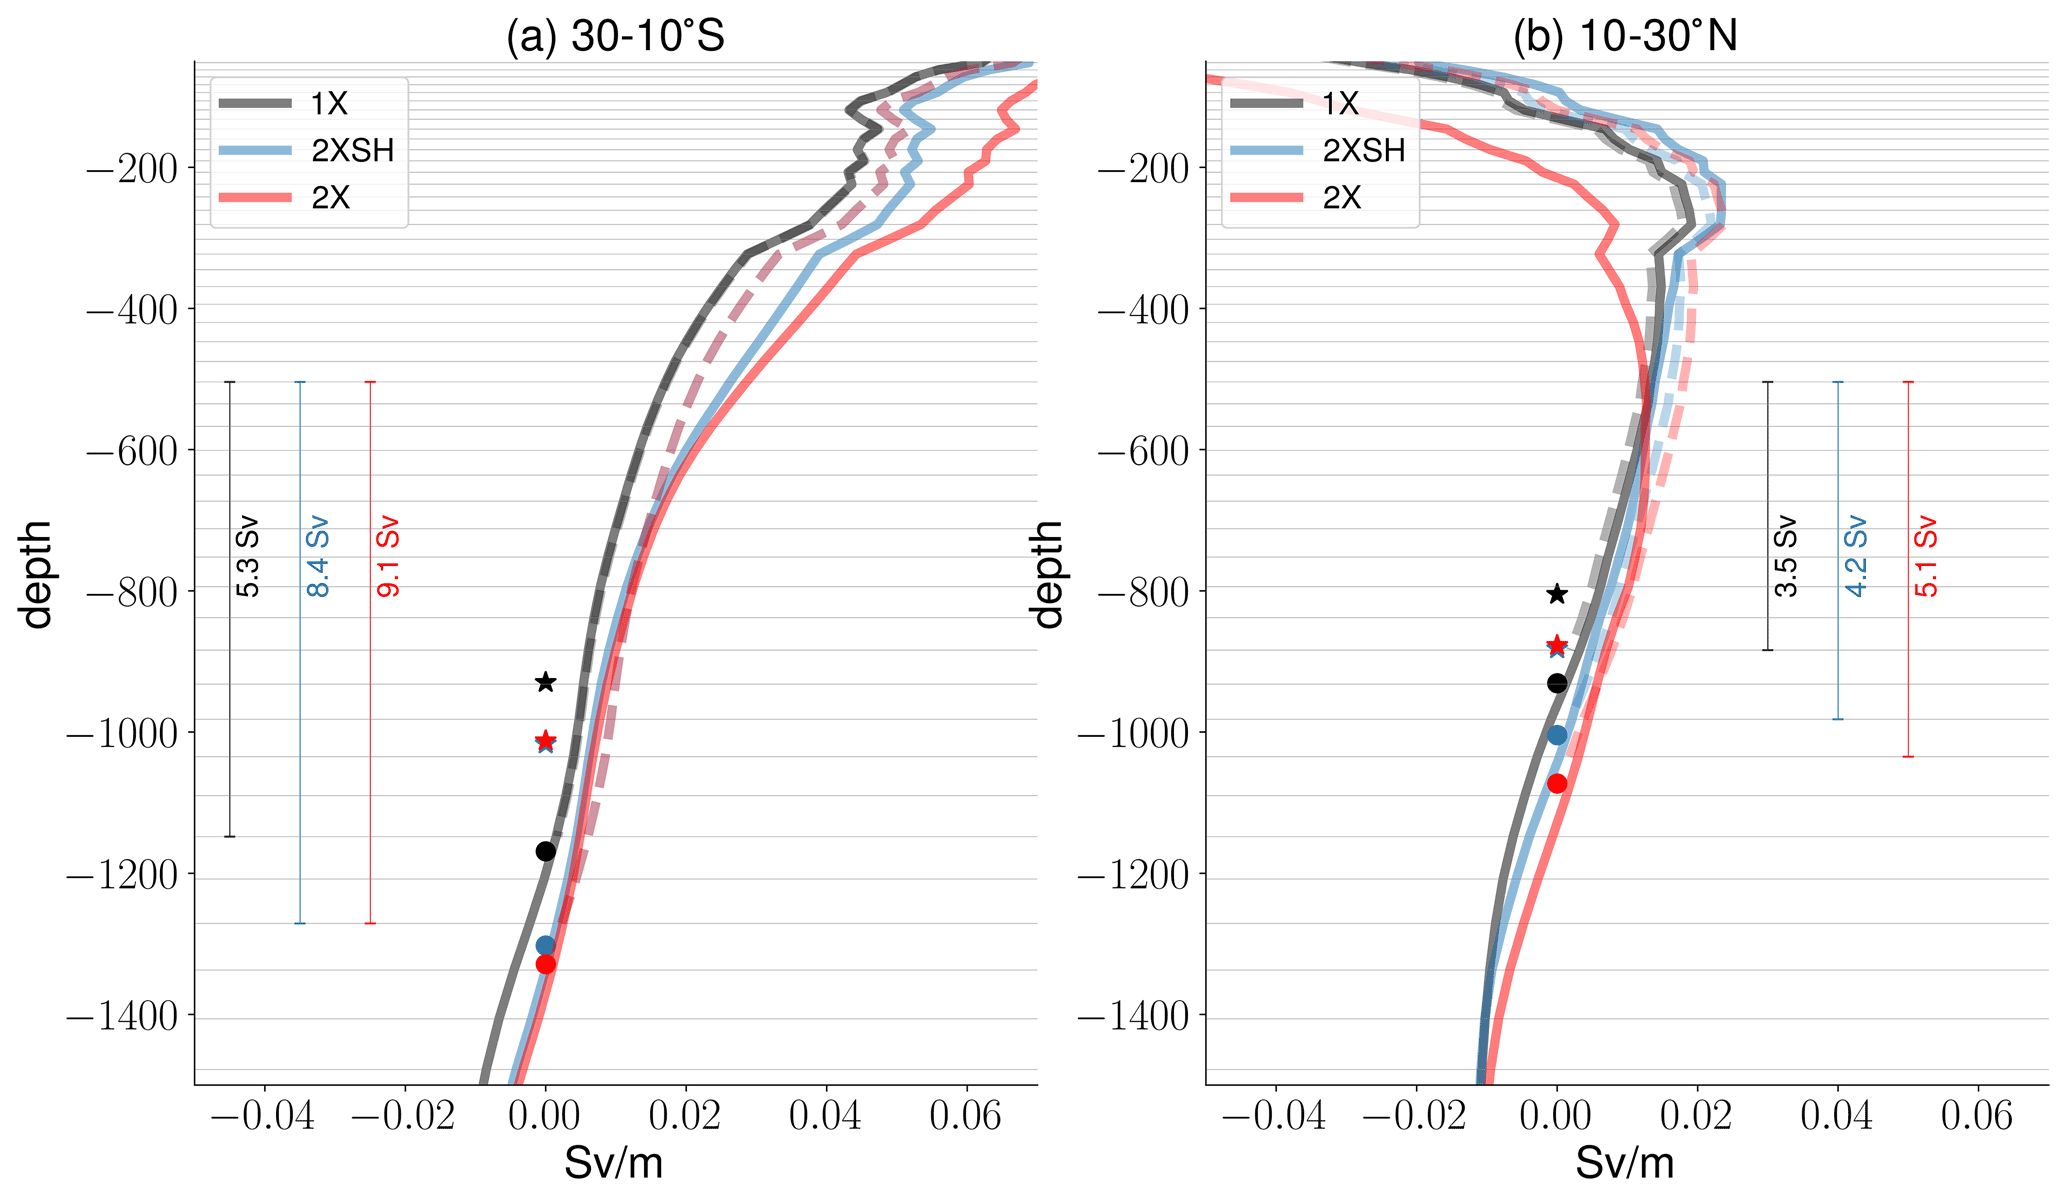
Figure 8The meridional averages in the Southern Hemisphere (a, 30–10∘ S) and in the Northern Hemisphere (b, 10–30∘ N) of the time-mean (1991–2010) vertical derivative of the AMOC streamfunction in the 1X experiment (black), 2XSH experiment (blue), and 2X experiment (red). We exclude the surface Ekman layer. The circles show the meridional averages of the level of no motion ηψ and the stars show the meridional averages of the pycnocline scale ηρ. The dashed lines represent the velocity profiles that arise from the displacements of the level of no motion ηψ while the velocity shear is held constant (1X) in the sense that we use it as the reference vertical velocity shear that is forcing-invariant. The time-mean vertical velocity shear of the 1X experiment is thus integrated from the level of no motion in the 2XSH and 2X experiments to obtain velocity profiles. Note that in the Southern hemisphere the dashed blue line and the dashed red line fall on top of one another. We indicate the transport (Sv) at the deeper levels by the annotation at the vertical bars, which show the respective depth range. The thin gray lines indicate the vertical model grid.
We analyze whether there is a direct relationship between the vertical velocity profiles described by and the changes in the level of no motion ηψ, by computing the meridional averages 30–10∘ S and 10–30∘ N (Fig. 8a, b). We analyze how much of the velocity profiles can be predicted by the level of no motion only. For this purpose, we assume vertical velocity shear that is constant under changing wind forcing. To assess to what degree the level of no motion ηψ represents changes in the velocity profiles, we vertically integrate the time-mean vertical velocity shear of the 1X reference experiment from the level of no motion ηψ in the 2XSH and 2X experiments with zero reference velocity (dashed lines; solid lines represent the actual velocity profiles). A comparable approach is not possible in the case of the pycnocline scale ηρ, because it is a scale height and even a small layer difference in the reference depth results in differences in . We find that the changes in deep velocity profiles are related to the changes in the level of no motion ηψ in both hemispheres. To a considerable extent, even the velocity profile of the 2XSH experiment at the upper levels in both hemispheres is connected to the displacement of the level of no motion ηψ. In the 2X experiment, however, the signal that arises from the interior return flow of the surface Ekman flux overcomes the signal that arises from the displacement of ηψ. In the Southern Hemisphere at the upper levels, the velocities associated with the changes in the level of no motion ηψ are lower than the actual velocities in this experiment. In the Northern Hemisphere at the upper levels, the velocities associated with the changes of the level of no motion ηψ are much higher than the actual velocities. Integrating the velocity profiles vertically, however, the Ekman cells should cancel out such that the level of no motion is a proxy for northward transport.
We therefore show the changes in maximum overturning that are associated with the level of no motion only by analyzing the vertically integrated transport. Figure 9 shows the total maximum overturning streamfunction ψt and the maximum overturning streamfunction ψ* in the case that we use the vertical velocity shear from the 1X experiment. We find that the changes in total maximum overturning ψt are explained by the changes in the level of no motion to a very large degree. The maximum overturning streamfunctions ψt and ψ* are approximately congruent, and the vertical velocity shear stays approximately constant with wind forcing on the timescale considered here. There is deviation at the Equator due to systematic errors that arise from perturbations in equatorial upwelling. Away from the Equator, however, the differences between the 2XSH and 2X experiments arise solely from the differences in the level of no motion. The mechanism regarding how the changes in wind forcing translate into changes in the level of no motion ηψ is thus easy to comprehend from the AMOC decomposition. Small changes in the zonal pressure gradients at the depth range scaled by advective depth scale ηw are related to substantial differences in the level of no motion ηψ, because the internal velocity shear that is not influenced by the external Ekman cells hardly changes between the wind experiments.
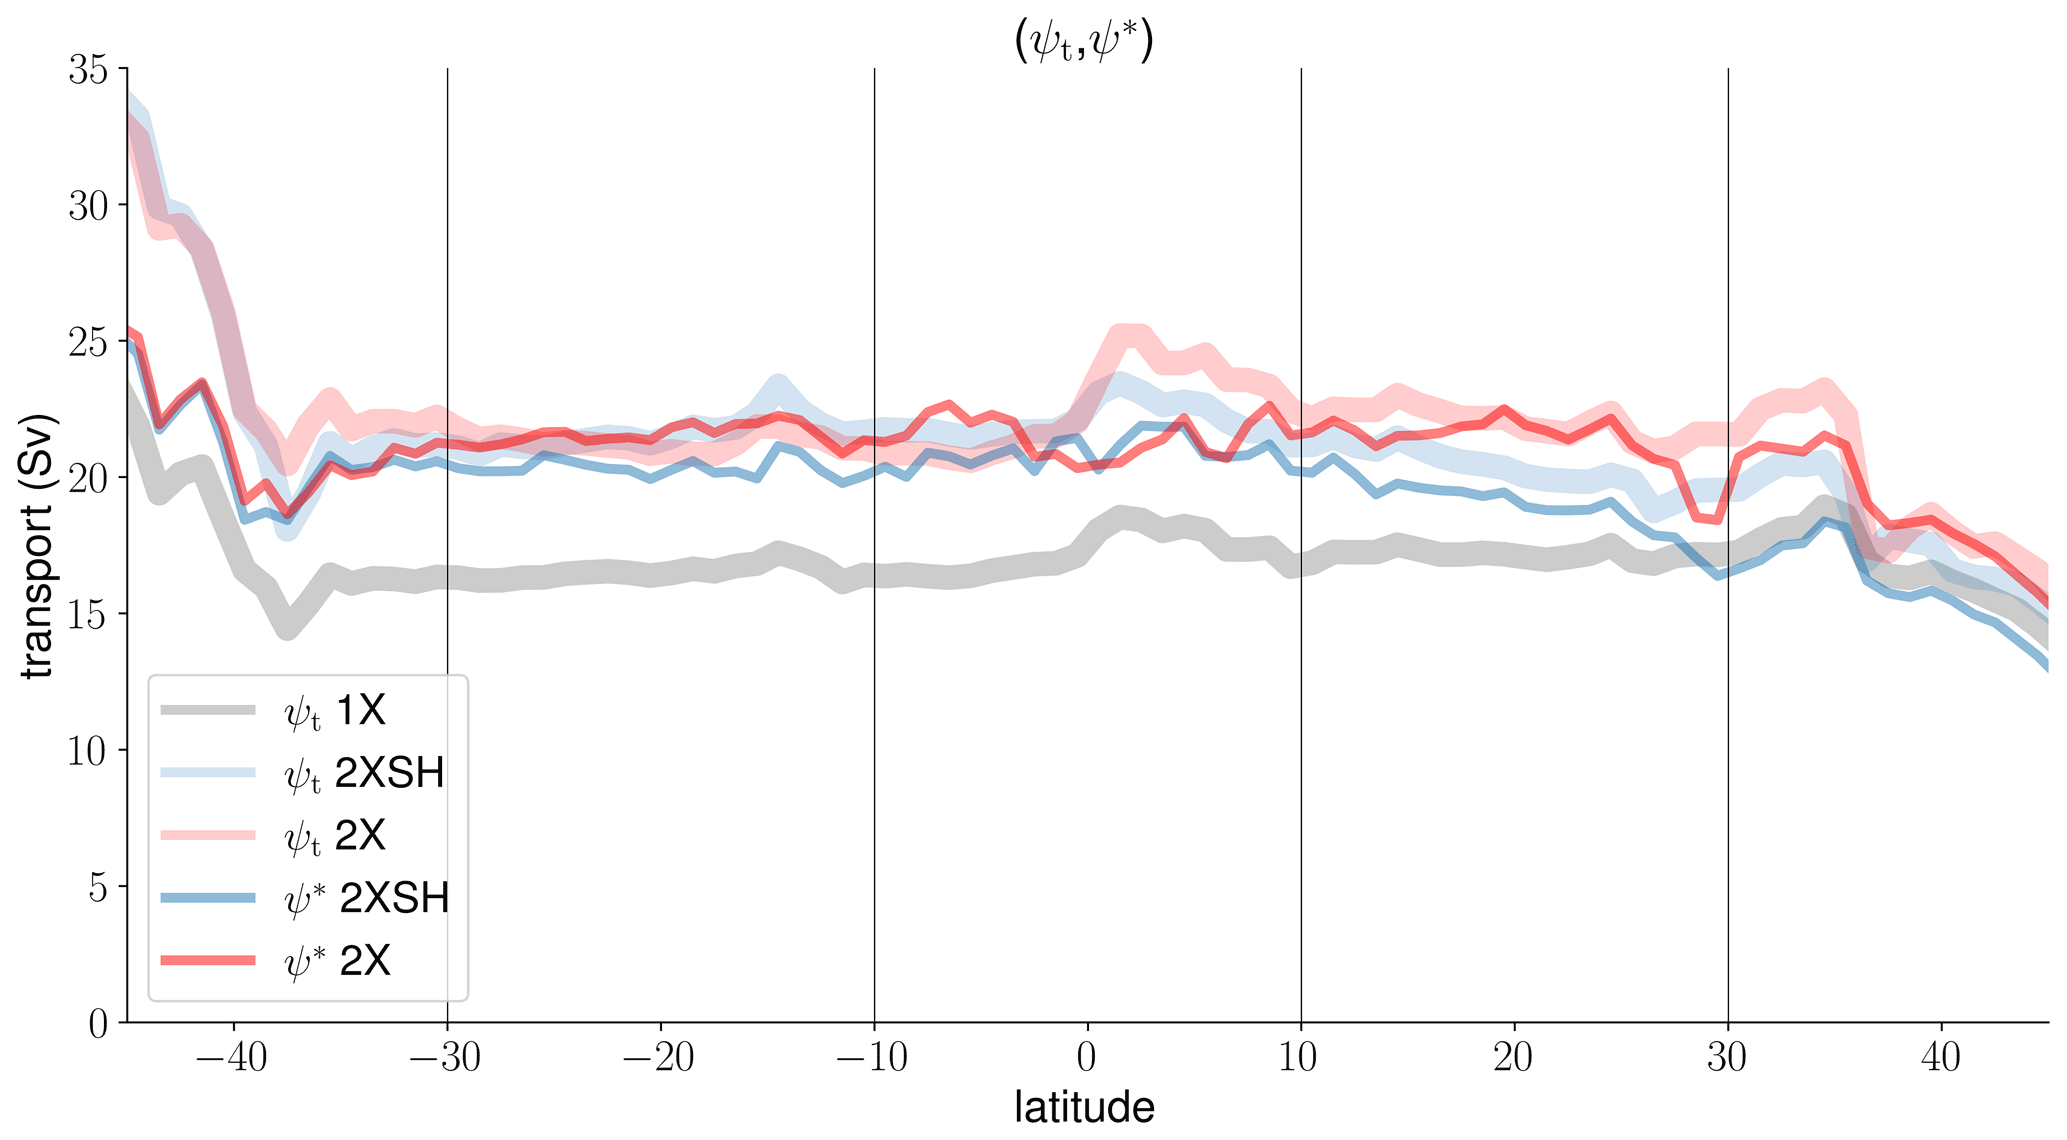
Figure 9The total maximum overturning streamfunction ψt and the maximum overturning streamfunction ψ* in the case that we use the time-mean vertical velocity shear of the 1X reference experiment and the changes in the level of no motion from the 2XSH and 2X experiments to integrate the vertical shear vertically.
The question arises as to whether the wind forcing dependence of the AMOC found in the short-term integration of TP6ML80 (1980–2010) is robust. We use the time window (1991–2010) in order to allow for major adjustments at an initial stage. We assume that the wind forcing dependence found in the time window would reflect a quasi-steady response. This is a strong assumption given that it is actually a transient response within a short integration time. The adjustment in the density field with wind forcing (Fig. 3) supports the perspective that major adjustments in ocean dynamics to forcing are realized. However, the wind forcing dependence of the AMOC may still be time dependent, and low-resolution model outcome may differ from high-resolution model outcome.
We first show the full time series (1980–2010) of maximum overturning and the level of no motion in TP6ML80 (30–10∘ S, 10–30∘ N) (Fig. 10a–d). There is a strong adjustment and time dependence in both variables at an initial stage on a decadal time scale. During the course of the study we have neglected this initial adjustment by focusing on the time window 1991–2010 only. After the initial adjustment on a decadal timescale (1980–1990), the wind forcing dependence of maximum overturning and the level of no motion is robust. Nevertheless, there are oscillations at low frequency which put into question whether the wind forcing dependence of the AMOC found in the short-term integration of TP6ML80 is quasi-steady. We cannot investigate the steady response of the AMOC in TP6ML80 due to the high computational costs. The temporal changes in the level of no motion, however, coincide with the temporal changes in maximum overturning in the sense that the vertical velocity shear of the meridional velocity stays approximately constant over time.
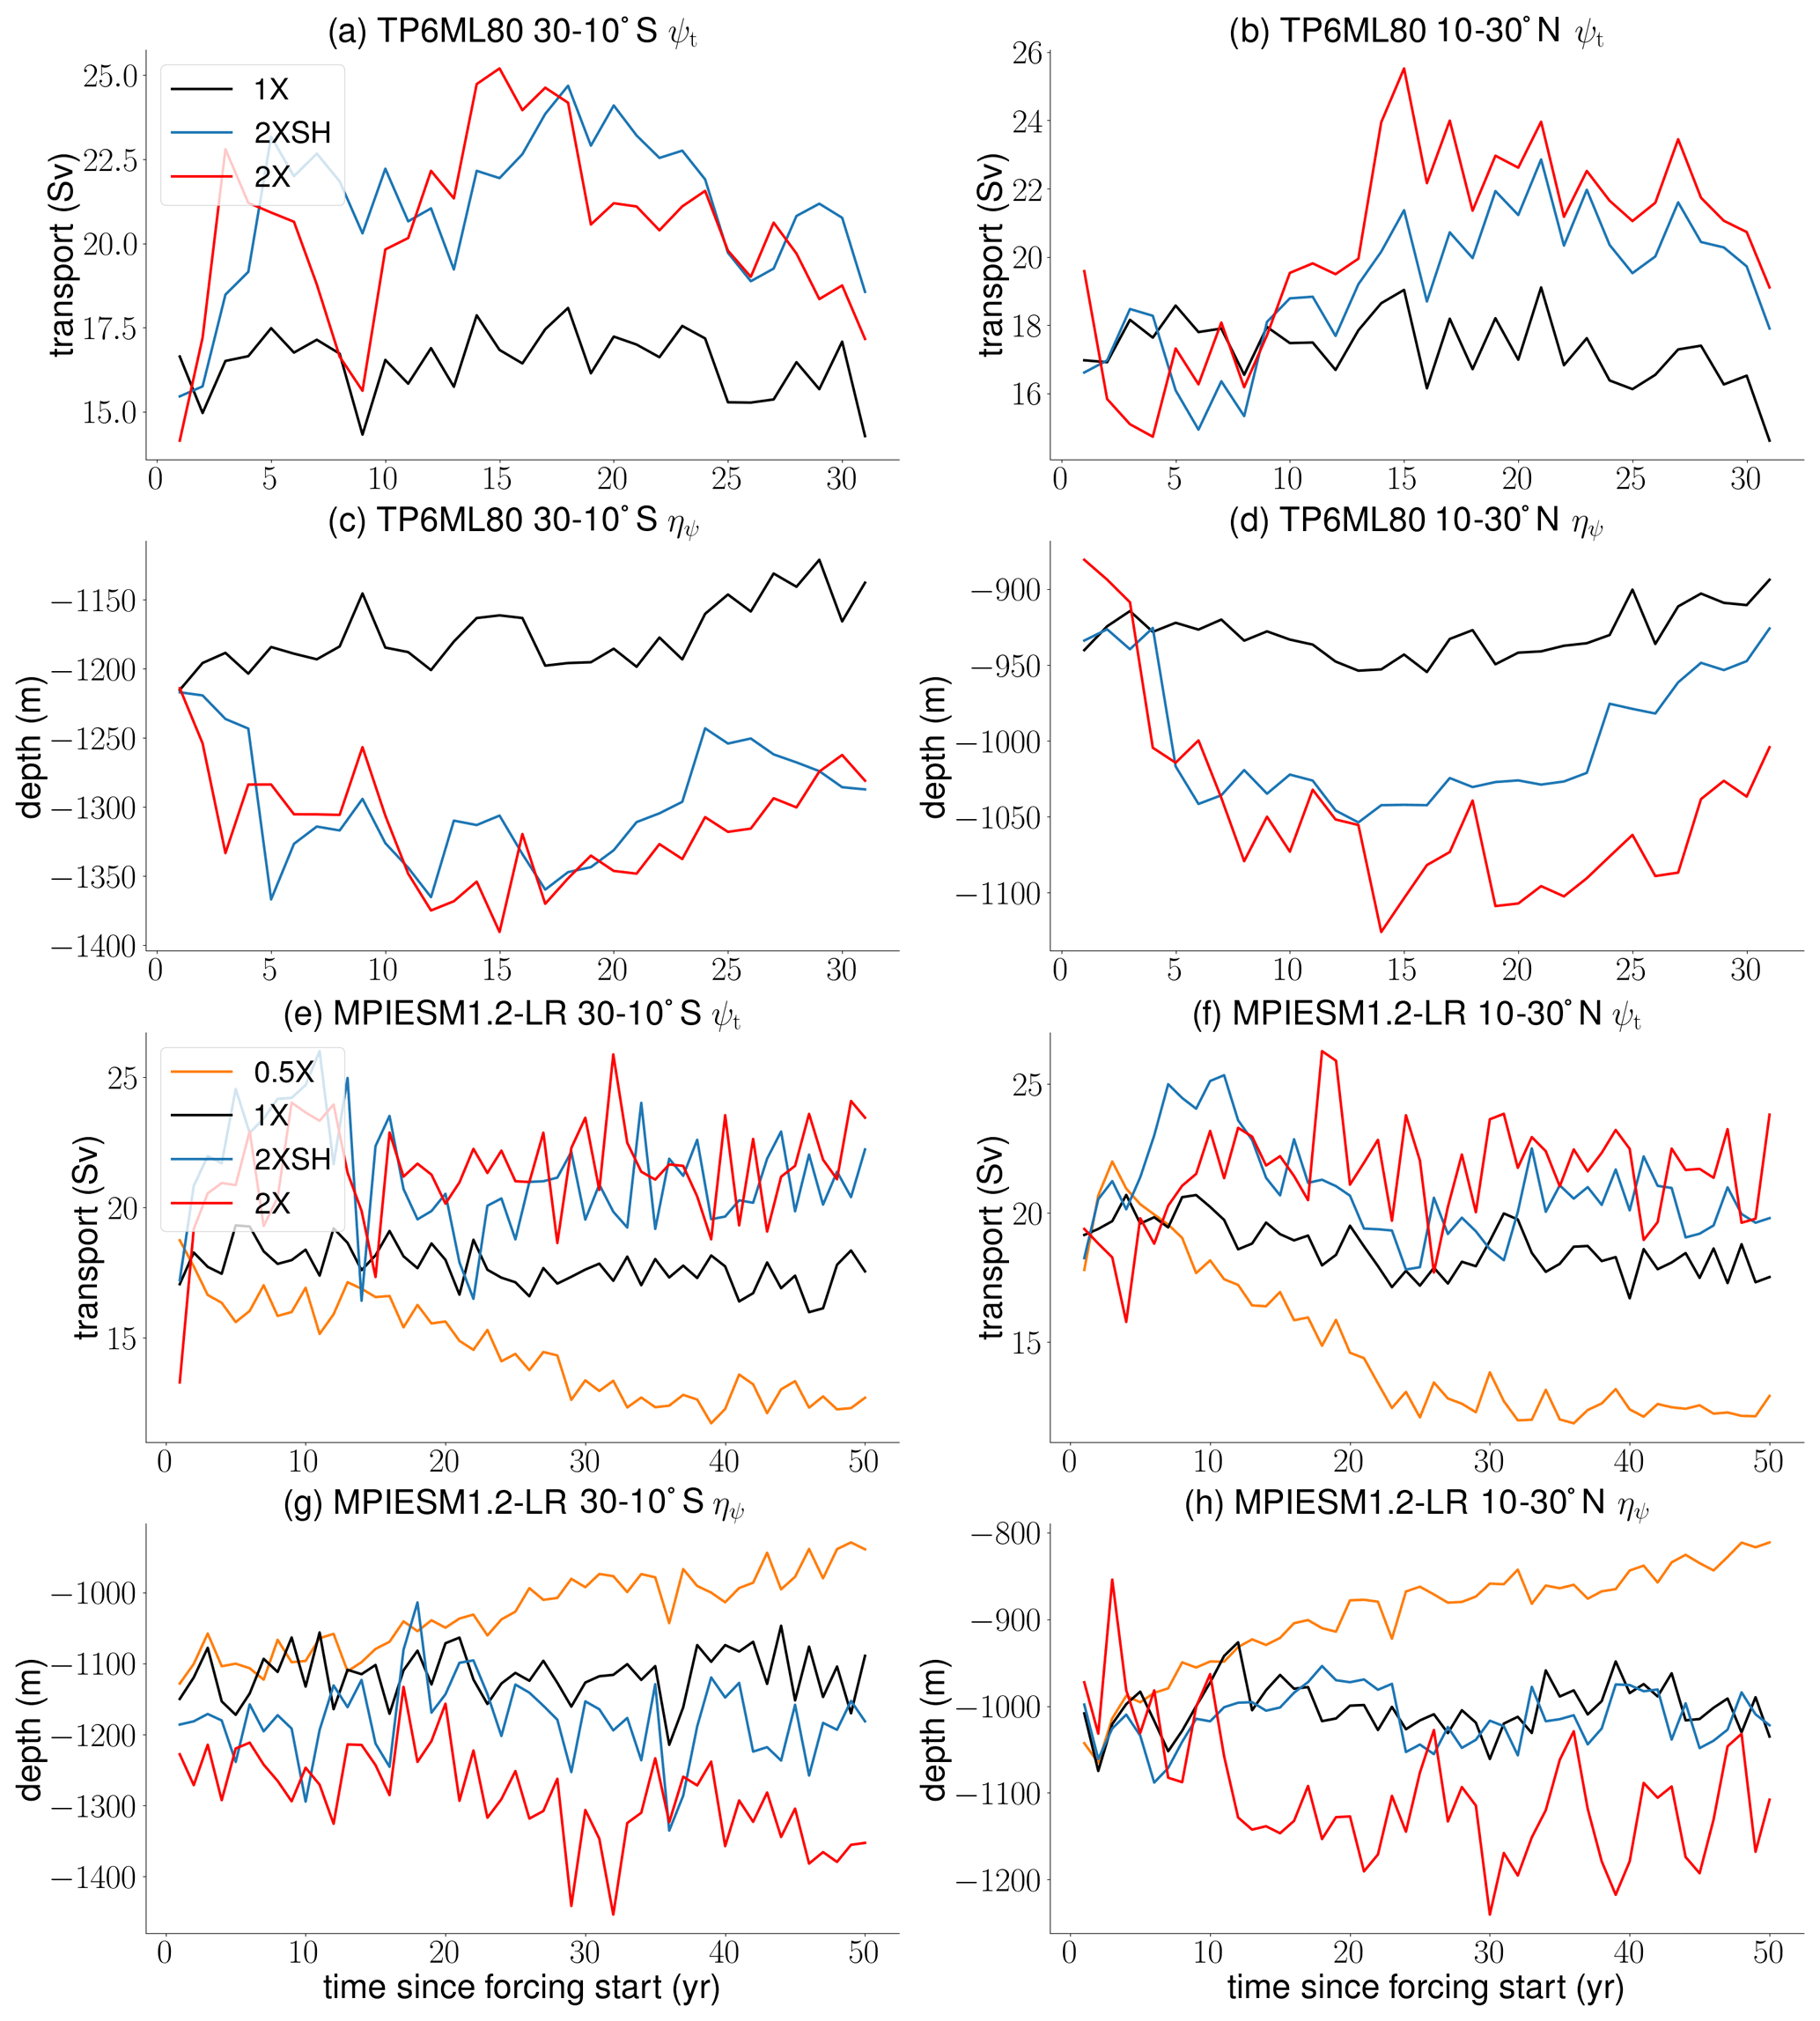
Figure 10The TP6ML80 time evolution (30–10∘ S, 10–30∘ N) of (a, b) maximum overturning and (c, d) the level of no motion after the forcing is switched on. The MPIESM1.2-LR time evolution (30–10∘ S, 10–30∘ N) of (e, f) maximum overturning and (g, h) the level of no motion after the forcing is switched on.
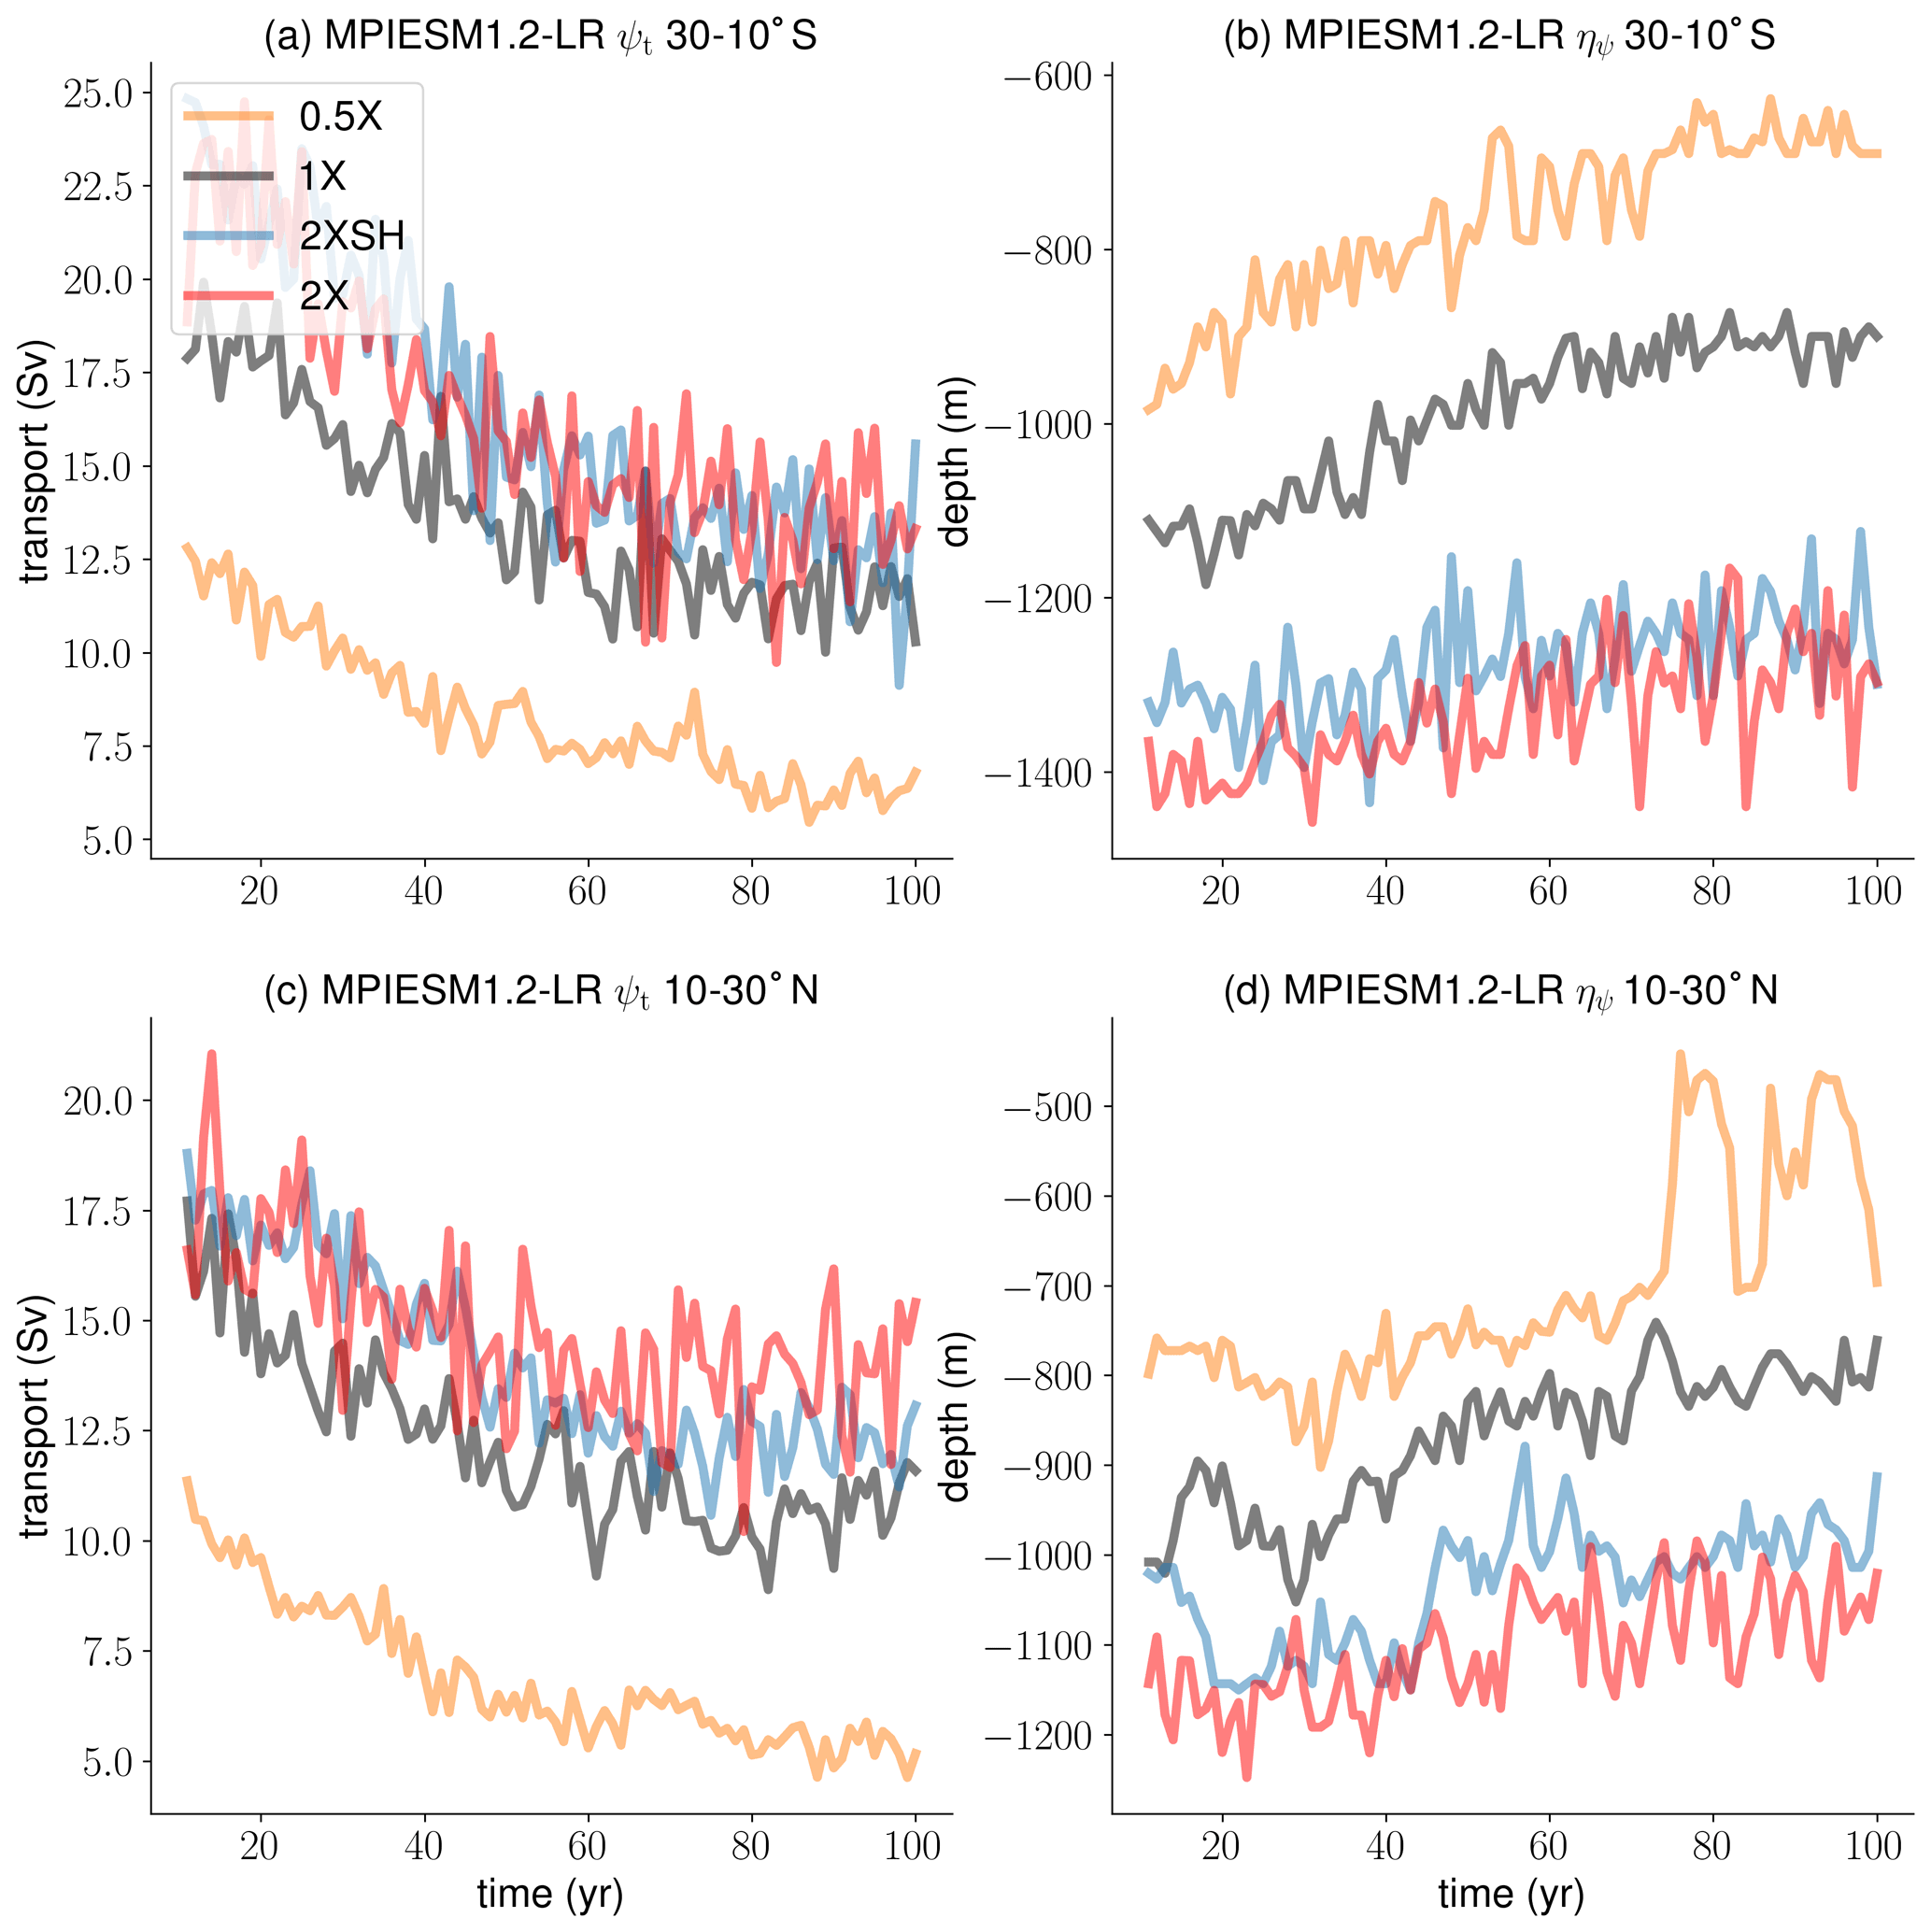
Figure 11The time evolution (30–10∘ S, 10–30∘ N) of (a, c) maximum overturning and (b, d) the level of no motion after the forcing is switched on in the global warming experiments with altered surface wind stress using MPIES1.2-LR. Atmospheric CO2 is quadrupled.
As a next step, we use an AGCM-OGCM coupled low-resolution model to simulate the wind forcing dependence in a low-resolution counterpart and on a longer timescale (50 years). The coupled model better simulates the salinity balance in the OGCM to which ocean dynamics are sensitive. The coupled model is MPIESM1.2-LR, with the low-resolution configuration of MPI0M being the OGCM component. The ocean model (GR15L40) has a horizontal resolution of 1.5∘ and 40 vertical levels only. We have a set of four experiments: the 2X experiment in which the zonal and meridional surface wind stress is doubled throughout the hemispheres; the 2XSH experiment in which the wind stress is doubled over the Southern Ocean only; the 1X experiment which is forced under no changes; and the 0.5X experiment in which the zonal and meridional wind stress is halved. We only change the ocean wind stress factor that multiplies the surface wind stress in the coupled model because we are interested in the OGCM dynamics only. It is an online multiplication of each wind stress value at each time step.
We find that in the 50 years' integration of the low-resolution model the response is apparently quasi-steady on this timescale (Fig. 10e–h). On longer timescales, internal, low-frequent variability may take place. We find that the wind forcing dependence of maximum overturning is similar to that of TP6ML80 and robust. However, there are major deviations in the level of no motion which does not reflect the wind forcing dependence in the high-resolution model outcome. The general finding that the level of no motion deepens with stronger wind forcing is confirmed, but the details between the 1X and 2XSH experiments are not well simulated. This may be due to model drift in the coupled model, or low-frequency oscillations, or the low vertical model resolution. The level of no motion is sensitive to small variations in the velocity field which may still adjust and oscillate. It seems that the nonlocal wind forcing dependence of the AMOC is less strong and the local wind forcing dependence is much stronger. The vertical velocity shear of the meridional velocity is not constant.
Disappointed from the finding that the level of no motion may not be well represented in the low-resolution MPIOM configuration, we looked for an alternative way to make sure that the wind forcing dependence of the AMOC would be robust. We computed the wind forcing dependence of the AMOC in 100-year global warming experiments with altered surface wind stress, using also MPIESM1.2-LR. We quadrupled atmospheric CO2 and applied the wind stress factor during the forward integration. We initialized with the control experiments with altered surface wind stress at year 30, after having explored that the initialization plays a minor role in the evolution of the AMOC in the global warming experiments. We believe the system is more strongly forced so that the forced underlying dynamics overcome internal oscillations and model drift. Figure 11 shows the wind forcing dependence (30–10∘ S, 10–30∘ N) of maximum overturning and the level of no motion in the global warming experiments with altered surface wind stress. Now the wind forcing dependence of maximum overturning and the level of no motion is the same as in the wind sensitivity experiments with TP6ML80.
In line with the current understanding of the Atlantic circulation, Southern Ocean winds boost the strength of the AMOC and change density stratification throughout the basin (e.g., Vallis, 2000; Klinger et al., 2003, 2004; Klinger and Cruz, 2009). Northern hemisphere winds over the downwelling region additionally influence the meridional flow and density stratification locally, which is commonly ignored in the scientific literature on the AMOC. The present study is based on simulations with an eddy-resolving OGCM on a decadal timescale rather than a fully equilibrated experiment. We find a robust adjustment of the AMOC and density field, which demonstrates the realization of major adjustments due to wave propagation, and the 30-year simulations are long enough to analyze the wind forcing dependencies of the depth scales and northward transport. The wind forcing dependence of the AMOC is reflected by the wind experiments.
The findings of the present study support the pycnocline model described in Gnanadesikan (1999) in the sense that Southern Ocean wind forcing deepens the pycnocline scale and the level of no motion, and strengthens the AMOC. However, local wind forcing over the Northern Hemisphere downwelling region additionally influences the level of no motion and northward transport locally. In that respect, the level of no motion is more appropriate to scale northward transport than the pycnocline scale. By artificial modification of density gradients in OGCM experiments, Griesel and Maqueda (2006) and DeBoer et al. (2010) indicate that the pycnocline scale does not scale northward transport at all. By contrast, we provide insight on the scaling behavior of the depth scales from a conceptual point of view, and the pycnocline scale fails to scale northward transport in the Northern Hemisphere.
Wind stress curl variations at the surface translate into changes in the AMOC. The changes in the AMOC with changing wind forcing in the inter-hemispheric region are explained by the changes in the level of no motion. The internal velocity shear that is not influenced by the external Ekman cells remains constant on the timescale considered here. In contrast to what is stated in Cabanes et al. (2008) who analyze inter-annual variability, the forcing imposed by the wind stress curl at the surface does not substantially change the vertical shear but rather the reference depth of the AMOC shear component. Our findings also deviate from those of Levermann and Fuerst (2010) who evaluate the pycnocline model using a model of intermediate complexity. They analyze equilibrated experiments which reproduce the response to Southern Ocean wind forcing and focus on meridional density gradients instead of zonal density gradients to represent vertical velocity shear. Using meridional density gradients instead of zonal density gradients is based on the assumption that these gradients are proportional and have the same order of magnitude, and zonal and meridional velocities compare well with one another. According to their findings, both the pycnocline scale and meridional density gradients vary, while according to our study the internal velocity shear remains approximately fixed. We speculate that our high-resolution simulation better simulates velocity shear.
The displacement of the level of no motion in the MPIOM wind experiments approximates the conditions in the interior with the Ekman cells mainly canceling out. Comparing the wind experiments, the ocean response at the upper levels is much more complex than the response at the deeper levels, which is mostly related to the baroclinicity of the interior return flow of the surface Ekman flux. However, integrating vertically, the changes that are associated with the level of no motion give approximately the changes in the total maximum overturning streamfunction with changing wind forcing. As a general contribution and supporting the theoretical considerations made in McCreary and Lu (1994), our findings give baroclinic Ekman compensation which has been demonstrated in an idealized way by Williams and Roussenov (2014). Baroclinic Ekman compensation may depend sensitively on the resolution of an OGCM.
An outcome of our experimental study is that northward overturning is well approximated by the level of no motion which reflects the wind forcing dependence of the AMOC. We demonstrate that, using the level of no motion, the flow can be subdivided into internal flow and external flow, because the external baroclinic Ekman cells that are directly forced by the surface winds cancel out by vertical integration. Our findings support baroclinic Ekman compensation which makes the level of no motion a proxy for northward overturning. That is, meridional Ekman transport in the Southern Hemisphere as well as in the Northern Hemisphere does not change the relationship between overturning and its depth. Thus, it does not change the wind forcing dependence of the AMOC because the surface Ekman flux is compensated above the level of no motion. Ekman pumping in the Southern Hemisphere and in the Northern Hemisphere does change the relationship between overturning and its depth. The explanation for the changes in maximum overturning and the level of no motion differs between the Southern Hemisphere and the Northern Hemisphere. In the Southern Hemisphere north of the ACC, Ekman pumping displaces isopycnals downward that span the basin meridionally. In the Northern Hemisphere the increase in transport and depth can be explained by continuity and isopycnals are displaced downward only locally. The wind-forced change in Ekman pumping gives a new advective balance. It forces the flow upstream of the meridional center of Ekman pumping, and a new dynamical balance is established downstream. We speculate that in this way maximum overturning and the level of no motion are altered. Both nonlocal Southern Ocean wind forcing and local wind forcing in the Northern Hemisphere downwelling region are likely to influence the adjustment of the level of no motion and northward transport in the inter-hemispheric region.
We use wind sensitivity experiments to analyze the wind forcing dependence of the depth scales of the inter-hemispheric cell in the Atlantic and their relationship to northward transport. We focus on the inter-hemispheric region in order to analyze the interplay of nonlocal and local wind effects, and our perspective deviates from the common view that the AMOC is a nonlocal phenomenon only. The dynamics of the inter-hemispheric cell can only be understood by analyzing both Southern Ocean wind effects and local wind effects in the Northern Hemisphere downwelling region which arises from the forcing imposed by the wind stress curl at the surface.
We find different wind forcing dependencies of the pycnocline scale and the level of no motion. Southern Ocean processes determine the magnitude of the pycnocline scale, whereas Northern Hemisphere wind stress additionally influences the level of no motion. The pycnocline scale is insensitive to the local wind stress over the Northern Hemisphere and cannot capture the details of deep velocity profiles and mid-depth stratification. Local wind forcing changes density stratification and displaces isopycnals downward at an advective depth. In that respect, the level of no motion is a better proxy for velocity profiles than the pycnocline scale, because the level of no motion accounts for the changes in the surface winds over the Northern Hemisphere.
To a large extent, the changes in transport at deeper levels below the surface layers between the wind experiments can be related to the changes in the level of no motion in the case that we hold the vertical velocity shear of the meridional velocity constant. The changes in the level of no motion between the wind experiments explain a large fraction of the changes in the meridional velocities. Near the surface, however, the signal that arises from the interior return flow of the surface Ekman flux overcomes the signal that arises from the displacement of the level of no motion. In this regard, the changes in meridional flow which are associated with the displacement of the level of no motion and the actual transport can differ considerably at these levels. However, the changes in maximum overturning with changing wind forcing are explained by the changes in the level of no motion only, because the internal velocity shear that is not influenced by the external Ekman cells stays constant.
There is no unique way to describe and quantify interior geostrophic flow that is not directly influenced by the local Ekman cells, and in this sense both the total maximum overturning streamfunction and the geostrophic maximum overturning streamfunction are approximations for the conditions in the interior. Our findings suggest that the differences in the total maximum overturning streamfunction are related to the differences in the level of no motion, since the surface Ekman fluxes are compensated mostly above the level of no motion. Compared with the total maximum overturning streamfunction, the geostrophic approximation makes a scaling more complex, but it is the result of the force balance below the surface Ekman layer. The hemispheric differences in the level of no motion and the associated meridional transport suggest a hemispheric scaling rather than a single depth scale approximation for the entire basin.
The present paper relies on experiments that are conducted with a single but horizontally high-resolution model. Low-resolution models may differ significantly from high-resolution models. We put forward the idea that the ability of numerical models to capture the spatial and temporal variations of the level of no motion is crucial to reproduce the mid-depth cell in an appropriate way. Changes in the relationships between the level of no motion and vertical velocity shear change the AMOC both quantitatively and dynamically.
Data will be published via MPG.PuRe (https://pure.mpg.de/pubman/faces/ViewItemOverviewPage.jsp?itemId=item_3279817, Rohrschneider et al., 2022). We publish the data associated with the present study during the external review process. The codes associated with the present study are available upon reasonable request.
TR conducted the research and developed the coding scripts associated with the present study. TR developed the text of the present manuscript. JB, VL, DP, and JM reviewed the manuscript and checked the consistency of the research results.
The contact author has declared that neither they nor their co-authors have any competing interests.
Publisher’s note: Copernicus Publications remains neutral with regard to jurisdictional claims in published maps and institutional affiliations.
We thank Oliver Gutjahr for the internal review of the manuscript. This work was funded by the Max Planck Society (MPG) and the International Max Planck Research School on Earth System Modelling (IMPRS ESM). Johanna Baehr received funding under Germany's Excellence Strategy, EXC 2037 “Climate, Climatic Change and Society” CLICCS (project no. 390683824), as a contribution to the Center for Earth System Research and Sustainability (CEN) of Universität Hamburg. Dian Putrasahan received funding under PRIMAVERA (grant no. 641727), a Horizon 2020 project funded by the European Commission. We also thank the German consortium project STORM for supporting the realization of high-resolution model simulations. Additionally, we thank Deutsches Klima Rechenzentrum (DKRZ) for providing the computational resources. Finally, we thank the anonymous reviewers and the editor for helpful comments.
The article processing charges for this open-access publication were covered by the Max Planck Society.
This paper was edited by A.J. George Nurser and reviewed by two anonymous referees.
Allison, L. C., Johnson, H. L., and Marshall, D. P.: Spin-up and adjustment of the Antarctic circumpolar current and global pycnocline, J. Mar. Res., 69, 167–189, https://doi.org/10.1357/002224011798765330, 2011. a
Baehr, J., Hirschi, J., Beismann, J. O., and Marotzke, J.: Monitoring the meridional overturning circulation in the North Atlantic: a model-based array design study, J. Mar. Res., 62, 283–312, https://doi.org/10.1357/0022240041446191, 2004. a
Baehr, J., Stroup, A., and Marotzke, J.: Testing concepts for continuous monitoring of the meridional overturning circulation in the South Atlantic, Ocean Modell., 29, 147–153, https://doi.org/10.1016/j.ocemod.2009.03.005, 2009. a
Bryan, F.: Parameter sensitivity of primitive-equation ocean general circulation models, J. Phys. Oceanogr., 17, 970–985, 1987. a, b
Cabanes, C., Lee, T., and Fu, L.-L.: Mechanims of Interannual Variations of the Meridional Overturning Circulation of the North Atlantic Ocean, J. Phys. Oceanogr., 38, 467–480, https://doi.org/10.1175/2007JPO3726.1, 2008. a, b
Cessi, P.: The Effect of Northern Hemisphere Winds on the Meridional Overturning Circulation and Stratification, J. Phys. Oceanogr., 48, 2495–2506, https://doi.org/10.1175/JPO-D-18-0085.1, 2018. a
DeBoer, A. M., Gnanadesikan, A., Edwards, N. L., and Watson, A. J.: Meridional Density Gradients Do Not Control the Atlantic Overturning Circulation, J. Oceanogr., 40, 368–380, https://doi.org/10.1175/2009JPO4200.1, 2010. a, b, c
Gent, P. R., Willebrand, J., McDougall, T. J., and McWilliams, J. C.: Parameterizing Eddy-Induced Tracer Transports in Ocean Circulation Models, J. Phys. Oceanogr., 25, 463–474, https://doi.org/10.1175/1520-0485(1995)025<0463:PEITTI>2.0.CO;2, 1995. a
Gnanadesikan, A.: A Simple Predictive Model for the Structure of the Oceanic Pycnocline, Science, 283, 2077–2079, https://doi.org/10.1126/science.283.5410.2077, 1999. a, b, c
Gnanadesikan, A., DeBoer, A. M., and Mignone, B. K.: A Simple Theory of the Pycnocline and Overturning Revisited, Ocean Circulation: Mechanisms and Impacts, Geophys. Monogr. Seri., 173, 19–32, https://doi.org/10.1029/173GM04, 2007. a
Griesel, A. and Maqueda, M. A. M.: The relation of meridional pressure gradients to North Atlantic deep water volume transport in an ocean general circulation model, Clim. Dynam., 26, 781–799, https://doi.org/10.1007/s00382-006-0122-z, 2006. a, b
Hirschi, J. and Marotzke, J.: Reconstructing the meridionaloverturning circulation from boundary densities and the zonal wind stress, J. Phys. Oceanogr., 47, 743–763, https://doi.org/10.1175/JPO3019.1, 2007. a, b
Hirschi, J., Baehr, J., Marotzke, J., Stark, J., Cunningham, S., and Beismann, J. O.: A monitoring design for the Atlantic meridional overturning circulation, Geophys. Res. Lett., 30, 1413, https://doi.org/10.1029/2002GL016776, 2003. a
Jayne, S. R. and Marotzke, J.: The dynamics of ocean heat transport variability, Rev. Geophys., 39, 385–411, https://doi.org/10.1029/2000RG000084, 2001. a
Johnson, H. L., Cessi, P., Marshall, D. P., Schloesser, F., and Spall, M. A.: Recent Contributions of Theory to Our Understanding of the Atlantic Meridional Overturning Circulation, J. Geophys. Res., 124, 5376–539, https://doi.org/10.1029/2019JC015330, 2019. a
Kalnay, E., Kanamitsu, M., Kistler, R., Collins, W., Deaven, D., Gandin, L., Iredell, M., Saha, S., White, G., Woollen, J., Zhu, Y., Chelliah, M., Ebisuzaki, W., Higgins, W., Janowiak, J., Mo, K. C., Ropelewski, C., Wang, J., Leetmaa, A., Reynolds, R., Jenne, R., and Joseph, D.: The NCEP/NCAR 40-year reanalysis project, Bull. Am. Meteorol. Soc., 77, 347–471, https://doi.org/10.1175/1520-0477(1996)077<0437:TNYRP>2.0.CO;2, 2018. a
Klinger, B. A. and Cruz, C.: Decadal Response of Global Circulation to Southern Ocean Zonal Wind Stress Perturbation, J. Phys. Oceanogr., 39, 1888–1904, https://doi.org/10.1175/2009JPO4070.1, 2009. a, b, c
Klinger, B. A., Drijfhout, S., Marotzke, J., and Scott, J. R.: Sensitivity of Basinwide Meridional Overturning to Diapycnal Diffusion and Remote Wind Forcing in an Idealized Atlantic–Southern Ocean Geometry, J. Phys. Oceanogr., 33, 249–266, https://doi.org/10.1175/1520-0485(2003)033<0249:SOBMOT>2.0.CO;2, 2003. a, b
Klinger, B. A., Drijfhout, S., Marotzke, J., and Scott, J. R.: Remote Wind-Driven Overturning in the Absence of the Drake Passage Effect, J. Phys. Oceanogr., 34, 1036–1049, https://doi.org/10.1175/1520-0485(2004)034<1036:RWOITA>2.0.CO;2, 2004. a, b
Levermann, A. and Fuerst, J. J.: Atlantic pycnocline theory scrutinized using a coupled climate model, Geophys. Res. Lett., 37, L14602, https://doi.org/10.1029/2010GL044180, 2010. a, b
Luyten, J. R., Pedlosky, J., and Stommel, H.: The ventilated Thermocline, J. Phys. Oceanogr., 13, 292–309, https://doi.org/10.1175/1520-0485(1983)013<0292:TVT>2.0.CO;2, 1983. a
Lüschow, V., von Storch, J.-S., and Marotzke, J.: Overturning response to a doubling of the surface wind stress in an eddying and a non-eddying ocean, J. Phys. Oceanogr., 51, 1007–1020, https://doi.org/10.1175/JPO-D-20-0176.1, 2021. a, b, c
Marotzke, J.: Boundary Mixing and the Dynamics of Three-Dimensional Thermohaline Circulations, J. Phys. Oceanogr., 27, 1713–1728, https://doi.org/10.1175/1520-0485(1997)027<1713:BMATDO>2.0.CO;2, 1997. a, b
Marotzke, J. and Klinger, B. A.: The Dynamics of Equatorially Asymmetric Thermohaline Circulations, J. Phys. Oceanogr., 30, 955–968, https://doi.org/10.1175/1520-0485(2000)030<0955:TDOEAT>2.0.CO;2, 2000. a
Marshall, D. P. and Johnson, H. L.: Relative strength of the Antarctic Circumpolar Current and Atlantic Meridional Overturning Circulation, Tellus A, 69, 1338884, https://doi.org/10.1080/16000870.2017.1338884, 2017. a
Marshall, J. and Speer, K.: Closure of the meridional overturning circulation through Southern Ocean upwelling, Nat. Geosci., 5, 171–180, https://doi.org/10.1038/ngeo1391, 2012. a
McCreary, J. P. and Lu, P.: Interaction between the Subtropical and Equatorial Ocean Circulations: The Subtropical Cell, J. Phys. Oceanogr., 24, 466–497, https://doi.org/10.1175/1520-0485(1994)024<0466:IBTSAE>2.0.CO;2, 1994. a, b
Moreno-Chamarro, E., Ortega, P., Gonzalez-Rouco, F., and Montoya, M.: Assessing reconstruction techniques of the Atlantic Ocean circulation variability during the last millennium, Clim. Dynam., 48, 799–819, https://doi.org/10.1007/s00382-016-3111-x, 2016. a
Munk, W. and Wunsch, C.: Abyssal recipes II: energetics of tidal and wind mixing, Deep-Sea Res. Pt. I, 45, 1977–2010, https://doi.org/10.1016/S0967-0637(98)00070-3, 1998. a
Rohrschneider, T., Baehr, J., Lüschow, V., Putrasahan, D., and Marotzke, J.: The depth scales of the AMOC on a decadal timescale, MPG.PuRe [data set], http://hdl.handle.net/21.11116/0000-0007-D24C-7, last access: 4 July 2022. a
Robinson, A. and Stommel, H.: The Oceanic Thermocline and the Associated Thermohaline Circulation, Tellus A, https://doi.org/10.1111/j.2153-3490.1959.tb00035.x, 1959. a
Scott, J. R.: The Roles of Mixing, Geothermal Heating, and Surface Buoyancy Forcing in Ocean Meridional Overturning Dynamics, PhD thesis, Massachusetts Institute of Technology, 2000. a
Shakespeare, C. J. and Hogg, A. M.: An Analytical Model of the Response of the Meridional Overturning Circulation to Changes in Wind and Buoyancy Forcing, J. Phys. Oceanogr., 42, 1270–1287, https://doi.org/10.1175/JPO-D-11-0198.1, 2012. a
Toggweiler, J. R. and Samuels, B.: Effect of Drake Passage on the global thermohaline circulation, Deep-Sea Res. Pt. I, 42, 477–500, https://doi.org/10.1016/0967-0637(95)00012-U, 1995. a
Tsujino, H. and Suginohara, N.: Thermohaline Circulation Enhanced by Wind Forcing, J. Phys. Oceanogr., 29, 1506–1516, https://doi.org/10.1175/1520-0485(2003)033<0249:SOBMOT>2.0.CO;2, 1998. a
Vallis, G. K.: Large-Scale Circulation and Production of Stratification: Effects of Wind, Geometry, and Diffusion, J. Phys. Oceanogr., 30, 933–953, https://doi.org/10.1175/1520-0485(1997)027<1713:BMATDO>2.0.CO;2, 2000. a, b, c
von Storch, J.-S., Eden, C., Fast, I., Haak, H., Deckers, D., Maier-Reimer, E., Marotzke, J., and Stammer, D.: An Estimate of the Lorenz Energy Cycle for the World Ocean Based on the STORM/NCEP Simulation, J. Phys.l Oceanogr., 42, 2185–2205, https://doi.org/10.1175/JPO-D-12-079.1, 2012. a
Welander, P.: An advective model of the ocean thermocline, Tellus A, https://doi.org/10.1111/j.2153-3490.1959.tb00036.x, 1959. a
Williams, R. G. and Roussenov, V.: Decadal Evolution of Ocean Thermal Anomalies in the North Atlantic: The Effects of Ekman, Overturning, and Horizontal Transport, J. Clim., 27, 698–719, https://doi.org/10.1175/JCLI-D-12-00234.1, 2014. a, b
Wolfe, C. L. and Cessi, P.: The Adiabatic Pole-to-Pole Overturning Circulation, J. Phys. Oceanogr., 41, 1705–1810, https://doi.org/10.1175/2011JPO4570.1, 2011. a
- Abstract
- Introduction
- Experiments and methods
- Wind forcing dependencies
- The relationship between the depth scales and velocity profiles
- Robustness of the wind forcing dependence
- Discussion
- Summary and conclusions
- Data availability
- Author contributions
- Competing interests
- Disclaimer
- Acknowledgements
- Financial support
- Review statement
- References