the Creative Commons Attribution 4.0 License.
the Creative Commons Attribution 4.0 License.
 | 18 Mar 2022
Sea-level variability and change along the Norwegian coast between 2003 and 2018 from satellite altimetry, tide gauges, and hydrography
Fabio Mangini
Léon Chafik
Antonio Bonaduce
Laurent Bertino
Jan Even Ø. Nilsen
Related authors
Coastal cities face growing flood risk from rising seas and storms. Scientists estimate dangerous water levels using satellite measurements of sea level and computer models of ocean behaviour, but the two are often combined inconsistently. We reviewed this research and found the real challenge is not merging the data, but making sure both methods measure the same thing, the same way. Solving this could lead to more reliable, consistent flood-risk estimates for coastal communities worldwide.
Coastal cities face growing flood risk from rising seas and storms. Scientists estimate dangerous water levels using satellite measurements of sea level and computer models of ocean behaviour, but the two are often combined inconsistently. We reviewed this research and found the real challenge is not merging the data, but making sure both methods measure the same thing, the same way. Solving this could lead to more reliable, consistent flood-risk estimates for coastal communities worldwide.

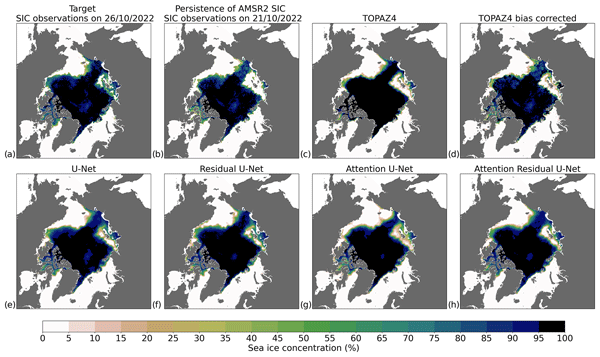
Sea ice forecasts are operationally produced using physically based models, but these forecasts are often not accurate enough for maritime operations. In this study, we developed a statistical correction technique using machine learning in order to improve the skill of short-term (up to 10 d) sea ice concentration forecasts produced by the TOPAZ4 model. This technique allows for the reduction of errors from the TOPAZ4 sea ice concentration forecasts by 41 % on average.