the Creative Commons Attribution 4.0 License.
the Creative Commons Attribution 4.0 License.
 | 17 Aug 2021
Freshwater in the Arctic Ocean 2010–2019
Amy Solomon
Céline Heuzé
Benjamin Rabe
Sheldon Bacon
Laurent Bertino
Patrick Heimbach
Jun Inoue
Doroteaciro Iovino
Ruth Mottram
Xiangdong Zhang
Yevgeny Aksenov
Ronan McAdam
An Nguyen
Roshin P. Raj
Han Tang
The Arctic climate system is rapidly transitioning into a new regime with a reduction in the extent of sea ice, enhanced mixing in the ocean and atmosphere, and thus enhanced coupling within the ocean–ice–atmosphere system; these physical changes are leading to ecosystem changes in the Arctic Ocean. In this review paper, we assess one of the critically important aspects of this new regime, the variability of Arctic freshwater, which plays a fundamental role in the Arctic climate system by impacting ocean stratification and sea ice formation or melt. Liquid and solid freshwater exports also affect the global climate system, notably by impacting the global ocean overturning circulation. We assess how freshwater budgets have changed relative to the 2000–2010 period. We include discussions of processes such as poleward atmospheric moisture transport, runoff from the Greenland Ice Sheet and Arctic glaciers, the role of snow on sea ice, and vertical redistribution. Notably, sea ice cover has become more seasonal and more mobile; the mass loss of the Greenland Ice Sheet increased in the 2010s (particularly in the western, northern, and southern regions) and imported warm, salty Atlantic waters have shoaled. During 2000–2010, the Arctic Oscillation and moisture transport into the Arctic are in-phase and have a positive trend. This cyclonic atmospheric circulation pattern forces reduced freshwater content on the Atlantic–Eurasian side of the Arctic Ocean and freshwater gains in the Beaufort Gyre. We show that the trend in Arctic freshwater content in the 2010s has stabilized relative to the 2000s, potentially due to an increased compensation between a freshening of the Beaufort Gyre and a reduction in freshwater in the rest of the Arctic Ocean. However, large inter-model spread across the ocean reanalyses and uncertainty in the observations used in this study prevent a definitive conclusion about the degree of this compensation.


1.1 Freshwater in the Arctic Ocean
Rapid changes in the Arctic climate system are impacting marine resources and industries, coastal Arctic environments, and large-scale ocean and atmosphere circulations. The Arctic climate system is rapidly transitioning into a new regime with a reduction in the extent of sea ice (Stroeve and Notz, 2018), a thinning of the ice cover (Kwok, 2018), a warming and freshening of the Arctic Ocean (Timmermans and Marshall, 2020), regionally enhanced mixing in the ocean and atmosphere, and enhanced coupling within the ocean–ice–atmosphere system (Polyakov et al., 2020a); these physical processes are leading to cascading changes in the Arctic Ocean ecosystems (Bluhm et al., 2015; Polyakov et al., 2020a). The emergent properties of this new regime, termed the “New Arctic” (Jeffries et al., 2013), are yet to be determined since altered feedback processes are expected to further impact upper ocean heat and freshwater content, atmospheric and oceanic stratification, the interactions between subsurface or intermediate warm waters and surface cold and fresh layer, among other properties (Carmack et al., 2016). In this review we assess one of the critically important aspects of this new regime, the variability of Arctic freshwater.
Freshwater in the Arctic Ocean plays a critical role in the global climate system; by impacting large-scale overturning ocean circulations (Sévellec et al., 2017; see Fig. 1 showing basins and upper circulation) by changing ocean stratification that affects sea ice growth, biological primary productivity (Ardyna and Arrigo, 2020; Lewis et al., 2020), and ocean mixing (Aagaard and Carmack, 1989) and by the emergence of freshwater regimes that couple variability in land, atmosphere, and ocean systems (e.g., Jeffries et al., 2013; Wood et al., 2013). Arctic Ocean freshwater is a balance between:
-
sources (relatively fresh Pacific oceanic inflow, precipitation, river runoff, ice sheet discharge, and sea ice melt) (Aagaard and Woodgate, 2001; Serreze et al., 2006; Bamber et al., 2012);
-
sinks (relatively saline Atlantic oceanic inflow, sea ice growth, evaporation, and liquid and solid transport through oceanic gateways) (Aagaard and Carmack, 1989; Rudels et al., 1994; Serreze et al., 2006; Haine et al., 2015);
-
redistribution between Arctic basins and vertical mixing (e.g., Timmermans et al., 2011; Morison et al., 2012; Proshutinsky et al., 2015).
These processes are not necessarily independent and are largely driven by atmospheric variability both within the Arctic and from lower latitudes.
Oceanographers have long been accustomed to the use of “freshwater” as an identifiable and separable component of seawater, either as a freshwater volume or a freshwater flux component of a seawater volume or flux. It usually manifests as a small fraction of the seawater volume or flux, where the fraction takes the form () and where is the deviation of the seawater salinity S from a reference value Sref. The sign in the numerator is conventionally reversed so that a positive-scaled salinity anomaly reflects a freshwater reduction and vice versa. However, scientists' familiarity with this usage perhaps disguises the fact that it is an arbitrary construct: the concept of “reference salinity” and values attributed to it are not rigorously mathematically and physically defined.
Since this is a review of existing literature and in light of established practice, we continue to employ here the “traditional” approach to freshwater flux calculation by use of a fixed reference salinity. For completeness we include a discussion of recent studies that highlight the ambiguity that arises when a constant reference salinity is used to calculate freshwater fluxes. The significant freshwater flux differences that can arise from the use of different reference salinities are illustrated and quantified by Tsubouchi et al. (2012) as well as by Schauer and Losch (2019). Schauer and Losch (2019) argue that it is preferable to use the uniquely defined salt budget as an absolute and well-posed physical quantity. However, Bacon et al. (2015) observed that a true freshwater flux occurs without ambiguity at the surface where freshwater is exchanged between ocean and atmosphere (via precipitation and evaporation) and where the ocean receives freshwater input from the land (as river or other runoff). This atmosphere–ocean surface freshwater flux is a key element of the global freshwater cycle, predicted to amplify with global warming, hence the importance of knowledge of this surface flux, its impacts on the ocean, and the ocean's redistribution (and storage) of these impacts. Salinity, by comparison, is of indirect interest for its role in seawater density, buoyancy, etc. Bacon et al. (2015) recognize that a surface flux requires definition of a surface area. They then use a time-varying ice and ocean control volume (or “budget”) approach, combined with mass and salt conservation, to generate a closed mathematical expression where the surface freshwater flux is given by the sum of three terms: (i) the divergence of the (scaled) salt flux around the boundary of the control volume, (ii) the change in total (ice and ocean) seawater mass within the control volume (or change in mass storage), and (iii) the (scaled) change in mass of salt within the control volume (the change in salinity storage). The “scaling” term that emerges from the mathematics performs the same function as the traditional reference salinity but in its place is the control volume's ice and ocean boundary mean salinity, which has uncomfortable implications in that it can vary in time and with boundary geography. This is a consequence of the nature of the calculation, which quantifies surface freshwater fluxes. Carmack et al. (2016) interpret the Arctic case thus: the surface freshwater flux is what is needed to dilute all the ocean inflows to become the outflows, allowing for interior storage changes. An exactly equivalent interpretation is that surface freshwater fluxes and the relatively fresh Bering Strait sea water inflow combine to dilute the relatively saline Atlantic water inflow, which then become the outflows (allowing for storage), where “relatively” means relative to the boundary mean salinity.
Forryan et al. (2019) pursue the surface freshwater flux approach, noting that (as is well known, e.g., Östlund and Hut, 1984) evaporation and freezing are distillation processes that leave behind a geochemical imprint via oxygen isotope anomalies on the affected freshwater in the sea ice and seawater. In the case of evaporation, distillation (here, isotopic fractionation) preferentially removes lighter oxygen isotopes from seawater, leaving behind in the seawater a proportion of heavier isotopes. The lighter isotopes that are now in the atmosphere return to the land or sea surface as precipitation. Those falling on land can (eventually) transfer from land to sea by river runoff, by other glacial processes, or by further cycles of evapotranspiration and precipitation. For sea ice, the ice contains the lighter isotopes while heavier isotopes are contained in the brine that drains out of the ice during freezing to re-enter the ocean. The isotopically lighter meteoric fractions are used to quantify freshwater that originates from the atmosphere (directly or indirectly), and the isotopically heavier fractions similarly quantify the signal of brine rejected from sea ice and thereby the amount of ice formed from that seawater. The Forryan et al. (2019) study shows that, within uncertainties, the geochemical approach produces the same surface freshwater flux as the budget approach.
Freshwater input to the Arctic Ocean is almost entirely confined to the upper water column and comes in the form of continental runoff, including from glacier melt, waters of Pacific origin, various coastal currents, and precipitation. In addition, freshwater input from the Greenland Ice Sheet and other marine terminating glaciers has three subsurface contributions: (i) melting from calved icebergs (Moon et al., 2017), (ii) submarine melt rates that may produce a freshwater plume, which may or may not become neutrally buoyant below the surface (Straneo et al., 2011), and subglacial runoff. Melt plumes that are amplified by seasonal subglacial runoff are more likely to reach the surface. Jenkins (2011) refers to a melt plume in the absence of subglacial runoff as “melt-driven convection”, whereas runoff (an added buoyancy source) incurs “convection-driven melting”. Overall, the freshwater flux magnitude from Greenland into the Arctic Mediterranean remains small compared to that of Arctic river runoff for the 1961–1990 period. Bamber et al. (2012) estimate around 184 km3 yr−1 freshwater flux from North and Northeast Greenland into the Arctic Mediterranean. Given that this region is mostly on the continental shelves adjacent to the Fram and Nares straits, it is likely that much of the discharge from northern Greenland is rapidly exported. Another 432 km3 yr−1 from West and Southwest Greenland are discharged into Baffin Bay and Labrador Sea and 266 km3 yr−1 from Southeast Greenland into the Irminger basin. For comparison, there is a total of 2440 km3 yr−1 of combined Arctic river runoff over the same period (Bamber et al., 2012); Haine et al. (2015) provide numbers of 3900 km3 yr−1 ± 10 % for the 1980–2000 period and 4200 km3 yr−1 ± 10 % for the 2000–2010 period, i.e., almost twice as large).
The upper Arctic Ocean is hence characterized by salinity values lower than that of the inflow of waters of largely Atlantic origin through the Fram Strait and the Barents Sea opening. The result is an extremely stratified Arctic Ocean with a shallow seasonal mixed layer on average less than 100 m thick and a halocline that is the result of all the inflows (McLaughlin et al., 1996; Rudels et al., 2004). Below the halocline sits the “Atlantic layer”, which is comparatively warm and salty, and below this are the Arctic Ocean deep waters (Aagaard et al., 1985; Rudels, 2012). Vertical fluxes of freshwater are generally low due to this strong stratification and very low vertical turbulent mixing and diffusion (e.g., Fer, 2009). The reviews of Carmack et al. (2016) and Haine et al. (2015) confirm the picture above; hence, they mainly considered the Arctic freshwater budget in the near-surface layers. This current study expands on their work and describes the processes impacting the vertical (re)distribution of freshwater throughout the entire water column.
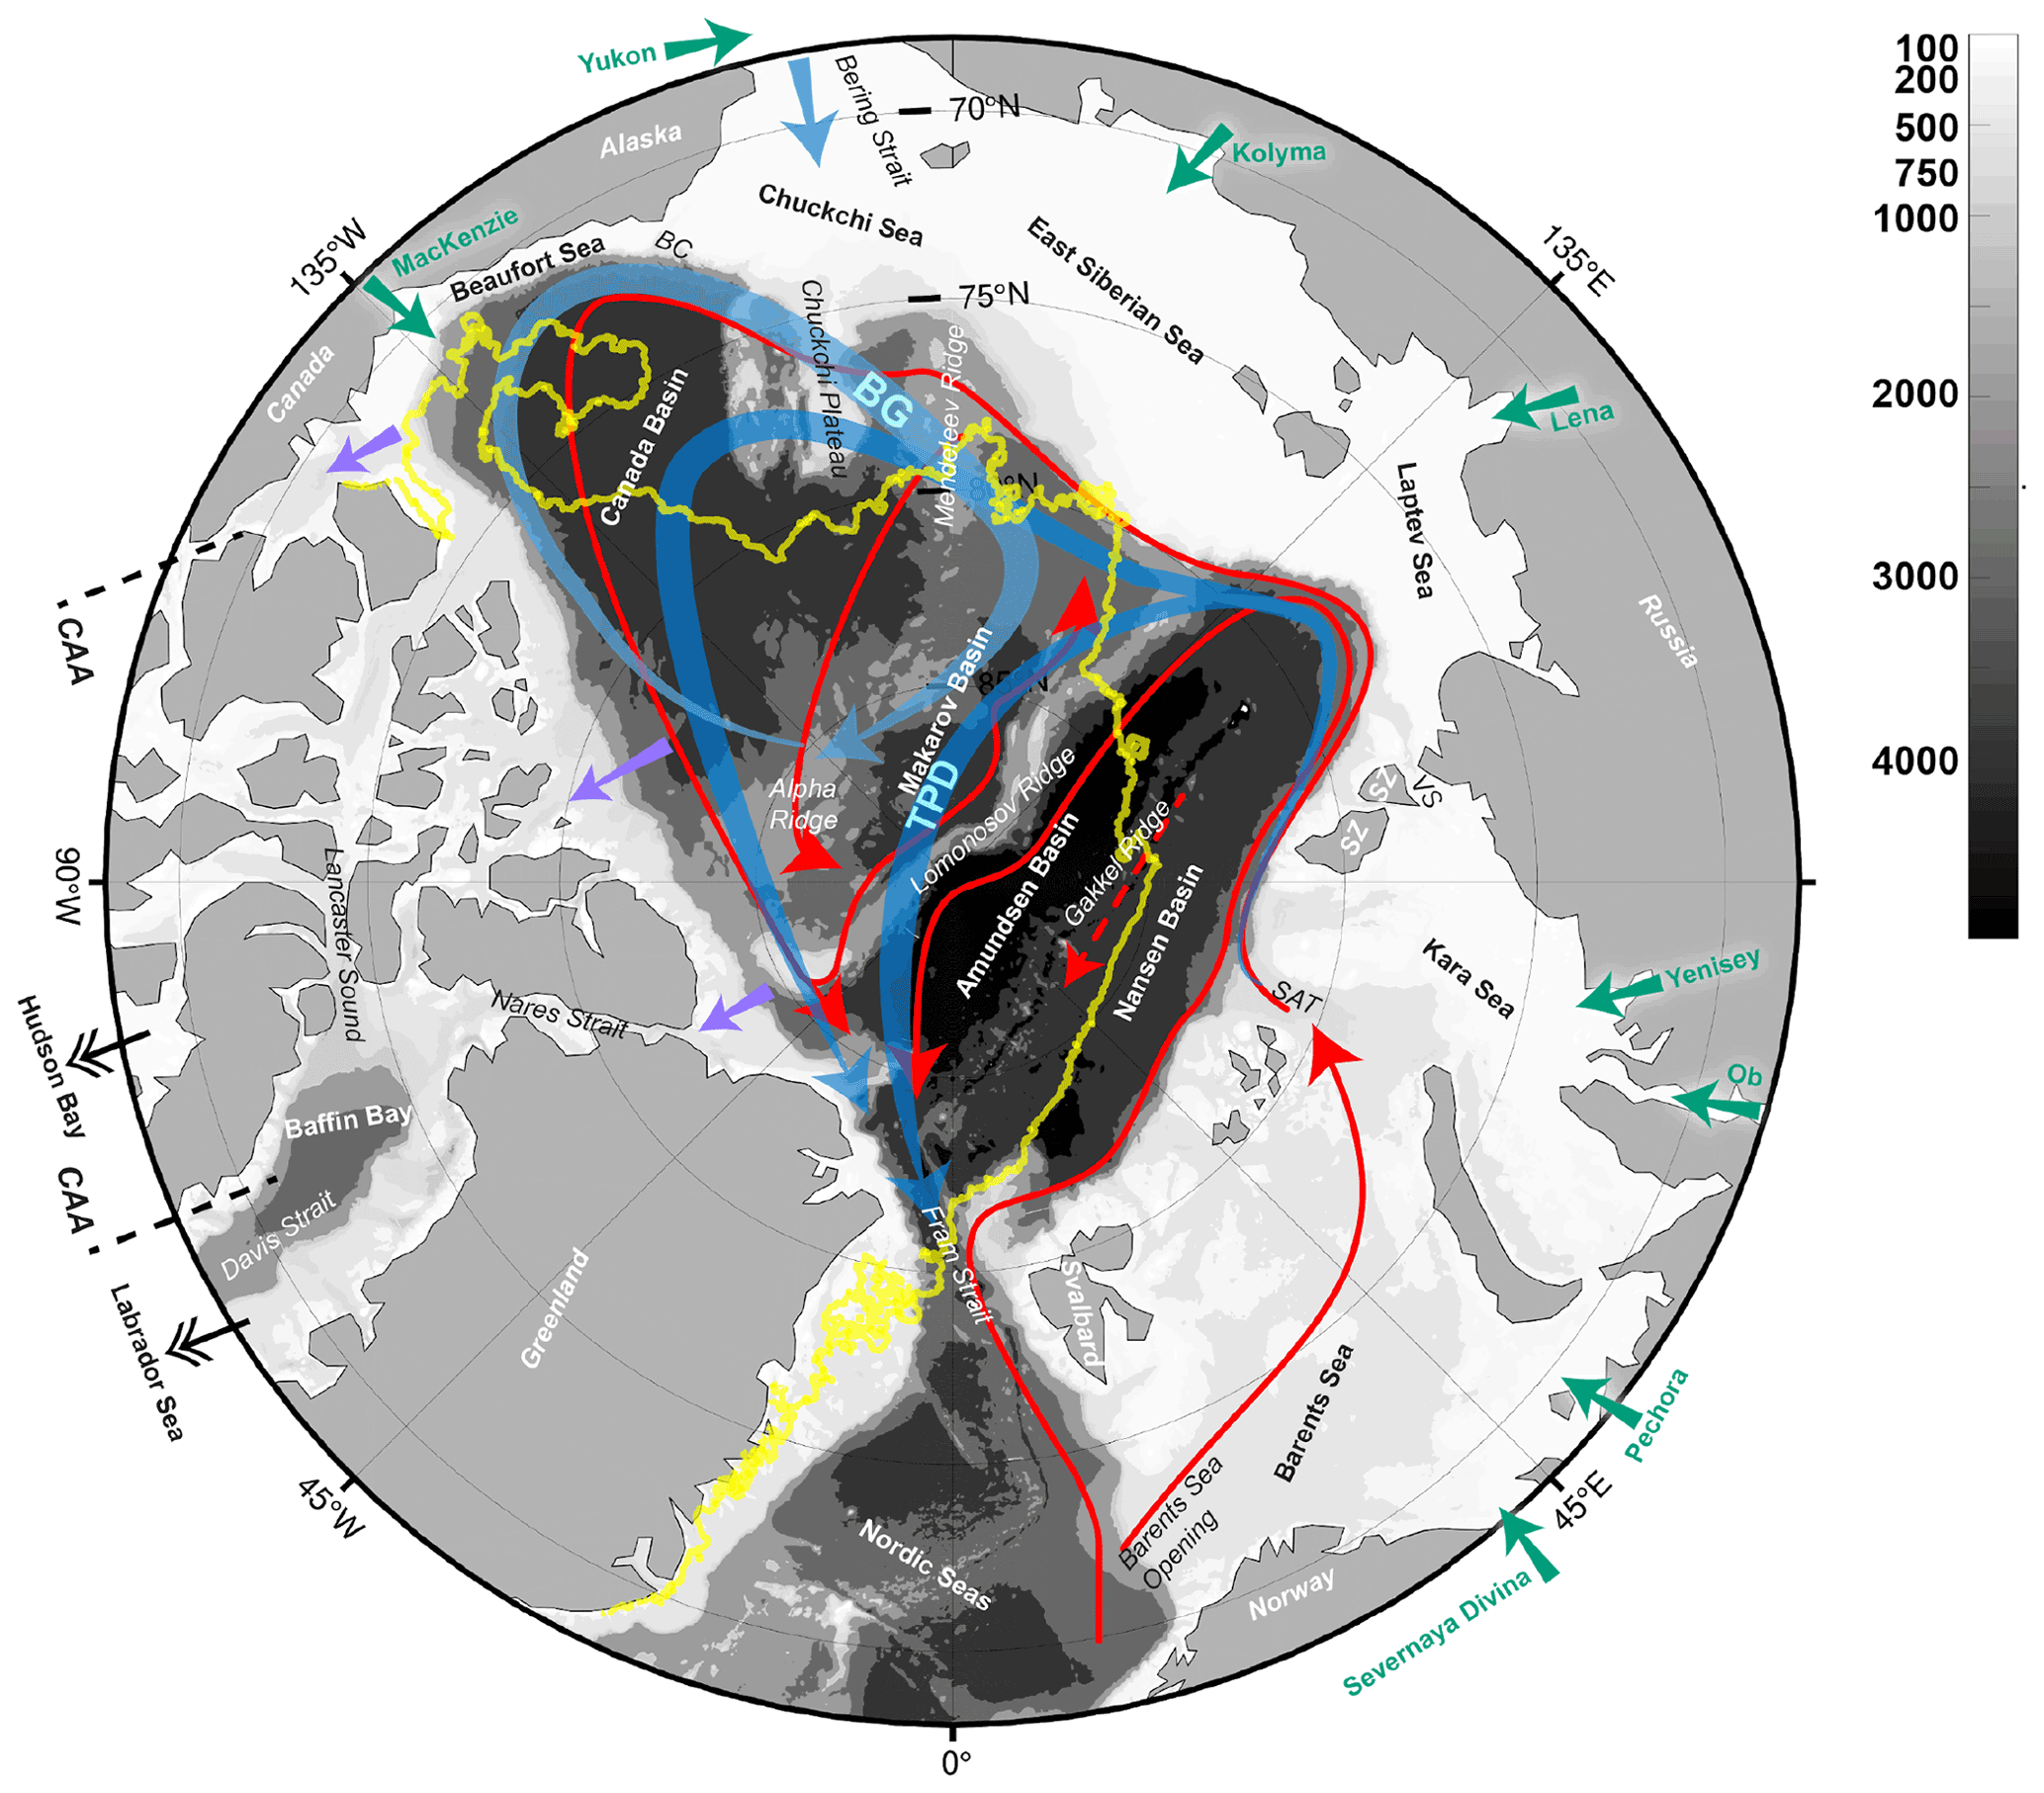
Figure 1Map of the Arctic Ocean with names of major basins and shelf seas as well as ocean circulation features: major river and Pacific inflow (cyan and turquoise) and surface outflows (purple), 2020 minimum sea ice edge (yellow), cold and fresh upper ocean circulations (polar surface water and halocline; blues), and warm and salty Atlantic water circulation (red). Areas shallower than 1000 m are referred to as shelf areas in the text. BG: Beaufort Gyre; TPD: transpolar drift; BC: Barrow Canyon; CAA: Canadian archipelago; SAT: St. Anna Trough; VS: Vilkitsky Strait; SZ: Severnaya Zemlya.
Assessments of Arctic freshwater for the 2000–2010 period relative to 1980–2000 were completed as part of the WCRP/IASC/AMAP Arctic Freshwater Synthesis (Prowse et al., 2015; Carmack et al., 2016; Vihma et al., 2015) and the Arctic–Subarctic Ocean Fluxes program (Haine et al., 2015). These projects found that liquid freshwater increased by 25 % (5000 km3) in the Beaufort Gyre; the Beaufort High was stronger than normal with higher sea level, a deeper halocline, stronger anticyclonic flow, and stronger transpolar drift (Proshutinsky et al., 2009; McPhee et al., 2009; Rabe et al., 2011; Haine et al., 2015). However, estimates of fluxes through the Fram Strait and the Labrador Sea were either too uncertain or showing statistically insignificant changes, leading to speculation on whether freshwater accumulated in the Arctic Ocean, if released via these Arctic gateways, could substantially impact the global ocean overturning circulation and climate (e.g., Haine, 2020; Zhang et al., 2021). In these studies, processes such as the redistribution of freshwater between basins and vertical redistribution due to turbulent mixing were not taken into account, leading to uncertainty in this speculation.
The observed Beaufort Gyre freshening is illustrated in Fig. 2, which shows 1993–2019 annual mean Arctic Ocean freshwater from seven state-of-the-art global ocean reanalyses (ORAs; see Table 1 for a description of the models used in this study). Significant freshening in the Beaufort Gyre is seen in 2010–2017 means minus 2000–2010 means in six ORAs (Fig. 2b, not including ASTE_R1, using the common 2010–2017 period for the difference maps). However, this freshening is partly compensated by a reduction in freshwater in the rest of the Arctic Ocean (Fig. 2b, c). This compensation increases in 2010–2018 compared to 2000–2010, which flattens the total Arctic Ocean freshwater trend when extended to 2019 (Fig. 2a). This is characteristic of the cyclonic mode of circulation (Morison et al., 2012, 2021; Sokolov, 1962). However, there is a significant spread in estimates of freshwater content in the Beaufort Gyre and the rest of the Arctic Ocean (Fig. 2d), which prevents a definitive estimate of the degree of this compensation. The wide variability in Freshwater Content (FWC) change among the ORAs in the Siberian Shelf seas is likely due to the paucity of observations there in recent years. Morison et al. (2021) speculate that the in situ observations have had an increasing spatial bias toward the Beaufort Sea. This highlights the need to be able to estimate the redistribution of freshwater when assessing changes in Arctic Ocean freshwater as well as the recent reduction in total Arctic Ocean freshening relative to the 2000–2010 period.
In this review we assess to what extent the 2010–2019 freshwater budget has changed relative to the 2000–2010 period. This study is not meant to be a comprehensive assessment of all processes that contribute to Arctic freshwater. Instead, we focus on specific aspects that provide insight into how the variability has changed since 2010 and the role of processes not considered in previous assessments.

Figure 2Ordered counterclockwise: (a) Time series of annual freshwater content integrated from 70–90∘ N and down to the 34 isohaline for the 1993–2019 period from six ORAs (in 103 km3). Multi-model mean shown in red; darker red indicates all six ORAs are included. (b) Difference (in m) between 2010–2017 and 2000–2010 means in five ORAs (not including ASTE_R1). (c) Multi-model mean of differences (in m) shown in (b). (d) Annual freshwater content separated into contributions from the Beaufort Gyre (blue) and the rest of the Arctic Ocean (red). The lower right figure shows the multi-model mean with ± 1 standard deviation shown with shading. The Beaufort Gyre is defined as 70–80∘ N, 120–180∘ W to be consistent with the satellite estimates below.
Table 1Global ocean reanalyses used in this study. T: temperature data; S: salinity; SST: sea surface temperature; SSS: sea surface salinity; SSH: sea surface height; SIC: sea ice concentration; SIT: sea ice thickness; DA: data assimilation; CORE: Coordinated Ocean-ice Reference Experiment; COARE4: Coupled Ocean–Atmosphere Response Experiment bulk flux parameterization version 4.

1.2 Arctic freshwater estimates from in situ and satellite measurements
1.2.1 Satellite measurements
A major challenge in the retrieval of freshwater fluxes in the Arctic Ocean is associated with the lack of availability of in situ observations. Direct measurements are non-homogenous in both time and space and rely on spatial as well as temporal interpolation, resulting in large uncertainties. The ability to estimate freshwater content of the Arctic region indirectly from satellite observations is a major breakthrough. The methodology, which exploits the satellite derived ocean mass change and satellite altimeter data, is detailed in Giles et al. (2012), Morison et al. (2012), and Armitage et al. (2016). It derives from the perceptions (1) that the sea surface height change (as observed by satellite altimeters) is the sum of two components: mass addition (or loss) and steric expansion (or contraction), and (2) that observation of mass changes (by satellite gravimetry) enables separation of these two components. A two-layer model is assumed where the sea surface height and interface depth are variable and where the upper layer represents the halocline (and surface mixed layer) and the lower layer all underlying waters. Upper layer thickness changes (per unit water column area) are then a function of changes in sea surface height and water column mass with assumed layer densities; changes in freshwater content are then the thickness changes scaled by with reversed sign. Giles et al. (2012) assume Sref (their S2) equals 34.7 and upper layer salinity equals 27.7. While this is a very simple model, the observed signals are significantly larger than the uncertainty, as shown in their thorough uncertainty assessment (Supplement in Giles et al., 2012).
Our understanding of the Earth's gravity field has improved considerably over the last decade, thanks to the Gravity Recovery and Climate Experiment (GRACE) mission launched in 2002. GRACE is the only satellite mission designed to be directly sensitive to mass changes by means of gravity. The variability in spatiotemporal characteristics of the Earth's gravitational field resulting in very small deviations in the separation between the two satellites of the GRACE mission are measured with micrometer precision and are used to infer the Earth's gravity field, which can then be used to estimate changes in ocean mass (Peralta-Ferriz et al., 2014; Armitage et al., 2016). Here we use the latest Release 06 gridded GRACE ocean mass products from the Jet Propulsion Laboratory (Watkins et al., 2015). Satellite radar altimeters on the other hand can retrieve sea surface heights in the open ocean with variable precision depending on the number of flying altimeters and have been uninterrupted since 1993. CryoSat-2, launched in 2010, is a satellite altimeter that provides coverage up to 88∘ N with much better spatial resolution than before. Several studies have utilized this source to study the sea level variability of the Arctic (Kwok and Morison, 2016, 2017; Armitage et al., 2018a, b; Rose et al., 2019; Raj et al., 2020). However, constructing precise altimeter derived sea level data in the Arctic Ocean is still a challenge. One of them is the effect of melt ponds during summer on the waveforms, which dominate the reflected signal. A better understanding of the radar altimeter response over the different ice types must be gained to improve the quantity and quality of the range retrievals in the Arctic Ocean. One of the ongoing efforts is the CRYO-TEMPO project, funded by the European Space Agency.
Satellites can monitor some important pieces of the Arctic freshwater puzzle. Here, we use the state-of-the-art sea level product produced as part of the recently concluded climate change initiative (CCI) project (sea level budget closure; Horwath et al., 2020) of the European Space Agency. This Arctic sea level product (DTU/TUM SLA record; Rose et al., 2019) is the first one that includes a physical retracker (ALES+) for retrieving the specular waveforms from open leads in the sea cover. The sea state bias corrected using ALES+ improves the sea level estimates of the region (Passaro et al., 2018). The latest version (v3.1) of the DTU/TUM SLA record is a complete reprocessing of the former DTU Arctic sea level product (Andersen et al., 2016) by dedicated Arctic retracking. The current study thus takes advantage of the state-of-the-art satellite datasets to study the freshwater content of the region following Giles et al. (2012) and Armitage et al. (2016).
Freshwater is calculated using the satellite measurements using these equations:
where η is the change in SSH, Δm is the ocean mass anomaly, N is the number of grid cells, and A is the grid cell area. The salinities S1 and S2 are, respectively, 27.7 and 35, while the densities ρ1 and ρ2 are 1022 and 1028, respectively, in units of kg m−3.
Time series from 2002 to 2018 using GRACE-derived ocean bottom pressure (OBP) anomalies (https://podaac.jpl.nasa.gov/GRACE, last access: 22 June 2020) and satellite altimeter data provide insights into the redistribution of freshwater in the Arctic Ocean (Fig. 3). While initial results from GRACE suggest an overall OBP decrease caused by a fresher Arctic surface (Morison et al., 2007), results on the now-longer time series show more complex interannual variability, in agreement with modeling data (e.g., de Boer et al., 2018). Figure 3a (red line) shows that freshwater content increases in the Beaufort Gyre during the 2002–2010 period, followed by a stabilizing phase where the increase flattens out. However, including freshwater content outside of the Beaufort Gyre (blue line in Fig. 3a; defined as the region contoured in Fig. 3c) results in a reduction in freshwater content during the 2010–2016 period, indicating increased compensation between freshwater content in the Beaufort Gyre and outside the Beaufort Gyre after 2009. Raj et al. (2020) noted a similar signature in the altimeter derived sea surface height anomaly and the halosteric component of the sea surface height anomaly and attributed it to the change in the dominant atmospheric forcing over the Arctic, which changed from the Arctic dipole pattern to the Arctic Oscillation, respectively, during the time periods prior to and after 2010. These results are qualitatively consistent with estimates in Fig. 2 using the ocean reanalyses. In addition, Fig. 2c shows that the regions not included in Fig. 3 make only small contributions to the time series in Fig. 2. It is well known that while the sea surface height variability in the Beaufort Gyre region is dictated by the variability in salinity, the same variability in the Nordic Seas and the Barents Sea is controlled by Atlantic water temperature as opposed to salinity (Raj et al., 2020). Hence, the methodology to estimate FWC from sea surface height data is not recommended in those two regions. Our study included the rest of the Arctic excluding the Canadian Archipelago, Nordic Seas, and Barents Sea.
1.2.2 In situ measurements
Figure 3b includes estimates of Arctic freshwater content from in situ hydrographic observations (black line). The time series of freshwater content for the whole basin to the 34 isohaline is extended from Rabe et al. (2014a). Details of the mapping procedure and the distribution of hydrographic stations until 2012 are given in Rabe et al. (2014a). Further data are based on the data sources listed in Table 2. Interestingly, the Arctic satellite and in situ time series in Fig. 3a, b are relatively consistent before 2009 but do not show the same variability after 2009. This difference may stem from the lack of data coverage in the in situ measurements, the different regions used in the time series, and the choice of time period for the mean used to obtain anomalies. The satellite time series uses the region contoured in Fig. 3c and the in situ time series uses observations within the basin excluding the shelves, indicating a good part of the difference after 2009 may be due to the contribution by the rest of the basin outside the Beaufort Gyre. In addition, the annual values of the in situ time series are biased towards the prior three years near the end of the time series, as the mapping analysis only includes data up to 2015; 2012, 2013 and 2014 show similar levels as 2015. The locations of all profiles used between 1992 and 2015 show that there are interannual variations in data coverage but that overall, the decadal timescale is reasonably well covered across the Arctic Ocean basin (Fig. 3).
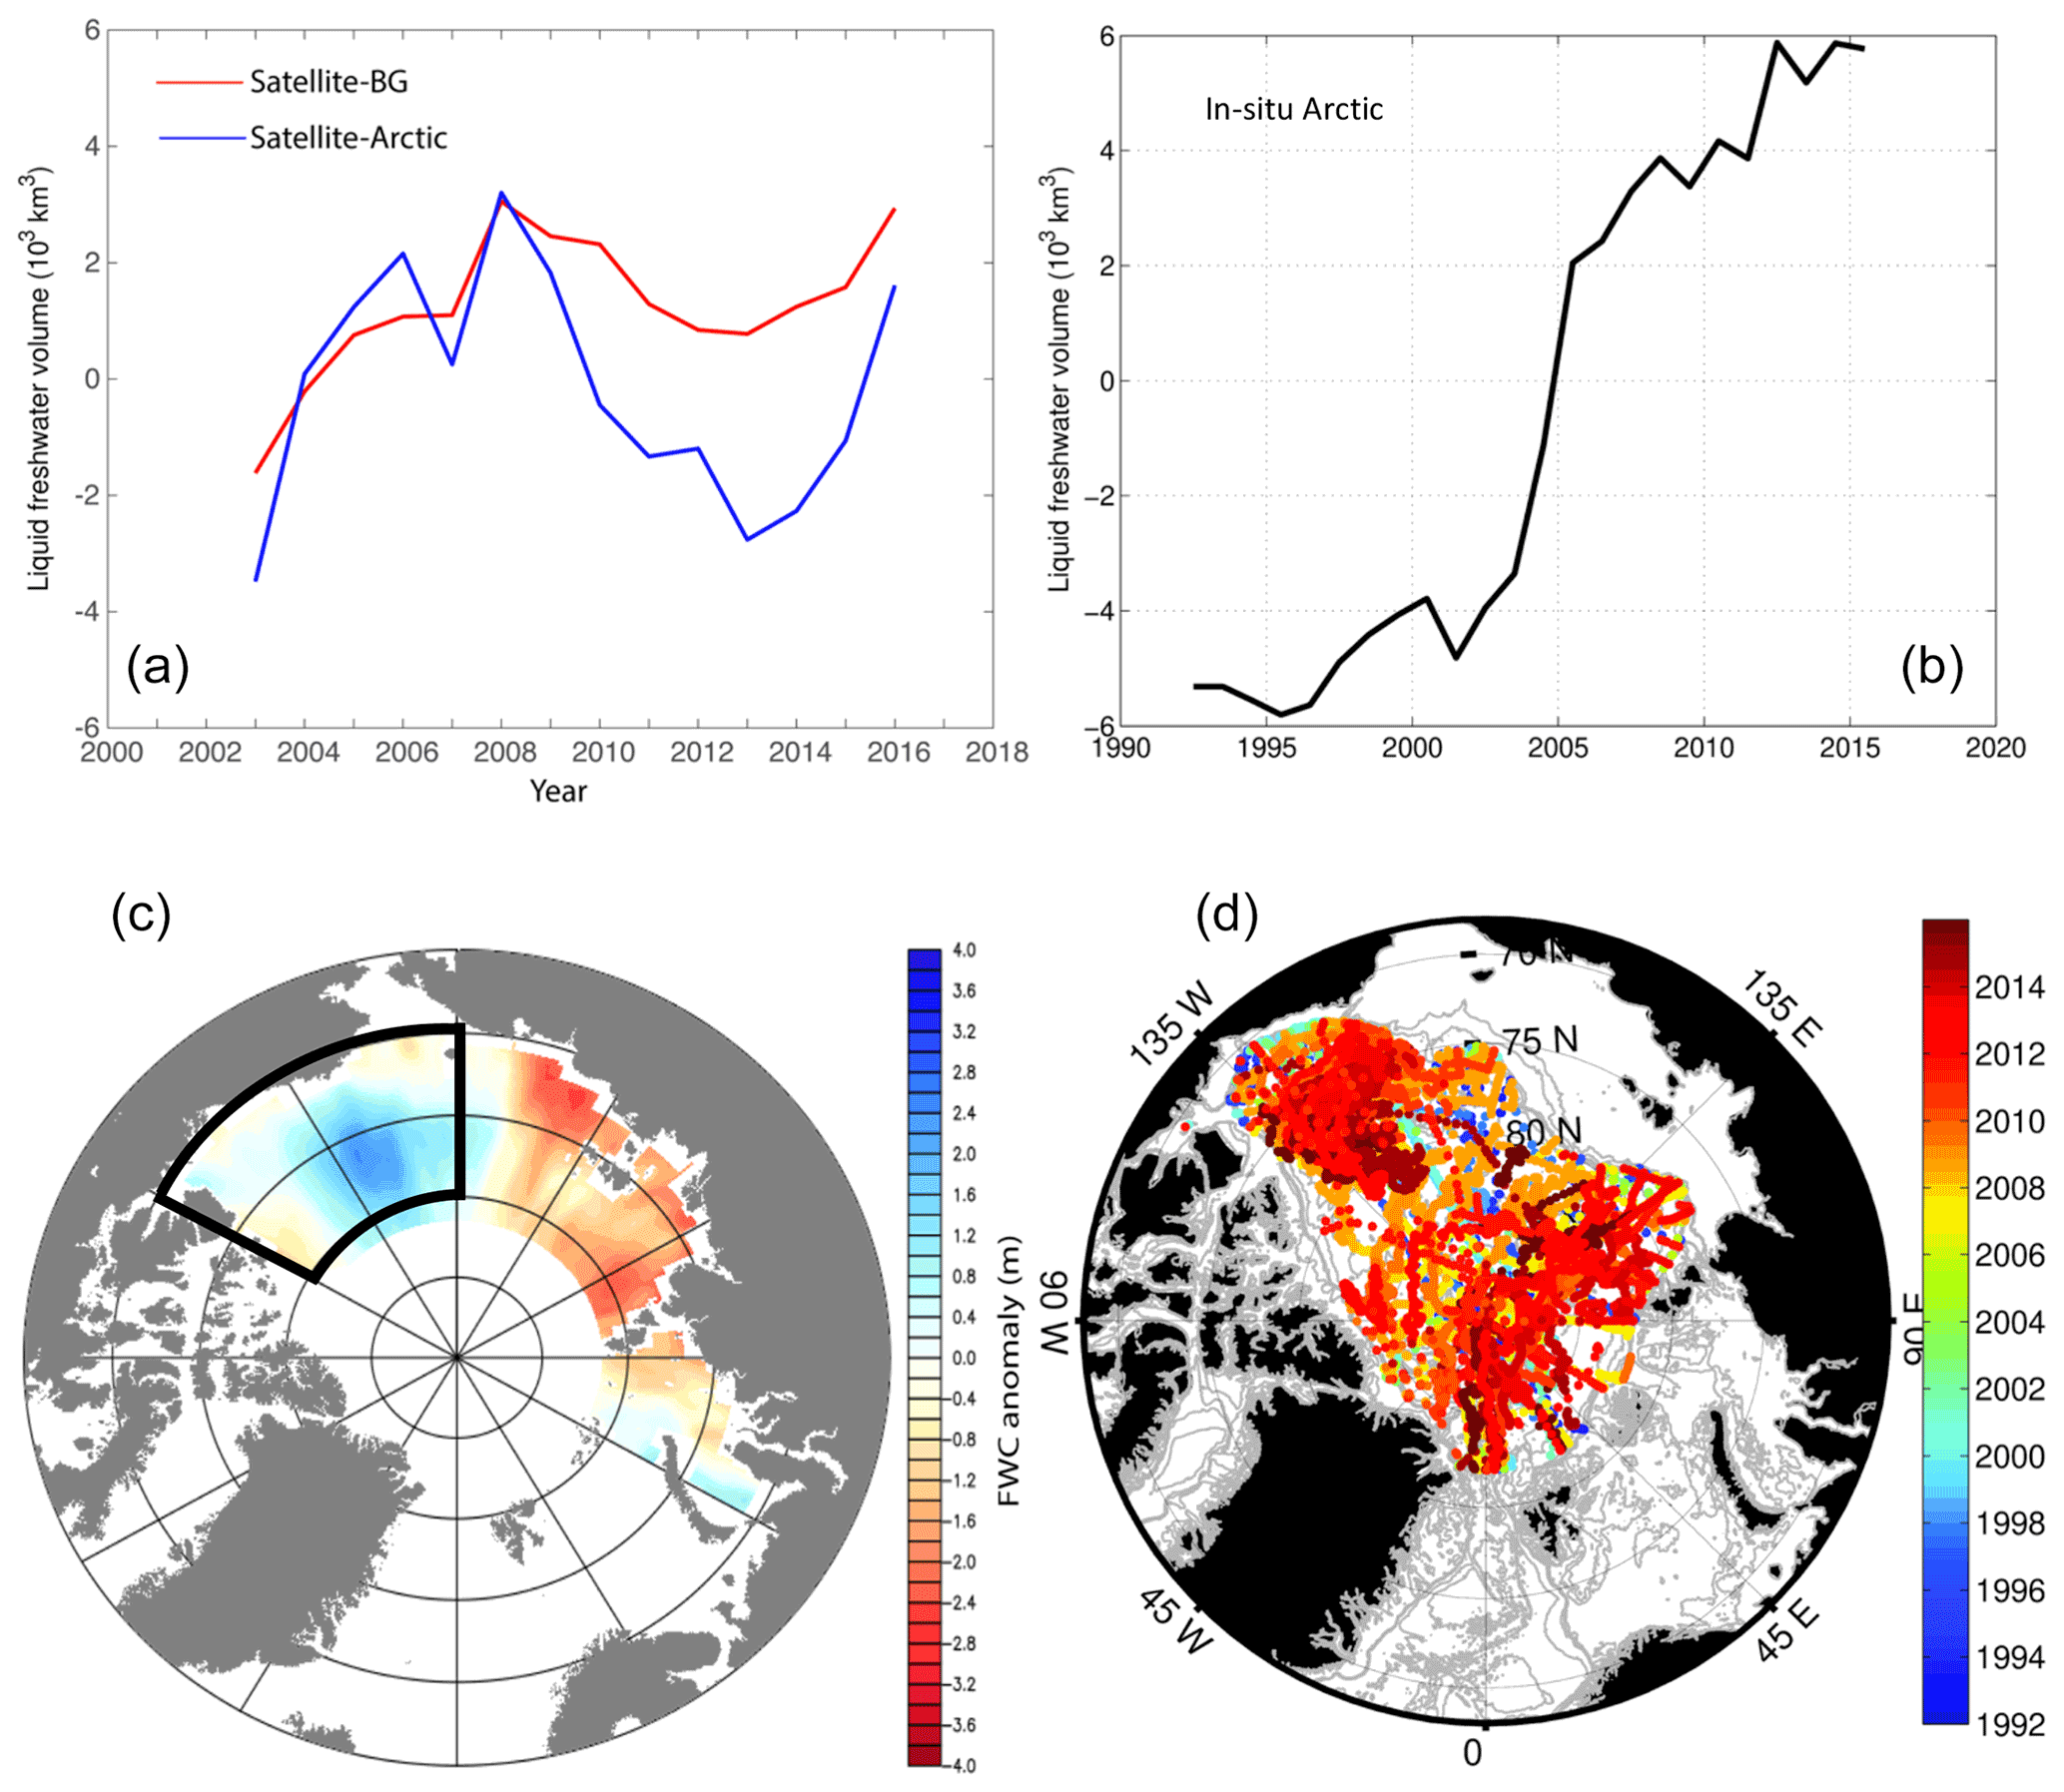
Figure 3Anomalies of freshwater content from satellite sea surface height data analysis and GRACE OBP data and from objectively mapped in situ hydrographic observations. Annual mean time series of freshwater content from (a) satellite measurements in the Beaufort Gyre (red), the Arctic region shown in (c) (blue), and the (b) Arctic basin using in situ hydrographic observations shown in (d) (black) in units of 103 km3. (c) Difference between 2010–2017 and 2002–2010 freshwater content means from satellite measurements in units of meters. (d) Locations of salinity profiles used for the objective analysis of the in situ data with time denoted by color. Anomalies in (a) and (b) are relative to the corresponding mean of the 2003–2006 period in each time series using a reference practical salinity of 35 and a layer from the surface to the 34 isohaline. The Beaufort Gyre region (marked with thick black lines in c) is defined as 70–80∘ N, 120–180∘ W. The time series are calculated using observations from the Arctic Ocean with a water depth deeper than 500 m and a cutoff at 82∘ N north of the Fram Strait for the in situ estimates and the contoured region shown in (c) for the satellite estimates. Panel (b) is an update of the time series in Rabe et al. (2014a), partly shown previously in Wang et al. (2019); the additional data used are listed in Table 2.
Table 2Sources of salinity data used in the objective analysis to derive the black curve in Fig. 3. The listed data sources are for the data used in addition to the data described in Rabe et al. (2014a) and published in Rabe et al. (2014b). ITP: ice-tethered profiler; NPEO: North Pole Environmental Observatory; WHOI: Woods Hole Oceanographic Institution; NABOS: Nansen and Amundsen Basin Observational System.

The most recent estimates of Arctic freshwater sources and sinks have been developed by Østerhus et al. (2019), Haine et al. (2015), Prowse et al. (2015), Carmack et al. (2016), and Vihma et al. (2016). Only Østerhus et al. (2019) covers a more recent period through 2015. One issue is that not all these estimates use the same reference salinity; a discussion of freshwater versus salt transports and reference salinities is provided in Bacon et al. (2015), Schauer and Losch (2019), and Tsubouchi et al. (2018). Another more recent development over the last decade is the inclusion of freshwater fluxes from the Greenland Ice Sheet (GIS) and smaller Arctic glaciers and ice caps (GICs) into these basins (Bamber et al., 2012, 2018; Dukhovskoy et al., 2019).
2.1 River discharge
Observations suggest a linkage between the Arctic Oscillation (AO) and the North American (mainly Mackenzie River) runoff pathways (Yamamoto-Kawai et al., 2009; Fichot et al., 2013). There has been a shift from a rather direct outflow via the Canadian Arctic Archipelago (CAA) in the early 2000s to a northward pathway into the Beaufort Gyre around 2006, coinciding with a change to a strongly positive AO. In addition, for high AO indices, river runoff entering the Eurasian shelves is mainly transported into the Canada Basin, while for low AO indices, the transport is mainly towards the Fram Strait by a strengthened transpolar drift (Morison et al., 2012; Alkire et al., 2015).
Observations of runoff rates for Eurasian rivers are available since 1936 and for North American rivers since 1964 (Shiklomanov et al., 2021). There has been a decline since about 1990 in the total gauged area by ∼ 10 % in Siberia and Canada (Shiklomanov et al., 2021), due to the closure or mothballing of gauging stations. Regardless, only the most important rivers are gauged: knowledge of net (continent-scale) river discharge rates requires estimation of the substantial ungauged runoff fraction, typically one-third of the total. The long-term, multi-decadal, gauged annual mean runoff rates are given by Shiklomanov et al. (2021) as 1800 km3 yr−1 (Eurasia, 1936–2015) and 1150 km3 yr−1 (North America, 1964–2015), for a total of 2950 km3 yr−1. Shiklomanov et al. (2021) also note the increase (with uncertainties) in these records as 2.9 ± 0.4 (Eurasia, using the 1935–2015 period) and 0.7 ± 0.3 (North America, using the 1964–2015 period) km3 yr−2. The significant Eurasian trend is on the order of 15 % per century. However, the weakly significant North American trend over the shorter period disguises an apparent signal of multi-decadal variability similar to that observed by Florindo-Lopez et al. (2020), who suggest it to be part of the evidence for much wider-area atmospheric and oceanic teleconnections.
2.2 Precipitation and atmospheric moisture transport
Precipitation over the Arctic is the main source of freshwater into the Arctic Ocean, when including that from its pathway through river discharge from the large continental drainage basins (Haine et al., 2015; Serreze et al., 2006). In climatology, river discharge is predominantly from precipitation, though land surface processes (e.g., thawing permafrost and decreasing vegetation transpiration) may have slight contributions according to Zhang et al. (2013). The total continental runoff into the Arctic Ocean is about 0.1 Sv (see Table 1; Haine et al., 2015). The remaining sources are lower; those of similar order of magnitude are precipitation–evaporation and Bering Strait liquid inflow. In addition, precipitation is largely driven by atmospheric moisture transport. Based on a mass-corrected atmospheric moisture transport dataset, Zhang et al. (2013) found that the observed increase in the Eurasian Arctic river discharge was driven by an enhanced poleward atmospheric moisture transport into the river basins. Using the same dataset, Villamil-Otero et al. (2017) also found a continual enhancement of the poleward atmospheric moisture transport across 60∘ N into the Arctic Ocean from the 1950s to the mid 2010s. An update of the transport using ERA5 reanalysis shows a continuation of the enhancement across 60∘ N (Fig. 4). Nygard et al. (2020) also found an increase in poleward moisture transport from 1979–2018 using the ERA5 data. Interestingly, they also found that evaporation shows a negative trend due to suppression by the horizontal moisture transport.
The large-scale atmospheric circulation may play a dynamic driving role in the enhanced atmospheric moisture transport. A statistical analysis indicates a temporally varying relationship between the annual moisture transport and the annual mean Arctic Oscillation (AO; Thompson and Wallace, 1998), showing a negative and a positive correlation before and after 2000. The positive phase of the AO indicates a strengthening of the westerlies, transporting atmospheric moisture to the Eurasian continent and leading to an increase in precipitation over the landmass (e.g., Kryzhov and Gorelits, 2015). An AO positive trend occurred primarily from the late 1980s to mid-1990s. In the 1990s, the variability of the atmospheric circulation was mainly characterized by the AO. However, although a positive correlation occurred between the transport and AO after 2000, the AO lagged the transport variability by one year during the negative peaks in 2005 and 2010. During 2000–2010, the AO mainly showed fluctuations and was also inclined towards a negative phase (Fig. 4). After 2010, the AO and transport are in-phase, with a positive trend and peak positive values in 2011 and 2015.
During the 2000–2010 time period, the atmospheric circulation spatial pattern experienced a radical change, in particular during the winter seasons, as revealed in Zhang et al. (2008). This changed spatial pattern, named the Arctic rapid change pattern (ARP), exhibits a predominant role in driving the poleward moisture transport (Zhang et al., 2013). This driving role can also be manifested by a poleward extension and intensification of the Icelandic low in the negative ARP phase. Considering that temporal-varying features of AO and the seasonal preference of the emergence of the spatially transformed ARP, the dynamic driving role of the atmospheric circulation needs to be further investigated. In addition, synoptic-scale analysis also suggested the propagation of intense storms into the Arctic played an important role in the enhanced poleward moisture transport and resulting increase in precipitation (e.g., Villamil-Otero et al., 2017; Webster et al., 2019).
Much of the precipitation in the Arctic falls as snow but projections show an increasing amount of rain as the climate warms (Bintanja, 2018). This appears to have been tentatively observed in Greenland, though mostly in southern and western Greenland away from the central Arctic Ocean (Doyle et al., 2015; Haine et al., 2015; Boisvert et al., 2018; Oltmanns et al., 2019), where the consequences of surface melt, surface runoff, and ice dynamics from increased rainfall over the ice sheet have been observed (e.g., Lenaerts et al., 2019). Similarly, Webster et al. (2019) note an increased frequency of rain on sea ice. Unfortunately, precipitation is notoriously difficult to measure, particularly in the solid phase and, as with other observations in the Arctic, reliable observations of precipitation are few and far between. Estimates of the precipitation flux are therefore forced to rely on model reanalysis, which have large uncertainties (e.g., Bromwich et al., 2018) on indirect measures such as river runoff and may also be affected by glacier melt or on GNSS data analysis of solid earth movements in response to localized precipitation (e.g., Bevis et al., 2019).

Figure 4Time series of annual poleward atmospheric moisture transport (in km3 yr−1) across 60∘ N updated using the ERA5 reanalysis dataset following Zhang et al. (2013) and the annual mean Arctic Oscillation (AO) index constructed by NOAA Climate Prediction Center from 1991–2019. The transport was integrated from the surface to the top of the atmosphere and along 60∘ N.
2.3 Sea ice
Freshwater stored in sea ice, i.e., sea ice volume, decreased by roughly 10 % for maximum sea ice and 40 % for minimum sea ice over 2000–2010 (Fig. 5). Kwok (2018) explained the flattening by the predominance of seasonal ice. Using a different approach, Liu et al. (2020) converted sea ice age into volume and also found a decrease in sea ice volume over the entire Arctic of −411 km3 yr−1 over 1984–2018, which was most pronounced until 2010; their monthly trend ranges between −537 km3 yr−1 in May and −251 km3 yr−1 in September. The decrease in sea ice thickness is responsible for 80 % of this trend in winter and 50 % in summer. In addition to the global warming effects, sea ice decrease can be attributed to increased downward radiative forcing and turbulent heat fluxes associated with changes in the atmospheric circulation. In particular, storm activities have intensified over the Arctic Ocean. Recent observational studies have indicated that storms can increase mixing between surface cold water and underlying warm water to suppress winter sea ice growth or increase summer sea ice melt (Graham et al., 2019; Peng et al., 2021). Further, even in the deep basin area where the Pacific and Atlantic waters layers are deeper and stratification is strong, intense storms can force Ekman upwelling to cause the intrusions of the deeper warmer and saltier waters in the upper mixed layer. The input of deep warm and salty waters and enhanced mixing in the mixed layer increase the oceanic heat flux and consequently accelerates summer sea ice melt (Graham et al. 2019; Peng et al., 2021; Polyakov et al., 2020a). These processes influence both the volume of solid freshwater stored in sea ice and ocean freshwater budgets.
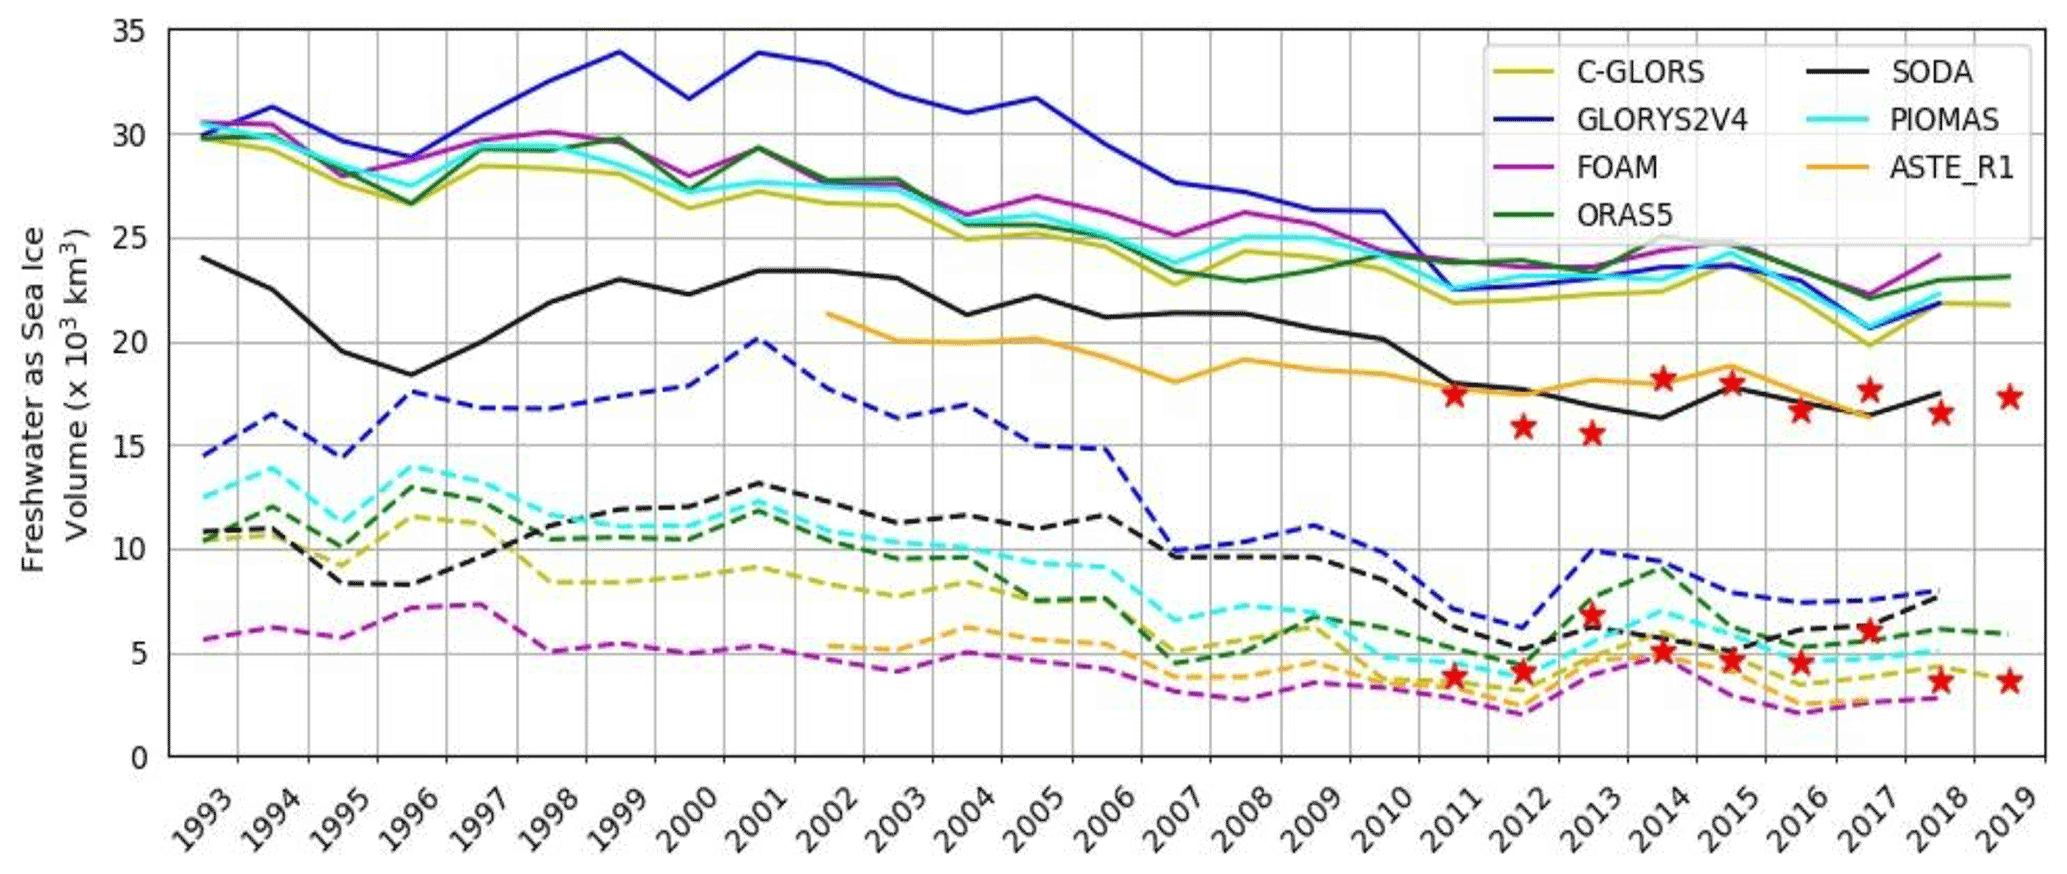
Figure 5Time series of annual freshwater volume stored as sea ice from seven ORAs and CryoSat-2 (red stars) (in 103 km3). The sea ice volume is calculated as the product of sea ice area and thickness. Annual volume maxima are shown by bold lines, while annual minima are shown by dashed lines.
New sea ice in the Arctic forms predominantly over the continental shelf. Estimates based on satellite imagery puts the cumulative sea ice formation of all Arctic coastal polynyas to 3000 km3 yr−1 (Tamura and Oshima, 2011), i.e., about a quarter of the total mean Arctic sea ice volume. Consequently, although the shelves receive large amounts of freshwater from rivers, their largest contribution to freshwater exchanges comes from sea ice export (e.g., Volkov et al., 2020), as the sea ice that forms on the shelves does not stay there. Sea ice is instead slowly transported across the Arctic by the transpolar drift (Serreze et al., 1989), taking 1.5 to 3 years to travel from the Laptev Sea to Fram Strait (Pfirman et al., 1997; Steele et al., 2004). The transpolar drift and ice deformation rates have been observed to be accelerating since the early 2000s (Rampal et al., 2011; Spreen et al., 2011); just recently, the MOSAiC drift expedition has shown that the transpolar drift can, indeed, be unusually fast and thus is capable of rapidly transporting sea ice out of the Arctic (Krumpen et al., 2020).
Fram Strait sea ice export is the largest dynamic sink of the Arctic freshwater cycle. The increase in Fram Strait sea ice export detected from long-term monitoring of sea ice area has been suspected as the cause of Arctic sea ice volume loss, in particular for the multiyear thick sea ice within the Arctic Ocean (Smedsrud et al., 2017; Ricker et al., 2018). Using the more recent sea ice thickness retrievals, Spreen et al. (2020) actually showed that in volume, the Fram Strait export has in fact been decreasing at 27 % per decade over 1992–2014, on par with the Fram Strait and Arctic ice thickness. In addition to the changes caused by thinned sea ice, changes in the atmospheric circulation pattern have also significantly contributed to the decrease in Fram Strait sea ice export since the mid 1990s (Wei et al., 2019). Sea ice export from the Siberian Shelf has increased by 46 % over 2000–2014 compared to 1988–1999 and North American sea ice reaches Eurasian waters 37% faster (Newton et al., 2017). But the summer survival rate of sea ice on the Siberian Shelf is decreasing by 15 % per decade (Krumpen et al., 2019). That is, in the 1990s, 50 % of first-year ice entered the transpolar drift; now, it is less than 20 %, as the rest melts before reaching the transpolar drift (Spall, 2019; Krumpen et al., 2019).
Snow on sea ice is crucial for surface heat budgets through its high albedo and sea ice growth through its thermal insulating effect. Therefore, snow on sea ice plays a significant role in determining where and when sea ice melts (Bigdeli et al., 2020). Although the delay of freeze up during early winter, which partly depend on the anomalies of oceanic and atmospheric circulations (e.g., Kodaira et al., 2020), would cause a delay of snow accumulation on sea ice, the increase in precipitation and snow depth associated with the increase in storm activities in the Pacific Arctic contributes to a rapid buildup of snow cover on first-year ice (and a potential delay in seasonal sea ice melt). These feedbacks were reported by Sato and Inoue (2018) based on the analysis of ice mass balance buoys and CFSR reanalysis datasets. In the Atlantic sector, precipitation associated with six major storm events in 2014–2015 during the N-ICE2015 field campaign (Merkouriadi et al., 2017) caused the snow depth to be substantially greater than climatology.
2.4 Freshwater flux from glaciers and the Greenland Ice Sheet
The freshwater input from Arctic glaciers and the Greenland Ice Sheet comprises a minor but difficult to compute source of freshwater in the Arctic Ocean basin. The Greenland Ice Sheet and the surrounding smaller peripheral glaciers and ice caps on Greenland have shown an increasing tendency for net ice sheet loss since the early 2000s (Shepherd et al., 2020; Noël et al., 2017; Bolch et al., 2013), though with wide spatial and large temporal variability from year to year, a trend reflected in other glaciated basins within the Arctic including Arctic Canada, Russia, and Svalbard (e.g., Noël et al., 2018; Gardner et al., 2011; Moholdt et al., 2012). The Ice sheet Mass Balance Intercomparison Exercise (IMBIE) (Shepherd et al., 2012) and IMBIE2 (Shepherd et al., 2020) results show, for example, a steady increase in net mass loss from around −119 ± 16 Gt yr−1 for the 1992–2011 period to −244 ± 28 Gt yr−1 in the 2012–2017 period with a peak in 2012 of 345 ± 66 Gt yr−1 (see also Helm et al., 2014). The increase in ice loss is due to both enhanced calving and submarine melting at outlet glaciers and increased surface melt and runoff through the period. In the mid-2010s a series of cooler summers, wetter winters, and slowing calving rates from some of the very large calving outlet glaciers around Greenland led to a short-lived slowing in the rate of mass loss. Simonsen et al. (2021) found that 2017 is the first year in the 21st century with a neutral annual mass budget. However, they and others also further note the resumption of high ice loss in 2018 and particularly in 2019, which although outside the IMBIE2 period of mass change has led to further decreases in the decadal mass balance of the ice sheet (Tedesco and Fettweis, 2020; Sasgen et al., 2020). However, much of the runoff and solid discharge is lost to the North Atlantic rather than the central Arctic directly and it remains a difficult contribution to estimate accurately. Net ice loss refers to the total mass budget of glaciers where ablation and calving losses exceed gains due to precipitation of primarily snowfall and a more minor contribution from rainfall that freezes internally within the surface snowpack. Total freshwater flux from glaciers is consequently rather larger than net ice loss. The main mechanisms of ice loss are: (1) liquid meltwater runoff from both surface and basal melting at the bed of glaciers, (2) submarine melt at outlet glaciers in contact with the ocean, and (3) a solid component of ice loss driven by the calving of icebergs. All components of ice loss have seen recent increases (Shepherd et al., 2020).
Given the lack of streamflow measurements in Greenland, calculation of liquid runoff is primarily based on numerical models. Meltwater production is calculated within models, based either on surface energy budget considerations or using temperature index scaling, and then runoff is determined by also accounting for refreezing or storage of meltwater in the snowpack. Recent model intercomparisons of modeled surface mass budget (SMB) (Fettweis et al., 2020) and refreezing in firn (Vandecrux et al., 2020) show that the primary source of variability in model estimates is still the amount of melt. This is primarily modulated by surface albedo but is also determined by the amount and spatial variability in the distribution of snowfall from models, as the difference in surface properties between fresh snow and bare glacier ice leads to a melt–albedo feedback that is triggered when bare glacier ice is exposed (e.g., Hermann et al., 2018). The GrIS SMBMIP (Fettweis et al., 2020) compared results from 13 different models over Greenland. While many of these models give a similar figure for the net SMB over the ice sheet, there were wider differences between the components and also the distribution of melt and runoff. Typical values for the mean annual snowfall are in the range of 500 to 800 Gt yr−1. The modeled liquid runoff by comparison is in the range of 200 to 500 Gt yr−1, though note that many of the highest snowfall models also have runoff so the models converge to a smaller range of SMB values.
To assess the calving and submarine melting components of freshwater flux from Greenland, remote sensing observations have focused on two separate techniques. The discharge method produces an estimate based on the observed velocity of outlet glaciers through flux gates of a known channel cross section, thus including both solid and liquid ice loss components. The gravimetry method on the other hand estimates mass change over a given area and time period computed from gravimetric observations using the GRACE and later GRACE-Follow On satellites. Modeled SMB is subtracted from the total mass change to give an estimate of the dynamical discharge component that also includes submarine melting at glacier fronts.
Mankoff et al. (2019) used the discharge technique in a recent assessment of the freshwater flux from Greenland to estimate a flux of 488 ± 49 Gt yr−1 that is consistent with that produced by King et al. (2018) of 484 ± 9 Gt yr−1 and Kjeldsen et al. (2015) of −465.2 ± 65.5 Gt yr−1, both for the 2003–2010 period. All three studies note that while the amount of discharge over the whole ice sheet has steadily increased through the 20th century (based on comparisons with aerial photos and mapped glacier extents; Kjeldsen et al., 2015) to the 2010s, the rate of increase has largely stabilized at a high level in the last few years. However, the spatial pattern of discharge varies through time and space. Initial high discharge numbers in the 2000s were driven by accelerations that later slowed in outlet glaciers in especially western Greenland but additional accelerations in ice flow speeds at other outlets are sufficient to compensate and keep the overall discharge numbers high. Note that these figures do not include meltwater runoff from surface melt.
Taken together, the modeled runoff and ice discharge figures given in this section indicate that Greenland adds on average between 680 to 1000 Gt yr−1 of fresh water to the oceans. However, the spatial variability in ice discharge and runoff complicates the interpretation of implications for the Arctic freshwater balance. The main regions of accelerating ice loss in Greenland drain out to the North Atlantic particularly in the high melt and high calving regions of western and Southeast Greenland. There has also been an observable increase in both calving and runoff from the outlet glaciers of northern Greenland (Hill et al., 2018; Solgaard et al., 2020; Shepherd et al., 2019, Extended Fig. 4), which directly drains to the Arctic Ocean. Mankoff et al. (2019) estimate a stable ∼ 26 Gt yr−1 of ice discharge per year in the northern Greenland drainage basin that drains directly to the Arctic Ocean basin. This figure does not include surface melt and runoff, but analysis by Fettweis et al. (2020) indicates about the same amount as an annual gain by SMB processes in the same basin up until 2013 and declining thereafter as surface melt has increased in this region.
Glaciers in the Canadian Arctic Archipelago draining into the same region as northern Greenland have seen a succession of ice shelf collapses and associated changes in the fjords most likely related to sub-shelf melting and increased atmospheric air temperatures in the region since the 1950s (e.g., Copland et al., 2007; Gardner et al., 2011). Glaciers in Svalbard (e.g., Noël et al., 2020) and the high Russian Arctic have also shown consistent mass loss trends (e.g., Moholdt et al., 2012), indicating an increase in freshwater contribution from the smaller Arctic glaciers in the region directly into the Arctic Ocean basin, but their contribution is an order of magnitude smaller than from Greenland.
The analysis of Arctic freshwater flux from land ice presented by Bamber et al. (2018) reaches a similar conclusion. The Bamber study estimates that by including land ice from other parts of the Arctic as well as the Greenland Ice Sheet, the total freshwater flux is around 1300 Gt yr−1 in the period since 2010. They also identify a marked increase in runoff and discharge compared to a climatology period of 1960–1990. They also note that the distribution of the freshwater flux is not even around Greenland spatially, but also temporally, with both runoff and iceberg discharge peaking in summer but being rather low (though not zero) in winter. Therefore, compared to the other fluxes, ice sheet and glacier discharge is a rather minor source of freshwater.
2.5 Ocean transport through gateways
The latest reviews of the Arctic freshwater budget and fluxes (e.g., Haine et al., 2015; Carmack et al., 2016; Østerhus et al., 2019) conclude that observations of liquid freshwater transport through the Bering, Davis, and Fram straits do not show significant trends between 1980–1990 and the 2000s. A recent study by Woodgate (2018) has shown that the Bering Strait exhibited a significant increase in volume and freshwater import to the Arctic between 2001 and 2014. Florindo-Lopez et al. (2020) analyzed several decades of summertime hydrographic data at the eastern side of the Labrador Sea to find that freshwater transports in the boundary current were generally lower in the mid-1990s to 2015 period than the pre-1990s transports. The long-term variability was on the order of 30 milli-Sverdrup (one Sverdrup or Sv = 106 m3 s−1).
Polyakov et al. (2020a) have described the contrasting changes in the Eurasian and Amerasian basins, where the latter has shown increasing stratification in recent years. They relate this to an increased import of low-salinity waters through the Bering Strait (see Woodgate, 2018). In the Eurasian Basin, Polyakov et al. (2020a) relate the weakening stratification and enhanced sea ice melt, a process referred to as the Atlantification of the Arctic (Polyakov et al., 2017), to injection of (warmer) relatively salty water from the Barents Sea into the Eurasian Basin halocline, flowing at shallower depths. Although they do not show any clear link to the Fram Strait imports, they find a small but statistically significant correlation between observed salinity in the eastern Eurasian Basin halocline and the northern Barents Sea upper water column. These findings are consistent with the box model estimates of Tsubouchi et al. (2021); there appears to be no trend in volume fluxes at the boundaries and no evidence for a dominant link between changes in the freshwater fluxes at the boundaries and changes in the upper Arctic Ocean. This is also true for the Atlantic water volume inflow.
The large-scale freshwater redistribution in the Arctic is mainly caused by the oceanic flows near the surface and in the upper ocean, up to the lowermost extent of the Arctic halocline. It is governed by the two co-dependent and interactive components: wind-driven circulation and density-driven circulation. The wind distributes the fresh water through the advection in the Ekman layer, Ekman upwelling and downwelling, and mixing. The ocean density gradients due to river runoff, precipitation and sea ice processes act through geostrophic density-driven flows, mixing of the ocean interior by lateral ocean eddies, and shelf topographic and tidal mixing and shelf cascading. All of these processes impacting fresh water are discussed below.
3.1 Wind-driven circulation
The wind-driven circulation in the Arctic features: (i) the Beaufort Gyre (BG), a large-scale anticyclonic (clockwise) ocean gyre that occupies the Beaufort Sea and the Canadian Basin of the Arctic Ocean at the farthest extent, (ii) the cyclonic (counterclockwise) circulation on the Atlantic side of the Arctic Ocean (Nansen and Amundsen basins), and (iii) cyclonic ocean flows in the Siberian Shelf seas. The transpolar drift (TPD), a large-scale stream that constitutes the oceanic and sea ice coherent flows, has its sources in the Siberian Shelf seas and follows across the North Pole to the Fram Strait. The TPD can be found from the surface to the depth of the upper intermediate waters and until recently was assumed to be a slowly (on the order of years to decades) varying flow, although sea ice retreat may destabilize sea ice and oceanic flows in the TPD (e.g., Belter, 2021; Krumpen et al., 2019). The wind-driven circulation produces local accumulation or thinning of the surface layer (Timmermans and Marshall, 2020).
Although the exchanges with the Atlantic and Pacific influence the large-scale salinity gradients across the Arctic Ocean (Polyakov et al., 2020b), the combined effects of the density-driven and wind-driven circulations primarily drive a strong freshwater gradient through the Arctic of up to 25 m freshwater equivalent (Rabe et al., 2011) with a maximum freshwater content in the Beaufort Gyre and a minimum in the Nansen Basin towards the Barents Sea. Morison et al. (2012) and Alkire et al. (2007) in particular have shown the regional changes in steric height by driving near-surface geostrophic currents and sea level pressure, respectively, can redistribute relatively fresh water near the surface along the boundaries of the deep basin and the shelves. In addition, Morison et al. (2021) recently provide a longer-term perspective on freshwater distribution and stress the importance of the cyclonic mode of ocean circulation on the Atlantic–Eurasian side of the Arctic Ocean, in addition to the conventionally emphasized Beaufort Gyre. The cyclonic mode is characterized as the first empirical orthogonal function (EOF) of ocean surface height variability (dynamic heights for 1959–1989 and satellite DOT for 2004–2019). In the cyclonic phase, surface depression, reduced freshwater content, and cyclonic circulation occurred on the Atlantic–Eurasian side of the Arctic Ocean. The freshwater loss in this area offsets freshwater gains in the Beaufort Gyre with the entire Arctic basin. The ocean cyclonic mode is related to the positive polarity of the AO with approximately 1-year latency and has become more prominent under the long-term changing tendency of winter AO toward a positive phase since 1990 (see Fig. 4).
Recent studies suggest that the Beaufort Gyre has stabilized or reached a new normal high freshwater content state. Dewey et al. (2018) attributes this to a switch from a system driven by surface ice and wind stress that affects a passive ocean to one where it is the ocean that drives the ice (often in the absence of wind). Zhong et al. (2019) in contrast attribute it to higher energy input to the ocean and suggest that the transition is not complete, i.e., the Beaufort Gyre is not yet “saturated”. Zhong et al. (2019) further conclude that the recent increase in cyclonic activity reduces this energy input and hence should result in future decrease of freshwater stored in the Beaufort Gyre. This surface circulation transports meteoric water (and hence nutrients, e.g., Bluhm et al., 2015) throughout the Arctic. On average, 10 % of the Arctic surface waters are made up of meteoric waters (shallower than ∼ 200 m depth; see Fig. 5b in Forryan et al., 2019) and this number has so far been constant since the early 2000s (Alkire et al., 2017; Proshutinsky et al., 2019).
3.2 Competing processes in the Beaufort Gyre
The Beaufort Gyre is a retainer of liquid freshwater in the Arctic Ocean governed by three factors: wind stress, the dynamic feedback between ice motion and upper ocean currents (“ice–ocean governor”), and lateral eddy fluxes (Doddridge et al., 2019). Observations and an idealized two-layer model study indicate that the ice–ocean governor controlling Ekman pumping is five times more important than eddy dynamics in regulating the retention and release of freshwater from the Beaufort Gyre (Meneghello et al., 2020). Dewey et al. (2018) indicate that Ekman pumping and the ice drag feedback mechanism stabilize ice and ocean velocity at timescales of less than a week while eddy propagation feedback has timescales measured in years. Regan et al. (2020) have shown that the mean kinetic energy dominated over eddy kinetic energy (change in isopycnal slope reduces the potential for baroclinic instability) in governing Beaufort Gyre dynamics during the spin-up in the past one to two decades. Armitage et al. (2020) predict that eddies will become more important in stabilizing the Beaufort Gyre. In addition, idealized simulations with and without a continental slope by Manucharyan and Isachsen (2019) demonstrate that eddy dynamics prevail in the Beaufort Gyre only in the presence of the slope. Further, Liang and Losch (2018) show that the positive feedback loop “enhanced vertical mixing = less sea ice” reduces halocline stratification and brings more salt to the deep Arctic.
3.3 Ekman pumping and wind mixing
The wind also contributes to vertical redistribution via wind-driven coastal up- and downwelling. On average, only the Laptev and Kara are dominated with downwelling; the rest of the Arctic, especially the Amerasian basin, is upwelling dominated (Williams and Carmack, 2015). However, bathymetric features can reverse the sign of this Ekman transport (Randelhoff and Sundfjord, 2018; Danielson et al., 2020). Even more relevant for freshwater, at locations where upwelling occurs, river plumes are pushed offshore (Williams and Carmarck, 2015; Våge et al., 2016). Downward flows of water can be generated by the wind or by an increase in density that destabilizes the water column. In addition, as mentioned in Sect. 2.3, strong storms force Ekman upwelling, not only along the coast but also within the basin, which advect deeper layer warm and salty water to the upper ocean layer (or, in other words, cause a shoaling of the Pacific or Atlantic water layer) and, in turn, results in a salinization (Peng, et al., 2021). It is worth mentioning again that the storm-driven upwelling and increase in mixing also enhance sea ice melt, increasing the upper mixed layer freshwater. The final vertical freshwater distribution depends on the competition between these two processes.
The wind also impacts the depth of the mixed layer. The Arctic surface mixed layer varies both seasonally and geographically, as reviewed by Peralta-Ferriz and Woodgate (2015). Using all available observations from 1979–2012, Peralta-Ferriz and Woodgate (2015) find a shoaling trend in the whole Arctic in winter; in summer, the mixed layer trend is a deepening in ice-free parts of the Barents and Beaufort seas, but also a shoaling in the Eurasian basin. Polyakov et al. (2017) found an opposite trend using moorings and ice-tethered profilers: an increased winter convection caused by sea ice formation over a weakened stratification in the eastern Eurasian basin. They argue that the entire Eurasian basin is becoming similar to the Atlantic sector of the Nansen basin and hence dubbed this phenomenon “the Atlantification of the Arctic” (or, more recently, “the Borealization of the Arctic”, Polyakov et al., 2020b).
3.4 Dense water cascading and tidal mixing
On the Arctic shelf, dense water can form as a result of cooling or brine rejection during sea ice formation, especially in polynyas (Ivanov et al., 2004). Cascading plumes entrain waters during their descent, explaining how the cascading of cold and saline surface waters can result in warmer (if entraining Atlantic water) or fresher (if entraining halocline) deeper levels (Backhaus et al., 1997). Preconditioning of the shelf waters due to the mixing with the upwelled Atlantic water can also result in the cold and saline cascading plumes (Luneva et al., 2020). Furthermore, cascading is becoming more common in the Arctic; it is more effective in mixing and ventilating upper and low intermediate Arctic waters than open ocean deep convection and can reach deep into the water column (e.g., Luneva et al., 2020). Cascading and entrainment in the Beaufort Sea during upwelling events re-injects cold and fresh water into the halocline (Ivanov et al., 2004). Janout et al. (2017) observed shelf processes and the modification of warm Atlantic water leading to flux of the modified water and hence an effective freshwater flux toward the basin. From two expeditions in 2013 and 2014 and one year of mooring deployment in between, Janout et al. (2017) found a dual behavior in Vilkitsky Trough between the Kara and Laptev Sea: strong winds can cause an upward diversion of the along-slope freshwater transport onto the shelf; the addition of sea ice formation results in the formation of water with a higher density than that found at 3000 m, suggesting possible sinking of these waters to the Nansen basin.
Tidal mixing of the waters on the Arctic continental shelves and over the steep shelf slope topography has been shown to be of importance for the freshwater fluxes between the shelves and the ocean interior and for decadal variations and long-term decline of sea ice cover (Luneva et al., 2015, 2020; Rippeth et al., 2015). The further sea ice retreat results in an increased upper-ocean shear and mixing, leading to enhanced ventilation of the Atlantic water layer and impact on the subsurface fresh water (Polyakov et al., 2020a).
Our review of recent work suggests that Arctic freshwater content in the 2010s has stabilized relative to the 2000s. This stabilization is due in part to the compensation between an increase in the Beaufort Gyre and a decrease in the rest of the Arctic Ocean. However, large inter-model spread in the ocean reanalyses and uncertainty in the observations used in this study prevents a definitive estimate of the degree of this compensation. Inferred from the published literature, the most notable differences between the 2010s and the 2000s are:
-
the Arctic Oscillation and moisture transport into the Arctic are in-phase and have a positive trend;
-
the sea ice cover has transitioned to be increasingly seasonal and mobile; the impacts of this variability on the Arctic Ocean and atmosphere are still being debated;
-
mass loss from the Greenland Ice Sheet and other Arctic glaciers has increased, including in the northern region that drains directly into the Arctic Ocean;
-
vertical mixing of Atlantic water into the deep Arctic has increased in the eastern Eurasian Basin where imported warm Atlantic waters have shoaled and the halocline has weakened.
This review also suggests that large uncertainties remain in quantifying regional patterns, changes, and individual contributors to freshwater content variability, motivating the need for long-term monitoring in rivers and ocean, both in situ and from space. An increased sample size of freshwater content and budget observations with time would help distinguish climate change forced long-term trends from internal low-frequency variability.
All code used for the present study is freely available by request.
References that detail how to access the ORA model output can be found in Table 1, satellite observations in Sect. 1.2.1, and in situ observations in Sect. 1.2.2 and Table 2.
All authors reviewed the final manuscript. AS edited and synthesized the individual contributions. LB and RR were the primary authors on satellite observations. BR was the primary author on in-situ observations. PH, AN, DI, and RM were the primary authors on the ORAs. RM and PH were the primary authors on glaciers and Greenland. XD and HT were the primary authors on atmospheric circulation and transports. SB, YA, and CH were the primary authors on redistribution. JI was the primary author on sea ice.
The authors declare that they have no conflict of interest.
Publisher’s note: Copernicus Publications remains neutral with regard to jurisdictional claims in published maps and institutional affiliations.
Amy Solomon acknowledges support from the NOAA Physical Sciences Laboratory. An Nguyen and Patrick Heimbach acknowledge support from the NSF (grant 1603903). Xiangdong Zhang acknowledges support from ONR (grant N00014-21-1-2577). Yevgeny Aksenov and Sheldon Bacon acknowledge support from the NERC program ACSIS (grant NE/N018044/1), the cooperative project APEAR, part of the Changing Arctic Ocean program jointly funded by the UKRI Natural Environment Research Council (NERC) and the German Federal Ministry of Education and Research (BMBF) (grants NE/R012865/1, NE/R012865/2, 03V01461), and the European Union’s Horizon 2020 research and innovation program project COMFORT (grant 820989). Benjamin Rabe acknowledges support from the cooperative projects Regional Atlantic Circulation and global Change funded by BMBF (grant 03F0824E) and APEAR (grants NE/R012865/1,NE/R012865/2 and 03V01461). Laurent Bertino acknowledges support from the KEPLER Horizon 2020 project (grant 821984). Ronan McAdam acknowledges support of the Danish state through the National Centre for Climate Research. Céline Heuzé acknowledges support from the Swedish Research Council (grant 2018-03859).
This research has been supported by the Cooperative Institute for Research in the Environmental Sciences, University of Colorado, Boulder, Colorado.
This paper was edited by Ilker Fer and reviewed by James Morison and two anonymous referees.
Aagaard, K. and Carmack, E. C.: The role of sea ice and other fresh water in the Arctic circulation, J. Geophys. Res., 94, 14485–14497, 1989.
Aagaard, K. and R. A. Woodgate, R. A.: Some thoughts on the freezing and melting of sea ice and their effects on the ocean, Ocean Modell., 3, 127–135, 2001.
Aagaard, K., Swift, J. H., and Carmack, E. C.: Thermohaline circulation in the Arctic mediterranean seas, J. Geophys. Res., 90, 4833–4846, 1985.
Alkire, M. B., Falkner, K. K., Rigor, I., Steele, M., and Morison, J.: The return of Pacific waters to the upper layers of the central Arctic Ocean, Deep-Sea Res. I, 54, 1509–1529, 2007.
Alkire, M. B., Morison, J., and Andersen, R.: Variability in the meteoric water, sea-ice melt, and Pacific water contributions to the central Arctic Ocean, 2000–2014, J. Geophys. Res., 120, 1573–1598, https://doi.org/10.1002/2014JC010023, 2015.
Andersen, O. B. and Piccioni, G.: Recent Arctic Sea Level Variations from Satellites, Front. Mar. Sci., 3, 76, https://doi.org/10.3389/fmars.2016.00076, 2016.
Ardyna, M. and Arrigo, K. R.: Phytoplankton dynamics in a changing Arctic Ocean, Nat. Clim. Change, 10, 892–903, https://doi.org/10.1038/s41558-020-0905-y, 2020.
Armitage, T. W. K., Bacon, S., Ridout, A. L., Thomas, S. F., Aksenov, Y., and Wingham, D. J.: Arctic sea surface height variability and change from satellite radar altimetry and GRACE, 2003–2014, J. Geophys. Res.-Ocean., 121, 4303–4322, 2016.
Armitage, T. W. K., Bacon, S., and Kwok, R.: Arctic Sea Level and Surface Circulation Response to the Arctic Oscillation, Geophys. Res. Lett., 45, 6576–6584, https://doi.org/10.1029/2018GL078386, 2018a.
Armitage, T. W. K., Kwok, R., Thompson, A. F., and Cunningham, G.: Dynamic topography and sea level anomalies of the Southern Ocean: Variability and teleconnections, J. Geophys. Res., 123, 613–630, 2018b.
Armitage, T. W. K., Manucharyan, G. E., Petty, A. A., Kwok, R., and Thompson, A. F.: Enhanced eddy activity in the Beaufort Gyre in response to sea ice loss, Nat. Commun., 11, 761, https://doi.org/10.1038/s41467-020-14449-z, 2020.
Backhaus, J. O., Fohrmann, H., Kämpf, J., and Rubino, A.: Formation and export of water masses produced in Arctic shelf polynyas – Process studies of oceanic convection, ICES J. Mar. Sci., 54, 366–382, 1997.
Bacon, S., Aksenov, Y., Fawcett, S., and Madec, G.: Arctic mass, freshwater and heat fluxes: methods and modelled seasonal variability, Philos. T. R. Soc. A., 373, 20140169, https://doi.org/10.1098/rsta.2014.0169, 2015.
Bamber, J., van den Broeke, M., Ettema, J., Lenaerts, J., and Rignot, E.: Recent large increases in freshwater fluxes from Greenland into the North Atlantic, Geophys. Res. Lett., 39, L19501, https://doi.org/10.1029/2012GL052552, 2012.
Bamber, J. L., Tedstone, A. J., King, M. D., Howat, I. M., Enderlin, E. M., van den Broeke, M. R., and Noël, B.: Land Ice Freshwater Budget of the Arctic and North Atlantic Oceans: 1. Data, Methods, and Results, J. Geophys. Res.-Ocean., 44, 1827–1837, https://doi.org/10.1002/2017JC01360, 2018.
Bevis, M., Harig, C., Khan, S. A., Brown, A., Simons, F. J., Willis, M., Fettweis, X., van den Broeke, M. R., Madsen, F. B., Kendrick, E., Caccamise II, D. J., van Dam, T., Knudsen, P., and Nylen, T.: Accelerating changes in ice mass within Greenland, and the ice sheet's sensitivity to atmospheric forcing, P. Natl. Acad. Sci. USA, 116, 1934–1939, https://doi.org/10.1073/pnas.1806562116, 2019.
Bigdeli, A., Nguyen, A. T., Pillar, H. R., Ocana, V., and Heimbach, P.: Atmospheric Warming Drives Growth in Arctic Sea-Ice: A Key Role for Snow, Geophys. Res. Lett., 47, e2020GL090236, https://doi.org/10.1029/2020GL090236, 2020.
Bintanja, R.: The impact of Arctic warming on increased rainfall, Sci. Rep., 8, 16001, https://doi.org/10.1038/s41598-018-34450-3, 2018.
Blockley, E. W., Martin, M. J., McLaren, A. J., Ryan, A. G., Wa- ters, J., Lea, D. J., Mirouze, I., Peterson, K. A., Sellar, A., and Storkey, D.: Recent development of the Met Office operational ocean forecasting system: an overview and assessment of the new Global FOAM forecasts, Geosci. Model Dev., 7, 2613–2638, https://doi.org/10.5194/gmd-7-2613-2014, 2014.
Bluhm, B. A., Kosobokova, K. N., and Carmack, E. C.: A tale of two basins: An integrated physical and biological perspective of the deep Arctic Ocean, Prog. Oceanogr., 139, 89–121, 2015.
Boisvert, L. N., Webster, M. A., Petty, A. A., Markus, T., Bromwich, D. H., and Cullather, R. I.: Intercomparison of precipitation estimates over the Arctic Ocean and its peripheral seas from reanalyses, J. Clim., 31, 8441–8462, https://doi.org/10.1175/JCLI-D-18-0125.1, 2018.
Bolch, T., Sandberg Sørensen, L., Simonsen, S. B., Mölg, N., Machguth, H., Rastner, P., and Paul, F.: Mass loss of Greenland's glaciers and ice caps 2003–2008 revealed from ICESat laser altimetry data, Geophys. Res. Lett., 40, 875–881, https://doi.org/10.1002/grl.50270, 2013.
Bromwich, D. H., Wilson, A. B., Bai, L., Liu, Z., Barlage, M., Shih, C.-F., Maldonado, S., Hines, K. M., Wang, S.-H., Woollen, J., Kuo, B., Lin, H.-C., Wee, T.-K., Serreze, M. C., and Walsh, J. E.: The Arctic System Reanalysis, Version 2, Bull. Am. Meteorol. Soc., 99, 805–828, https://doi.org/10.1175/BAMS-D-16-0215.1, 2018.
Carmack, E. C., Yamamoto Kawai, M., Haine, T. W. N., Bacon, S., Bluhm, B. A., Lique, C., Melling, H., Polyakov, I. V., Straneo, F., Timmermans, M.-L., and Williams, W. J.: Freshwater and its role in the Arctic Marine System: Sources, disposition, storage, export, and physical and biogeochemical consequences in the Arctic and global oceans, J.f Geophys. Res.-Biogeo., 121, 675–717, https://doi.org/10.1002/2015JG003140, 2016.
Carton, J. A., Chepurin, G. A., and Chen, L.: SODA3: a new ocean climate reanalysis, J. Clim., 31, 6967–6983, https://doi.org/10.1175/JCLI-D-18-0149.1, 2018.
Copland, L., Mueller, D. R., and Weir, L.: Rapid loss of the Ayles Ice Shelf, Ellesmere Island, Canada, Geophys. Res. Lett., 34, L21501, https://doi.org/10.1029/2007GL031809, 2007.
Danielson, S. L., Hennon, T. D., Hedstrom, K. S., Pnyushkov, A. V., Polyakov, I. V., Carmack, E., Filchuk, K., Janout, M., Makhotin, M., Williams, W. J., and Padman, L.: Oceanic Routing of Wind-Sourced Energy Along the Arctic Continental Shelves, Front. Mar. Sci., 7, 509, https://doi.org/10.3389/fmars.2020.00509, 2020.
de Boer A. M., Gavilan Pascual-Ahuir, E., Stevens, D. P., Chafik, L., Hutchinson, D. K., Zhang, Q., Sime, L. C., and Willmott, A. J.: Interconnectivity between volume transports through Arctic straits, J. Geophys. Res.-Ocean., 123, 8714–8729, https://doi.org/10.1029/2018JC014320, 2018.
Dewey, S., Morison, J., Kwok, R., Dickinson, S., Morison, D., and Andersen, R.: Arctic ice-ocean coupling and gyre equilibration observed with remote sensing, Geophys. Res. Lett., 45, 1499–1508, https://doi.org/10.1002/2017GL076229, 2018.
Doddridge, E. W., Meneghello, G., Marshall, J., Scott, J., and Lique, C.: A Three-Way Balance in the Beaufort Gyre: The Ice-Ocean Governor, Wind Stress, and Eddy Diffusivity, J. Geophys. Res.-Ocean., 124, 3107–3124, https://doi.org/10.1029/2018JC014897, 2019.
Doyle, S. H., Hubbard, A., van de Wal, R. S. W., Box, J. E., van As, D., Scharrer, K., Meierbachtol, T. W., Smeets, P. C. J. P., Harper, J. T., Johansson, E., Mottram, R. H., Mikkelsen, A. B., Wilhelms, F., Patton, H., Christoffersen, P., and Hubbard, B.: Amplified Melt and Flow of the Greenland Ice Sheet Driven by Late-Summer Cyclonic Rainfall, Nat. Geosci., 8, 647–653, https://doi.org/10.1038/ngeo2482, 2015.
Dukhovskoy, D. S., Yashayaev, I., Proshutinsky, A., Bamber, J. L., Bashmachnikov, I. L., Chassignet, E. P., Lee, C. M., and Tedstone, A. J.: Role of Greenland Freshwater Anomaly in the Recent Freshening of the Subpolar North Atlantic, J. Geophys. Res.-Ocean., 21, 181–28, https://doi.org/10.1029/2018JC014686, 2019.
Fer, I.: Weak vertical diffusion allows maintenance of cold halocline in the central Arctic, Atmos. Ocean. Sc. Lett., 2, 148–152, 2009.
Fettweis, X., Hofer, S., Krebs-Kanzow, U., Amory, C., Aoki, T., Berends, C. J., Born, A., Box, J. E., Delhasse, A., Fujita, K., Gierz, P., Goelzer, H., Hanna, E., Hashimoto, A., Huybrechts, P., Kapsch, M.-L., King, M. D., Kittel, C., Lang, C., Langen, P. L., Lenaerts, J. T. M., Liston, G. E., Lohmann, G., Mernild, S. H., Mikolajewicz, U., Modali, K., Mottram, R. H., Niwano, M., Noël, B., Ryan, J. C., Smith, A., Streffing, J., Tedesco, M., van de Berg, W. J., van den Broeke, M., van de Wal, R. S. W., van Kampenhout, L., Wilton, D., Wouters, B., Ziemen, F., and Zolles, T.: GrSMBMIP: intercomparison of the modelled 1980–2012 surface mass balance over the Greenland Ice Sheet, The Cryosphere, 14, 3935–3958, https://doi.org/10.5194/tc-14-3935-2020, 2020.
Fichot, G. G., Kaise, K., Hooker, S. B., Amon, R. M. W., Babin, M., Bélanger, S., Walker, S. A., and R. Benner, R.: Pan-Arctic distributions of continental runoff in the Arctic Ocean, Sci. Rep., 3, 1053, https://doi.org/10.1038/srep01053, 2013.
Florindo-Lopez, C., Bacon, S., Aksenov, Y., Chafik, L., Colbourne, E., and Holliday, N. P.: Arctic Ocean and Hudson Bay freshwater exports: new estimates from 7 decades of hydrographic surveys on the Labrador shelf, J. Clim., 33, 8849–8868, https://doi.org/10.1175/JCLI-D-19-0083.1, 2020.
Forryan, A., Bacon, S., Tsubouchi, T., Torres-Valdés, S., and Naveira Garabato, A. C.: Arctic freshwater fluxes: sources, tracer budgets and inconsistencies, The Cryosphere, 13, 2111–2131, https://doi.org/10.5194/tc-13-2111-2019, 2019.
Gardner, A. S., Moholdt, G., Wouters, B., Wolken, G. J., Burgess, D. O., Sharp, M. J., Cogley, G., Braun, C., and Labine, C.: Sharply increased mass loss from glaciers and ice caps in the Canadian Arctic Archipelago, Nature, 473, 357–360, https://doi.org/10.1038/nature10089, 2011.
Garric, G., Parent, L., Greiner, E., Drévillon, M., Hamon, M., Lellouche, J.M., Régnier, C., Desportes, C., Le Galloudec, O., Bricaud, C., Drillet, Y., Hernandez, F., Dubois, C., and Le Traon, P.-Y..: Performance and quality assessment of the global ocean eddy-permitting physical reanalysis glorys2v4, in: Operational oceanography serving sustainable marine development, edited by: Buch, E., Fernandez, V., Nolan, G., and Eparkhina, D., Proceedings of the eight EuroGOOS international conference, 2018, 3–5 October 2017, Bergen, Norway, ISBN 978-2-9601883-3-2, 2017.
Giles, K. A., Laxon, S. W., Ridout, A. L., Wingham, D. J., and Bacon, S.: Western Arctic Ocean freshwater storage increased by wind-driven spin-up of the Beaufort Gyre, Nat. Geosci., 5, 194–197, 2012.
Graham, R. M., P. Itkin, P., Meyer, A., Sundfjord, A., Spreen, G., Smedsrud, L. H., Liston, G. E., Cheng, B., Cohen, L., Divine, D., Fer, I., Fransson, A., Gerland, S., Haapala, J., S., Hudson, R., Johansson, A. M., King, J., Merkouriadi, I., Peterson, A. K., Provost, C., Randelhoff, A., Rinke, A., Rösel, A., Sennéchael, N., Walden, V. P., Duarte, P., Assmy, P., Steen, H., and Granskog, M. A.: Winter storms accelerate the demise of sea ice in the Atlantic sector of the Arctic Ocean, Sci. Rep., 9, 92222, https://doi.org/10.1038/s41598-019-45574-5, 2019.
Haine, T. W. N.: Arctic Ocean freshening linked to anthropogenic climate change: All hands on deck, Geophys. Res. Lett., 47, e2020GL090678, https://doi.org/10.1029/2020GL090678, 2020.
Haine, T. W. N., Curry, B., Gerdes, R., Hansen, E., Karcher, M., Lee, C., Rudels, B., Spreen, G., de Steur, L., Stewart, K. D., and Woodgate, R.: Arctic freshwater export: Status, mechanisms, and prospects, Glob. Planet. Change, 125, 13–35, https://doi.org/10.1016/j.gloplacha.2014.11.013, 2015.
Helm, V., Humbert, A., and Miller, H.: Elevation and elevation change of Greenland and Antarctica derived from CryoSat-2, The Cryosphere, 8, 1539–1559, https://doi.org/10.5194/tc-8-1539-2014, 2014.
Hermann, M., Box, J. E., Fausto, R. S., Colgan, W. T., Langen, P. L., Mottram, R., Wuite, J., Noël, B., van den Broeke, M. R., and van As, D.: Application of PROMICE Q-Transect in Situ Accumulation and Ablation Measurements (2000–2017) to Constrain Mass Balance at the Southern Tip of the Greenland Ice Sheet, J. Geophys. Res.-Earth, 123, 1235–1256, 2018.
Hill, E. A., Carr, J. R., Stokes, C. R., and Gudmundsson, G. H.: Dynamic changes in outlet glaciers in northern Greenland from 1948 to 2015, The Cryosphere, 12, 3243–3263, https://doi.org/10.5194/tc-12-3243-2018, 2018.
Horwath, M., Novotny, K., Cazenave, A., Palanisamy, H., Marzeion, B., Paul, F., Döll, P., Cáceres, D., Hogg, A., Otosaka, I., Shepherd, A., Forsberg, R., Barletta, V. R., Andersen, O. B., Rose, S. K., Johannessen, J., Raj, R. P., Gutknecht, B. D., Merchant, C. J., MacIntosh, C. R., and von Schuckmann, K.: ESA Climate Change Initiative (CCI) Sea Level Budget Closure (SLBC_cci), Final Report (D4.7). Version 1.1, 2020.
Ivanov, V. V., Shapiro, G. I., Huthnance, J. M., Aleynik, D. L., and Golovin, P. N.: Cascades of dense water around the world ocean, Prog. Oceanogr., 60, 47–98, 2004.
Janout, M. A., Hölemann, J., Timokhov, L., utjahr, O., and Heinemann, G.: Circulation in the northwest Laptev Sea in the eastern Arctic Ocean: Crossroads between Siberian River water, Atlantic water and polynya-formed dense water, J. Geophys. Res.-Ocean., 122, 6630–6647, https://doi.org/10.1002/2017JC013159, 2017.
Jeffries, M. O., Overland, J. E., and Perovich, D. K.: The Arctic shifts to a new normal, Phys. Today, 66, 35–40, https://doi.org/10.1063/PT.3.2147, 2013.
Jenkins, A.: Convection-Driven Melting near the Grounding Lines of Ice Shelves and Tidewater Glaciers, J. Phys. Oceanogr., 41, 2279–2294, https://doi.org/10.1175/JPO-D-11-03.1, 2011.
King, M. D., Howat, I. M., Jeong, S., Noh, M. J., Wouters, B., Noël, B., and van den Broeke, M. R.: Seasonal to decadal variability in ice discharge from the Greenland Ice Sheet, The Cryosphere, 12, 3813–3825, https://doi.org/10.5194/tc-12-3813-2018, 2018.
Kjeldsen, K. K., Korsgaard, N. J., Bjørk, A. A., Khan, S. A., Box, J. E., Funder, S., Larsen, N. K., Bamber, J. L., Colgan, W., Van Den Broeke, M., Siggaard-Andersen, M. L., Nuth, C., Schomacker, A., Andresen, C. S., Willerslev, E., and Kjær, K. H.: Spatial and temporal distribution of mass loss from the Greenland Ice Sheet since AD 1900, Nature, 528, 396–400, https://doi.org/10.1038/nature16183, 2015.
Kodaira, T., Waseda, T., Nose, T., and Inoue, J.: Record high Pacific Arctic seawater temperatures and delayed sea ice advance in response to episodic atmospheric blocking, Sci. Rep., 10, 20830, https://doi.org/10.1038/s41598-020-77488-y, 2020.
Krumpen, T., Belter, H. J., Boetius, A., Damm, E., Haas, C., Hendricks, S., Nicolaus, M., Nöthig, E.-M., Paul, S., Peekem, I., Ricker, R., and Stein, Rudiger: Arctic warming interrupts the Transpolar Drift and affects long-range transport of sea ice and ice-rafted matter, Sci. Rep., 9, 5459, https://doi.org/10.1038/s41598-019-41456-y, 2019.
Krumpen, T., Birrien, F., Kauker, F., Rackow, T., von Albedyll, L., Angelopoulos, M., Belter, H. J., Bessonov, V., Damm, E., Dethloff, K., Haapala, J., Haas, C., Harris, C., Hendricks, S., Hoelemann, J., Hoppmann, M., Kaleschke, L., Karcher, M., Kolabutin, N., Lei, R., Lenz, J., Morgenstern, A., Nicolaus, M., Nixdorf, U., Petrovsky, T., Rabe, B., Rabenstein, L., Rex, M., Ricker, R., Rohde, J., Shimanchuk, E., Singha, S., Smolyanitsky, V., Sokolov, V., Stanton, T., Timofeeva, A., Tsamados, M., and Watkins, D.: The MOSAiC ice floe: sediment-laden survivor from the Siberian shelf, The Cryosphere, 14, 2173–2187, https://doi.org/10.5194/tc-14-2173-2020, 2020.
Kryzhov, V. N. and Gorelits, O. V.: The Arctic Oscillation and its impact on temperature and precipitation in Northern Eurasia in the 20th Century, Russ. Meteorol. Hydrol., 40, 711–721, https://doi.org/10.3103/S1068373915110011, 2015.
Kwok, R.: Arctic sea ice thickness, volume, and multiyear ice coverage: losses and coupled variability (1958–2018), Environ. Res. Lett., 13, 105005, https://doi.org/10.1088/1748-9326/aae3ec, 2018.
Lenaerts, J. T. M., Medley, B., Broeke, M. R., and Wouters, B.: Observing and Modeling Ice Sheet Surface Mass Balance, Rev. Geophys., 41, 1–45, https://doi.org/10.1029/2018RG000622, 2019.
Lewis, K. M., van Dijken, G. L., and Arrigo, K. R.: Changes in phytoplankton concentration now drive increased Arctic Ocean primary production, Science, 369, 198–202. https://doi.org/10.1126/science.aay8380, 2020.
Liang, X. and Losch, M.: On the effects of increased vertical mixing on the Arctic Ocean and sea ice, J. Geophys. Res.-Ocean., 123, 9266–9282, 2018.
Liu, Y., Key, J. R., Wang, X., and Tschudi, M.: Multidecadal Arctic sea ice thickness and volume derived from ice age, The Cryosphere, 14, 1325–1345, https://doi.org/10.5194/tc-14-1325-2020, 2020.
Luneva, M. V., Aksenov, Y., Harle, J. D., and Holt, J. T.: The effects of tides on the water mass mixing and sea ice in the Arctic Ocean, J. Geophys. Res.-Ocean., 120, 6669–6699, 2015.
Luneva, M. V., Ivanov, V. V., Tuzov, F., Aksenov, Y., Harle, J. D., Kelly, S., and Holt, J. T.: Hotspots of dense water cascading in the Arctic Ocean: Implications for the Pacific water pathways, J. Geophys. Res., 125, e2020JC016044, https://doi.org/10.1029/2020JC016044, 2020.
Mankoff, K. D., Colgan, W., Solgaard, A., Karlsson, N. B., Ahlstrøm, A. P., van As, D., Box, J. E., Khan, S. A., Kjeldsen, K. K., Mouginot, J., and Fausto, R. S.: Greenland Ice Sheet solid ice discharge from 1986 through 2017, Earth Syst. Sci. Data, 11, 769–786, https://doi.org/10.5194/essd-11-769-2019, 2019.
Manucharyan, G. E. and Isachsen, P. E.: Critical role of continental slopes in halocline and eddy dynamics of the Ekman-driven Beaufort Gyre, J. Geophys. Res.-Ocean., 124, 2679–2696, 2019.
McLaughlin, F. A., Carmack, E. C., Macdonald, R. W., and Bishop, J. K. B.: Physical and geochemical properties across the Atlantic/Pacific water mass front in the southern Canadian Basin, J. Geophys. Res., 101, 1183–1197, https://doi.org/10.1029/95JC02634, 1996.
McPhee, M. G., Proshutinsky, A., Morison, J. H., Steele, M., and Alkire, M. B.: Rapid change in freshwater content of the Arctic Ocean, Geophys. Res. Lett., 36, L10602, https://doi.org/10.1029/2009GL037525, 2009.
Meneghello G., Doddridge, E. W., Marshall, J., Scott, J., and Campin, J.-M.: Exploring the role of the “Ice-Ocean governor” and mesoscale eddies in the equilibration of the Beaufort Gyre: lessons from observations, J. Phys. Oceanogr., 50, 269–277, https://doi.org/10.1175/JPO-D-18-0223.1, 2020.
Merkouriadi, I., Gallet, J.-C., Graham, R. M., Liston, G. E., Polashenski, C., Hudson, S., Rösel, A., and Gerland, S.: Winter snow conditions on Arctic sea ice north of Svalbard during the Norwegian young sea ICE (N-ICE2015) expedition, J. Geophys. Res.-Atmos., 122, 10837–10854, 2017.
Moholdt, G., Wouters, B., and Gardner, A. S.: Recent mass changes of glaciers in the Russian High Arctic: Glacier Mass Changes, Russian Arctic, Geophys. Res. Lett., 39, L10502, https://doi.org/10.1029/2012GL051466, 2012.
Moon, T., Sutherland, D. A., Carroll, D., Felikson, D., Kehrl, L., and Straneo, F.: Subsurface iceberg melt key to Greenland fjord freshwater budget, Nat. Geosci., 11, 1–8, https://doi.org/10.1038/s41561-017-0018-z, 2017.
Morison, J., Wahr, J., Kwok, R., and Peralta-Ferriz, C.: Recent trends in Arctic Ocean mass distribution revealed by GRACE, Geophys. Res. Lett., 34, L07602, https://doi.org/10.1029/2006GL029016, 2007.
Morison, J., Kwok, R., Peralta-Ferriz, C., Alkire, M., Rigor, I., Andersen, R., and Steele, M.: Changing arctic ocean freshwater pathways, Nature, 481, 66–70, 2012.
Morison, J., Kwok, R., Dickinson, S., Andersen, R., Peralta-Ferriz, C., Morison, D., Rigor, I., Dewey, S., and Guthrie, J.: The Cyclonic Mode of Arctic Ocean Circulation, J. Phys. Oceanogr., 51, 1053–1075, https://doi.org/10.1175/JPO-D-20-0190.1, 2021.
Newton, R., Pfirman, S., Tremblay, B., and DeRepentigny, P.: Increasing transnational sea-ice exchange in a changing Arctic Ocean, Earth's Future, 5, 633–647, 2017.
Nguyen, A. T., Pillar, H., Ocaña, V., Bigdeli, A., Smith, T. A., and Heimbach, P.: The Arctic Subpolar gyre sTate Estimate: Description and assessment of a data-constrained, dynamically consistent ocean-sea ice estimate for 2002–2017, J. Adv. Model. Earth Syst., 13, e2020MS002398. https://doi.org/10.1029/2020MS002398, 2021.
Noël, B., Berg, W. J. van de, Lhermitte, S., Wouters, B., Schaffer, N., and van den Broeke, M. R.: Six Decades of Glacial Mass Loss in the Canadian Arctic Archipelago, J. Geophys. Res.-Earth, 123, 1430–1449, https://doi.org/10.1029/2017JF004304, 2018.
Noël, B., Jakobs, C. L., van Pelt, W. J. J., Lhermitte, S., Wouters, B., Kohler, J., Hagen, J. O., Luks, B., Reijmer, C. H., van de Berg, W. J., and van den Broeke, M. R.: Low elevation of Svalbard glaciers drives high mass loss variability, Nat. Commun., 11, 4597, https://doi.org/10.1038/s41467-020-18356-1, 2020.
Nygard, T., Naakka, T., and Vihma, T.: Horizontal moisture transport dominates the regional moistening patterns in the Arctic, J. Clim., 33, 6793–6807, 2020.
Oltmanns, M., Straneo, F., and Tedesco, M.: Increased Greenland melt triggered by large-scale, year-round cyclonic moisture intrusions, The Cryosphere, 13, 815–825, https://doi.org/10.5194/tc-13-815-2019, 2019.
Østerhus, S., Woodgate, R., Valdimarsson, H., Turrell, B., de Steur, L., Quadfasel, D., Olsen, S. M., Moritz, M., Lee, C. M., Larsen, K. M. H., Jónsson, S., Johnson, C., Jochumsen, K., Hansen, B., Curry, B., Cunningham, S., and Berx, B.: Arctic Mediterranean exchanges: a consistent volume budget and trends in transports from two decades of observations, Ocean Sci., 15, 379–399, https://doi.org/10.5194/os-15-379-2019, 2019.
Östlund, G. H. and Hut, G.: Arctic Ocean water mass balance from isotope data, J. Geophys. Res., 89, 6373–6381, https://doi.org/10.1029/JC089iC04p06373, 1984.
Passaro, M., Rose, S., Andersen, O., Boergens, E., Calafat, F., Dettmering, D., and Benveniste, J.: ALES+: Adapting a homogenous ocean retracker for satellite altimetry to sea ice leads, coastal and inland waters, Remote Sens. Environ., 211, 456–471, 2018.
Peng, L., Zhang, X., Kim, J.-H., Cho, K.-H., Kim, B.-M., Wang, Z., and Tang, H.: Role of intense Arctic storm in accelerating summer sea ice melt: An in-situ observational study, Geophy. Rea. Lett., 48, e2021GL092714, https://doi.org/10.1029/2021GL092714, 2021.
Peralta-Ferriz, C. and Woodgate, R. A.: Seasonal and interannual variability of pan-Arctic surface mixed layer properties from 1979 to 2012 from hydrographic data, and the dominance of stratification for multiyear mixed layer depth shoaling, Prog. Oceanogr., 134, 19–53, https://doi.org/10.1016/j.pocean.2014.12.005, 2015.
Peralta-Ferriz, C., Morison, J. H., Wallace, J. M., Bonin, J. A., and Zhang, J.: Arctic Ocean Circulation Patterns Revealed by GRACE, J. Clim., 27, 1445–1468, https://doi.org/10.1175/JCLI-D-13-00013.1, 2014.
Pfirman, S. L., Colony, R., Nürnberg, D., Eicken, H., and Rigor, I.: Reconstructing the origin and trajectory of drifting Arctic sea ice, J. Geophys. Res.-Ocean., 102, 12575–12586, 1997.
Polyakov, I., Timokhov, L., Walsh, D., Dmitrenko, I., Colony, R., Johnson, M., Carmack, E., and Hutchings, J.: A long-term circulation and water mass monitoring program for the Arctic Ocean, Eos, Transactions, American Geophysical Union, 84, 281–285, 2003.
Polyakov, I. V., Pnyushkov, A., Alkire, M., Ashik, I., Baumann, T., Carmack, E., Goszczko, I., Guthrie, J., Ivanov, V., Kanzow, T., Krishfield, R., Kwok, R., Sundfjord, A., Morison, J., Rember, R., and Yulin, A.: Greater role for Atlantic inflows on sea-ice loss in the Eurasian Basin of the Arctic Ocean, Science, 356, 285–291, https://doi.org/10.1126/science.aai8204, 2017.
Polyakov, I. V., Rippeth, T. P., Fer, I., Alkire, M. B., Baumann, T. M., Carmack, E. C., Ingvaldsen, R., Ivanov, V. V., Janout, M., Lind, S., and Padman, L.: Weakening of cold halocline layer exposes sea ice to oceanic heat in the eastern Arctic Ocean, J. Clim., 33, 8107–8123, 2020a.
Polyakov, I. V., Alkire, M. B., Bluhm, B. A., Brown, K. A., Carmack, E. C., Chierici, M., Danielson, S. L., Ellingsen, I., Ershova, E. A., Gårdfeldt, K., Ingvaldsen, R. B., Pnyushkov, A. V., Slagstad, D., and Wassmann, P.: Borealization of the Arctic Ocean in Response to Anomalous Advection from Sub-Arctic Seas, Front. Mar. Sci., 7, 491, https://doi.org/10.3389/fmars.2020.00491, 2020b.
Proshutinsky, A., Krishfield, R., Timmermans, M.-L., Toole, J., Carmack, E., McLaughlin, F., Williams, W. J., Zimmermann, S., Itoh, M., and Shimada, K.: The Beaufort Gyre Fresh Water Reservoir: State and variability from observations, J. Geophys. Res., 114, C00A10, https://doi.org/10.1029/2008JC005104, 2009.
Proshutinsky, A., Dukhovskoy, D., Timmermans, M.-L., Krishfield, R., and J. Bamber, J.: Arctic circulation regimes, Philos. T. R. Soc. A, 373, 20140160, https://doi.org/10.1098/rsta.2014.0160, 2015.
Proshutinsky, A., Krishfield, R., Toole, J. M., Timmermans, M.-L., Williams, W., Zimmermann, S., Yamamoto-Kawai, M., Armitage, T. W. K., Dukhovskoy, D., Golubeva, E., Manucharyan, G. E., Platov, G., Watanabe, E., Kikuchi, T., Nishino, S., Itoh, M., S.-H. Kang, S.-H., Cho, K.-H., Tateyama, K., and Zhao, J.: Analysis of the Beaufort Gyre freshwater content in 2003–2018, J. Geophys. Res.-Ocean., 124, 9658–9689, https://doi.org/10.1029/2019JC015281, 2019.
Prowse, T., Bring, A., Mård, J., Carmack, E., Holland, M., Instanes, A., and Wrona, F. J.: Arctic Freshwater Synthesis: Summary of key emerging issues, J. Geophys. Res.-Biogeosci., 120, 1887–1893, https://doi.org/10.1002/2015JG003128, 2015.
Rabe, B., Karcher, M., Schauer, U., Toole, J., Krishfield, R., Pisarev, S., Kauker, F., Gerdes, R., and Kikuchi, T.: An assessment of Arctic Ocean freshwater content changes from the 1990s to 2006–2008, Deep-Sea Res. I, 58, 173–185, https://doi.org/10.1016/j.dsr.2010.12.002, 2011.
Rabe, B., Karcher, M., Kauker, F., Schauer, U. Toole, J. M., Krishfield, R. A., Pisarev, S., Kikuchi, T., and Su, J.: Arctic Ocean liquid freshwater storage trend 1992–2012, Geophys. Res. Lett., 41, 961–968, https://doi.org/10.1002/2013GL058121, 2014a.
Rabe, B., Karcher, M. J., Kauker, F., Schauer, U., Toole, J. M., Krishfield, R. A., Pisarev, S., Kikuchi, T., and Su, J.: (Table 1) Physical oceanography from several POLARSTERN cruises to the Arctic Ocean, 1993–2012, PANGAEA, https://doi.org/10.1594/PANGAEA.815756, 2014b.
Rabe, B., Schauer, U., Ober, S., Horn, M., Hoppmann, M., Korhonen, M., Pisarev, S., Hampe, H., Villacieros, N., Savy, J. P., and Wisotzki, A.: Physical oceanography during POLARSTERN cruise PS94 (ARK-XXIX/3), PANGAEA, https://doi.org/10.1594/PANGAEA.859558, 2016.
Raj, R. P., Andersen, O. B., Johannessen, J. A., Benjamin, G., Chatterjee, S., Rose, S. K., Bonaduce, A., Horwath, M., Ranndal, H., Richter, K., Palanisamy, H., Ludwigsen, C. A., Bertino, L., Nilsen, J. E. O., Knudsen, P., Hogg, A., Cazenave, A., and Benveniste, J.: Arctic Sea level Budget Assessment During the GRACE/Argo Time Period, Remote Sens., 125, 2837, https://doi.org/10.3390/rs12172837, 2020.
Rampal, P., Weiss, J., Dubois, C., and Campin, J.-M.: IPCC climate models do not capture Arctic sea ice drift acceleration: Consequences in terms of projected sea ice thinning and decline, J. Geophys. Res., 116, C00D07, https://doi.org/10.1029/2011JC007110, 2011.
Randelhoff, A. and Sundfjord, A.: Short commentary on marine productivity at Arctic shelf breaks: upwelling, advection and vertical mixing, Ocean Sci., 14, 293–300, https://doi.org/10.5194/os-14-293-2018, 2018.
Regan, H., Lique, C., Talandier, C., and Meneghello, G.: Response of Total and Eddy Kinetic Energy to the Recent Spinup of the Beaufort Gyre, J. Phys. Oceanogr., 50, 575–594, https://doi.org/10.1175/JPO-D-19-0234.1, 2020.
Ricker, R., Girard-Ardhuin, F., Krumpen, T., and Lique, C.: Satellite-derived sea ice export and its impact on Arctic ice mass balance, The Cryosphere, 12, 3017–3032, https://doi.org/10.5194/tc-12-3017-2018, 2018.
Rippeth, T. P., Lincoln, B. J., Lenn, Y.-D., Green, J. M., Sundfjord, A., and Bacon, S.: Tide-mediated warming of Arctic halocline by Atlantic heat fluxes over rough topography, Nat. Geosci., 8, 191–194, 2015.
Roloff, A., Rabe, B., Kikuchi, T., and Wisotzki, A.: Physical oceanography from 49 XCTD stations during POLARSTERN cruise PS87 (ARK-XXVIII/4), Alfred Wegener Institute, Helmholtz Centre for Polar and Marine Research, Bremerhaven, PANGAEA, https://doi.org/10.1594/PANGAEA.853770, 2015.
Rose, S. K., Andersen, O. B., Passaro, M., Ludwigsen, C. A., and Schwatke, C.: Arctic Ocean Sea Level Record from the Complete Radar Altimetry Era: 1991–2018, Remote Sens., 11, 1672, https://doi.org/10.3390/rs11141672, 2019.
Rudels, B.: Arctic Ocean circulation and variability – advection and external forcing encounter constraints and local processes, Ocean Sci., 8, 261–286, https://doi.org/10.5194/os-8-261-2012, 2012.
Rudels, B., Jones, E. P., Anderson, L. G., and Kattner, G.: On the intermediate depth waters of the Arctic Ocean, in: The Polar Oceans and Their Role in Shaping the Global Environment, Geophys. Monogr. Ser., edited by: Johannessen, O. M., Muench, R. D., and Overland, J. E., AGU, Washington, D.C., Vol. 85, 33–46, 1994.
Rudels, B., Jones, E. P., Schauer, U., and Eriksson, P.: Atlantic sources of the Arctic Ocean surface and halocline waters, Polar Res., 23, 181–208, https://doi.org/10.3402/polar.v23i2.6278, 2004.
Sasgen, I., Wouters, B., Gardner, A.S., King, M. D., Tedesco, M., Landerer, F. W., Dahle, C., Save, H., and Fettweis, X.: Return to rapid ice loss in Greenland and record loss in 2019 detected by the GRACE-FO satellites, Commun. Earth Environ., 1, 8, https://doi.org/10.1038/s43247-020-0010-1, 2020.
Sato, K. and Inoue, J.: Comparison of Arctic sea ice thickness and snow depth estimates from CFSR with in situ observations, Clim. Dynam., 50, 289–301, 2018.
Schauer, U. and Losch, M.: “Freshwater” in the Ocean is Not a Useful Parameter in Climate Research, J. Phys. Oceanogr., 49, 2309–2321, https://doi.org/10.1175/JPO-D-19-0102.1, 2019.
Serreze, M. C., McLaren, A. S., and Barry, R. G.: Seasonal variations of sea ice motion in the Transpolar Drift Stream, Geophys. Res. Lett., 16, 811–814, 1989.
Serreze, M. C., Barrett, A. P., Slater, A. G., Woodgate, R. A., Aagaard, K., Lammers, R. B., Steele, M., Moritz, R., Meredith, M., and Lee, C. M.: The large-scale freshwater cycle of the Arctic, J. Geophys. Res., 111, C11010, https://doi.org/10.1029/2005JC003424, 2006.
Sévellec, F., Fedorov, A. V., and Liu, W.: Arctic sea-ice decline weakens the Atlantic meridional overturning circulation, Nat. Clim. Change, 7, 604–610, https://doi.org/10.1038/nclimate3353, 2017.
Shepherd, A. and The IMBIE Team: Mass balance of the Greenland Ice Sheet from 1992 to 2018, Nature, 579, 1–21, https://doi.org/10.1038/s41586-019-1855-2, 2020.
Shepherd, A., Ivins, E. R., Geruo, A., Barletta, V. R., Bentley, M. J., Bettadpur, S., Briggs, K. H., Bromwich, D. H., Forsberg, R., Galin, N., Horwath, M., Jacobs, S., Joughin, I., King, M. A., Lenaerts, J. T., Li, J., Ligtenberg, S. R., Luckman, A., Luthcke, S. B., McMillan, M., Meister, R., Milne, G., Mouginot, J., Muir, A., Nicolas, J. P., Paden, J., Payne, A. J., Pritchard, H., Rignot, E., Rott, H., Sørensen, L. S., Scambos, T. A., Scheuchl, B., Schrama, E. J., Smith, B., Sundal, A. V., van Angelen, J. H., van de Berg, W. J., van den Broeke, M. R., Vaughan, D. G., Velicogna, I., Wahr, J., Whitehouse, P. L., Wingham, D. J., Yi, D., Young, D., and Zwally H. J.: A reconciled estimate of ice-sheet mass balance, Science, 338, 1183–1189, https://doi.org/10.1126/science.1228102, 2012.
Shiklomanov, A., Déry, S., Tretiakov, M., Yang, D., Magritsky, D., Georgiadi, A., and Tang, W.: River Freshwater Flux to the Arctic Ocean, in: Arctic Hydrology, edited by: Yang, D. and Kane, D., Permafrost and Ecosystems. Springer, Chambers, https://doi.org/10.1007/978-3-030-50930-9_24, 2021.
Simonsen, S. B., Barletta, V. R., Colgan, W. T., and Sørensen, L. S.: Greenland Ice Sheet mass balance (1992–2020) from calibrated radar altimetry, Geophys. Res. Lett., 48, e2020GL091216, https://doi.org/10.1029/2020GL091216, 2021.
Smedsrud, L. H., Halvorsen, M. H., Stroeve, J. C., Zhang, R., and Kloster, K.: Fram Strait sea ice export variability and September Arctic sea ice extent over the last 80 years, The Cryosphere, 11, 65–79, https://doi.org/10.5194/tc-11-65-2017, 2017.
Sokolov, A. L.: Drift of ice in the Arctic Basin and changes in ice conditions over the northern sea route, Probl. Arct. Anarct. Engl. Translation, 11, 1–20, 1962.
Solgaard, A. M., Simonsen, S. B., Grinsted, A., Mottram, R., Karlsson, N. B., Hansen, K., and Sorenson, L. S.: Hagen Bræ: A surging glacier in North Greenland – 35 years of observations, Geophys. Res. Lett., 47, e2019GL085802, https://doi.org/10.1029/2019GL085802, 2020.
Spall, M. A.: Dynamics and thermodynamics of the mean transpolar drift and ice thickness in the Arctic Ocean, J. Clim., 32, 8449–8463, https://doi.org/10.1175/JCLI-D-19-0252.1, 2019.
Spreen, G., Kwok, R., and Menemenlis, D.: Trends in Arctic sea ice drift and role of wind forcing: 1992–2009, Geophys. Res. Lett., 38, L19501, https://doi.org/10.1029/2011GL048970, 2011.
Spreen, G., de Steur, L., Divine, D., Gerland, S., Hansen, E., and Kwok, R.: Arctic sea ice volume export through Fram Strait from 1992 to 2014, J. Geophys. Res.-Ocean., 125, e2019JC016039, https://doi.org/10.1029/2019JC016039, 2020.
Steele, M., Morison, J., Ermold, W., Rigor, I., Ortmeyer, M., and Shimada, K.: Circulation of summer Pacific halocline water in the Arctic Ocean, J. Geophys. Res.-Ocean., 109, C02027, https://doi.org/10.1029/2003JC002009, 2004.
Storto, A. and Masina, S.: C-GLORSv5: an improved multipurpose global ocean eddy-permitting physical reanalysis, Earth Syst. Sci. Data, 8, 679–696, https://doi.org/10.5194/essd-8-679-2016, 2016.
Straneo, F., Curry, R. G., Sutherland, D. A., Hamilton, G. S., Cenedese, C., Våge, K., and Stearns, L. A.: Impact of fjord dynamics and glacial runoff on the circulation near Helheim Glacier, Nat. Geosci., 4, 322–327, https://doi.org/10.1038/ngeo1109, 2011.
Stroeve, J. and Notz, D.: Changing state of Arctic sea ice across all seasons, Environ. Res. Lett., 13, 103001, https://doi.org/10.1088/1748-9326/aade56, 2018.
Tamura, T. and Ohshima, K. I.: Mapping of sea ice production in the Arctic coastal polynyas, J. Geophys. Res., 116, C07030, https://doi.org/10.1029/2010JC006586, 2011.
Tedesco, M. and Fettweis, X.: Unprecedented atmospheric conditions (1948–2019) drive the 2019 exceptional melting season over the Greenland ice sheet, The Cryosphere, 14, 1209–1223, https://doi.org/10.5194/tc-14-1209-2020, 2020.
Thompson, D. W. J. and Wallace, J. M.: The Arctic Oscillation Signature in Wintertime Geopotential Height and Temperature Fields, Geophys. Res. Lett., 25, 1297–1300, 1998.
Timmermans, M.-L. and Marshall, J.: Understanding Arctic Ocean Circulation: A Review of Ocean Dynamics in a Changing Climate, J. Geophys. Res.-Ocean., 125, C04S02, https://doi.org/10.1029/2018JC014378, 2020.
Timmermans, M. L., Proshutinsky, A., Krishfield, R. A., Perovich, D. K., Richter-Menge, J. A., Stanton, T. P., and Toole, J. M.: Surface freshening in the Arctic Ocean's Eurasian Basin: An apparent consequence of recent change in the wind-driven circulation, J. Geophys. Res., 116, C00D03, https://doi.org/10.1029/2011JC006975, 2011.
Toole J. M. and Krishfield R.: Woods Hole Oceanographic Institution Ice-Tethered Profiler Program, Ice-Tethered Profiler observations: Vertical profiles of temperature, salinity, oxygen, and ocean velocity from an Ice-Tethered Profiler buoy system. Dataset accessed 2016-09-01, NOAA National Centers for Environmental Information, 2016.
Tsubouchi, T., Bacon, S., Naveira Garabato, A. C., Aksenov, Y., Laxon, S. W., Fahrbach, E., Beszczynska-Möller, A., Hansen, E., Lee, C. M., and Ingvaldsen, R. B.: The Arctic Ocean in summer: a quasi-synoptic inverse estimate of boundary fluxes and water mass transformation, J. Geophys. Res., 117, C01024, https://doi.org/10.1029/2011JC007174, 2012.
Tsubouchi, T., Bacon, S., Aksenov, Y., Naveira Garabato, A. C., Beszczynska-Möller, A., Hansen, E., de Steur, L., Curry B., and Lee, C. M.: The Arctic Ocean seasonal cycles of heat and freshwater fluxes: observation-based inverse estimates, J. Phys. Oceanogr., 48, 2029–2055, https://doi.org/10.1175/JPO-D-17-0239.1, 2018.
Tsubouchi, T., Våge, K., Hansen, B., Larsen, K. M. H., Østerhus, S., Johnson, C., Jónsson, S., and Valdimarsson, H.: Increased ocean heat transport into the Nordic Seas and Arctic Ocean over the period 1993–2016, Nat. Clim. Change, 11, 21–26, 2021.
Våge, K., Pickart, R. S., Pavlov, V., Lin, P., Torres, D. J., Ingvaldsen, R., Sundfjord, A., and Proshutinsky, A.: The Atlantic Water boundary current in the Nansen Basin: Transport and mechanisms of lateral exchange, J. Geophys. Res.-Ocean., 121, 6946–6960, https://doi.org/10.1002/2016JC011715, 2016.
Vandecrux, B., Fausto, R., Van As, D., Colgan, W., Langen, P. L., Haubner, K., Ingeman-Nielsen, T., Heilig, A., Stevens, C. M., Macferrin, M., Niwano, M., Steffen, K., and Box, J. E.: Firn cold content evolution at nine sites on the Greenland ice sheet between 1998 and 2017, J. Glaciol., 66, 591–602, https://doi.org/10.1017/jog.2020.30, 2020.
Vihma, T. J., Screen, J., Tjernström, M., Newton, B., Zhang, X., Popova, V., Deser, C., Holland, M., and Prowse, T.: The atmospheric role in the Arctic water cycle: A review on processes, past and future changes, and their impacts, J. Geophys. Res.-Biogeo., 121, 586–620, https://doi.org/10.1002/2015JG003132, 2016.
Villamil-Otero, G. A., Zhang, J., He, J., and Zhang, X.: Role of extratropical cyclones in the recently observed increase in poleward moisture transport into the Arctic Ocean, Adv. Atmos. Sci., 35, 85–94, https://doi.org/10.1007/s00376-017-7116-0, 2018.
Vogt, M., Rabe, B., Kikuchi, T., and Wisotzki, A.: Physical oceanography from 15 XCTD stations during POLARSTERN cruise PS86 (ARK-XXVIII/3 AURORA). Alfred Wegener Institute, Helmholtz Centre for Polar and Marine Research, Bremerhaven, PANGAEA, https://doi.org/10.1594/PANGAEA.853768, 2015.
Volkov, V. A., Mushta, A., and Demchev, D.: Sea Ice Drift in the Arctic, in: Sea Ice in the Arctic, Springer, Cham, 301–313, 2020.
Wang, Q., Wekerle, C., Danilov, S., Sidorenko, D., Koldunov, N., Sein, D., Rabe, B., and Jung, T.: Recent Sea Ice Decline Did Not Significantly Increase the Total Liquid Freshwater Content of the Arctic Ocean, J. Clim., 32, 15–32, https://doi.org/10.1175/JCLI-D-18-0237.1, 2019.
Watkins, M. M., Wiese, D. N., Yuan, D.-N., Boening, C., and Landerer, F. W.: Improved methods for observing Earth's time variable mass distribution with GRACE using spherical cap mascons, J. Geophys. Res.-Sol. Ea., 120, 2648–2671, https://doi.org/10.1002/2014JB011547, 2015.
Webster, M. A., Parker, C., Boisvert, L., and Kwok, R.: The role of cyclone activity in snow accumulation on Arctic sea ice, Nat. Commun., 10, 5285, https://doi.org/10.1038/s41467-019-13299-8, 2019.
Wei, J, Zhang, X., and Wang, Z.: Impacts of extratropical storm tracks on Arctic sea ice export through Fram Strait, Clim. Dynam., 52, 2235–2246, https://doi.org/10.1007/s00382-018-4254-8, 2019.
Williams, W. and Carmack, C. E.: The “interior” shelves of the Arctic Ocean: Physical oceanographic setting, climatology and effects of sea-ice retreat on cross-shelf exchange, Prog. Oceanogr. 139, 24–41, https://doi.org/10.1016/j.pocean.2015.07.008, 2015.
Wood, K.-R., Overland, J. E., Salo, S. A., Bond, N. A., Williams, W. J., and Dong, X.: Is there a “new normal” climate in the Beaufort Sea?, Polar Res., 32, 19552, https://doi.org/10.3402/polar.v32i0.19552, 2013.
Woodgate, R. A.: Increases in the Pacific inflow to the Arctic from 1990 to 2015, and insights into seasonal trends and driving mechanisms from year-round Bering Strait mooring data, Prog. Oceanog., 160, 124–154, https://doi.org/10.1016/j.pocean.2017.12.007, 2018.
Yamamoto-Kawai, M., McLaughlin, F. A., Carmack, E. C., Nishino, S., Shimada, K., and Kurita, N.: Surface freshening of the Canada Basin, 2003–2007: River runoff versus sea ice meltwater, J. Geophys. Res., 114, C00A05, https://doi.org/10.1029/2008JC005000, 2009.
Zhang, J., Weijer, W., Steele, M., Cheng, W., Verma, T., and Veneziani, M.: Labrador Sea freshening linked to Beaufort Gyre freshwater release, Nat. Commun., 12, 1–8, 2021.
Zhang, X., Sorteberg, A., Zhang, J., Gerdes, R., and Comiso, J. C.: Recent radical shifts of atmospheric circulations and rapid changes in Arctic climate system, Geophys. Res. Lett., 35, L22701, https://doi.org/10.1029/2008GL035607, 2008.
Zhang, X., He, J. Zhang, J., Polyakov, I., Gerdes, R., Inoue, J., and Wu, P.: Enhanced poleward moisture transport and amplified northern high-latitude wetting trend, Nat. Clim. Change, 3, 47–51, https://doi.org/10.1038/nclimate1631, 2013.
Zhong, W., Zhang, J., Steele, M., Zhao, J., and Wang, T.: Episodic extrema of surface stress energy input to the western Arctic Ocean contributed to step changes of freshwater content in the Beaufort Gyre, Geophys. Res. Lett., 46, 12173–12182, https://doi.org/10.1029/2019GL084652, 2019.
Zuo, H., Balmaseda, M. A., Tietsche, S., Mogensen, K., and Mayer, M.: The ECMWF operational ensemble reanalysis-analysis system for ocean and sea-ice: a description of the system and assessment, Ocean Sci., 15, 779–808, https://doi.org/10.5194/os-15-779-2019, 2019.