the Creative Commons Attribution 4.0 License.
the Creative Commons Attribution 4.0 License.
 | 21 Jun 2019
Surface predictor of overturning circulation and heat content change in the subpolar North Atlantic
Damien G. Desbruyères
Herlé Mercier
Guillaume Maze
Nathalie Daniault
The Atlantic Meridional Overturning Circulation (AMOC) impacts ocean and atmosphere temperatures on a wide range of temporal and spatial scales. Here we use observational datasets to validate model-based inferences on the usefulness of thermodynamics theory in reconstructing AMOC variability at low frequency, and further build on this reconstruction to provide prediction of the near-future (2019–2022) North Atlantic state. An easily observed surface quantity – the rate of warm to cold transformation of water masses at high latitudes – is found to lead the observed AMOC at 45∘ N by 5–6 years and to drive its 1993–2010 decline and its ongoing recovery, with suggestive prediction of extreme intensities for the early 2020s. We further demonstrate that AMOC variability drove a bi-decadal warming-to-cooling reversal in the subpolar North Atlantic before triggering a recent return to warming conditions that should prevail at least until 2021. Overall, this mechanistic approach of AMOC variability and its impact on ocean temperature brings new key aspects for understanding and predicting climatic conditions in the North Atlantic and beyond.
- Article
(2873 KB) - Full-text XML
-
Supplement
(525 KB) - BibTeX
- EndNote


The north-eastward meandering flow of the North Atlantic Current (NAC) dominates the upper-ocean circulation of the northern North Atlantic (Krauss, 1986). It transports relatively warm waters that release heat to the atmosphere as they flow around the Subpolar Gyre (SPG) and the Nordic Seas, ultimately forming North Atlantic Deep Water that propagates in the deep layers via upper and deep western boundary currents (DWBC) and dispersive interior pathways (Bower et al., 2009; Lherminier et al., 2010; see Fig. S1 in the Supplement for domain boundaries and bathymetric features). On top of sequestering physical and biogeochemical properties in the deep seas, the warm-to-cold conversion of water masses and the meridional overturning circulation associated with it drives a significant meridional heat transport. Its variability is thought to be a major cause of temperature and ocean heat content (OHC) shifts in the upper layer of the northern North Atlantic, with important ramifications for ocean–atmosphere interactions and large-scale climate variability (Bryden et al., 2014; Robson et al., 2017). In particular, the most recent reversal of climatic trends in the north Atlantic SPG since 2005 (warming to cooling) has been attributed in numerical models to a decadal weakening of the ocean meridional heat transport across the southern boundary of the SPG (Piecuch et al., 2017; Robson et al., 2016). The recent return of intense ocean-to-atmosphere heat loss (and associated deep convection) since the mid-2010s (Josey et al., 2018; Yashayaev and Loder, 2017) is now suggestive of an ongoing or approaching re-intensification of the circulation and, consequently, a shift to warming condition in the SPG. Overall, the need for a continuous monitoring of the top-to-bottom current field in the SPG has appeared critical to capture the many components of this warm-to-cold transformation. In 2014, international efforts led to the implementation of an in situ mooring array aimed to fulfil such a need – the Overturning in the Subpolar North Atlantic Program (OSNAP; Lozier et al., 2017).
In the commonly used depth space (z), the AMOCz stream function helps to simplify the complex three-dimensional velocity field of the North Atlantic into a northward flow of about 16 Sv (sverdrup, 1 Sv = 106 m3 s−1) in the upper 0–1000 m or so and a compensating southward flow at depth, connected vertically by the net sinking of surface waters at high latitudes (Buckley and Marshall, 2016; Wunsch, 2002). However, if one is interested in OHC and the dynamics of buoyancy redistribution in the ocean, an estimator of the circulation in density space (σ) must be preferred, which we will note AMOCσ hereafter. Such an estimator allows us to fully capture transformation of light water masses into denser ones at high latitudes, along both the vertical overturning and horizontal gyre circulations (Lherminier et al., 2010; Pickart and Spall, 2007).
In the absence of diapycnal mixing, the diapycnal volume fluxes associated with the AMOCσ at a given latitude must relate to air–sea exchanges of buoyancy within isopycnal outcrops north of this latitude (Fig. 1). This thermodynamic balance between the AMOCσ and its surface-forced component (noted SFOCσ hereafter), theorized by Walin (1982) and much later verified with numerical models (Grist et al., 2010; Marsh, 2000), suggests key monitoring and predictive skill of AMOCσ. This was particularly evidenced in low-resolution coupled climate models, which hold a significant lagged relationship between high-latitude surface forcing and overturning circulation at the southern exit of the SPG (Grist et al., 2009). In a follow-up paper, Grist et al. (2014) estimated the surface-forced component of the AMOC in several atmospheric reanalyses and highlighted their overall consistency in the SPG. An independent validation of those surface indices with observation-based time series of the interior circulation is, however, still missing. Moreover, the potential of such proxy-based reconstruction of the AMOC for predicting OHC variability and new climatic reversal in the coming years remains to be shown.
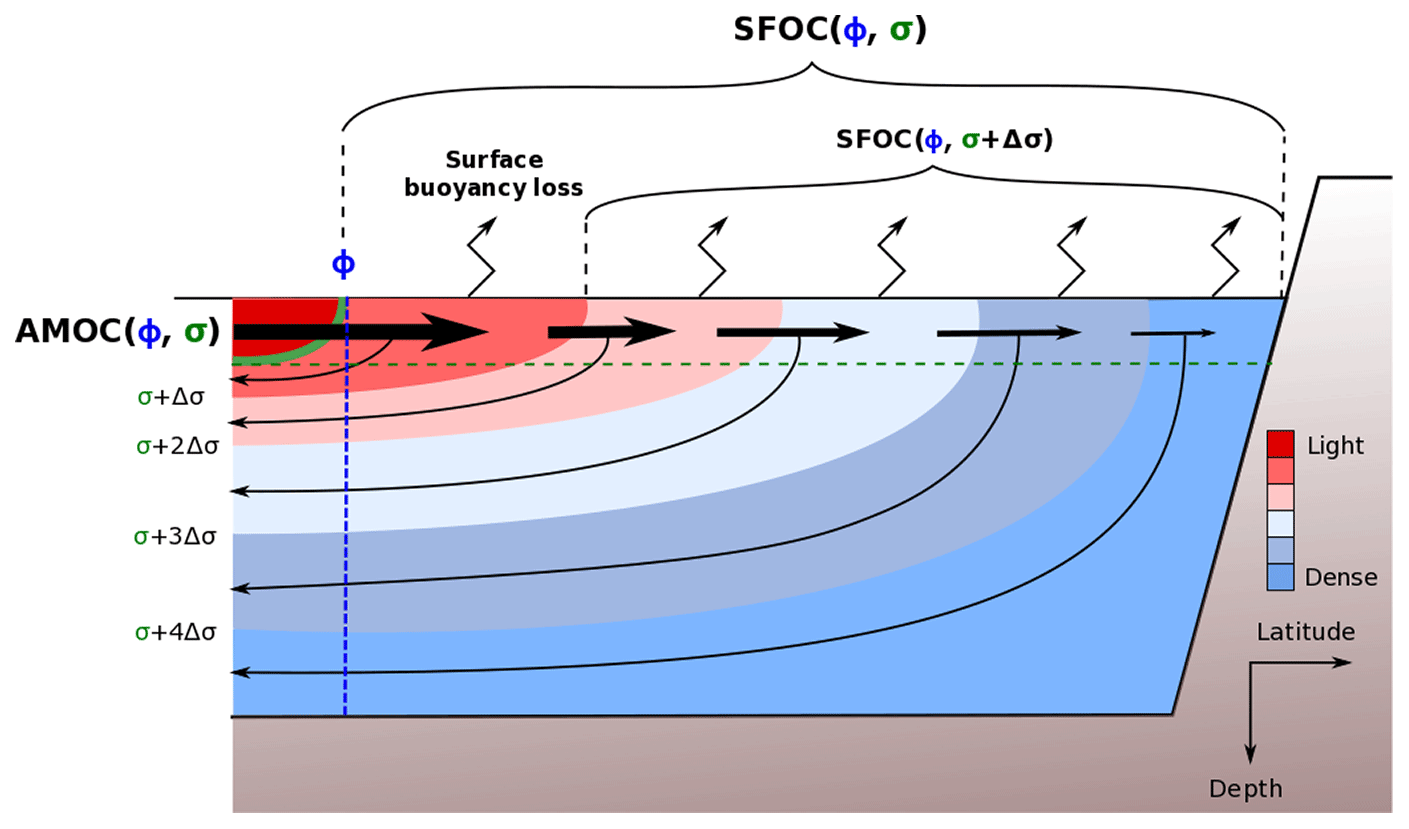
Figure 1Schematic of the relationship between meridional overturning circulation at latitude ϕ and isopycnal surface σ – the AMOC (ϕ, σ) – and its surface-forced component – the SFOC (ϕ, σ). Arrows show the progressive transformation of waters across increasing density surfaces balanced by buoyancy loss at the air–sea interface and meridional import and export. Inspired from Marsh (2000).
The primary purposes of the present study are (1) to validate with observational data the predictive skill of surface-forced water mass transformation for AMOC variability and (2) to assess the causal link between AMOC variability and decadal OHC changes in the SPG and perform near-future prediction of those quantities. Regional variability will also be documented, with details on the capability of the in situ OSNAP array in monitoring the basin-wide AMOCσ.
The paper is structured as follows. Section 2 presents the observational datasets and the methodology used to compute AMOCσ, SFOCσ, and OHC. Section 3 gathers the main results of the study and Sect. 4 summarizes and discusses them.
2.1 Data
Monthly gridded potential temperature (θ) and practical salinity (S) profiles from four in situ hydrographic datasets were used. Details on those datasets (EN4, CORA, ISHII, and ARMOR3D) are provides in Table S1 in the Supplement. For each product and at each grid point, the θ and S profiles were interpolated to a regular 20 db vertical spacing. Using the TEOS-10 Gibbs-SeaWater (GSW) toolbox, practical salinity was converted to absolute salinity and potential temperature to conservative temperature, and σ0 and σ1 (potential density relative to sea-surface and 1000 m, respectively) were computed. Air–sea heat fluxes (radiative and turbulent) and freshwater fluxes (evaporation and precipitation) were obtained from three atmospheric reanalyses (NCEP2, ERA-I, and CERES, see Table S1). Absolute dynamic topography and associated surface meridional geostrophic velocities were obtained from the AVISO platform and combine sea-level anomalies from multi-mission satellite altimeters and mean dynamic topography from GOCE (Gravity field and steady-state Ocean Circulation Explorer), GRACE (Gravity Recovery and Climate Experiment), altimetry, and in situ data (https://www.aviso.altimetry.fr/en/data/products/auxiliary-products/mdt.html, last access: 20 June 2019). Data were downloaded on 12 September 2017 for the years 1993–2015 and in August 2018 for the years 2016–2017.
The various integrated quantities derived from those data products (such as ocean heat content or overturning stream functions – see description below in Sect. 2.2 and 2.3) were then combined into ensemble mean over the period (1993–2017 for altimetry-related quantities, 1985–2017 otherwise), with associated ensemble standard errors computed as , where σ is the standard deviation and N=4 the number of data products used in the mean. This error captures the spread induced by the different methods used as of today to interpolate sparse in situ observations. Further notes on statistical analysis of the reported results (correlation, trend error) are provided in the Supplement.
2.2 Computation of AMOCσ, MHTσ, and associated OHC
The 0–2000 m absolute meridional velocities υ at 45∘ N are derived by referencing in situ estimates of the geostrophic thermal-wind currents with altimetry-derived sea-surface geostrophic velocities, following previously published methodologies (Gourcuff et al., 2011; Mercier et al., 2015; Sarafanov et al., 2012). The latitude 45∘ N represents the southern geographic boundary of the SPG with the bulk of the light-to-dense transformation associated with the AMOCσ occurring north of it (see Sect. 3.1). Moreover, the thermohaline fronts (and the resulting relative velocities) at 45∘ N are relatively well defined in ocean analysis products due to good data coverage, notably at the western boundary. This latitudinal band is therefore chosen as our reference line for computing a realistic AMOCσ and undertaking its subsequent mechanistic analysis.
The AMOCσ stream function is obtained by integrating υ zonally and vertically above each σ1 surface (spaced by δσ=0.025 kg m−3). The maximum value of the resulting stream function at the density level σm is written as
We restrict such a calculation to the 0–2000 m layer as not all products contain data below that depth1. This threshold is nonetheless deep enough to capture the level of maximum transformation at 45∘ N, as well as its variability. The AMOCσ-driven heat transport is estimated as in Mercier et al. (2015):
where ρ0=1025 kg m−3, Cp=4000 J kg−1 ∘C−1, and Δθ is the temperature difference between the upper and lower limbs of the AMOCσ (i.e. the area-weighted average temperature of water lighter than σm minus the area-weighted average temperature of water heavier than σm). Note that Δθ was computed from the EN4.2.0 product that provides full-depth temperature profiles. The change in ocean heat content north of 45∘ N driven by MHTσ is then estimated as
where t is a given year and the overbar refers to a temporal average over the period 1996–2013. This reference period is assumed to represent a climatological equilibrium state around which MHTσ fluctuates so that positive (negative) anomalies in MHTσ result in warming (cooling) north of 45∘ N. As shown in Sect. 3.3, this assumption yields high and significant correlations between OHCMHTσ and the observed OHC in the SPG.
2.3 Computation of SFOCσ
The surface-forced component of the overturning stream function SFOCσ was computed following common practice and methodologies (Marsh, 2000). For each month and each isopycnal σ (spaced by δσ=0.05 kg m−3), SFOCσ was computed as the diapycnal convergence of the diapycnal volume flux driven by surface density flux wherever σ outcrops north of a given coast-to-coast section:
where
The quantity within square brackets is the local surface density flux, α and β are the thermal expansion and haline contraction coefficients, respectively, Cp is specific heat capacity of sea water (4000 J kg−1 K−1), Q the net surface heat flux, E the evaporation rate, and P the precipitation rate. Following Marsh (2000), monthly fields of surface temperature (for density computation) and Q are used herein while monthly climatology values for surface salinity S and E−P are used to avoid introducing punctual spurious surface density anomalies due to poor salinity sampling (especially in the early historical record), notably near the continental margins and seasonally ice-covered areas. We note here that the air–sea buoyancy flux in the SPG, and therefore SFOCσ, is largely controlled by its thermal component (Marsh, 2000). When for a given month (usually during summer), σ does not outcrop north of 45∘ N, SFOCσ is set to zero. Annual averages are then obtained for 1985–2017. Even if SFOCσ is a surface integral statement, maps of transformation rates can be obtained by accumulating the integrand over outcrops (Brambilla et al., 2008; Maze et al., 2009), as shown later in Sect. 3.1.
In order to directly relate SFOCσ and AMOCσ, we rely on the assumption of water mass steadiness in the SPG, meaning that the net accumulation of volume within isopycnal layers is considered to be negligible in front of the import of light water to be transformed and the export of dense water after transformation (Marsh, 2000). To verify this hypothesis, we compute , the yearly local change in the volume of discrete isopycnal layer (in Sv), where Vσ is evaluated on 1 January of each year. Averaging this term north of 45∘ N and summing below the density level of maximum SFOCσ yields an evaluation of water mass steadiness during each year. As discussed later, this term can be intermittently important but does not dominate the decadal variability so that a direct link emerges between SFOCσ and AMOCσ on those relatively long timescales.
3.1 The time-mean AMOCσ and SFOCσ
The time-mean depth–longitude field of meridional velocity υ at 45∘ N (Fig. 2a) is dominated by a western boundary current system in good quantitative agreement with direct current estimates carried out in the region (Mertens et al., 2014; Toole et al., 2017). This current system includes the southward-flowing Labrador Current (LC) adjacent to the slope above 800 m (16 Sv), the upper part of the southward-flowing DWBC circa 47∘ W with increasing velocities with depth (13 Sv), and the surface-intensified northward-flowing NAC (53 Sv) with its recirculation east of 45∘ W (28 Sv). Meridional velocities are significantly weaker further east in the gyre interior. Integrating zonally the volume transport above discrete σ1 surfaces yields the (partial) AMOCσstream function at 45∘ N, which reaches a time-mean maximum value of 14.3±1.4 Sv at σ1=32.15 (Fig. 2b; see also Fig. S2A for the AMOCσ stream function of each individual product). A similar calculation in depth space yields the (partial) AMOCz stream function at 45∘ N, which reaches a time-mean maximum value of 9±0.4 Sv at 700 m depth (Fig. S2B). Therefore, about 60 % of the maximum diapycnal volume flux above 2000 m depth at 45∘ N is associated with a net downwelling in the vertical plane, the remainder being due to dense waters returning at the same depth as that of the inflowing light waters within the horizontal gyre circulation.

Figure 2Meridional velocity and transport at 45∘ N (AMOCσ). (a) Top panel: the 1993–2017 mean longitude–depth velocity field (in m s−1) at 45∘ N. The σ1=32.15 isopycnal across which the maximum diapycnal flux occurs is shown in black. Bottom panel: the depth-integrated (0–2000 m) zonally cumulated transport (in Sv) at 45∘ N with labels as follows. LC (Labrador Current), DWBC (Deep Western Boundary Current), NAC (North Atlantic Current), and RECIRC (NAC recirculation). Shading indicates the ensemble standard error. (b) The mean AMOCσ stream function at 45∘ N (in Sv). Shading indicates the ensemble standard error. The dashed blue line at σ1=32.15 depicts the maximum transformation rate.
The surface-forced component of the AMOCσ (noted SFOCσ, see Eq. 4) shows a maximum time-mean value of 15.4±1.8 Sv at σ0=27.4 (or σ1≈32), which reflects a light-to-dense flux that primarily occurs along the NAC path in the eastern SPG south of Reykjanes Ridge and to a lesser extent along the western SPG boundary (Labrador Sea), along the Norwegian margins (Fig. 3). This pattern is consistent with recent mooring-based analysis of the diapycnal overturning in the SPG showing a relatively minor contribution of the Labrador Sea to the basin-wide maximum transformation rates (Lozier et al., 2019). This is because the density level of maximum transformation in the Labrador Sea is well below the density level of the basin-wide AMOCσ (or SFOCσ). The spatial distribution of the surface-forced diapycnal volume flux within the domain is inferred by evaluating SFOCσ at two additional key sections: the international Canada–Greenland–Scotland OSNAP and the Greenland–Iceland–Scotland (GIS) sills. The SFOC and SFOC stream functions respectively show a maximum transformation rate of 11.2±1.3 Sv at σ0=27.52 and 5.4±0.4 Sv at σ0=27.77, in good agreement with independent in situ calculations of the maximum overturning across the OSNAP line and overflow transport estimates at the GIS (Hansen and Østerhus, 2000; Li et al., 2017). Altogether, the three estimates of SFOCσ across 45∘ N, OSNAP, and GIS describe the expected decrease in intensity and increase in density of the maximum transformation rate as one progresses northward. We note that the density level of the maximum SFOCσ at 45∘ N is slightly lighter than the density level of the maximum AMOCσ at 45∘ N. This is because SFOCσ cannot account for the positive transformation rate due to the entrainment-driven mixing of the subpolar mode waters with the denser overflow waters in the vicinity of the GIS sills. However, the analysis of numerical simulations shows that such a mixing contribution does not largely affect interannual and decadal variability (Marsh et al., 2005), our primary purpose here.
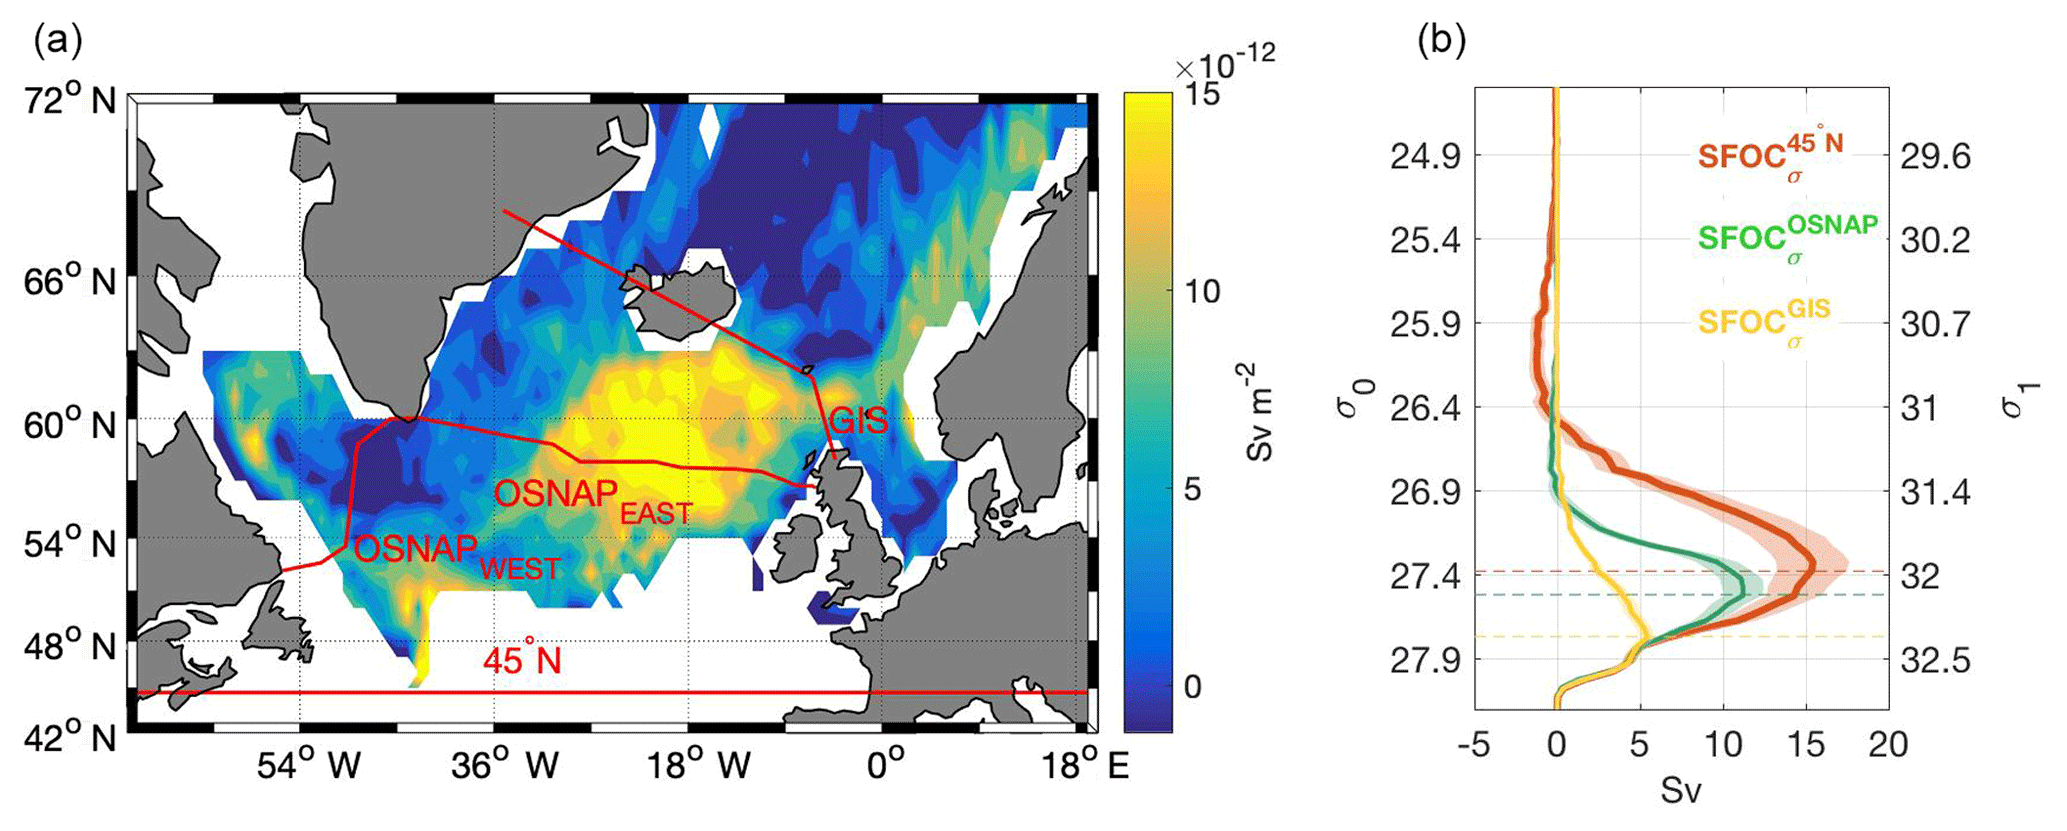
Figure 3The surface-forced transformation north of 45∘ N (SFOCσ). (a) The 1993–2017 time-mean transformation map across the isopycnal surface σ0=27.4 (in Sv m−2), across which the maximum transformation rate north of 45∘ N occurs. (b) The mean SFOCσ stream function (in Sv) at 45∘ N (red) at the OSNAP line (green) and at the GIS sills (yellow). See (a) for section locations. Shading indicates the ensemble standard error. The dashed lines depict the density levels of maximum surface-forced transformation rate north for each domain. As the computation was made using σ0, the corresponding surface σ1 values are shown on the right-hand side y axis. The surface integral of the diapycnal volume flux shown in (a) yields the maximum transformation rate through Sv.
3.2 The variability in AMOCσ and SFOCσ
The maximum AMOCσ time series, displayed as raw and 7-year low-pass-filtered annual anomalies in Fig. 4a (blue lines), shows an apparent 8-year period variability embedded in a linear decrease during 1993–2010 of Sv yr−1 and a subsequent intensification during 2010–2017 of 0.91±0.19 Sv yr−1. Those changes are largely advective (Fig. S4), indicating minor impact of volume (or σm) variability on the AMOC intensity. Volume redistribution associated with the formation history of intermediate water masses in the Labrador and Irminger seas can be important but they remain restricted to the lower limb of the AMOCσ (not shown). We note that the AMOCz shares a similar variability with AMOCσ but of weaker amplitude, indicating an important contribution of the horizontal circulation (versus vertical overturning) to the diapycnal volume flux variability at 45∘ N (Fig. S4). The gyre contribution to AMOCσ variability at 45∘ N is also inferred from an independent mooring-based observation of the (400 m bottom) DWBC intensity at 53∘ N (Zantopp et al., 2017). Although the shortness of the time series (10 years) only allows a suggestive independent validation, the DWBC variability is found to consistently lead the 2004–2010 weakening and the 2010–2014 intensification of the AMOCσ at 45∘ N by 3 years (Fig. S4).
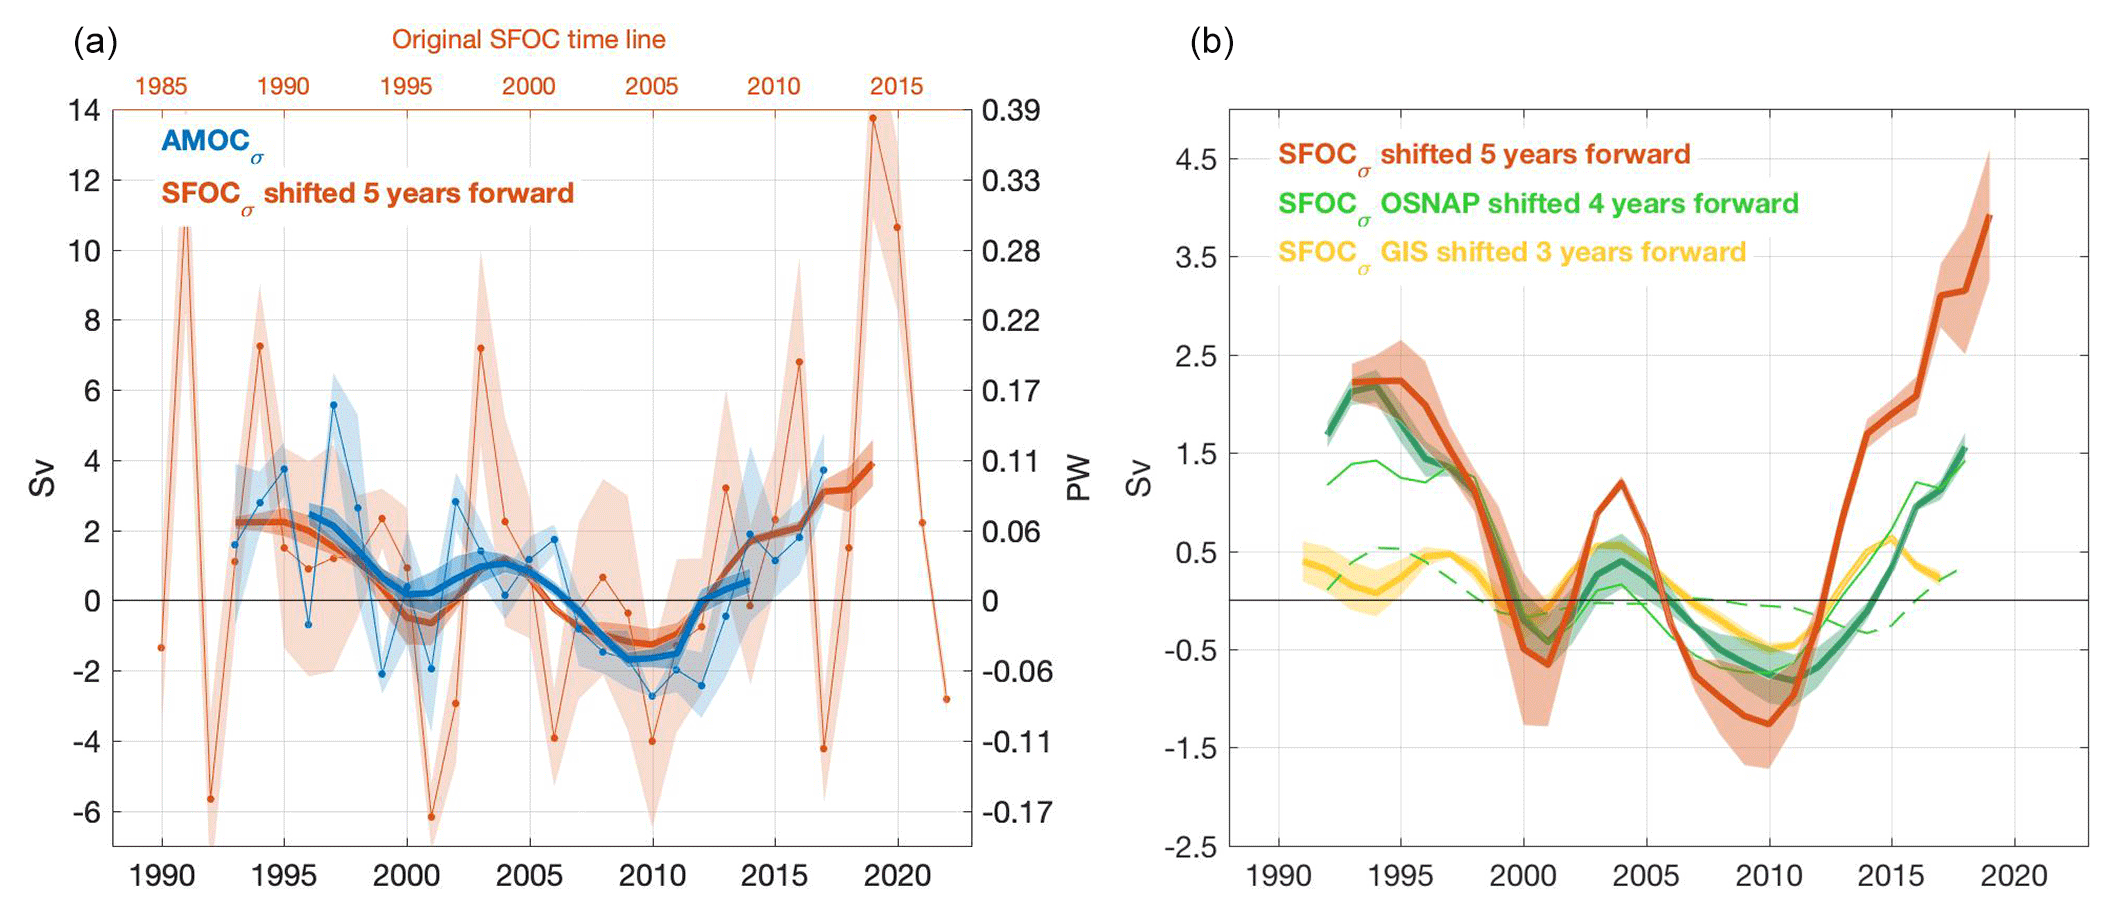
Figure 4The AMOCσ and SFOCσ time series. (a) Annual anomalies in the maximum AMOCσ (blue) and the maximum SFOCσ (red) at 45∘ N (in Sv), with the latter shifted 5 years forward (lag of maximum correlation). The reference (time-mean) period is 1996–2013. Thick lines show 7-year low-pass-filtered time series. The right-hand side axis displays the corresponding heat transport anomalies. The original time line for SFOCσ is given in the top x axis. (b) The 7-year low-pass-filtered time series of anomalies in the maximum SFOCσ at 45∘ N (red – shifted 5 years forward), the maximum SFOCσ at the OSNAP line (green – shifted 4 years forward) decomposed into contributions from the eastern (thin) and western (dashed) basins, and the maximum SFOCσ at the GIS sills (yellow – shifted 3 years forward). Shading indicates the ensemble standard errors for each variable.
The second independent validation of AMOCσ bears the mechanistic explanation of its variability. While the maximums of AMOCσ and SFOCσ hardly correlate at high frequency, a striking correspondence between their low-pass-filtered variability is found, with the largest correlation obtained when the former lags the latter by 5–6 years (0.94 at the 99 % confidence level), in line with typical advective timescales in the SPG (Bersch et al., 2007) (Fig. 4a – see also the Supplement for details on smoothing and correlation). Therefore, observational data confirm that surface-forced water mass transformation represents a dominant driver as well as an easily derived proxy of low-frequency AMOCσ changes across the southern exit of the SPG. Departure from an exact match between AMOCσ and SFOCσ relates to the influence of the remaining terms in the volume budget equation, namely diapycnal mixing and volume storage within the SPG interior. As shown in Fig. S5, the latter can be non-negligible on interannual timescale but exhibits minor decadal variability.
The 5-year time lag between AMOCσ and SFOCσ time series enables prediction of near-future AMOCσ variability. Here, the low-frequency strengthening of the meridional circulation observed since 2010 is found to continue at a similar rate until 2022, reaching extreme intensities in 2019 and 2020 similar to those observed in the early 1990s. Those extreme events reflect harsh atmospheric winter conditions in the SPG in 2014 and 2015 associated with large ocean-to-atmosphere heat transfer (Josey et al., 2018). As discussed in the next section, this most recent positive trend in AMOCσ intensity and its predicted persistence until the early 2020s may substantially increase OHC in the SPG in the coming years.
The decadal variability in the maximum SFOCσ at 45∘ N has minor contribution from the Nordic Seas and is effectively captured by SFOC, although the contribution from regions south of the OSNAP line appears important during its most recent intensification since 2010 (Fig. 4b). The variability in SFOCσ is dominated by changes in the rate of water mass transformation in the eastern SPG basins, in line with recent mooring-based estimates of the AMOCσ across the OSNAP line (Lozier et al., 2019). The successive 1-year lag between SFOCσ at 45∘ N, SFOCσ at OSNAP, and SFOCσ at GIS reflects the progressive northward spreading of transformation anomalies across surface of increasing density (see Fig. 3b).
3.3 The variability in OHC and its 5-year prediction
The lagged correlation between surface-forced water mass transformation and the overturning circulation has important ramifications for the monitoring of past, present, and future fluctuations of AMOCσ, but does not inform on its role in driving decadal OHC variability in the SPG. To infer such a role, the AMOCσ-driven meridional heat transport at 45∘ N – noted MHTσ hereafter – is computed from the maximum AMOCσ index (Fig. 4a) and the temperature difference between the upper and lower AMOCσ limbs at 45∘ N (see Sect. 2.2 and Eq. 2). The time-mean MHTσ at 45∘ N during 1993–2017 reaches 0.43±0.04 PW and is balanced by an ocean-to-atmosphere heat transfer of 0.21±0.04 PW, a small long-term change in OHC within the SPG domain of 0.014±0.002 PW, and a northward ocean heat transport across the GIS sills estimated as a residual as 0.20 PW (consistent with independent estimates; Curry et al., 2011; Hansen et al., 2015; Hansen and Østerhus, 2000).
The cumulated anomalies of MHTσ referenced to the time window 1996–2013 show a high correlation with the observed OHC within the 0–1000 m layer of the SPG (10–70∘ W, 45–65∘ N; Fig. 5). In particular, both the 1993–2006 warming and the 2006–2013 cooling of the region are explained well by the contribution of MHTσ variability at 45∘ N (r=0.87 at the 99 % confidence level for 1993–2013). This is consistent with previous model-based inferences that the AMOCσ is a primary driver of decadal temperature changes in the upper SPG (Desbruyères et al., 2015; Grist et al., 2010; Robson et al., 2016). This causal relationship is, however, not verified during 2013–2015, where MHTσ induces a warming of the SPG, whereas in situ observations indicate that OHC continued to decrease. This apparent discrepancy reflects the strong air–sea heat flux anomaly that drove a sharp cooling of the upper SPG during those years – the so-called “cold blob” (Duchez et al., 2016; Josey et al., 2018). From 2015, atmospheric conditions were back to “normal” and the MHTσ-driven warming of the SPG could begin.

Figure 5OHC time series. Detrended anomalies in OHC within the upper SPG (0–1000 m; 10–70∘ W, 45–65∘ N; black, in joules) and MHTσ-driven OHC anomalies north of 45∘ N (blue, in joules). Shading indicates the ensemble standard errors for each variable. The SFOCσ-driven OHC prediction for 2017–2022 is shown in red, with its associated error based on the historical predictive skills of SFOCσ (Eq. 6). The green patch indicates the “cold blob” era driven by extreme air–sea flux events (Josey et al., 2018).
We finally make use of the remarkable 5-year lead of SFOCσ on AMOCσ (Fig. 4a) to make a suggestive prediction of AMOCσ-driven OHC changes between 2017 and 2022. Annually averaged anomalies of SFOCσ are scaled by the actual interannual variance of AMOCσ and converted into an anomalous heat transport relative to 1996–2013 with associated OHC anomalies as previously shown. To make the prediction, we simply anchor the resulting 2017–2022 time series to the last observed OHC value of 2017 (red line, Fig. 5). An uncertainty is added to the prediction based on the skill of SFOCσ in predicting the historical 1993–2017 OHC (red shading in Fig. 5). This uncertainty is the prediction error ∈lag from the Nlag-year time series, with lag equal to 1 to 5 years:
Owing to the ongoing intensification of the AMOCσ and its presumed persistence until 2019 or 2020 (Fig. 4a), and under the (hypothesized) absence of extreme air–sea heat flux events in the near future, the present analysis predicts a rapid OHC surge of J between 2017 and 2021 (Fig. 5).
In this paper we have provided observationally based evidence of a tight causal relationship between low-frequency changes in the rate of surface-forced water mass transformation in the eastern SPG, the variability in the overturning circulation at 45∘ N, and ocean heat content trends in the SPG. The 5-year delay between surface property changes in the SPG and downstream circulation changes suggests good skills for short-term predictability in the region from the sole use of ocean surface and air–sea interface measurements. Here, a strong intensification of the overturning and associated heat transport from 2010 is found to persist until the early 2020s, driving a new significant reversal of climatic condition in the SPG as temperatures rapidly rise from their last minimum of 2017. The extreme winters of 2014 and 2015 appear as key drivers of those recent and upcoming changes in the SPG. They are found to be responsible for rapidly cooling the upper ocean while feeding a 5-year delayed intensification of the overturning through increased light-to-dense transformation, leading eventually to a sharp warming of the domain. We note that the series of oceanic events described herein, from surface-forced water mass transformation to meridional circulation and heat content changes, are only suggestively presented as a forced response to atmospheric variability. Understanding the extent to which they may belong to a more complex loop of coupled ocean–atmosphere interactions is beyond the scope of the present study. Finally, the present analysis confirms the suitability of the international mooring-based OSNAP array for capturing the bulk of interannual and decadal circulation changes driven by air–sea buoyancy exchanges in the whole subpolar area.
The EN4.2.0 dataset is available online at https://www.metoffice.gov.uk/hadobs/en4/download-en4-2-0.html and described in Good et al. (2013). The CORA dataset is available at https://doi.org/10.17882/46219 and described in Szekely et al. (2016). The ISHII dataset is available at https://climate.mri-jma.go.jp/pub/ocean/ts/ and described in Ishii et al. (2017). The ARMOR3D dataset is available at http://resources.marine.copernicus.eu/?option=com_csw&view= details&product_id=MULTIOBS_GLO_PHY_REP_015_002 and described in Guinehut et al. (2012). NCEP_Reanalysis 2 data are provided by the NOAA/OAR/ESRL PSD, Boulder, Colorado, USA, from their web site at http://www.esrl.noaa.gov/psd/ and are described in Kanamitsu et al. (2002). ERA-I data are available online at https://apps.ecmwf.int/datasets/data/interim-full-daily/levtype=sfc/. The CERES/FMASS product is available at https://doi.org/10.17864/1947.111 and described in Liu et al. (2017).
The supplement related to this article is available online at: https://doi.org/10.5194/os-15-809-2019-supplement.
DGD carried out the data analysis. All authors contributed to the interpretation, description, and presentation of the results
The authors declare that they have no conflict of interest.
Damien G. Desbruyères and Guillaume Maze were supported by Ifremer. Herlé Mercier was supported by CNRS. Nathalie Daniault was supported by the University of Brest. This work was supported by the French national programme LEFE/INSU: OBLADY and SOMOVAR, led by Damien G. Desbruyères and Guillaume Maze, respectively. All datasets used herein are available online (see the Supplement for references).
This paper was edited by David Stevens and reviewed by two anonymous referees.
Bersch, M., Yashayaev, I., and Koltermann, K. P.: Recent changes of the thermohaline circulation in the subpolar North Atlantic, Ocean Dynam., 57, 223–235, https://doi.org/10.1007/s10236-007-0104-7, 2007.
Bower, A. S., Lozier, M. S., Gary, S. F., and Böning, C. W.: Interior pathways of the North Atlantic meridional overturning circulation, Nature, 459, 243–247, https://doi.org/10.1038/nature07979, 2009.
Brambilla, E., Talley, L. D., and Robbins, P. E.: Subpolar mode water in the northeastern Atlantic: 2. Origin and transformation, J. Geophys. Res.-Oceans, 113, 1–16, https://doi.org/10.1029/2006JC004063, 2008.
Bryden, H. L., King, B. A., McCarthy, G. D., and McDonagh, E. L.: Impact of a 30 % reduction in Atlantic meridional overturning during 2009–2010, Ocean Sci., 10, 683–691, https://doi.org/10.5194/os-10-683-2014, 2014.
Buckley, M. W. and Marshall, J.: Observations, inferences, and mechanisms of the Atlantic Meridional Overturning Circulation: A review, Rev. Geophys., 54, 5–63, https://doi.org/10.1002/2015RG000493, 2016.
Curry, B., Lee, C. M., and Petrie, B.: Volume, Freshwater, and Heat Fluxes through Davis Strait, 2004–05*, J. Phys. Oceanogr., 41, 429–436, https://doi.org/10.1175/2010JPO4536.1, 2011.
Desbruyères, D., Mercier, H., and Thierry, V.: On the mechanisms behind decadal heat content changes in the eastern subpolar gyre, Prog. Oceanogr., 132, 262–272, https://doi.org/10.1016/j.pocean.2014.02.005, 2015.
Duchez, A., Frajka-Williams, E., Josey, S. A., Evans, D. G., Grist, J. P., Marsh, R., McCarthy, G. D., Sinha, B., Berry, D. I., and Hirschi, J. J.-M.: Drivers of exceptionally cold North Atlantic Ocean temperatures and their link to the 2015 European heat wave, Environ. Res. Lett., 11, 074004, https://doi.org/10.1088/1748-9326/11/7/074004, 2016.
Good, S. A., Martin, M. J., and Rayner, N. A.: EN4: quality controlled ocean temperature and salinity profiles and monthly objective analyses with uncertainty estimates, J. Geophys. Res.-Oceans, 118, 6704–6716, https://doi.org/10.1002/2013JC009067, 2013.
Gourcuff, C., Lherminier, P., Mercier, H., and Le Traon, P. Y.: Altimetry combined with hydrography for ocean transport estimation, J. Atmos. Ocean. Tech., 28, 1324–1337, https://doi.org/10.1175/2011JTECHO818.1, 2011.
Grist, J. P., Marsh, R., and Josey, S. A.: On the Relationship between the North Atlantic Meridional Overturning Circulation and the Surface-Forced Overturning Streamfunction, J. Climate, 22, 4989–5002, https://doi.org/10.1175/2009JCLI2574.1, 2009.
Grist, J. P., Josey, S. A., Marsh, R., Good, S. A., Coward, A. C., De Cuevas, B. A., Alderson, S. G., New, A. L., and Madec, G.: The roles of surface heat flux and ocean heat transport convergence in determining Atlantic Ocean temperature variability, Ocean Dynam., 60, 771–790, https://doi.org/10.1007/s10236-010-0292-4, 2010.
Grist, J. P., Josey, S. A., Marsh, R., Kwon, Y. O., Bingham, R. J., and Blaker, A. T.: The surface-forced overturning of the North Atlantic: Estimates from modern era atmospheric reanalysis datasets, J. Climate, 27, 3596–3618, https://doi.org/10.1175/JCLI-D-13-00070.1, 2014.
Guinehut, S., Dhomps, A.-L., Larnicol, G., and Le Traon, P.-Y.: High resolution 3-D temperature and salinity fields derived from in situ and satellite observations, Ocean Sci., 8, 845–857, https://doi.org/10.5194/os-8-845-2012, 2012.
Hansen, B. and Østerhus, S.: North Atlantic-Nordic Seas exchanges, Prog. Oceanogr., 45, 109–208, https://doi.org/10.1016/S0079-6611(99)00052-X, 2000.
Hansen, B., Larsen, K. M. H., Hátún, H., Kristiansen, R., Mortensen, E., and Østerhus, S.: Transport of volume, heat, and salt towards the Arctic in the Faroe Current 1993–2013, Ocean Sci., 11, 743–757, https://doi.org/10.5194/os-11-743-2015, 2015.
Ishii, M., Fukuda, Y., Hirahara, H., Yasui, S., Suzuki, T., and Sato, K.: Accuracy of Global Upper Ocean Heat Content Estimation Expected from Present Observational Data Sets, SOLA, 13, 163–167, https://doi.org/10.2151/sola.2017?030, 2017.
Josey, S. A., Hirschi, J. J.-M., Sinha, B., Duchez, A., Grist, J. P., and Marsh, R.: The Recent Atlantic Cold Anomaly: Causes, Consequences, and Related Phenomena, Annu. Rev. Mar. Sci., 10, 475–501, https://doi.org/10.1146/annurev-marine-121916-063102, 2018.
Kanamitsu, M., Ebisuzaki, W., Woollen, J., Yang, S.-K., Hnilo, J. J., Fiorino, M., and Potter, G. L.: NCEP-DOE AMIP-II Reanalysis (R-2), B. Am. Meteorol. Soc., 83, 1631–1643, 2002.
Krauss, W.: The North Atlantic Current, J. Geophys. Res., 91, 5061–5074, https://doi.org/10.1029/JC091iC04p05061, 1986.
Lherminier, P., Mercier, H., Huck, T., Gourcuff, C., Perez, F. F., Morin, P., Sarafanov, A., and Falina, A.: The Atlantic Meridional Overturning Circulation and the subpolar gyre observed at the A25-OVIDE section in June 2002 and 2004, Deep-Sea Res. Pt. I, 57, 1374–1391, https://doi.org/10.1016/j.dsr.2010.07.009, 2010.
Li, F., Lozier, M. S., and Johns, W. E.: Calculating the meridional volume, heat, and freshwater transports from an observing system in the subpolar North Atlantic: Observing system simulation experiment, J. Atmos. Ocean. Tech., 34, 1483–1500, https://doi.org/10.1175/JTECH-D-16-0247.1, 2017.
Liu, C. and Allan, R.: Reconstructions of the radiation fluxes at top of atmosphere and net surface energy flux in the period 1985–2015 from DEEP-C project, University of Reading, Dataset, https://doi.org/10.17864/1947.111, 2017.
Lozier, M. S., Bacon, S., Bower, A. S., Cunningham, S. A., De Jong, M. F., De Steur, L., De Young, B., Fischer, J., Gary, S. F., Greenan, B. J. W., Heimbmbach, P., Holliday, N. P., Houpert, L., Inall, M. E., Johns, W. E., Johnson, H. L., Karstensen, J., Li, F., Lin, X., Mackay, N., Marshall, D. P., Mercier, H., Myers, P. G., Pickart, R. S., Pillar, H. R., Straneo, F., Thierry, V., Weller, R. A., Williams, R. G., Wilson, C., Yang, J., Zhao, J., and Zika, J. D.: Overturning in the Subpolar north Atlantic program: A new international ocean observing system, B. Am. Meteorol. Soc., 98, 737–752, https://doi.org/10.1175/BAMS-D-16-0057.1, 2017.
Lozier, M. S., Li, F., Bacon, S., Bahr, F., Bower, A. S., Cunningham, S. A., de Jong, M. F., de Steur, L., deYoung, B., Fischer, J., Gary, S. F., Greenan, B. J. W., Holliday, N. P., Houk, A., Houpert, L., Inall, M. E., Johns, W. E., Johnson, H. L., Johnson, C., Karstensen, J., Koman, G., Le Bras, I. A., Lin, X., Mackay, N., Marshall, D. P., Mercier, H., Oltmanns, M., Pickart, R. S., Ramsey, A. L., Rayner, D., Straneo, F., Thierry, V., Torres, D. J., Williams, R. G., Wilson, C., Yang, J., Yashayaev, I., and Zhao, J.: A sea change in our view of overturning in the subpolar North Atlantic, Science, 363, 516–521, https://doi.org/10.1126/science.aau6592, 2019.
Marsh, R.: Recent variability of the North Atlantic thermohaline circulation inferred from surface heat and freshwater fluxes, J. Climate, 13, 3239–3260, https://doi.org/10.1175/1520-0442(2000)013<3239:RVOTNA>2.0.CO;2, 2000.
Marsh, R., Josey, S. A., de Nurser, A. J. G., Cuevas, B. A., and Coward, A. C.: Water mass transformation in the North Atlantic over 1985–2002 simulated in an eddy-permitting model, Ocean Sci., 1, 127–144, https://doi.org/10.5194/os-1-127-2005, 2005.
Maze, G., Forget, G., Buckley, M., Marshall, J., and Cerovecki, I.: Using Transformation and Formation Maps to Study the Role of Air–Sea Heat Fluxes in North Atlantic Eighteen Degree Water Formation, J. Phys. Oceanogr., 39, 1818–1835, https://doi.org/10.1175/2009JPO3985.1, 2009.
Mercier, H., Lherminier, P., Sarafanov, A., Gaillard, F., Daniault, N., Desbruyères, D., Falina, A., Ferron, B., Gourcuff, C., Huck, T., and Thierry, V.: Variability of the meridional overturning circulation at the Greenland-Portugal OVIDE section from 1993 to 2010, Prog. Oceanogr., 132, 250–261, https://doi.org/10.1016/j.pocean.2013.11.001, 2015.
Mertens, C., Rhein, M., Walter, M., Böning, Claus, W., Behrens, E., Kieke, D., Steinfeldt, R., and Stöber, U.: Circulation and transports in the Newfoundland Basin, western subpolar North Atlantic, J. Geophys. Res.-Oceans, 119, 7772–7793, https://doi.org/10.1002/2014JC010019, 2014.
Pickart, R. S. and Spall, M. A.: Impact of Labrador Sea Convection on the North Atlantic Meridional Overturning Circulation, J. Phys. Oceanogr., 37, 2207–2227, https://doi.org/10.1175/JPO3178.1, 2007.
Piecuch, C. G., Ponte, R. M., Little, C. M., Buckley, M. W., and Fukumori, I.: Mechanisms underlying recent decadal changes in subpolar North Atlantic Ocean heat content, J. Geophys. Res.-Oceans, 122, 7181–7197, https://doi.org/10.1002/2017JC012845, 2017.
Riser, S. C., Freeland, H. J., Roemmich, D., Wijffels, S., Troisi, A., Belbéoch, M., Gilbert, D., Xu, J., Pouliquen, S., Thresher, A., Le Traon, P. Y., Maze, G., Klein, B., Ravichandran, M., Grant, F., Poulain, P. M., Suga, T., Lim, B., Sterl, A., Sutton, P., Mork, K. A., Vélez-Belchí, P. J., Ansorge, I., King, B., Turton, J., Baringer, M., and Jayne, S. R.: Fifteen years of ocean observations with the global Argo array, Nat. Clim. Change, 6, 145–153, https://doi.org/10.1038/nclimate2872, 2016.
Robson, J., Ortega, P., and Sutton, R.: A reversal of climatic trends in the North Atlantic since 2005, Nat. Geosci., 9, 513–517, https://doi.org/10.1038/ngeo2727, 2016.
Robson, J., Polo, I., Hodson, D. L. R., Stevens, D. P., and Shaffrey, L. C.: Decadal prediction of the North Atlantic subpolar gyre in the HiGEM high-resolution climate model, Clim. Dynam., 50, 1–17, https://doi.org/10.1007/s00382-017-3649-2, 2017.
Sarafanov, A., Falina, A., Mercier, H., Sokov, A., Lherminier, P., Gourcuff, C., Gladyshev, S., Gaillard, F., and Daniault, N.: Mean full-depth summer circulation and transports at the northern periphery of the Atlantic Ocean in the 2000s, J. Geophys. Res.-Oceans, 117, 1–22, https://doi.org/10.1029/2011JC007572, 2012.
Szekely, T., Gourrion, J., Pouliquen, S., and Gilles, R.: CORA, Coriolis Ocean Dataset for Reanalysis, SEANOE, https://doi.org/10.17882/46219, 2016.
Toole, J. M., Andres, M., Le Bras, I. A., Joyce, T. M., and McCartney, M. S.: Moored observations of the Deep Western Boundary Current in the NW Atlantic: 2004–2014, J. Geophys. Res.-Oceans, 122, 7488–7505, https://doi.org/10.1002/2017JC012984, 2017.
Walin, G.: On the relation between sea-surface heat flow and thermal circulation in the ocean, Tellus, 34, 187–195, https://doi.org/10.3402/tellusa.v34i2.10801, 1982.
Wunsch, C.: What is the thermohaline circulation?, Science, 298, 1179–1181, https://doi.org/10.1126/science.1079329, 2002.
Yashayaev, I. and Loder, J. W.: Further intensification of deep convection in the Labrador Sea in 2016, Geophys. Res. Lett., 44, 1429–1438, https://doi.org/10.1002/2016GL071668, 2017.
Zantopp, R., Fischer, J., Visbeck, M., and Karstensen, J.: From interannual to decadal: 17 years of boundary current transports at the exit of the Labrador Sea, J. Geophys. Res.-Oceans, 122, 1724–1748, https://doi.org/10.1002/2016JC012271, 2017.
This is due to the fact that the main source of recent in situ data is the Argo array of profiling floats (Riser et al., 2016), providing quality-controlled temperature and salinity data for the upper 2000 m only.