the Creative Commons Attribution 4.0 License.
the Creative Commons Attribution 4.0 License.
 | 24 Mar 2026
Marine heatwaves variability and trends in the Patagonian Shelf
Ana L. Delgado
Vincent Combes
Gotzon Basterretxea
Marine heatwaves (MHWs), have doubled in frequency globally in recent decades and are becoming longer, more intense, and increasingly disruptive to marine ecosystems. However, despite their growing ecological and biogeochemical importance, major productive coastal systems remain understudied, particularly in the Southern Hemisphere. Here, we provide the first comprehensive characterization of MHWs across the Patagonian Shelf (PS), one of the most biologically productive marine regions on Earth, using 40 years of satellite-derived daily sea surface temperature (SST) data. We first assess how the choice of MHW detection method (fixed versus moving climatology) and SST-dataset selection affect MHW metrics. Then we quantify MHW frequency, intensity, duration, and long-term trends, revealing that the PS experiences on average 1.9 ± 2 MHWs yr−1 with a mean cumulative duration of 23–28 d yr−1 and an average intensity of 1.36 ± 0.3 °C. We show that MHW activity varies substantially across the region, with the northern sector and the outer shelf experiencing the most frequent and intense events (>2 events yr−1 and >2 °C). A notable increase in MHW days (+5–10 d per decade) is observed in the northern PS, whereas no significant trends are observed to the south (i.e., south of 48° S). These trends are consistent with background warming of the ocean in this region, suggesting a mechanistic link, whereby long-term warming enhances the likelihood of MHWs occurrence and duration. We further demonstrate that a component of MHW variability can be attributed to the El Niño Southern Oscillation, which exerts a stronger influence on the intensity of thermal anomalies than on the cumulative duration of the events. Together, these findings constitute the first comprehensive assessment of MHWs on the PS and provide essential insight for anticipating their ecological and climatic impacts in one of the Southern Hemisphere's key marine ecosystems.
- Article
(13180 KB) - Full-text XML
- BibTeX
- EndNote


Marine heatwaves (MHWs) are defined as prolonged periods during which sea surface temperatures (SSTs) exceed certain thresholds derived from the statistical properties of the local climatological SST distribution (Hobday et al., 2016). Their impacts are extensive, influencing both physical and biological processes in the ocean, and they are increasingly recognized as key drivers of ecosystem change in the context of the contemporary climate regime (Smale et al., 2019; Suryan et al., 2021). The physical consequences of their presence have been linked to enhanced water column stratification, reduced dissolved oxygen levels, and hindered sea ice formation (e.g., Brauko et al., 2020; Hu et al., 2020; Carvalho et al., 2021). Ecologically, they are associated with pronounced disruptions to ecosystems, including shifts in phytoplankton community structure, coral bleaching, altered migration patterns, and mass mortality events affecting a wide range of marine taxa, from invertebrates to mammals (Cavole et al., 2016; Genevier et al., 2019; Manta et al., 2018; Smale et al., 2019; Rigual-Hernández et al., 2025). MHWs can induce distinct phytoplankton responses across the water column, including intensified, weakened, and subsurface-reversed chlorophyll a anomalies with clear latitudinal patterns driven by changes in light availability, temperature, and nutrient supply, often enhancing deep chlorophyll maxima and reshaping subsurface chlorophyll distributions (Ma and Chen, 2025). The ecological impacts are often more pronounced in coastal and benthic habitats, where organisms have limited capacity to escape the altered thermal conditions. Beyond local ecological effects, MHWs can also trigger broader systemic consequences, such as declines in fisheries, alterations in atmospheric circulation, and disturbances in air-sea carbon fluxes (e.g., Oliver et al., 2017; Cheung and Frölicher, 2020; Mignot et al., 2022).
Over the past century, both the frequency and duration of MHWs have increased globally, with the total annual number of MHW days rising by more than 50 %, largely as a consequence of persistent upper-ocean warming driven by anthropogenic climate change (Oliver et al., 2018, 2021, Oliver, 2019). However, quantification of MHW and their long-term trends present many uncertainties due to methodological differences. Indeed, the definition of MHWs is still debated, complicating research efforts and communication among scientists, policymakers, and the public (Smith et al., 2025). Most studies have traditionally relied on the definition established by Hobday et al. (2016, 2018), which is based on a fixed climatological temperature threshold. However, applying a fixed baseline in a warming ocean can blur the distinction between transient anomalies and long-term trends, potentially leading to misinterpretation of MHW impacts (Smith et al., 2025). In response, recent literature has proposed alternative approaches, including shifting baselines, moving climatologies, and hybrid methods, designed to better align with specific applications, research objectives, or regional oceanographic conditions (Chiswell, 2022; Sen Gupta et al., 2023; Amaya et al., 2023; Giménez et al., 2024). Likewise, the selection of source temperature datasets represents another potential source of bias, influencing the magnitude and spatial expression of derived MHW metrics. The influence of these methodological choices is region-dependent, tending to be most pronounced in areas experiencing strong long-term SST variability or rapid warming, where they can substantially affect MHW statistics.
Despite these biases, climate model projections robustly indicate that the frequency, duration, and intensity of MHWs will continue to increase markedly under future warming scenarios. By the end of the 21st century, the total number of MHW days is expected to rise by an order of magnitude, with especially pronounced increases in coastal regions (Frölicher et al., 2018; IPCC, 2021). However, anthropogenic forcing is not the sole driver of MHW variability. Internal modes of climate variability, including the El Niño-Southern Oscillation (ENSO) and Madden–Julian Oscillation (MJO), together with regional climate processes, also exert a strong influence on the timing, spatial distribution, and severity of MHWs, while modulating their variability across interannual, seasonal and intraseasonal timescales (Heidemann and Ribbe, 2019; Liu et al., 2022; Gregory et al., 2024; Chen et al., 2025).
Due to climate change, the Southwestern Atlantic Ocean (SWA) is undergoing significant transformations, including the gradual warming of surface waters (Hobday and Pecl, 2014), shifts in wind forcing (Leyba et al., 2019), the poleward migration of western boundary currents (Artana et al., 2019), and an increase in the frequency and intensity of climate-driven variability events such as the El Niño–Southern Oscillation (ENSO), the Southern Annular Mode, droughts, and MHWs (e.g., Cai et al., 2020; Risaro et al., 2022). Recent research by Artana et al. (2024) demonstrates a clear relationship between key MHW metrics, particularly intensity and duration, and ENSO phases in the SWA. Their results indicate that MHWs in the tropical SWA tend to intensify during El Niño events, while those in the subtropical sector are more closely associated with La Niña conditions, with the strength and phase of ENSO modulating both the magnitude and persistence of the events.
Within the SWA, the Patagonian shelf (PS), stretching from the southern tip of South America (∼55° S) to the Brazil/Malvinas Confluence (∼38° S), covers less than 2 % of the Southern Ocean's surface but ranks among its most biologically productive regions and largest carbon sinks (e.g., García et al., 2008; Lutz et al., 2010; Bianchi et al., 2005; Bianchi et al., 2009; Kahl et al., 2017; Fig. 1). Intense seasonal phytoplankton blooms make the PS a globally significant refuge and feeding ground for numerous fish species (FAO, 2020). However, phytoplankton biomass in this region is already exhibiting changes linked to climate-driven stressors, including rising sea surface temperatures and the shoaling of the mixed layer depth (Delgado et al., 2023). Despite its central role in climate regulation through carbon fixation and its importance as the foundation of major fisheries, a comprehensive characterization of MHWs across the Patagonian Continental Shelf is still lacking. Understanding MHW behaviour in the PS is particularly important because complex interactions between large-scale climate modes and local oceanographic processes shape the region's response to climate forcing and can trigger substantial disruptions to ecosystem structure and function, with far-reaching environmental and socioeconomic implications.
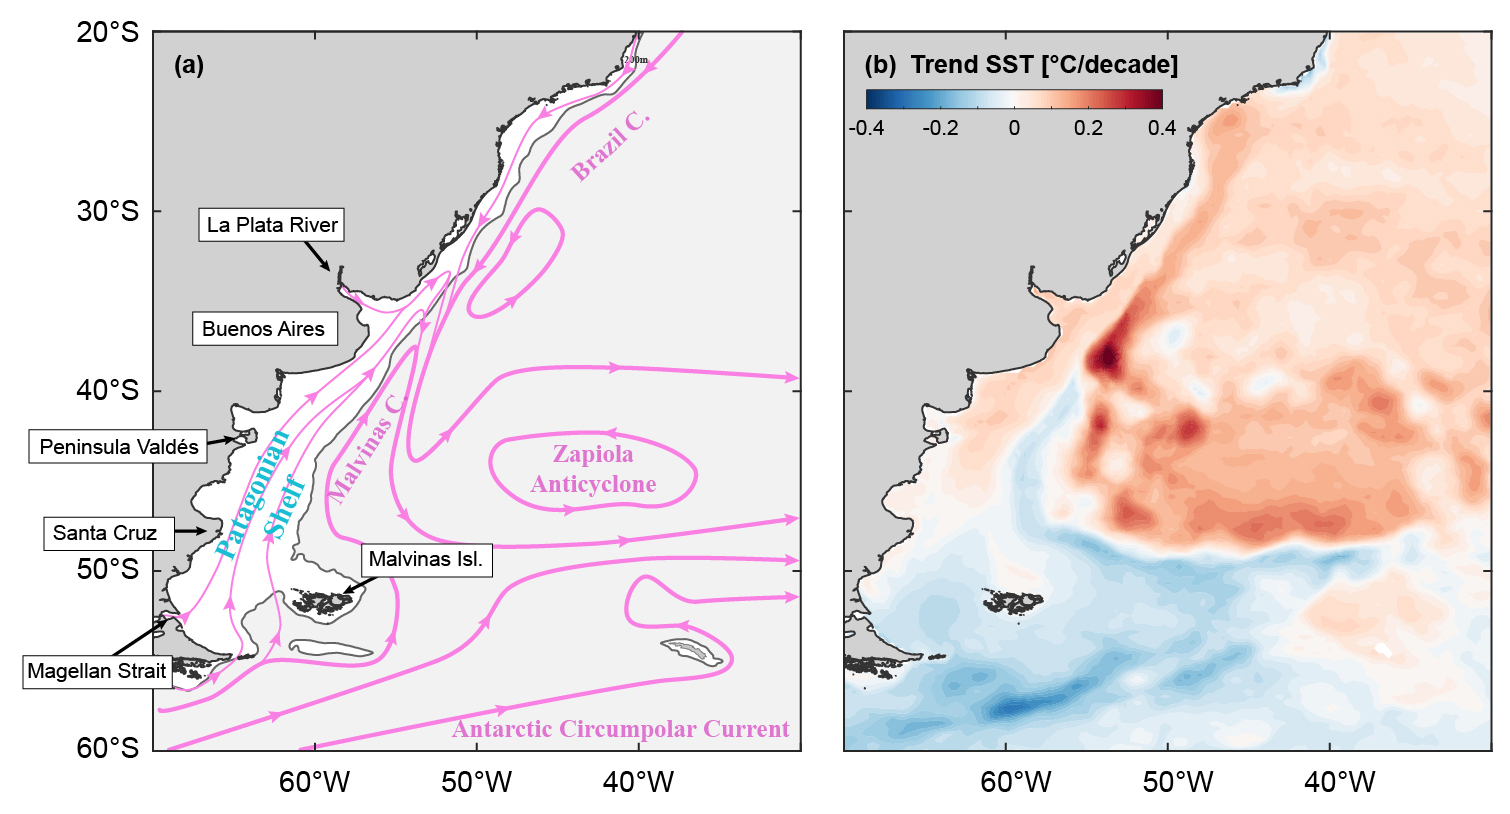
Figure 1(a) General circulation patterns and oceanographic characteristics of the Southwestern Atlantic Ocean (SWA). The grey line, corresponding to the 200 m isobath, delimits the Patagonian Shelf (PS). (b) SST trend (°C per decade) in the region for the period 1980 to 2021.
Here, we analyse the main features of MHWs in the PS. We first compare two methodologies and four satellite-derived sea surface temperature datasets for detecting MHWs to evaluate their consistency in representing these events in the PS. We then provide a regional characterization of MHWs, examining their mean and seasonal distribution, long-term trends, and interannual variability, with particular attention to their relationship with ENSO events. Together, these analyses provide both a methodological framework and an empirical foundation for future research on the ecological and climatic impacts of MHWs in the region.
2.1 Regional setting
The PS, on the western boundary of the SWA, constitutes an elongated (36–55° S) and relatively shallow plateau with a variable width (Fig. 1a). For most of its extent, the bathymetry is characterized by regularly spaced isobaths parallel to the coast and scarce relief features, indicating a flat seabed with no major topographic features (Glorioso, 1987; Parker et al., 1997). The shelf is narrower in the northern sector (∼200 km) and widens to between 400 and 600 km. The increased shelf width enhances tidal resonance, particularly South of 40° S and towards the coast (Barclay et al., 2023; Dinapoli and Simionato, 2024), resulting in some of the world's highest tidal amplitudes and driving strong tidal currents that vigorously mix the coastal water column (Kantha et al., 1995; Piola and Rivas, 1997).
Regional oceanography in open waters is characterized by significant mesoscale activity driven by the interaction of two sharply contrasting western boundary currents: the Brazil Current (BC) and the Malvinas Current (MC, Matano and Philander, 1993; Olson et al., 1988). These currents converge near 38° S, forming the highly dynamic Brazil/Malvinas Confluence (BMC), a region characterized by the persistent generation of warm and cold core eddies and filaments (Gordon and Greengrove, 1986; Gordon, 1989). The MC, originating from the Antarctic Circumpolar Current (ACC), flows northward along the shelf-break carrying cold, fresh waters, while the BC transports warm, salty waters southward (Matano and Philander, 1993).
Within the PS, Sub-Antarctic cold waters enter through the southern boundary and mix with freshwaters inputs from the Magellan Strait and several rivers (Dai and Trenberth, 2002). The fresh water sources of the shelf are the small continental discharge and the low-salinity water outflowing from the Magellan Strait. Strong westerly and northwesterly winds (Trenberth, 1991) and cross-shore pressure gradients induced over the outer shelf by the Malvinas Current force a northeasterly current at the shelf known as the Patagonian Current (Rivas, 1997; Palma et al., 2004; Matano et al., 2010).
Interactions between topography, atmospheric circulation, and proximity to the oceans introduce large complexities in the spatial patterns of atmospheric temperature in this region. The Andean Mountain range blocks atmospheric circulation acting as a formidable barrier to the atmospheric temperature patterns by reducing the passage of air masses (e.g., Falvey and Garreaud, 2007; Barrett et al., 2009; Viale et al., 2013). Therefore, the spatial pattern of atmospheric temperature in the region is mainly determined by the north–south latitudinal gradient and the elevation (Villalba et al., 2003). Since the Andean range dramatically varies in altitude north of 35° S (i.e, from 3000 to over 6000 m) the boundary between the air masses of the Pacific and those of the Atlantic roughly follows an oblique NW–SE line stretching from 35° S on the mountains to 41° S on the Atlantic coast. Southward of this boundary, westerlies become dominant all year-round (Coronato, 2020).
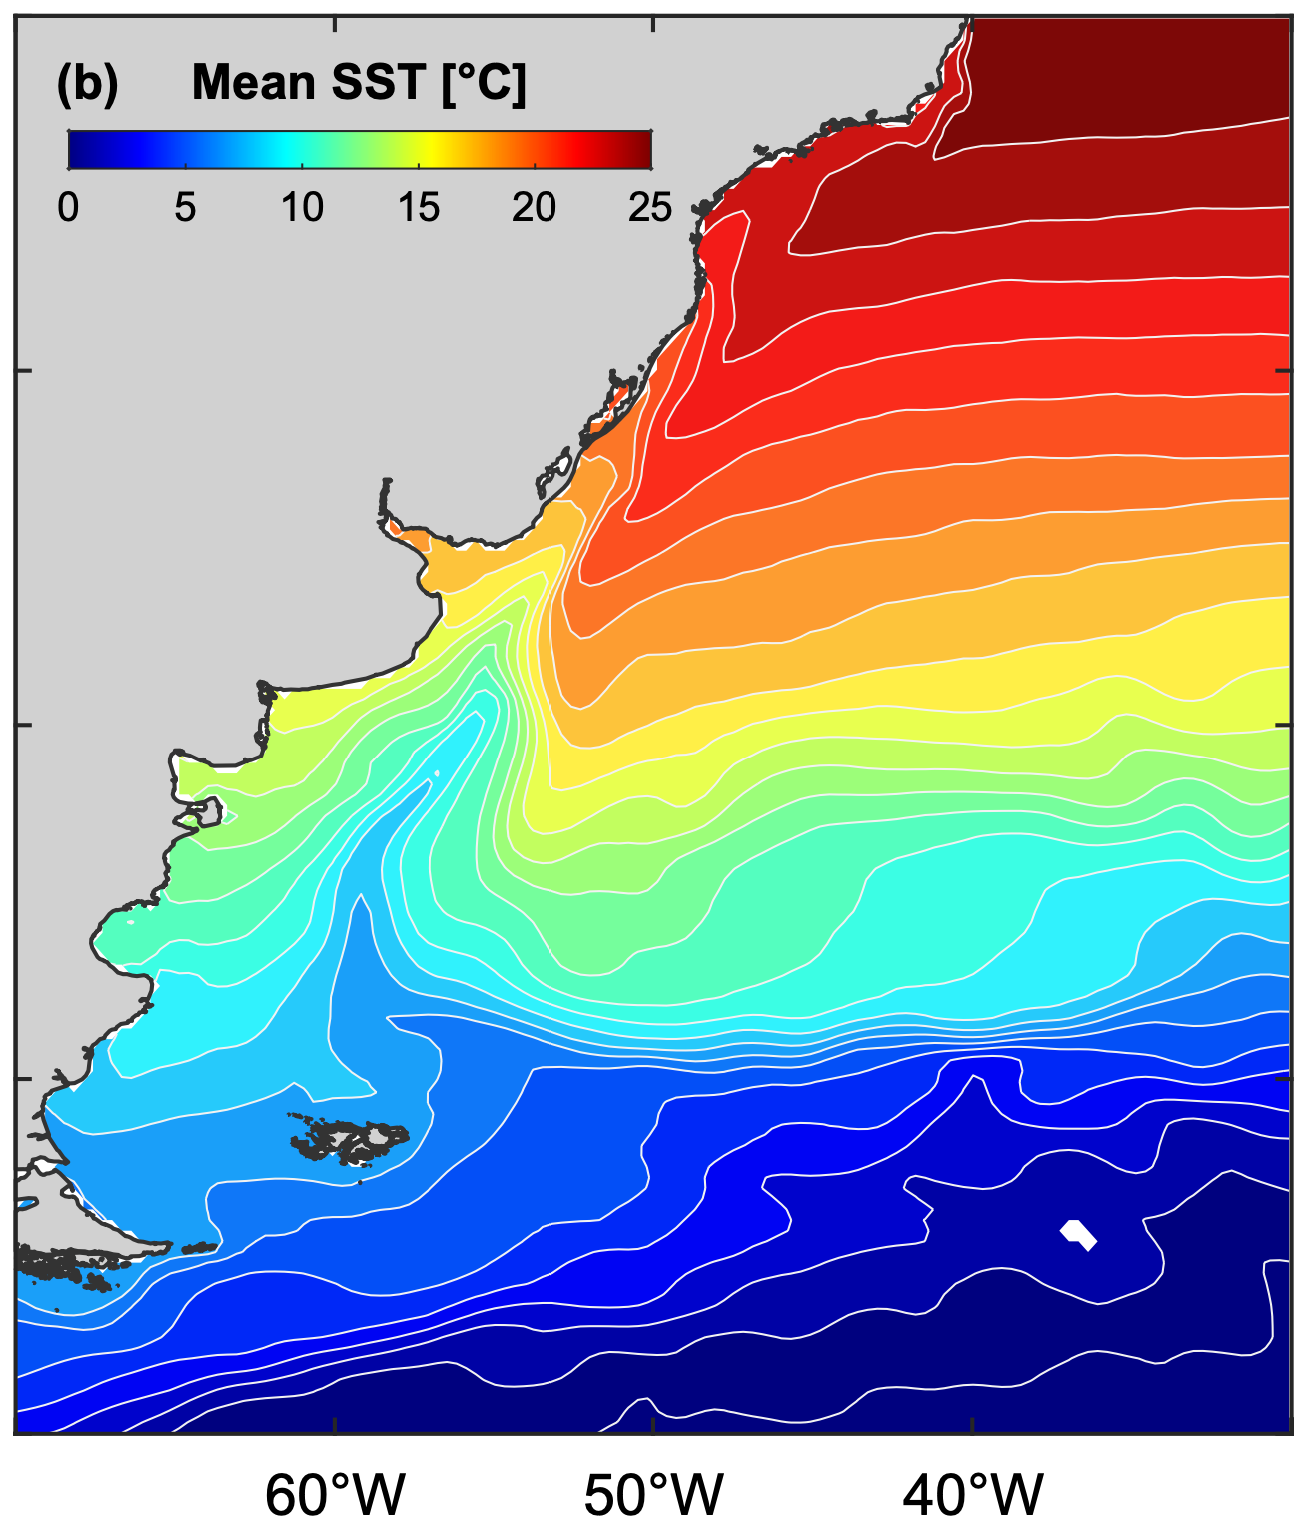
As a consequence of these atmospheric and latitudinal differences, mean SSTs along the shelf present clear meridional variation, ranging from 17 °C in the Río de la Plata mouth to 6 °C at the latitude of the Magellan Strait (Fig. A1). Owing to the combined influence of large-scale circulation patterns and climate-driven changes acting upon them, the SWA shows distinct and contrasting SST trend regimes (Fig. 1b). North of 48–50° S, at the Brazil/Malvinas Confluence, the surface ocean is warming at a rate of 0.4 °C per decade as a result of the poleward migration of the BMC (Artana et al., 2019; Franco et al., 2020). Farther south, surface temperatures show a slight cooling trend of approximately −0.1 °C per decade (Delgado et al., 2023), which has been linked to the positive trend in westerly winds at these latitudes (Saraceno et al., 2022).
2.2 SST datasets
We base our analysis on satellite-derived SST data provided by the European Space Agency's Climate Change Initiative Program (ESACCI), which is dedicated to extending, stabilizing, and enhancing the accuracy of climate data records for SST. The 40 year climate database provides daily SST at 0.05° resolution, from 1982 to 2021, obtained from twenty infrared and two microwave radiometers (Embury et al., 2024). This database was selected for its stability, designed specifically for climatological studies (i.e., de Boisséson and Balmaseda, 2024; Konsta et al., 2025). However, to assess the influence of database selection on the characterization of MHWs, we conducted a comparative analysis of ESACCI against three alternative data sources: OSTIA-SST, NOAA-SST, and ERA-SST.
-
OSTIA-SST is the Operational Sea Surface Temperature and Ice Analysis dataset, produced by the UK Met Office and distributed by IFREMER/PU. It combines satellite observations from the GHRSST project with in situ measurements to generate a high-resolution (°, ∼6 km) daily global SST analysis available from 1981 onward (Good et al., 2020).
-
NOAA-SST dataset corresponds to the daily Optimum Interpolation Sea Surface Temperature product (OISST V2.1) provided by the National Oceanic and Atmospheric Administration. This dataset offers a globally gridded, gap-filled field of sea surface temperature, derived primarily from remotely sensed observations acquired by the Advanced Very High-Resolution Radiometer (AVHRR). It features a spatial resolution of 0.25° and extends from 1981 to the present (Huang et al., 2021).
-
ERA5-SST refers to the fifth-generation reanalysis of SST by ECMWF, based on in-situ data assimilation, providing a comprehensive record from 1940 onward at 0.25° spatial resolution (Hersbach et al., 2023).
2.3 MHW detection methodologies
The standard approach among marine scientists follows the definition by Hobday et al. (2016): days with temperatures warmer than the 90th percentile based on a daily climatology baseline are considered MHW days, and only prolonged events lasting at least 5 consecutive days are retained, allowing for interruptions of up to two days. In this study, we initially adopt a Fixed Baseline (FB) method, consistent with Hobday et al. (2016), using a daily climatology derived from the 1982–2021 period (40 years) to estimate key MHW metrics such as event frequency, total MHW days, and intensity. However, the influence of ongoing ocean warming trends on MHWs detection has sparked a debate on the optimal criteria for defining the baseline reference thresholds. If long-term temperature trends are not accounted for, MHW occurrence and duration may be overestimated (Oliver, 2019). The current discussion centers on whether a fixed or a moving baseline offers differing perspectives on MHW statistics (Oliver, 2019). However, while these approaches often yield different results, the choice of method should ideally be context-dependent and consider the adaptive capacity of regional ecosystems (Holbrook et al., 2019). We therefore additionally compute the MHW statistics using a Moving Baseline (MB), in the daily climatology is updated annually using the preceding 20 years of data. We selected a 20 year moving window because it offers a practical balance between statistical robustness and representativeness of present-day climatological conditions in a rapidly warming ocean. A 30 year window, although recommended by the World Meteorological Organization (WMO), would incorporate older and cooler years that depress the percentile threshold and artificially increase MHW counts, while also reducing the available temporal span of our analysis, given that satellite SST records begin in 1982 (e.g., Rosselló et al., 2023; Fernández-Álvarez et al., 2025). Using a 20 year window avoids this cooling bias, maintains methodological consistency, and maximizes the number of comparable. Finally, the sensitivity of MHW statistics to the length of the baseline period (from 5 to 40 years) is also assessed.
2.4 Climate indices and interannual variability
Inter-annual climate variation in Patagonia is explained by variations in the position and strength of the southeast Pacific anticyclone, mean sea-level pressure (SLP) in the Atlantic between South America and the Antarctic Peninsula, and teleconnections with ENSO, characterized by 2 to 4 years oscillations between warm (El Niño) and cool (La Niña) phases (Webster and Palmer, 1997). In the PS, ENSO has been linked to changes in the frequency and/or intensity of climate-driven ocean variability events (e.g., Cai et al., 2020; Risaro et al., 2022). Specifically, Artana et al. (2024) reported a strong relationship between MHWs characteristics and ENSO events in the SWA, with interannual variations in the number of MHW days and their intensity closely linked to ENSO conditions. To characterize ENSO variability, we use the Southern Oscillation Index (SOI), which is based on the observed sea level pressure differences between Tahiti and Darwin, Australia (Climate Prediction Center, NOAA). The negative values of SOI correspond to El Niño conditions, whereas the positive values indicate La Niña phases.
To examine the interannual variability of MHW characteristics and their relationship with large-scale climate indices, we computed the dominant modes of spatial–temporal variability using Empirical Orthogonal Functions (EOFs), applied separately to (i) the annual number of MHW days (yr−1) and (ii) the annual mean MHW intensity (°C). For each grid cell, annual anomaly fields were constructed by removing the temporal mean. EOFs were then calculated using the covariance matrix formulation, which preserves variance associated with the dominant spatial structures. The covariance matrices were decomposed via singular value decomposition to obtain the spatial EOF modes and their corresponding principal component (PC) time series. We mapped the spatial pattern of the leading EOF (EOF1) and compared the associated PC1 time series with climate indices, including the SOI, to investigate potential large-scale drivers of MHW variability.
To evaluate the relationship between large-scale climate variability and MHW characteristics, we computed frequency-dependent coherence between the SOI and the PC1 of MHW intensity and the number of MHW days. Both time series were demeaned and analyzed at a sampling interval of 1 year. Coherence and cross-spectral phase were estimated using Welch's averaged periodogram method, employing Hamming windows, 50 % overlap, and segment lengths equal to one-quarter of each time series, with zero-padding to the next power of two. The resulting coherence function provides the fraction of variance in the MHW metrics that is linearly and phase-consistently associated with SOI at a given frequency, while the phase spectrum and corresponding time-lag estimates quantify the temporal lead–lag relationship between the two series.
3.1 Comparative baseline climatology criterion and database selection
3.1.1 Influence of detection methods on the MHW metrics
Long-term changes in background climate variability can substantially influence the detection and characterization of extreme events, particularly when static climatological baselines are employed, as these may fail to represent contemporary ocean conditions. Consequently, outdated reference periods can lead to misrepresentations of the probability of exceeding or falling below threshold values. This limitation becomes particularly evident in climate model projections of SST. For instance, Roselló et al. (2023) demonstrated that, in a warming Mediterranean Sea, employing a fixed baseline leads to a saturation of MHW days, reaching 365 d yr−1 by the end of the 21st century under the SSP5-8.5 scenario, compared with roughly 100 d yr−1 during the past decade.
Results from comparing both methods indicate that the mean number of MHW days is 27 ± 25 and 26 ± 21 d yr−1 for the FB and MB approaches, respectively. The spatial patterns in the mean number of MHW days are highly correlated. Figure 2 reveals the differences in applying the FB and the MB method on the SWA and PS region. Methodological discrepancies were most evident in open-ocean areas characterized by strong sea surface temperature (SST) trends (Fig. 2b–d). For example, in the Zapiola Anticyclone region, where the SST trend exceeds 0.3 °C per decade (see Fig. 1), the MHW # of days trend reaches 30 d per decade and attains statistical significance when applying the moving baseline (MB) approach (see Fig. B1). Conversely, over the PS, both methodologies produced similar outcomes, indicating that methodological sensitivity is region-dependent and primarily governed by the magnitude of the prevailing temperature trends.
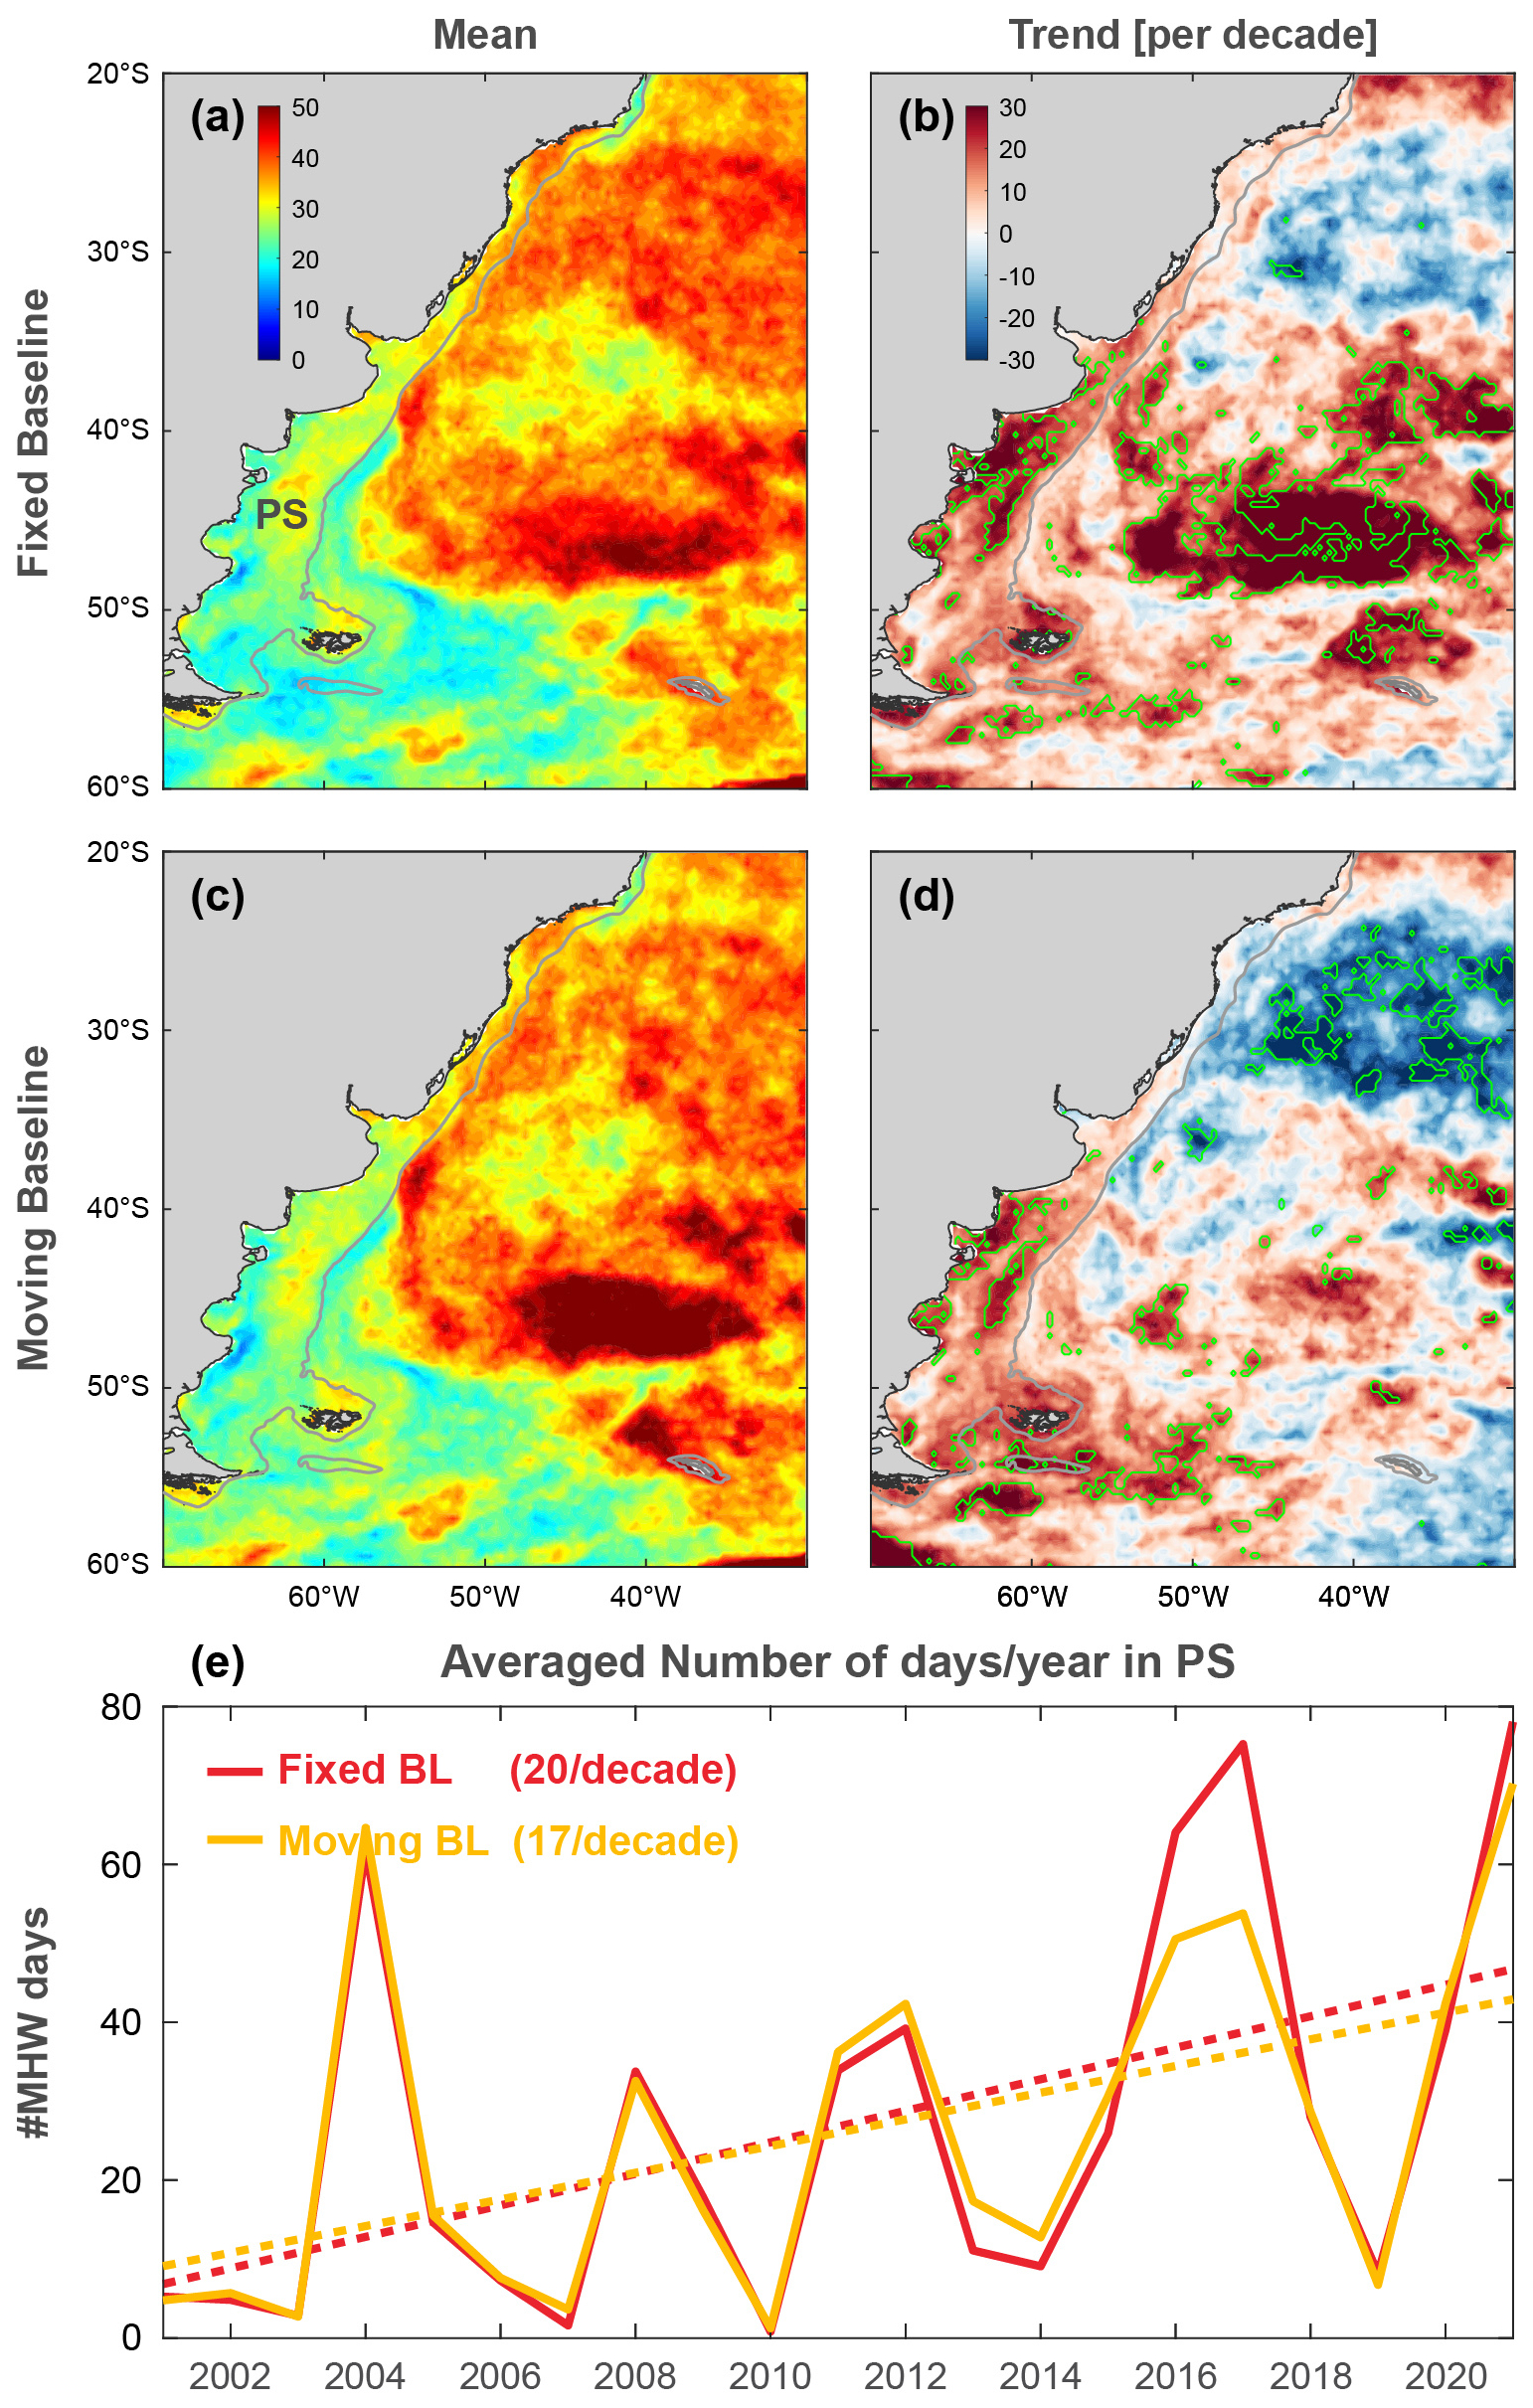
Figure 2Comparison of two baseline methodologies (FB and MB) for the detection of MHWs in the PS. (a) Mean number of days per year of MHWs and (b) trend of the number of days by decade of MHWs using the fixed baseline approach. (c) Mean number of days by year of MHWs and (d) trend of number of days by decade of MHWs using the moving baseline approach. (e) Comparison of both methodologies on the interannual variability of the mean number of days in the PS. Delimited green areas stand for a statistically significant trend (p<0.05).
3.1.2 Dataset comparison
A comparative assessment of MHWs across the four SST datasets considered (ESACCI, OSTIA, NOAA, and ERA5) presents an overall agreement on the frequency, number of days, and mean intensity of the MHWs with no significant differences (Table B1). On average, the region experiences 1.9 ± 2 MHWs yr−1 with a mean number of days of 24 to 28 d and intensities of 1.36 ± 0.3 °C. There are, nevertheless, significant differences. However, notable differences emerge when examining the year-to-year variability. For example, during the historically intense 1998 El Niño event (Enfield, 2001), the NOAA dataset yielded 81 MHW days over the PS, whereas the ESACCI, OSTIA, and ERA5 datasets indicated substantially longer durations (124, 130, and 113 MHW days, respectively; Fig. 3a). Prior to 2005, the NOAA dataset consistently yields fewer MHW days and lower intensities (Fig. 3a), whereas post-2005 values become comparable to, or in some years exceed, those from the other datasets. These temporal discrepancies result in a higher long-term trend in MHW days estimated from the NOAA dataset (10.7 d yr−1 per decade) compared with the ESACCI dataset (5.5 d yr−1 per decade). Nonetheless, despite the magnitude of these differences, neither trend is statistically significant (Fig. 3, Table B2).
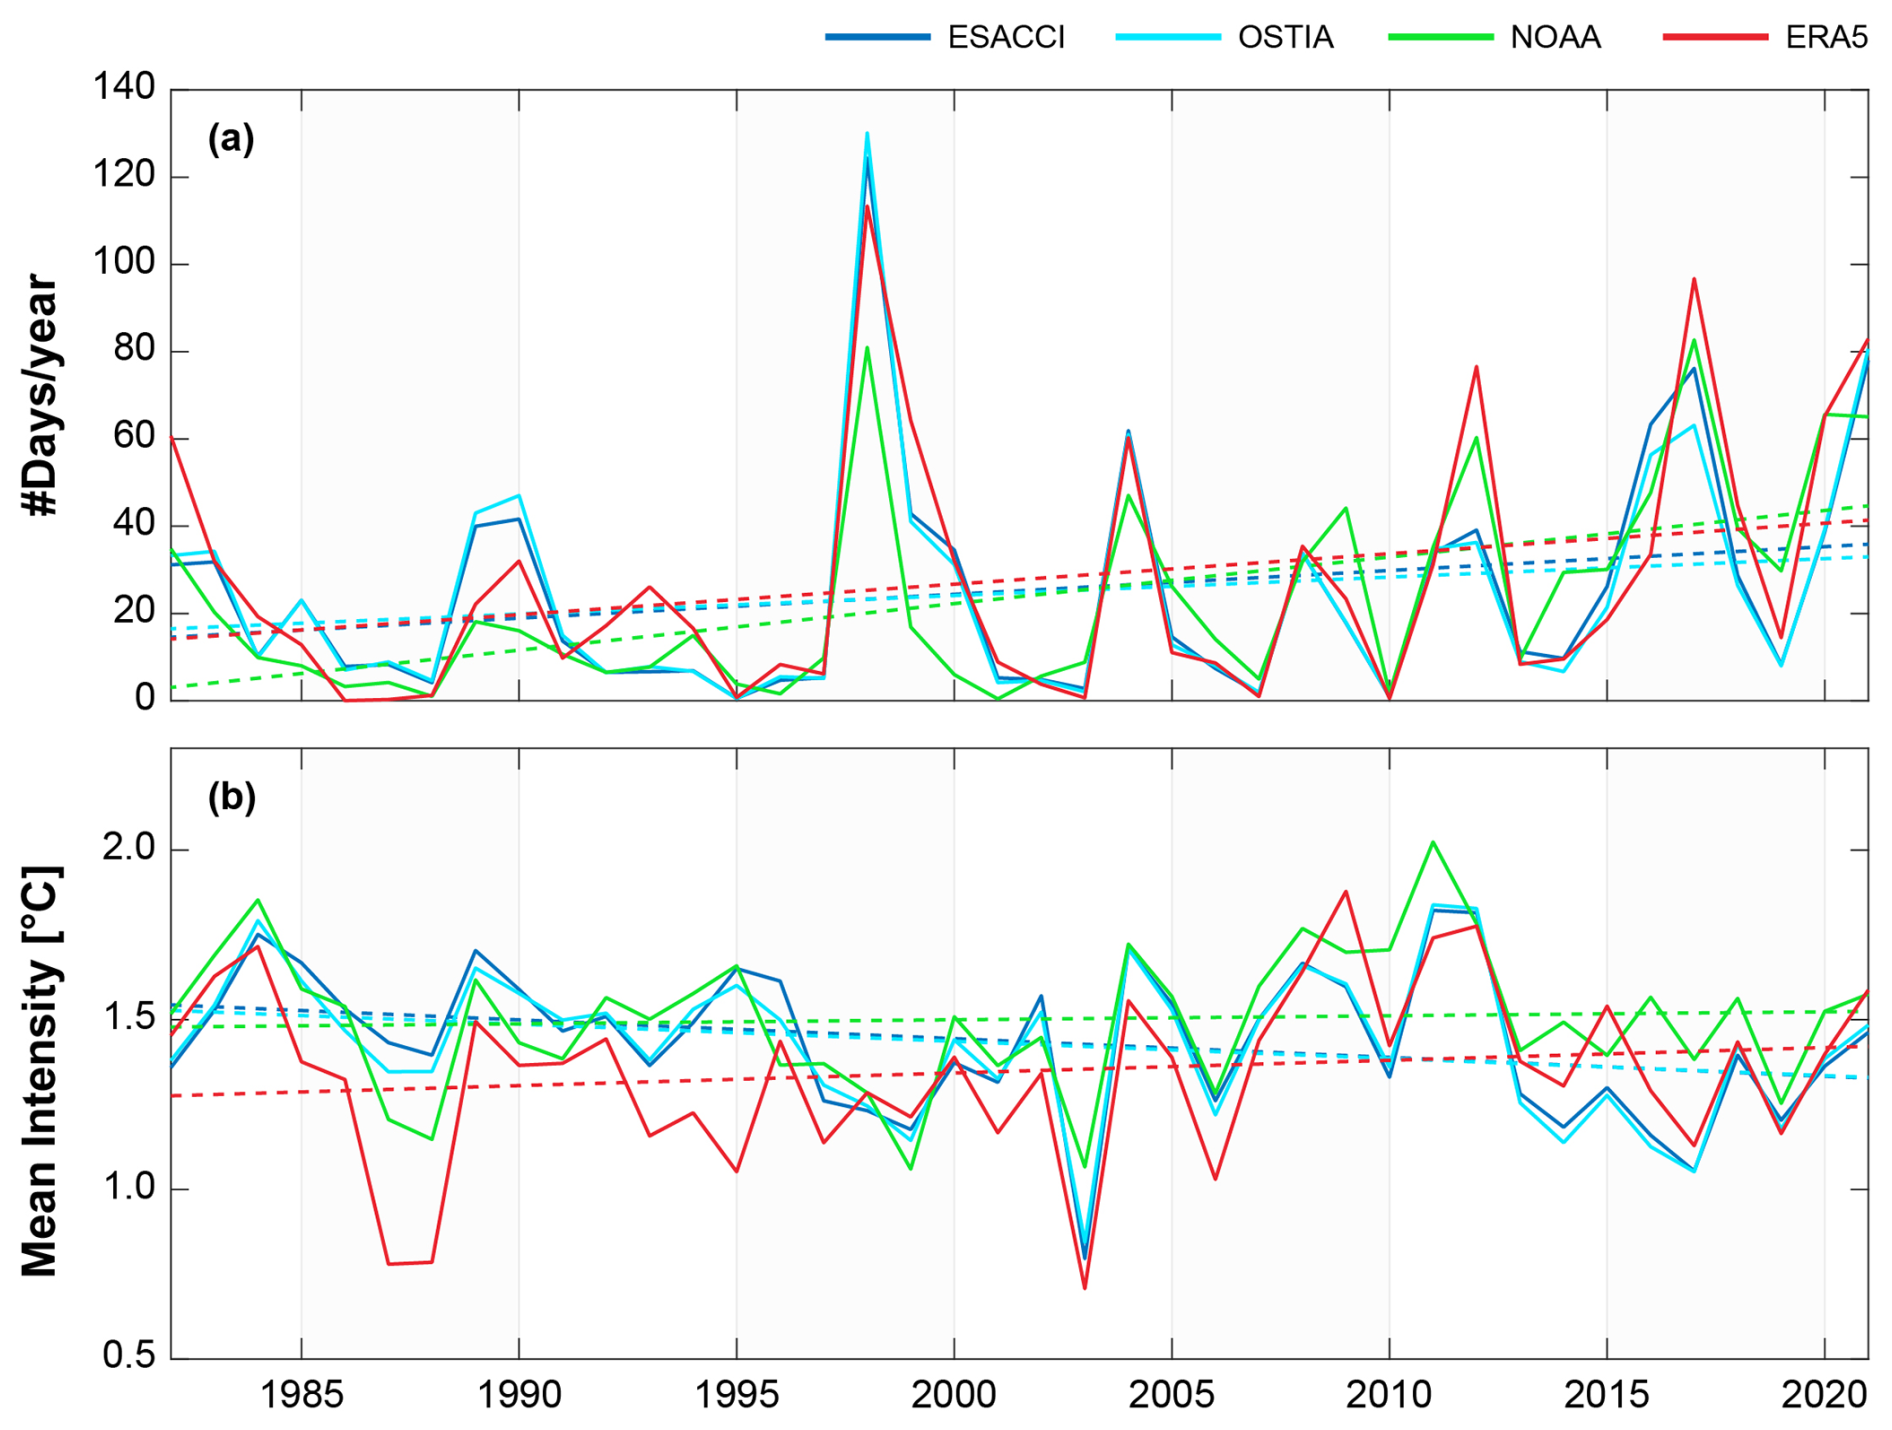
Figure 3Dataset comparison for MHWs assessment in the PS. (a) Interannual variability in the number of MHWs days per year. (b) Mean annual MHW intensity. Dotted lines represent the linear fits to each corresponding dataset (see Table B2 for statistics).
In our case, the ESACCI dataset was selected for subsequent analyses because it is specifically designed to provide long-term, stable, and high-quality climate data records for SST. Additionally, in our comparative assessment, ESACCI SST values generally fell within the intermediate range for the four datasets considered, indicating a balanced representation that avoids the higher or lower biases observed in some other products.
3.2 Spatial distribution of MHW parameters and long-term trends
The distribution of MHW descriptors in the PS reveals an average frequency of 1 to 2.5 events yr−1 (Fig. 4a). The highest occurrence rates (2.5 events yr−1) are observed at northern latitudes, particularly in the northernmost part of the study area and along the southwestern coast of Buenos Aires Province, and along the northern shelf break. The rest of the shelf presents lower values with frequencies between 1.5 and 2.0 events yr−1 resulting in a consistent cumulative MHW days of 23 to 28 d yr−1 (Fig. 4b). Temperature anomalies generally range from 0.5 to 2.5 °C, exhibiting a north–south spatial structure broadly similar to that of MHW frequency but with sharper and more pronounced gradients (Fig. 4c). The largest thermal anomalies, (up to 2.5 °C) occur in the northern sector of the study region, whereas values barely exceed 0.5 °C in several coastal areas and around Tierra del Fuego and the Malvinas Islands. This spatial pattern aligns closely with the known distribution of tidal energy dissipation in the PS, as documented by Glorioso and Flather (1997), who identified particularly energetic tidal regimes in the Gulf of San Matías and across southern Patagonia. Such regions of strong tidal forcing are associated with enhanced turbulent mixing and the modification of vertical stratification. Tidal mixing is known to exert a major control on heat redistribution in continental shelf seas, with intensified tidal mixing and residual circulation shaping the vertical and horizontal structure of temperature fields (e.g., Tinker et al., 2022). The correspondence between MHW intensity and areas of strong tidal influence, therefore, suggests that tidal-driven mixing processes contribute significantly to the observed pattern (Fig. 4c).
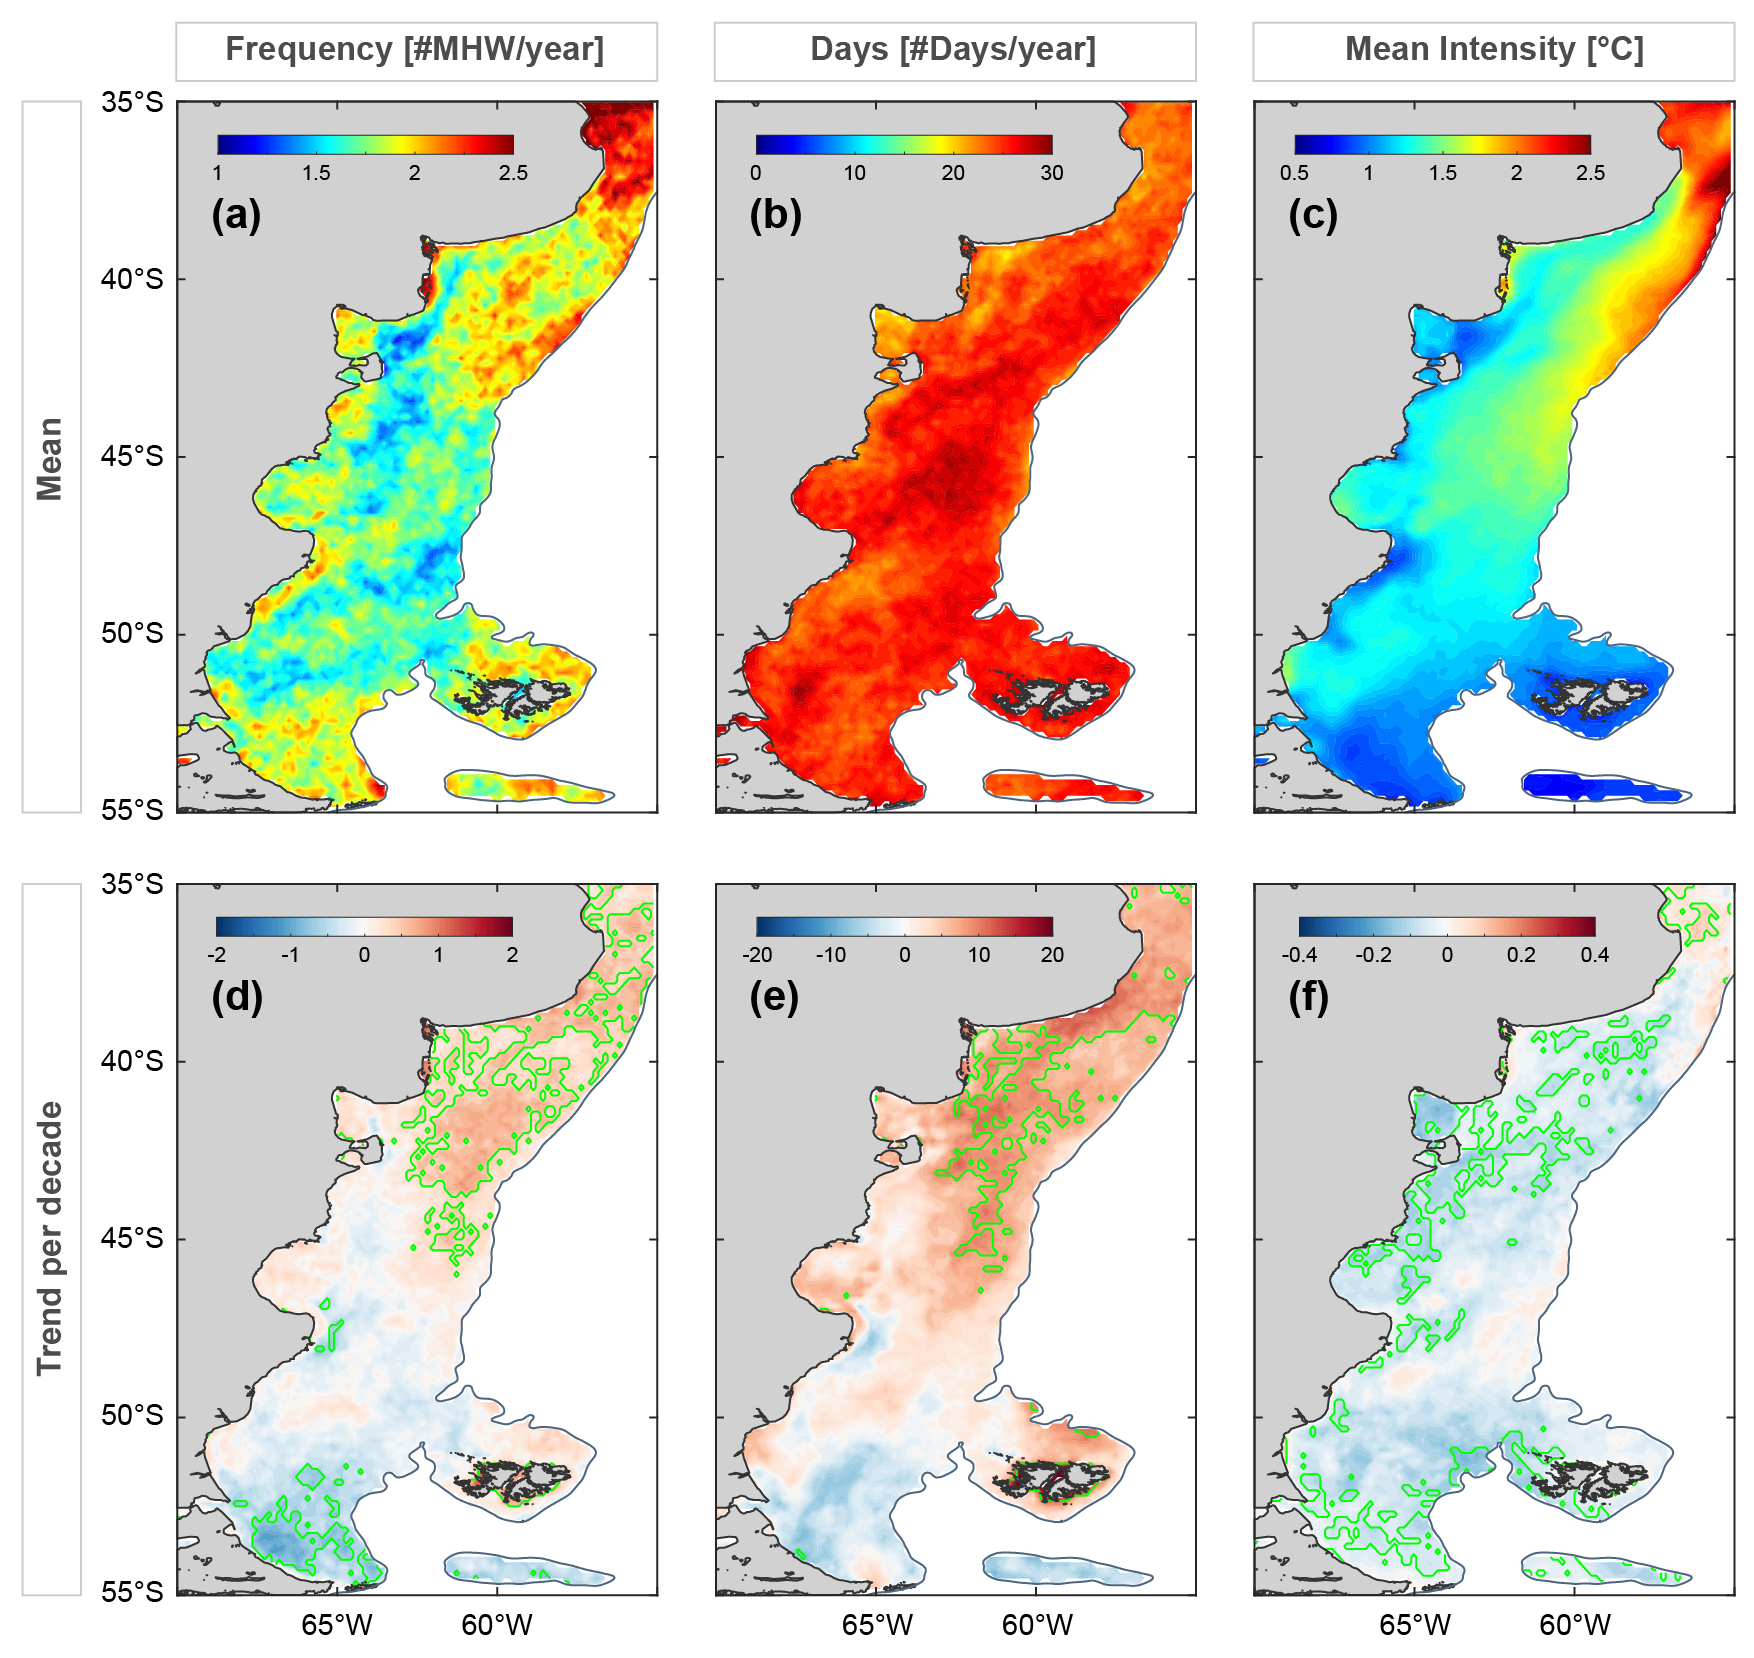
Figure 4(a) Mean frequency, (b) number of cumulative days, and (c) intensity of MHWs in the PS. Corresponding trends are shown in (d), (e), and (f) (values per decade). Areas in green indicate statistically significant trends (p<0.05).
As shown in Fig. 4d and e, the frequency of MHWs and the cumulative number of MHW days exhibit significant positive trends north of approximately 42–44° S, indicating an intensification of MHW activity in the northern region. MHW frequency increases at a rate of 0.5 to 1.5 events per decade, while the cumulative number of MHW days rises by 10–20 d per decade (Fig. 4d and e). In contrast, no significant trends are detected south of these latitudes, except for a few isolated locations near Tierra del Fuego, where significant cooling trends emerge (−0.2 °C per decade, Fig. 4f). This spatial pattern is broadly consistent with the SST warming trend shown in Fig. 1b which indicates that the long-term increase in MHW frequency is likely driven, at least in part, by the background warming of the ocean. Notably, the reduction in MHW activity at the southern tip of the Argentine Shelf coincides an increase in the frequency and # of days duration of Marine Cold Spells (MCSs; Schlegel et al., 2021), which are intensifying at rates of 0.5 to 1 event yr−1 per decade and 5 to 10 d yr−1 per decade, respectively (Fig. C1). Overall, MHW intensity across the PS shows a slight decline of approximately −0.2 °C.
3.3 Seasonality of MHWs in the PS
The probability of occurrence of MHW events and the number of MHW days over the PS exhibit weak seasonality (Fig. 5a and b). The seasonal probability of MHW onset ranges from 0 % to 20 %, with a standard deviation of the same order of magnitude (not shown). The season with the lowest probability of MHWs onset is winter in the southern portion of the PS (<43° S); however, in the northern portion of the shelf, the behavior is similar to that observed during the other seasons. Regarding the number of MHW days, austral spring registers the lowest MHW activity, with an average of approximately 1.8 d per month. In contrast, the mean number of MHW days increases markedly during summer, and to a lesser extent during autumn, with summer months exhibiting an approximately 40 % increase in MHW days relative to spring. The standard deviation of the seasonal mean values is, in some cases, even higher than the mean (ranging from 3 to 9 d per month, not shown), indicating that the seasonal cycle in the average number of MHW days is weak, despite the presence of seasonal differences.
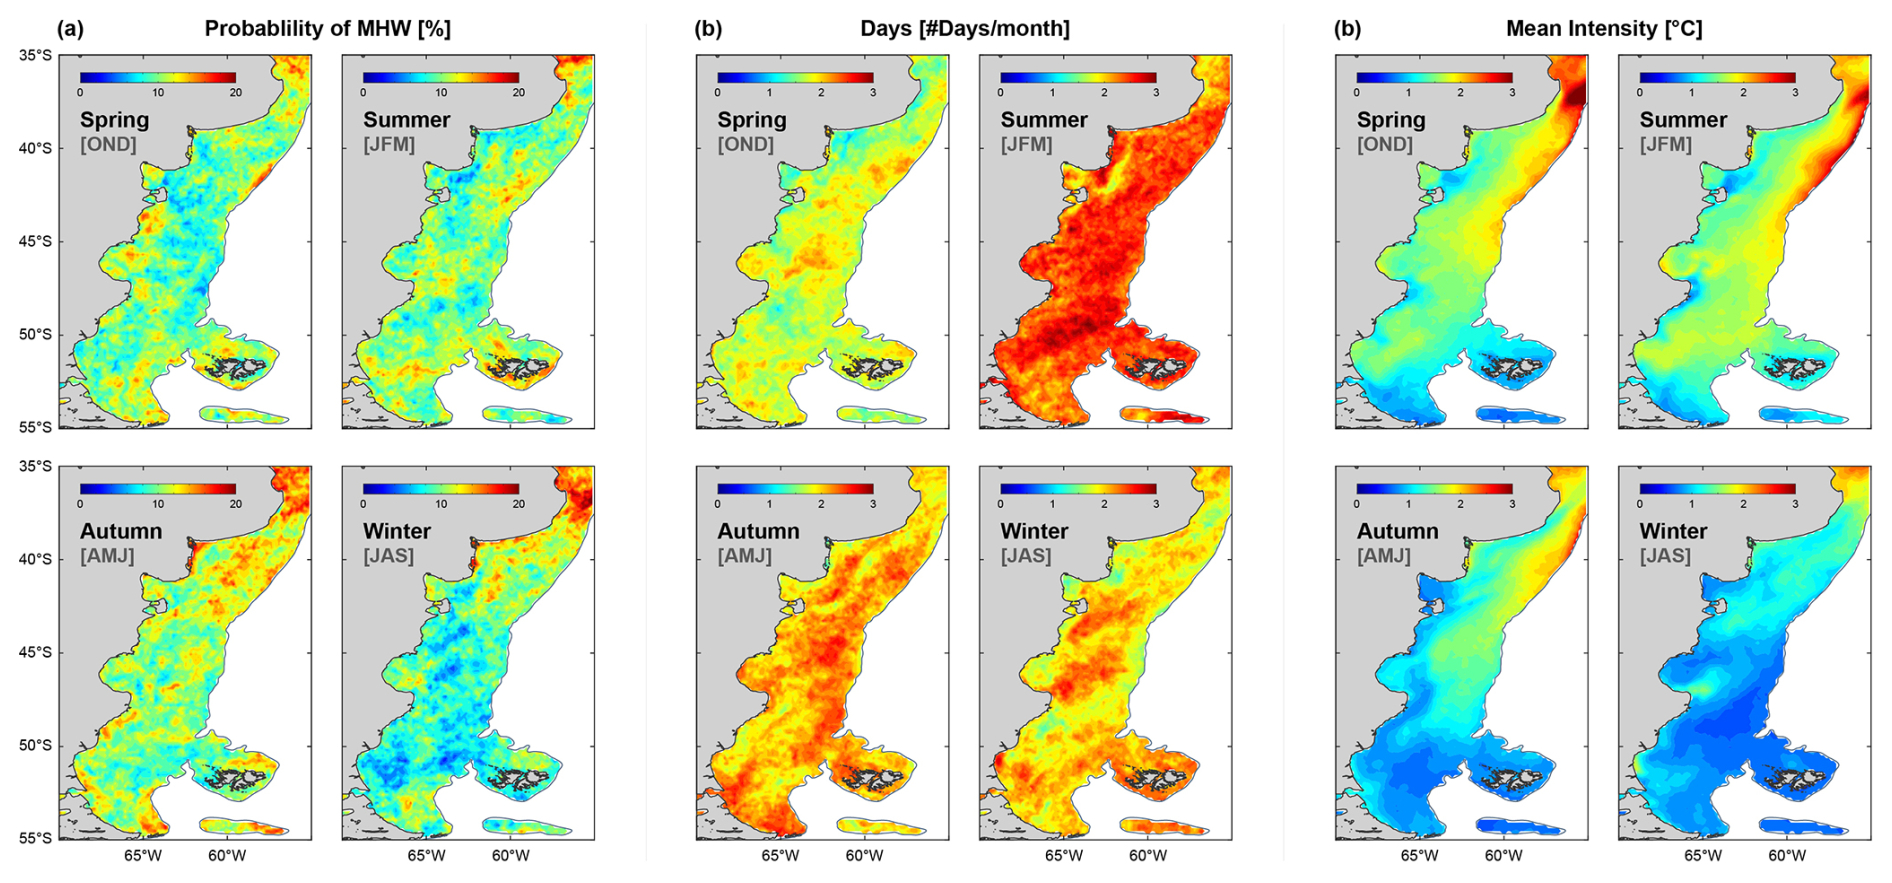
Figure 5Seasonal patterns of MHW. (a) Mean Probability of MHWs occurrence (%). (b) Average number of MHW days per month for each season. (c) Average MHW intensity (°C) by season.
Air–sea heat fluxes play a pivotal role in modulating cumulative MHW intensity during the warm season (Wang and Zhou, 2024). Consistent with this, the highest MHW intensities (>2.5 °C) occur during austral spring and summer, particularly along the northern shelf break and near the Río de la Plata (Fig. 5b). In contrast, during autumn and winter, MHWs seldom exceed 1.5 °C, especially within the mid-shelf region. In addition, MHW intensities exhibit a pronounced seasonal latitudinal migration: events exceeding 2 °C extend northward from the Malvinas region during spring and summer, while shifting toward lower latitudes (∼38° S) in winter. The highest intensities are observed along the shelf break and in open waters, suggesting that enhanced vertical mixing, driven by wind or tides, and the northward coastal flow of the Magellan plume may modulate MHW intensities in shallower shelf areas. Temporal trends in MHWs reveal marked seasonal variability, with the most substantial long-term changes occurring in event # of days rather than intensity (Fig. D1). Across much of the PS, the number of MHW days shows stronger positive trends during autumn and winter, reaching increases of up to ∼2 additional days per month per decade. These seasonal extensions are particularly relevant for assessing some ecological impacts, such as the effect of MHWs on secondary phytoplankton blooms, which typically occur in late autumn and have been reported to increase in frequency in recent years (Delgado et al., 2023).
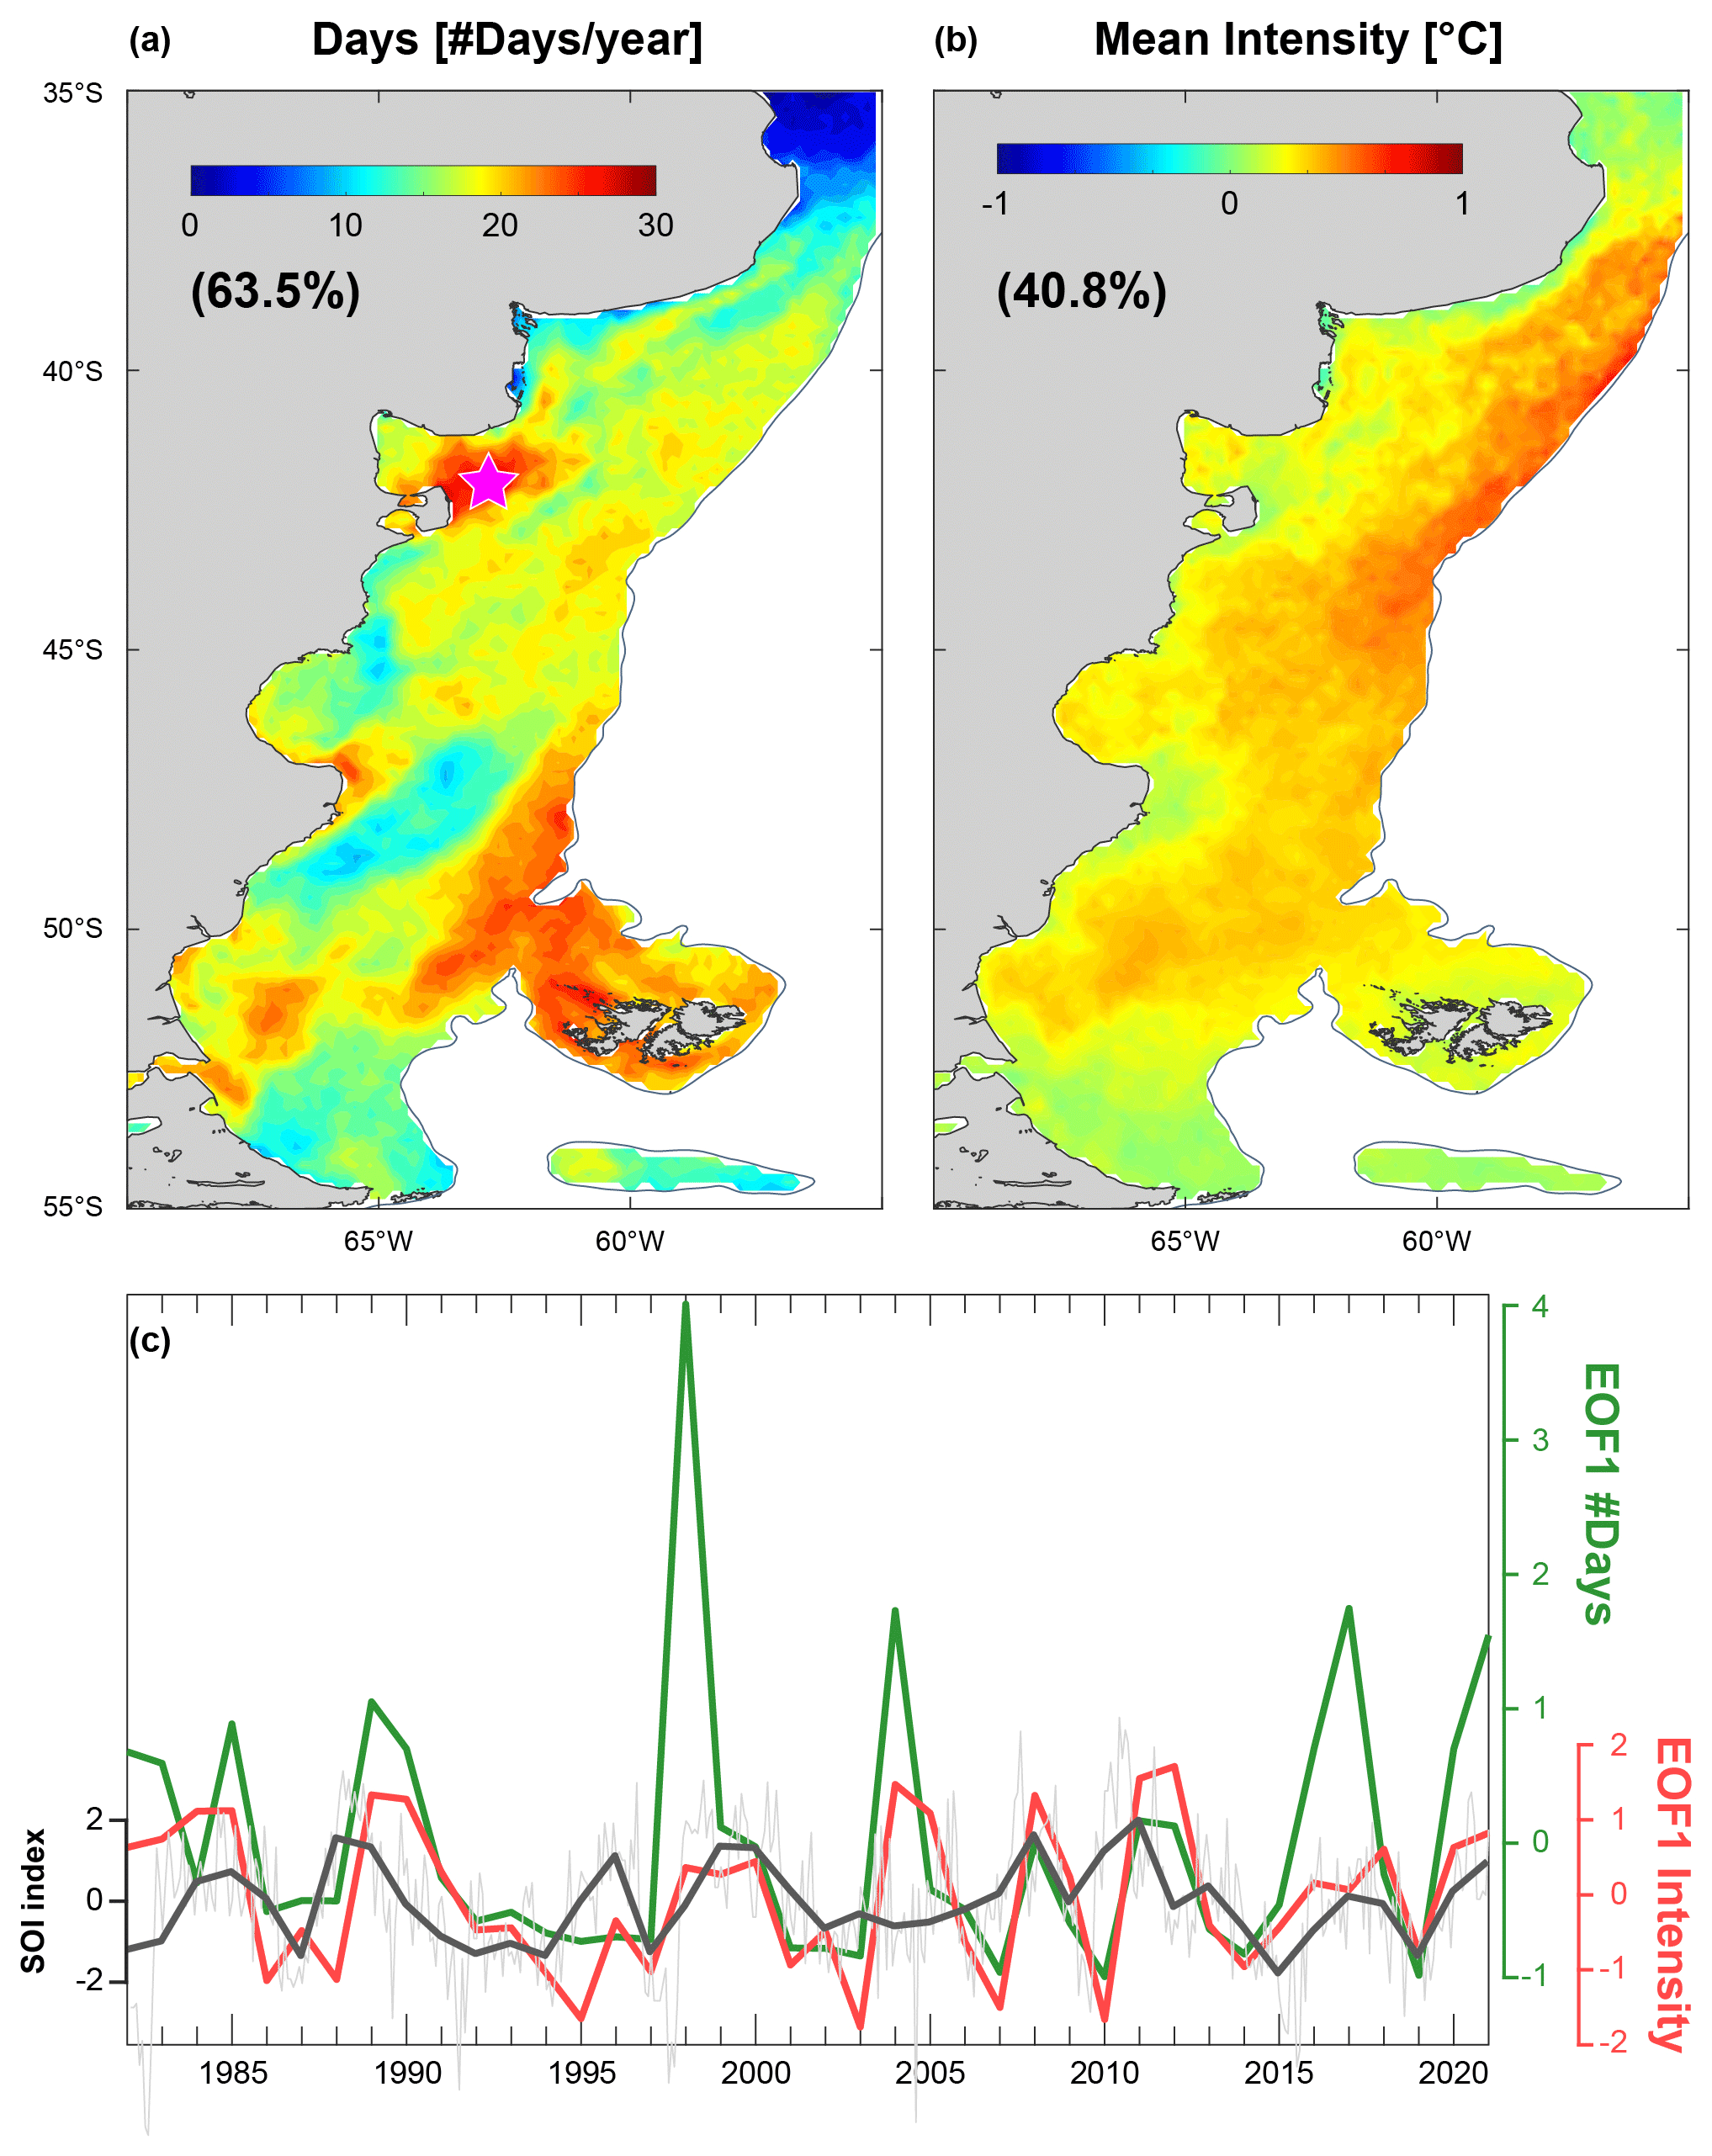
Figure 6Spatial patterns of the first EOF modes of the interannual variability in (a) number of days, (b) mean intensity and (c) the corresponding time series of expansion coefficients overlayed on monthly (grey) and annual mean (black) SOI index. El Niño (la Niña) phases correspond to negative (positive) SOI indexes.
3.4 Interannual variability of MHWs
The leading empirical orthogonal function mode (EOF1) of the annual number of MHW days per year and mean MHW intensity accounts for 63.5 % and 40.8 % of the total variance, respectively (Fig. 6a and b). Both temporal modes exhibit pronounced interannual variability and are significantly correlated (r=0.57; p<0.05). Despite their temporal correlation, their corresponding spatial patterns differ in the location of maximum variability. For example, the northern sector of the shelf break displays greater variability in MHW intensity than in cumulative duration of the events (number of days), with temperature anomalies reaching up to 1.5 °C above the mean MHWs intensity during extreme events. In contrast, several shelf regions, including the inner and mid-shelf areas off Peninsula Valdés, the vicinity of the Malvinas Islands, and the southern Santa Cruz mid-shelf, accumulate MHW days. At these locations, extreme events have eventually lasted 30 to 110 d longer than average conditions during peak years.
The coherence between SOI and the PC1 of the annual number of MHW days is weak across all timescales, with only modest peaks near ∼3 and ∼7 years (coherence<0.18), suggesting that although some interannual and early-decadal covariability exists, the response of MHW days to ENSO forcing is limited and likely masked by regional and local atmospheric–oceanic processes and noise. The mesoscale structures visible in Fig. 6a further support the influence of these autochthonous processes. In contrast, the coherence between SOI and MHW intensity exhibits a stronger peak at 4–5 years (coherence ∼0.55), indicating a more robust ENSO imprint on thermal anomalies. A lag of approximately 0.5 years is found in both metrics between SOI fluctuations and MHWs interannual variability, as represented by the leading EOF. These differences in the degree of coupling between MHWs and climate indicate that the mechanisms controlling how intense MHWs become are more tightly linked to large-scale climate variability than those governing how often they occur. Hence, ENSO modulates the magnitude of thermal anomalies more effectively than the frequency of events.
This interpretation is consistent with previous studies reporting a strong association between MHW properties in the southwestern Atlantic and the positive phase of the SOI, characteristic of La Niña conditions, which favor the development of persistent high-pressure systems (Artana et al., 2024; Rodrigues et al., 2015). However, this linkage is not ubiquitous across the region. For instance, over the La Plata River plume and the Uruguayan coast, an exceptionally strong MHW occurred in 2017 with no apparent connection to La Niña conditions. Manta et al. (2018) attributed this event instead to the influence of the Madden–Julian Oscillation and persistent atmospheric anomalies, including unusually high air temperatures and weak wind speeds. Over the Patagonian Shelf, local processes such as wind forcing, coastal currents, and tidal mixing likely play a key role in modulating both MHW intensity and duration. The complexity of the coastal system introduces non-linear interactions between stratification, advection, and mixing that can amplify or dampen temperature anomalies independently of large-scale forcing. This interplay between large-scale and regional drivers likely explains the weak statistical correlations observed, while still producing the spatially coherent patterns captured by EOF1.
The ecological and societal impacts of MHWs are an issue of growing concern. While the consequences of the most intense warming events are well-documented across entire marine foodwebs (Samhouri et al., 2021; Suryan et al., 2021), some ecological impacts may arise from the cumulative impact of recurrent high-temperature events or from prolonged, albeit less intense, thermal anomalies. The present study provides a comprehensive analysis of MHWs-related temperature anomalies in the PS, a highly productive and biologically diverse marine region. The observed MHW intensities (0.5–2.5 °C) fall within the range reported for other worldwide regions (Wang and Zhou, 2024). However, a positive trend in cumulative MHW days across the northern PS (10–20 d per decade) suggests that persistence, rather than intensity, may ultimately pose the greater environmental challenge.
In general, the definition of extreme events remains a critical issue for ensuring consistency in research and for facilitating effective communication among marine scientists, policymakers, and the public (Smith et al., 2025). The detection and characterization of MHWs are particularly sensitive to methodological choices, which can substantially influence their interpretation. In this study, we compared the outputs of four different SST datasets and two methodological approaches, FB and MB, across the PS. Although mean MHW metrics were broadly consistent across datasets and methods, notable discrepancies emerged when analyzing individual events or short time periods (e.g., spanning only a few years). Over the PS, both methodologies yielded comparable results, suggesting that methodological sensitivity is region-specific and influenced by the magnitude of underlying temperature trends.
Within the PS, the highest occurrence of MHWs is observed in the northern sector, particularly near the La Plata Estuary, where surface temperatures are generally higher (mean ∼17 °C), as well as in specific regions along the continental shelf. The observed increase in the number of MHW days in these areas may be linked to shifts in the position of the latitudinal sea surface temperature (SST) gradient. In contrast, MHW intensities appear to correspond more closely with regions of strong tidal influence, suggesting that intense tidal mixing may moderate the magnitude of thermal anomalies. Nonetheless, the presence of persistent coastal warming hotspots deserves further analysis.
Part of the variability of MHWs intensity and number of days can be attributed to climate variability. The interannual variability analysis indicate that while the frequency and persistence of MHWs over the PS are largely governed by local ocean–atmosphere processes, the intensity of the events exhibits a modulation by ENSO (La Niña) at interannual timescales (4–5 years). This contrast highlights that large-scale climate variability plays a potential role in shaping thermal anomalies, even in a region strongly influenced by local and regional dynamics. Given the increasing strength of La Niña events (Geng et al., 2023), it is crucial to monitor regions with high interannual variability, especially those showing significant positive trends, such as the Península Valdés front and the northern shelf-break front, which are highly relevant ecological environments for biodiversity and biological productivity. Additional mechanisms, including regional atmospheric processes, may also exert a significant influence and should be considered in future analyses of the driving mechanisms.
Nearby the PS in the SWA, particularly in the Zapiola Anticyclone, using the fixed baseline method, the trend in MHWs days shows values 3-fold higher than with the moving baseline method for the period 2001–2021, with 33 and 11 MHWs yr−1 per decade, respectively (Fig. 2e). Similarly, the weak negative MHW days trend east of the Brazil Current using a fixed baseline becomes statistically significant using a moving baseline strategy. Over the Patagonian shelf, differences between both methods are weaker (Fig. 2), and the impact on the long-term trends is mostly negligible.
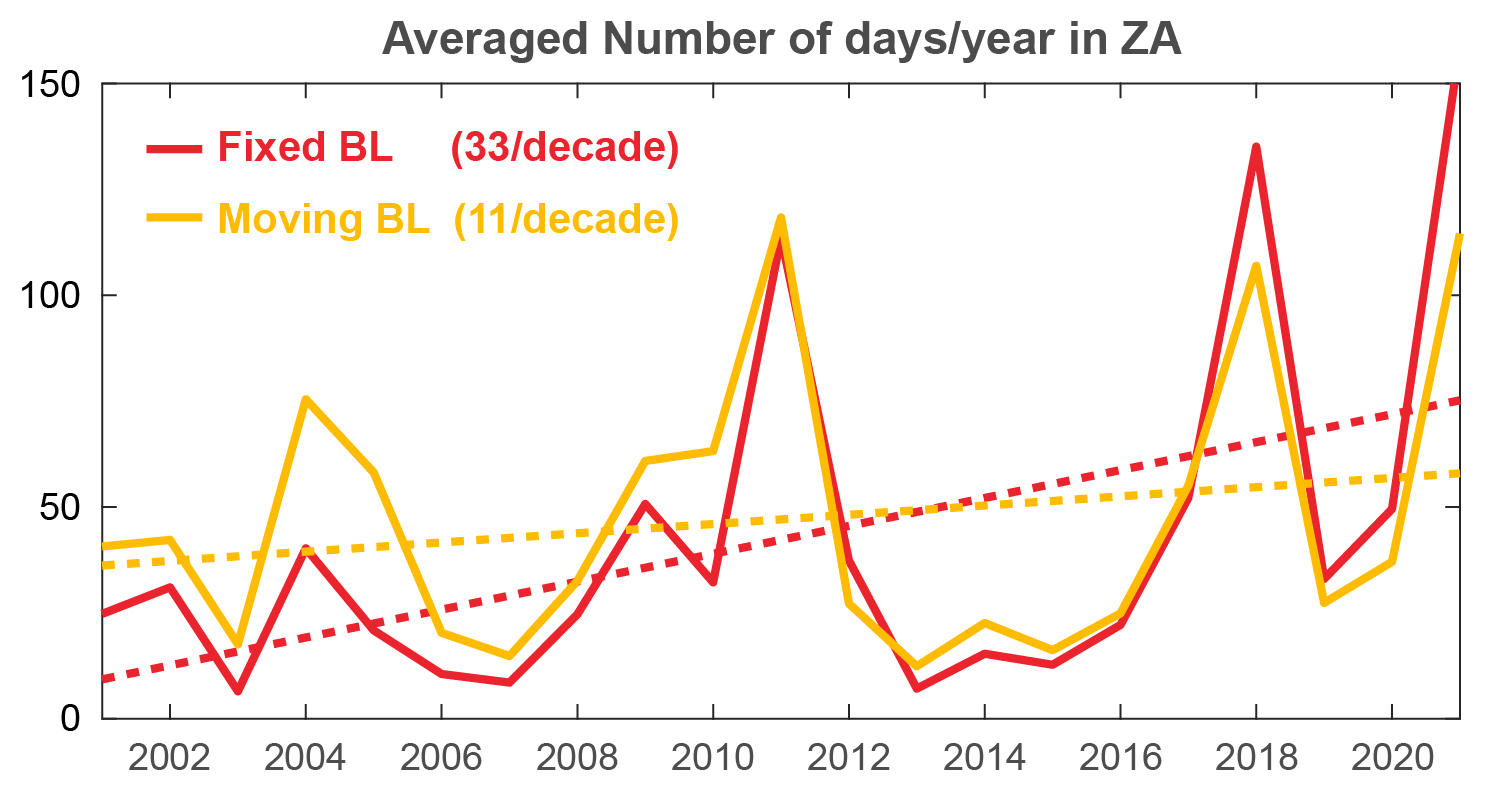
Figure B1Comparison of both methodologies on the interannual variability of the mean number of days in the ZA.
Beyond the choice of baseline type, the length of the baseline climatology can also exert a strong influence on marine heatwave (MHW) statistics. Although somewhat subjective, there is general agreement for FB approaches that a baseline period should span at least 30 years (WMO). To illustrate the sensitivity to baseline length, we examine how different climatology windows affect MHW statistics in the ZA region, where sea surface temperature (SST) trends are significant (Fig. B2a). Figure B2b illustrates the number of MHW days per year calculated using different baseline lengths ranging from 5 to 40 years (Fixed Baseline method starting in 1982). When using a 30 year baseline climatology (1982–2011), the average number of MHW days is approximately 45 yr−1. We find that the highest number of MHW days occurs with a 16 year baseline climatology (∼75 d yr−1), while the lowest (∼30 d yr−1) is observed using a 40 year baseline climatology. Spatially, the length of the baseline climatology associated with the maximum number of MHW days is shown in Fig. B3 and closely resembles the map of SST trends (Fig. 1c). This preliminary analysis highlights the need for further investigation into the influence of baseline length, especially in regions with strong decadal SST variability, such as the northwest Pacific, where the Pacific Decadal Oscillation plays a major role. The sensitivity of MHW trends to baseline length is further illustrated in Fig. 3c.
Table B1Marine Heat Waves Statistics. Mean and standard deviation (from yearly time series) values are computed for the Patagonian Shelf.
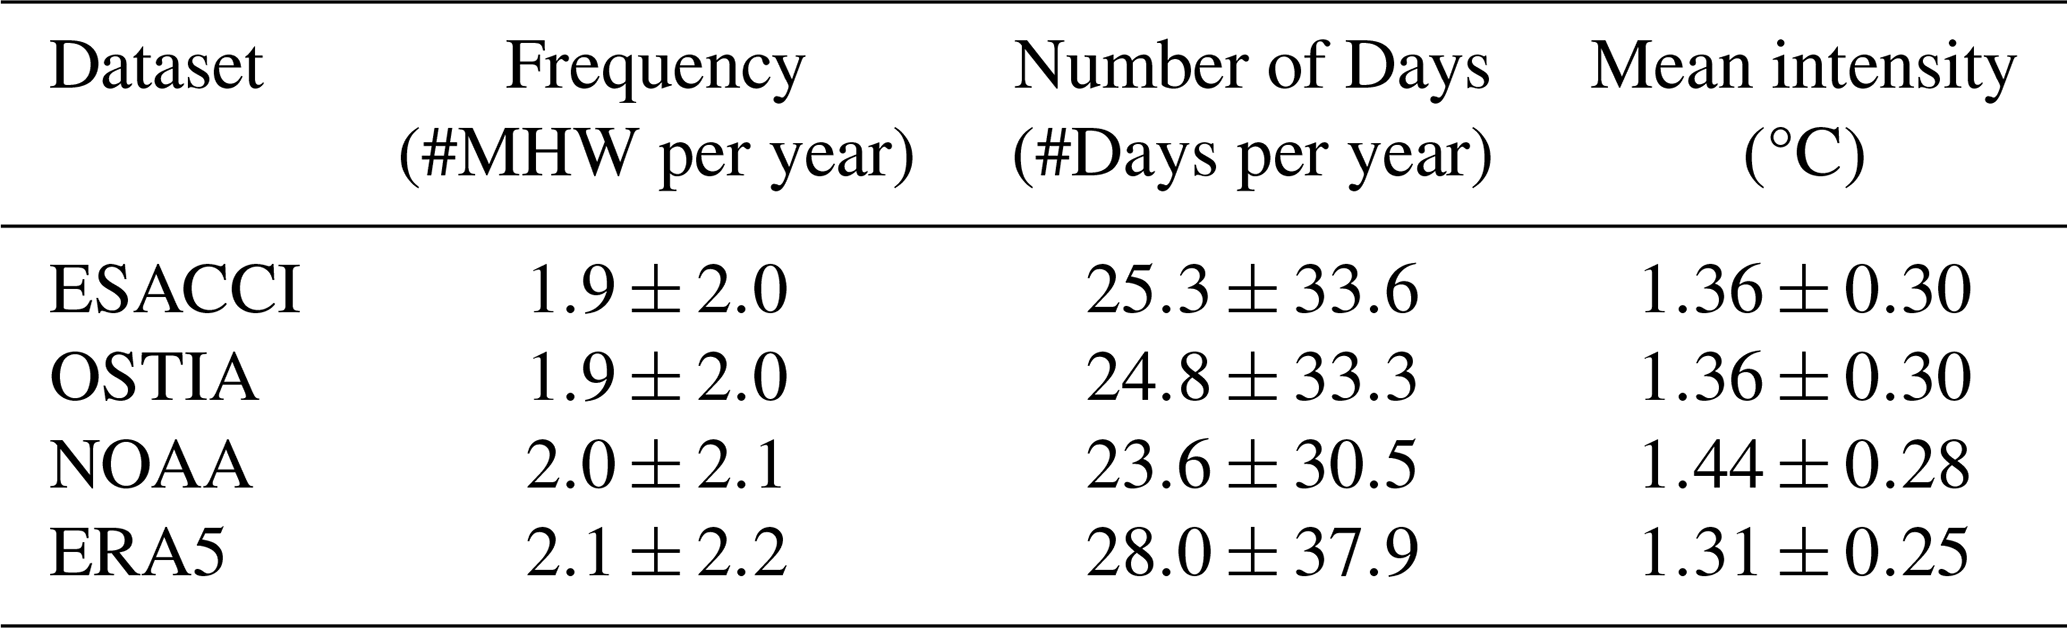
Table B2Marine Heat Waves dataset trends statistics for the Patagonian Shelf. In bold, statistically significant (95 % confidence).
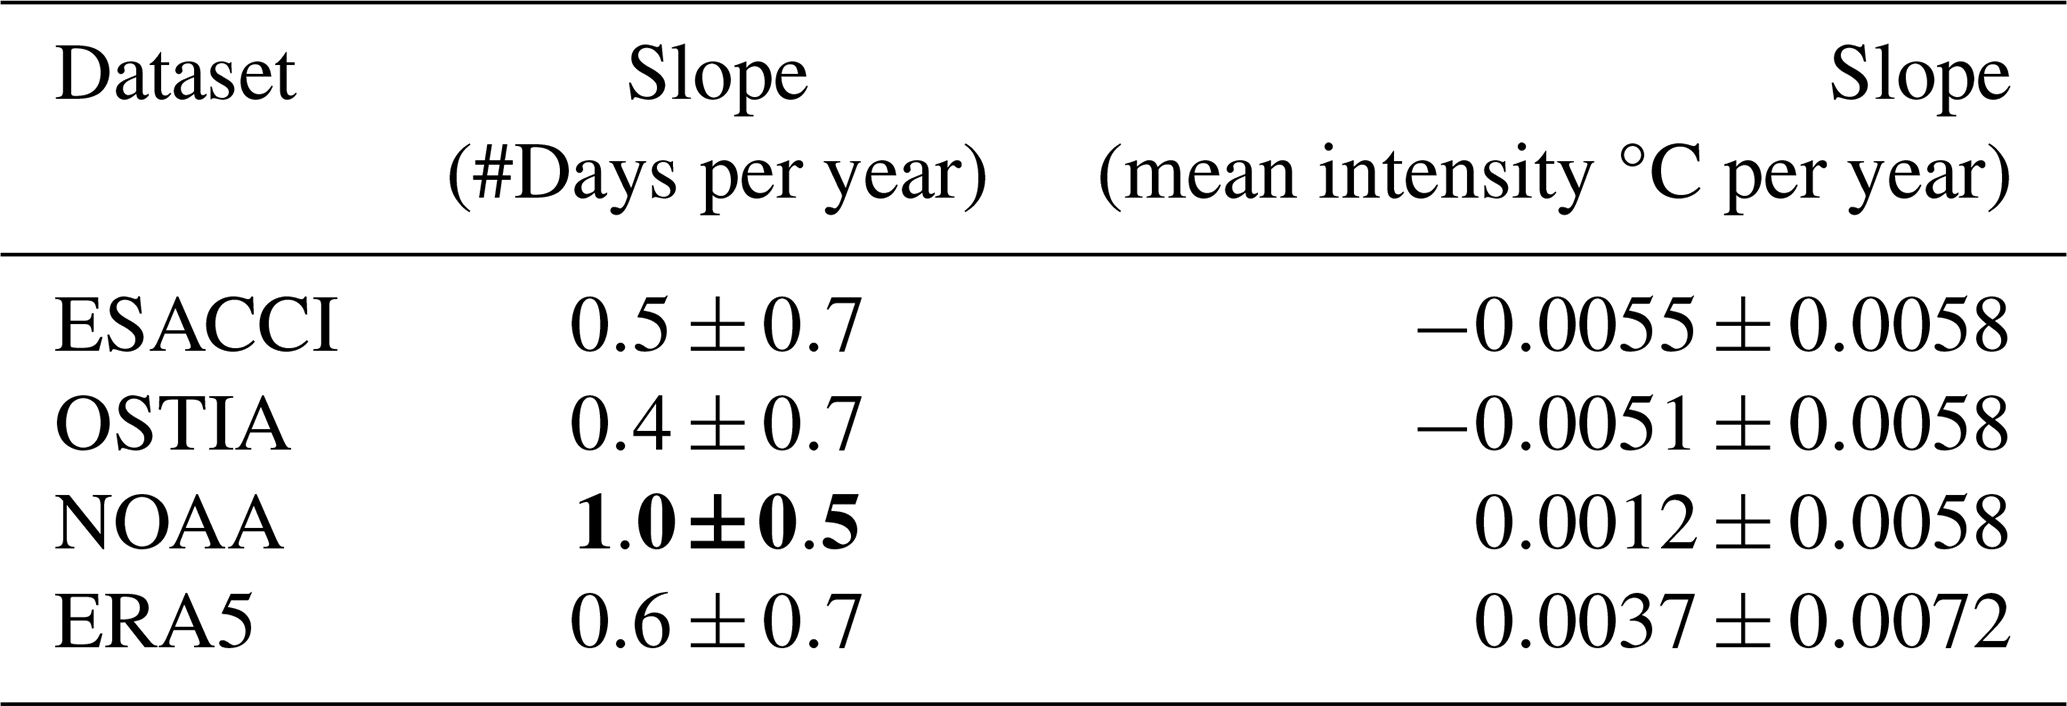
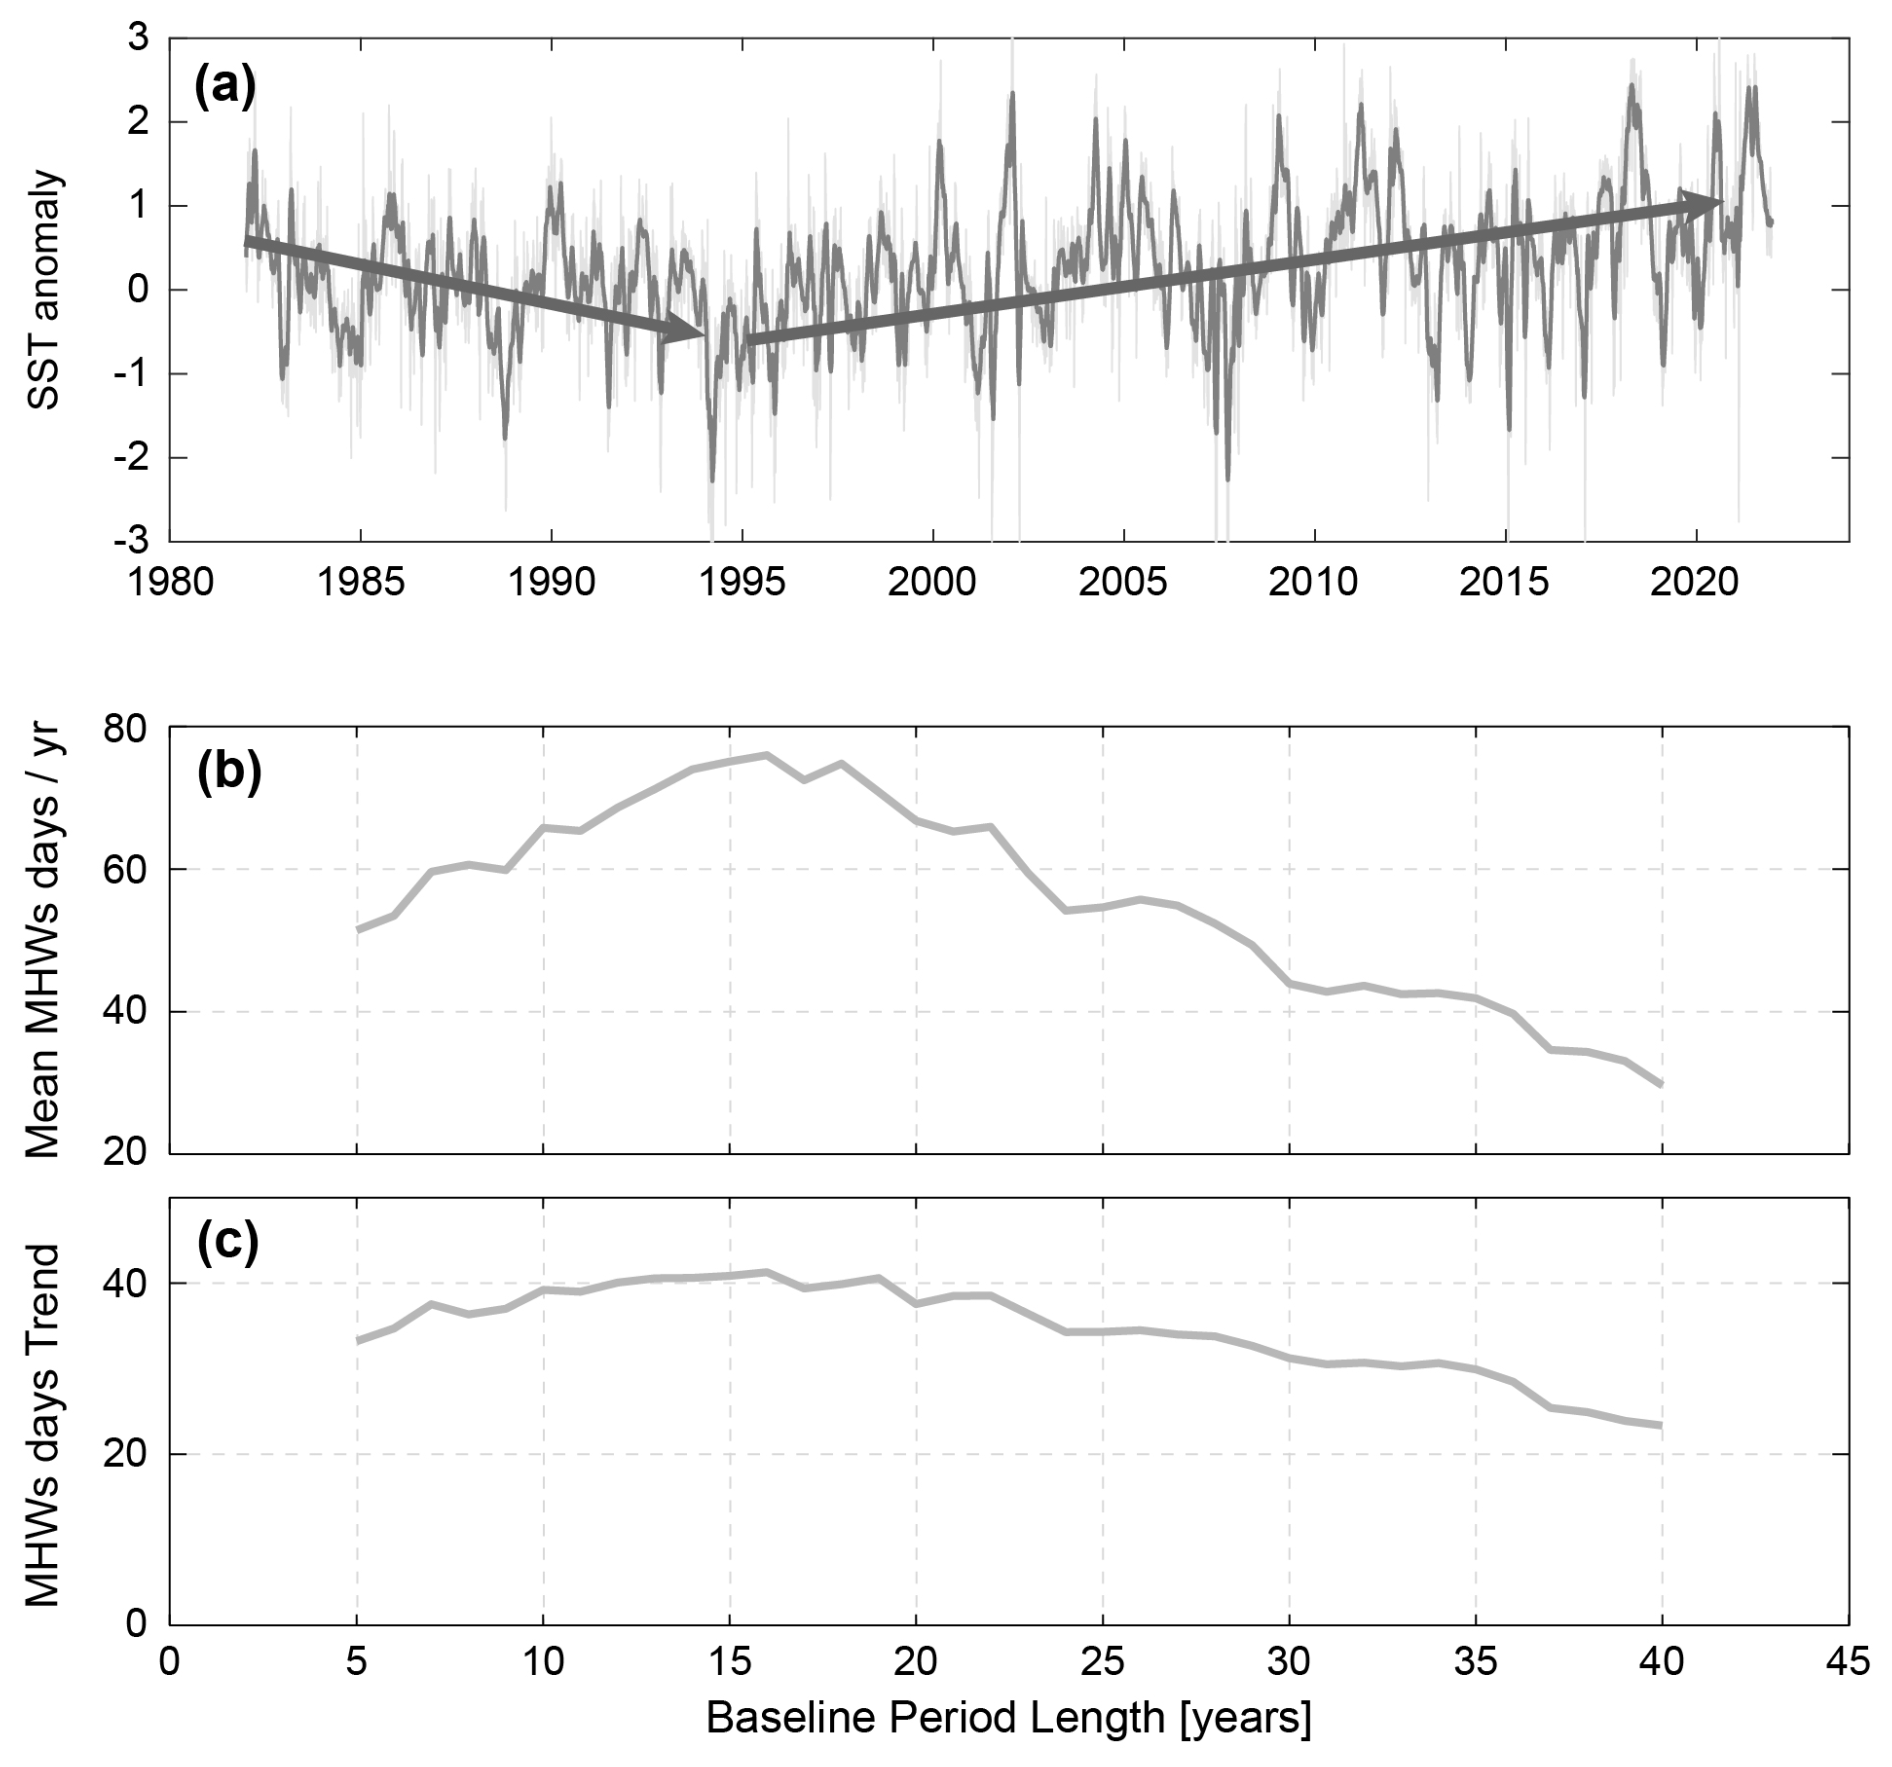
Figure B2(a) SST anomaly (°C) in the Zapiola anticyclone. (b) Number of MHW days per year (averaged over 1982–2021) for different baseline period lengths (in years) ranging from 5 to 40 years (starting in 1982). (c) same as (b) for the trend in MHWs days [#days per year per decade].
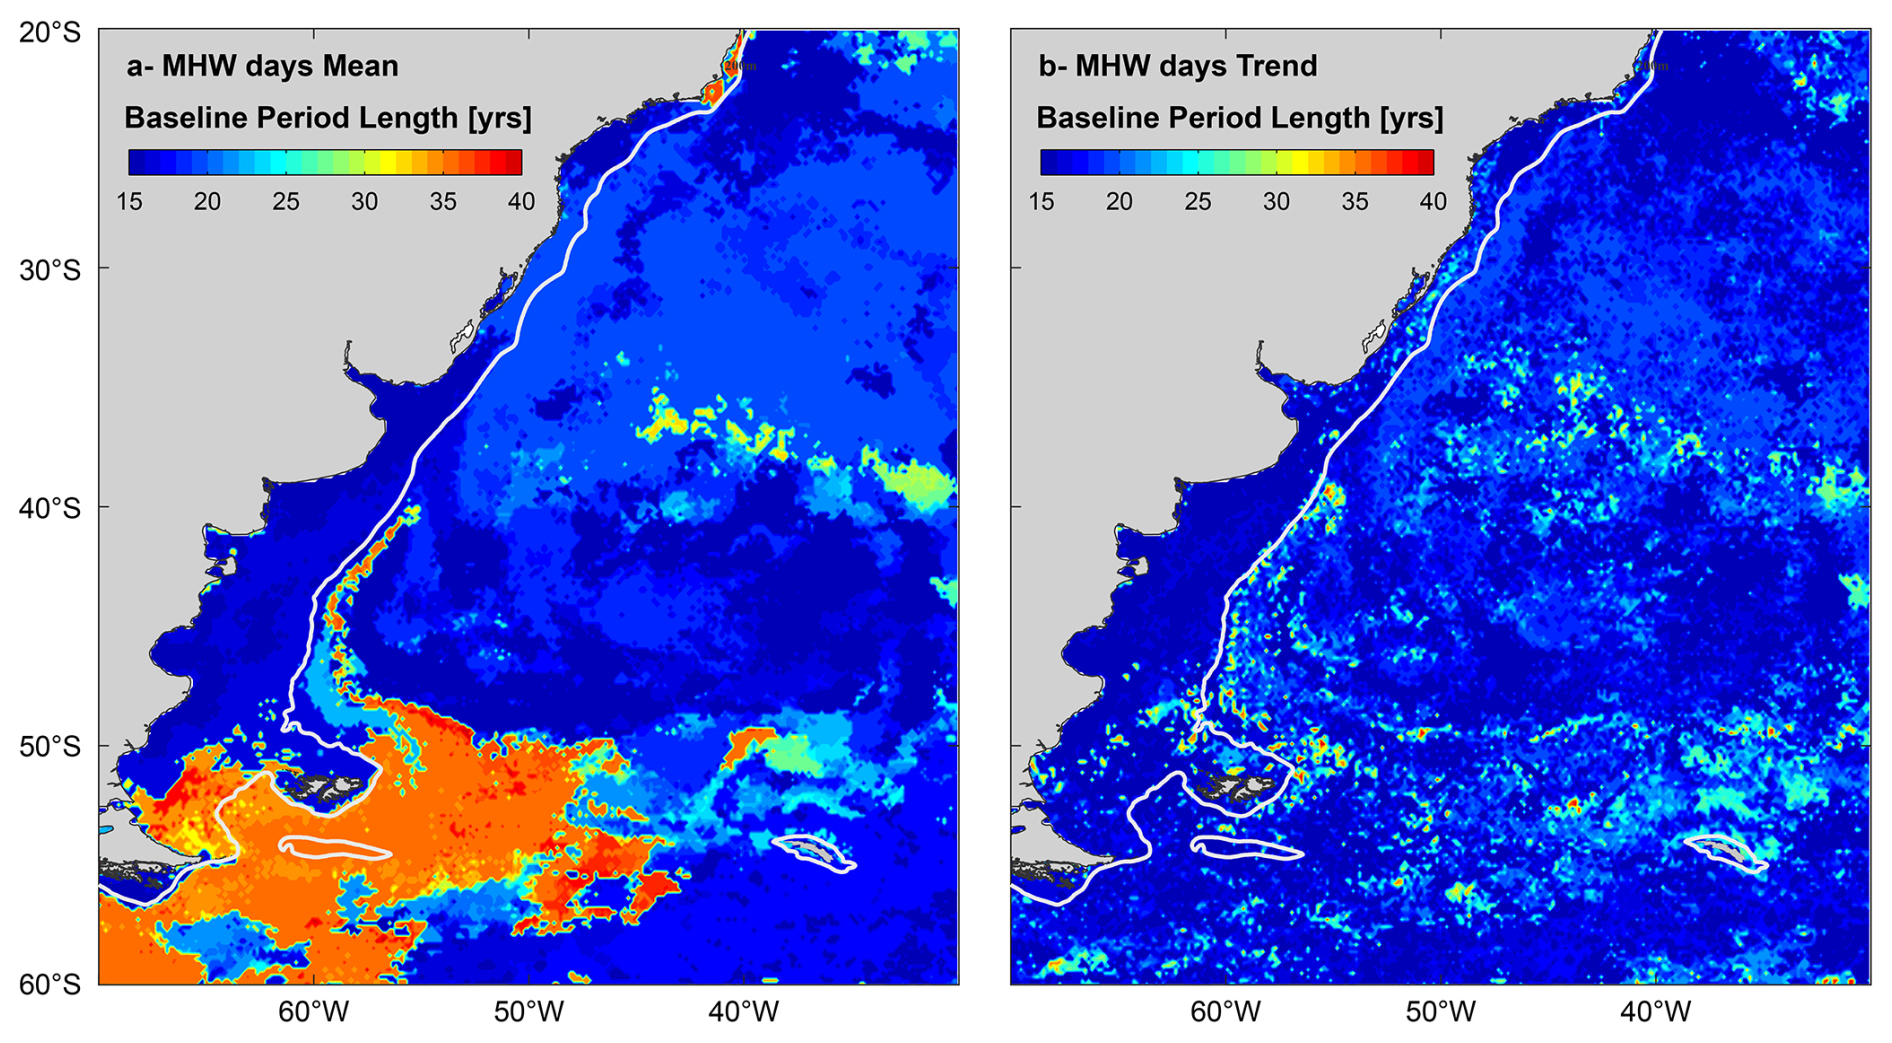
Figure B3Length of the Baseline period [in years], when the 1982–2021 mean (a) and trend (b) MHWs days is maximum.
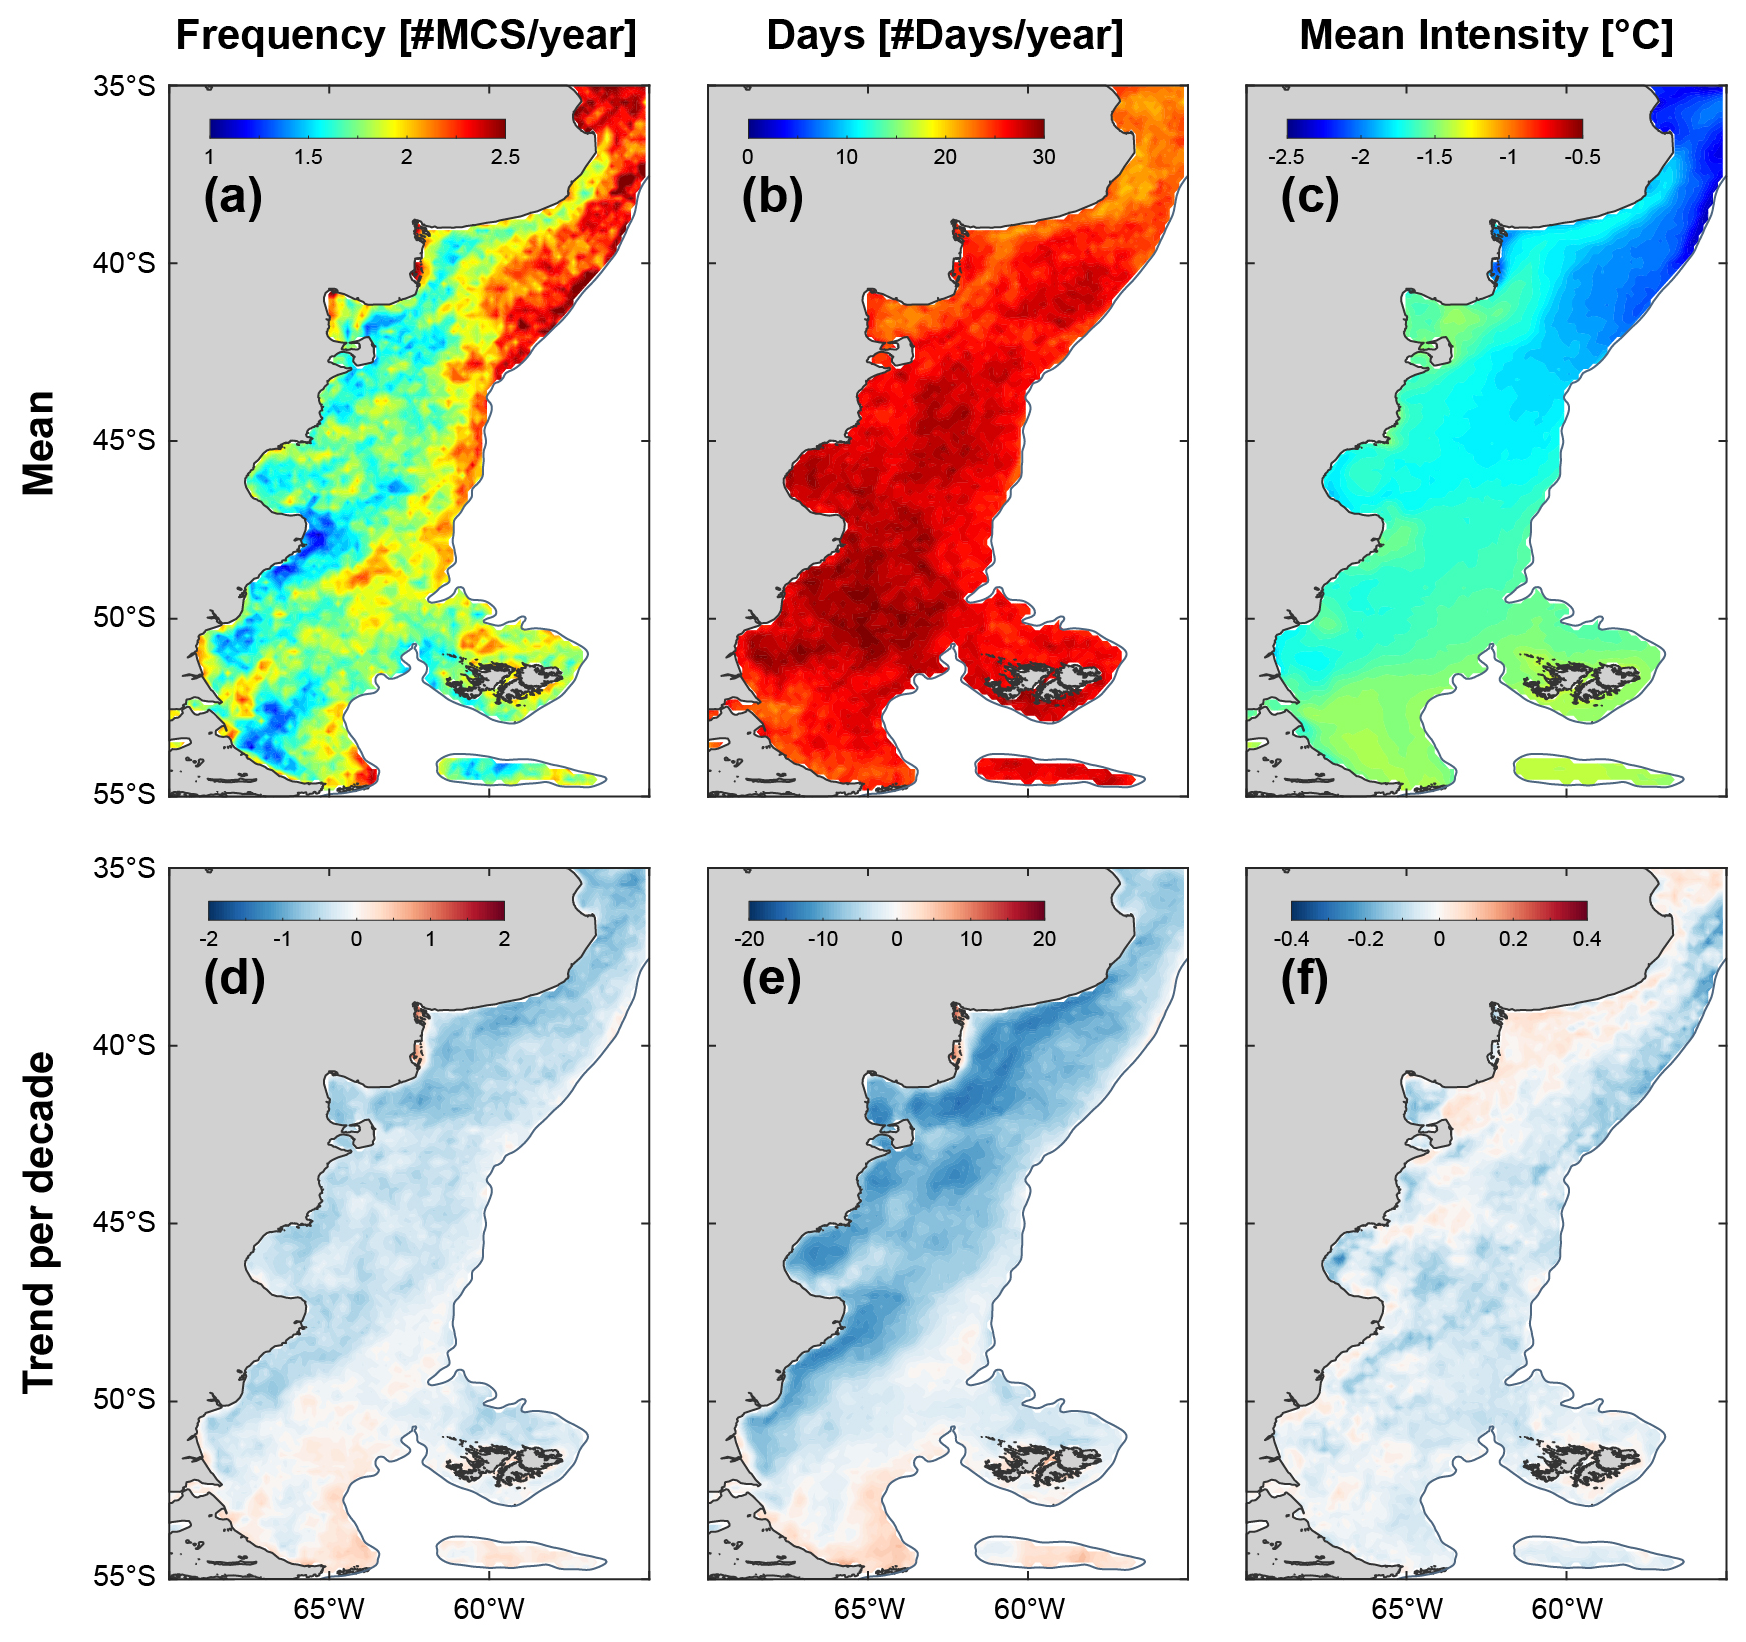
Figure C1Marine Cold Spells in the Patagonian Continental Shelf. Mean frequency (a), number of days (b), intensity (c); trend per decade of frequency (d), number of days (e), intensity (f).
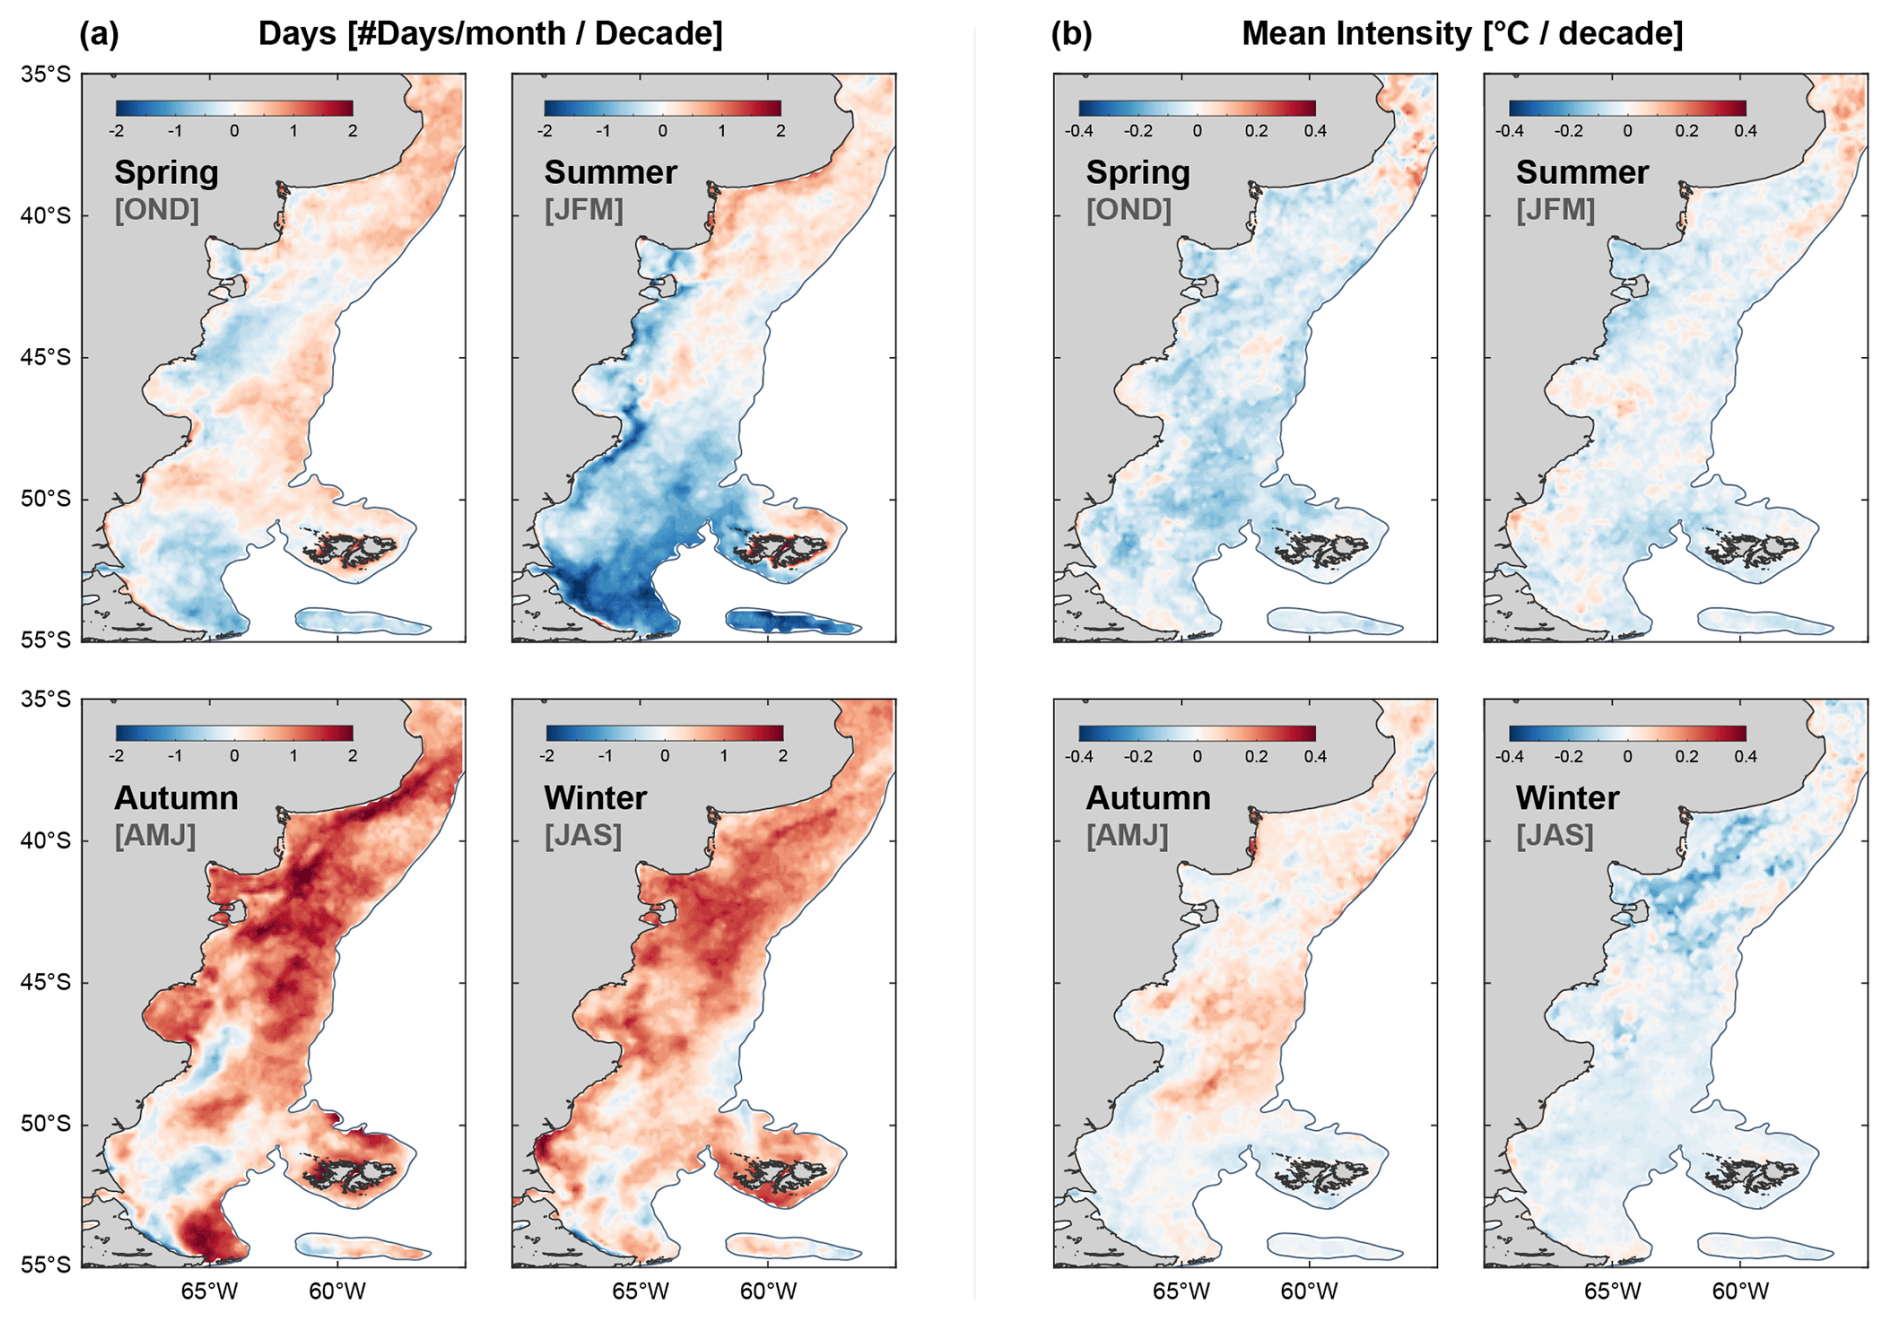
Figure D1Seasonal Marine Heatwaves trends in number of days per month per decade and mean intensity (°C per decade).
All raw data can be provided by the corresponding authors upon request.
ALD and VC conceptualized the manuscript. VC performed the data curation and developed the methodology. ALD and VC conducted the formal analysis. ALD and GB acquired the funding. ALD wrote the original draft. ALD, VC and GB reviewed and edited the manuscript.
The contact author has declared that none of the authors has any competing interests.
Publisher's note: Copernicus Publications remains neutral with regard to jurisdictional claims made in the text, published maps, institutional affiliations, or any other geographical representation in this paper. The authors bear the ultimate responsibility for providing appropriate place names. Views expressed in the text are those of the authors and do not necessarily reflect the views of the publisher.
. We thank the reviewers for their valuable and constructive comments and suggestions, which helped to improve this work.
The present research was carried out within the framework of the activities of the Spanish Government through the “María de Maeztu Centre of Excellence” accreditation to IMEDEA (CSIC-UIB) (CEX2021-001198-M). Ana L. Delgado acknowledges funding 440 by an individual postdoctoral fellowship “Vicenç Mut” (PD/002/2022) from Govern de les Illes Balears and Fondo Social Europeo and MSCA-PF 2023 (AI-PHYTOCLIM) funded by the European Union. Vincent Combes acknowledges the support from the Spanish Ramón y Cajal Program (RYC2020-029306-I) through Grant AEI/UIB–10.13039/501100011033.
This paper was edited by Ismael Hernández-Carrasco and reviewed by two anonymous referees.
Amaya, D. J., Jacox, M. G., Alexander, M. A., Scott, J. D., Deser, C., Capotondi, A., and Phillips, A. S.: Bottom marine heatwaves along the continental shelves of North America, Nat. Commun., 14, 1038, https://doi.org/10.1038/s41467-023-36567-0, 2023.
Artana, C., Provost, C., Lellouche, J. M., Rio, M. H., Ferrari, R., and Sennéchael, N.: The Malvinas current at the confluence with the Brazil current: Inferences from 25 years of Mercator ocean reanalysis, J. Geophys. Res.-Oceans, 124, 7178–7200, https://doi.org/10.1029/2019JC015289, 2019.
Artana, C., Rodrigues, R. R., Fevrier, J., and Coll, M.: Characteristics and drivers of marine heatwaves in the western South Atlantic, Commun. Earth Environ., 5, 555, https://doi.org/10.1038/s43247-024-01726-8, 2024.
Barclay, V. M., Neill, S. P., and Angeloudis, A.: Tidal range resource of the Patagonian shelf, Renew. Energ., 209, 85–96, https://doi.org/10.1016/j.renene.2023.04.001, 2023.
Barrett, B. S., Garreaud, R., and Falvey, M.: Effect of the Andes Cordillera on precipitation from a midlatitude cold front, Mon. Weather Rev., 137, 3092–3109, https://doi.org/10.1175/2009MWR2881.1, 2009.
Bianchi, A. A., Bianucci, L., Piola, A. R., Pino, D. R., Schloss, I., Poisson, A., and Balestrini, C. F.: Vertical stratification and air-sea CO2 fluxes in the Patagonian shelf, J. Geophys. Res.-Oceans, 110, https://doi.org/10.1029/2004JC002488, 2005.
Bianchi, A. A., Pino, D. R., Perlender, H. G. I., Osiroff, A. P., Segura, V., Lutz, V., Clara, M. L., Balestrini, C. F., and Piola, A. R.: Annual balance and seasonal variability of sea-air CO2 fluxes in the Patagonia Sea: Their relationship with fronts and chlorophyll distribution, J. Geophys. Res.-Oceans, 114, https://doi.org/10.1029/2008JC004854, 2009.
Brauko, K. M. , Cabral, A., Costa, N. V., Hayden, J., Dias, C. E. P., Leite, E. S., Westphal, R. D., Mueller, C. M., Hall-Spencer, J. M., Rodrigues, R. R., Rörig, L. R., Pagliosa, P. R., Fonseca, A. L., Alarcon, O. E.,and Horta, P. A. A.: Marine heatwaves, sewage and eutrophication combine to trigger deoxygenation and biodiversity loss: a SW Atlantic case study, Front. Mar. Sci., 7, 590258, https://doi.org/10.3389/fmars.2020.590258, 2020.
Cai, W. J., McPhaden, M. J., Grimm, A. M., Rodrigues, R. R., Taschetto, A. S., Garreaud, R. D., Dewitte, B., Poveda, G., Ham, Y. G., Santoso, A., Ng, B., Anderson, W., Wang, G. J., Geng, T., Jo, H. S., Marengo, J. A., Alves, L. M., Osman, M., Li, S. J., Wu, L. X., Karamperidou, C., Takahashi, K., and Vera, C.: Climate impacts of the El Niño–southern oscillation on South America, Nat. Rev. Earth Environ., 1, 215–231, https://doi.org/10.1038/s43017-020-0040-3, 2020.
Carvalho, K. S., Smith, T. E., and Wang, S.: Bering Sea marine heatwaves: Patterns, trends and connections with the Arctic, J. Hydrol., 600, 126462, https://doi.org/10.1016/j.jhydrol.2021.126462, 2021.
Cavole, L. M., Demko, A. M., Diner, R. E., Giddings, A., Koester, I., Pagniello, C. M. L. S., Paulsen, M.-L., Ramirez-Valdez, A., Schwenck, S. M., Yen, N. K., Zill, M. E., and Franks, P. J. S.: Biological impacts of the 2013–2015 warm-water anomaly in the Northeast Pacific: winners, losers, and the future, Oceanography, 29, 273–285, https://doi.org/10.5670/oceanog.2016.32, 2016.
Chen, M., Chen, G., and Chu, X.: Intraseasonal oscillations modulate spring marine heatwaves in the northern South China Sea, J. Geophys. Res.-Oceans, 130, e2025JC022374, https://doi.org/10.1029/2025JC022374, 2025.
Cheung, W. W. and Frölicher, T. L.: Marine heatwaves exacerbate climate change impacts for fisheries in the northeast Pacific, Sci. Rep.-UK, 10, 6678, https://doi.org/10.1038/s41598-020-63650-z, 2020.
Chiswell, S. M.: Global trends in marine heatwaves and cold spells: the impacts of fixed versus changing baselines, J. Geophys. Res.-Oceans, 127, e2022JC018757, https://doi.org/10.1029/2022JC018757, 2022.
Coronato, F. R.: Geographical singularities of the Patagonian climate, in: Lizards of Patagonia: Diversity, Systematics, Biogeography and Biology of the Reptiles at the End of the World, edited by: Morando, M. and Avila, L. J., Springer, Berlin, Heidelberg, Germany, 43–58, https://doi.org/10.1007/978-3-030-42752-8, 2020.
Dai, A. and Trenberth, K. E.: Estimates of freshwater discharge from continents: latitudinal and seasonal variations, J. Hydrometeorol., 3, 660–687, https://doi.org/10.1175/1525-7541(2002)003<0660:EOFDFC>2.0.CO;2, 2002.
de Boisséson, E. and Balmaseda, M. A.: Predictability of marine heatwaves: assessment based on the ECMWF seasonal forecast system, Ocean Sci., 20, 265–278, https://doi.org/10.5194/os-20-265-2024, 2024.
Delgado, A. L., Hernández-Carrasco, I., Combes, V., Font-Muñoz, J., Pratolongo, P. D., and Basterretxea, G.: Patterns and trends in chlorophyll a concentration and phytoplankton phenology in the biogeographical regions of Southwestern Atlantic, J. Geophys. Res.-Oceans, 128, e2023JC019865, https://doi.org/10.1029/2023JC019865, 2023.
Dinapoli, M. G. and Simionato, C. G.: Study of the tidal dynamics in the Southwestern Atlantic Continental Shelf based on data assimilation, Ocean Model., 188, 102332, https://doi.org/10.1016/j.ocemod.2024.102332, 2024.
Embury, O., Merchant, C. J., Good, S. A., Rayner, N. A., Høyer, J. L., Atkinson, C., Block, T., Alerskans, E., Pearson, K. J., Worsfold, M., McCarroll, N., and Donlon, C.: Satellite-based time-series of sea-surface temperature since 1980 for climate applications, Sci. Data, 11, 326, https://doi.org/10.1038/s41597-024-03147-w, 2024.
Enfield, D. B.: Evolution and historical perspective of the 1997–1998 El Niño–Southern Oscillation event, B. Mar. Sci., 69, 7–25, 2001.
Falvey, M. and Garreaud, R.: Wintertime precipitation episodes in central Chile: Associated meteorological conditions and orographic influences, J. Hydrometeorol., 8, 171–193, https://doi.org/10.1175/JHM562.1, 2007.
FAO: The State of Food and Agriculture 2020. Overcoming water challenges in agriculture, Food and Agriculture Organization of the United Nations, https://doi.org/10.4060/cb1447en, 2020.
Fernández-Álvarez, B., Barceló-Llull, B., and Pascual, A.: Tracking marine heatwaves in the Balearic Sea: temperature trends and the role of detection methods, Ocean Sci., 21, 1987–1999, https://doi.org/10.5194/os-21-1987-2025, 2025.
Franco, B. C., Combes, V., and González Carman, V.: Subsurface ocean warming hotspots and potential impacts on marine species: the southwest South Atlantic Ocean case study, Front. Mar. Sci., 7, 563394, https://doi.org/10.3389/fmars.2020.563394, 2020.
Frölicher, T. L., Fischer, E. M., and Gruber, N.: Marine heatwaves under global warming, Nature, 560, 360–364, https://doi.org/10.1038/s41586-018-0383-9, 2018.
García, V. M., Garcia, C. A., Mata, M. M., Pollery, R. C., Piola, A. R., Signorini, S. R., McClain, C. R., and Iglesias-Rodriguez, M. D.: Environmental factors controlling the phytoplankton blooms at the Patagonia shelf-break in spring, Deep-Sea Res. Pt. I, 55, 1150–1166, https://doi.org/10.1016/j.dsr.2008.04.011, 2008.
Genevier, L. G. C., Jamil, T., Raitsos, D. E., Krokos, G., and Hoteit, I.: Marine heatwaves reveal coral reef zones susceptible to bleaching in the Red Sea, Global Change Biol., 25, 2338–2351, https://doi.org/10.1111/gcb.14652, 2019.
Geng, T., Jia, F., Cai, W., Wu, L., Gan, B., Jing, Z., Li, S., and McPhaden, M. J.: Increased occurrences of consecutive La Niña events under global warming, Nature, 619, 774–781, https://doi.org/10.1038/s41586-023-06236-9, 2023.
Giménez, L., Boersma, M., and Wiltshire, K. H.: A multiple baseline approach for marine heatwaves, Limnol. Oceanogr., 69, 638–651, https://doi.org/10.1002/lno.12521, 2024.
Glorioso, P. D.: Temperature distribution related to shelf-sea fronts on the Patagonian Shelf, Cont. Shelf Res., 7, 27–34, https://doi.org/10.1016/0278-4343(87)90061-6, 1987.
Glorioso, P. D. and Flather, R. A.: The Patagonian shelf tides, Prog. Oceanogr., 40, 263–283, https://doi.org/10.1016/S0079-6611(98)00004-4, 1997.
Good, S., Fiedler, E., Mao, C., Martin, M. J., Maycock, A., Reid, R., Roberts-Jones, J., Searle, T., Waters, J., While, J., and Worsfold, M.: The Current Configuration of the OSTIA System for Operational Production of Foundation Sea Surface Temperature and Ice Concentration Analyses, Remote Sens.-Basel, 12, 720, https://doi.org/10.3390/rs12040720, 2020.
Gordon, A. L.: Brazil-malvinas confluence–1984, Deep-Sea Res. Pt. I, 36, 359–384, https://doi.org/10.1016/0198-0149(89)90042-3, 1989.
Gordon, A. L. and Greengrove, C. L.: Geostrophic circulation of the Brazil-Falkland confluence, Deep-Sea Res. Pt. I, 33, 573–585, https://doi.org/10.1016/0198-0149(86)90054-3, 1986.
Gregory, C. H., Artana, C., Lama, S., León-FonFay, D., Sala, J., Xiao, F., and Holbrook, N. J.: Global marine heatwaves under different flavors of ENSO, Geophys. Res. Lett., 51, e2024GL110399, https://doi.org/10.1029/2024GL110399, 2024.
Heidemann, H. and Ribbe, J.: Marine heat waves and the influence of El Niño off Southeast Queensland, Australia, Front. Mar. Sci., 6, 56, https://doi.org/10.3389/fmars.2019.00056, 2019.
Hersbach, H., Bell, B., Berrisford, P., Biavati, G., Horányi, A., Muñoz Sabater, J., Nicolas, J., Peubey, C., Radu, R., Rozum, I., Schepers, D., Simmons, A., Soci, C., Dee, D., and Thépaut, J-N.: ERA5-hourly data on single levels from 1940 to present, Copernicus Climate Change Service (C3S) Climate Data Store (CDS), https://doi.org/10.24381/cds.adbb2d47, 2023.
Hobday, A. J. and Pecl, G. T.: Identification of global marine hotspots: sentinels for change and vanguards for adaptation action, Rev. Fish Biol. Fish., 24, 415–425, https://doi.org/10.1007/s11160-013-9326-6, 2014.
Hobday, A. J., Alexander, L. V., Perkins, S. E., Smale, D. A., Straub, S. C., Oliver, E. C. J., Benthuysen, J. A., Burrows, M. T., Donat, M. G., Feng, M., Holbrook, N. J., Moore, P. J., Scannell, H. A., Sen Gupta, A., and Wernberg, T.: A hierarchical approach to defining marine heatwaves, Prog. Oceanogr., 141, 227–238, https://doi.org/10.1016/j.pocean.2015.12.014, 2016.
Hobday, A. J., Oliver, E. C. J., Sen Gupta, A., Benthuysen, J. A., Burrows, M. T., Donat, M. G., Holbrook, N. J., Moore, P. J., Thomsen, M. S., Wernberg, T., and Smale, D. A.: Categorizing and naming marine heatwaves, Oceanography, 31, 162–173, https://doi.org/10.5670/oceanog.2018.205, 2018.
Holbrook, N. J., Scannell, H. A., Sen Gupta, A., Benthuysen, J. A., Feng, M., Oliver, E. C., Alexander, L. V., Burrows, M. T., Donat, M. G., Hobday, A. J., Moore, P. J., Perkins-Kirkpatrick, S. E., Smale, D. A., Straub, S. C., and Wernberg, T.: A global assessment of marine heatwaves and their drivers, Nat. Commun., 10, 2624, https://doi.org/10.1038/s41467-019-10206-z, 2019.
Hu, S., Zhang, L., and Qian, S.: Marine heatwaves in the Arctic region: Variation in different ice covers, Geophys. Res. Lett., 47, e2020GL089329, https://doi.org/10.1029/2020GL089329, 2020.
Huang, B., Liu, C., Banzon, V., Freeman, E., Graham, G., Hankins, B., Smith, T., and Zhang, H.-M.: Improvements of the Daily Optimum Interpolation Sea Surface Temperature (DOISST) Version 2.1, J. Climate, 34, 2923–2939, https://doi.org/10.1175/JCLI-D-20-0166.1, 2021.
IPCC: Climate Change 2021: The Physical Science Basis. Contribution of Working Group I to the Sixth Assessment Report of the Intergovernmental Panel on Climate Change, edited by: Masson-Delmotte, V., Zhai, P., Pirani, A., Connors, S. L., Péan, C., Berger, S., Caud, N., Chen, Y., Goldfarb, L., Gomis, M. I., Huang, M., Leitzell, K., Lonnoy, E., Matthews, J. B. R., Maycock, T. K., Waterfield, T., Yelekçi, O., Yu, R., and Zhou, B., Cambridge University Press, Cambridge, United Kingdom and New York, NY, USA, https://doi.org/10.1017/9781009157896, 2021.
Kahl, L. C., Bianchi, A. A., Osiroff, A. P., Pino, D. R., and Piola, A. R.: Distribution of sea-air CO2 fluxes in the Patagonian Sea: Seasonal, biological and thermal effects, Cont. Shelf Res., 143, 18–28, https://doi.org/10.1016/j.csr.2017.05.011, 2017.
Kantha, L. H., Tierney, C., Lopez, J. W., Desai, S. D., Parke, M. E., and Drexler, L.: Barotropic tides in the global ocean from a nonlinear tidal model assimilating altimetric tides: 2. Altimetric and geophysical implications, J. Geophys. Res., 100, 25309–25317, https://doi.org/10.1029/95JC02578, 1995.
Konsta, K., Doxa, A., Katsanevakis, S., and Mazaris, A. D.: Projected marine heatwaves over the Mediterranean Sea and the network of marine protected areas: a three-dimensional assessment, Climatic Change, 178, 17, https://doi.org/10.1007/s10584-025-03860-4, 2025.
Leyba, I. M., Solman, S. A., and Saraceno, M.: Trends in sea surface temperature and air–sea heat fluxes over the South Atlantic Ocean, Clim. Dynam., 53, 4141–4153, https://doi.org/10.1007/s00382-019-04777-2, 2019.
Liu, K., Xu, K., Zhu, C., and Liu, B.: Diversity of marine heatwaves in the South China Sea regulated by ENSO phase, J. Climate, 35, 877–893, https://doi.org/10.1175/JCLI-D-21-0309.1, 2022.
Lutz, V. A., Segura, V., Dogliotti, A. I., Gagliardini, D. A., Bianchi, A. A., and Balestrini, C. F.: Primary production in the Argentine Sea during spring estimated by field and satellite models, J. Plankton Res., 32, 181–195, https://doi.org/10.1093/plankt/fbp117, 2010.
Ma, X. and Chen, G.: Marine heatwaves are shaping the vertical structure of phytoplankton in the global ocean, Commun. Earth Environ., 6, 715, https://doi.org/10.1038/s43247-025-02718-y, 2025.
Manta, G., De Mello, S., Trinchin, R., Badagian, J., and Barreiro, M.: The 2017 record marine heatwave in the southwestern Atlantic shelf, Geophys. Res. Lett., 45, 449–456, https://doi.org/10.1029/2018GL081070, 2018.
Matano, R. P. and Philander, S. G. H.: Heat and mass balances of the South Atlantic Ocean calculated from a numerical model, J. Geophys. Res., 98, 977–984, https://doi.org/10.1029/92jc01899, 1993.
Matano, R. P., Palma, E. D., and Piola, A. R.: The influence of the Brazil and Malvinas Currents on the Southwestern Atlantic Shelf circulation, Ocean Sci., 6, 983–995, https://doi.org/10.5194/os-6-983-2010, 2010.
Mignot, A., Von Schuckmann, K., Landschützer, P., Gasparin, F., van Gennip, S., Perruche, C., Lamouroux, J., and Amm, T.: Decrease in air-sea CO2 fluxes caused by persistent marine heatwaves, Nat. Commun., 13, 4300, https://doi.org/10.1038/s41467-022-31983-0, 2022.
Oliver, E. C., Benthuysen, J. A., Bindoff, N. L., Hobday, A. J., Holbrook, N. J., Mundy, C. N., and Perkins-Kirkpatrick, S. E.: The unprecedented 2015/16 Tasman Sea marine heatwave, Nat. Commun., 8, 16101, https://doi.org/10.1038/ncomms16101, 2017.
Oliver, E. C. J.: Mean warming not variability drives marine heatwave trends, Clim. Dynam., 53, 1653–1659, https://doi.org/10.1007/s00382-019-04707-2, 2019.
Oliver, E. C. J., Donat, M. G., Burrows, M. T., Moore, P. J., Smale, D. A., Alexander, L. V., Benthuysen, J. A., Feng, M., Sen Gupta, A., Hobday, A. J., Holbrook, N. J., Perkins-Kirkpatrick, S. E., Scannell, H. A., Straub, S. C., and Wernberg, T.: Longer and more frequent marine heatwaves over the past century, Nat. Commun., 9, 1324, https://doi.org/10.1038/s41467-018-03732-9, 2018.
Oliver, E. C. J., Benthuysen, J. A., Darmaraki, S., Donat, M. G., Hobday, A. J., Holbrook, N. J., Schlegel, R. W., and Sen Gupta, A.: Marine Heatwaves, Annu. Rev. Mar. Sci., 13, 313–342, https://doi.org/10.1146/annurev-marine-032720-095144, 2021.
Olson, D. B., Podestá, G. P., Evans, R. H., and Brown, O. B.: Temporal variations in the separation of Brazil and Malvinas Currents, Deep-Sea Res. Pt. I, 35, 1971–1990, https://doi.org/10.1016/0198-0149(88)90120-3, 1988.
Palma, E. D., Matano, R. P., and Piola, A. R.: A numerical study of the Southwestern Atlantic Shelf circulation: barotropic response to tidal and wind forcing, J. Geophys. Res.-Oceans, 109, C08014, https://doi.org/10.1029/2004JC002315, 2004.
Parker, G., Paterlini, M. C., and Violante, R. A.: El fondo marino, in El Mar Argentino y sus Recursos Pesqueros, Antecedentes Históricos de las Exploraciones en el Mar y las Características Ambientales, vol. 1, 65–87, Inst. Nac. Invest. Desarrollo Pesquero, Mar del Plata, Argentina, ISBN 9879624408, 1997.
Piola, A. R. and Rivas, A. L.: Corrientes en la Plataforma Continental, in El Mar Argentino y sus Recursos Pesqueros, Antecedentes Históricos de las Exploraciones en el Mar y las Características Ambientales, vol. 1, Inst. Nac. Invest. Desarrollo Pesquero, Mar del Plata, Argentina, 119–132, https://www.researchgate.net/profile/Alberto-Piola/publication/277195950_Corrientes_en_la_plataforma_continental/links/5742ff9108ae9ace8418b8a6/Corrientes-en-la-plataforma-continental.pdf (last access: 18 March 2026), 1997.
Rigual-Hernández, A. S., Leventer, A., Fernández-Barba, M., Flores, J. A., Navarro, G., Etourneau, J., Evangelinos, D., Duffy, M., Escutia, C., Bohoyo, F., Sánchez-Santos, J. M., Sabourdy, M., Jiménez-Espejo, F. J., and Bárcena, M. A.: Response of phytoplankton communities to the onset of the 2020 summer marine heatwave in the Drake Passage and Antarctic Peninsula, Biogeosciences, 22, 7205–7232, https://doi.org/10.5194/bg-22-7205-2025, 2025.
Risaro, D. B., Chidichimo, M. P., and Piola, A. R.: Interannual variability and trends of sea surface temperature around southern South America, Front. Mar. Sci., 9, 829144, https://doi.org/10.3389/fmars.2022.829144, 2022.
Rivas, A. L.: Current-meter observations in the Argentine continental shelf, Cont. Shelf Res., 17, 391–406, https://doi.org/10.1016/S0278-4343(96)00039-8, 1997.
Rodrigues, R. R., Campos, E. J., and Haarsma, R.: The impact of ENSO on the South Atlantic subtropical dipole mode, J. Climate, 28, 2691–2705, https://doi.org/10.1175/JCLI-D-14-00483.1, 2015.
Rosselló, P., Pascual, A., and Combes, V.: Assessing marine heat waves in the Mediterranean Sea: a comparison of fixed and moving baseline methods, Front. Mar. Sci., 10, 1168368, https://doi.org/10.3389/fmars.2023.1168368, 2023.
Samhouri, J. F., Feist, B. E., Fisher, M. C., Liu, O.,Woodman, S. M., Abrahms, B., Forney, K. A., Hazen, E. L., Lawson, D., Redfern, J., and Saez, L. E.: Marine heatwave challenges solutions to human–wildlife conflict, P. Roy. Soc. Lond. B Bio., 288, 20211607, https://doi.org/10.1098/rspb.2021.1607, 2021.
Saraceno, M., Martín, J., Moreira, D., Pisoni, J. P., and Tonini, M. H.: Physical changes in the Patagonian shelf, in: Global Change in Atlantic Coastal Patagonian Ecosystems: A Journey Through Time, edited by: Helbling, E. W., Narvarte, M. A., González, R. A., and Villafañe, V. E., Springer, Berlin, Heidelberg, Germany, 43–71, https://doi.org/10.1007/978-3-030-86676-1, 2022.
Schlegel, R. W., Darmaraki, S., Benthuysen, J. A., Filbee-Dexter, K., and Oliver, E. C.: Marine cold-spells, Prog. Oceanogr., 198, 102684, https://doi.org/10.1016/j.pocean.2021.102684, 2021.
Sen Gupta, A., Ryan, S., and Hernaman, V.: Advances in marine heatwave interactions, Front. Clim., 5, 1177781, https://doi.org/10.3389/fclim.2023.1177781, 2023.
Smale, D. A., Wernberg, T., Oliver, E. C. J., Thomsen, M., Harvey, B. P., Straub, S. C., Burrows, M. T., Alexander, L. V., Benthuysen, J. A., Donat, M. G., Feng, M., Hobday, A. J., Holbrook, N. J., Perkins-Kirkpatrick, S. E., Scannell, H. A., Sen Gupta, A., Payne, B. L., and Moore, P. J.: Marine heatwaves threaten global biodiversity and the provision of ecosystem services, Nat. Clim. Change, 9, 306–312, https://doi.org/10.1038/s41558-019-0412-1, 2019.
Smith, K. E., Gupta, A. S., Amaya, D., Benthuysen, J. A., Burrows, M. T., Capotondi, A., Filbee-Dexter, K., Frölicher, T. L., Hobday, A. J., Holbrook, N. J., Malan, N., Moore, P. J., Oliver, E. C. J., Richaud, B., Salcedo-Castro, J., Smale, D. A., Thomsen, M., and Wernberg, T.: Baseline matters: Challenges and implications of different marine heatwave baselines, Prog. Oceanogr., 231, 103404, https://doi.org/10.1016/j.pocean.2024.103404, 2025.
Suryan, R. M., Arimitsu, M. L., Coletti, H. A., Hopcroft, R. R., Lindeberg, M. R., Barbeaux, S. J., Batten, S. D., Burt, W. J., Bishop, M. A., Bodkin, J. L., Brenner, R., Campbell, R. W., Cushing, D. A., Danielson, S. L., Dorn, M. W., Drummond, B., Esler, D., Gelatt, T., Hanselman, D. H., Hatch, S. A., Haught, S., Holderied, K., Iken, K., Irons, D. B., Kettle, A. B., Kimmel, D. G., Konar, B., Kuletz, K. J., Laurel, B. J., Maniscalco, J. M., Matkin, C., McKinstry, C. A. E., Monson, D. H., Moran, J. R., Olsen, D., Palsson, W. A., Pegau, W. S., Piatt, J. F., Rogers, L. A., Rojek, N. A., Schaefer, A., Spies, I. B., Straley, J. M., Strom, S. L., Sweeney, K. L., Szymkowiak, M., Weitzman, B. P., Yasumiishi, E. M., and Zador, S. G.: Ecosystem response persists after a prolonged marine heatwave, Sci. Rep.-UK, 11, 6235, https://doi.org/10.1038/s41598-021-83818-5, 2021.
Tinker, J., Polton, J. A., Robins, P. E., Lewis, M. J., and O'Neill, C. K.: The influence of tides on the North West European shelf winter residual circulation, Front. Mar. Sci., 9, 847138, https://doi.org/10.3389/fmars.2022.847138, 2022.
Trenberth, K. E.: Climate diagnostics from global analyses: Conservation of mass in ECMWF analyses, J. Climate, 4, 707–722, https://doi.org/10.1175/1520-0442(1991)004<0707:cdfgac>2.0.co;2, 1991.
Viale, M., Houze Jr., R. A., and Rasmussen, K. L.: Upstream orographic enhancement of a narrow cold-frontal rainband approaching the Andes, Mon. Weather Rev., 141, 1708–1730, https://doi.org/10.1175/MWR-D-12-00138.1, 2013.
Villalba, R., Lara, A., Boninsegna, J. A., Masiokas, M., Delgado, S., Aravena, J. C., Roig, F. A., Schmelter, A., Wolodarsky, A., and Ripalta, A.: Large-scale temperature changes across the southern Andes: 20th-century variations in the context of the past 400 years, Climatic Change, 59, 177–232, https://doi.org/10.1023/A:1024452701153, 2003.
Wang, Y. and Zhou, Y.: Seasonal dynamics of global marine heatwaves over the last four decades, Front. Mar. Sci., 11, 1406416, https://doi.org/10.3389/fmars.2024.1406416, 2024.
Webster, P. J. and Palmer, T. N.: The past and the future of El Niño, Nature, 390, 562–564, https://doi.org/10.1038/37499, 1997.
- Abstract
- Introduction
- Materials and methods
- Results and discussion
- Summary and future perspectives
- Appendix A: Mean sea surface temperature in the southwestern Atlantic Ocean
- Appendix B: Comparison of marine heatwave detection methods in the southwestern Atlantic
- Appendix C: Marine cold spells in the Patagonian Shelf
- Appendix D: Marine heatwaves seasonal trends in the Patagonian Shelf
- Data availability
- Author contributions
- Competing interests
- Disclaimer
- Acknowledgements
- Financial support
- Review statement
- References