the Creative Commons Attribution 4.0 License.
the Creative Commons Attribution 4.0 License.
 | 23 Feb 2026
Mesoscale variability and water mass transport of the Caribbean Current revealed by high-resolution glider observations
Joseph C. Gradone
William D. Wilson
Scott M. Glenn
Leah N. Hopson
Travis N. Miles
The Caribbean Through-Flow (CTF) provides a key pathway linking the North Atlantic Subtropical Gyre and the upper limb of the Atlantic Meridional Overturning Circulation. Yet, its internal structure and variability remain poorly resolved. Autonomous underwater gliders offer a unique capability to address this gap by collecting high-resolution hydrographic and velocity observations in regions where sampling is sparse. Here, data from a glider that operated for >90 d along 69° W in summer 2024 were analyzed to investigate mesoscale-driven variability in the CTF. Two consecutive occupations of this ∼600 km trans-Caribbean section revealed a sharp decline in zonal transport from −17.64 to −9.22 Sv, coinciding with a shift in mesoscale activity. Magnitude and variability in the vertical shear of the subsurface currents and dynamic height anomaly calculations from the glider data showed a shift from flow largely in geostrophic balance during Transect #1 to increased mesoscale influence during Transect #2. Satellite altimetry spanning the full deployment suggested this shift was driven by a cyclonic eddy that passed through the northern half of the section between the timing of the two transects. Despite the large changes in transport between transect occupations, water mass analysis showed that the relative contributions from North and South Atlantic water masses remained nearly constant. Direct sampling of an anticyclonic eddy during a partial Transect #3 revealed strong temperature and salinity anomalies in the upper 200 m. These findings highlight how glider observations can resolve key features and processes governing variability in this critical inter-basin pathway and improve understanding of mesoscale influences on large-scale circulation.
- Article
(7851 KB) - Full-text XML
-
Supplement
(405 KB) - BibTeX
- EndNote


Western boundary currents (WBCs) are critical components of the global climate system, facilitating the poleward transport of heat, salt, tracers, and momentum. In the western tropical Atlantic, the Caribbean Through-Flow (CTF), composed largely of the Caribbean Current, represents a major upper-ocean conduit linking the North Atlantic Subtropical Gyre and the upper limb of the Atlantic Meridional Overturning Circulation (AMOC). The CTF exports upper-layer waters through the Yucatan Straits, supplying the Florida Current and, subsequently, the Gulf Stream (Johns et al., 2002; Rhein et al., 2005; Gradone et al., 2025b). As such, the Caribbean Sea constitutes a critical chokepoint for transforming and redistributing water masses, influencing interhemispheric circulation.
Despite its importance, the structure and variability of the CTF remain insufficiently resolved, particularly in the subsurface. Mesoscale features and processes, such as eddies, jets, and countercurrents, likely play a substantial role in modulating transport and mixing but are poorly captured by traditional observing systems. The A22 section along 66° W in the Caribbean has been occupied four times from 1997 to 2021 by several different hydrographic programs, including WOCE (World Ocean Circulation Experiment), CLIVAR (Climate Variability and Predictability), and GO-SHIP (Global Ocean Ship-based Hydrographic Investigations Program). While these programs have improved understanding of large-scale circulation, the station spacing ranging from 25–50 km (Menezes, 2022) is insufficient to resolve mesoscale features, which typically exhibit scales of 10–100 km.
Autonomous underwater gliders now offer the capability to resolve oceanic processes at much finer spatial and temporal resolution, with sampling scales on the order of 2 km horizontal and 1 m vertically. These platforms have proven particularly effective in the Caribbean, where mesoscale eddies are known to introduce both transient and persistent variability in the current structure (Gradone et al., 2023). While observing systems like Argo have enabled the detection of large-scale water mass changes in the CTF (Gradone et al., 2025b), the limited spatial and temporal coverage of subsurface velocity measurements makes it difficult to assess corresponding changes in volumetric transport. Near 69° W, observations suggest the Caribbean Current ranges from −13.7 to −26.3 Sv (; negative indicates westward/southward transport, while positive indicates eastward/northward transport) (Johns et al., 2002; Casanova-Masjoan et al., 2018), a discrepancy as large as the lower transport estimate itself. The Caribbean Current is the main conduit for the waters exiting the Caribbean through the Yucatan Straits northward into the Gulf of Mexico. With an estimated northward transport of 30 Sv exiting the Yucatan Straits (Rousset and Beal, 2014), the Caribbean Current must be augmented by an additional westward transport of 6–9 Sv from the Windward Passage (Fig. 1) (Wunsch and Grant, 1982; Nelepo et al., 1978; Roemmich, 1981; Johns et al., 2002). The Yucatan Straits, therefore, provide a critical benchmark: they not only constrain the mass balance of the CTF but also supply 88 %–100 % of the source waters of the Florida Current (Rousset and Beal, 2014), linking Caribbean variability directly to the circulation of the greater Atlantic. Resolving the wide uncertainty in Caribbean Current transport (Johns et al., 2002; Casanova-Masjoan et al., 2018) is therefore essential for understanding the dynamics and variability of the CTF and its role in Atlantic circulation.
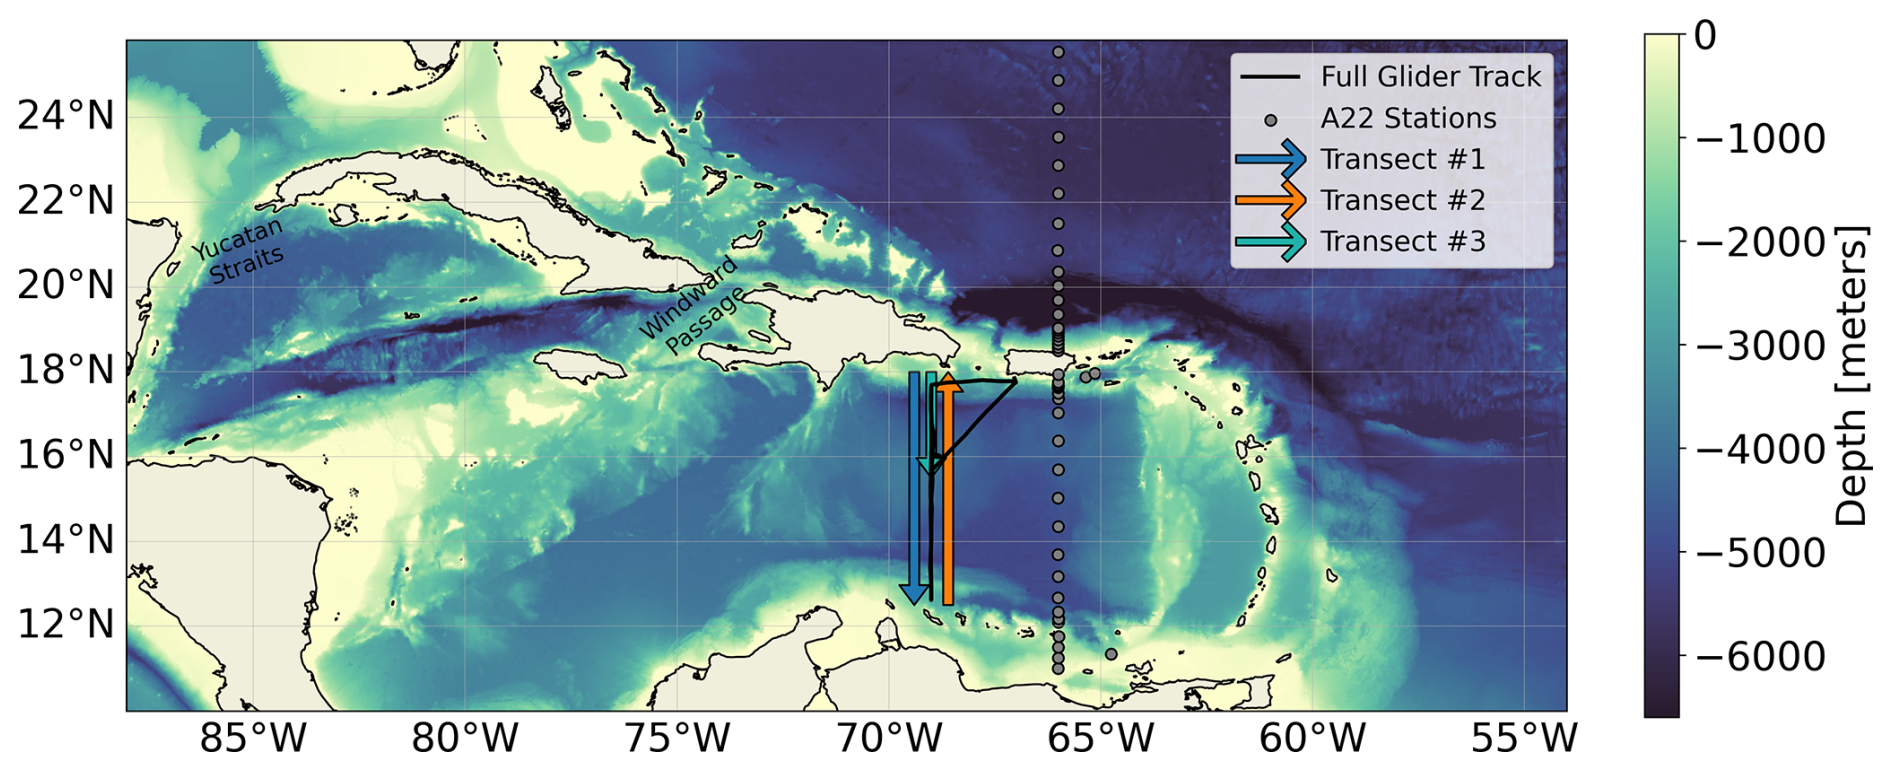
Figure 1Map of the Caribbean region with glider track in black, arrows indicating transect direction, and WOCE A22 stations as grey circles. Transect #1 (blue) and Transect #2 (orange) are offset from the half of Transect #3 (green) along −69° W for visualization. Bathymetry obtained from the National Oceanic and Atmospheric Administration's 30 arcsec ETOPO 2022 product. The A22 station locations are from the 1997 and 2003 cruises for consistency. The A22 station locations for the 2012 and 2021 cruises have a similar horizontal spacing but deviate from a purely meridional transect, complicating the comparison with the glider track.
In this study, high-resolution observations from an autonomous underwater glider were used to investigate the internal dynamics of the Caribbean Through-Flow near 69° W. Unlike traditional ship-based sampling along sections like A22, which lack the resolution to capture mesoscale features, this dataset provided detailed hydrography and subsurface velocity measurements at scales capable of resolving mesoscale-driven variability. First, the variability in zonal transport between repeat glider transects was quantified, and its sensitivity to mesoscale structure was assessed. Second, the relative contributions of North and South Atlantic water masses to the Caribbean Current transport were examined, and the consistency of these distributions under contrasting dynamical conditions was discussed. Finally, the influence of mesoscale eddies on current structure and water mass properties was explored by combining in situ measurements with satellite altimetry. These findings provide new insight into the internal dynamics of the Caribbean Current and underscore the necessity of resolving eddy-driven processes in both observational and modeling frameworks.
2.1 Autonomous underwater glider data
The observations used in this study were collected using a Teledyne Webb Research Slocum glider (Schofield et al., 2007). A deep (1000 m rated) second-generation Slocum glider (RU29) sampled an approximately 600 km transect along 69° W from the Dominican Republic to Curaçao, traveling over 2300 km (2.5 transects total, with each transect taking ∼3 weeks) over 95 d (Fig. 1). This glider was equipped with a Sea-Bird Scientific pumped conductivity, temperature, and depth (CTD) sensor and a 1 MHz Nortek AD2CP. The AD2CP is a four-beam acoustic current profiler configured to sample with 15 cells of 2 m vertical resolution, averaging four pings for 1 s every 5 s. The CTD data were sampled every 2 s throughout complete dives and climbs. Potential density (σθ, units: kg m−3, from here on: density) was calculated from conservative temperature (Θ, from here on: temperature) and absolute salinity (SA, from here on: salinity) measurements using the TEOS-10 standard from the Gibbs Sea Water (GSW) Python package (Roquet et al., 2015; Mcdougall et al., 2021). Individual dives and climbs were treated as separate profiles, and all hydrographic data were averaged into 2 m vertical depth bins. Dynamic height anomaly (DHA) was computed by vertically integrating the specific volume anomaly (δv) relative to 990 decibars by:
where g is the gravitational acceleration and p is the pressure derived from depth. The reference of 990 decibars was chosen for consistency with most glider profiles reaching at least this depth.
2.1.1 Transport from glider-mounted acoustic doppler profiler derived horizontal water velocity
Processing velocity measurements from glider-mounted current profilers involved a series of quality control and correction steps to ensure accurate estimates of ocean currents. The processing steps include quality control, mapping beam velocities to vertical bins relative to the glider, correcting for glider orientation to assign level true depths, performing a coordinate transformation from beam coordinates to East-North-Up (ENU), and deriving absolute horizontal water velocities through a least-squares linear inversion (Visbeck, 2002; Todd et al., 2017). The reader is referred to the methodology in Gradone et al. (2023) for the specifics of the processing steps performed in this analysis.
Absolute horizontal water velocities were interpolated onto a regular latitude–depth grid to enable spatially consistent comparison of velocity data along the two transects between the Dominican Republic and Curaçao. A constant longitude of 69.0° W was used for all grid points because glider movement was primarily north–south and east–west drift was minimal. The latitude grid was constructed with a uniform spacing of 6 km, chosen to include ∼2 glider profiles per bin based on the gliders' typical horizontal speed (∼1 km h−1) and segment length (∼3 km). At each depth level, E–W and N–S velocity observations were interpolated to this grid using 1D linear interpolation (Fig. 2). This gridding approach spatially smooths the velocity field while preserving large-scale structure. After gridding, transport for each glider segment (latitude bin) was calculated by multiplying the E–W velocity at each depth by the vertical bin thickness and the latitude bin length, then integrating over depth to obtain transport per segment in Sverdrups. These segment transports were subsequently summed along the entire transect to yield the total transport, with negative (positive) representing westward (eastward) transport.
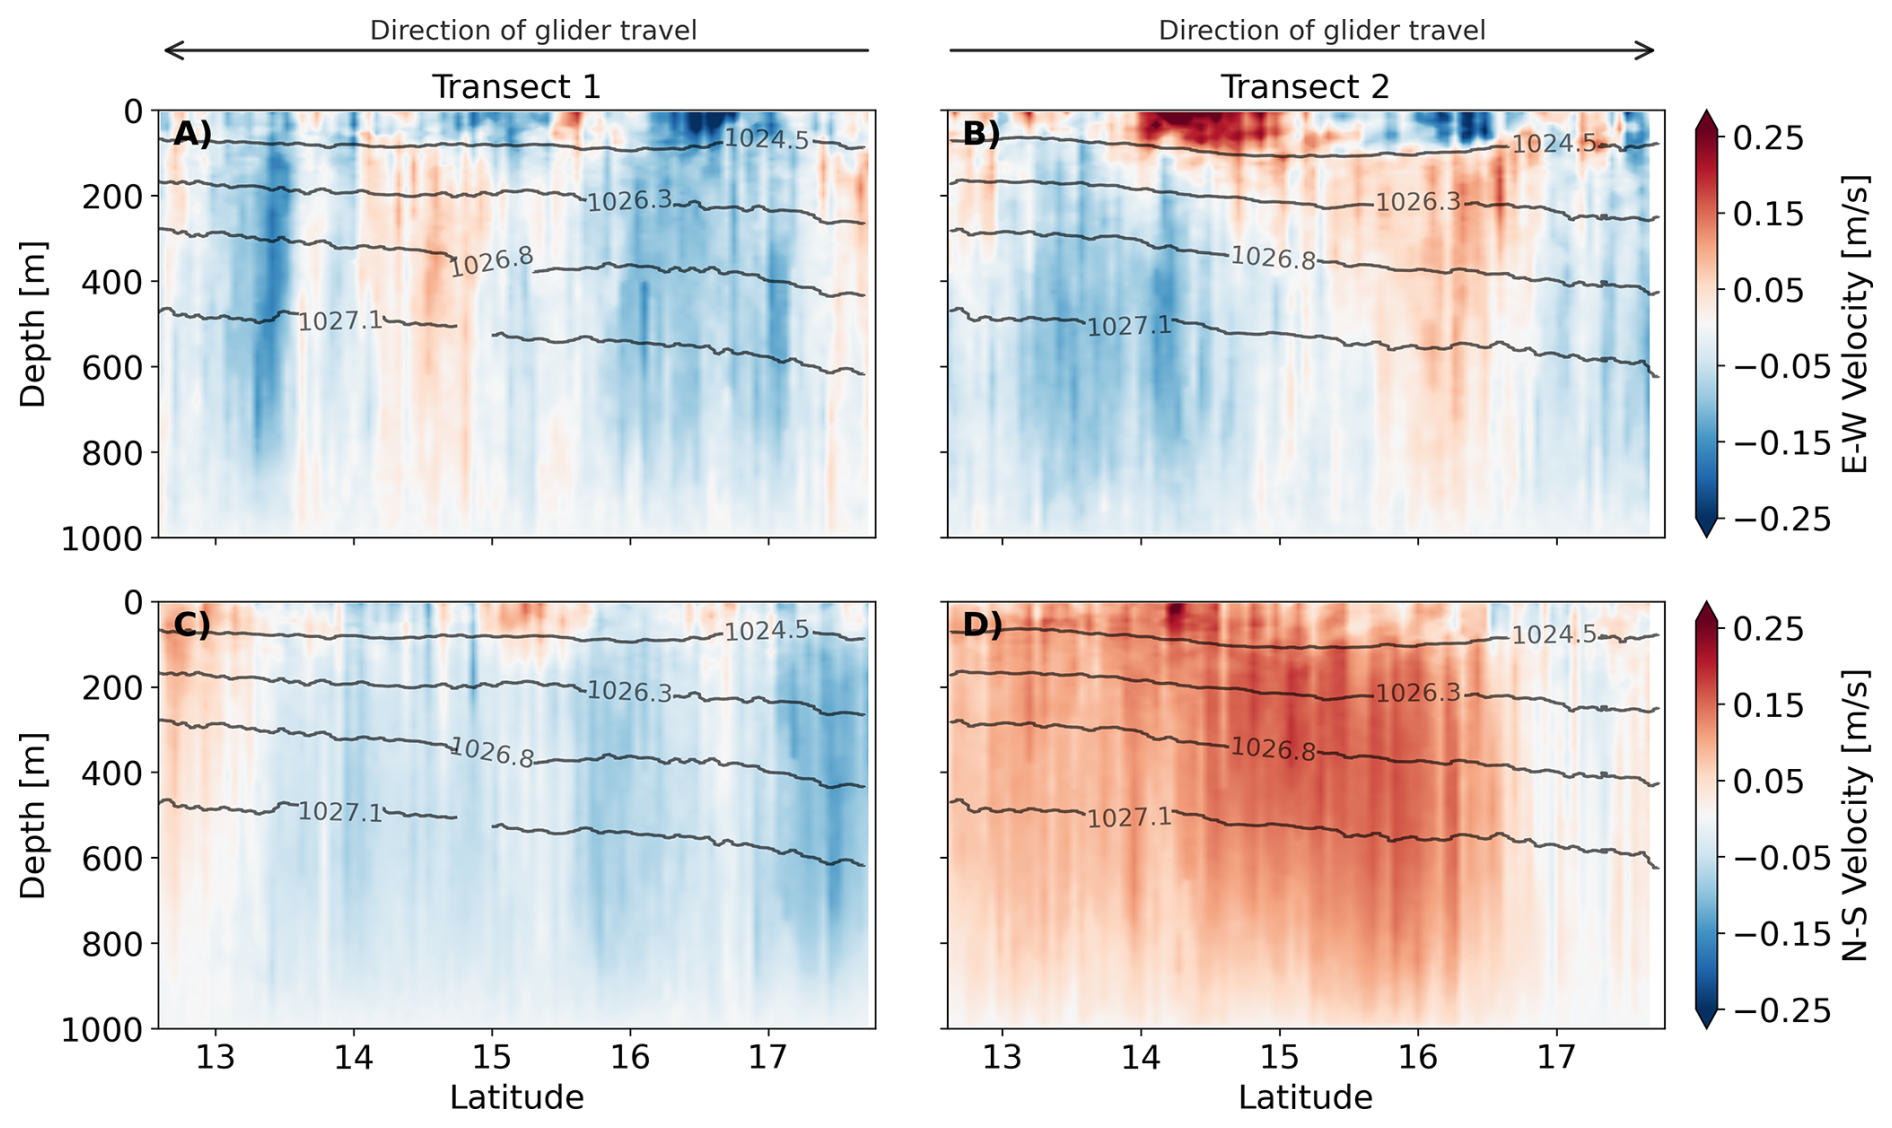
Figure 2E–W (top row) and N–S (bottom row) velocity derived from glider-mounted AD2CP from Transect #1 (A, C) and Transect #2 (B, D), contoured with isopycnals of used in the water mass analysis where surface waters are σθ<1024.5, salinity maximum waters are , upper central waters are , lower central waters are , and intermediate waters are (lower extent not shown). The direction of glider travel is indicated by arrows at the top of each column.
Depth-dependent velocity uncertainties were estimated from the inversion, with RMS values of O(0.05) m s−1 throughout the water column, similar to the O(0.1) m s−1 estimates by others (Visbeck, 2002; Heiderich and Todd, 2020). While formal propagation of these uncertainties into transport can produce unrealistically large values due to strong correlations within profiles, the small RMS velocity uncertainty indicates that the observed transport differences between transects are robust and reflect real environmental variability rather than measurement noise.
2.1.2 Water mass analysis
Water mass analysis used temperature and salinity data to distinguish between South Atlantic Water (SAW) and North Atlantic Water (NAW) fractions within the CTF. Followed the approach of Rhein et al. (2005), this method uses an isopycnal mixing approach with least-squares fitting to estimate the relative contributions of the two source waters to the observed temperature and salinity at each density level, based on representative source water profiles (Fig. 3). Representative source water properties were taken from World Ocean Atlas 2018 (Locarnini et al., 2019; Zweng et al., 2019) and converted to conservative temperature and absolute salinity using TEOS-10 standards. The isopycnal mixing method followed:
where (TSA, SSA) and (TNA, SNA) represent the temperature and salinity definitions for the representative SAW and NAW types; (Tobs, Sobs) are the observations; (xSA, xNA) are the fractional relative contributions from each source; and (RT, RS, RMC) are the residuals minimized through least squares fitting. This approach parallels optimum multiparameter methods but is simplified to two water mass endmembers for a determined system of equations. We follow the water mass density ranges and naming conventions of Stramma and Schott (1999) and Rhein et al. (2005) where surface waters (SW) are σθ<1024.5, salinity maximum waters (SMW) are , upper central waters (uCW) are , lower central waters (lCW) are , and intermediate waters are (IW) . The fractional source contributions were then multiplied by the corresponding measured velocity and vertically and horizontally integrated in the respective isopycnal ranges to estimate transport by water mass. For a more comprehensive description of the methodology, including assumptions, source water definitions, and detailed equations, the reader is referred to Gradone et al. (2023). The Python package PYOMPA (version 0.3) is adapted for this analysis (Shrikumar et al., 2021). The surface layer (σθ<1024.5, ∼60–90 m) was assigned entirely to SAW following Rhein et al. (2005), while the analysis covers the density range from σθ=1024.5 to 1027.5, matching the glider's operational depth.
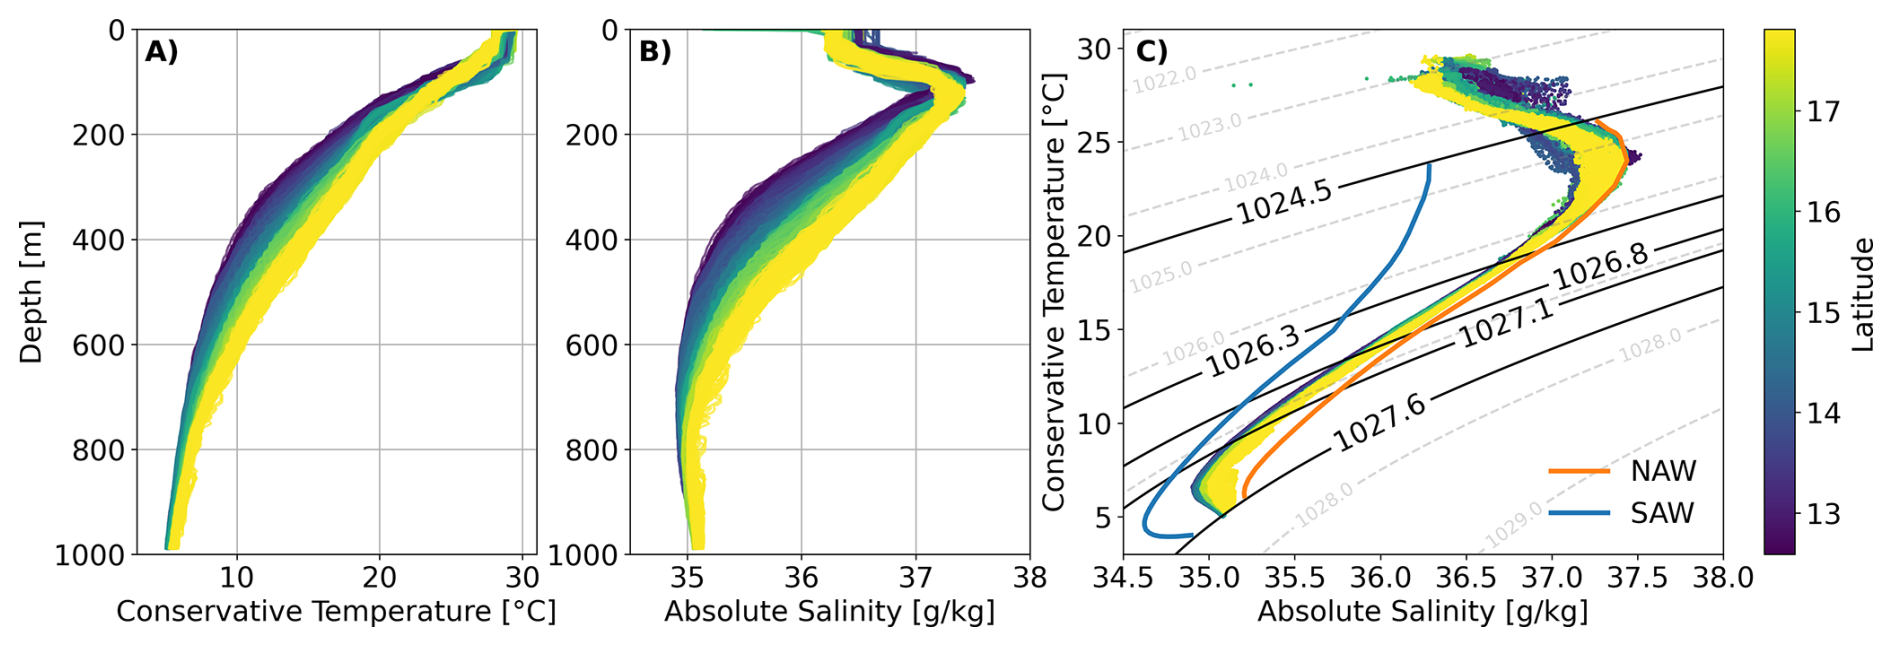
Figure 3Conservative Temperature (A) and Absolute Salinity (B) profiles from the two transects colored by latitude. Temperature-Salinity diagram (C) of same data with representative source water mass profiles from World Ocean Atlas 2018 following Rhein et al. (2005) for the South Atlantic (blue) and North Atlantic (orange). Isopycnal ranges of the water masses used in the water mass analysis are bolded, where surface waters are σθ<1024.5, salinity maximum waters are , upper central waters are , lower central waters are , and intermediate waters are .
2.2 Satellite altimetry
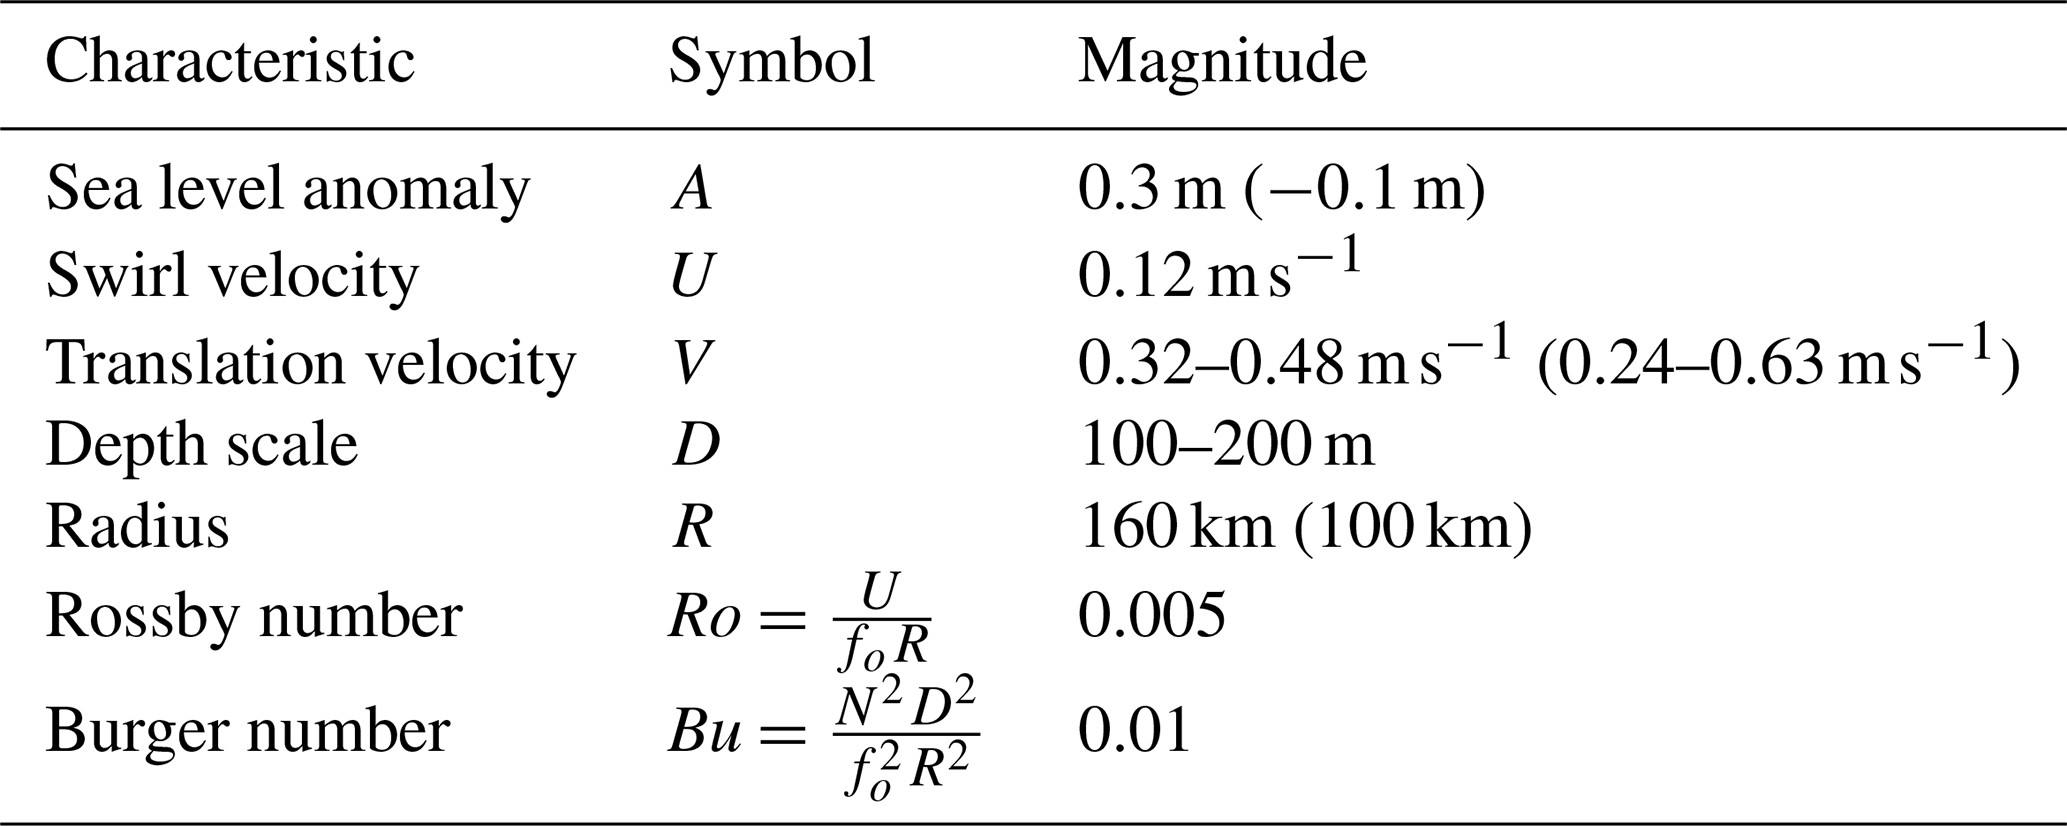
Daily 0.25° resolution sea surface height (SSH), sea level anomaly (SLA), and absolute dynamic topography (ADT) data were obtained from the Copernicus Marine Environment Monitoring Service's (CMEMS) AVISO (Archiving, Validation and Interpretation of Satellite Oceanographic data) product. This dataset was used to identify, track, and derive associated properties of mesoscale eddies near the glider during this deployment (Table 1) following an automated eddy tracking algorithm, py-eddy-tracker (Mason et al., 2014). This open-source Python tool identifies and tracks eddies from high-pass–filtered SLA fields, obtained by removing a large-scale Gaussian-smoothed background (10°×5°). Within the study domain, closed SLA contours were analyzed at 1 cm intervals (i.e., contour levels in SLA space) on the native 0.25° AVISO grid to detect coherent cyclonic and anticyclonic features. Eddies were retained based on geometric and physical criteria, including shape, size, interior SLA consistency, single-core structure, and amplitude limits. Eddy radius, amplitude, swirl velocity, and translation velocity were obtained directly from py-eddy-tracker outputs following Mason et al. (2014), while eddy vertical scales were estimated independently from glider-derived hydrographic and velocity anomalies.
Table 1Mean anticyclonic eddy characteristics derived from satellite altimetry and glider data. Numbers in parentheses represent values for the cyclonic eddy not directly sampled by the glider between the two transects.
Although the glider did not complete a full third transect, it conducted detailed in situ sampling of an anticyclonic eddy during its partial transit. During this period, the glider distance to the eddy center was calculated from the glider's location and the corresponding eddy location from the py-eddy-tracker output on that day. The differential anomaly method (Simpson et al., 1984) was used to quantify eddy-induced water mass anomalies. This method isolates temperature and salinity deviations from a reference profile caused by isopycnal displacements at specific depths by:
where eddy temperature (salinity) anomaly Ta(r,z) at a radial distance r from the eddy center and depth z is defined as the difference between the observed temperature (salinity) Te(r,z) and a reference temperature (salinity) profile Tr(z). The reference profiles were constructed by averaging all glider data outside the eddy diameter but within a 50 km buffer zone beyond its outer boundary. A total of 67 profiles met this criterion.
2.3 Mesoscale Signal Isolation
To quantify the mesoscale contribution to transport and water mass variability, a scale separation was performed on the glider hydrographic and velocity data and the satellite altimetry fields. Following Chelton et al. (1998), we approximate the mesoscale with the first baroclinic Rossby radius (LR), which defines the horizontal length scale at which baroclinic dynamics dominate. The hydrographic, velocity, and altimetry fields were high pass filtered with a cutoff wavelength of ∼2LR ( km between 12–18° N) to separate the transient mesoscale signals from the large-scale circulation. This scale separation allows for a quantitative assessment of how eddy activity modulates transport and water mass variability.
3.1 Current Structure and Transport
Figure 2 shows E–W and N–S velocity derived from the glider-mounted AD2CP for the two transects from the Dominican Republic to the north and Curaçao to the south. Though the flow was generally westward during both transects, the Caribbean Current exhibited significant variability in vertical structure and magnitude along this longitude. A strong westward jet existed around 13° N during both transects, with surface and subsurface speeds exceeding −0.3 m s−1 during Transect #1. Between 16 and 17° N, strong westward flow existed during Transect #1 but was absent and partially reversed during Transect #2. A weak but persistent countercurrent was observed in the center of each transect, around ∼14–15° N. Total zonal transport across this section was estimated as −17.64 Sv for Transect #1 and −9.22 Sv for Transect #2. The potential driver of the variability in both current structure and total transport is examined in the Discussion section. The N–S velocity exhibited less variability within a given transect than the E–W velocity, but was distinctly more variable between transects. Transect #1 showed surface-intensified southward flow near 15, 16, and 17.5° N. Glider direction of travel was southward during Transect #1 and northward during Transect #2. As the glider approached the southern end of Transect #1 near ∼13° N, there was a stronger northward component to the N–S velocity. Then, during Transect #2, the flow had a consistent northward component until the glider was north of 17° N.
3.2 Water Mass Analysis and Transport
The highly stratified water mass structure found in the Caribbean was evident in the temperature and salinity profiles shown in Fig. 3. Marked by warm temperatures and comparatively lower salinity, Caribbean Surface Water (CSW) dominated the surface layer (Morrison and Nowlin, 1982). Just below the CSW, Subtropical Underwater (STUW) was identified as a subsurface salinity maximum in the depth range of 90–160 m (Wüst, 1963). The subsurface salinity maximum became shallower and saltier moving from north to south. Subtropical Mode Waters (STMW), also known as Sargasso Sea Water and 18 °C Water (Worthington, 1958), were found below STUW with temperature and salinity properties generally warmer and saltier in the northern Caribbean. Central Waters (CW) overlapped with the STMW and extended over a significant depth range in the Caribbean, and were easily identifiable by their linear relationship (Montgomery, 1938; Iselin, 1939). As the maximum depth sampled by the glider was ∼990 m, the deepest water mass observed was Antarctic Intermediate Water, first identified in the Caribbean by Wüst (1963).
Transport of NAW and SAW per water mass class was calculated following the isopycnal water mass analysis (Fig. 4). Including the surface layer, the total SAW (NAW) transport was −8.35 Sv (−9.29 Sv) and −4.59 Sv (−4.63 Sv) for the first and second transect, respectively. The surface layer accounted for −2.71 and 1.24 Sv of SAW transport, which represents 15 % and 13 % of the total transport, for the first and second transect. Note, the surface layer transport during Transect #2 is positive, indicating net transport eastward. Despite the decrease in total transport by a factor of ∼2 from the first transect to the second, there was comparatively minimal variation in the ratio of SAW : NAW transport. Transect #1 transport was comprised of 53 % NAW and 47 % SAW, whereas Transect #2 shifted to 50 % NAW and 50 % SAW. Excluding the surface layer, the percentage of SAW transport generally increased moving from SMWs down to IWs. For clarity, only the percentage of SAW is reported here, as the percentage of NAW can be inferred as the remainder. Though other water masses may contribute to the transport in these layers, an assumption and limitation of the methodology is that the observed properties were derived from linear mixing of two water masses. The SMWs were overwhelmingly dominated by NAW, with SAW constituting ∼8 %–13 % of the transport in this layer. The 13 % SAW derived for Transect #2 represents a net eastward transport as well. Interestingly, the percentage of SAW transport relative to the total transport in the uCW layer was ∼21 % during Transect #1, but increased to 50 %, albeit with a net transport nearly equal to zero, during Transect #2. For both transects, the percentage of SAW transport relative to the total transport in the lCW and IW layers was nearly constant at ∼45 %, and ∼53 %. Mean temperature and salinity residuals for the isopycnal water mass analysis fit are quite low for both transects at −0.005 ± 0.002 °C and 0.024 ± 0.012 g kg−1, respectively (Fig. S1 in the Supplement).
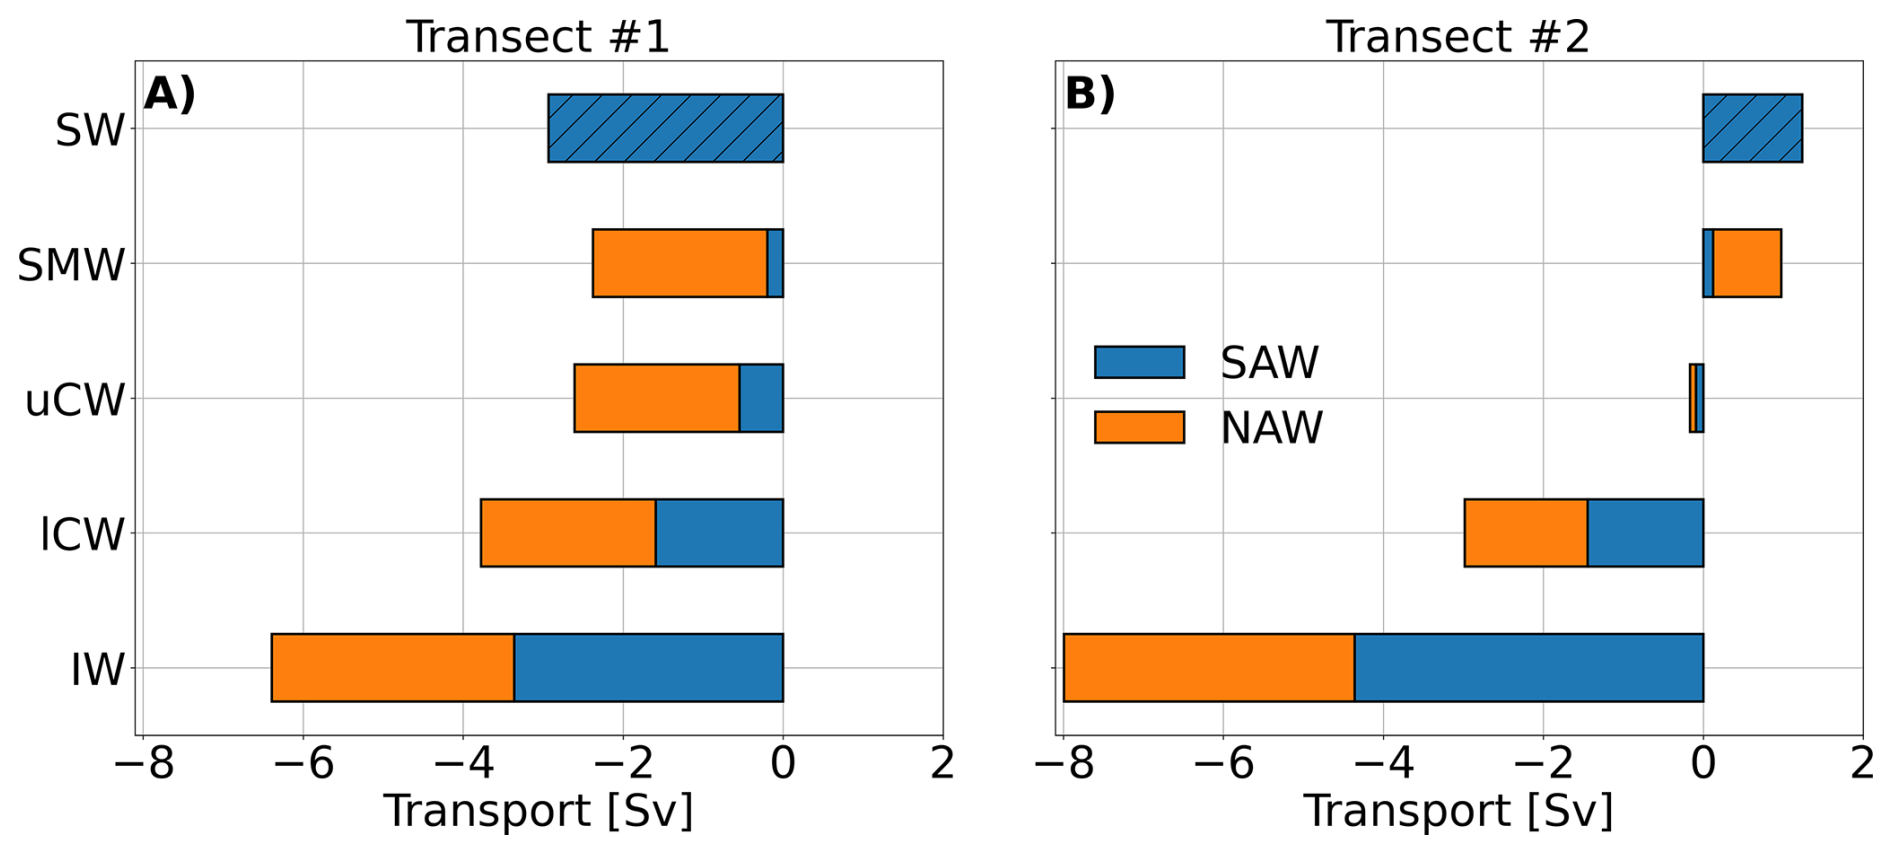
Figure 4Transport of South Atlantic Water (blue) and North Atlantic Water (orange) in the major water masses from the isopycnal water mass analysis integrated for the two transects. The surface waters are hatched in blue as they were not included in the water mass analysis. Surface waters (SW) are σθ<1024.5, salinity maximum waters (SMW) are , upper central waters (uCW) are , lower central waters (lCW) are , and intermediate waters (IW) are .
3.3 Structure and Dynamics of Mesoscale Eddies
The glider sampled to within approximately 15 km of the center of an anticyclonic eddy during the third (half) transect, collecting 283 profiles within the eddy radius over 24 d. Figure 5 shows a detailed sampling of this eddy, highlighting temperature and salinity anomalies alongside E–W and N–S AD2CP velocities and the glider's position relative to a sea-level anomaly estimated from AVISO. Temperature and salinity anomalies increase considerably in the eddy interior relative to a reference profile constructed from averaging 67 glider profiles outside the eddy radius but within a 50 km buffer zone beyond its outer boundary. The findings below are reported for the upper 200 m within the eddy core (inner 50 km), unless otherwise stated. The maximum eddy conservative temperature anomaly was 3.98 °C at 155 m while, on average, the conservative temperature anomaly was 1.88 ± 1.1 °C. The eddy absolute salinity anomaly exhibited a different structure, largely due to the presence of the subsurface salinity maximum. The minimum eddy absolute salinity anomaly was −0.74 g kg−1 at 133 m, while the maximum eddy absolute salinity anomaly was 0.3 g kg−1 at 195 m. Figure 6 shows how the glider likely missed sampling the direct center of the anticyclonic eddy but still managed to collect a few profiles on the southern side of the center. The velocity fields support this, showing strong eastward (clockwise) flow as the glider samples the northern side of the eddy, followed by a brief period of westward flow beginning around 20 June 2024, when the glider's distance from the eddy center started to increase again. The brief period of westward flow also corresponds with an increase in a southward component to the current, further supporting the glider's likely sampling of the southeastern quadrant of the eddy.
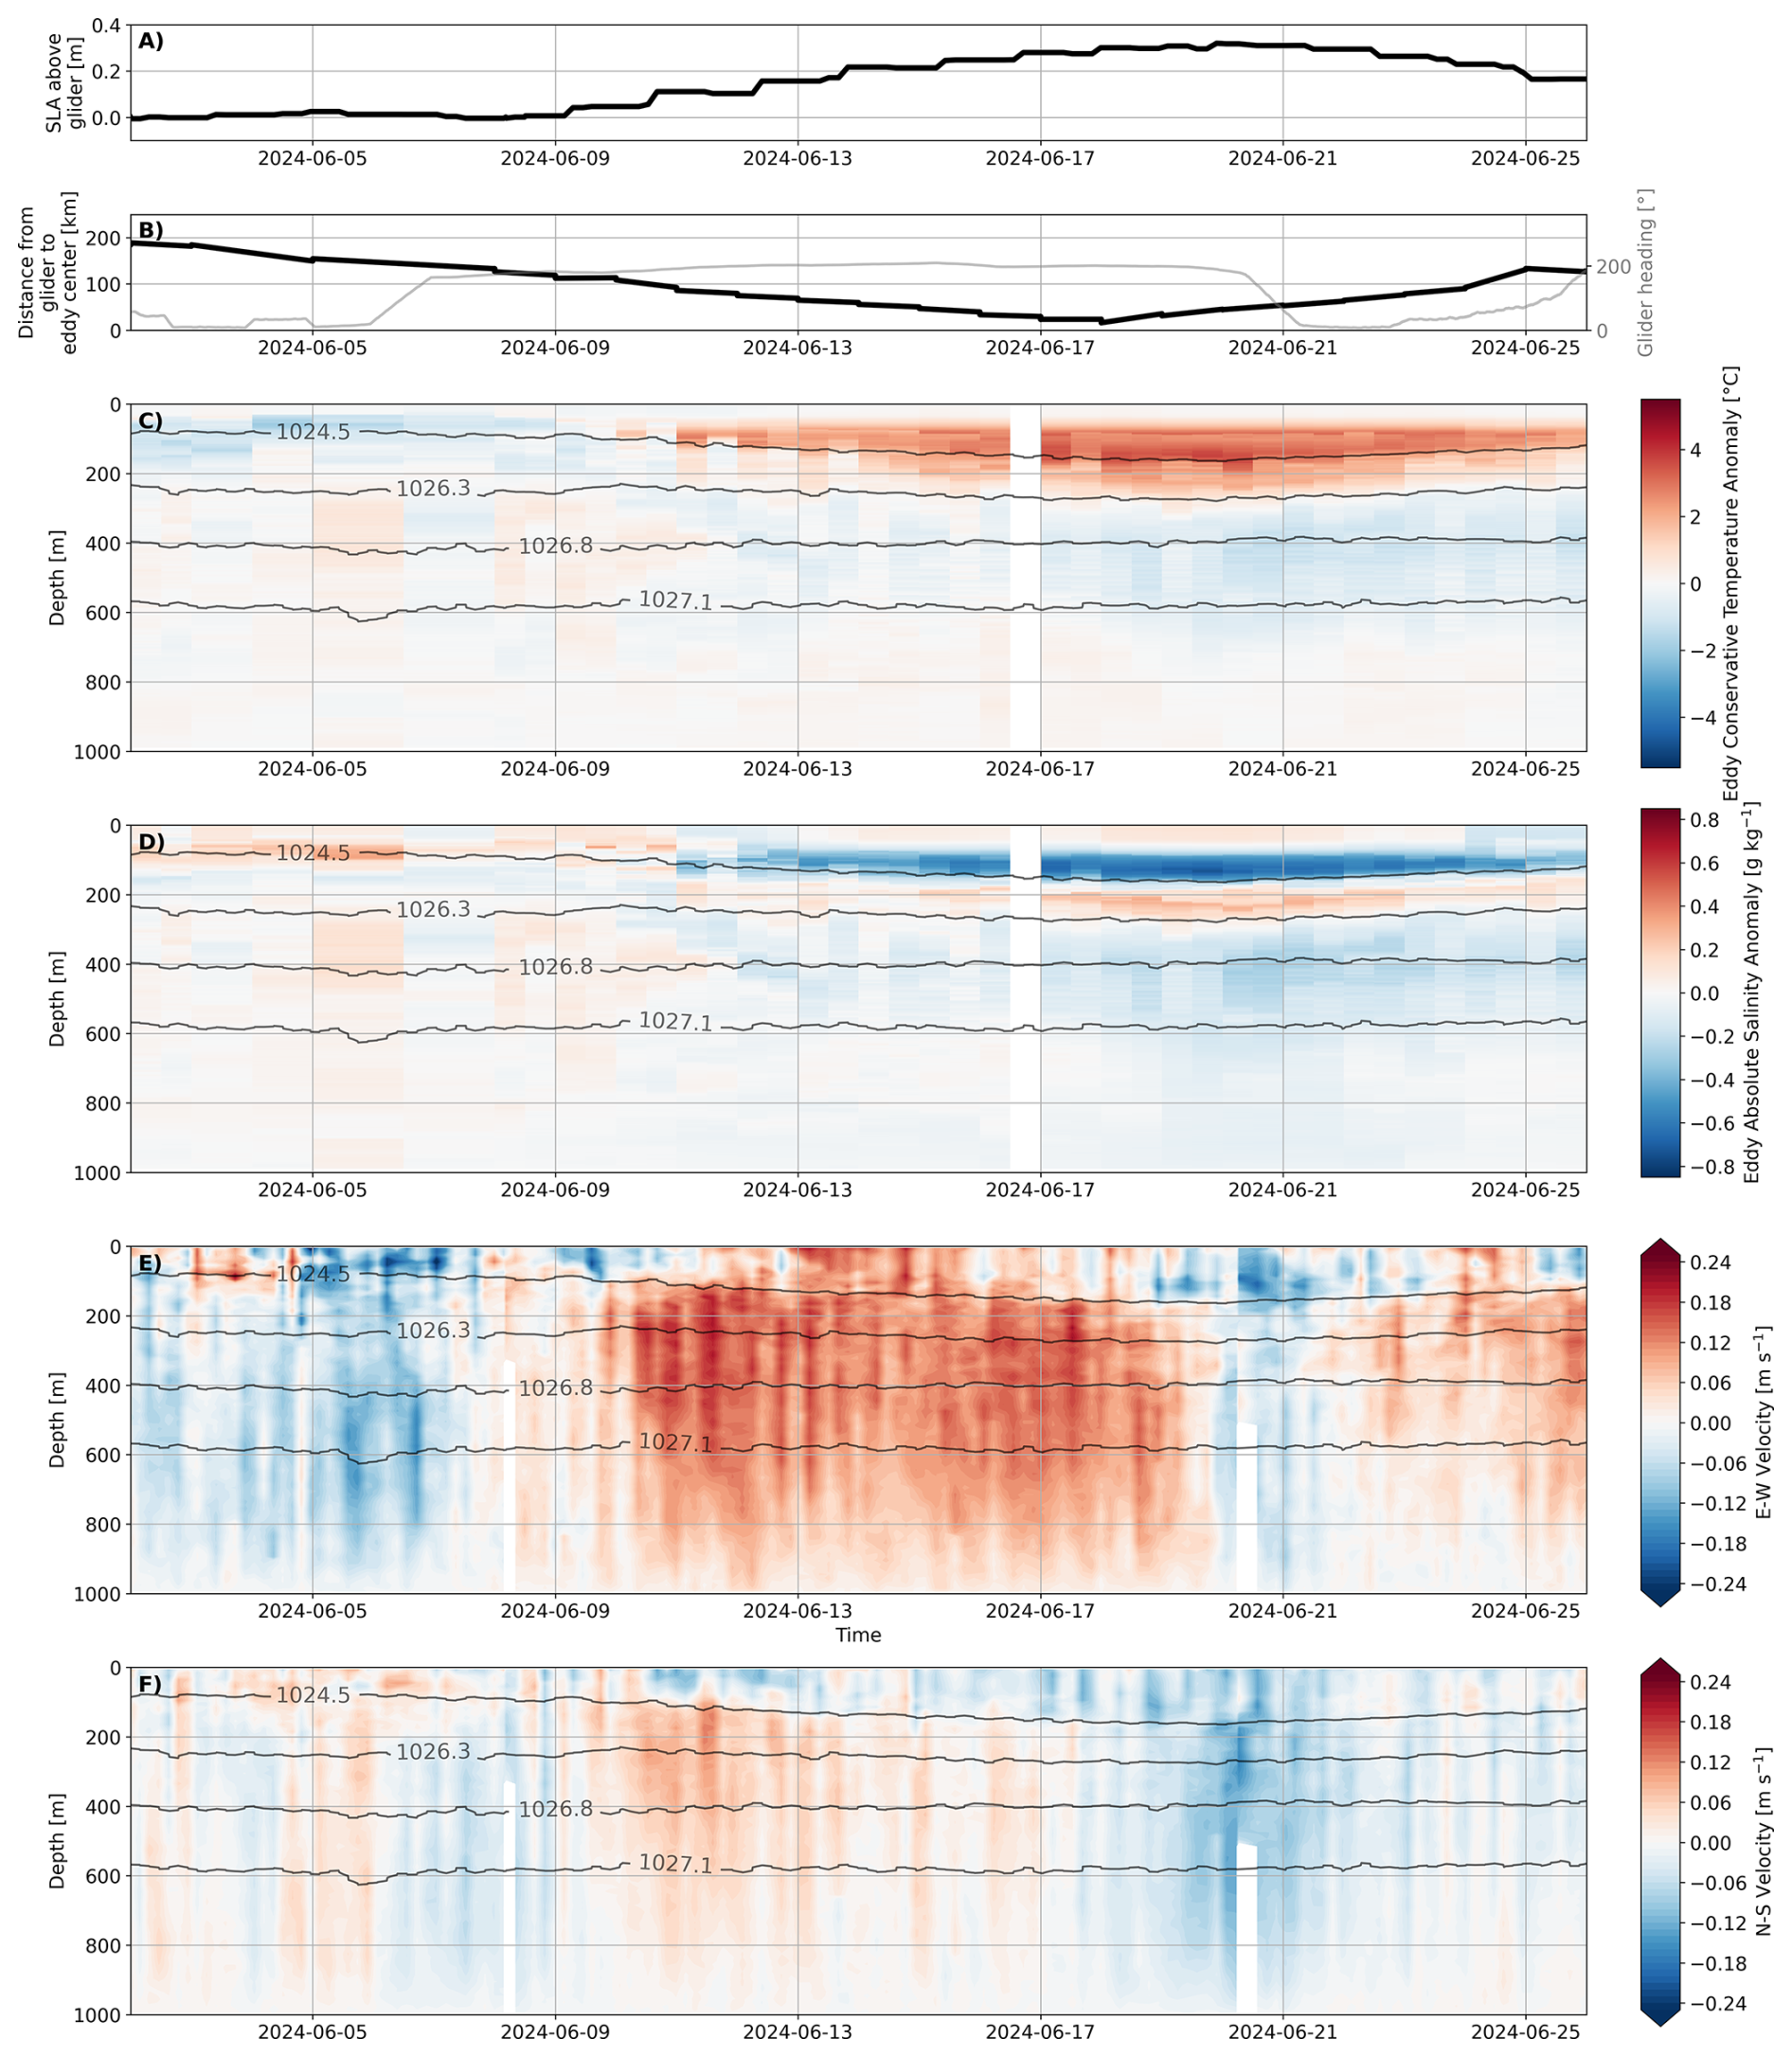
Figure 5(A) Sea level anomaly above glider and (B) distance from glider to eddy center determined by py-eddy-tracker algorithm and glider heading, where 0° represents travel to the north. (C) Eddy induced Conservative Temperature anomaly and (D) Absolute Salinity anomaly relative to nearby reference profiles outside of eddy influence. (E) E–W and (F) N–S velocity derived from glider-mounted AD2CP. Subplots (C)–(F) are contoured with isopycnals of used in the water mass analysis, where surface waters are σθ<1024.5, salinity maximum waters are , upper central waters are , lower central waters are , and intermediate waters are (lower extent not shown).
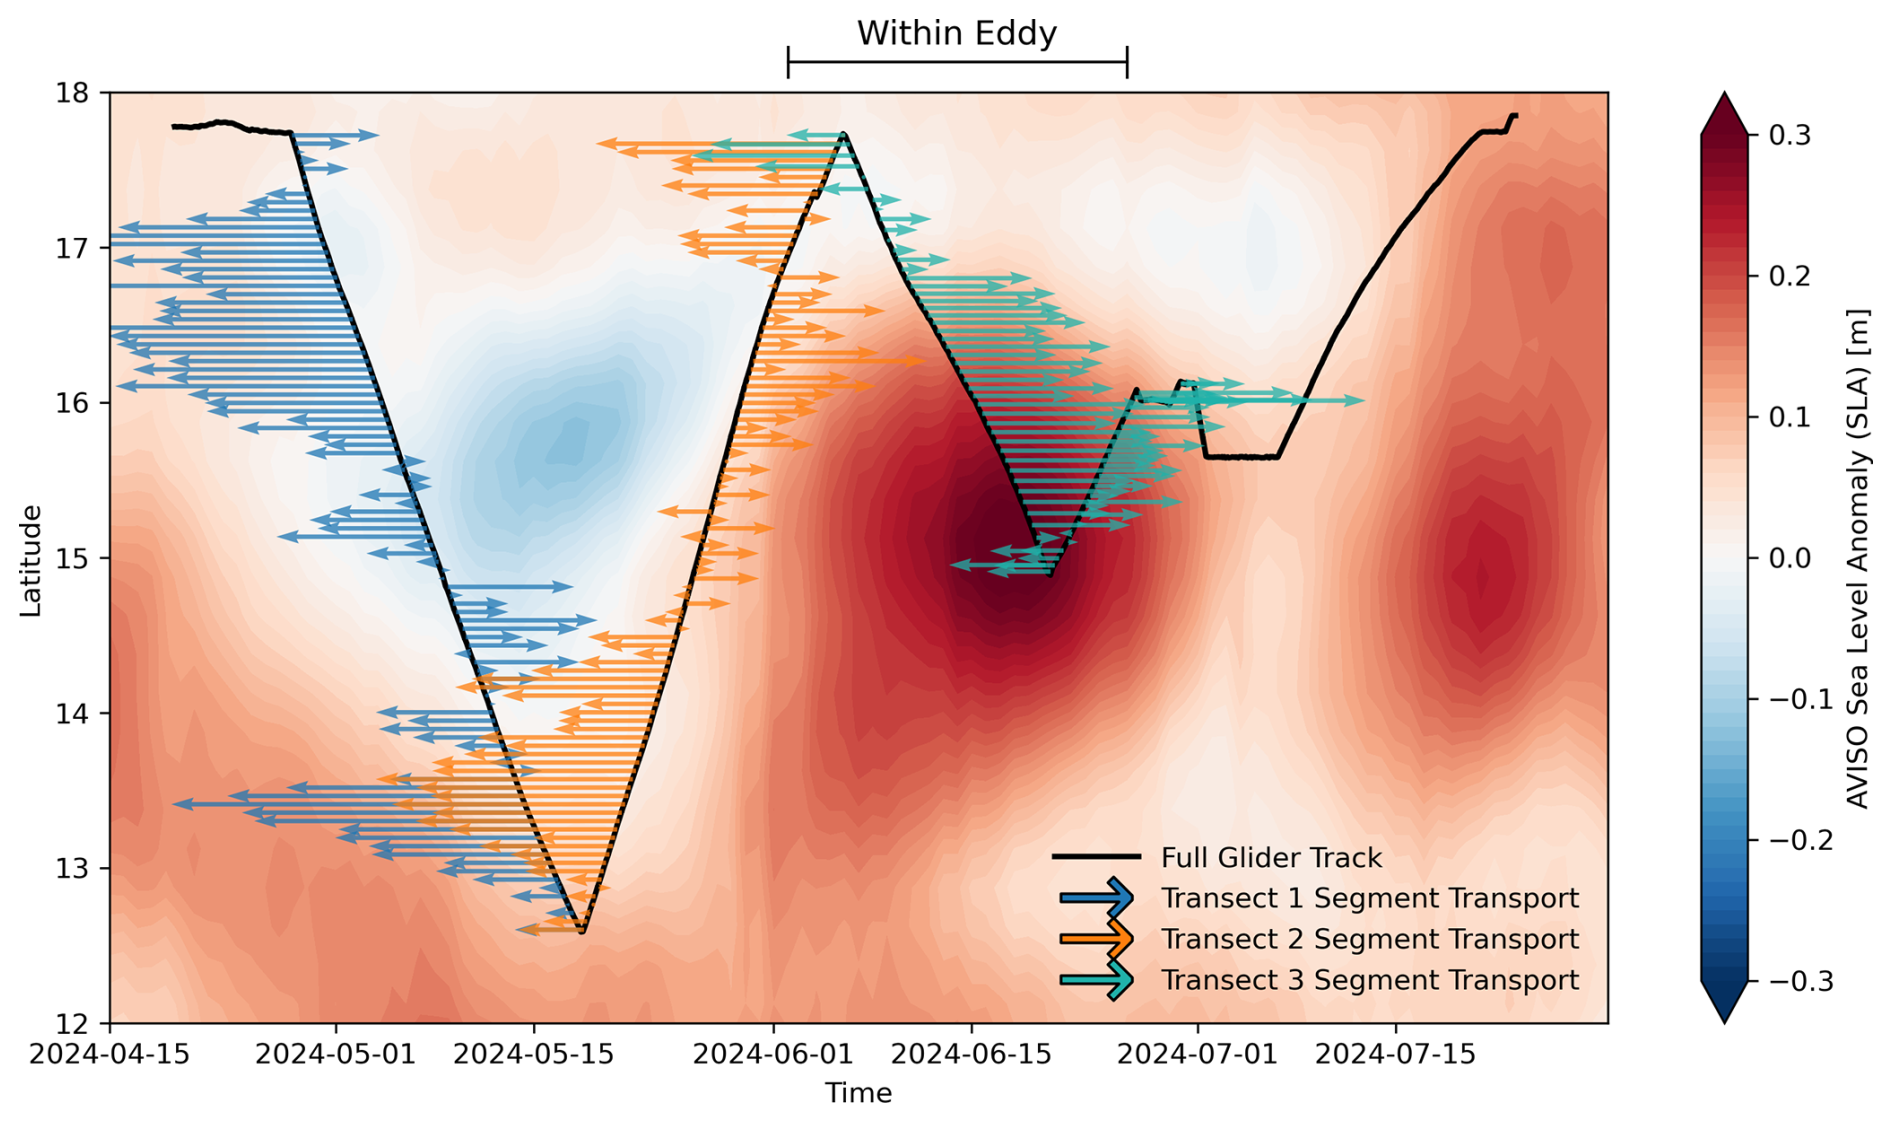
Figure 6Hovmöller time-series of glider track (black) against latitude overlying daily mean AVISO sea level anomaly. Relative magnitude of E–W transport per glider segment as colored vectors for Transect #1 (blue) and Transect #2 (orange) and Transect #3 (green). Arrows to the left indicate westward transport and arrows to the right indicate eastward transport. The period during which the glider is within the anticyclonic eddy is indicated at the top of the figure.
Table 1 details the eddy characteristics of the anticyclonic eddy directly sampled by the glider. The Rossby and Burger numbers are dimensionless diagnostics that quantify the relative importance of rotation, stratification, and inertia in ocean flows, where low Rossby numbers indicate near-geostrophic balance, high Rossby numbers indicate strong ageostrophic or inertial effects, and low Burger numbers indicate rotationally dominated, vertically coherent flows, while high Burger numbers indicate strong stratification effects. The low Rossby and Burger numbers suggest the anticyclonic eddy was largely in geostrophic balance. Estimates of the sea level anomaly, radius, and translation speed of a cyclonic eddy that passed through the region between the two transects (Fig. 6), and therefore not directly sampled by the glider, are also included in Table 1 for use in the Discussion section. The estimated translation speed for each eddy was comparable to the mean zonal velocity of the Caribbean Current (Richardson, 2005).
Figure 7 highlights the variability in water mass structure during Transect #1 and #2, and during the direct sampling of the anticyclonic eddy during the half Transect #3. All isopycnal surfaces exhibit a general tilt downwards from south to north along Transects #1 and #2 (Fig. 7C, E, F, and I). From south to north, layer thickness increases for the SMW and uCW (Fig. 7D and F) and decreases for the IW (Fig. 7J). Layer thickness is more variable in the SW and lCW (Fig. 7B and H). Water mass depths and thicknesses are generally consistent meridionally between Transect #1 and #2. The SW and SMW are slightly deeper near 15° N during Transect #2 (Fig. 7A and C); however, the thickness of the SMW is unaffected (Fig. 7D). The abrupt increase in uCW thickness during Transect #1 (Fig. 7F) does not correspond with an increase in the core depth of the water mass (Fig. 7E), but rather a thinning of the SMW above and lCW below (Fig. 7D and H). Comparing the half Transect #3 with Transect #1 and #2, generally water mass core depths are deeper, but thicknesses are consistent meridionally.
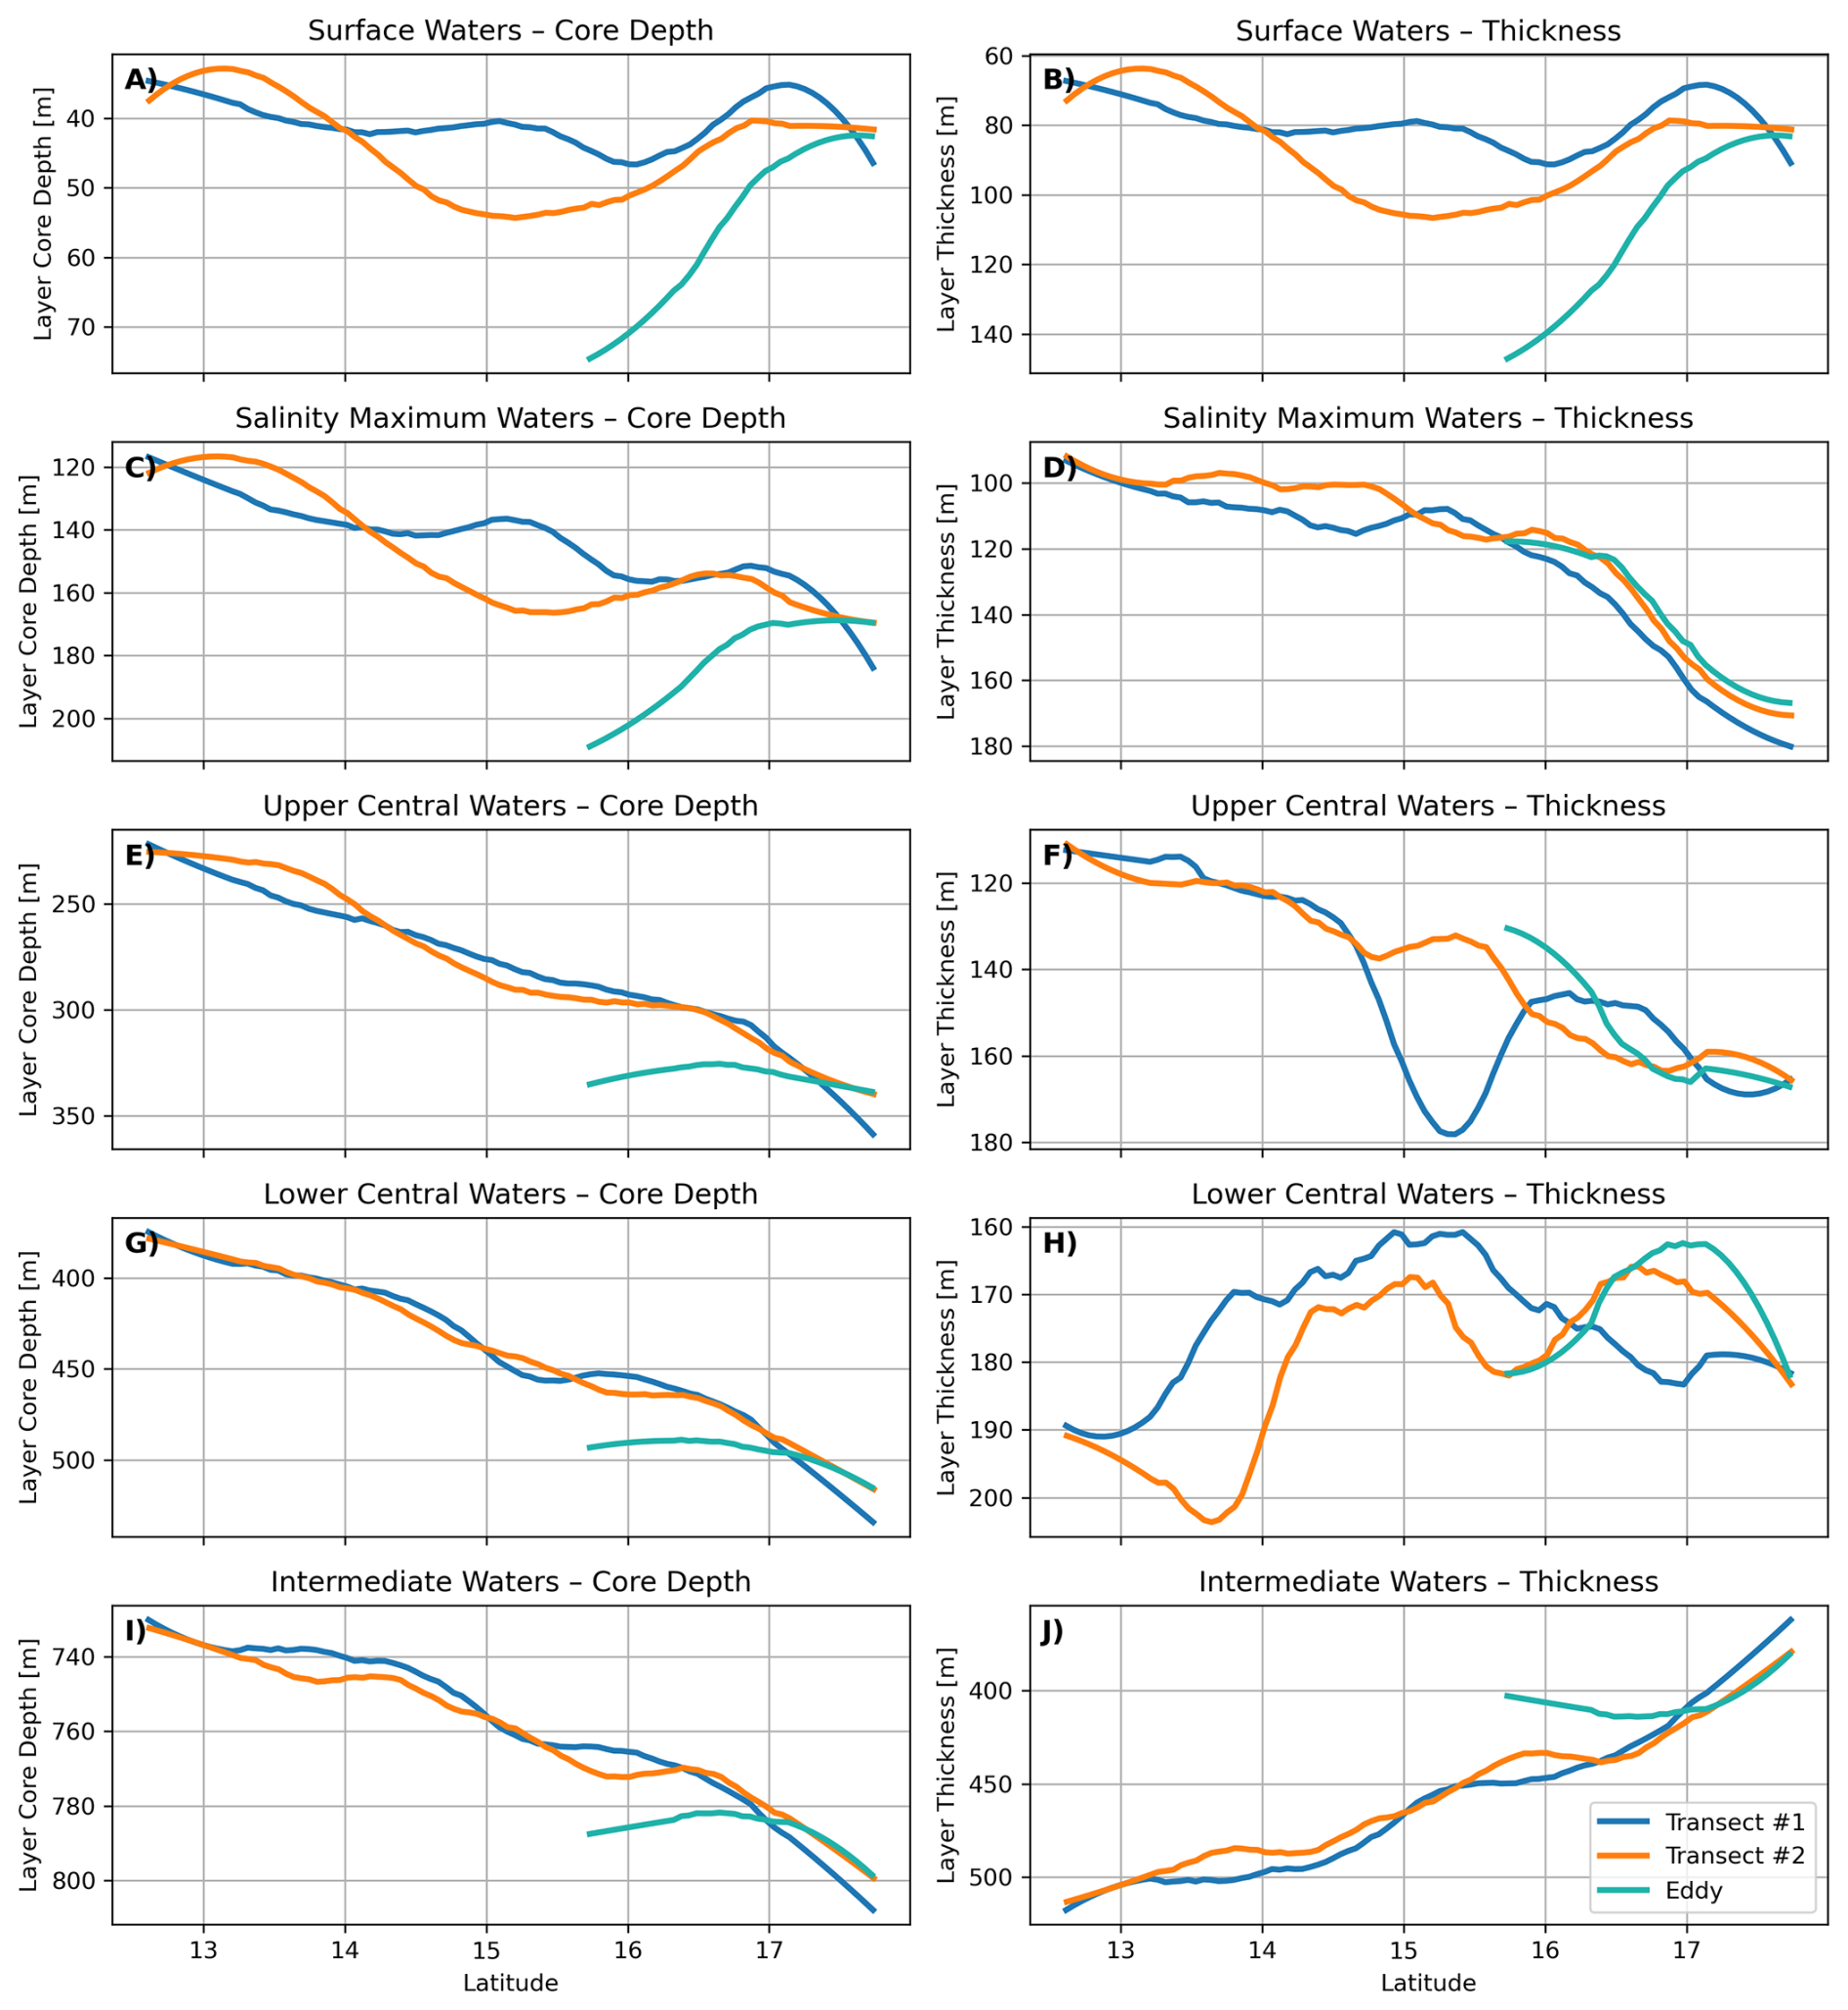
Figure 7High-pass filtered core depth (left) and thickness (right) of water masses from the water mass analysis. Surface waters (SW) are σθ<1024.5, salinity maximum waters (SMW) are , upper central waters (uCW) are , lower central waters (lCW) are , and intermediate waters (IW) are . Core depth is the middle of the density ranges and thickness is the depth difference between the two bounding isopycnals.
4.1 Transport Variability
These glider-based observations provide a new perspective on long-standing uncertainty in Caribbean Current transport near 69° W. Zonal transport estimates ranged from −17.64 Sv on Transect #1 to −9.22 Sv on Transect #2, values that fall within but also extend the range of previous ship-based measurements (−13.7 to −26.3 Sv) (Johns et al., 2002; Casanova-Masjoan et al., 2018). This overlap underscores agreement in variability while highlighting the persistent difficulty in constraining the current's mean strength. Owing to the large spatial extent of the study area and logistical constraints of glider operations, the transects were sampled sequentially, such that each transect represents circulation integrated over a 3 week period rather than a synoptic snapshot. As a result, differences in transport magnitude may reflect both spatial structure and temporal variability during the sampling period. This variability is examined in detail in the following section, where potential drivers of the discrepancies in mean transport values are considered. Given the role of the Caribbean Current in closing the mass budget into the Yucatan Straits and ultimately supplying the Florida Current, resolving these uncertainties is critical for linking Caribbean dynamics to the larger Atlantic circulation.
The vertical structure of the mean subsurface velocity derived from ADCP measurements was examined to investigate the mechanisms underlying the transport discrepancy between transects (Figs. 2 and 8). During Transect #1, the velocity field exhibited relatively weak vertical shear and low variability throughout the water column, consistent with a stable, large-scale flow. In contrast, Transect #2 showed substantially enhanced variability over much of the profile, particularly in the upper 200 m and between 400–900 m, indicating a more energetic and dynamically complex flow regime. This increased variability is reflected in elevated root-mean-square (RMS) vertical shear of the subsurface velocity during Transect #2 (Fig. 8), highlighting stronger eddy influence on the vertical structure of the flow. Enhanced RMS shear indicates greater vertical heterogeneity in the velocity field and is consistent with intensified mesoscale eddy interaction, which can redistribute momentum and weaken the depth-integrated transport. The elevated shear variability observed during Transect #2, therefore, provides a direct dynamical explanation for the reduced transport relative to Transect #1 (Fig. 8).
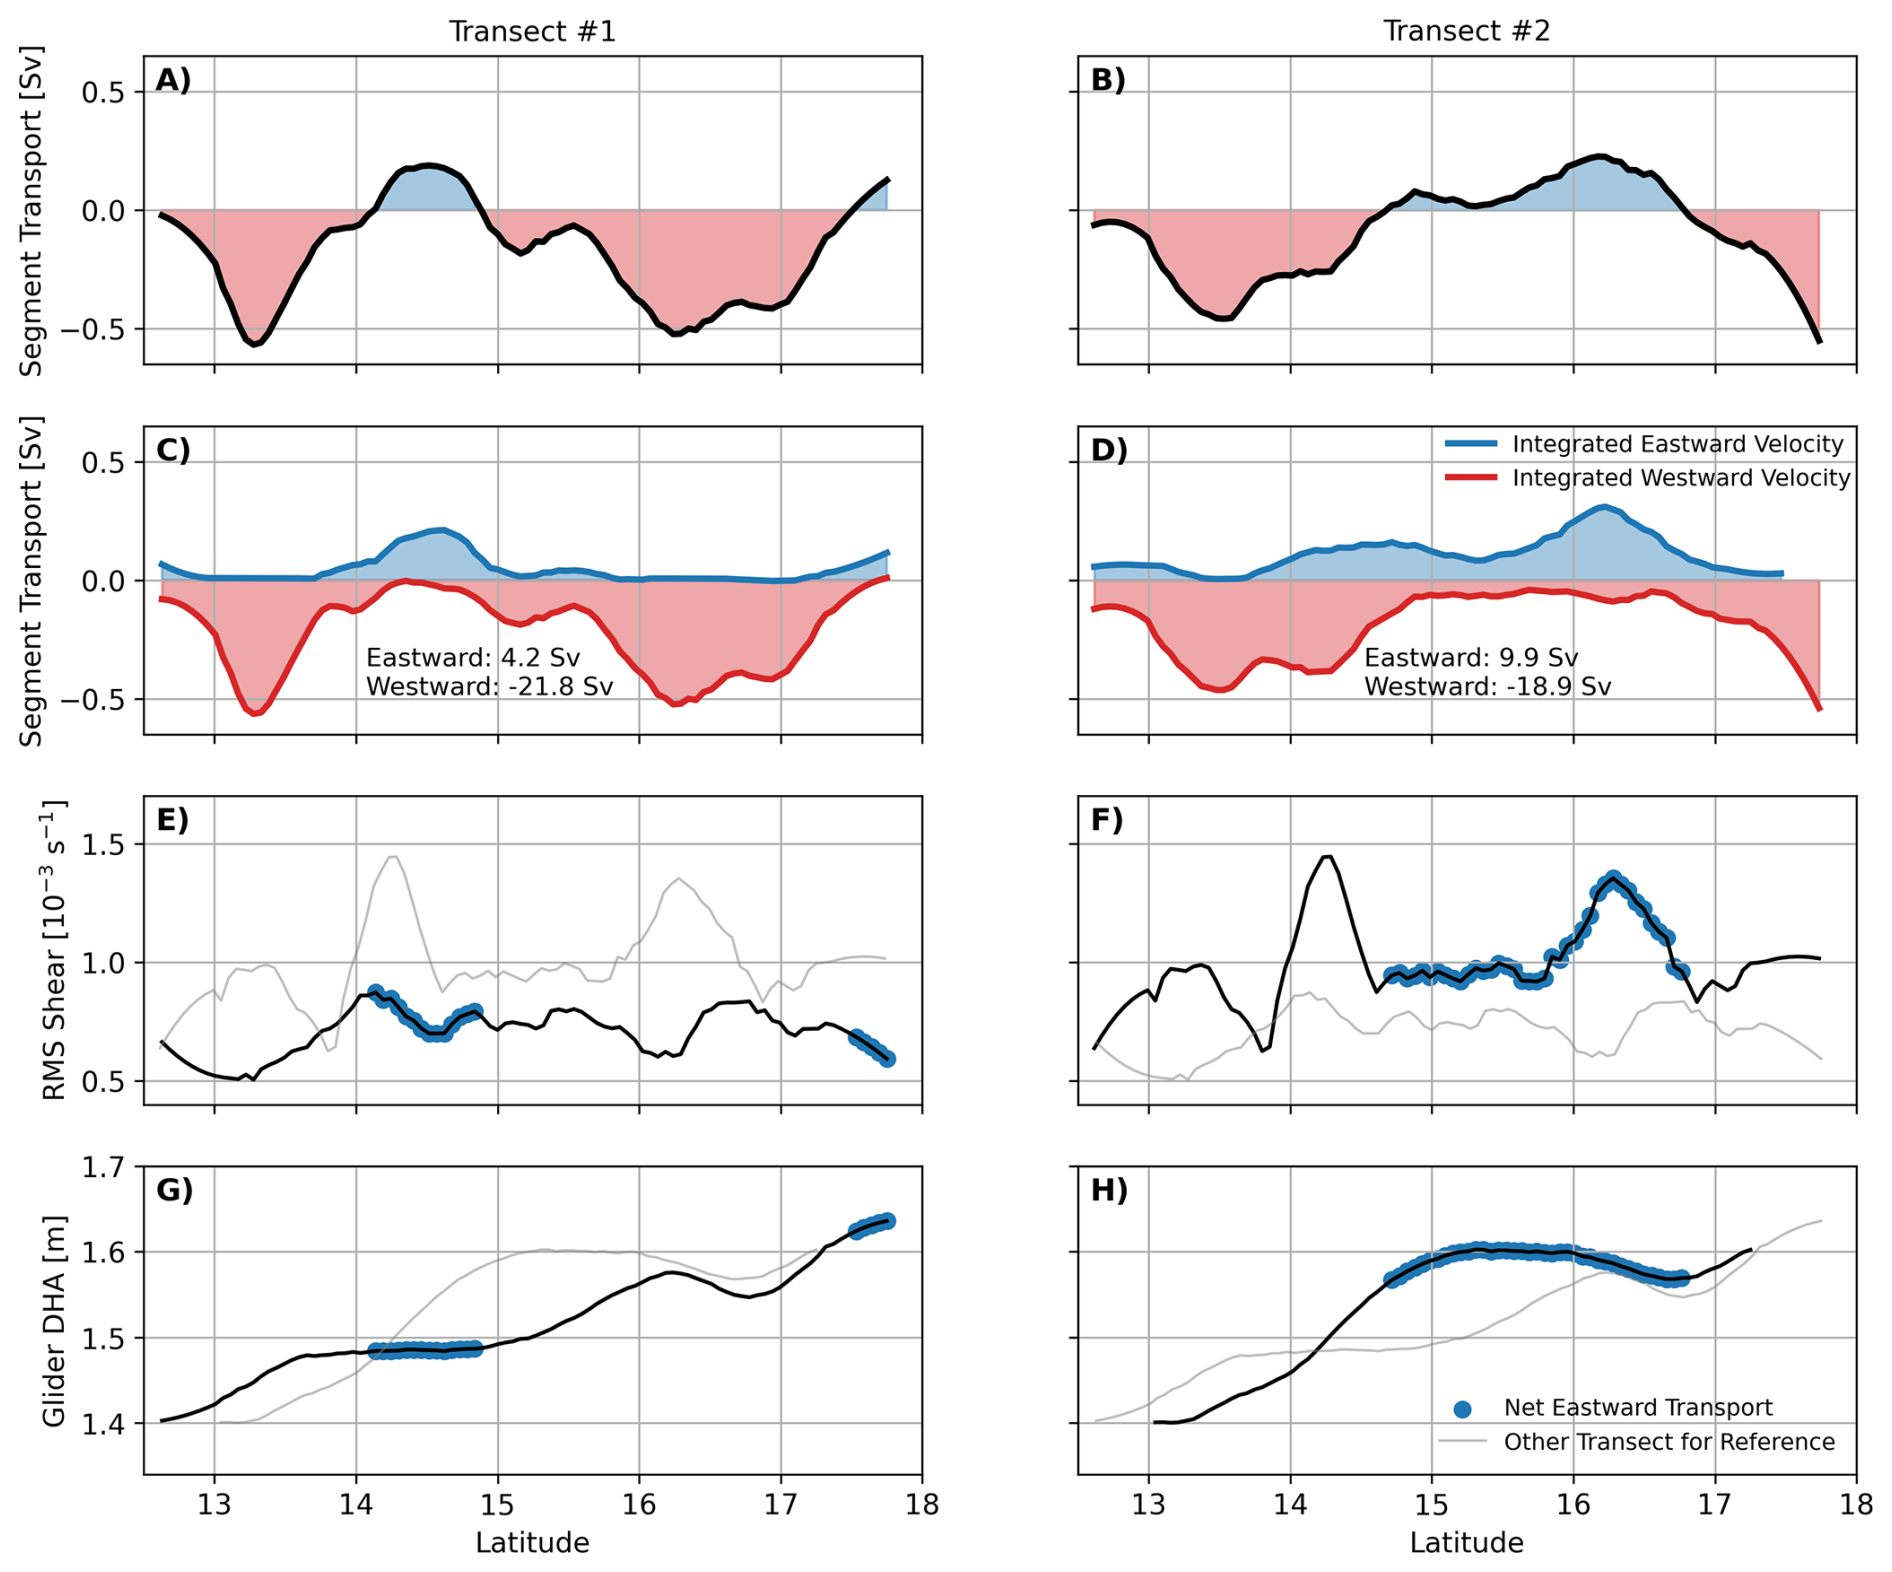
Figure 8Net segment transport (A, B), total eastward and westward segment transport (C, D), root-mean-square vertical shear of the subsurface zonal velocity (E, F), and glider dynamic height anomaly (DHA) (G, H), where the left column represents Transect #1 and the right column Transect #2. All fields are high pass filtered to isolate mesoscale as described in the methods section. Subplots (E)–(H) show the respective property from other transect shaded in light grey for reference and are dotted blue where the net transport is eastward.
Additional support for this interpretation comes from comparisons between glider-derived dynamic DHA and depth-integrated transport per glider segment (Figs. 8 and 9). The close agreement between glider-derived DHA and AVISO absolute dynamic topography (ADT) is expected (Fig. 9), as the former captures the baroclinic structure while the latter includes both baroclinic and barotropic contributions. However, regions where depth-integrated transport deviates from glider-derived DHA, most notably in the northern half of Transect #1, coincide with strong barotropic flow and reduced vertical shear, indicating limited mesoscale influence. In contrast, the tighter correspondence between depth-integrated transport and glider-derived DHA during Transect #2 reflects a diminished barotropic contribution and a stronger mesoscale imprint on the flow field, consistent with the elevated RMS shear observed along this transect. The area of increased shear in Transect #2 also corresponds with a deviation from the tight ADT-DHA correlation (Fig. 9B).
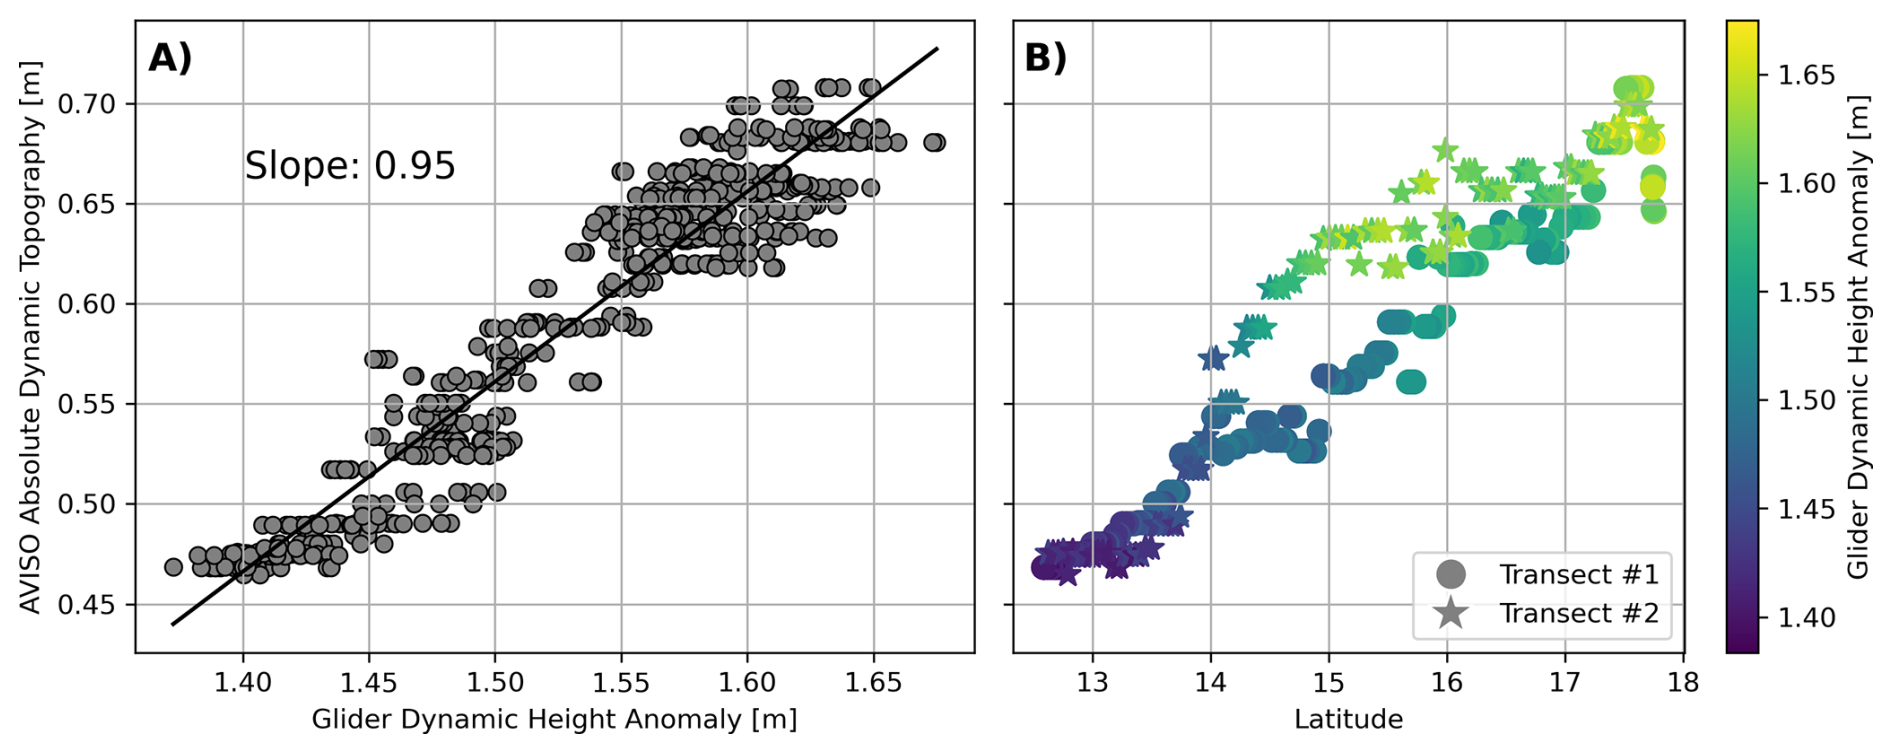
Figure 9(A) Relationship between Dynamic Height Anomaly relative to 990 decibars derived from glider data and Absolute Dynamic Topography from AVISO matched to the glider's location, and (B) comparing these fields meridionally between Transect #1 (circles) and Transect #2 (stars).
A third factor arises from observational resolution. Historical ship-based sections in the Caribbean have typically sampled at horizontal spacings of 25–50 km, which are too coarse to resolve the mesoscale features revealed here that strongly influence transport. In contrast, the gliders provide effective resolution of ∼5 km, capturing much finer-scale variability. When the glider subsurface velocity observations are interpolated to the coarser station spacing of the A22 section, the resulting transport estimates are biased by nearly a factor of two, even reversing the relative magnitudes of transport for Transects #1 and #2 (Transect #1 transport drops from −17.46 to −9.02 Sv, while Transect #2 transport increases from −9.44 to −17.55 Sv). This sensitivity underscores how under sampling can alias mesoscale variability, producing the wide spread of mean transport estimates reported over the past three decades.
4.2 Water Mass Transport
Following the isopycnal water mass analysis of Rhein et al. (2005), glider observations revealed a SAW transport of approximately −8.35 and −4.59 Sv for the first and second transects. Interestingly, there was minimal variation in the ratio of SAW : NAW, changing only 3 % despite the factor of 2 change in bulk transport. If these SAW transport estimates are taken as accurate, an additional ∼8.65–12.41 Sv of SAW must flow through Windward Passage to close the ∼17 Sv transport budget corresponding to the estimated strength of the AMOC (Frajka-Williams et al., 2019). This is unlikely as most of the SAW inflow is thought to be concentrated in the southeastern Caribbean passages (Kirchner et al., 2009; Rhein et al., 2005), and the northern passages exhibit stronger NAW inflow (Kirchner et al., 2009; Gradone et al., 2023). Notably, however, the 47 %–50 % SAW fraction observed along 69° W closely matches the 45 % Schmitz and Richardson (1991) reported for the Florida Current, despite their estimate being based on only 13 Sv of SAW. Even considering the highest mean transport estimate from ship-based observations near 69° W of −26.3 Sv (Casanova-Masjoan et al., 2018) and 50 % SAW would only account for −13.15 Sv of SAW. A likely alternative explanation for the observed discrepancies is a reassessment of the water mass analysis methodology, which cannot be applied in the SW (Schmitz and Richardson, 1991; Schott et al., 1998; Hellweger and Gordon, 2002; Rhein et al., 2005) and neglects contributions from high-salinity South Atlantic SMW (Zhang et al., 2003; Rhein et al., 2005; Kirchner et al., 2008). Transect #1 SW transport contributes −2.9 Sv of SAW transport, which represents ∼35 % of the total SAW transport for this transect. If the net SW transport for Transect #2 (1.24 Sv) were westward rather than eastward, this would only represent ∼20 % of the total SAW transport for this transect, highlighting the influence of the change in the subsurface velocity field in comparison to the water mass structure.
Prior estimates of the SAW transport contributions from the western South Atlantic high-salinity SMW, unaccounted for in the water mass analysis, suggest a factor of 25 %–50 % could reasonably be applied to the NAW component of the SMW (Rhein et al., 2005; Kirchner et al., 2008; Gradone et al., 2023). This adjustment only increases the SAW transport by a maximum of −1 and −0.5 Sv for Transect #1 and #2, respectively, further highlighting the need for alternative water mass analysis tools.
Additionally, it is important to acknowledge that the glider-based transport estimates, particularly for Transect #2, where mesoscale variability was pronounced, may underestimate the mean flow. This underestimation likely arises from navigational constraints that prevent sampling the full width of the Caribbean Current and from the gliders' depth limitation to ∼1000 m, which does not capture the entire vertical structure of the flow. Consequently, while the observed SAW : NAW ratio is informative, the absolute transport values should be interpreted as a lower bound on the total SAW contribution to the AMOC and viewed as motivation for improved methodological approaches to better constrain water mass transport in this region.
4.3 Eddy Influence on Water Mass Structure
Mesoscale eddies are key components of the climate system, redistributing tracers and momentum and influencing ocean circulation, heat and nutrient transport, carbon sequestration, and gas exchange (Beech et al., 2022). The CTF eddy field has been well characterized in terms of formation (Carton and Chao, 1999; Jouanno et al., 2009), propagation (Richardson, 2005), dissipation (Carton and Chao, 1999), variability (López-Álzate et al., 2022), and climatic forcing (Huang et al., 2023), and is thought to intensify from east to west due to the westward growth of baroclinic instabilities (Carton and Chao, 1999; Jouanno et al., 2008). However, how these eddies modify subsurface water mass structure in the CTF remains unresolved (Gradone et al., 2025a).
The detailed sampling of an anticyclonic eddy during the third transect quantifies how mesoscale structures modify local water mass properties and structure. The eddy generated strong temperature and salinity anomalies in the upper 200 m, along with pronounced clockwise velocity components consistent with an anticyclonic circulation. In contrast, the SLA field suggests that a cyclonic eddy passed through the region between the first and second transects (Table 1), likely further contributing to the higher background shear observed throughout Transect #2, which increased mesoscale variability. Cyclonic eddies, being more baroclinic and nonlinear than their anticyclonic counterparts, can oppose the mean flow, enhance vertical shear, and redistribute energy from the mean current (Perrett et al., 2011). By contrast, anticyclonic eddies, often more barotropic, can reinforce the mean flow locally or broaden the current without substantially decreasing net transport. These observations underscore the significant role of mesoscale eddies, both cyclonic and anticyclonic, in modulating the Caribbean Current, influencing local water mass properties, and generating variability in transport estimates.
High-resolution glider observations from repeat transects along ∼69° W provide new insight into mesoscale-driven variability in the Caribbean Through-Flow. Zonal transport declined sharply from −17.64 Sv on the first transect to −9.22 Sv on the second, coinciding with a shift from flow largely in geostrophic balance to conditions dominated by mesoscale variability. Metrics derived from the glider hydrographic data (dynamic height anomaly) and subsurface velocity data (root-mean-square vertical shear) support this increased variability, and satellite altimetry data spanning the full deployment suggest a cyclonic eddy passing through the northern half of the section between transects was a key driver. Sampling of an anticyclonic eddy during a partial third transect further illustrates the impact of mesoscale features, producing strong thermal and salinity anomalies in the upper 200 m. Despite these circulation changes, there was minimal variation in the relative contributions of North and South Atlantic water masses to the total transport. These results underscore how high-resolution glider observations, combined with altimetry, can resolve the processes controlling transport variability and water mass structure in this critical pathway linking the North Atlantic Subtropical Gyre and the upper limb of the AMOC.
However, further advancements in observational methodology are necessary to fully and accurately constrain the pathways of water mass circulation within the upper limb of the AMOC. One approach to achieving this requires measurements of at least one nutrient that covaries stoichiometrically with dissolved, tailored to the number of distinct source waters, which can then be used in an extended optimum multiparameter (eOMP) analysis (Poole and Tomczak, 1999; Tomczak and Large, 1989; Valencia-Gasti et al., 2022). Other observational approaches for determining water mass origins remain limited, making it challenging to resolve circulation pathways confidently. Current observing systems and sensor technologies are insufficient for routinely acquiring the necessary data, highlighting the urgent need to develop new, more accessible nutrient sensors. Addressing these gaps will be essential for enabling high-resolution, widespread monitoring and improving understanding of the dynamics of large-scale ocean circulation.
High-resolution, eddy-resolving numerical models offer a promising approach to quantify the variability induced by mesoscale eddies in the Caribbean Current. To ensure these simulations accurately capture eddy–mean flow interactions, they must be paired with targeted observations, such as gliders, drifters, and altimetry, to evaluate and validate model performance. This combination of appropriate modeling and observational constraints is critical for robustly assessing the role of eddies in modulating the mean flow.
The original software for this analysis can be found in this Zenodo repository: https://doi.org/10.5281/zenodo.18622052 (Gradone, 2026a).
The data for this analysis can be found in this Zenodo repository https://doi.org/10.5281/zenodo.18332586 (Gradone, 2026b).
The supplement related to this article is available online at https://doi.org/10.5194/os-22-735-2026-supplement.
JCG, WDW., and TNM conceptualized the study. JCG performed the data curation and formal analysis and wrote the manuscript draft. JCG, WDW, TNM, LNH and SMG reviewed and edited the manuscript.
The contact author has declared that none of the authors has any competing interests.
Publisher's note: Copernicus Publications remains neutral with regard to jurisdictional claims made in the text, published maps, institutional affiliations, or any other geographical representation in this paper. The authors bear the ultimate responsibility for providing appropriate place names. Views expressed in the text are those of the authors and do not necessarily reflect the views of the publisher.
This article is part of the special issue “Advances in ocean science from underwater gliders”. It is a result of the International Underwater Glider Conference 2024, Gothenburg, Sweden, 10–14 June 2024.
All authors acknowledge the G. Unger Vetlesen Foundation for the many years of support in conducting exploratory and capacity-building research across the greater Caribbean region.
This research has been supported by the National Science Foundation, Division of Ocean Sciences (grant nos. 2421622 and 1946412) and the G. Unger Vetlesen Foundation.
This paper was edited by Denise Fernandez and reviewed by Estel Font and Mathieu Gentil.
Beech, N., Rackow, T., Semmler, T., Danilov, S., Wang, Q., and Jung, T.: Long-term evolution of ocean eddy activity in a warming world, Nature Climate Change, 12, 910–917, https://doi.org/10.1038/s41558-022-01478-3, 2022.
Carton, J. A. and Chao, Y.: Caribbean Sea eddies inferred from TOPEX/POSEIDON altimetry and a ° Atlantic Ocean model simulation, Journal of Geophysical Research: Oceans, 104, 7743–7752, https://doi.org/10.1029/1998jc900081, 1999.
Casanova-Masjoan, M., Joyce, T. M., Pérez-Hernández, M. D., Vélez-Belchí, P., and Hernández-Guerra, A.: Changes across 66° W, the Caribbean Sea and the Western boundaries of the North Atlantic Subtropical Gyre, Progress in Oceanography, 168, 296–309, https://doi.org/10.1016/j.pocean.2018.09.013, 2018.
Chelton, D. B., deSzoeke, R. A., Schlax, M. G., El Naggar, K., and Siwertz, N.: Geographical Variability of the First Baroclinic Rossby Radius of Deformation, Journal of Physical Oceanography, 28, 433–460, https://doi.org/10.1175/1520-0485(1998)028<0433:GVOTFB>2.0.CO;2, 1998.
Frajka-Williams, E., Ansorge, I. J., Baehr, J., Bryden, H. L., Chidichimo, M. P., Cunningham, S. A., Danabasoglu, G., Dong, S. F., Donohue, K. A., Elipot, S., Heimbach, P., Holliday, N. P., Hummels, R., Jackson, L. C., Karstensen, J., Lankhorst, M., Le Bras, I. A., Lozier, M. S., McDonagh, E. L., Meinen, C. S., Mercier, H., Moat, B. I., Perez, R. C., Piecuch, C. G., Rhein, M., Srokosz, M. A., Trenberth, K. E., Bacon, S., Forget, G., Goni, G., Kieke, D., Koelling, J., Lamont, T., McCarthy, G. D., Mertens, C., Send, U., Smeed, D. A., Speich, S., van den Berg, M., Volkov, D., and Wilson, C.: Atlantic Meridional Overturning Circulation: Observed Transport and Variability, Frontiers in Marine Science, 6, https://doi.org/10.3389/fmars.2019.00260, 2019.
Gradone, J.: JGradone/RU29_69W: Final for publication, Zenodo [code], https://doi.org/10.5281/zenodo.18622052, 2026a.
Gradone, J.: Mesoscale Variability and Water Mass Transport of the Caribbean Current Revealed by High-Resolution Glider Observations, Zenodo [data set], https://doi.org/10.5281/zenodo.18332586, 2026b.
Gradone, J., Christopher, Wilson, W., Glenn, S., and Miles, T.: Upper Ocean Transport in the Anegada Passage From Multi-Year Glider Surveys, Journal of Geophysical Research: Oceans, 128, https://doi.org/10.1029/2022jc019608, 2023.
Gradone, J. C., Wilson, W. D., Glenn, S. M., and Miles, T. N.: Westward modification of Caribbean through-flow water mass structure, Deep Sea Research Part I: Oceanographic Research Papers, 225, 104581, https://doi.org/10.1016/j.dsr.2025.104581, 2025a.
Gradone, J. C., Miles, T. N., Palter, J. B., Glenn, S. M., and Wilson, W. D.: Warming and salinity changes of the upper ocean Caribbean through-flow since 1960, Sci. Rep., 15, 23157, https://doi.org/10.1038/s41598-025-05494-z, 2025b.
Heiderich, J. and Todd, R. E.: Along-Stream Evolution of Gulf Stream Volume Transport, Journal of Physical Oceanography, 50, 2251–2270, https://doi.org/10.1175/JPO-D-19-0303.1, 2020.
Hellweger, F. and Gordon, A.: Tracing Amazon River water into the Caribbean Sea, J. Mar. Res., 60, 537–549, 2002.
Huang, M., Liang, X., Yang, Y., and Zhang, Y.: ENSO Modulates Mean Currents and Mesoscale Eddies in the Caribbean Sea, Geophysical Research Letters, 50, https://doi.org/10.1029/2023gl103958, 2023.
Iselin, C. O. D.: The influence of vertical and lateral turbulence on the characteristics of the waters at mid-depths, Eos, Transactions American Geophysical Union, 20, 414–417, https://doi.org/10.1029/TR020i003p00414, 1939.
Johns, W., Townsend, T., Fratantoni, D., and Wilson, W.: On the Atlantic inflow to the Caribbean Sea, Deep Sea Research Part I: Oceanographic Research Papers, 49, 211–243, https://doi.org/10.1016/s0967-0637(01)00041-3, 2002.
Jouanno, J., Sheinbaum, J., Barnier, B., Molines, J.-M., Debreu, L., and Lemarié, F.: The mesoscale variability in the Caribbean Sea. Part I: Simulations and characteristics with an embedded model, Ocean Modelling, 23, 82–101, https://doi.org/10.1016/j.ocemod.2008.04.002, 2008.
Jouanno, J., Sheinbaum, J., Barnier, B., and Molines, J.-M.: The mesoscale variability in the Caribbean Sea. Part II: Energy sources, Ocean Modelling, 26, 226–239, https://doi.org/10.1016/j.ocemod.2008.10.006, 2009.
Kirchner, K., Rhein, M., Mertens, C., Böning, C. W., and Hüttl, S.: Observed and modeled meridional overturning circulation related flow into the Caribbean, Journal of Geophysical Research, 113, https://doi.org/10.1029/2007jc004320, 2008.
Kirchner, K., Rhein, M., Hüttl-Kabus, S., and Böning, C. W.: On the spreading of South Atlantic Water into the Northern Hemisphere, Journal of Geophysical Research, 114, https://doi.org/10.1029/2008jc005165, 2009.
Locarnini, R. A., Mishonov, A. V., Baranova, O. K., Boyer, T. P., Zweng, M. M., Garcia, H. E., Reagan, J. R., Seidov, D., Weathers, K. W., Paver, C. R., and Smolyar, I. V.: World Ocean Atlas 2018, NOAA Atlas NESDIS 81, Vol. 1: Temperature, 52, https://doi.org/10.25923/e5rn-9711, 2019.
López-Álzate, M. E., Sayol, J.-M., Hernández-Carrasco, I., Osorio, A. F., Mason, E., and Orfila, A.: Mesoscale eddy variability in the Caribbean Sea, Ocean Dynamics, 72, 679–693, https://doi.org/10.1007/s10236-022-01525-9, 2022.
Mason, E., Pascual, A., and McWilliams, J. C.: A New Sea Surface Height–Based Code for Oceanic Mesoscale Eddy Tracking, Journal of Atmospheric and Oceanic Technology, 31, 1181–1188, https://doi.org/10.1175/JTECH-D-14-00019.1, 2014.
McDougall, T. J., Barker, P. M., Fernandes, F., Firing, E., and Ådlandsvik, B.: GSW-Python: Gibbs SeaWater (GSW) Oceanographic Toolbox for Python, Zenodo [code], https://doi.org/10.5281/zenodo.5214122, 2021.
Menezes, V.: Cruise Report of the 2021 A22 US GO-SHIP Reoccupation, US GO-SHIP Program, Woods Hole Oceanographic Institution, https://cchdo.ucsd.edu/data/24670/325020210420_do.pdf (last access: 19 February 2026), 2022.
Montgomery, R. B.: Circulation in the upper layers of southern North Atlantic deduced with use of isentropic analysis, Pap. Phys. Oceanogr. Meteorol., 6, 55 pp., 1938.
Morrison, J. M. and Nowlin Jr., W. D.: General distribution of water masses within the eastern Caribbean Sea during the winter of 1972 and fall of 1973, Journal of Geophysical Research: Oceans, 87, 4207–4229, https://doi.org/10.1029/JC087iC06p04207, 1982.
Nelepo, B. A., Stepanov, V. N., Bulatov, R. P., and Domanov, M. M.: Soviet investigations of the dynamics and properties of the waters of the Caribbean Sea and Gulf of Mexico. CICAR II, Symposium on Progress in Marine Research in the Caribbean and Adjacent Regions, Caracas, FAO Fisheries Report, Vol. 200, 119–131, ISBN 92-5-000707-8, 1976.
Perret, G., Dubos, T., and Stegner, A.: How Large-Scale and Cyclogeostrophic Barotropic Instabilities Favor the Formation of Anticyclonic Vortices in the Ocean, Journal of Physical Oceanography, 41, 303–328, https://doi.org/10.1175/2010JPO4362.1, 2011.
Poole, R. and Tomczak, M.: Optimum multiparameter analysis of the water mass structure in the Atlantic Ocean thermocline, Deep Sea Research Part I: Oceanographic Research Papers, 46, 1895–1921, https://doi.org/10.1016/s0967-0637(99)00025-4, 1999.
Rhein, M., Kirchner, K., Mertens, C., Steinfeldt, R., Walter, M., and Fleischmann-Wischnath, U.: Transport of South Atlantic water through the passages south of Guadeloupe and across 16° N, 2000–2004, Deep Sea Research Part I: Oceanographic Research Papers, 52, 2234–2249, https://doi.org/10.1016/j.dsr.2005.08.003, 2005.
Richardson, P. L.: Caribbean Current and eddies as observed by surface drifters, Deep Sea Research Part II: Topical Studies in Oceanography, 52, 429–463, https://doi.org/10.1016/j.dsr2.2004.11.001, 2005.
Roemmich, D.: Circulation of the Caribbean Sea: A well-resolved inverse problem, Journal of Geophysical Research: Oceans, 86, 7993–8005, 1981.
Roquet, F., Madec, G., Brodeau, L., and Nycander, J.: Defining a Simplified Yet “Realistic” Equation of State for Seawater, Journal of Physical Oceanography, 45, 2564–2579, https://doi.org/10.1175/JPO-D-15-0080.1, 2015.
Rousset, C. and Beal, L. M.: Closing the transport budget of the Florida Straits, Geophysical Research Letters, 41, 2460–2466, https://doi.org/10.1002/2014GL059498, 2014.
Schmitz, W. J. and Richardson, P. L.: On the sources of the Florida Current, Deep Sea Research Part A. Oceanographic Research Papers, 38, S379–S409, https://doi.org/10.1016/s0198-0149(12)80018-5, 1991.
Schofield, O., Kohut, J., Aragon, D., Creed, L., Graver, J., Haldeman, C., Kerfoot, J., Roarty, H., Jones, C., Webb, D., and Glenn, S.: Slocum Gliders: Robust and ready, Journal of Field Robotics, 24, 473–485, https://doi.org/10.1002/rob.20200, 2007.
Schott, F. A., Fischer, J., and Stramma, L.: Transports and Pathways of the Upper-Layer Circulation in the Western Tropical Atlantic, Journal of Physical Oceanography, 28, 1904–1928, https://doi.org/10.1175/1520-0485(1998)028<1904:TAPOTU>2.0.CO;2, 1998.
Shrikumar, A., Lawrence, R., and Casciotti, K. L.: PYOMPA version 0.3, Authorea [preprint], https://doi.org/10.1002/essoar.10507053.2, 2022.
Simpson, J., Dickey, T., and Koblinsky, C.: An offshore eddy in the California current system Part I: Interior dynamics, Progress in Oceanography, 13, 5–49, 1984.
Stramma, L. and Schott, F.: The mean flow field of the tropical Atlantic Ocean, Deep Sea Research Part II: Topical Studies in Oceanography, 46, 279–303, https://doi.org/10.1016/S0967-0645(98)00109-X, 1999.
Todd, R. E., Rudnick, D. L., Sherman, J. T., Owens, W. B., and George, L.: Absolute Velocity Estimates from Autonomous Underwater Gliders Equipped with Doppler Current Profilers, Journal of Atmospheric and Oceanic Technology, 34, 309–333, https://doi.org/10.1175/jtech-d-16-0156.1, 2017.
Tomczak, M. and Large, D. G. B.: Optimum multiparameter analysis of mixing in the thermocline of the eastern Indian Ocean, Journal of Geophysical Research, 94, 16141, https://doi.org/10.1029/jc094ic11p16141, 1989.
Valencia-Gasti, J. A., Camacho-Ibar, V. F., and Herguera, J. C.: Water Mass Structure and Mixing Fractions in the Deepwater Region of the Gulf of Mexico, Journal of Geophysical Research: Oceans, 127, https://doi.org/10.1029/2021jc017705, 2022.
Visbeck, M.: Deep Velocity Profiling Using Lowered Acoustic Doppler Current Profilers: Bottom Track and Inverse Solutions, Journal of Atmospheric and Oceanic Technology, 19, 794–807, https://doi.org/10.1175/1520-0426(2002)019<0794:dvpula>2.0.co;2, 2002.
Worthington, L. V.: The 18° water in the Sargasso Sea, Deep Sea Research (1953), 5, 297–305, https://doi.org/10.1016/0146-6313(58)90026-1, 1958.
Wunsch, C. and Grant, B.: Towards the general circulation of the North Atlantic Ocean, Progress in Oceanography, 11, 1–59, 1982.
Wüst, G.: On the stratification and the circulation in the cold water sphere of the Antillean-Caribbean basins An abstract, Deep Sea Research and Oceanographic Abstracts, 10, 165–187, https://doi.org/10.1016/0011-7471(63)90354-1, 1963.
Zhang, D., McPhaden, M. J., and Johns, W. E.: Observational Evidence for Flow between the Subtropical and Tropical Atlantic: The Atlantic Subtropical Cells, Journal of Physical Oceanography, 33, 1783–1797, https://doi.org/10.1175/2408.1, 2003.
Zweng, M. M., Reagan, J. R., Seidov, D., Boyer, T. P., Locarnini, R. A., Garcia, H. E., Mishonov, A. V., Baranova, O. K., Weathers, K. W., Paver, C. R., and Smolyar, I. V.: World Ocean Atlas 2018, NOAA Atlas NESDIS 82, Vol. 2: Salinity, 50, https://doi.org/10.25923/9pgv-1224, 2019.