the Creative Commons Attribution 4.0 License.
the Creative Commons Attribution 4.0 License.
 | 20 Jan 2026
Remineralisation changes dominate oxygen variability in the North Atlantic
Elaine L. McDonagh
Siv K. Lauvset
Charles E. Turner
Thomas W. N. Haine
Nadine Goris
Richard Sanders
Oxygen is fundamental to ocean biogeochemical processes, with deoxygenation potentially reducing biodiversity, and disrupting biogeochemical cycles. In recent decades, the global ocean oxygen concentration has been decreasing, but this decrease is underestimated in numerical ocean models by as much as 50 %. Mechanisms responsible for this deoxygenation include (i) solubility-driven deoxygenation due to ocean warming, and (ii) changes in the remineralised signal due to either a change in the supply of biological material to depth or a change in circulation leading to change in the residence time of water, and hence the accumulation of the remineralised oxygen deficit, or a combination of both. The magnitude of oxygen change due to each process is currently unclear. Here, we describe and implement a new method to decompose oxygen change into its constituent parts by linking each process to concomitant changes in temperature and dissolved inorganic carbon. Using observations on a repeated section of the North Atlantic at 24.5° N, we show that the consistent oxygen decrease observed since 1992 in the upper 2000 m has been dominated by an increase in remineralisation-related oxygen-consumption. While warming-driven solubility changes have a much smaller impact on the upper ocean in comparison, their impact has trebled in the past twenty years, suggesting they will become an increasingly significant driver of deoxygenation with future warming. Remineralisation-related oxygen consumption peaks at a depth of approximately 600 m, where it is responsible for up to 70 % of the total deoxygenation. While this study does not determine the exact cause of the remineralisation-driven change, little change in primary productivity has been observed in the region, suggesting that a change in ocean circulation is indirectly driving the majority of deoxygenation in the Subtropical North Atlantic, via a non-local change in remineralisation.
- Article
(5197 KB) - Full-text XML
- BibTeX
- EndNote


Oxygen is a fundamental component of biogeochemical processes in the ocean. A change in the ocean oxygen content can result in major changes in biodiversity, and biogeochemical cycles (Gruber, 2011; Morée et al., 2023). Since the mid-20th century, both open ocean and coastal waters have experienced a marked decline in oxygen concentration (Stramma et al., 2008; Diaz and Rosenberg, 2008; Keeling et al., 2010; Helm et al., 2011), with approximately a 2 % reduction in open ocean oxygen concentrations over the past 50 years (Schmidtko et al., 2017). However, there is disagreement between observations of oxygen change and results of Coupled Model Intercomparison Project (CMIP) model simulations (Oschlies et al., 2017; Takano et al., 2023; Abe and Minobe, 2023), both in terms of magnitude and spatial patterns, with models simulating a decline in the global ocean oxygen inventory that is only approximately half of the observed deoxygenation (Oschlies et al., 2018). While there are many different processes driving deoxygenation, some of which are not necessarily accurately represented by the models, it is unclear which of these processes is responsible for the too conservative decline in the models.
Oxygen enters the surface ocean via rapid exchange with the atmosphere. While some enters the interior ocean, deoxygenation occurs with depth due to an imbalance between ventilation and the consumption of organic matter at depth (Levin, 2018). Oxygen concentrations are sensitive to ocean warming via temperature-driven changes in solubility. Ocean oxygen and heat content are therefore highly inversely correlated, with a sharp rise in heat content and concurrent deoxygenation observed from the mid 1980s (Ito et al., 2017). While warming-induced solubility changes may be a significant driver of deoxygenation in the upper ocean (Shaffer et al., 2009; Helm et al., 2011), the total ocean oxygen loss has been shown to be around 3-4 times higher than expected from the direct impact of warming alone (Oschlies, 2021), indicating that other mechanisms play a significant role. The remaining warming has been linked to changes in ventilation and circulation, which can lead to changes in the residence time of the water, allowing for more remineralisation to occur (Oschlies et al., 2018; Schmidtko et al., 2017).
Warming ocean temperatures also impact oxygen concentrations indirectly via altering key terms such as stratification or biological processes (Breitburg et al., 2018; Stendardo and Gruber, 2012; Keeling et al., 2010). Acceleration of oxygen consumption rates leads to changes in the depth distribution of oxygen loss as the respiration of organic matter occurs at shallower depths (Brewer and Peltzer, 2017; Oschlies, 2021). Increases in ocean stratification and freshwater fluxes account for a significant amount of the remaining global oxygen loss, via changes in ventilation and nutrient supply (Bopp et al., 2013; Long et al., 2016). Circulation changes also influence oxygen concentration, driving spatial variation in mixed layer depths, and altering water mass residence times (Palter and Trossman, 2018). In deep waters, changes in oxygen are predominantly driven by a change in the balance between ventilation, and the consumption of oxygen via the respiration of sinking particulate organic matter (Matear and Hirst, 2003).
It has been hypothesised that the disparity between observational and modelled oxygen decline is due to uncertainty in either historic atmospheric forcing data, the representation of biogeochemical processes in models (Oschlies et al., 2017), or coarse resolution models not accurately representing changes in circulation and ventilation (Buchanan and Tagliabue, 2021). Projections show an acceleration of the observed deoxygenation with ongoing climate change (Bopp et al., 2013; Keeling et al., 2010), so understanding the causes of disparities between model results and observations is imperative for accurate predictions of future global oxygen changes.
To allow for a better understanding of these disparities, we use a new method to apportion any oxygen changes due to each potential driving mechanism, by linking those changes to related changes in the driving mechanisms of temperature and the concentration of dissolved inorganic carbon (DIC). This is based on a method previously used to divide temperature changes into excess changes and redistribution (Turner et al., 2022). Here, excess changes are defined as oxygen being added/removed from the system via a change in solubility, and redistribution is of the background oxygen already in the system. We consider two additional drivers: changes due to remineralisation, either locally or upstream, and a change in the disequilibrium between the surface ocean and atmosphere when the oxygen was first absorbed, leading to changes in air-sea fluxes. We apply this method to observations from the subtropical North Atlantic, at 24.5° N, the most frequently surveyed transoceanic section, with six cruises over 23 years between 1992 and 2015. Over this period, the region has experienced a notable oxygen decline (Stendardo and Gruber, 2012), increased temperature and salinity (Turner, 2024), increased accumulation of anthropogenic carbon (Guallart et al., 2015), and trends in cross-section transport, with a decrease in the northward flow of Antarctic Intermediate Water (Hernández-Guerra et al., 2014).
2.1 Data and processing
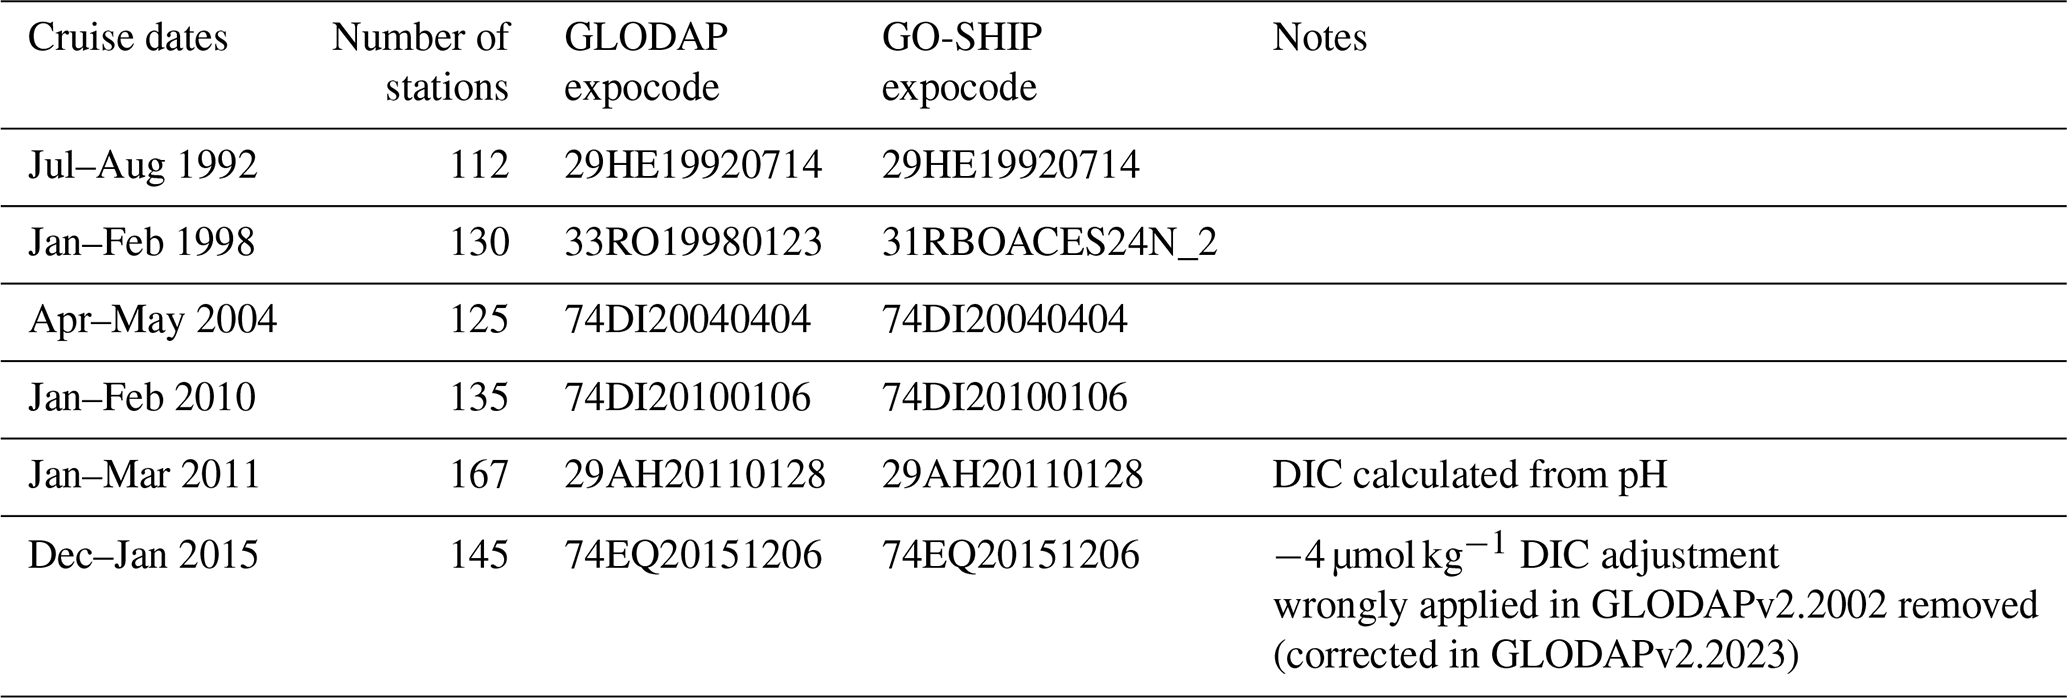
We use GLODAPv2.2002 (Lauvset et al., 2022; Olsen et al., 2016; Key et al., 2015) potential temperature, DIC, and oxygen bottle measurements. The GLODAP data product has undergone extensive quality control, with adjustments applied when required, in order to remove any biases between cruises (Olsen et al., 2016). Using DIVA (Data-Interpolating Variational Analysis) gridding techniques (Barth et al., 2014), we interpolate the GLODAP bottle data with the same method as Turner (2024) onto the GO-SHIP Easy Ocean (Katsumata et al., 2024) A05 section. We then map the A05 section onto a regular grid with 651 vertical levels and 670 longitude points, giving a resolution of 10 m depth by 0.1° longitude. The A05 hydrographic section is located at approximately 24.5° N, spanning 80–13° W across the subtropical North Atlantic (Fig. 1a). The section was sampled in six GO-SHIP cruises, and the collection and analyses of these samples followed standard operating procedures as outlined in the GO-SHIP manuals (Langdon, 2010; Dickson et al., 2007). The six cruises were conducted between 1992 and 2015 (Table A1), with the average profiles and sections of temperature, DIC and oxygen shown in Fig. 1b–g. We quantify changes in oxygen concentration, potential temperature, and DIC by computing the difference between measurements obtained during the initial cruise in 1992 and those obtained in each subsequent cruise (e.g., 1998 minus 1992, 2004 minus 1992, and so forth).
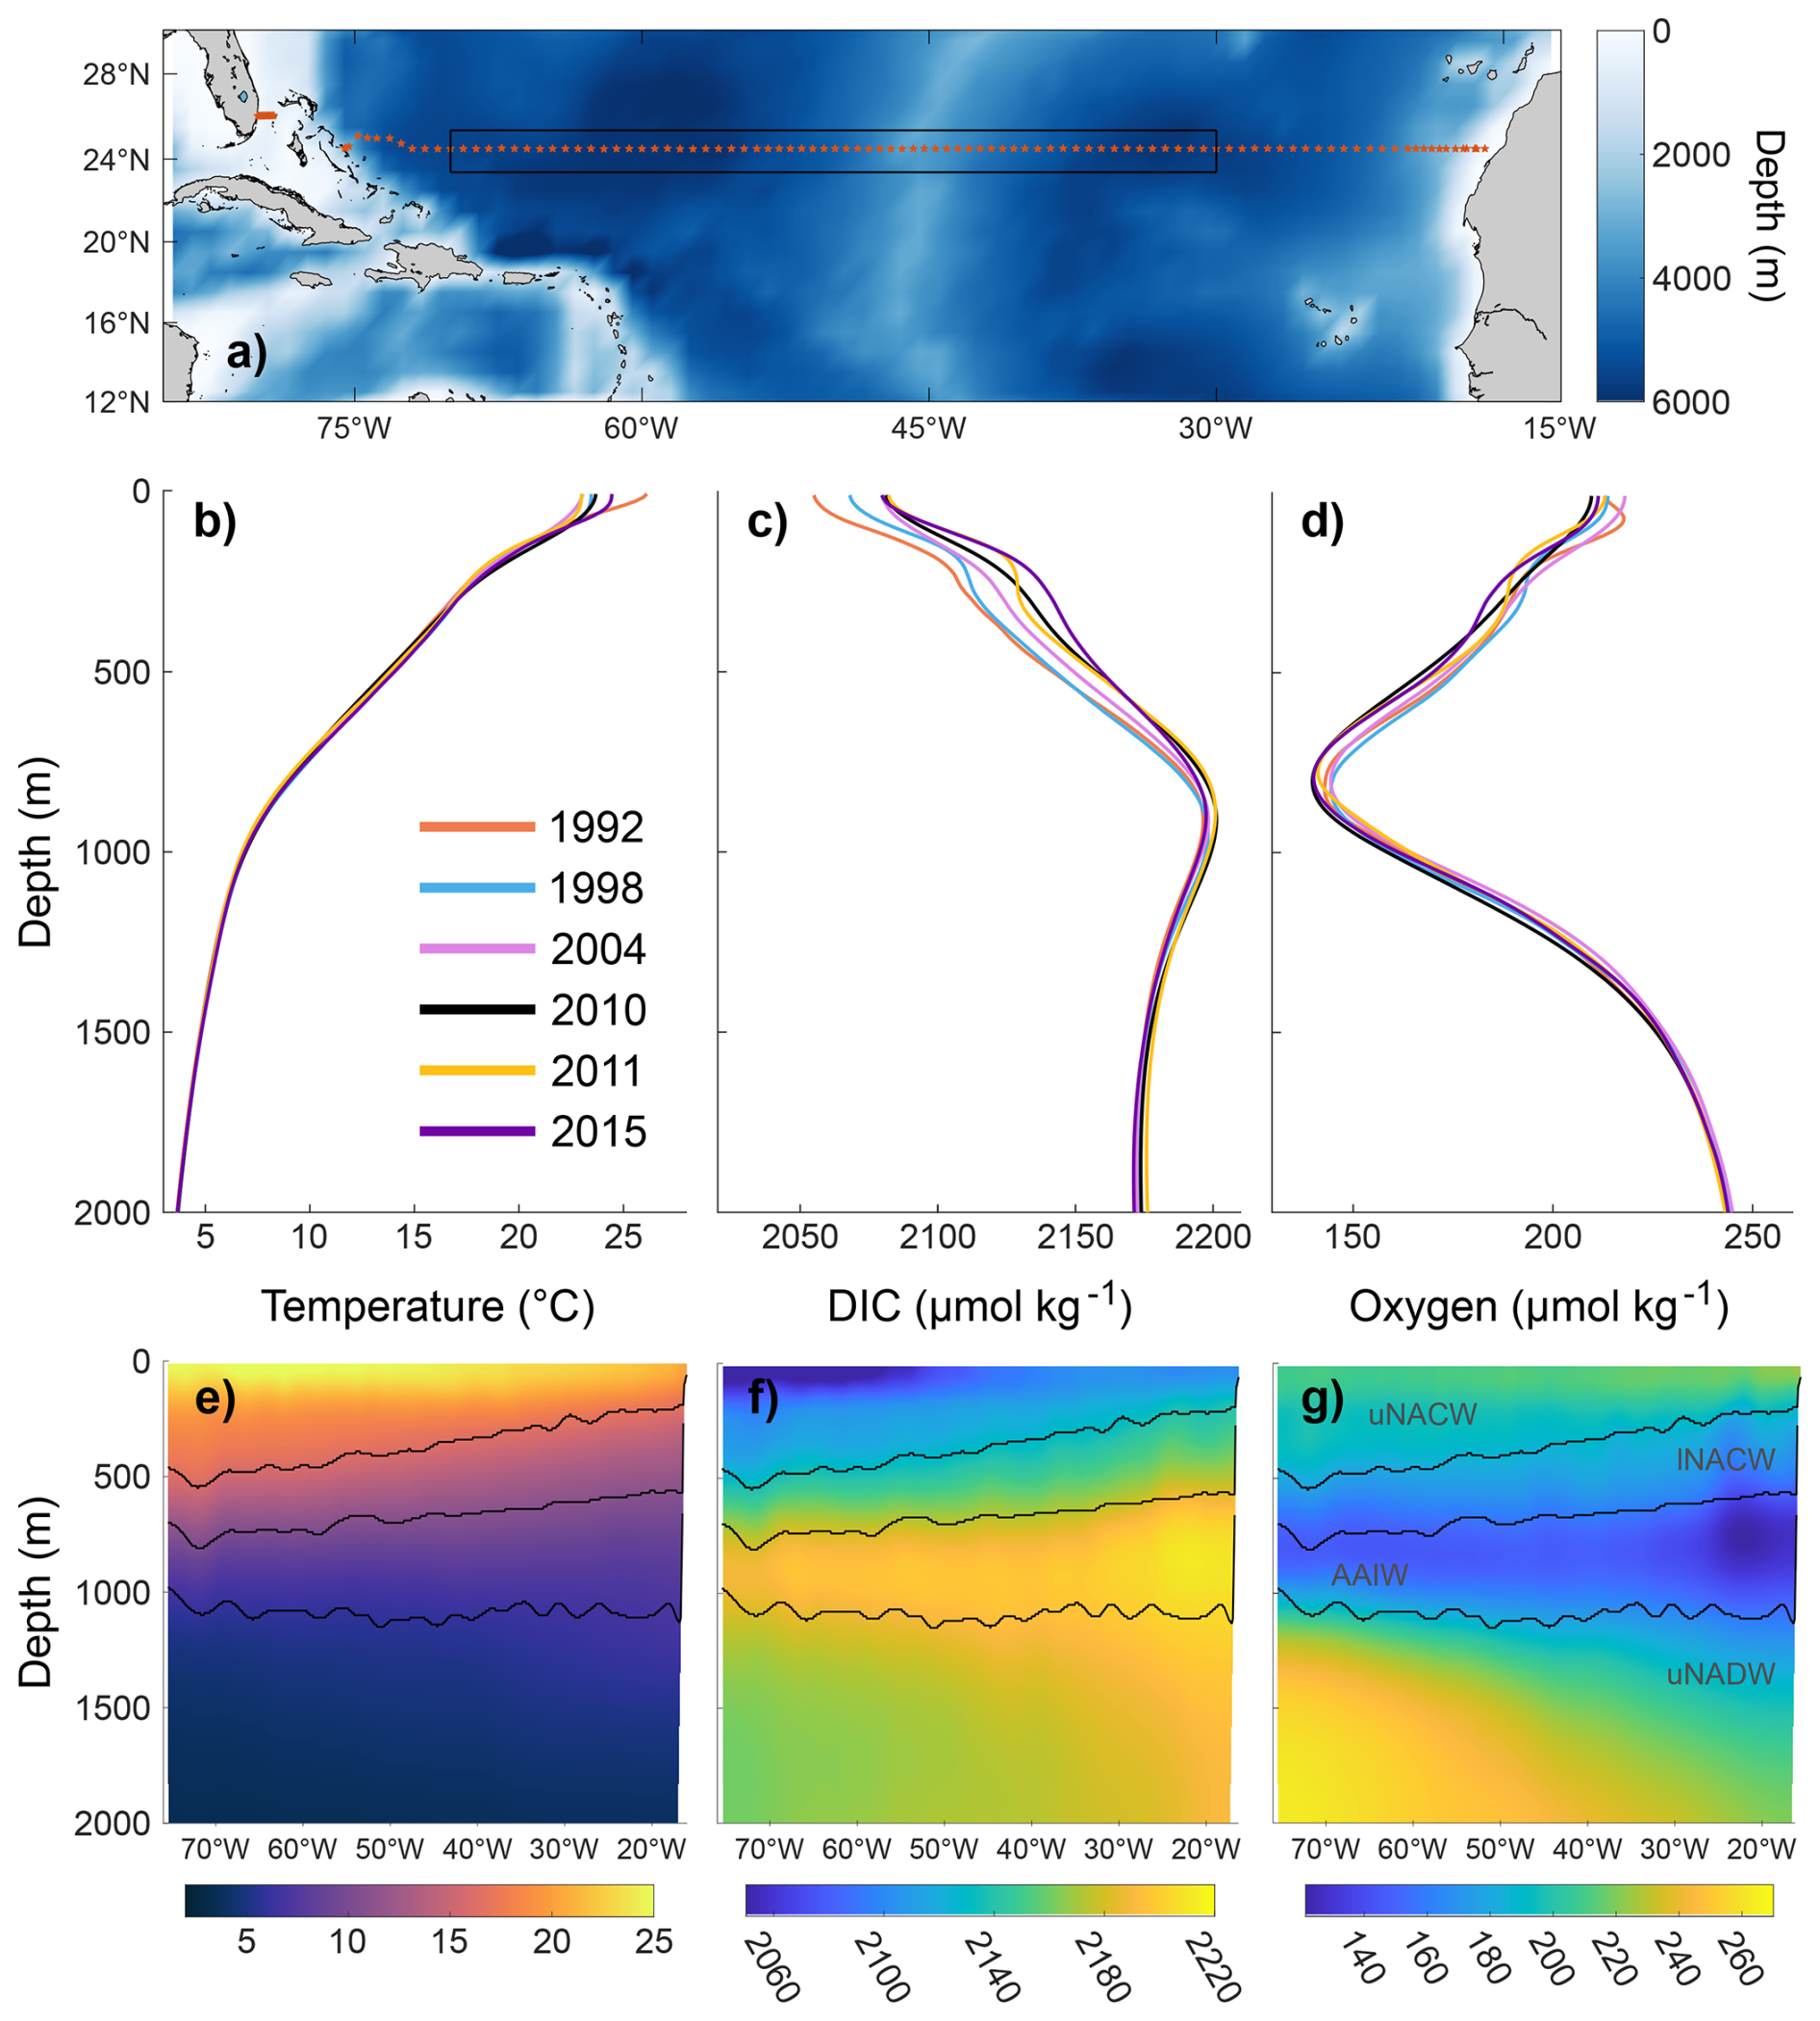
Figure 1(a) Map of the A05 cruise transect overlaid on background bathymetry (m) (NOAA National Centers for Environmental Information, 2022). Red markers show the positions of the CTD stations occupied in 1992, and the black box is the central region, averaged over in (b)–(d) The spatially-averaged (b) potential temperature (°C), (c) DIC (µmol kg−1) and (d) oxygen (µmol kg−1) profiles of the A05 section for the six cruises between 1992 and 2015. (e–g) The temporal average of the same properties, with contours showing the upper (uNACW, σ0<26.7 k m−3) and lower North Atlantic Central Water (lNACW, 26.7 kg m kg m−3), Antarctic Intermediate Water (AAIW, 27.2 kg m kg m−3), and upper North Atlantic Deep Water (uNADW, σ0>27.6 kg m−3 and σ2<37 kg m−3) based on definitions in Guallart et al. (2015) and labelled in (g).
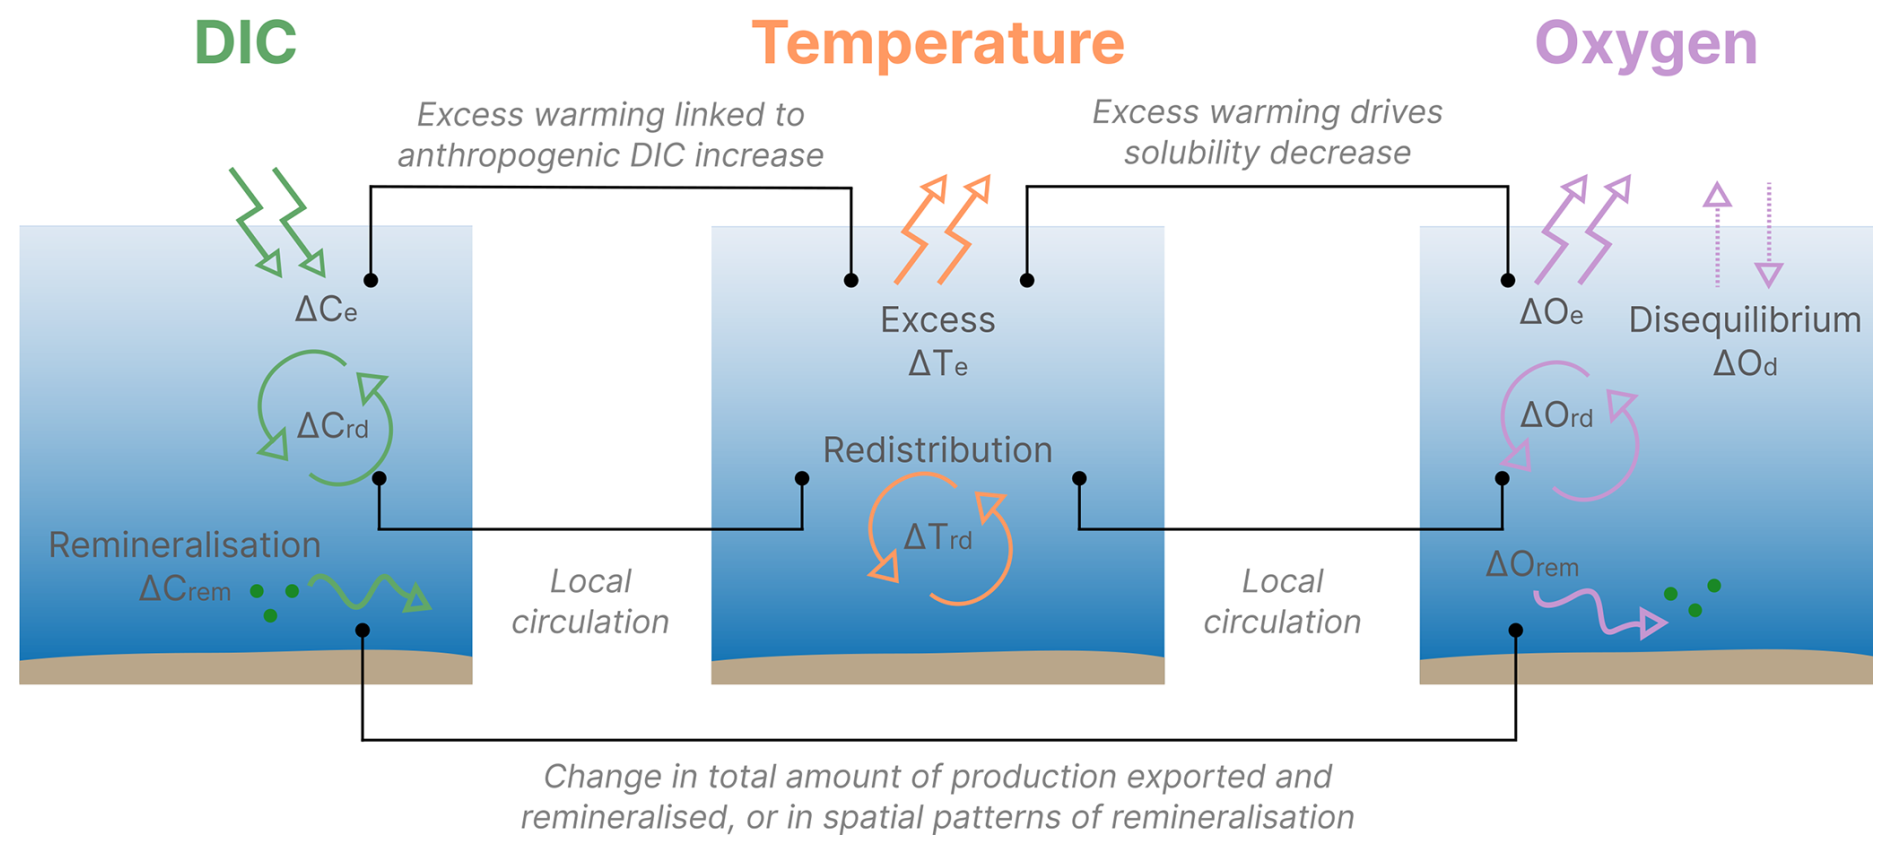
Figure 2Schematic illustrating the links between the different processes driving changes in oxygen, temperature, and DIC, along with the coefficients used to link the processes. The subscript “e” represents excess change, “rd” redistributed change, “rem” remineralised change, and “d” disequilibrium change.
2.2 Processes driving oxygen change
We define the total change in oxygen as the sum of four distinct changes (Fig. 2): (1) change in the excess oxygen (ΔOe), (2) redistribution of the background field (ΔOrd), (3) change in the amount of remineralisation (ΔOrem), and (4) change due to variability in sea surface disequilibrium (ΔOd). Excess changes are those due to changes in sea surface temperature which alter solubility – this component is the warming-driven deoxygenation. The vertical redistribution of the oxygen already in the water column is a result of local circulation changes, or reorganization of the local oxygen structure, and so will sum to zero globally. It is a result of the local movement or change in the distribution of water masses, and occurs on all time scales associated with local variability in circulation, which is well measured at the A05 section (Frajka-Williams et al., 2019). Our assumption, following Turner (2024), is that these redistributed changes are linked by local stratification in theta-oxygen-DIC space. While we determine the interannual changes in redistribution well, we do not resolve them well on shorter timescales, as they vary on timescales much faster than the nominal GO-SHIP repeat of ∼5 years at this latitude. However, we are interested in the longer-term changes in water mass properties, which are resolved by the ∼5 year frequency.
Changes in remineralisation can be either due to a change in the rate of export of organic matter leading to an altered rate of remineralisation at depth, or to changes in the spatial patterns of remineralisation, i.e. because changes in large scale circulation patterns affect the residence time of water and hence the accumulation of the remineralised oxygen deficit. A change in the remineralisation term at 24° N reflects a change in the accumulated remineralisation signal of that water mass since subduction. The final term, disequilibrium change is due to the change in saturation levels when the water mass was initially subducted, which changes the potential amount of oxygen that can be absorbed by the surface ocean.
These mechanisms are shown schematically in Fig. 2. By linking each of these mechanisms to simultaneous changes in temperature and DIC, we develop a set of equations that can be solved to calculate the magnitude of each process. The total temperature change is the sum of only excess and redistributed temperature changes, while total DIC change is defined as a sum of the excess, redistributed and remineralisation changes of DIC. Excess DIC change is dominated by the anthropogenic increase (Turner, 2024), and has an associated temperature change. Isolating this excess change means that we can also calculate the remaining redistribution component of temperature change. Since the redistribution of all three properties is driven by local changes in stratification (or distribution of water masses), we can use the redistribution of temperature to calculate the redistribution of DIC and oxygen. The remaining DIC change, due to the production of DIC during remineralisation, is connected to the associated loss of oxygen. The disequilibrium oxygen term remains weakly constrained as it is not directly linked to another process. A disequilibrium term is not included for DIC because, while disequilibrium does affect surface CO2 concentrations, this term is instead incorporated in the coefficient relating any excess DIC and temperature changes, described in Sect. 2.3.
The total change in potential temperature (ΔT), DIC (ΔC), and oxygen (ΔO) is thus described by the following equations:
where the subscript “e”, “rd”, “rem”, and “d” relate to excess, redistribution, remineralisation, and disequilibrium change, respectively. Each of these contributions are currently unknown. However, by defining coefficients that link the individual components of temperature, DIC, and oxygen change, we can form a system of equations that can be solved to obtain the magnitude of each process driving oxygen change. The calculation of these coefficients is described below, along with the final system of equations, while the full derivation is shown in the Appendix. We only look at the upper 2000 m of the water column because the changes in the deeper ocean over the period that the A05 section has been occupied are smaller than the accuracy of the GLODAP data, particularly for DIC.
2.3 Links between excess changes
Excess changes in oxygen and DIC are both linked to excess changes in temperature, via different mechanisms. Changes in surface heat fluxes lead to changes in solubility, and therefore oxygen concentration, while an almost linear relationship exists between ocean heat and carbon content, both on local and global scales (Bronselaer and Zanna, 2020), due to the oceanic uptake of heat and carbon as a response to anthropogenic CO2 emissions.
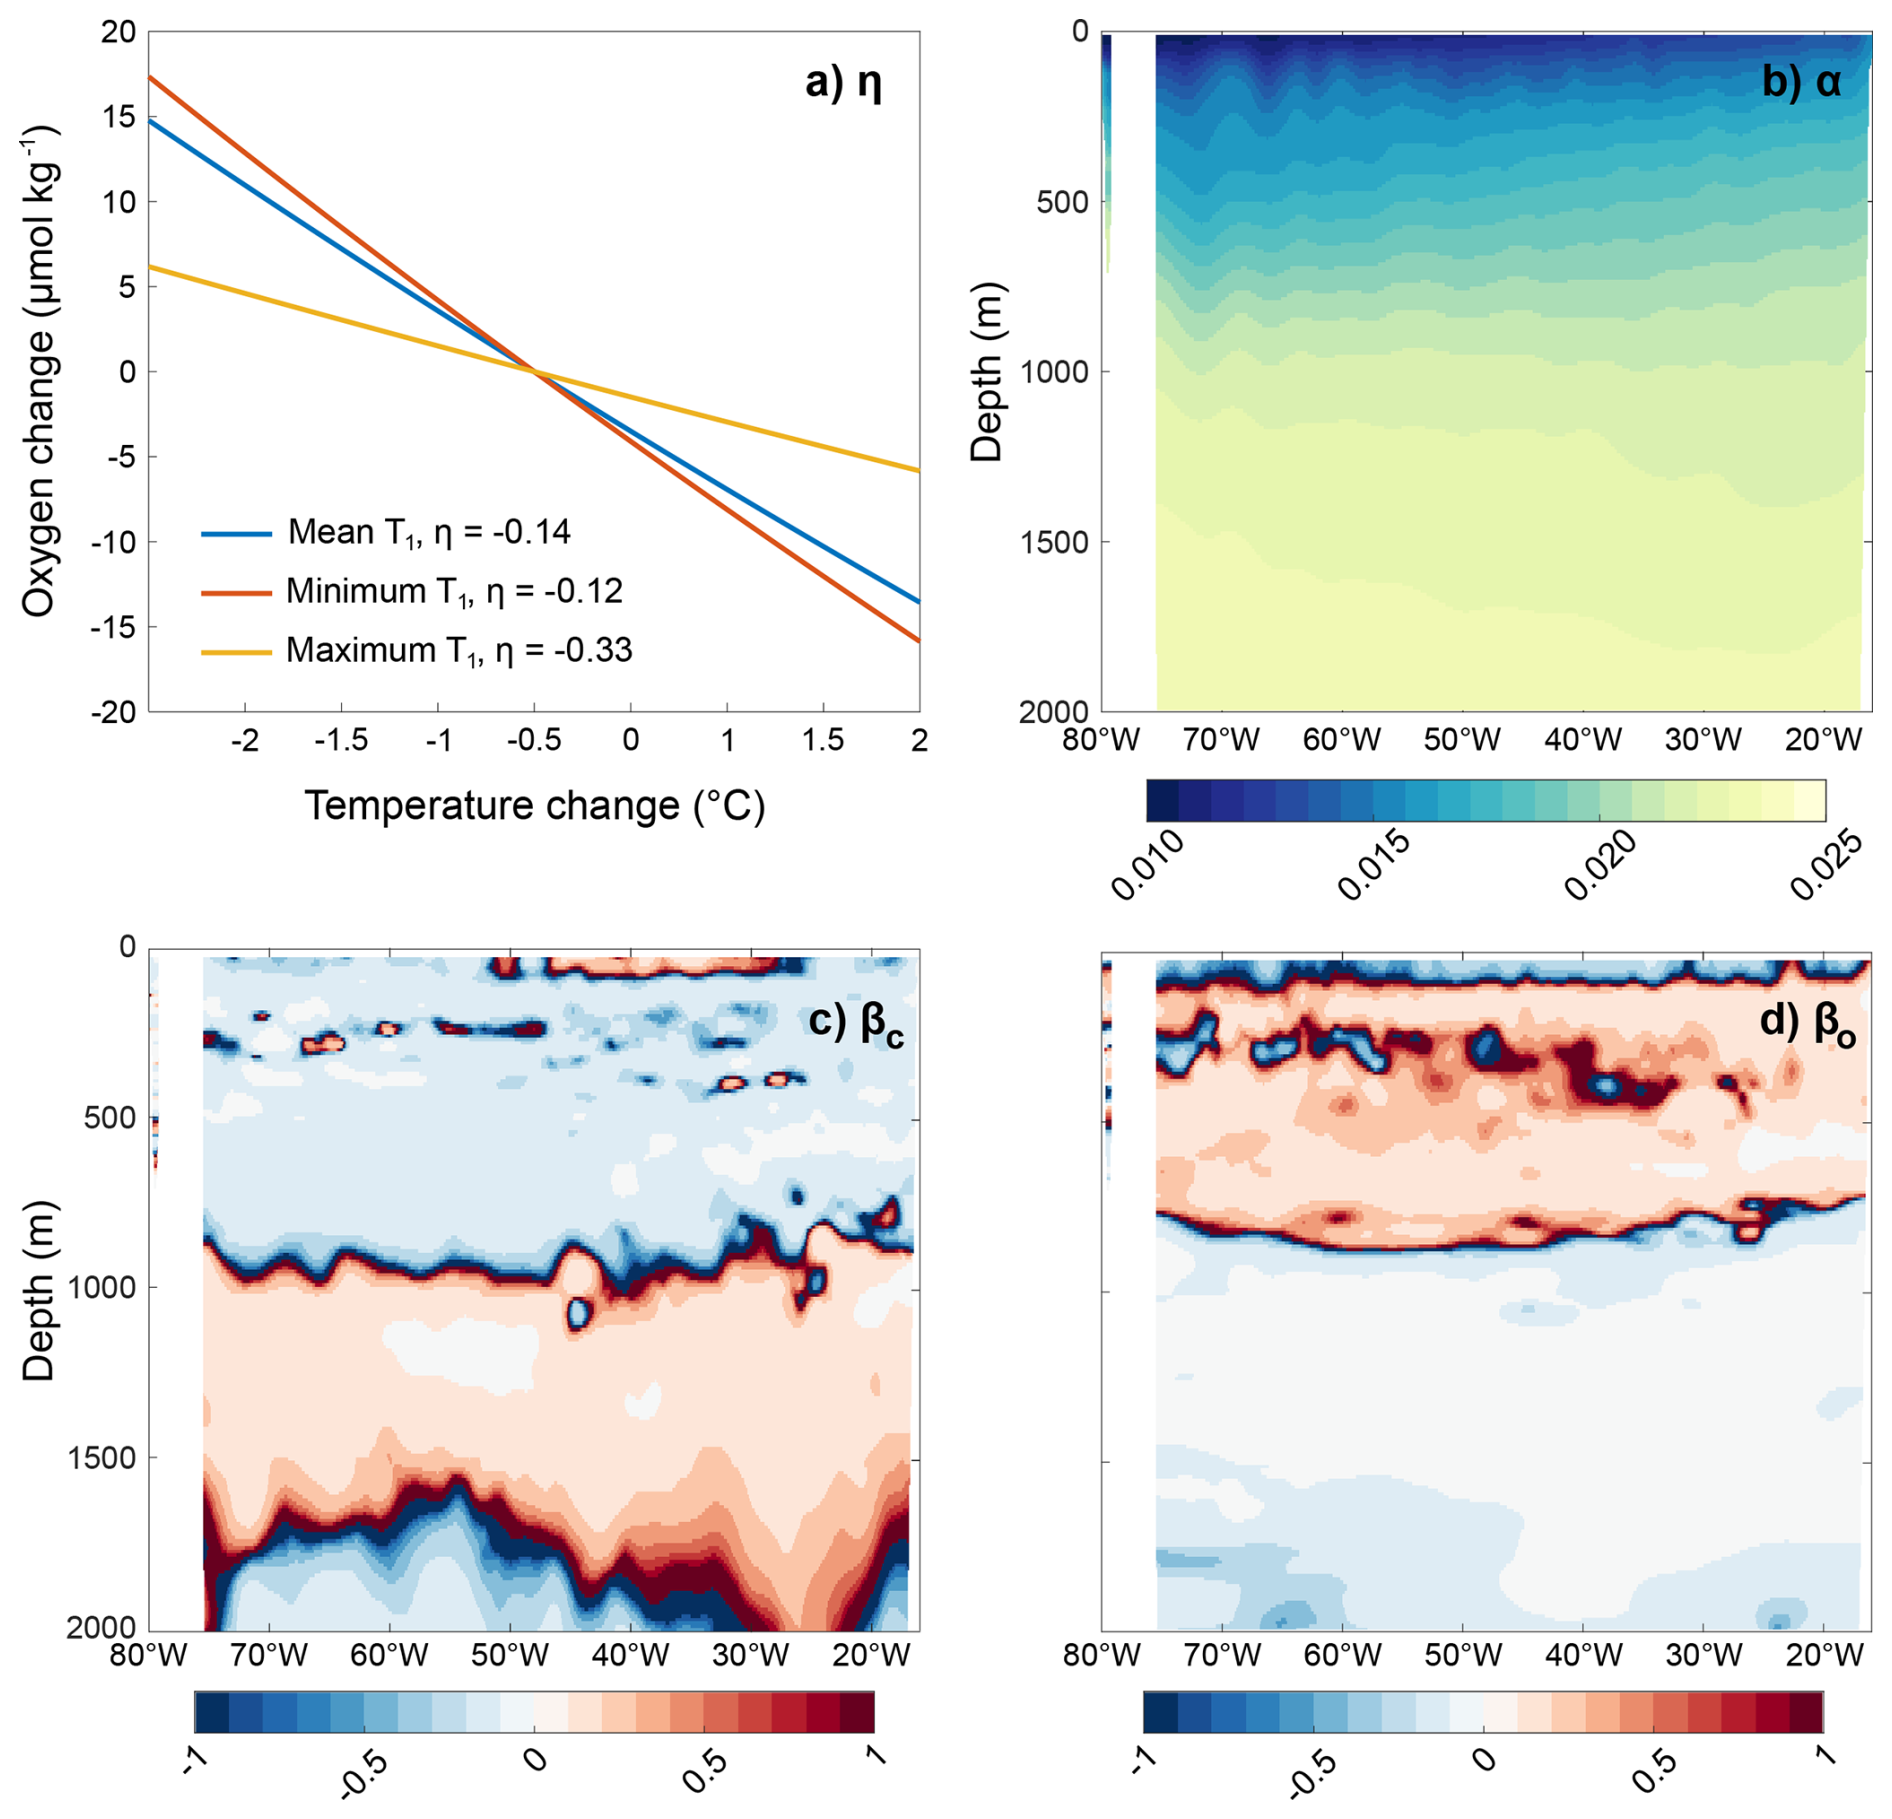
Figure 3(a) The solubility curve, showing how oxygen concentration changes with temperature due to solubility. The blue, red and yellow lines show the curve given the average, minimum and maximum initial (1992) temperature on the A05 section. Assuming a linear change over these temperature ranges, the gradient of the line gives the coefficient η, linking excess temperature change and excess oxygen change, at each longitude-depth point. (b) The coefficient α (°C (µmol/kg)−1), representing the relationship between excess potential temperature changes and excess DIC change. (c, d) The coefficients βC and βO (°C (µmol/kg)−1), linking redistribution-driven changes in temperature with redistribution-driven changes in DIC and oxygen, respectively. Each coefficient is calculated from the 1992 occupation of the A05 section, as this is the earliest occupation and so least impacted by excess changes.
Excess oxygen changes are due to temperature-driven change in solubility, a relationship that is close to linear over the observed temperature ranges on the A05 section (Fig. 3a). This relationship is described by the coefficient η, the gradient of the temperature-oxygen solubility curve, assuming 100 % saturation and using the temperature during the 1992 cruise as the initial temperature of the curve. Within the A05 section, the coefficient has a range of −0.33 to −0.12 °C (µmol/kg)−1, and increases with depth. The effect of oxygen under-/over-saturation is not incorporated in this coefficient since the saturation level is not known. Instead, adjustments for saturation effects are addressed through the inclusion of disequilibrium change as a distinct oxygen change term. The relationship between excess oxygen and temperature change is described by Eq. (4):
To describe the relationship between excess temperature and excess DIC, we use a temperature-dependent coefficient, α, (Turner et al., 2022). Equation (6) defines the relationship between the excess temperature and excess DIC terms. This coefficient was approximated as uniform via Eq. (5), following Turner (2024). The coefficient α varies between 0.010 and 0.024 °C (µmol/kg)−1 within the A05 section in 1992, and increases with depth (Fig. 3b), similar to η. We use the initial (1992) values for α, however temporal variability in the coefficient is minimal over these timescales, with a mean difference on the order of 10−6 µmol kg−1. Since α describes the observed relationship between the excess component of DIC and temperature, it also takes into account any impact that the change in CO2 saturation has on the surface flux. Separating this effect would be non-trivial and add extra unknowns into the equation, so it is simply included as part of the excess term and no DIC disequilibrium term is introduced:
2.4 Link between redistributed terms
The redistribution coefficients βC and βO relate vertical redistribution driven changes in temperature to redistribution driven changes in DIC and oxygen, at a given geographical location. Each coefficient is approximated by the ratio of stratification between temperature and DIC/oxygen, following Turner (2024):
Within the A05 section, βC has a mean value of −0.043 °C (µmol/kg)−1 (Fig. 3c), and is primarily negative in the upper 1000 m as temperature decreases with depth while DIC increases. The coefficient then transitions to positive at ∼1000 m as DIC concentration reaches a maximum and begins to decrease slightly. βO has a mean of −0.048 °C (µmol/kg)−1 (Fig. 3d), and is negative in the upper 100 m as temperature and oxygen are relatively constant. The coefficient then shifts to positive as both the oxygen concentration and temperature decreases, until a depth of around 800 m, when oxygen reaches a minimum and begins to decrease again, driving a negative βO. At this depth, as the coefficient changes sign, redistribution is effectively zero. The relationship between redistributed changes in temperature, DIC, and oxygen can then be expressed by the following equations:
Once the redistributed oxygen term is calculated via Eq. (12), it can be used to compute the temperature and DIC redistribution via Eqs. (9) and (10).
2.5 Link between remineralisation terms
We define the relationship between changes in remineralisation in oxygen and those in DIC using the Redfield ratio of 106C : −138O (Redfield, 1934, 1958), generally considered to be the approximate average ratio of change during remineralisation. The change in remineralised oxygen is therefore described in Eq. (11), where :
The ratio γ between oxygen and DIC is tightly constrained based on interior tracer fields, and while there will be some spatial changes in this ratio, within the Atlantic, the remineralisation ratio between oxygen and carbon can be considered constant with depth (Li and Peng, 2002). While variation in the Redfield ratio was tested, changing the value by as much as 50 % has little impact on the overall findings (Fig. B1).
2.6 System of equations
Once the coefficients are calculated for each individual gridpoint along the A05 section, they can be input into Eqs. (4), (6) and (9)–(11), and represent a system of simultaneous equations in the form W1Ax=W2b, which is solved via a weighted least squares fit approach to obtain the individual drivers of oxygen change at each point. The magnitude of the oxygen change terms can then be added back into the equations relating oxygen change to temperature and DIC changes to compute the magnitude of each driver of temperature and DIC change at each point along the A05 section
As Eq. (12) is under-determined, an infinite number of solutions exist, and so we regularise the system with an initial estimate of the solution and its estimated variance (Wunsch, 2006). These weightings are listed in Table 1. The b vector consisting of total changes in temperature, DIC and oxygen, is weighted by the inconsistency in each variable between GLODAP cruises (Lauvset et al., 2022); this weighting determines the possible magnitude of the residual (i.e. the mismatch between the total oxygen change and the sum of the driving terms). Temperature and oxygen weightings are derived from the inconsistency between cruises within the Atlantic, while the global inconsistency in the GLODAP data product is used for DIC, as the Atlantic inconsistency is too high due to the influence of coastal ocean data.
Table 1The values used to regularise each variable in Eq. (12) when calculating the decomposition of the oxygen change. a The weightings and initial estimate for each individual oxygen components defined as the expected mean and standard deviation respectively, taken from literature. b When no previous information is available, the initial estimate is set to zero. c The weightings for the total variable changes come from the approximate consistency between GLODAP cruises, with the oxygen weighting changing spatially since it is given as a percentage.
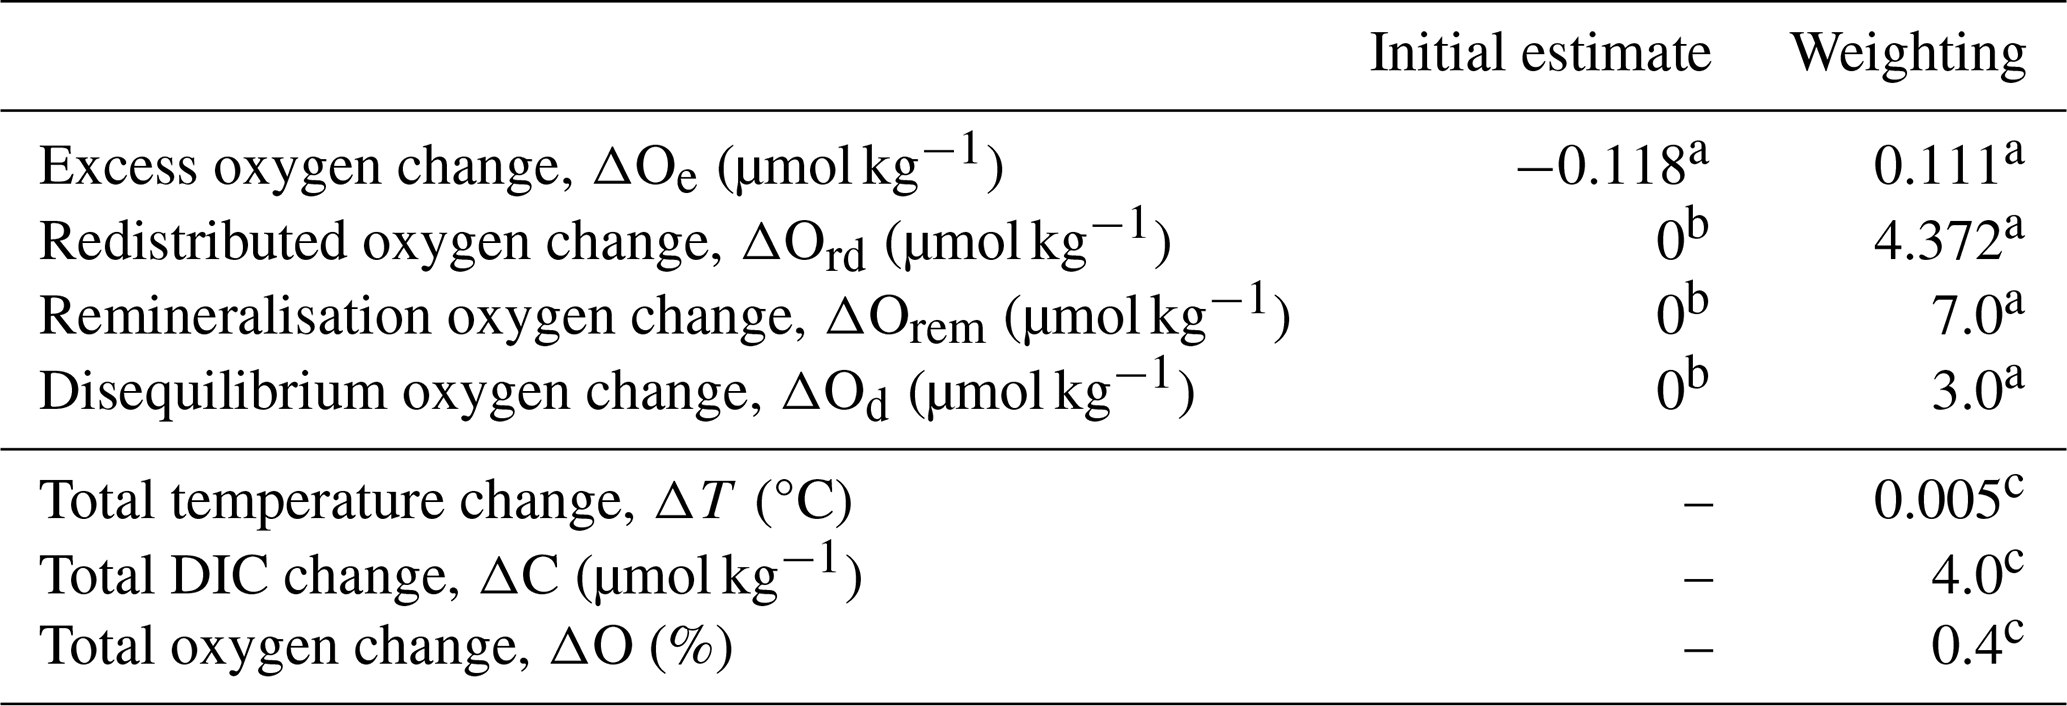
The initial estimate and weighting for the x vector, which consists of the changes in each individual oxygen process, are assigned as the estimated mean, and variance of each component, respectively, when estimates of these values exist in the literature. In instances where no previous information is available, we assign an initial estimate of zero and estimate the spatial variability from previous literature. A weighting and initial estimate for excess oxygen change is approximated from excess temperature change along the A05 section (Zika et al., 2021) via Eq. (4). Weightings for remineralisation and disequilibrium changes are estimated from spatial variability available in the literature (Cassar et al., 2021; Ito et al., 2004). We assume variability in the redistributed term to be similar to that of the total oxygen change, and thus take the variance in the total change as the redistributed weighting.
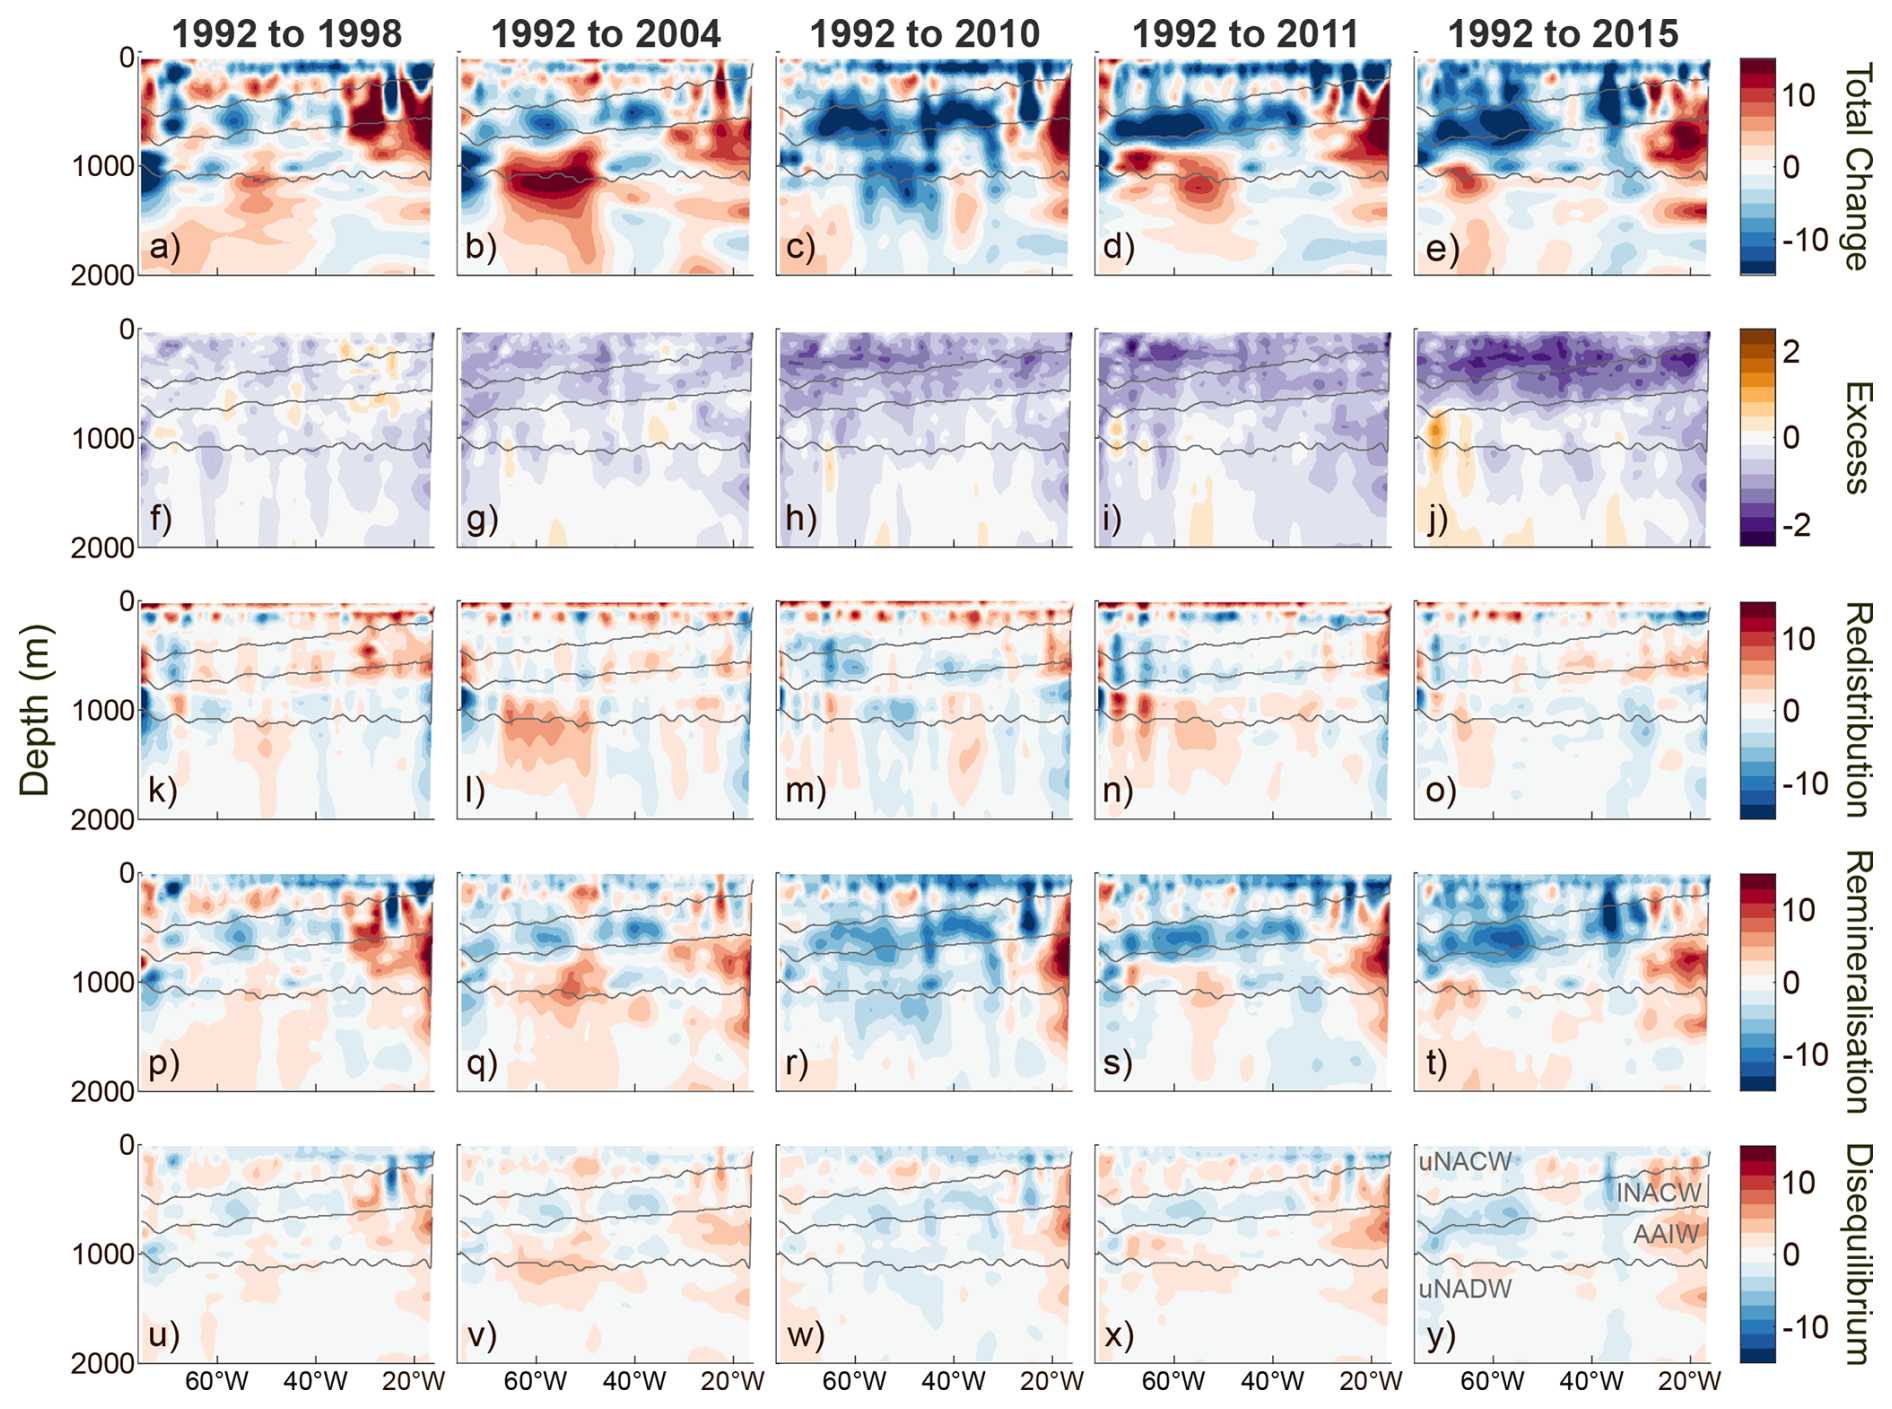
Figure 4The oxygen decomposition results for the upper 2000 m of the A05 section: each plot shows the oxygen change (µmol kg−1) between 1992 and each subsequent cruise year. (a–e) The total oxygen change since 1992, (f–j) the excess change, (k–o) the redistributed change, (p–t) the remineralisation change, and (u–y) the disequilibrium change. The contours mark the same water masses as in Fig. 1. Note the varying colour scales in the second panel.
3.1 Total oxygen change on the A05 section
The observations show an overall decline in total oxygen concentration in the upper 1000 m of the A05 section, which is strongest at the surface (Fig. 4a–e), with the trend becoming more pronounced from 2010 onwards. The exception to this is in the eastern side of the section, which shows an oxygen increase from around 200–1000 m eastward of 30° W, likely related to the influence of Mediterranean water and denitrification. Below 1000 m, within the uNADW layer, there is no obvious trend, with areas of both positive and negative oxygen change. At depths of 1000–2000 m, an increase in oxygen between 40 and 65° W is observed in most years, except 1992 to 2010, when this region instead experiences a strong decrease.
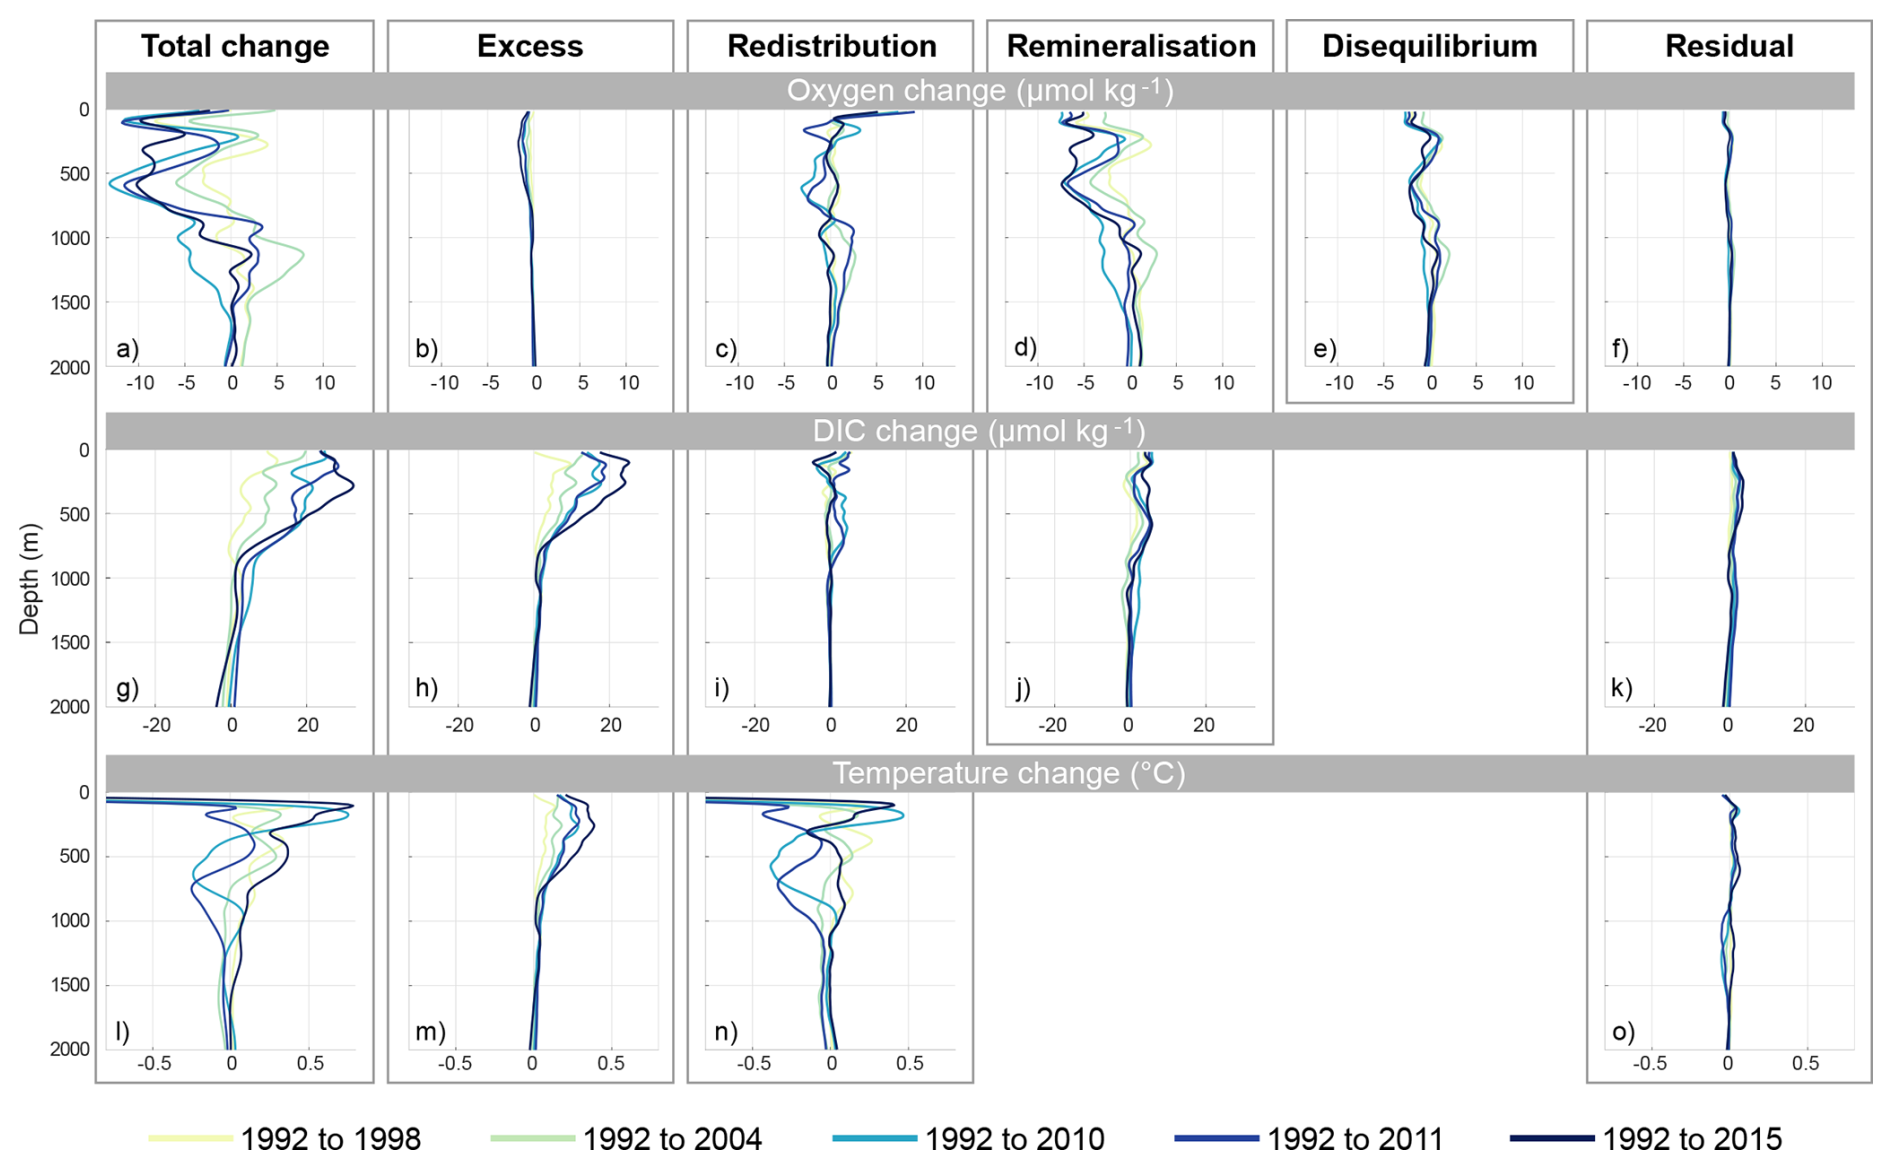
Figure 5The oxygen (µmol kg−1), DIC (µmol kg−1), and potential temperature (°C) decomposition results averaged over the A05 section, from 30–70° W: (a) the total temperature change since 1992, (b) the excess change, and (c) the redistributed change. (d) shows the residual in the method, i.e. the difference between the total potential temperature change and the sum of the changes attributed to each process.
To better understand the drivers of the average property changes across the A05 section, we focus on the region between 30–70° W (black box in Fig. 1a). This allows us to focus on the central region that has more robust trends in the upper 1000 m, with clear deoxygenation over time, while removing the impact of regional oxygen increases occurring in the eastern and western boundaries of the section. The average over the central region emphasises the negative trend in total oxygen change in the upper 1000 m of the water column (Fig. 5a), with deoxygenation reaching a maximum rate of −13.1 µmol kg−1 between 1992 and 2010 at ∼600 m depth. As the average oxygen concentration decreases, the observations simultaneously show a strong DIC increase in the upper ocean (Fig. 5g), reaching a maximum change of 32.4 µmol kg−1 from 1992 to 2015 at ∼300 m. However, there is no consistently increasing trend in the average temperature of the section over the same period (Fig. 5l).
3.2 Decomposition of oxygen change across the A05 section
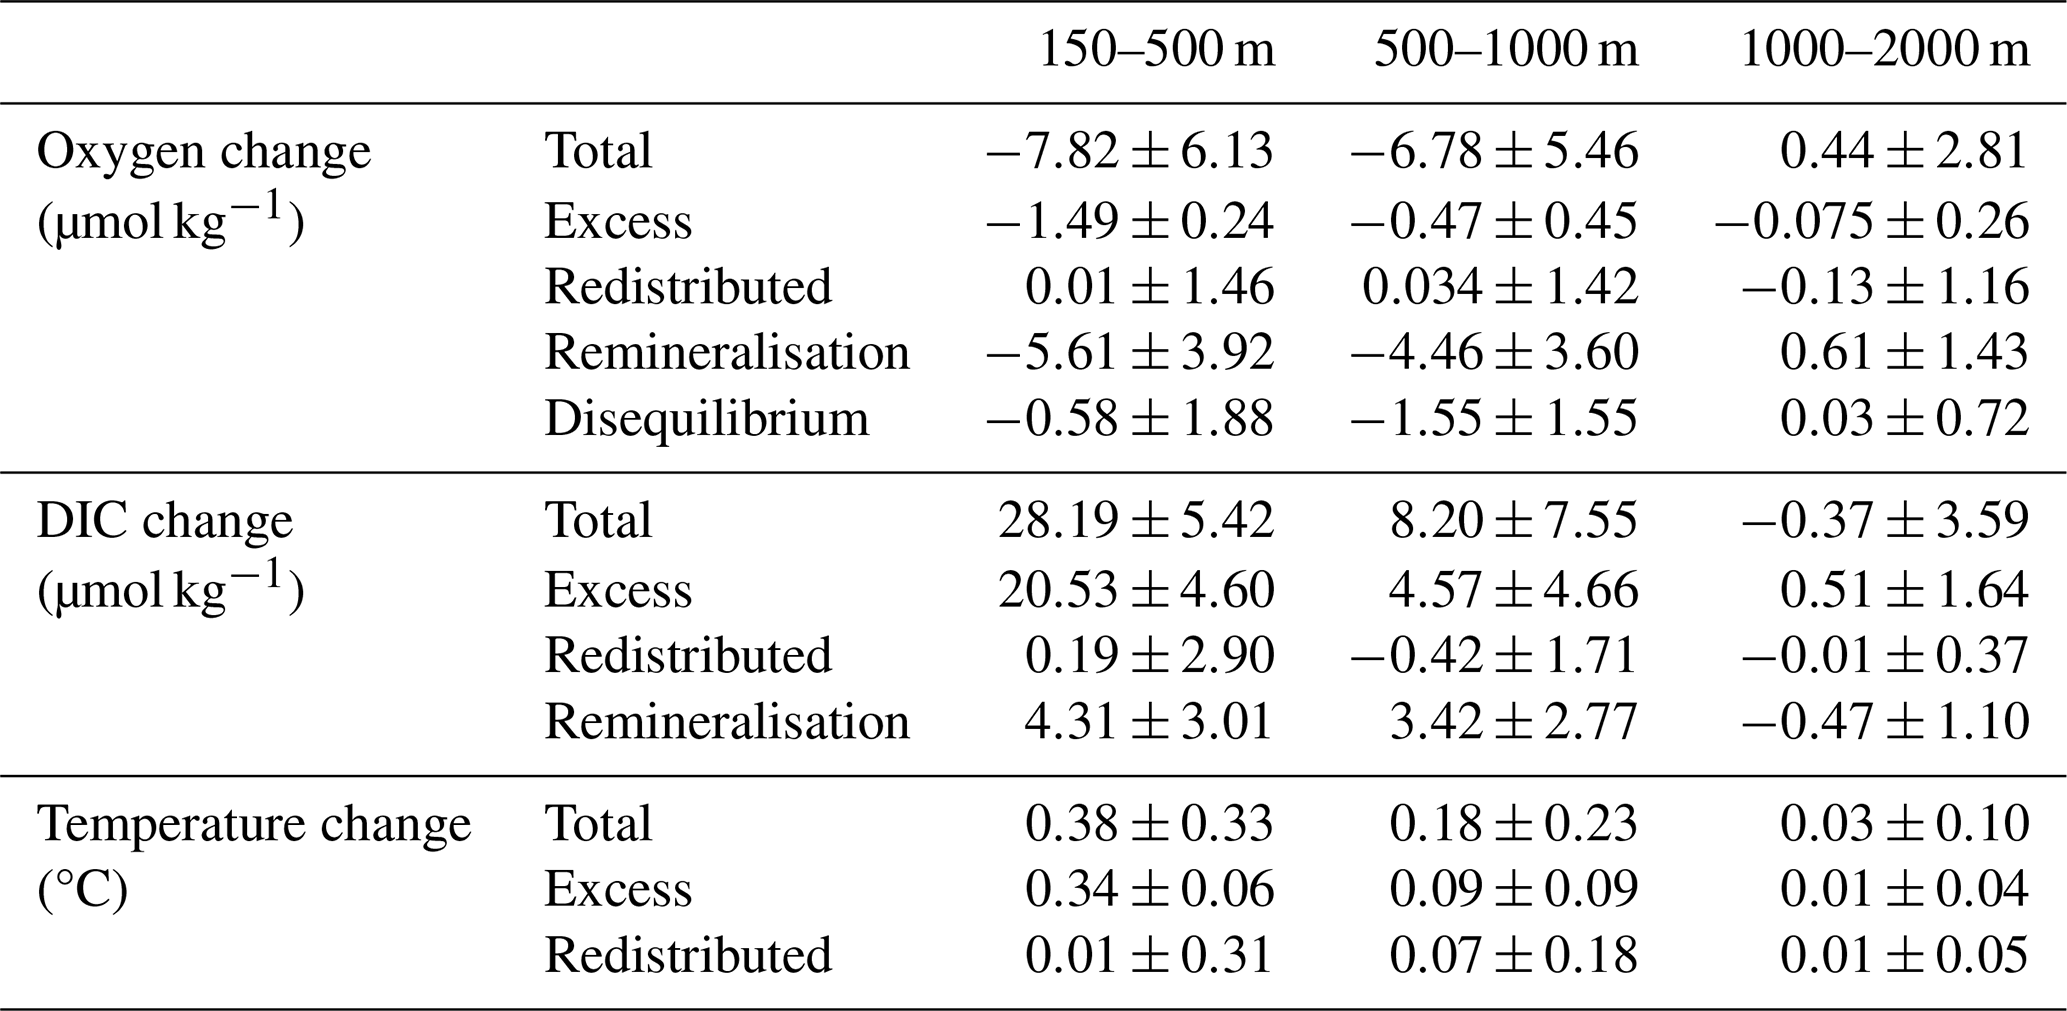
There is variation in the driving mechanisms of oxygen, DIC and temperature change at different depths. Averaging over depth ranges also shows high standard deviation at depths below 1000 m (Table 2). In the depth range 150–500 m total deoxygenation is dominated by change in remineralisation, while the DIC increase is dominated by excess change, and a slight warming is driven by excess change. The dominance of one process is less evident in the depth range 500–1000 m. Remineralised oxygen change still makes up the majority of the deoxygenation, while for DIC, the remineralisation term becomes more significant, with an average of 3.42 µmol kg−1 compared to a total DIC change of 8.20 µmol kg−1. Within this depth range, the average temperature change is less than the standard deviation, with both excess change and redistribution driving a similar size increase.
Table 2The total change in oxygen, DIC and temperature from 1992 to 2015, and the change due to each process, averaged over the central region of the A05 section and different depths, along with the standard deviation. The upper 150 m has not been included to avoid the influence of seasonal variability.
Spatial patterns in the total oxygen change (Fig. 4a–e) resemble those of the remineralisation change (Fig. 4p–t), with consumption of oxygen via remineralisation generally increasing over time in the upper 1000 m, particularly within the NACW layers. The majority of remineralisation-related oxygen change is negative in the central part of the section (approximately 30–70° W), with only a slightly positive average change below 1000 m, within the uNADW, which is strongest between 1992 and 2004. The increasing total oxygen seen in the east of the section is also due to remineralisation changes. When averaged over the entire central region of the A05 section, remineralisation change is strongly correlated with total oxygen change (r2=0.93, p=0.008), with the maximum remineralisation decrease also occurring at a depth of ∼600 m, and reaching a maximum of −7.4 µmol kg−1 by 2015 (Fig. 5d).
Excess oxygen changes exhibit the clearest temporal trend, with increased deoxygenation since 1992, particularly in the upper 1000 m, within the NACW (Fig. 4f–j). Despite its smaller magnitude in comparison to remineralisation change, the term exhibits the largest trend over time, owing to increasing excess temperature changes (Fig. 5m) and their impact on oxygen solubility. When averaged over the central region, the largest excess changes occur at ∼300 m, with the maximum deoxygenation at this depth trebling between 1992 to 1998 and 1992 to 2015, when it reaches −1.50 µmol kg−1 (Fig. 5b). Below 1000 m, excess oxygen change is negligible in the uNADW, given the magnitude of excess temperature change generally at this depth remains below ±0.05 °C, and hence drives very little deoxygenation (Fig. 5m).
Redistributed changes in oxygen are less consistent with time than the excess signal (Fig. 5c), reflecting local circulation patterns with no apparent trends. The lines of near-zero redistribution close to the surface and at a depth of around 800 m (Fig. 4k–o) are simply due to the change in sign of the βo coefficient as it switches from positive to negative, and have no correlation with any particular water masses. At this depth, redistribution has no effect on oxygen because the depth gradient is zero. Patterns of disequilibrium oxygen change are relatively similar to those of the total oxygen change, but with considerably lower absolute values (Fig. 4u–y). When averaged across the central region of the section, the maximum magnitude is only −2.37 µmol kg−1 at depths of ∼600 m between 1992 and 2010 (Fig. 5e). Since there is no direct link between the disequilibrium change and any of the DIC or temperature terms, the term is weakly constrained, making analysis more challenging. The similarity between the total change is likely because it is a residual term, and so will have a larger magnitude when the total change is greater.
Figure 6 shows the remineralisation and excess change, the two terms with clear trends, over time. Averaging the changes over the upper 1000 m emphasises the relationship between total oxygen change and the remineralisation component. In both time series, maximum deoxygenation occurs in 2010, before decreasing slightly again. Solubility-driven deoxygenation has a much smaller but fairly constant decrease across the time series in the upper 1000 m. At depths of 1000–2000 m (Fig. 6b), there is no obvious trend in total oxygen change across the section, however, the total change and remineralisation change are still highly correlated, with the same patterns of increasing and decreasing oxygen over time.
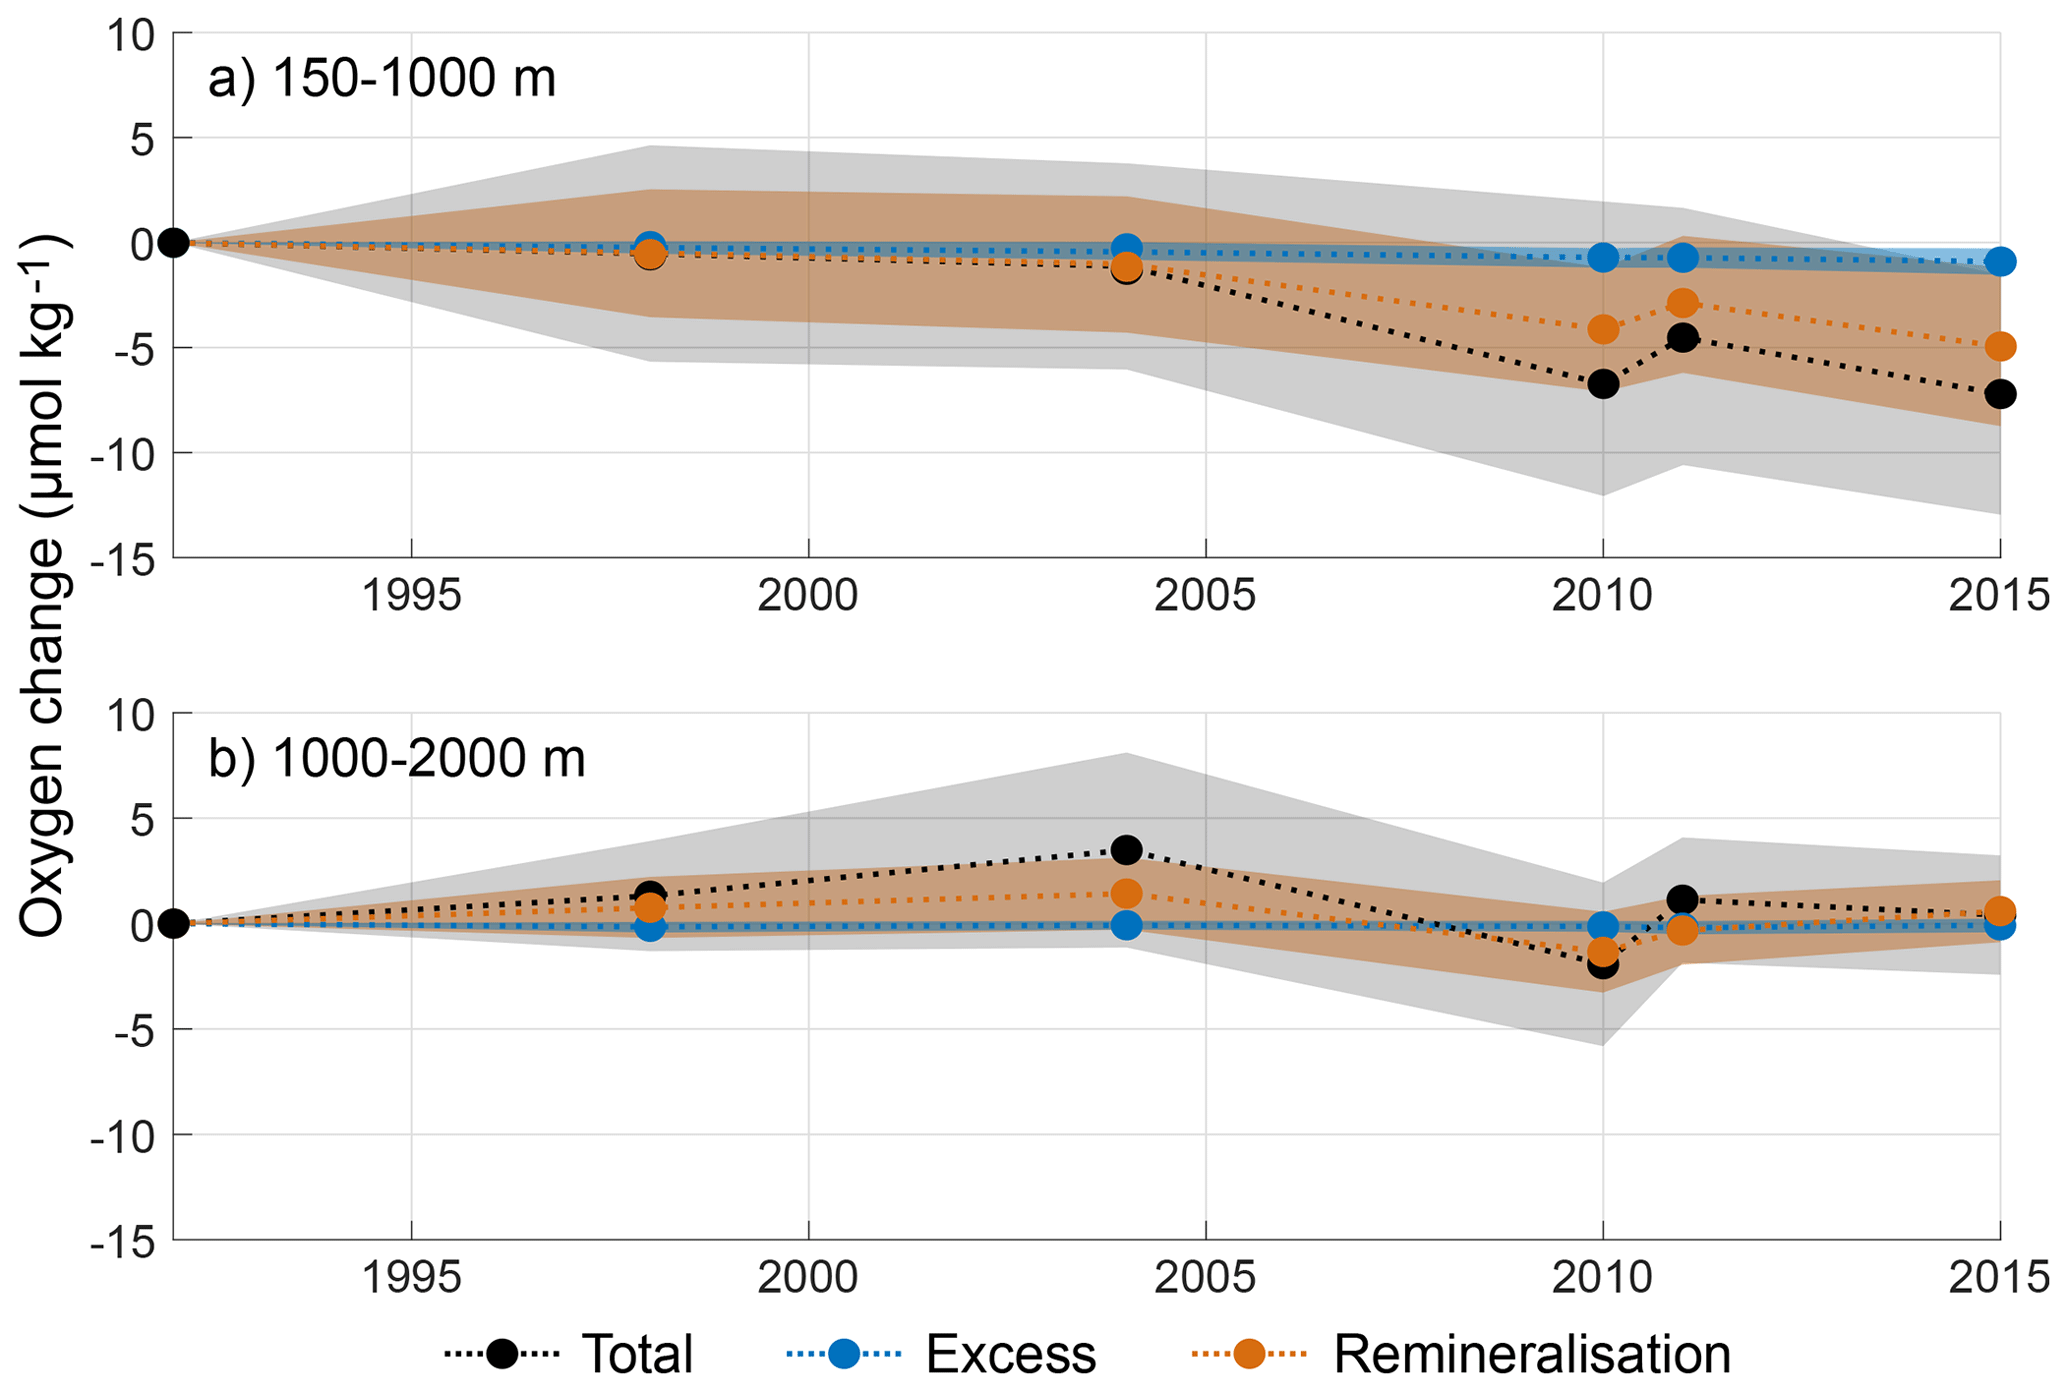
Figure 6Oxygen change over time (µmol kg−1), averaged over the A05 section (30–70° W), and integrated over (a) the upper 1000 m, and (b) 1000–2000 m. The total change is shown in black along with the terms that show the strongest trends: excess change (blue) and remineralisation (orange), with the standard deviation shown by the shading. The surface 150 m is omitted from (a) to exclude effects due to seasonal variability.
3.3 Temperature and DIC change on the A05 section
The temperature change in the central region of the A05 section is dominated by redistribution (Fig. 5n). While no clear trends are observed in the redistributed component, the excess component exhibits a steadily increasing trend over time, particularly pronounced in the upper 1000 m (Fig. 5m). This leads to decreased solubility and the observed trends in excess oxygen decrease in the upper ocean.
DIC change is dominated by the excess term in the upper 1000 m (Fig. 5g), due to increasing anthropogenic CO2 levels. Trends in excess DIC changes mirror those in excess temperature since they are linearly related via the coefficient α, which is constant in time. Excess DIC reaches a maximum change of 21.5 µmol kg−1, occurring between 1992 and 2015 at a depth of ∼270 m (Fig. 5h). Due to the ratio of oxygen consumption and DIC production during remineralisation, we also see a clear temporal trend in remineralisation DIC change, with increasing production over time. Remineralisation change peaks at a depth of ∼600 m, reaching around 5.7 µmol kg−1. At deeper depths, DIC change becomes close to zero and in some cases slightly negative, but this negative change is generally smaller than the internal accuracy of the GLODAP data product. As with temperature, no distinct temporal patterns are discernible in redistributed DIC changes. The decomposition shows that while the anthropogenic increase in CO2 fluxes dominate, remineralisation changes are also responsible for a significant amount of the increased DIC in the upper ocean. Excess DIC change in the section is strongly correlated with the total DIC change (r2=0.72, p=0.07), particularly in the upper 1000 m (r2=0.95, p=0.004) but the correlation between the remineralisation change and the total change is also high (r2=0.65, p=0.09, increasing to r2=0.91, p=0.01 for just the upper 1000 m).
Based on our new methodology and analysis of one repeat hydrographic section in the North Atlantic, we find that alterations in remineralisation, either local or upstream, are responsible for up to half of the total oxygen decrease seen in the upper 2000 m between 1992 and 2015. By linking changes in DIC and oxygen, we ensure that the dominant processes that impact remineralisation are taken into account. While we do not consider the impact of changes in stoichiometry, and instead assume that the stoichiometric ratio applied remains constant in time and space, using a constant ratio does simplify the method and allow for the same technique to be used to investigate deoxygenation globally. In reality, there will be variations from the Redfield ratio within the section. However, altering the coefficient linking remineralisation changes in oxygen and DIC by as much as ±50 % has only a very minor impact on the average change due to each process (Fig. B1).
Previous studies have suggested that with increased ocean warming, remineralisation tends to occur at shallower depths (Oschlies, 2021), which may play a role in driving the increased remineralisation in the upper 1000 m. Here, we calculate the oxygen change due to each process at each longitude-depth point individually, so the observed change in remineralisation processes could be a result of either an increase in the total amount of production exported and remineralised, a change in the spatial patterns of remineralisation due to large-scale circulation changes, or both. Further work beyond the decomposition method is required to determine the drivers responsible for the increased oxygen consumption via remineralisation with certainty. A significant increase in primary production would lead to higher rates of export to depth, and higher rates of remineralisation. However, there has been little change in primary production in the surface of the subtropical North Atlantic over the same time period (Macovei et al., 2019). This suggests that either there is has been change in the export ratio, with less of the productivity exported to depth, or that changes in large-scale circulation are driving the increased remineralisation. Modelling studies have also suggested that in future more carbon will likely be stored in the ocean interior, despite export production to depth decreasing as a result of a slowdown in ocean circulation (Wilson et al., 2022). This gives further credibility to the hypothesis that changes in circulation could be driving the increased remineralisation along the A05 section. Large-scale circulation changes at the A05-Section are strongly influenced by changes in Atlantic Meridional Overturning Circulation (AMOC). The strength of the AMOC at the latitude of A05 has been monitored since 2004, and weakened between 2004 and 2010 (Smeed et al., 2014; Johns et al., 2023). This decline may have led to increased residence times, allowing for more remineralisation to occur before the water reaches the A05 section. This would also explain why the dominant decreases in remineralisation are visible after 2004 and why they occur within the upper 1000m and in the western part of the section. However, discerning the exact physical processes responsible for these changes is complicated and warrants further study.
While remineralisation changes dominate deoxygenation, temperature and DIC change over this period are dominated by different mechanisms. The temperature change on the A05 section is driven primarily by redistribution in the upper 2000 m, in agreement with previous studies (Bindoff and Mcdougall, 1994; Desbruyères et al., 2017), and excess change is the dominant driver of increasing DIC in the upper 2000 m, due to the influence of increasing anthropogenic atmospheric CO2. Remineralisation changes are however also responsible for a small but significant amount of the increased DIC in the upper ocean. While excess temperature and oxygen changes are smaller in comparison to the effect of other drivers, excess temperature change nearly trebled over the period of the A05 section occupations and is now of a similar magnitude to temperature redistribution within the upper 500 m. Given the magnitude of this increase, it could be expected that this term will become dominant in the surface waters in the near future, as suggested by previous studies (Bronselaer and Zanna, 2020; Zika et al., 2021). Since excess oxygen change is driven by temperature-driven solubility change, further surface warming will lead to increased excess-driven deoxygenation. The excess oxygen change has already more than doubled in magnitude between 1998 and 2015, from −0.16 to −0.47 µmol kg−1 in the upper 150–500 m. The average total oxygen change between 1992 and 2015 was −7.82 µmol kg−1 in this depth layer. For the excess oxygen change to reach this magnitude, an excess temperature change of 1.74 °C would be required, assuming the average value for η at these depths. This is around five times greater than the actual average excess change during this period.
The six cruises on the A05 transect generally took place between December and March, however two cruises did not occur during this time frame (1992 and 2004, see Table A1), meaning the results could be impacted by seasonal changes. To account for this, we excluded the upper 150 m from our analysis – the depths where we expect the greatest seasonality to occur and where they are clear in the initial temperature, DIC and oxygen profiles (Fig. 1b-d). The 1992 cruise occurred during summer, but since it was used as a baseline to calculate the changes between years, while this may lead to biases in the quantitative results, it should not affect the observed long-term trends. In the mechanisms that we see the clearest trends, i.e. in excess and remineralisation changes, the same trends were observed in 2004, suggesting that any seasonal changes deeper than 150 m are not large enough to impact the trends we see in the results.
Apparent Oxygen Utilisation (AOU) is often used as a measure of the oxygen consumed by remineralisation in the ocean interior. While this is similar to the remineralisation change term that we calculate here, there are several important differences. Our method calculates the remineralisation rate, whereas AOU calculates the absolute consumption of oxygen. AOU also assumes there is no disequilibrium at the ocean surface when oxygen is first absorbed from the atmosphere, thus combining the disequilibrium and remineralisation components that we resolve separately in this method. The final and most important difference is the way that temperature change and its impact on oxygen change is interpreted. Here, we separate the temperature change due to perturbations in air-sea heat flux (excess temperature), where ocean warming is associated with a reduction in ocean solubility and therefore deoxygenation. In contrast, in the upper ∼1000 m a redistributed warming of the ocean (or a downward motion of an isotherm) will result in an increase in oxygen concentration, the result of a positive correlation between temperature and oxygen above 8 °C at the A05 section. While we separate these terms, if these redistributed temperature changes are not correctly accounted for separately, they will instead be wrongly included in the remineralisation component. For instance, if the total temperature changes that we observe are all interpreted as a warming signal associated with air-sea fluxes, this will overestimate the warming driven de-oxygenation, and underestimate the consumption via remineralisation. Therefore, the change in AOU will in this case be much smaller than, and not comparable to, the change in remineralisation calculated using this method. AOU will also mask the systematic signals that we observe over time by introducing the large variability seen in the redistributed signal.
We develop and implement a new technique linking oxygen, DIC and temperature changes, to create a system of equations that can be solved to compute the magnitude of the different drivers of oxygen change. We show that changes in remineralisation are responsible for up to half of the deoxygenation that has been observed in recent years within the upper 2000 m of the subtropical North Atlantic. However, this technique alone does not allow us to say whether that increase in remineralisation is due to a local change in the total amount of primary production exported and remineralised, or a change in circulation driving the spatial patterns of remineralisation. Since there has been no observed change in primary production over the same period, we hypothesise that the change in remineralisation is driven by a change in circulation leading to increased remineralisation, however further work is needed to confirm this, and whether the same trends in remineralisation are occurring in other regions. Here, we used the technique on the GLODAP data product because as part of the quality control of the dataset, adjustments have already been made to reduce biases between cruises. However, this method could be repeated on any dataset that includes temperature, DIC, and oxygen concentration, including model data. Further work could therefore also potentially be used to determine if this change in remineralisation is a cause for the mismatch between observed and modelled deoxygenation in the global ocean.
Table A1Additional information about the six cruises on the A05 section between 1992 and 2015. The data collected during each cruise was collected and analysed using standard operating procedures as outlined in the GO-SHIP manuals (Langdon, 2010; Dickson et al., 2007).
The total change in oxygen (ΔO), temperature (ΔT) and DIC (ΔC) can be defined as follows, where the subscripts “e”, “rd”, “rem” and “d” describe the excess, redistributed, remineralisation and disequilibrium change, respectively.
The excess change in temperature can be linked to both the excess change in oxygen and in DIC. Excess changes in oxygen are driven by excess changes in temperature via changes in solubility, described by the coefficient η:
Excess changes in DIC and temperature are linear related via a coefficient α, due to increasing anthropogenic CO2:
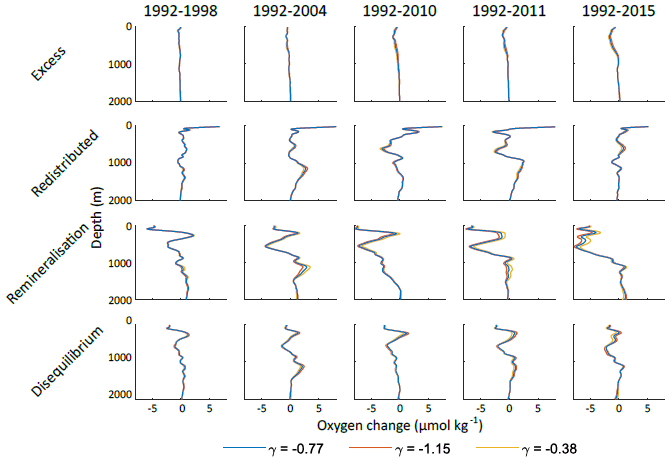
Figure B1The sensitivity of the oxygen change decomposition to changes in the coefficient γ, which links remineralisation changes in oxygen and DIC. Each row shows the oxygen change due to a different process for the different years computed using a constant as used in this study (blue), computed with a γ value 50 % lower (orange) and 50 % higher (yellow).
Redistributed changes in both oxygen and DIC can be related to redistributed changes in temperature via the coefficients βO and βC respectively due to the effect of local circulation on each property:
Finally, the remineralisation changes can be linked via a coefficient γ, which describes the stoichiometric ratio between DIC and oxygen:
Rearranging these equations, means that the total change in temperature can therefore be defined via changes in oxygen:
The total change in DIC can then also be computed via changes in oxygen:
The total oxygen, DIC and temperature can now be defined in terms of changes in oxygen terms and the coefficients α, βC, βO, η and γ, and can be written as the following matrix equation in the form Ax=b:
This matrix equation can then be rearranged in order to solve to find the unknown values in x:
The GLODAPv2.2002 data is publicly available at https://glodap.info (last access: September 2022) and is described by Lauvset et al. (2022). The GO-SHIP Easy Ocean gridded hydrographic data is available at https://doi.org/10.5281/zenodo.13315689 and is described by Katsumata et al. (2024). The package used to interpolate the GLODAP data onto the GO-SHIP sections was developed by Charles Turner and can be found at https://github.com/charles-turner-1/GLODAP_Section_Gridder.jl (last access: January 2026).
RNCS completed the analysis, wrote the draft and made the figures, ELM proposed the study, SKL provided advice on the data, CET provided the data processing methods, TWNH provided advice on the methods, and ELM, SKL, NG, RS provided advice on the analysis.
The contact author has declared that none of the authors has any competing interests.
Publisher's note: Copernicus Publications remains neutral with regard to jurisdictional claims made in the text, published maps, institutional affiliations, or any other geographical representation in this paper. The authors bear the ultimate responsibility for providing appropriate place names. Views expressed in the text are those of the authors and do not necessarily reflect the views of the publisher.
Rachael N. C. Sanders, Elaine L. McDonagh, Siv K. Lauvset and Nadine Goris would like to acknowledge funding from the strategic project “The breathing Ocean” from the Bjerknes Centre for Climate Research.
This paper was edited by Bernadette Sloyan and reviewed by Jannes Koelling and one anonymous referee.
Abe, Y. and Minobe, S.: Comparison of ocean deoxygenation between CMIP models and an observational dataset in the North Pacific from 1958 to 2005, Front. Mar. Sci., 10, 1161451, https://doi.org/10.3389/fmars.2023.1161451, 2023. a
Barth, A., Beckers, J.-M., Troupin, C., Alvera-Azcárate, A., and Vandenbulcke, L.: divand-1.0: n-dimensional variational data analysis for ocean observations, Geosci. Model Dev., 7, 225–241, https://doi.org/10.5194/gmd-7-225-2014, 2014. a
Bindoff, N. L. and Mcdougall, T. J.: Diagnosing climate change and ocean ventilation using hydrographic data, J. Phys. Oceanogr., 24, 1137–1152, https://doi.org/10.1175/1520-0485(1994)024<1137:DCCAOV>2.0.CO;2, 1994. a
Bopp, L., Resplandy, L., Orr, J. C., Doney, S. C., Dunne, J. P., Gehlen, M., Halloran, P., Heinze, C., Ilyina, T., Seferian, R., Tjiputra, J., and Vichi, M.: Multiple stressors of ocean ecosystems in the 21st century: projections with CMIP5 models, Biogeosciences, 10, 6225–6245, https://doi.org/10.5194/bg-10-6225-2013, 2013. a, b
Breitburg, D., Levin, L. A., Oschlies, A., Grégoire, M., Chavez, F. P., Conley, D. J., Garçon, V., Gilbert, D., Gutiérrez, D., Isensee, K., Jacinto, G. S., Limburg, K. E., Montes, I., , Naqvi, S. W. A., Pitcher, G. C., Rabalais, N. N., Roman, M. R., Rose, K. A., Seibel, B. A., Telszewski, M., Yasuhara, M., and Zhang, J.: Declining oxygen in the global ocean and coastal waters, Science, 359, eaam7240, https://doi.org/10.1126/science.aam7240, 2018. a
Brewer, P. G. and Peltzer, E. T.: Depth perception: the need to report ocean biogeochemical rates as functions of temperature, not depth, Philos. T. Roy. Soc. A, 375, 20160319, https://doi.org/10.1098/rsta.2016.0319, 2017. a
Bronselaer, B. and Zanna, L.: Heat and carbon coupling reveals ocean warming due to circulation changes, Nature, 584, 227–233, https://doi.org/10.1038/s41586-020-2573-5, 2020. a, b
Buchanan, P. J. and Tagliabue, A.: The regional importance of oxygen demand and supply for historical ocean oxygen trends, Geophys. Res. Lett., 48, e2021GL094797, https://doi.org/10.1029/2021GL094797, 2021. a
Cassar, N., Nicholson, D., Khatiwala, S., and Cliff, E.: Decomposing the oxygen signal in the ocean interior: Beyond decomposing organic matter, Geophys. Res. Lett., 48, e2021GL092621, https://doi.org/10.1029/2021GL092621, 2021. a
Desbruyères, D., McDonagh, E. L., King, B. A., and Thierry, V.: Global and full-depth ocean temperature trends during the early twenty-first century from Argo and repeat hydrography, J. Climate, 30, 1985–1997, https://doi.org/10.1175/JCLI-D-16-0396.1, 2017. a
Diaz, R. J. and Rosenberg, R.: Spreading dead zones and consequences for marine ecosystems, science, 321, 926–929, https://doi.org/10.1126/science.1156401, 2008. a
Dickson, A. G., Sabine, C. L., and Christian, J. R. (Eds.): Guide to Best Practices for Ocean CO2 Measurements, PICES Special Publication 3, 191 pp., https://repository.oceanbestpractices.org/bitstream/handle/11329/249/Guide_all_in_one.pdf (last access: October 2025), 2007. a, b
Frajka-Williams, E., Ansorge, I. J., Baehr, J., Bryden, H. L., Chidichimo, M. P., Cunningham, S. A., Danabasoglu, G., Dong, S., Donohue, K. A., Elipot, S., Heimbach, P., Holliday, N. P., Hummels, R., Jackson, L. C., Karstensen, J., Lankhorst, M., Le Bras, I. A., Lozier, M. S., McDonagh, E. L., Meinen, C. S., Mercier, H., Moat, B. I., Perez, R. C., Piecuch, C. G., Rhein, M., Srokosz, M. A., Trenberth, K. E., Bacon, S., Forget, G., Goni, G., Kieke, D., Koelling, J., Lamont, T., McCarthy, G. D., Mertens, C., Send, U., Smeed, D. A., Speich, S., van den Berg, M., Volkov, D., and Wilson, C.: Atlantic meridional overturning circulation: Observed transport and variability, Front. Mar. Sci., 6, 260, https://doi.org/10.3389/fmars.2019.00260, 2019. a
Gruber, N.: Warming up, turning sour, losing breath: ocean biogeochemistry under global change, Philos. T. Roy. Soc. A, 369, 1980–1996, https://doi.org/10.1098/rsta.2011.0003, 2011. a
Guallart, E. F., Schuster, U., Fajar, N. M., Legge, O., Brown, P., Pelejero, C., Messias, M.-J., Calvo, E., Watson, A., Ríos, A. F., and Pérez, F. F.: Trends in anthropogenic CO2 in water masses of the Subtropical North Atlantic Ocean, Prog. Oceanogr., 131, 21–32, https://doi.org/10.1016/j.pocean.2014.11.006, 2015. a, b
Helm, K. P., Bindoff, N. L., and Church, J. A.: Observed decreases in oxygen content of the global ocean, Geophys. Res. Lett., 38, https://doi.org/10.1029/2011GL049513, 2011. a, b
Hernández-Guerra, A., Pelegrí, J. L., Fraile-Nuez, E., Benítez-Barrios, V., Emelianov, M., Pérez-Hernández, M. D., and Vélez-Belchí, P.: Meridional overturning transports at 7.5N and 24.5N in the Atlantic Ocean during 1992–93 and 2010–11, Prog. Oceanogr., 128, 98–114, https://doi.org/10.1016/j.pocean.2014.08.016, 2014. a
Ito, T., Follows, M., and Boyle, E.: Is AOU a good measure of respiration in the oceans?, Geophys. Res. Lett., 31, https://doi.org/10.1029/2004GL020900, 2004. a
Ito, T., Minobe, S., Long, M. C., and Deutsch, C.: Upper ocean O2 trends: 1958–2015, Geophys. Res. Lett., 44, 4214–4223, https://doi.org/10.1002/2017GL073613, 2017. a
Johns, W. E., Elipot, S., Smeed, D. A., Moat, B., King, B., Volkov, D. L., and Smith, R. H.: Towards two decades of Atlantic Ocean mass and heat transports at 26.5° N, Philos. T. Roy. Soc. A, 381, 20220188, https://doi.org/10.1098/rsta.2022.0188, 2023. a
Katsumata, K., Purkey, S., Cowley, R., Sloyan, B., Diggs, S., Moore, T., Talley, L., and Swift, J.: GO-SHIP Easy Ocean: Formatted and gridded ship-based hydrographic section data (2024UpdateBugfix1), Zenodo [data set], https://doi.org/10.5281/zenodo.13315689, 2024. a, b
Keeling, R. F., Körtzinger, A., and Gruber, N.: Ocean deoxygenation in a warming world, Annu. Rev. Mar. Sci, 2, 199–229, https://doi.org/10.1146/annurev.marine.010908.163855, 2010. a, b, c
Key, R. M., Olsen, A., van Heuven, S., Lauvset, S. K., Velo, A., Lin, X., Schirnick, C., Kozyr, A., Tanhua, T., Hoppema, M., Jutterström, S., Steinfeldt, R., Jeansson, E., Ishii, M., Perez, F. F., and Suzuki, T.: Global ocean data analysis project, version 2 (GLODAPv2), Ornl/Cdiac-162, Ndp-093, NOAA, https://doi.org/10.3334/CDIAC/OTG.NDP093_GLODAPv2, 2015. a
Langdon, C.: Determination of Dissolved Oxygen in Seawater By Winkler Titration using Amperometric Technique, in: The GO-SHIP Repeat Hydrography Manual: A Collection of Expert Reports and Guidelines. Version 1, edited by: Hood, E. M., Sabine, C. L., and Sloyan, B. M., 18 pp., IOCCP Report Number 14, ICPO Publication Series Number 134, https://doi.org/10.25607/OBP-1350, 2010. a, b
Lauvset, S. K., Lange, N., Tanhua, T., Bittig, H. C., Olsen, A., Kozyr, A., Alin, S., Álvarez, M., Azetsu-Scott, K., Barbero, L., Becker, S., Brown, P. J., Carter, B. R., da Cunha, L. C., Feely, R. A., Hoppema, M., Humphreys, M. P., Ishii, M., Jeansson, E., Jiang, L.-Q., Jones, S. D., Lo Monaco, C., Murata, A., Müller, J. D., Pérez, F. F., Pfeil, B., Schirnick, C., Steinfeldt, R., Suzuki, T., Tilbrook, B., Ulfsbo, A., Velo, A., Woosley, R. J., and Key, R. M.: GLODAPv2.2022: the latest version of the global interior ocean biogeochemical data product, Earth Syst. Sci. Data, 14, 5543–5572, https://doi.org/10.5194/essd-14-5543-2022, 2022. a, b, c
Levin, L. A.: Manifestation, drivers, and emergence of open ocean deoxygenation, Annu. Rev. Mar. Sci., 10, 229–260, https://doi.org/10.1146/annurev-marine-121916-063359, 2018. a
Li, Y.-H. and Peng, T.-H.: Latitudinal change of remineralization ratios in the oceans and its implication for nutrient cycles, Global Biogeochem. Cy., 16, 77-1–77-16, https://doi.org/10.1029/2001GB001828, 2002. a
Long, M. C., Deutsch, C., and Ito, T.: Finding forced trends in oceanic oxygen, Global Biogeochem. Cy., 30, 381–397, https://doi.org/10.1002/2015GB005310, 2016. a
Macovei, V., Torres-Valdés, S., Hartman, S., Schuster, U., Moore, C., Brown, P., Hydes, D., and Sanders, R.: Temporal variability in the nutrient biogeochemistry of the surface North Atlantic: 15 years of ship of opportunity data, Global Biogeochem. Cy., 33, 1674–1692, https://doi.org/10.1029/2018GB006132, 2019. a
Matear, R. and Hirst, A.: Long-term changes in dissolved oxygen concentrations in the ocean caused by protracted global warming, Global Biogeochem. Cy., 17, https://doi.org/10.1029/2002GB001997, 2003. a
Morée, A. L., Clarke, T. M., Cheung, W. W., and Frölicher, T. L.: Impact of deoxygenation and warming on global marine species in the 21st century, Biogeosciences, 20, 2425–2454, https://doi.org/10.5194/bg-20-2425-2023, 2023. a
NOAA National Centers for Environmental Information: ETOPO 2022 15 Arc-Second Global Relief Model, NOAA National Centers for Environmental Information [data set], https://doi.org/10.25921/fd45-gt74, 2022. a
Olsen, A., Key, R. M., Van Heuven, S., Lauvset, S. K., Velo, A., Lin, X., Schirnick, C., Kozyr, A., Tanhua, T., Hoppema, M., Jutterström, S., Steinfeldt, R., Jeansson, E., Ishii, M., Pérez, F. F., and Suzuki, T.: The Global Ocean Data Analysis Project version 2 (GLODAPv2) – an internally consistent data product for the world ocean, Earth Syst. Sci. Data, 8, 297–323, https://doi.org/10.5194/essd-8-297-2016, 2016. a, b
Oschlies, A.: A committed fourfold increase in ocean oxygen loss, Nat. Commun., 12, 1–8, https://doi.org/10.1038/s41467-021-22584-4, 2021. a, b, c
Oschlies, A., Duteil, O., Getzlaff, J., Koeve, W., Landolfi, A., and Schmidtko, S.: Patterns of deoxygenation: sensitivity to natural and anthropogenic drivers, Philos. T. Roy. Soc. A, 375, 20160325, https://doi.org/10.1098/rsta.2016.0325, 2017. a, b
Oschlies, A., Brandt, P., Stramma, L., and Schmidtko, S.: Drivers and mechanisms of ocean deoxygenation, Nat. Geosci., 11, 467–473, https://doi.org/10.1038/s41561-018-0152-2, 2018. a, b
Palter, J. B. and Trossman, D. S.: The sensitivity of future ocean oxygen to changes in ocean circulation, Global Biogeochem. Cy., 32, 738–751, https://doi.org/10.1002/2017GB005777, 2018. a
Redfield, A. C.: On the Proportions of Organic Derivatives in Sea Water and Their Relation to the Composition of Plankton, James Johnstone Memorial Volume, University Press of Liverpool, 176–192, 1934. a
Redfield, A. C.: The biological control of chemical factors in the environment, Am. Scient., 46, 230A, 205–221, 1958. a
Schmidtko, S., Stramma, L., and Visbeck, M.: Decline in global oceanic oxygen content during the past five decades, Nature, 542, 335–339, https://doi.org/10.1038/nature21399, 2017. a, b
Shaffer, G., Olsen, S. M., and Pedersen, J. O. P.: Long-term ocean oxygen depletion in response to carbon dioxide emissions from fossil fuels, Nat. Geosci., 2, 105–109, https://doi.org/10.1038/ngeo420, 2009. a
Smeed, D. A., McCarthy, G., Cunningham, S. A., Frajka-Williams, E., Rayner, D., Johns, W., Meinen, C. S., Baringer, M. O., Moat, B. I., Duchez, A., and Bryden, H. L.: Observed decline of the Atlantic meridional overturning circulation 2004–2012, Ocean Sci., 10, 29–38, https://doi.org/10.5194/os-10-29-2014, 2014. a
Stendardo, I. and Gruber, N.: Oxygen trends over five decades in the North Atlantic, J. Geophys. Res.-Oceans, 117, https://doi.org/10.1029/2012JC007909, 2012. a, b
Stramma, L., Johnson, G. C., Sprintall, J., and Mohrholz, V.: Expanding oxygen-minimum zones in the tropical oceans, Science, 320, 655–658, https://doi.org/10.1126/science.1156401, 2008. a
Takano, Y., Ilyina, T., Tjiputra, J., Eddebbar, Y. A., Berthet, S., Bopp, L., Buitenhuis, E., Butenschön, M., Christian, J. R., Dunne, J. P., Gröger, M., Hayashida, H., Hieronymus, J., Koenigk, T., Krasting, J. P., Long, M. C., Lovato, T., Nakano, H., Palmieri, J., Schwinger, J., Séférian, R., Suntharalingam, P., Tatebe, H., Tsujino, H., Urakawa, S., Watanabe, M., and Yool, A.: Simulations of ocean deoxygenation in the historical era: insights from forced and coupled models, Front. Mar. Sci., 10, 1139917, https://doi.org/10.3389/fmars.2023.1139917, 2023. a
Turner, C.: Characterising water mass and circulation change using heat and carbon co-variability during the anthropogenic era, PhD thesis, University of Southampton, ISBN 9781139456937, 2024. a, b, c, d, e, f
Turner, C. E., Brown, P. J., Oliver, K. I., and McDonagh, E. L.: Decomposing oceanic temperature and salinity change using ocean carbon change, Ocean Sci., 18, 523–548, https://doi.org/10.5194/os-18-523-2022, 2022. a, b
Wilson, J. D., Andrews, O., Katavouta, A., de Melo Viríssimo, F., Death, R. M., Adloff, M., Baker, C. A., Blackledge, B., Goldsworth, F. W., Kennedy-Asser, A. T., Liu, Q., Sieradzan, K. R., Vosper, E., and Ying, R.: The biological carbon pump in CMIP6 models: 21st century trends and uncertainties, P. Natl. Acad. Sci. USA, 119, e2204369119, https://doi.org/10.1073/pnas.2204369119, 2022. a
Wunsch, C.: Discrete inverse and state estimation problems: with geophysical fluid applications, Cambridge University Press, https://eprints.soton.ac.uk/498514/ (last access: January 2025), 2006. a
Zika, J. D., Gregory, J. M., McDonagh, E. L., Marzocchi, A., and Clément, L.: Recent water mass changes reveal mechanisms of ocean warming, J. Climate, 34, 3461–3479, https://doi.org/10.1175/JCLI-D-20-0355.1, 2021. a, b