the Creative Commons Attribution 4.0 License.
the Creative Commons Attribution 4.0 License.
 | 22 Apr 2026
Mechanism of storm surge induced by low-pressure systems along the northern coast of Kyushu, Japan
Yoshihiko Ide
Shinichiro Ozaki
Masaru Yamashiro
This study aims to clarify the mechanism of storm surge caused by low-pressure systems, which differs from typical storm surges associated with typhoons and has been prominently observed along the northern coast of Kyushu, Japan. An integrated approach was employed by combining the analysis of observational data with numerical simulations using an ocean circulation model. First, based on tide gauge and wind data collected at multiple locations along the Northern Coast of Kyushu, the temporal relationship between storm surge anomalies and wind variations was evaluated. A strong correlation was identified between the rotational component of wind direction and the amplitude of the anomalies. Subsequently, numerical simulations using realistic coastal topography successfully captured the characteristics of coastal wave propagation (i.e. coastal-trapped gravity waves) generated by wind rotation and coastal geometry, and accurately reproduced both the timing and amplitude of the storm surge anomalies in the gauge. Furthermore, numerical experiments using idealized topographic meshes and simplified wind conditions quantitatively assessed how the rotation period of wind and the presence or absence of topographic features affect the resonant amplification or suppression of storm surges. In particular, it was revealed that the Goto Islands contribute to the earlier formation and amplification of storm surges, while the Korean Peninsula suppresses wave amplitude by limiting the spatial extent of wave propagation. These findings contribute to a better understanding of storm surge mechanisms, not only along the northern coast of Kyushu, but also in other regions around the world with similar geographic settings.
- Article
(24053 KB) - Full-text XML
-
Supplement
(756 KB) - BibTeX
- EndNote


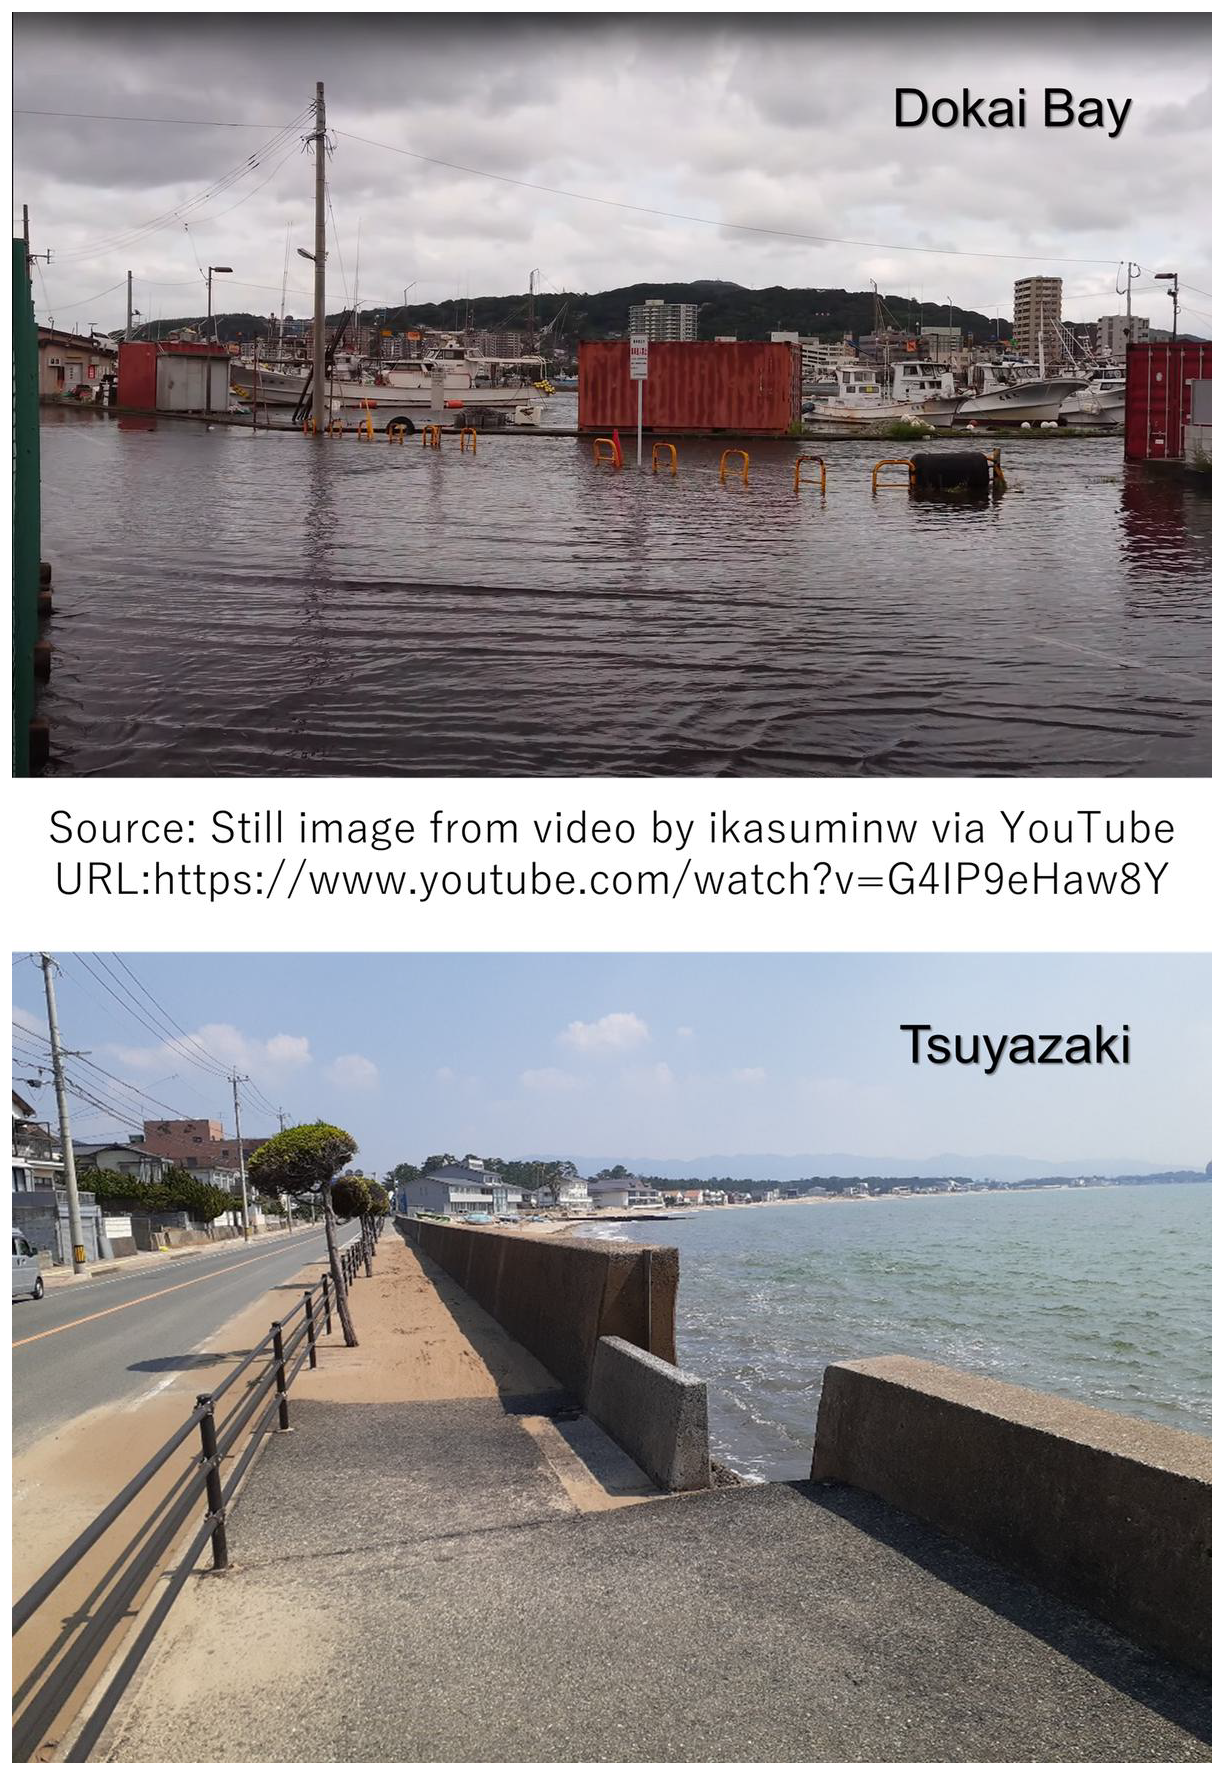
The northern coastal region of Kyushu, located in western Japan (Fig. 1), has experienced several incidents of coastal flooding associated with elevated sea levels in recent years. In particular, during Typhoon Maysak in 2020, which moved northwards off the western coast of Kyushu, flooding was reported in several locations along the northern coast, including Tsuyazaki, Dokai Bay (Fig. 2), and Itoshima (Fig. 1). These events occurred due to storm surges that coincided with spring tides. In Tsuyazaki, wave overtopping was also suggested as a contributing factor. In this paper, the term “storm surge” denotes non-tidal sea level anomalies generated by atmospheric pressure and wind forcing associated with low-pressure systems. This definition includes both positive deviations (storm surge) and negative deviations (storm setdown), which frequently occur during extratropical cyclone events in the study region. Previous studies have mainly focused on storm surges induced by typhoons, highlighting localized effects of strong winds and low pressure. For example, Yamashiro et al. (2016) analyzed the influence of meteorological conditions on sea level changes in Hakata Bay and identified the combined roles of wind setup and pressure forcing. Similarly, Kojima and Fujii (2002) investigated historical typhoon cases in the 20th century and evaluated the potential for raised sea level along the northern Kyushu coast. In recent years, broader dynamic processes have also been recognized. Niimi et al. (2022) showed that storm surges in Dokai Bay during Typhoon Maysak were caused by the interaction of Ekman transport, strait-wide oscillations, and tides. Ozaki et al. (2025) also showed that in semi-enclosed straits typified by the Tsushima Strait, a second, larger storm surge peak can occur several hours after the typhoon's closest approach due to the excitation of natural oscillation modes (about 5 and 10 h) that are triggered once the external forcing weakens. These seiche-type oscillations driven by the release of potential energy stored in the strait and modulated by the Coriolis effect produce a delayed amplitude maximum even though both wind and pressure anomalies have subsided. Despite these insights, storm surges caused by extratropical cyclones have received far less attention. Ide et al. (2023) conducted a statistical analysis covering all seasons from 2012 to 2020 and found that the three largest storm surges observed at the Hakata tide station were all associated with extratropical cyclones, not typhoons. This finding highlights the need for further investigation into non-typhoon events.
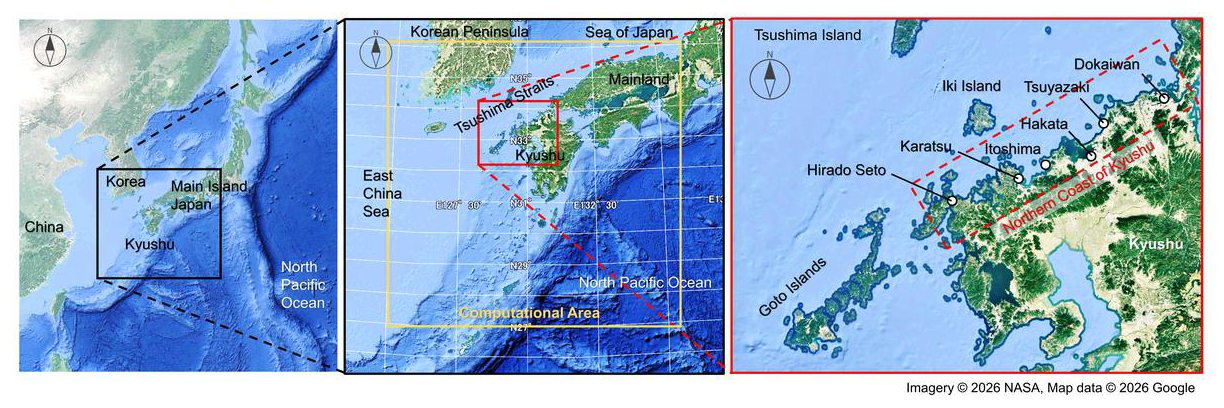
Figure 1Geographical setting of Kyushu and its northern coast. The yellow box in the center map indicates the computational domain used in the FVCOM realistic-topography simulation. The red box shows the enlarged area in the right panel, which includes coastal sites such as Itoshima, Tsuyazaki, and Dokai Bay areas that have experienced coastal flooding during past typhoon and low-pressure events.
Extratropical cyclone-induced sea level anomalies have been studied in other parts of the world. For instance, Horsburgh and Wilson (2007) examined tide-surge interactions in the North Sea, while Särkkä et al. (2024) simulated extreme sea levels along the Baltic Sea due to synthetic cyclones. In the United States, NOAA (2023) reported that persistent low-pressure systems contribute to anomalous sea level rise along the East Coast. These studies underscore the significant impact of extratropical cyclones on coastal sea level. However, the response of sea level anomalies to atmospheric forcing is highly region-dependent, as it is strongly influenced by local bathymetry, coastline geometry, and tidal conditions (Ide et al., 2021). Such regional variability arises because the dominant physical processes differ from place to place; for example, the relative importance of wind rotation, coastal-trapped wave propagation, or resonance with local topography. Therefore, mechanisms identified in one region cannot be directly extrapolated to others, and localized analyses are essential for understanding storm surge anomalies under different geographic settings.
As noted by Ozaki et al. (2025), the northern Kyushu region is characterized by a series of bays and straits with complex surrounding topography and abrupt changes in water depth. Consequently, the spatiotemporal development of storm surges is strongly modulated by the interaction between external atmospheric forcing and regional coastal geometry. However, how time-varying wind direction and speed, particularly under rotational wind fields associated with low-pressure systems, interact with such complex coastal environments to amplify or suppress storm surges remains insufficiently understood.
To address these issues, this study investigates the mechanisms of storm surges induced by extratropical cyclones along the northern coast of Kyushu. In particular, we focus on how temporal wind rotation amplifies storm surges and how the resulting disturbances propagate along the coastline under the influence of regional coastal geometry. A combination of observational analysis and numerical experiments using both realistic and idealized topographies is employed to achieve a comprehensive understanding.
The remainder of this paper is organized as follows. Section 2 outlines the study area, selected extratropical cyclone events, observational datasets, and the configuration of the numerical simulations. Section 3 analyzes the temporal evolution of wind fields and storm surges to clarify their characteristic time scales and mutual relationships. Section 4 presents the results of the numerical experiments, emphasizing the spatial structure of storm surges and the dynamical response to wind-topography interactions derived from both realistic and idealized model setups. Finally, Sect. 5 summarizes the key findings and discusses their implications for understanding and predicting storm surges in coastal regions with complex geometry.
This study analyzes three extratropical cyclone events: April 2012, April 2016, and January 2020 that caused significant storm surges along the northern coast of Kyushu. All three events produced anomalies exceeding those of Typhoon Maysak in 2020, suggesting that flooding could have occurred depending on the timing of the storm surge with respect to high water. Tide data were taken from the Hakata tide station (Hakata in right panel of Fig. 1), located in the inner part of Hakata Bay, representing the central portion of the northern Kyushu coast. To complement the point-based tide gauge observations, the spatial distribution and propagation of storm surges were further examined through numerical simulations covering the entire northern coastal area of Kyushu. Meteorological data, including wind and pressure fields, were obtained from the Japan Meteorological Agency's mesoscale model (MSM).
First, time-series analyses of observational data were performed, including wavelet analysis, to evaluate how storm surges vary in relation to wind direction and intensity. Then, numerical simulations using both realistic and idealized coastal topographies were conducted to assess the effects of coastal geometry and wind rotation on anomaly formation. The following subsections provide details on the data and methods.
2.1 Data Used
2.1.1 Observed Storm Surge Anomaly and Astronomical Tide
Observed tide level data were collected from three tide stations: Hirado Seto and Karatsu (Ministry of Land, Infrastructure, Transport and Tourism), and Hakata (Japan Coast Guard) (https://www.jodc.go.jp/vpage/tide_j.html, last access: 14 April 2026). Among the three tide-gauge stations where observational data were available, Hakata was selected as the representative site primarily because it is located in the central part of the northern Kyushu coast (Fig. 1). As will be discussed later, the analysis confirms that major surge events at Hakata are predominantly associated with extratropical cyclones, supporting the suitability of this site selection. While data from Hirado Seto and Karatsu are recorded hourly, Hakata data were available at 30 s intervals and averaged to hourly values for analysis. Storm surge anomalies were calculated by subtracting the astronomical tide from the observed tide. The astronomical tide was reconstructed using the Python library pytides (ver. 0.0.4), with harmonic analysis based on past observational records, including constituents Z0, M2, S2, N2, K1, M4, O1, M6, MK3, S4, MN4, ν2, S6, μ2, 2N2, OO1, λ2, S1, M1, J1, Mm, Ssa, Sa, MSF, Mf, ρ1, Q1, T2, R2, 2Q1, P1, 2SM2, M3, L2, 2MK3, K2, M8, and MS4. The observed storm surge anomaly ζsurge(t) was defined as the difference between the observed sea level ηobs(t) and the astronomical tide ηtide(t): ().
2.1.2 Meteorological Data (Wind and Pressure)
The atmospheric field data were obtained from the mesoscale model (MSM) provided by the Japan Meteorological Agency (JMA) (https://www.data.jma.go.jp/suishin/cgi-bin/catalogue/make_product_page.cgi?id=MesModel, last access: 14 April 2026). The MSM provides output at a horizontal resolution of approximately 5 km and a temporal resolution of 1 h, and it accurately represents wind and pressure fields in coastal regions. Wind speed, wind direction, and atmospheric pressure during the target periods were extracted and used both for time-series analyses aimed at understanding their relationship with storm surges, and as external forcing conditions for the numerical simulations.
For the simulations, we employed the Finite-Volume Community Ocean Model (FVCOM), an unstructured-grid ocean circulation model developed by Chen et al. (2003). The MSM atmospheric data were spatially interpolated onto the FVCOM computational grid and applied as external forcings, specifically wind components (u and v) and surface atmospheric pressure, at hourly intervals. Within the FVCOM model, these hourly data were further processed using temporal linear interpolation to provide continuous atmospheric forcing throughout the simulation period.
2.2 Overview of Target Events
Storm surge data from 2012 to 2020 were analyzed for three sites along the northern coast of Kyushu: Hirado Seto, Karatsu, and Hakata (Fig. 1), to identify meteorological events that exhibited prominent anomalies. Table 1 lists the top nine events with the highest storm surges at each site.
Table 1Chronological ranking of the top storm surge anomalies at Hirado Seto, Karatsu, and Hakata (2012–2020). Extratropical cyclones and typhoons are indicated, with specific typhoon names provided. Bold entries indicate the Typhoon Maysak (2020) event, which is shown as a benchmark because actual flooding occurred during this event. Superscript numbers (1)–(3) indicate the three extratropical cyclone events selected for detailed analysis in this study (April 2012, April 2016, and January 2020).
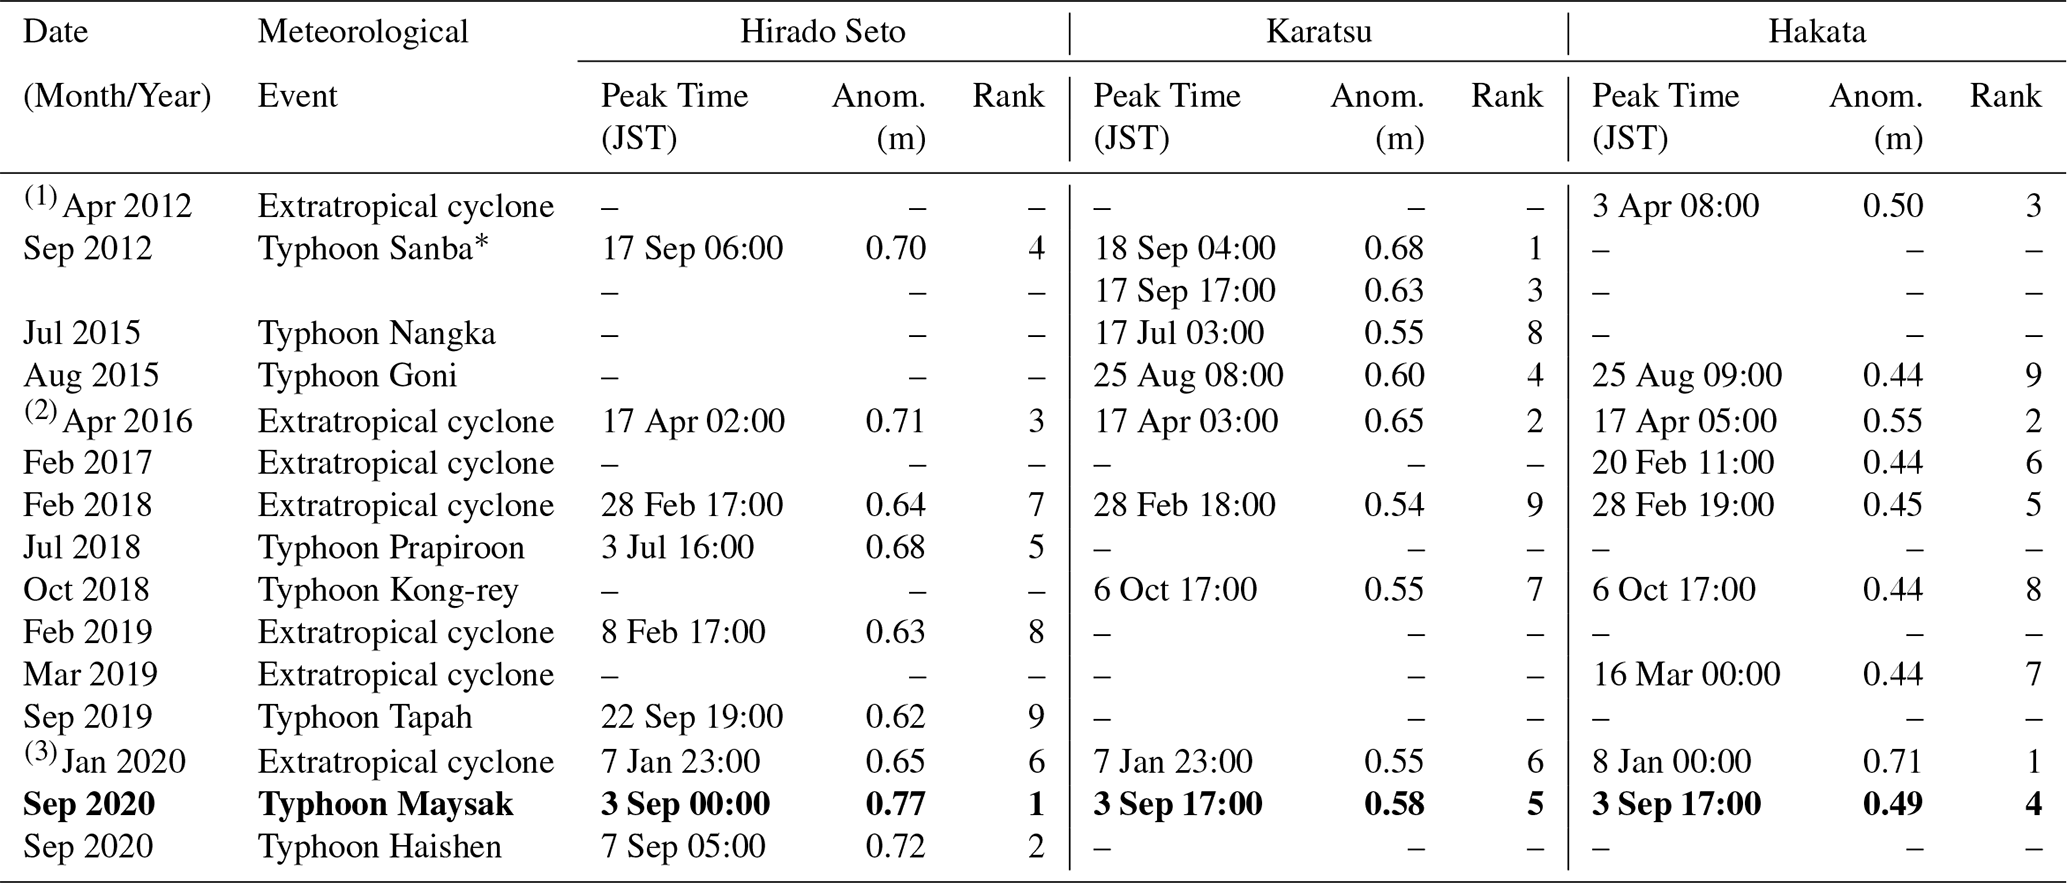
* For Typhoon Sanba at Karatsu, two distinct peaks separated by 11 hours are listed. They are treated as independent events because they were driven by different mechanisms (Ozaki et al., 2025).
From these rankings, it can be seen that several extratropical cyclone events produced higher storm surges than Typhoon Maysak in 2020 (bold entries in the table), which caused actual flooding. Notably, at Hakata, the largest recorded anomaly was due to an extratropical cyclone on 8 January 2020, followed by 17 April 2016, and 3 April 2012, making the top three events all extratropical in nature. On the other hand, in Karatsu and Hirado Seto, located west of Hakata Bay, typhoons are the primary events causing the highest storm surges, although extratropical cyclones also produced comparable anomalies in several cases. It should be noted, however, that the historical highest water level, with a storm surge of approximately 1.7 m as reported by Odamaki et al. (1993), was recorded at the Hakata tide station during Typhoon Mireille in 1991, indicating that typhoons remain the dominant cause of extreme storm surges in this region. Although none of these events resulted in flooding, since they did not coincide with a high water during spring tides, they exhibited greater anomalies than Typhoon Maysak. Therefore, it is highly likely that similar or even more extensive flooding would have occurred if these events had coincided with high tidal conditions. From the perspective of storm surge risk assessment, these events cannot be overlooked.
In this study, we conducted observational analyses for three major low-pressure events observed at the Hakata tide station: 3 April 2012, 8 January 2020, and 17 April 2016. In Table 1, these selected events are indicated by superscript numbers (1, 2, and 3, respectively) at the beginning of their rows. Among them, the 17 April 2016 event (corresponding to 2), which exhibited pronounced storm surges at all three stations, was selected for detailed numerical simulation analysis.
2.3 Method of Analysis
This subsection outlines the methods used to analyze the observational data and selected events described in Sect. 2.1 and 2.2. Detailed descriptions of the numerical simulation framework and model setups are provided in Sect. 2.3.2. The objective is to clarify the temporal relationship between storm surge events and atmospheric forcing, and to examine the dynamical mechanisms reproduced by the realistic and idealized model experiments.
2.3.1 Analysis Based on Observational Data
Hourly storm surge and wind records were analyzed for the selected extratropical cyclone events. Time-series comparisons were conducted to examine how the temporal evolution of wind speed and rotational wind components relates to the rise and peak timing of storm surges. To extract the dominant temporal scales, a continuous wavelet transform (CWT) was applied to the complex wind vector u−iv, enabling simultaneous representation of wind magnitude and directional variability. Here, the complex representation explicitly separates rotary components: u−iv corresponds to the clockwise (CW) rotary component, whereas u+iv corresponds to the counterclockwise (CCW) component; in this study we focus on the CW component because the synoptic wind typically veers clockwise during the screened events. A validation example using an idealized wind field with constant scalar speed but prescribed clockwise rotation is provided in Fig. S2 in the Supplement, confirming that the present analysis identifies rotational periodicity independently of scalar wind-speed fluctuations. Wavelet power spectra were used to identify periods of intensified rotational wind energy. For each event, the wavelet energy at dominant periods was compared with the storm surge time series to assess their temporal correspondence and correlation. Pearson correlation coefficients between surge anomalies and wavelet energy at each period were computed to determine the time scales most relevant for surge generation.
2.3.2 Numerical Simulation Model
Storm surge dynamics were examined using the FVCOM ocean model (ver. 3.2.2). Meteorological forcing fields (wind and pressure) from the MSM were interpolated onto the computational grid and applied at hourly intervals. This model has been widely used in previous studies applied to the target and surrounding ocean areas (e.g., Yamashiro et al., 2016; Ide et al., 2023), and the configuration used in this study follows the same specifications as described in Ide et al. (2024a). The following sections outline the mesh configurations and model settings used for both the realistic and idealized topographies.
Realistic Topography Simulation. In the realistic topography simulation, a wide computational domain covering the Tsushima Strait and the entire northern coast of Kyushu (yellow box in the center panel of Fig. 1) was used. The horizontal grid resolution was approximately 300 m along the Kyushu coastline and up to 50 km in the offshore region (Fig. 3).
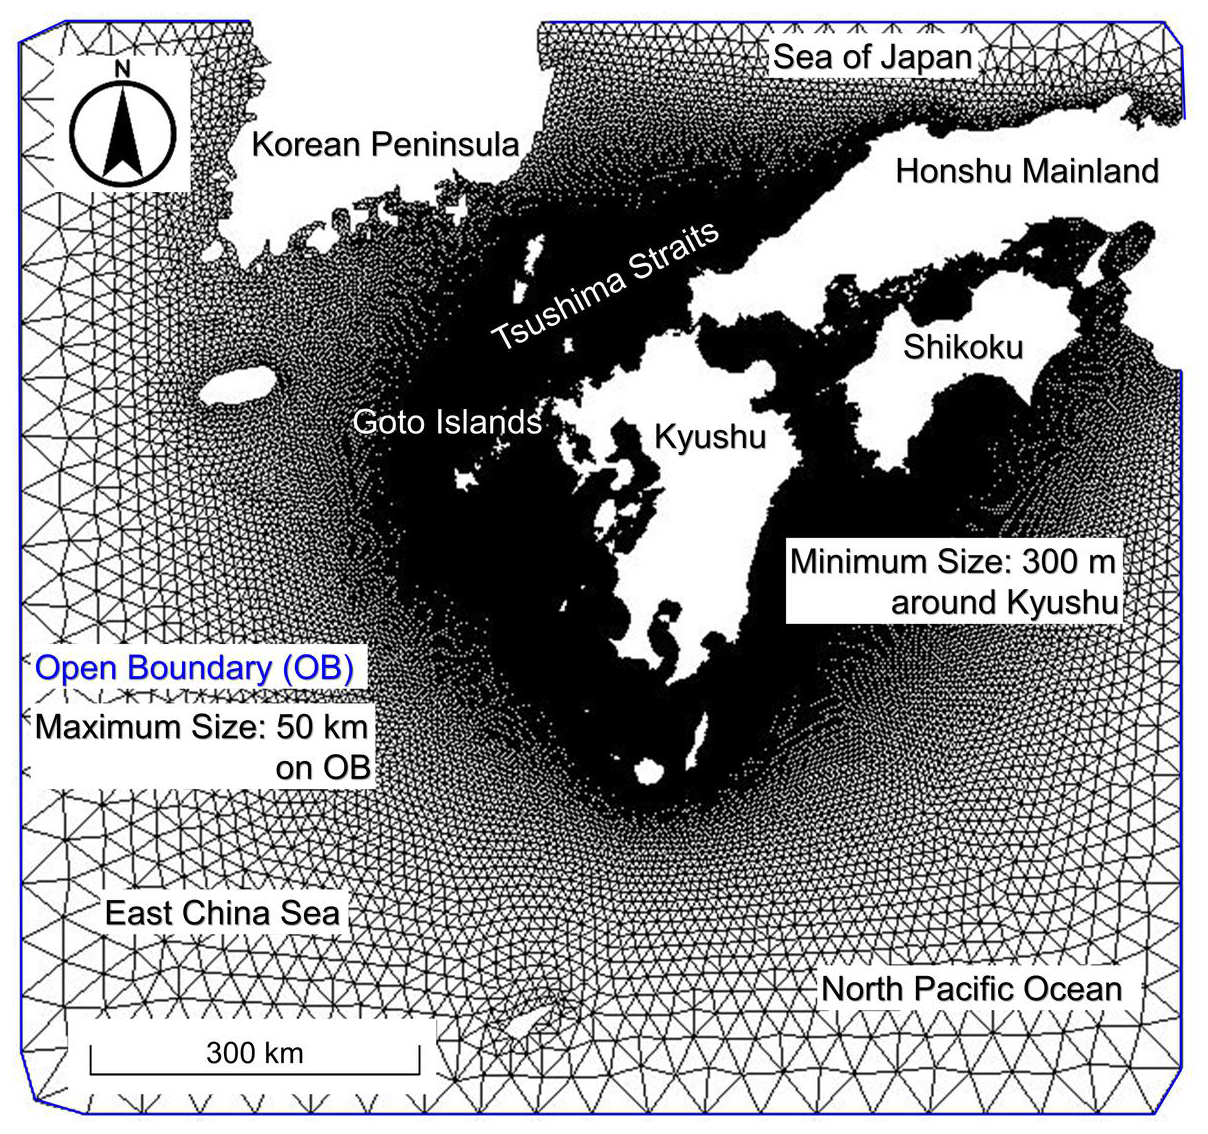
Figure 3Computational grid for the realistic topography simulation in FVCOM. Grid size is approximately 300 m along the Kyushu coastline and up to 50 km near the open ocean boundary (blue lines). The computational domain corresponds to the yellow box shown in Fig. 1 (center), where latitude and longitude coordinates are provided.
In the realistic topography simulations, four uniformly distributed sigma layers were used in the vertical direction (defined by five σ-levels: σ=0.0, −0.25, −0.5, −0.75, −1.0). Preliminary sensitivity tests using 2 to 6 vertical layers (i.e., 3 to 7σ-levels) showed that the simulated storm surge anomalies were largely insensitive to the vertical resolution, with peak values changing by only about 3 %. This is also consistent with related sensitivity results on computational parameters reported for storm surge simulations in the Ariake Sea (Ide et al., 2024b). Therefore, the five-layer configuration was adopted as a sufficient and computationally efficient setup.
Meteorological data, including wind and atmospheric pressure from the JMA mesoscale model (MSM), were spatially interpolated onto the FVCOM computational grid and applied as external forcing at 1 h intervals. Vertical mixing and diffusion were calculated using the Mellor-Yamada Level 2.5 turbulence closure scheme (Janjic, 2001). The time step was set to 1 s to satisfy the CFL condition.
Wind stress was computed based on the 10 m wind speed U using a surface drag coefficient CD following Large and Pond (1981):
The bottom drag coefficient CB was calculated using a bottom roughness length of z0=0.001 m and a representative height za (i.e., the vertical distance from the seabed to the lowest sigma layer) in the model as follows:
where κ=0.4 is the von Kármán constant.
An open boundary (blue lines in Fig. 3) was placed on the ocean side, where the surface elevation was prescribed as a boundary condition, i.e., the model sea-surface elevation along the open boundary was forced to follow a specified value ζ=ζobc(t). This allows the normal flow velocity at the boundary to be determined diagnostically to satisfy the (depth-integrated) continuity equation.
Depending on the temporal scale and focus of the analysis, we employed two distinct setups for the realistic topography simulations:
-
Long-term continuous simulation (Surge-only experiments). To evaluate the overall surge trends over a one-month period, the model was driven solely by meteorological forcing without astronomical tides. The open boundary was set to ζobc(t)=0. In this setup, the simulated surface elevations directly represent the pure storm surge anomalies.
-
Short-term event analysis (Tide-coupled experiments). To account for tide-surge interactions during the peak event spanning a few days, the open boundary condition ζobc(t) varied in time according to the imposed tidal forcing. The simulation included both astronomical tides and meteorological disturbances. The pure storm surge anomalies were then accurately extracted by subtracting the results of a tide-only simulation (with the same settings but without meteorological forcing) from those of the full coupled simulation.
To evaluate the model's validity, particularly the magnitude and timing of the peak anomaly, a hindcast of the April 2016 extratropical cyclone was conducted and compared with observations at the Hakata tide station. For both simulation setups, the model was initialized from a state of rest (i.e., zero surface elevation and velocity) and included a 3 d spin-up period to allow the dynamics to adjust to the external forcing before the main analysis period.
Idealized Model. In the idealized model, the geography of the study region, including the Tsushima Strait, Kyushu, the Korean Peninsula, and the Goto Islands, and bathymetric conditions were simplified to enable controlled investigations of how wind configuration and the presence or absence of topographic features affect storm surges. In contrast, the idealized topography simulations were conducted using a single vertical layer (depth-averaged mode) to isolate the fundamental horizontal dynamics of surge generation under simplified conditions. As the base configuration, the Tsushima Strait and the adjacent landmasses of Kyushu and Honshu were represented using rectangular, simplified shapes (Fig. 4). Open boundaries were placed along the ocean side in the idealized model, similar to the realistic configuration. Additional cases were created by modifying the base topography, specifically by adding the Goto Islands and by removing the Korean Peninsula, to examine the roles and impacts of these features.
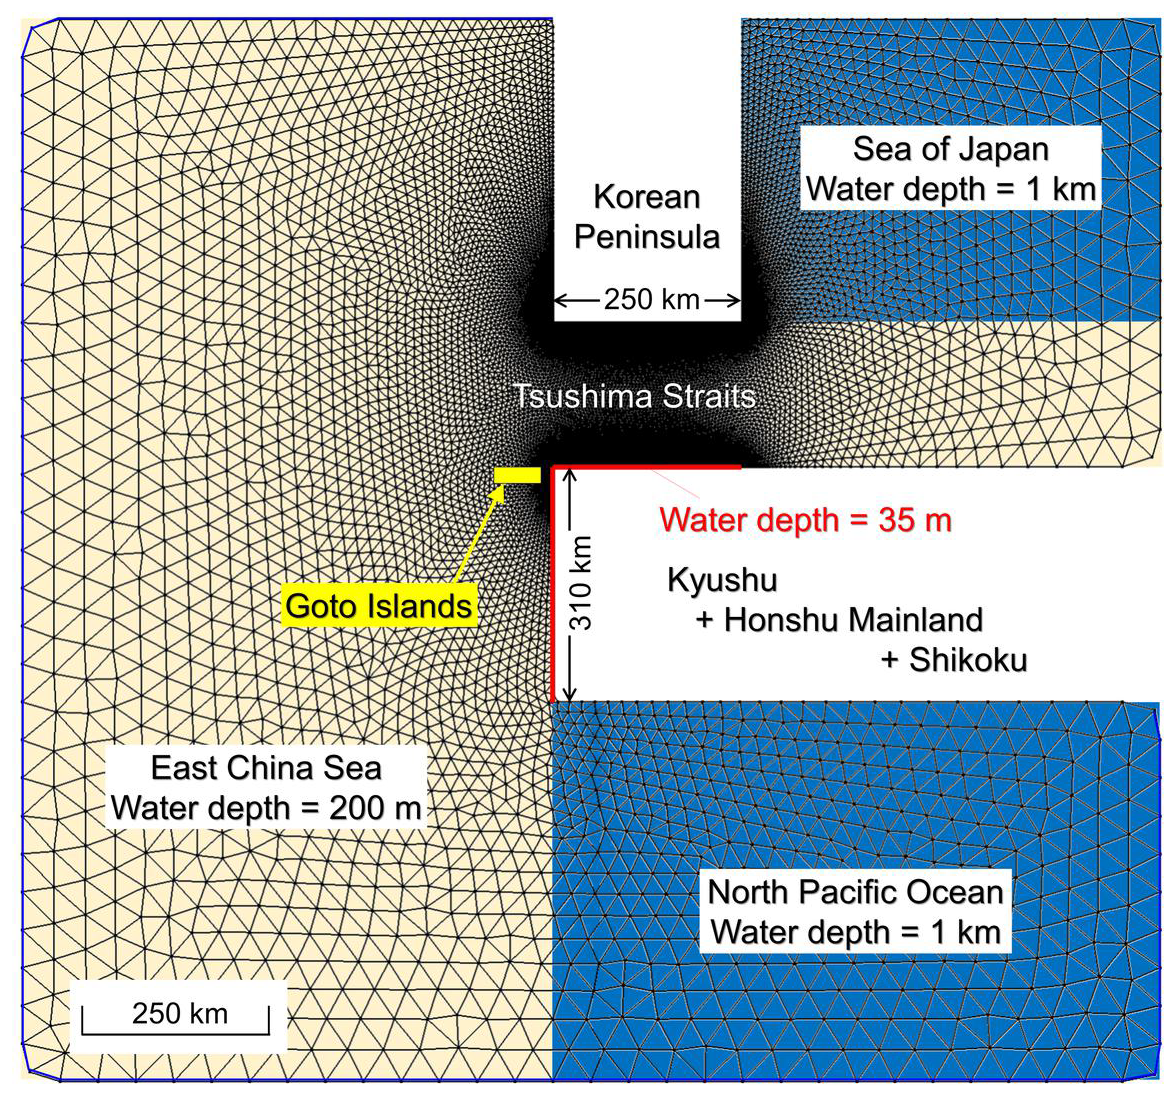
Figure 4Computational grid of the idealized topographic model in FVCOM. The Tsushima Strait, Kyushu, Korean Peninsula, and Goto Islands are reconstructed using simplified rectangular shapes.
Uniform water depths were assigned to each oceanic region: 1000 m in the Sea of Japan and the North Pacific, and 200 m in the East China Sea. Along the western and northern coasts of Kyushu, indicated by red lines in the figure, shallow waters of 35 m were assigned on the coastline, increasing linearly to 200 m offshore. This sloping bathymetry was based on real bathymetric profiles of the region (Fig. 5). In the case where the Korean Peninsula was removed, the area formerly occupied by it was assigned a uniform depth of 200 m.
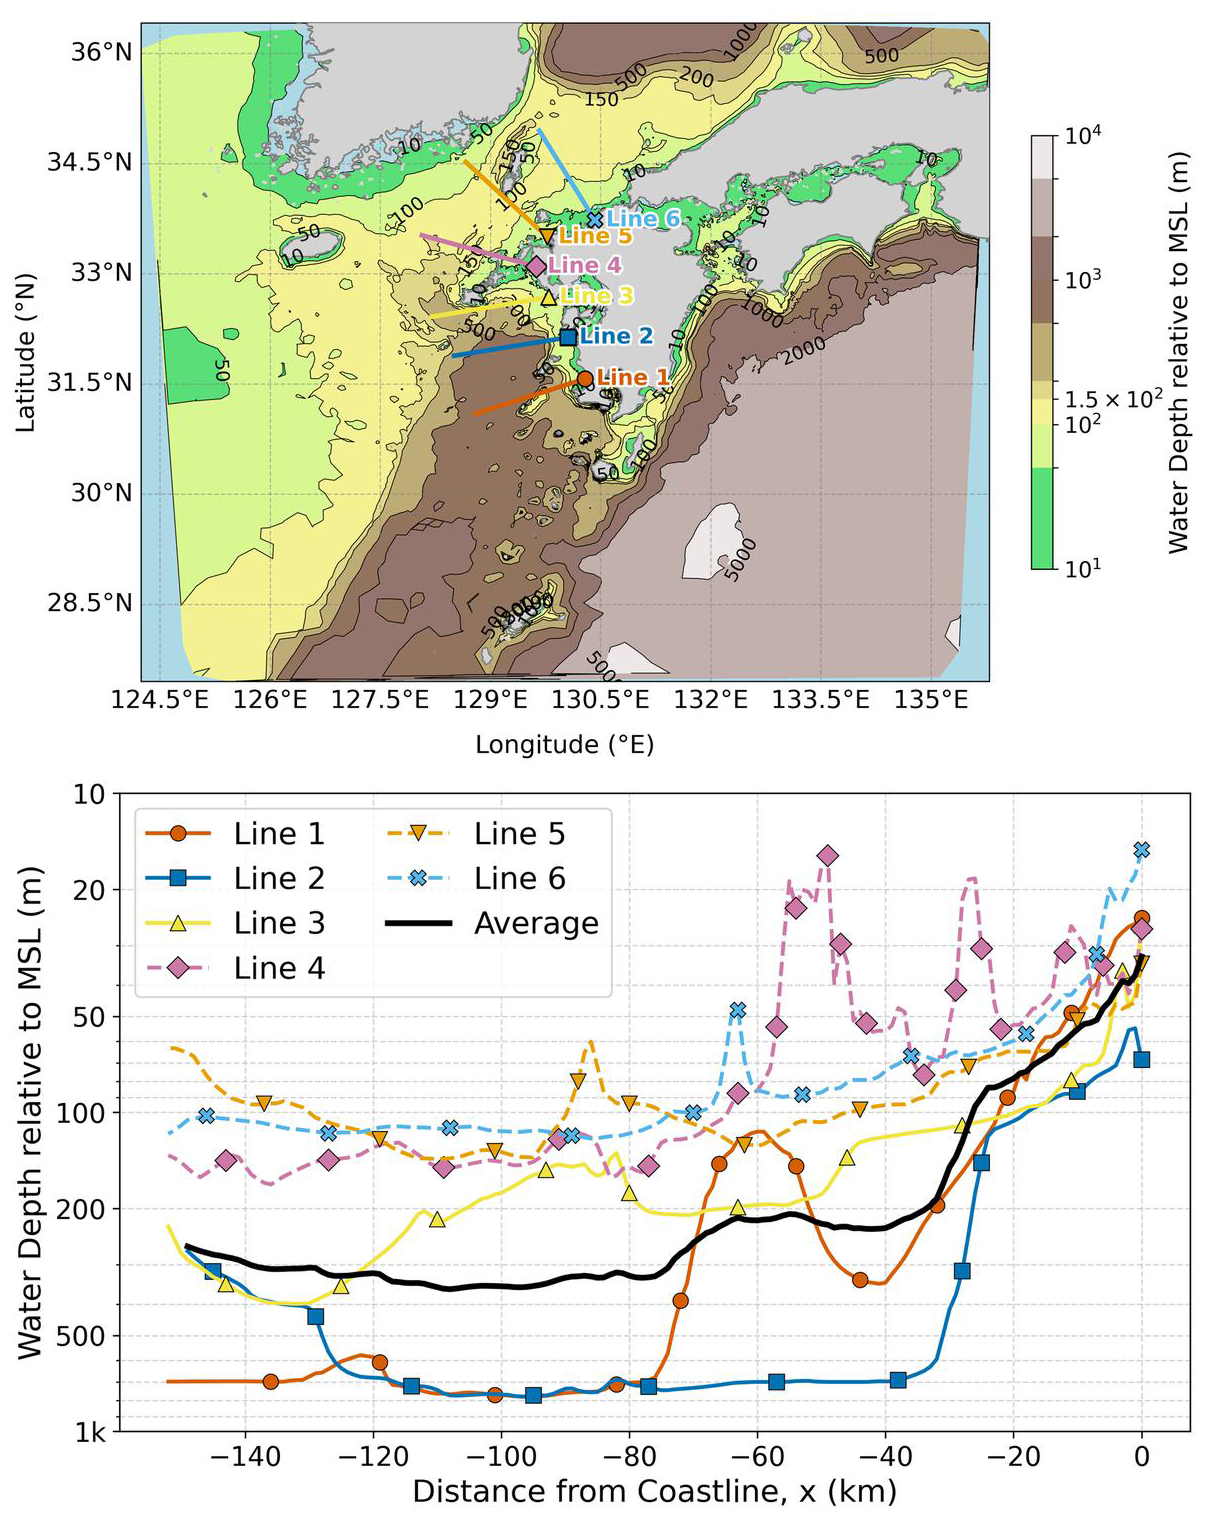
Figure 5Bathymetric profiles along the marker-labeled transects shown in the upper panel are plotted in the lower panel, with matching markers indicating the correspondence between the two panels. The thick black line in the lower panel denotes the mean profile averaged over all transects, and x=0 represents the near-coast reference location corresponding to the marker positions in the upper panel. Here, water depth and surface elevation are defined relative to the undisturbed mean sea level (MSL).
For the external forcing in the idealized model, different wind configurations were applied for each case. This setup was motivated by the common feature identified in observed extratropical cyclone events: wind direction exhibited temporal rotation. The goal was to quantitatively examine the impact of wind rotation on the formation of storm surges.
For all the idealized simulations described below, both the wind forcing and the atmospheric pressure fields were set to be spatially uniform over the entire computational domain. This simplification is supported by the realistic simulation for the April 2016 event, in which two representative offshore points show broadly coherent temporal evolution of atmospheric pressure and clockwise wind rotation despite local differences in wind magnitude (see Fig. S3). The atmospheric pressure was kept constant to eliminate the pressure gradient force, allowing us to exclusively isolate the wind-driven surge components. Specifically, we prepared the following wind forcing patterns: (1) steady wind, (2) temporally rotating wind mimicking the passage of an extratropical cyclone, and (3) multiple cases with different rotation speeds (periods: 6–72 h). These scenarios allowed us to compare differences in the temporal and spatial response of storm surges to wind rotation speed.
Through this approach, the complex processes involved in storm surge formation under realistic conditions were decomposed into fundamental components, clarifying the relative magnitude and roles of each factor.
3.1 Temporal Variation of Storm Surge Anomalies and Wind
Figure 6 shows the time series of storm surge anomalies and surface wind for the months including the three extratropical cyclone events. The observed anomalies were derived by subtracting predicted astronomical tides from the raw tide gauge observations. Each column corresponds to one of the events. In the figure, the top graph shows the monthly storm surge and the bottom shows the wind vectors and wind speed. The red highlight indicates the period surrounding the passage of the low-pressure system, which is the main focus of the analysis. Figure 7 provides expanded views of these periods, allowing detailed inspection of the storm surge anomaly variations and wind rotational behavior.
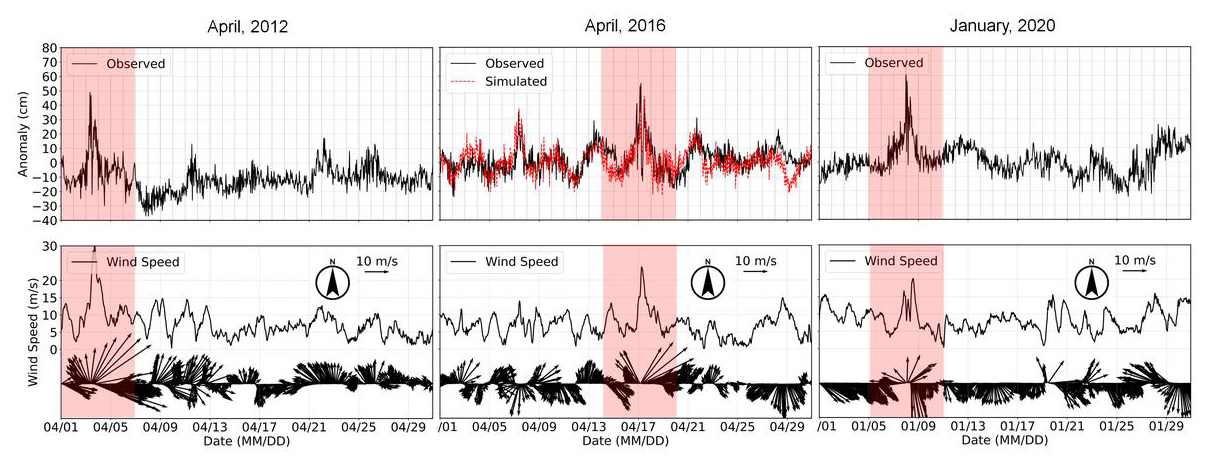
Figure 6Time series of storm surge anomalies (upper panels) and surface wind speed and direction (lower panels) for the three extratropical cyclone events examined in this study (left: April 2012, center: April 2016, right: January 2020). The observed anomalies were derived by subtracting predicted astronomical tides from tide gauge observations. In contrast, the simulated anomalies were obtained directly from surge-only computations driven solely by meteorological forcing, without including astronomical tides.
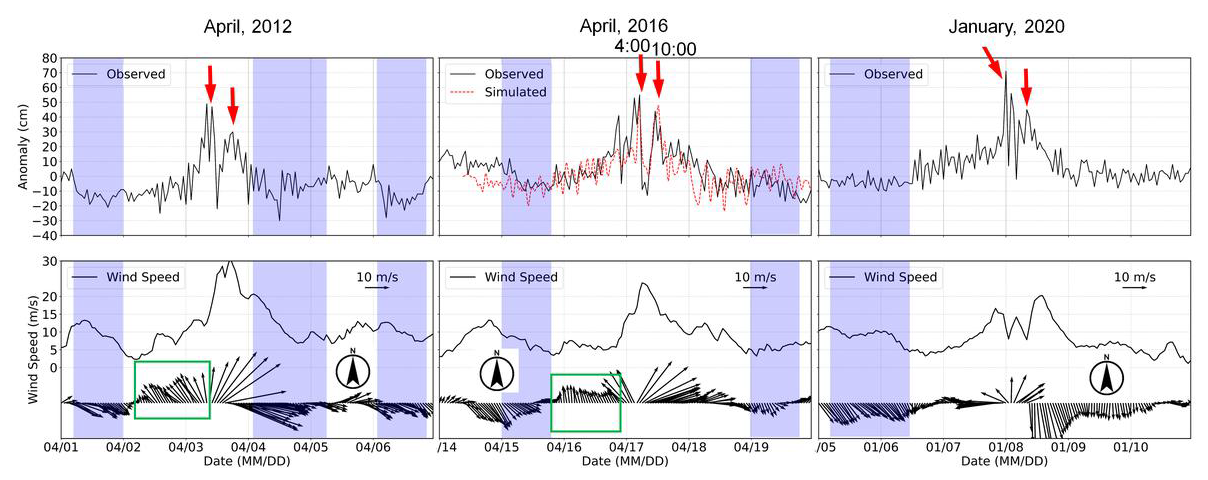
Figure 7A close-up of the red-highlighted period in Fig. 6, showing the target low-pressure events. The blue-shaded area indicates the period during which southeasterly winds were blowing toward the northern coast of Kyushu. For the 2016 case (center), the numerical simulation result is overlaid as a red dashed line. The green boxes in the lower panels mark the pre-rotation stage, during which relatively steady southerly winds persist for several to more than ten hours before the wind-speed peak; these intervals motivate the idealized steady-wind experiments discussed later in Sect. 4.3.
In all three events, the storm surge rises sharply and reaches a peak within several hours after the onset of the rise. A common feature among the events is that the wind begins rotating in a clockwise direction, shifting from southeast to south, then southwest, west, and finally northwest, prior to the anomaly peak, along with an increase in wind speed. These observations suggest that the emergence of strong, rotating winds acts as a major trigger for the development of storm surges.
All three cases exhibit a bimodal structure with two anomaly peaks spaced approximately six hours apart (indicated by red arrows) in the upper panel of Fig. 7. In each case, the first peak is the higher of the two. A noteworthy point is that in the 2020 event, although the maximum wind speed is less than in the other two cases, the storm surge reaches the highest value among the three, approximately 70 cm. This suggests that, in addition to wind speed, the rotation rate of the wind and the generation and propagation of coastal waves modulated by topographic features may play significant roles in the anomaly formation process.
Furthermore, throughout the entire periods, during times when the wind direction is from the northwest (for example, the period highlighted in blue), which represents an onshore (wind setup) direction for the northern Kyushu coast, the storm surge instead tends to decrease. This indicates that factors beyond mere wind direction – such as its temporal variability, the excitation of oscillatory components, or Ekman transport – may be controlling the storm surges. This point has been previously discussed by Ide et al. (2023); however, the specific mechanisms by which the temporal rotation of the wind field amplifies the surge and how the generated disturbances propagate along the coastline had remained unclear. Based on these features, the following sections examine the temporal evolution of wind direction using wavelet analysis and assess the results of numerical simulations in terms of their reproducibility.
3.2 Storm surges and Rotational Structure of Wind
Figure 8 presents the results of wavelet analysis of the rotational component of wind for the three extratropical cyclone events examined in this study: April 2012, April 2016, and January 2020. The left panels show the time-period distributions (in logarithmic scale) of the wavelet power spectra obtained from continuous wavelet transforms (CWT) applied to the complex wind vector u−iv. By using complex wind vectors, the analysis captures not only variations in wind speed but also the temporal evolution of wind direction, i.e. rotational motion, reflected in the energy structure. A feature common to all three events is the temporally localized intensification of wind energy within a specific range of periods, from several to about a dozen hours (indicated by the dashed box in the left panel of Fig. 8), which occurs at the time of the storm surge rise. This suggests that the sharp increase in storm surges is closely related to atmospheric variations excited at specific time scales through rotational wind motions.
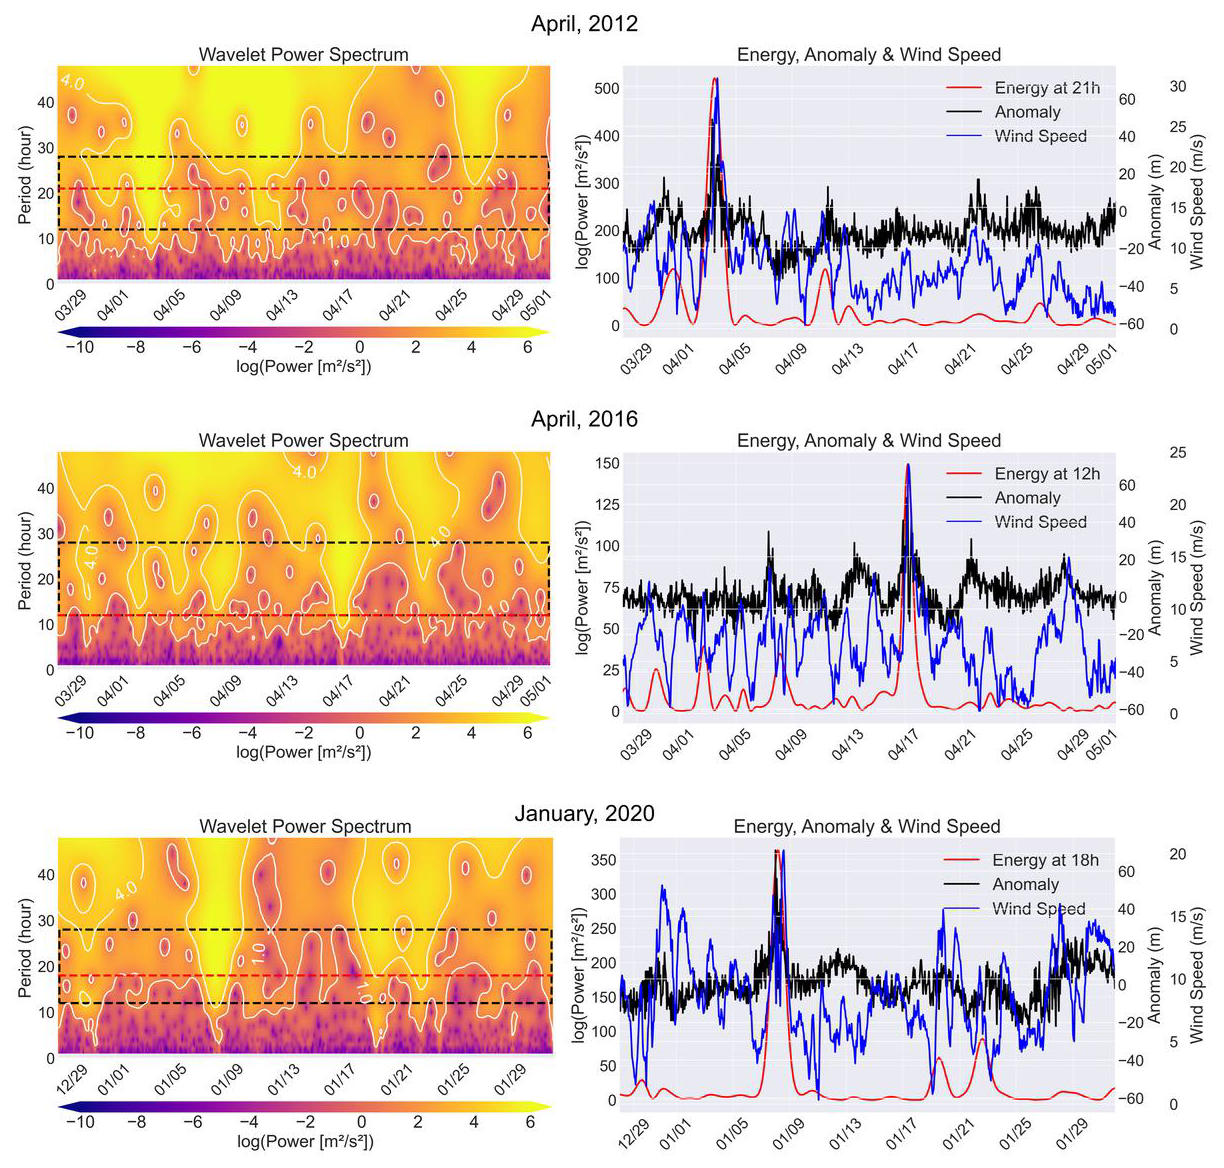
Figure 8Wavelet analysis results of wind for the three cases (upper: April 2012, middle: April 2016, lower: January 2020). The left panels show wavelet power spectra (log scale) of the complex wind vector (u−iv) (clockwise rotary component). The right panels show time series of wind energy at a selected period (red), storm surge anomalies (black), and wind speed (blue). The energy is expressed in units of log 10(Power). The horizontal red dashed lines in the left panels indicate the selected periods (T=21, 12, and 18 h, respectively) used for the wind energy time series in the right panels. The black dashed boxes highlight the period range of 12–28 h across the entire duration, indicating the specific frequency band where the wind power fluctuations closely correspond with the storm surge anomalies.
Figure 9 shows the correlation coefficients between wavelet energy of the rotational component of wind and storm surge anomalies, evaluated for each rotational period (horizontal axis). The correlation coefficients were computed using one-month datasets for each event (April 2012, April 2016, January 2020), and represent Pearson correlation values between storm surge anomalies and time series of wavelet energy at each period. As shown in the figure, all three cases exhibit peak correlation at periods around a dozen hours: specifically, 21 h in 2012, 12 h in 2016, and 18 h in 2020. The right panels in Fig. 8 display time series of wind energy at the period showing the highest correlation (red line), storm surge (black line), and wind speed (blue line). The energy shown is the squared magnitude of the wavelet coefficients, expressed as log 10(Power). It is evident that the wind energy (red line) increases sharply at the time when the storm surge (black line) rises. The correlation coefficients between storm surges and wind energy are 0.48 (2012), 0.34 (2016), and 0.43 (2020), which are significantly higher than those for wind speed alone (0.24, 0.22, and 0.20, respectively), and also higher than the maximum correlation values for specific wind directions (0.033 in the NNE direction for 2012, 0.075 in the SW direction for 2016, and 0.274 in the S direction for 2020).
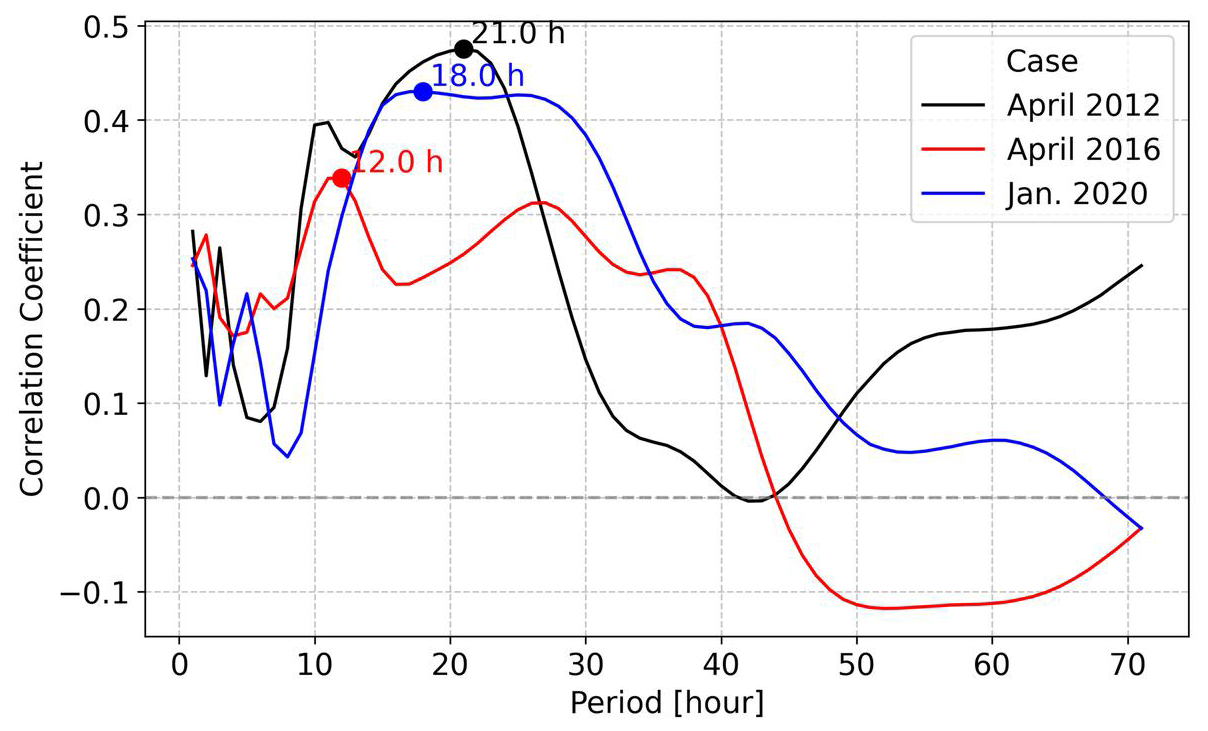
Figure 9Correlation coefficients between storm surge anomalies and wavelet energy (rotational component of wind) for each period. The differences in line color indicate the three cases, as shown in the upper-right legend of the graph.
These results quantitatively indicate that temporally varying wind directions, i.e. the rotational component, are more influential in the formation of storm surges than steady winds. On the other hand, Fig. 9 shows that correlation coefficients drop significantly at longer periods exceeding 30 h, and in some cases even become negative. This suggests that while storm surge anomalies are sensitive to atmospheric disturbances with periods of several to a dozen hours, they are not necessarily synchronized with longer-period, quasi-steady wind field variations.
Overall, these results support the conclusion that not only wind speed, but also the temporal variability of wind direction, i.e. the periodic structure of rotational wind motion, is a key factor in the formation of storm surges. In the following section, we examine how the presence or absence of these periodic components affects the spatial distribution of storm surges through numerical experiments.
4.1 Validation of Reproducibility
To validate the model's reproducibility, a comparison is made between the observed storm surges at the Hakata tide station (black solid lines) and the results from the FVCOM numerical simulations (red dashed lines) for the April 2016 event. As defined in Sect. 2.3.2, we utilized two distinct simulation setups to generate the results shown in Figs. 6 and 7.
For the one-month period shown in Fig. 6, the simulated anomalies were obtained from the long-term continuous simulation (a surge-only computation driven solely by meteorological forcing, without astronomical tides). We confirmed that the storm surge anomaly is insensitive to tide coupling for our analysis over this extended timeframe. The differences between the surge-only and fully tide-coupled approaches are sufficiently small when examining the overall temporal evolution and large-scale variability, and they do not alter the main conclusions.
Conversely, for the detailed short-term event analysis shown in Fig. 7 (center panel), we employed a high-accuracy approach (tide-coupled simulation) that includes astronomical tides to account for the nonlinear interaction between the tide and the surge during the peak period.
Under both configurations, the simulation successfully reproduces the overall variation pattern and the timing of the peaks in the anomaly. This confirms that the major fluctuations in the storm surge were appropriately captured by the model.
In particular, on 17 April, when the maximum anomaly was recorded, two distinct peaks were observed (Fig. 7). The model reproduced the timing of both peaks with an error of less than one hour. Regarding peak amplitudes, the first peak (around 04:00, indicated by the left red arrow in the figure) had an observed value of approximately 55 cm, while the simulation result was about 48 cm, indicating a slight underestimation of about 7 cm. For the second peak (around 11:00, indicated by the right red arrow in the figure), the observed anomaly was approximately 45 cm, whereas the model produced about 48 cm, showing a slight overestimation of approximately 3 cm.
These results demonstrate that the model reproduces the timing of storm surge anomaly events with high precision, and that the amplitude errors are generally within a few cm. The remaining small discrepancies may be attributed to limitations in the spatial and temporal resolution of the meteorological forcing, the internal physical schemes of FVCOM, and interactions with local topography, tidal currents, or wave fields that are not fully represented in the model. Additionally, some error may exist in the observational data due to incomplete removal of astronomical tide components.
Nevertheless, the model captures the primary generation mechanisms of storm surges both qualitatively and quantitatively. It can therefore be considered sufficiently reliable for the subsequent analysis of spatial structures and their relationship to the flow field, as will be discussed in the next subsection.
4.2 Spatial and Temporal Evolution of the Storm Surge
Using the same realistic simulation validated in Sect. 4.1, Fig. 10 shows the temporal evolution of the spatial distribution of storm surges from 21:00 on 16 April to 12:00 on 17 April 2016. Figure 11 shows the evolution of atmospheric pressure fields, and Fig. 12 shows the corresponding surface wind vectors. We begin by tracking the evolution of meteorological conditions and tide anomalies from 21:00 on 16 April to 01:00 on 17 April. From the pressure fields (Fig. 11), the center of the extratropical cyclone is seen moving eastward from the Yellow Sea north of 37° N, nearing landfall on the Korean Peninsula. Correspondingly, southeasterly to southerly winds begin to dominate offshore of the western and northern coasts of Kyushu (Fig. 12). At 01:00 on 17 April, a positive storm surge of 40–50 cm develops west of the Goto Islands (white circle in Fig. 10).
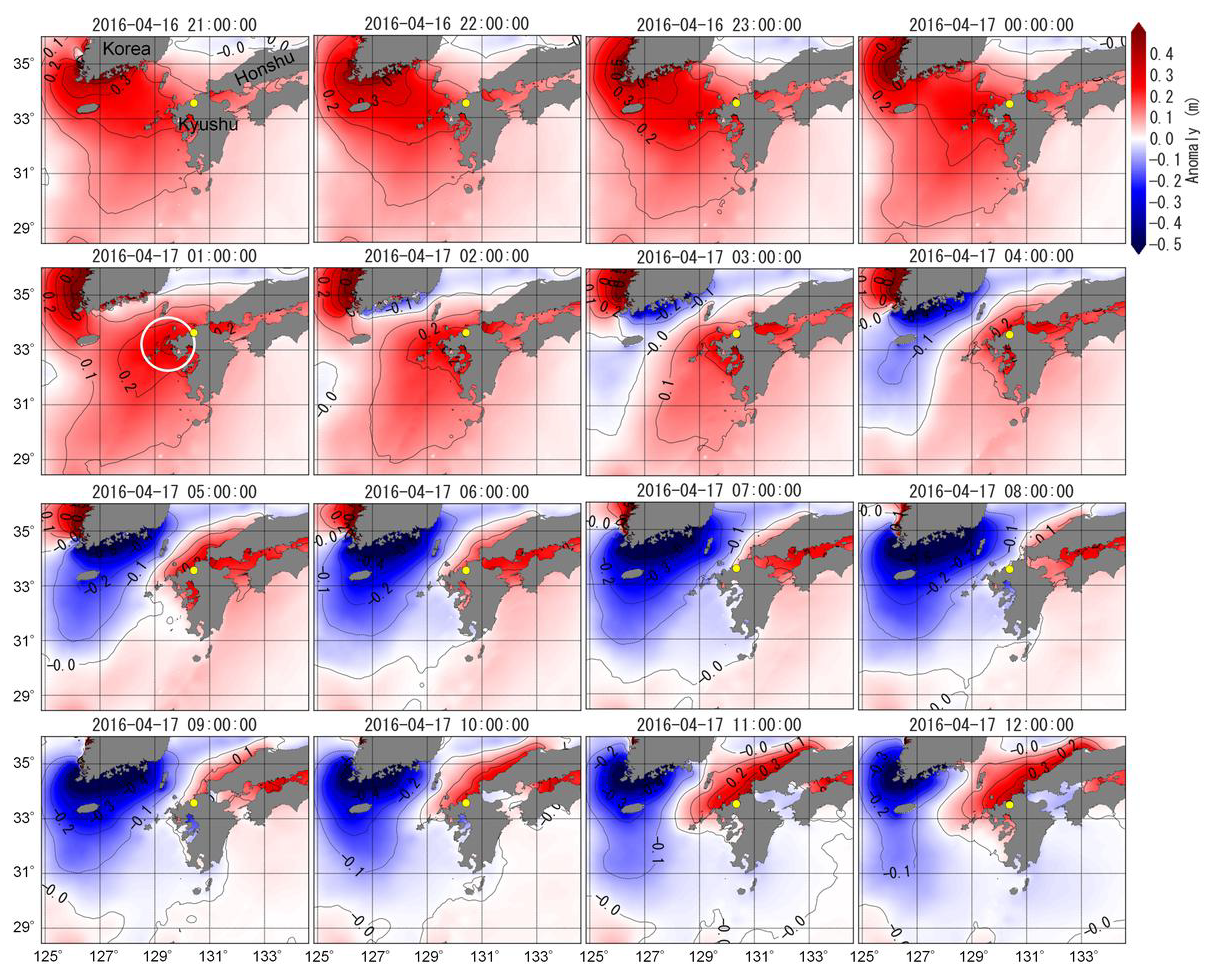
Figure 10Temporal evolution of the spatial distribution of storm surges from 21:00 on 16 April to 12:00 on 17 April 2016 (hourly intervals). The time corresponding to each snapshot is indicated at the top of each panel.
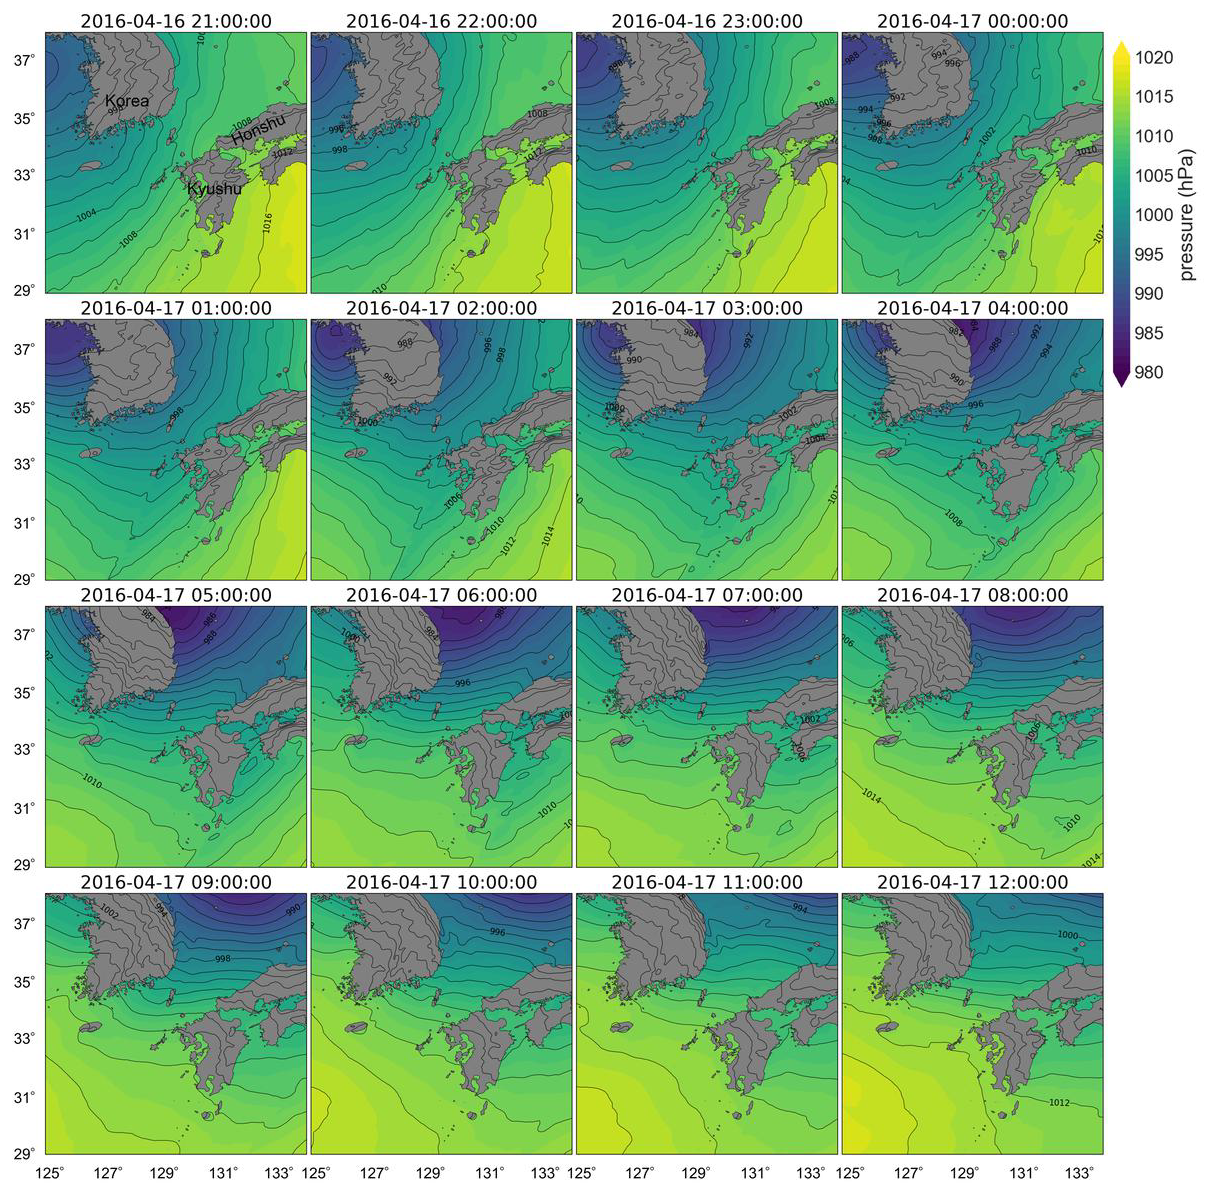
Figure 11Temporal evolution of atmospheric pressure fields from 21:00 on 16 April to 12:00 on 17 April 2016 (hourly intervals).
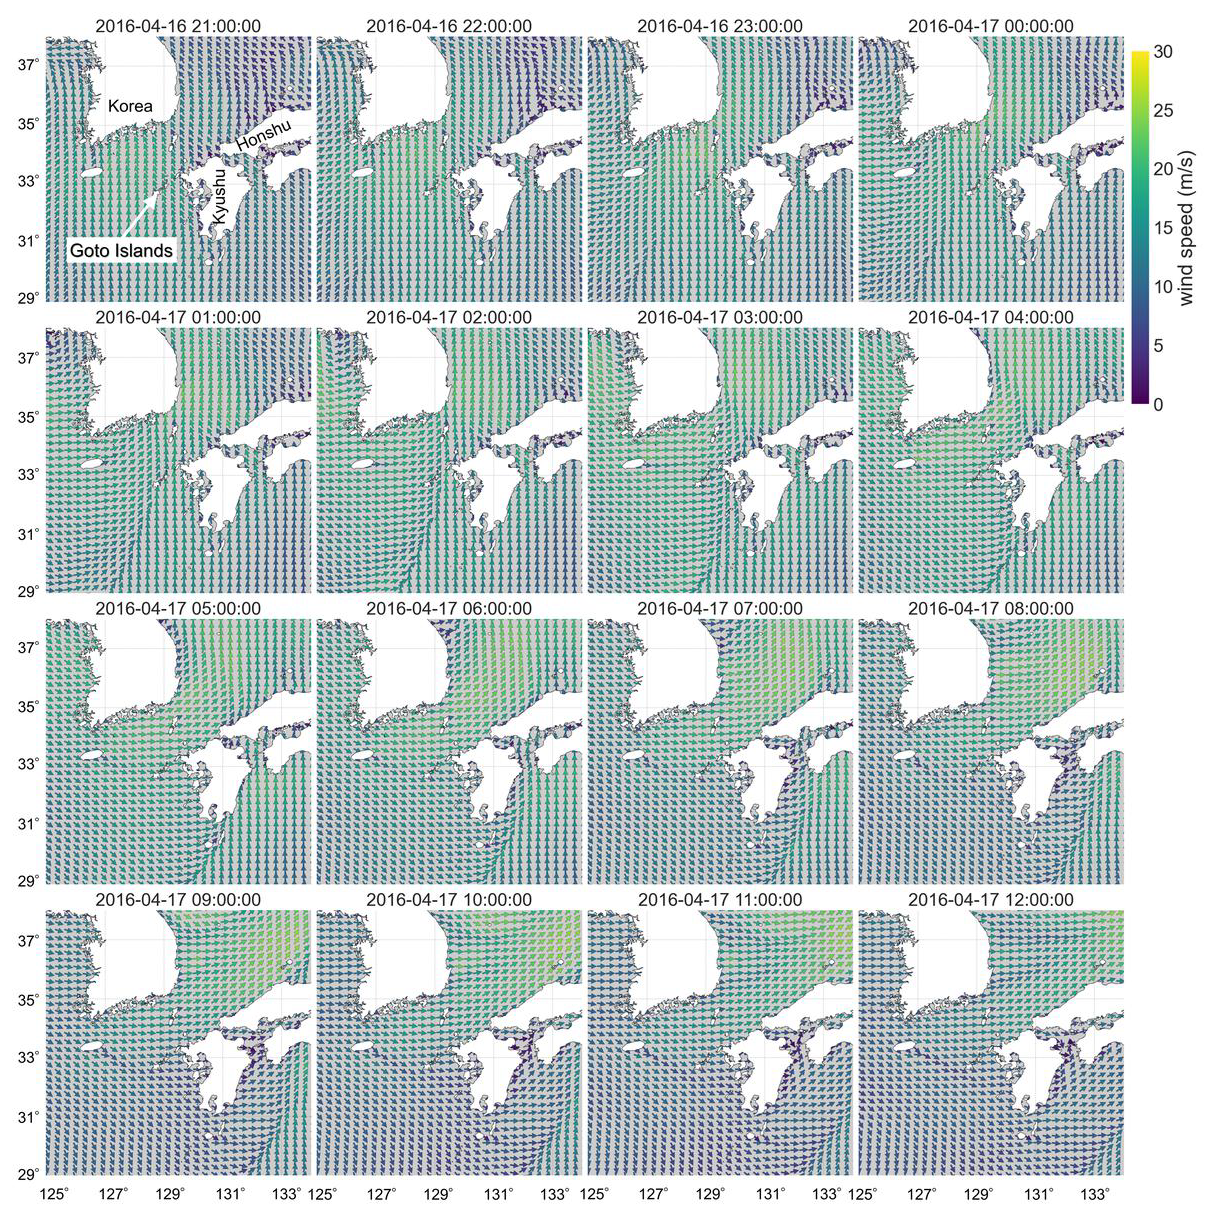
Figure 12Temporal evolution of surface wind vectors from 21:00 on 16 April to 12:00 on 17 April 2016 (hourly intervals).
This localized concentration of high anomaly can be attributed to southerly winds blowing along the western coast of Kyushu. These winds generate Ekman transport, which accumulates water along the Kyushu west coast. Additionally, a coastal-trapped wave-like structure forms along the Kyushu coast, further focusing the anomaly near the Goto Islands. Notably, around midnight to 01:00 on 17 April, the wind along the northern coast of Kyushu is predominantly from the south, which would typically drive offshore water transport due to local wind forcing and reduce sea level. However, the storm surge along the northern coast of Kyushu is in fact rising during this period (Fig. 10), indicating that local wind setup alone cannot explain the phenomenon. This implies the involvement of more complex spatiotemporal structures induced by the interaction of topography and time-varying winds, resulting in a characteristic development process.
After 01:00 on 17 April, the area of high anomaly progresses eastward along the northern coast of Kyushu, eventually passing toward Honshu (from 01:00 to 08:00 on 17 April). As shown in Fig. 7, the tide anomaly reaches a peak around 04:00 at the Hakata tide station (yellow dot in Fig. 10) as this disturbance passes. The propagation speed of the high anomaly region can be estimated at approximately 10 m s−1, based on a travel distance of about 110 km in roughly 3 h. This is consistent with the typical phase speed of shallow water waves (coastal-trapped wave) in water depths of 15–35 m (corresponding to a shallow water wave speed of approximately 12–18 m s−1) along the northern Kyushu coast (Fig. 5). During the 3 h from 01:00 to 04:00, the wind direction in the Tsushima Strait rotates clockwise by about 90°, from southerly to westerly. This corresponds to a rotation period of approximately 12 h (a quarter-turn in 3 h), matching the dominant wind direction rotation component identified in Figs. 8 and 9.
As time progresses beyond 09:00 on 17 April, the previously subsided anomaly reintensifies along the northern Kyushu coast, producing the second peak commonly observed in all three events (Fig. 7). Despite the cyclone having moved over the Sea of Japan and wind intensity having declined by this time, sea levels rise again. This is due to resonant oscillations of the entire Tsushima Strait. According to Ozaki et al. (2025), dominant oscillation modes in the Tsushima Strait have periods of approximately 5 and 10 h. Both the simulation and observations show a second rise in sea level 6 h after the first peak at 04:00, occurring around 10:00–11:00 on 17 April (Figs. 7 and 10).
The realistic topography simulation presented above demonstrates that the spatial evolution of storm surge anomalies results from the interaction between rotating wind fields and complex coastal topography. In particular, the process in which an anomaly formed by southerly winds along the western coast of Kyushu propagates eastward and peaks in Hakata Bay suggests not only local wind setup effects within the bay but also the involvement of topographically induced wave propagation and geostrophic responses. However, in the realistic-topography simulation, both the coastal geometry and the applied meteorological forcing are highly complex, making it difficult to isolate the dominant factors responsible for the observed anomalies. Therefore, in the following subsection, we employ idealized simulations with simplified topography and forcing conditions, in which the coastal configuration and wind field can be systematically controlled as independent variables, including the presence or absence of major geographic features such as the Goto Islands and the Korean Peninsula. This approach enables us to clarify the fundamental physical mechanisms governing the generation and propagation of storm surges.
4.3 Dynamical Validation of Coastal Propagation Using Idealized Topography Mesh
Numerical experiments using an idealized topography mesh and simplified external forcing were conducted to eliminate the complex factors in realistic terrain and isolate the key dynamical mechanisms, thereby clarifying the dominant physical processes involved in the generation and propagation of storm surges. As indicated by the green boxes in Fig. 7, during the approach of the 2012 and 2016 extratropical cyclones, there are periods when steady southerly winds persist for several to more than ten hours, prior to the wind speed reaching its peak (i.e. before the onset of wind rotation). Based on this observation, this section first investigates the spatial and temporal structure of storm surges induced by a steady, spatially uniform northward wind of 20 m s−1, to systematically analyze the dynamic responses related to the generation and propagation of coastal waves. Particular attention is paid to the process, suggested by simulations with realistic topography, in which water masses accumulated along the coast via Ekman transport propagate as coastal-trapped structures, including their propagation speed and peak formation mechanisms.
Figure 13 shows the time evolution of spatial distributions of storm surges under the condition of a uniform and steady northward wind (20 m s−1) applied to the idealized topography. In the early stages after the wind begins (2–6 h), the storm surge anomaly decreases along the northern coast of Kyushu due to offshore water displacement. However, about 10 h after the onset of wind forcing, a pronounced positive anomaly develops along the western and northern coasts of Kyushu. This is clearly attributed to the southerly wind-induced Ekman transport elevating sea level along the western coast, followed by the propagation of the accumulated water mass northward along the coast (6–8 h), with anomaly concentration around the northwestern coast of Kyushu (10 h). Subsequently, the positive anomaly propagates eastward along the northern coast and spreads toward the Honshu side over time (14 h).
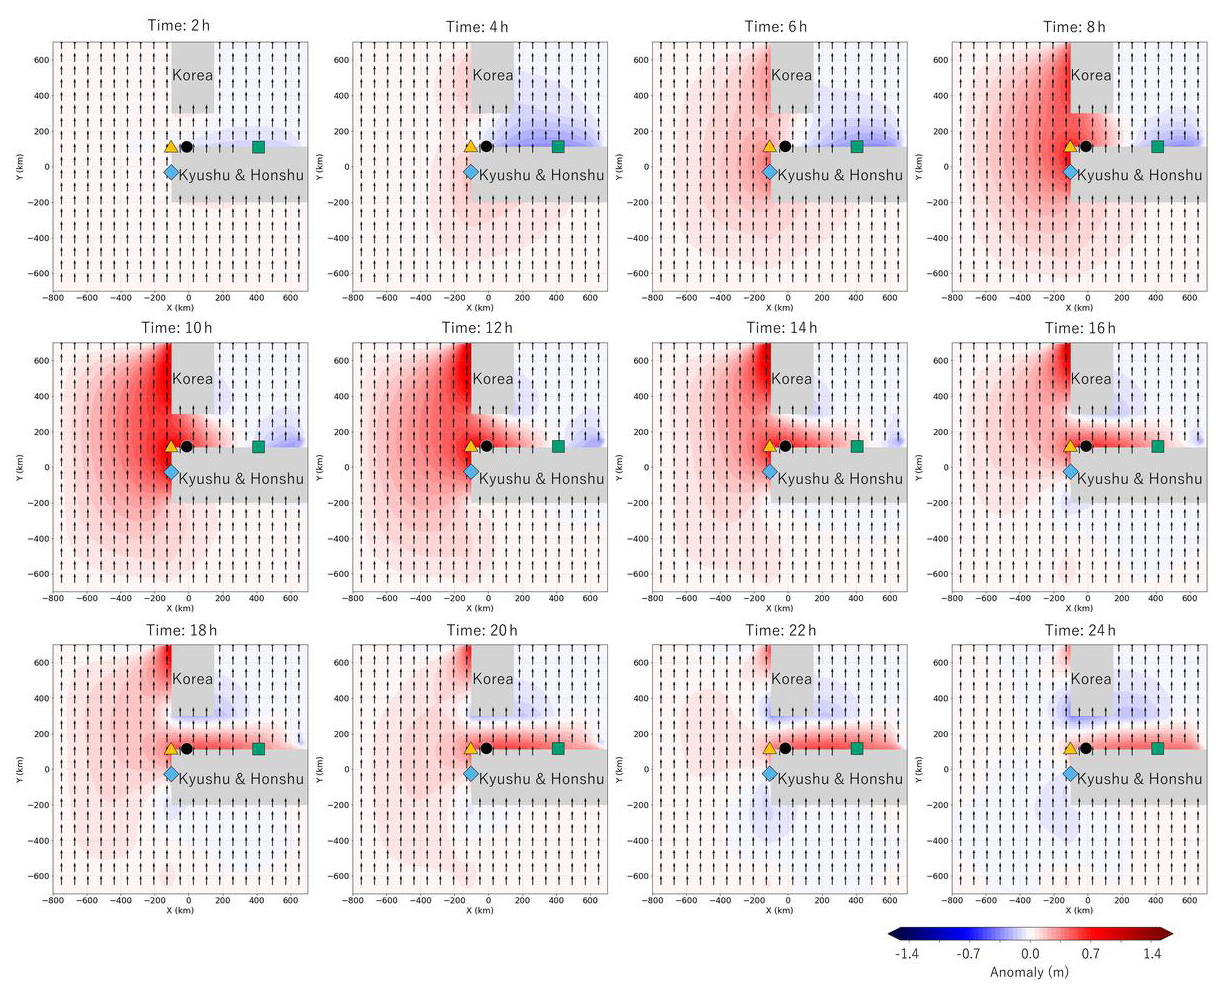
Figure 13Spatial distribution of storm surges for the steady northward wind case over the idealized topography at multiple time steps. The background shading indicates storm surges, and arrows show wind vectors. Reference points are indicated by distinct markers: light-blue diamond (western coast of Kyushu), orange triangle (northwestern Kyushu), black circle (Hakata Bay), and green square (the Honshu coast).
To examine the role of the Earth's rotation (the Coriolis effect), we conducted an additional sensitivity experiment identical to the base case except that the Coriolis parameter was set to zero (f=0; see Fig. S1). In the non-rotating case (f=0), the coastal surge anomalies disappeared and the associated alongshore propagation was not reproduced. In particular, at the Hakata tide-gauge location on the northern coast, offshore-directed winds maintained a quasi-steady negative surge anomaly, indicating that the amplification mechanism fundamentally relies on rotation-driven dynamics (e.g., Ekman transport and the coastal-trapped wave response).
This unidirectional coastal propagation exhibits features where the anomaly is concentrated near the coastline and decays rapidly offshore. As discussed later, its propagation speed and spatial structure suggest that it can be interpreted as a coastal-trapped wave governed by a balance between geostrophic flow and gravity. Despite the application of a spatially uniform and steady wind, these spatial variations reproduce key features of peak anomaly occurrence and its propagation observed in the realistic topography model.
To complement the spatial analysis, Fig. 14 shows the time series of storm surges at four reference points (identified by distinct markers in Fig. 13). The anomaly rise begins earliest at the light-blue diamond, located on the western coast of Kyushu, due to Ekman transport. It is followed approximately four hours later by an increase at the orange triangle on the northwestern coast. Meanwhile, during this interval, temporary negative anomalies form at the black circle (Hakata Bay equivalent) and green square (Honshu side) points. These reflect short-term sea level drops caused by offshore water movement driven by the local wind.
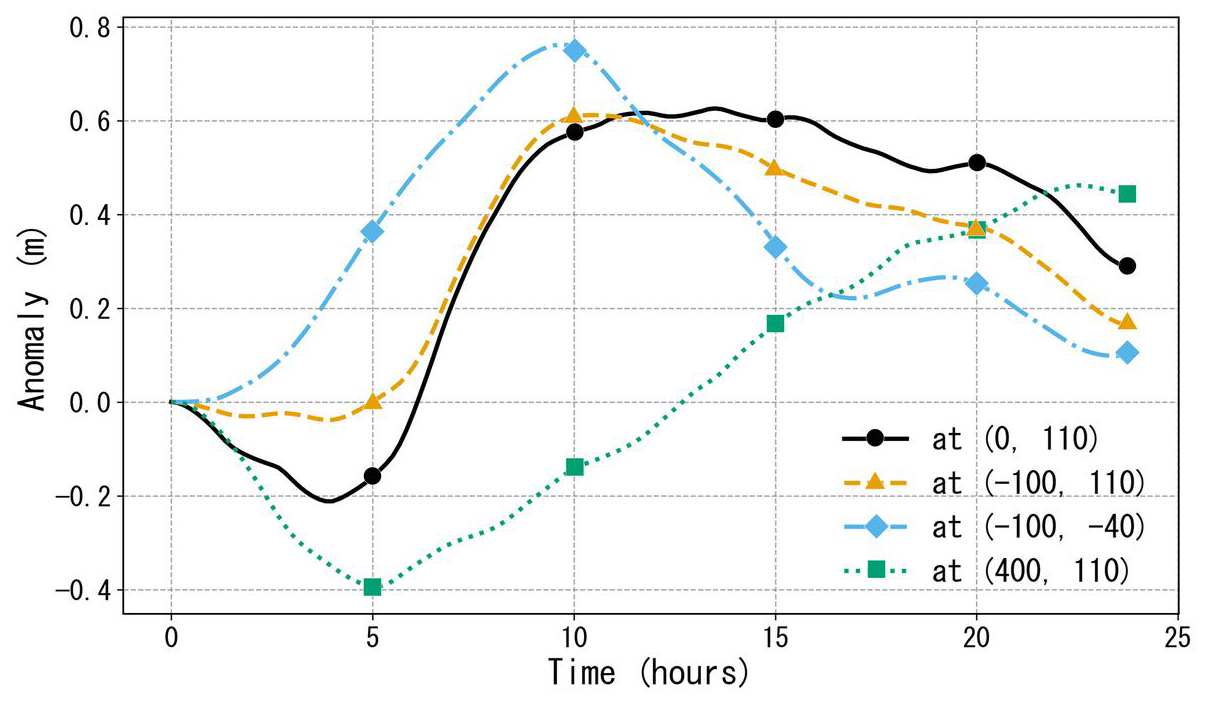
Figure 14Time series of storm surge anomalies at four locations under the idealized topography. The four locations are distinguished by matching marker shapes (and colors) corresponding to the reference points shown in Fig. 13.
Eventually, the anomaly peak propagates from the western coast to the northwestern coast and then to the northern coast and the Honshu side, with the four points showing corresponding differences in peak timing. The estimated propagation speed is about 12 m s−1, which is close to the propagation speed (∼ 10 m s−1) obtained in the realistic topography simulation. However, this value is lower than the theoretical shallow-water Kelvin wave speed, m s−1, estimated from a representative depth of 35 m (Fig. 5). This difference is expected because the relation assumes a constant-depth cross-shore structure and therefore represents an ideal Kelvin wave. In the present shelf–slope configuration, where the water depth varies across the continental shelf, the disturbance behaves as a coastal-trapped wave supported by the shelf structure (Huthnance, 1978). Coastal-trapped waves are dispersive and their phase speeds depend on the shelf width and the cross-shore depth gradient. Consequently, propagation speeds smaller than are expected even in idealized shelf geometries.
Additionally, the maximum amplitude of the anomaly gradually decreases as it propagates eastward, suggesting attenuation due to spatial spreading of wave energy. Thus, while some finer details differ, the idealized simulation successfully captures the key spatial development observed in the realistic model and in observations, where storm surges originate near northwestern Kyushu and propagate eastward. This confirms that the model appropriately captures the dominant physical processes involved in anomaly formation. In the next subsection, additional idealized simulations are used to further investigate how temporal variations in wind (particularly wind direction rotation) and differences in coastal topography affect this coastal propagation process.
4.4 Effects of Rotational Wind Forcing
This section investigates the storm surge response under rotational wind forcing. The black line in Fig. 15 shows the relationship between the maximum storm surge at the Hakata Bay-equivalent location (black circle marker in Fig. 13) and the wind rotation period for a series of test cases. The wind forcing was initially set to be easterly at 20 m s−1, then rotate clockwise with a constant wind speed and angular velocity. The choice of initial wind direction was based on observational wind patterns shown in Fig. 7, where the 2012 and 2016 events began with southeasterly winds and the 2020 event with easterly winds.
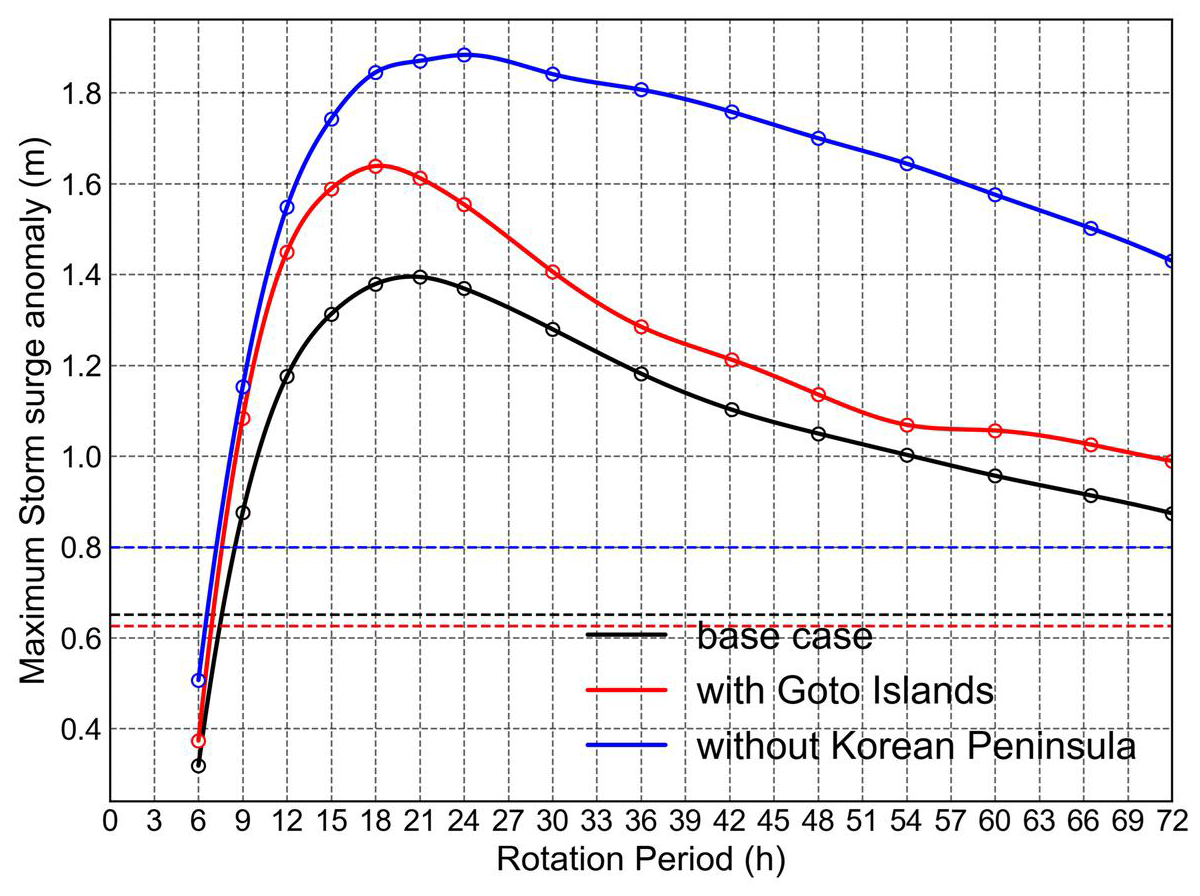
Figure 15Maximum storm surge for each wind rotation period under the three topographic configurations. The black line represents the base case (with the Korean Peninsula but without the Goto Islands); the red line represents the case including the Goto Islands (with the Korean Peninsula); and the blue line represents the case with neither the Goto Islands nor the Korean Peninsula. The dashed line shows the simulation forced by a steady southerly wind.
As shown in the black line of Fig. 15, storm surges are notably amplified for wind rotation periods between 15 and 27 h, with a peak anomaly occurring in the 21 h rotation case. The spatial distributions of storm surges for this case are shown in Fig. 16. Approximately 6 h after the start of the forcing, the wind becomes southerly, inducing negative storm surge anomalies along the northern coasts of Kyushu and Honshu due to offshore water displacement. At the same time, sea level begins rising along the western coast of Kyushu as a result of Ekman transport. Between 6 and 10 h, as the wind shifts from southerly to westerly, storm surge anomalies sharply increase around northwestern Kyushu, and the elevated sea levels spread along the northern coast. A peak anomaly is observed at the Hakata Bay-equivalent location (black circle marker in Fig. 13) at 12 h, during which northwesterly winds prevail. The observed peak results from the combined action of three physical processes: (i) Coastal-trapped wave propagation: a coastal-trapped wave generated in the northwestern region propagates eastward along the coast of Kyushu, conveying accumulated water mass toward Hakata Bay. (ii) Ekman transport: under the influence of wind forcing and the Coriolis effect, surface waters are transported obliquely toward the coast, enhancing coastal water accumulation. (iii) Local wind setup: persistent local winds drive surface waters directly toward the shore, elevating sea level near the coast. These three effects act constructively, amplifying the storm surge near the northern coast of Kyushu. After reaching its maximum, the anomaly propagates eastward toward Honshu, while sea level in Hakata Bay begins to decrease. Figure 17 schematically summarizes these processes, showing how the combined effects of coastal wave propagation, Ekman transport, and local wind setup sequentially intensify the anomaly. Subsequently, the anomaly propagates toward the Honshu coast, and sea level begins to decrease in Hakata Bay. These results suggest that, under rotating wind conditions, multiple contributing mechanisms act in concert to amplify the peak storm surge. In fact, storm surges under 21 h wind rotation exceed those under steady wind by more than a factor of two, suggesting the occurrence of resonance, in which the wind rotation period matches the response period of coastal wave dynamics. Furthermore, as shown in Fig. 8, the actual wind field in April 2016 contained periodic components of approximately 12–28 h, which showed strong correlation with storm surge anomalies, lending additional consistency to the model results.
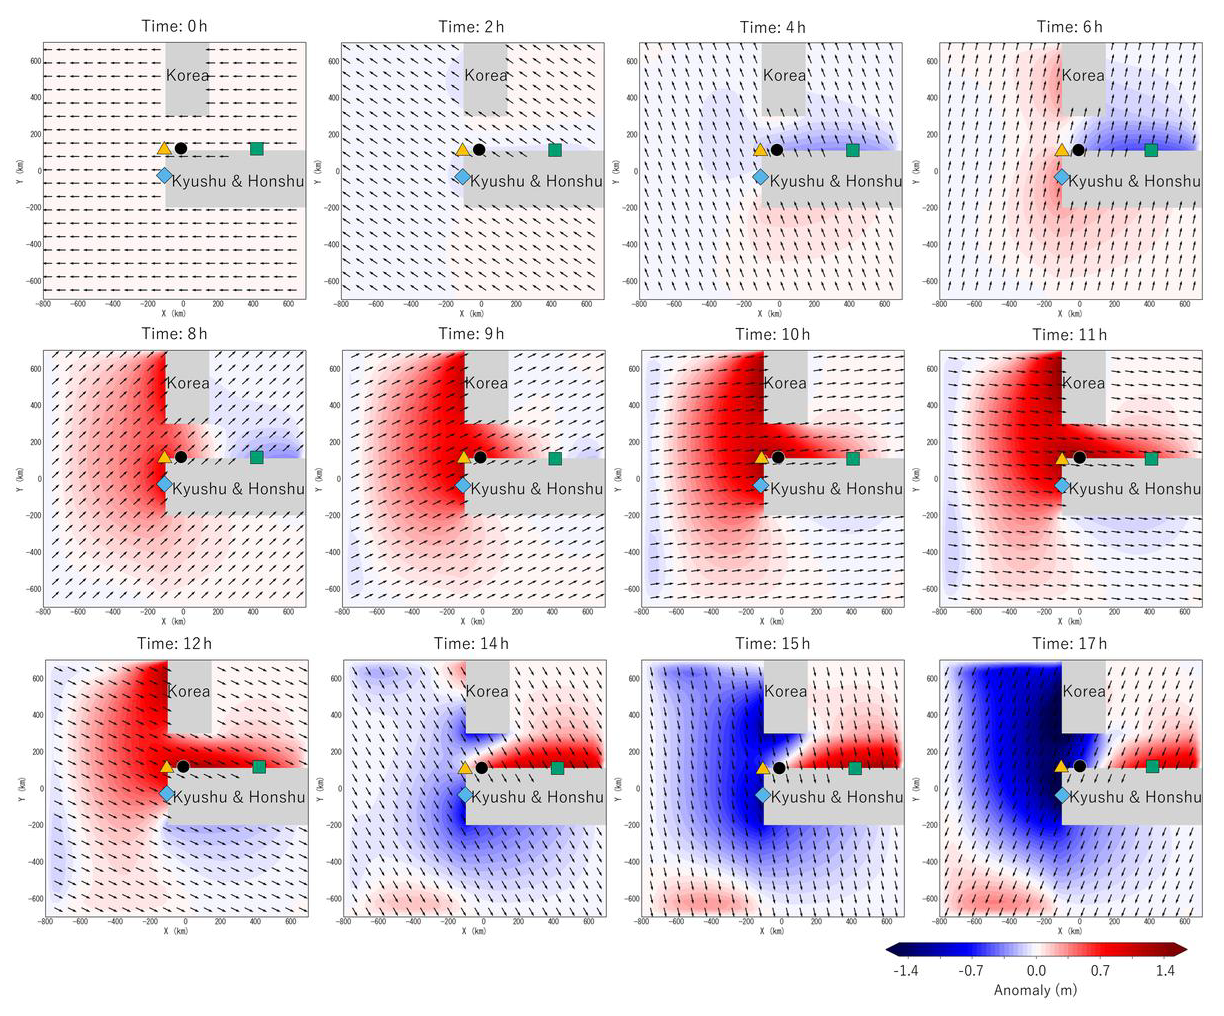
Figure 16Spatial distribution of storm surges and wind vectors for the clockwise-rotating wind case with a 21 h period over the idealized topography (multiple time steps). Background shading represents storm surges, and the reference points are indicated by the same marker shapes (and colors) as in Fig. 13. Note that the time intervals between panels are not uniform. Note that this case corresponds to the peak value of the base case shown in Fig. 15.
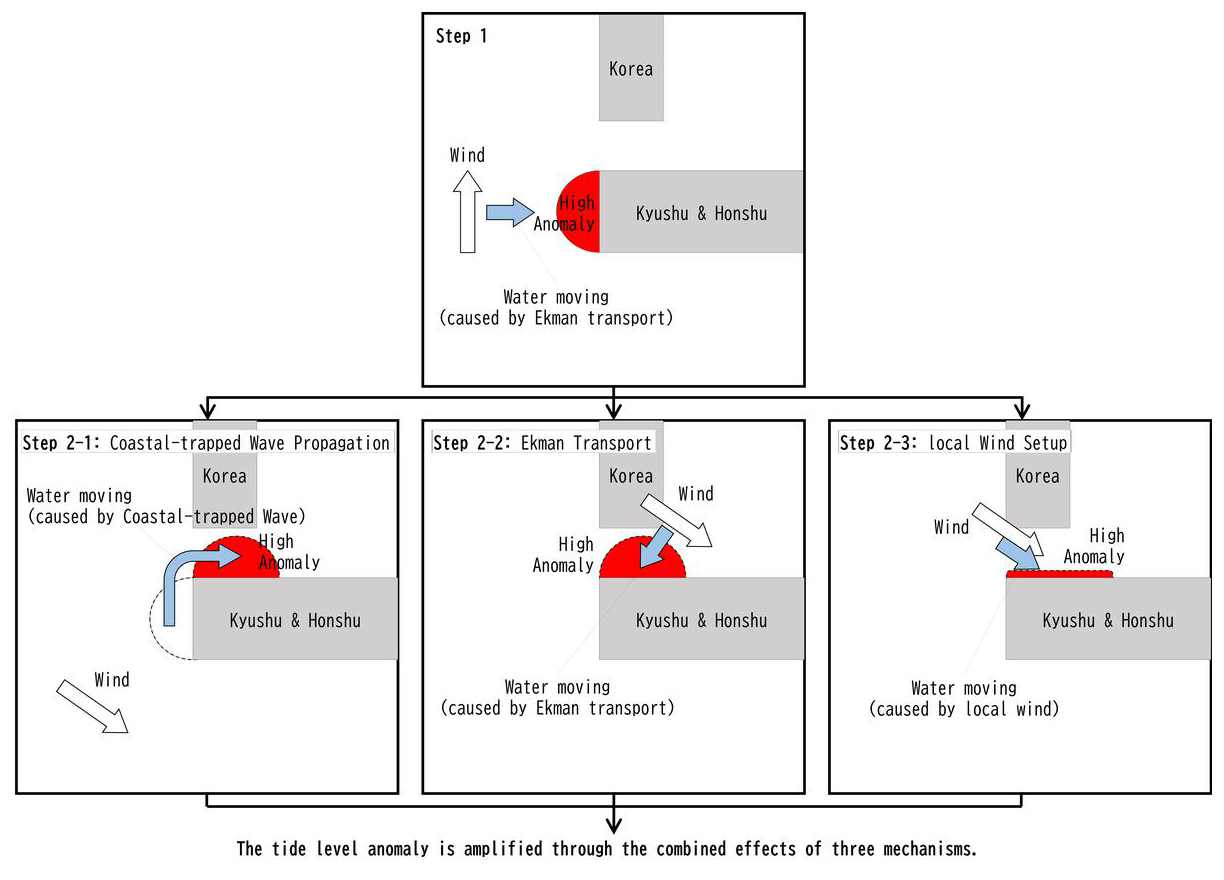
Figure 17Schematic illustration of the amplification process of storm surges along the northern coast of Kyushu. Step 1 shows the accumulation of high storm surges along the western coast of Kyushu caused by persistent southerly winds. The anomaly develops through the combined effects of three physical mechanisms: (Step 2-1) coastal-trapped wave propagation from the northwestern region, which transfers accumulated water eastward along the coast; (Step 2-2) Ekman transport, in which wind forcing and the Coriolis effect drive surface waters obliquely toward the coast, enhancing coastal accumulation; and (Step 2-3) local wind setup, where persistent onshore winds elevate sea level near the coast. These mechanisms act constructively to amplify the storm surge before it propagates eastward toward Honshu.
It is worth noting that the strength of such resonant responses is not determined solely by the periodic structure of the wind, but also heavily depends on the shape and configuration of the coastal topography. Therefore, we next examine in detail which specific topographic features are critical in enabling this resonant amplification of storm surges.
4.5 Effects of Coastal Topographic Features on Storm Surges
To evaluate the influence of coastal topography on resonant responses, numerical experiments were conducted with and without the presence of the Goto Islands and the Korean Peninsula.
4.5.1 Effect of the Goto Islands
We examined the influence of the Goto Islands (right panel in Fig. 1) on the formation of storm surges in this subsection. The idealized mesh used was based on the configuration shown in Fig. 4, with the addition of landmass representing the Goto Islands (highlighted in yellow). Under this condition, we calculated the maximum storm surge at the Hakata Bay-equivalent location (black circle marker in Fig. 16) for multiple cases with different wind rotation periods, as shown by the red line in Fig. 15.
When the Goto Islands were included, the peak rotation period shifted about 3 h toward the shorter side, from 21 to 18 h, compared to the base case (without the Goto Islands), and the maximum anomaly was amplified by approximately 1.15 times. This temporal shift is likely due to the rapid accumulation of storm surge anomalies along the southern coast of the Goto Islands caused by onshore wind setup from southerly winds. Meanwhile, along the western coast of Kyushu, water mass accumulation occurred more gradually via Ekman transport, as in the base case. As a result, the anomalies generated near the Goto Islands propagated earlier toward the northern coast and overlapped with those forming along the western coast, shifting the resonance timing toward shorter periods.
The amplification of maximum anomalies occurred because the presence of the Goto Islands introduced a dual structure of anomaly formation through both wind setup and Ekman transport. Although these effects were not perfectly synchronized, their partial overlap led to reinforced positive anomalies along the western coast of Kyushu, allowing larger anomalies to propagate to the Hakata Bay-equivalent location.
To illustrate this process, Fig. 18 highlights how the presence of the Goto Islands modifies the spatial development of the storm surge and the associated flow field under an 18 h wind rotation period. In particular, the case including the islands exhibits an earlier and more pronounced onshore flow toward the Hakata Bay-equivalent coastline, accompanied by enhanced convergence along the western boundary. These differences indicate that the islands alter the pathway and strength of the wind-driven current, thereby amplifying the local storm surge response.
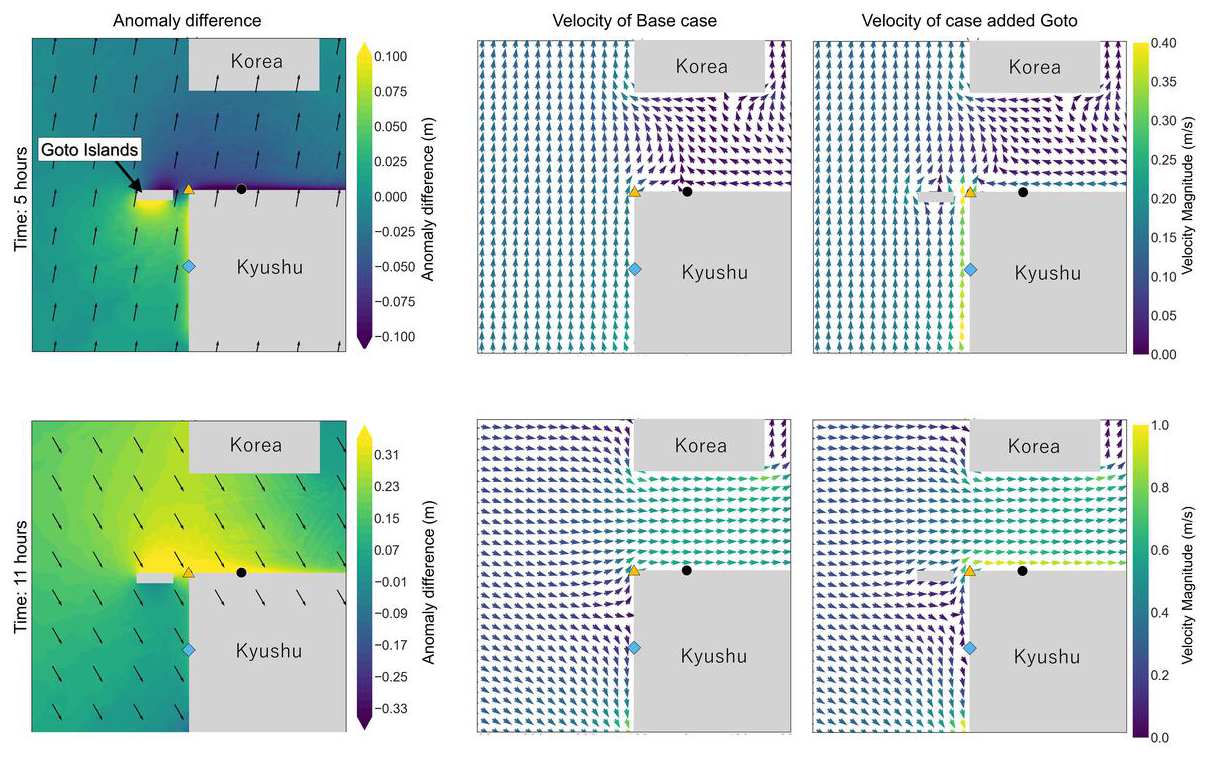
Figure 18Difference in storm surges and velocity fields due to the presence or absence of the Goto Islands under a rotation period of 18 h. Left column: difference in storm surges (Goto Islands Included minus Goto Islands Excluded) with wind vectors overlaid; center: vertically averaged velocity vectors for the Goto Excluded case; right: same for the Goto Included case. The upper panels show results at 5 h after the start of the simulation, and the lower panels at 11 h (when the anomaly peaks at the Hakata Bay-equivalent location). Note that the contour ranges differ between the upper and lower panels.
At 5 h (top row), when southerly winds dominate, sea level is elevated along the southern coast of the Goto Islands (left column), and the velocity field (right column) shows water being pushed toward the southern coast by wind setup. This wind-induced setup leads to rapid accumulation of storm surge anomalies in this area. In contrast, the northern coast of Kyushu exhibits negative anomaly difference, likely because the presence of the Goto Islands restricts the transport of water masses from the western to the northern coast of Kyushu. Although strong currents are observed in the channel between the Goto Islands and Kyushu (top right panel), they are insufficient to fully supply water to the northern coast relative to the base case without the Goto Islands.
These results indicate that the presence of the Goto Islands accelerates sea level rise along the western coast of Kyushu and enhances the rate of anomaly accumulation around northwestern Kyushu. At 11 h (bottom row), the case including the Goto Islands shows higher anomalies over a broader area from the Goto Islands to the northern coast of Kyushu, along with the development of a prominent coastal current. This can be interpreted as the accumulated water mass being rapidly released and propagating as a coastal wave toward the northern coast, in response to wind direction changes, which enabled the surge response to develop differently due to the presence of the Goto Islands.
Figure 19 compares the time series of storm surges between the realistic topography case (blue line) and the case in which the Goto Islands were removed (red line). In the realistic topography case, the actual meteorological forcing used in the April 2016 extratropical cyclone event (the same as shown in the central panel of Fig. 6) was applied. Focusing on the first peak (04:00 on 17 April), the anomaly in the no-Goto case is approximately 12 % smaller than that in the realistic case. This reduction ratio is consistent with the result obtained from the idealized topography experiment, indicating that the presence of the Goto Islands clearly enhances the storm surge along the northern coast of Kyushu. In contrast, the second peak (12:00 on 17 April) shows almost no difference between the two cases. This secondary peak corresponds to the delayed response caused by oscillations throughout the Tsushima Strait (the detailed mechanism is explained in Ozaki et al., 2025), suggesting that the Goto Islands have little influence on this later resonant mode.
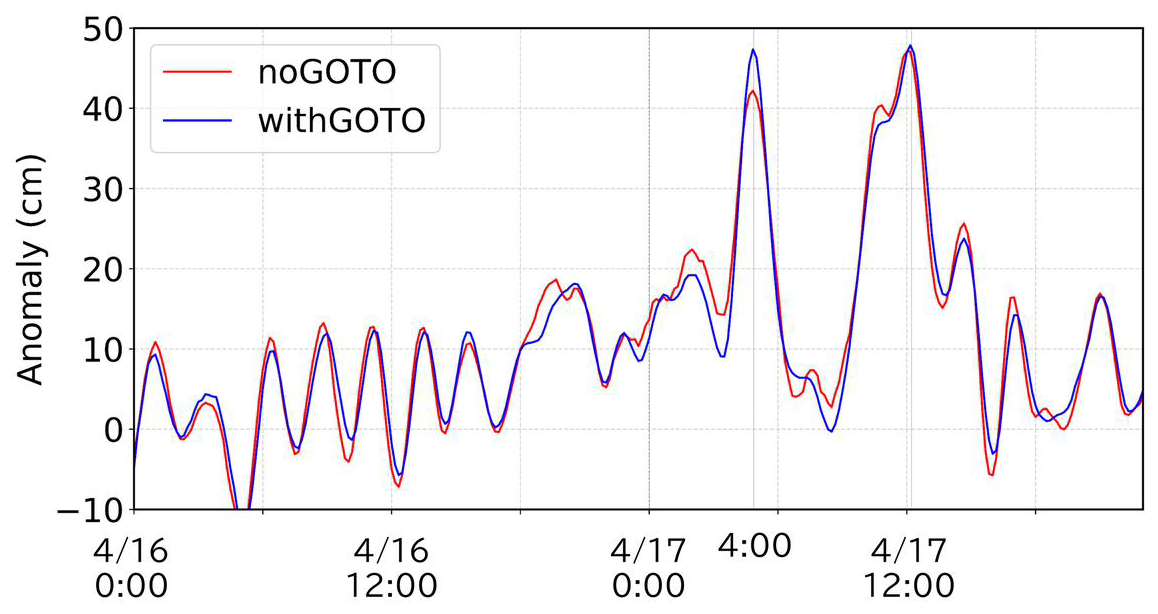
Figure 19Comparison of simulated storm surges at the Hakata Bay-equivalent location between the realistic topography case (blue line) and the case in which the Goto Islands were removed (red line). The first peak (around 04:00 on 17 April) in the no-Goto case is approximately 12 % smaller than that in the realistic case, whereas the second peak (around noon on 17 April) shows almost no difference between the two cases.
4.5.2 Effect of the Korean Peninsula
In this subsection, we examined the effect of the Korean Peninsula on storm surges using the idealized topography mesh. It should be noted that the base case (the black line of Fig. 15) used for this comparison already excludes the Goto Islands. Since we evaluate the impact of the Korean Peninsula by simply removing it from this base configuration, the Goto Islands are not included in this examination. The blue line in Fig. 15 shows the maximum storm surges at the Hakata Bay-equivalent location for each wind rotation period in the case where the Korean Peninsula is removed from the base configuration. The results indicate that the maximum anomaly increases to approximately 1.35 times that of the base case, demonstrating that the presence of the Korean Peninsula significantly suppresses the amplitude of storm surges.
To identify the cause of this suppression, Fig. 20 shows how the removal of the Korean Peninsula modifies the storm surge and flow field under a 21 h wind rotation period. In the no-Korea configuration, the onshore flow toward the northern Kyushu coast becomes stronger and more spatially coherent, resulting in an enhanced surge response. In contrast, when the peninsula is present, it blocks the southwestward component of the wind-driven current and weakens the coastal convergence, thereby reducing the peak surge.
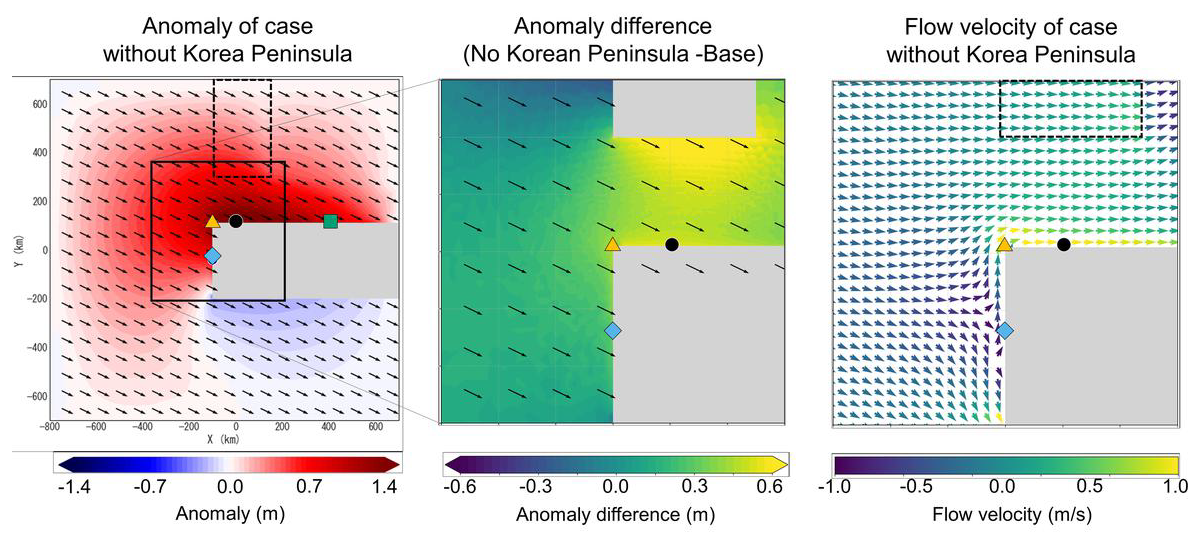
Figure 20Difference in storm surges due to the presence or absence of the Korean Peninsula and flow velocity fields under the condition of a 21 h rotation period. Left: storm surges and wind vectors in the case without the Korean Peninsula; Center: difference in storm surge anomalies between the case without the Korean Peninsula and the base case (No Korean Peninsula – Base). Positive values indicate larger anomalies in the no-Korea case; Right: vertically averaged flow velocity field in the no Korean Peninsula case. All results correspond to 12 h after the start of the simulation.
In the no-Korea case (left panel), high anomaly regions extend broadly from the Tsushima Strait into the Sea of Japan (positive y-direction), and the difference map (center panel) clearly shows that the Korean Peninsula suppresses the spread of anomalies throughout the Tsushima Strait, including the northern coast of Kyushu. Notably, the suppression is significant not only around Hakata Bay but also north of the Strait.
This spatial suppression effect can be interpreted as a result of coastal wave structures being constrained by topography. Evaluating the Rossby radius of deformation, , where g is gravitational acceleration, H is water depth, and f is the Coriolis parameter, yields approximately 370 km for H=100 m at latitude 35°. This exceeds the typical width of the Tsushima Strait (200 km between the northern Kyushu coast and the southern coast of the Korean Peninsula). Thus, in the absence of the Korean Peninsula, wave energy would be expected to spread farther north. However, the physical presence of the Korean Peninsula acts as a barrier, limiting this expansion and consequently restricting raised sea level along the Kyushu coast.
Comparing the flow field in the right panel of Fig. 20 with that shown in the bottom center panel of Fig. 18, we find that removing the Korean Peninsula strengthens the flow along the northern coast of Kyushu, while weakening the flow in the central Tsushima Strait and offshore (positive y-direction). The steeper pressure gradient formed in the absence of the Korean Peninsula generates a stronger alongshore current near the northern coast of Kyushu to maintain geostrophic balance. Conversely, offshore of the Strait, where the narrow-passage effect disappears, the flow becomes spatially more distributed, resulting in weaker currents. These results indicate that the Korean Peninsula acts not only as a geometric barrier but also as a regulator of the dynamic balance between the pressure gradient and coastal current within the Tsushima Strait, thereby suppressing the amplitude of storm surges along the northern coast of Kyushu.
This study investigated the formation mechanisms of storm surges induced by extratropical cyclones along the northern coast of Kyushu by combining observational data analysis and numerical simulations. Through this integrated approach, we identified how the temporal evolution of wind direction and regional coastal topography jointly control the development and amplification of storm surges.
Analysis of tide gauge data, particularly at the Hakata tide station, revealed three extratropical cyclone events (in 2012, 2016, and 2020) characterized by pronounced storm surges. A common feature among these events was the clockwise rotation of wind direction, from easterly to westerly, over a period ranging from 10 to more than 20 h. This temporal change in wind direction was strongly correlated with both the timing and magnitude of the anomalies. Wavelet analysis further demonstrated that the energy of the rotational wind component (u−iv) corresponded closely with anomaly amplitude, highlighting the importance of time-varying wind forcing in generating coastal sea level responses.
These observational findings were reproduced by numerical simulations that successfully captured the spatiotemporal evolution of storm surges, with a particular focus on the 2016 event. The model revealed that sea level rises initially along the western coast of Kyushu under southerly winds and then propagates eastward along the northern shoreline as a coastal-trapped wave.
Idealized topography experiments clarified the underlying dynamics. Even under steady wind forcing, coastal anomalies propagated with speeds of approximately 12 m s−1. This propagation speed is smaller than the theoretical Kelvin wave speed estimated from the representative shelf depth, but is consistent with the behavior of coastal-trapped waves supported by the continental shelf structure. When the wind rotated in time, resonant amplification occurred at specific rotation periods, indicating constructive interference among anomalies generated at multiple coastal locations.
Additional experiments demonstrated the influence of regional topography on the magnitude and spatial extent of storm surges. The inclusion of the Goto Islands modified both the timing and magnitude of storm surges. The presence of the islands caused earlier accumulation of positive anomalies along their southern coast through wind setup under southerly winds, while Ekman transport gradually increased water mass along the western coast of Kyushu. These two anomaly sources partially overlapped and reinforced each other, shifting the resonant response toward a shorter rotation period (from 21 to 18 h) and amplifying the maximum anomaly by approximately 15 %. Thus, the Goto Islands play a key role in accelerating anomaly growth and enhancing its propagation toward the northern coast of Kyushu. Removing the Korean Peninsula increased the maximum anomaly at the Hakata Bay-equivalent location by approximately 35 %. In the absence of this topographic barrier, coastal wave energy originating in the Tsushima Strait spread farther northward into the Sea of Japan, resulting in a broader and stronger sea-level response along northern Kyushu. This behavior indicates that the Korean Peninsula acts as a physical boundary that confines coastal-trapped wave energy within the strait and suppresses the amplitude of storm surges along Kyushu. This confinement is consistent with the theoretical Rossby radius of deformation, which exceeds the width of the Tsushima Strait, suggesting that the peninsula effectively limits the meridional expansion of wave energy and regulates the geostrophic balance within the strait.
Overall, the results indicate that storm surges associated with extratropical cyclones are governed not solely by local wind setup or pressure effects, but by the interplay between temporally varying wind fields and regional geomorphological features. The resonance between wind rotation period and coastal wave response is particularly crucial for amplifying storm surges. These findings underscore the importance of considering both atmospheric temporal variability and coastal topography in forecasting systems. Specifically, monitoring the “wind rotation period” can serve as an effective pre-screening indicator for the northern coast of Kyushu. By identifying systems with rotation periods conducive to resonance (e.g., 12–21 h) a priori, it becomes possible to detect high-risk events early. This enables the selective application of detailed numerical simulations to dangerous low-pressure systems, allowing for the efficient assessment of risks associated with frequent extratropical cyclones. While similar atmospheric and topographic conditions exist in other semi-enclosed coastal regions, caution is required when applying the present interpretations elsewhere. Differences in latitude (affecting the Coriolis parameter and coastal-trapped wave width), water depth (modifying phase speed and resonant period), and coastal geometry (governing reflection and dissipation) may all influence the degree of resonance. Nevertheless, the methodologies and physical insights presented here provide a useful framework for investigating extratropical cyclone-induced storm surges globally, contributing to improved coastal management strategies.
Meteorological forcing data from the JMA Mesoscale Model (MSM) used in this study are available from the Japan Meteorological Agency (https://www.jma.go.jp, last access: 14 April 2026). Tide gauge observations at Hirado Seto and Karatsu are provided by the Ports and Harbours Bureau of the Ministry of Land, Infrastructure, Transport and Tourism (MLIT), and the tide gauge data at Hakata are provided by the Japan Coast Guard. These observational datasets are publicly accessible through the Japan Oceanographic Data Center (https://www.jodc.go.jp, last access: 14 April 2026). The numerical simulation outputs generated in this study are archived at Kyushu University and are available from the corresponding author upon reasonable request.
The supplement related to this article is available online at https://doi.org/10.5194/os-22-1237-2026-supplement.
Y.I. designed the study, performed the numerical simulations, analysed the observational and model data, and wrote the manuscript. S.O. performed numerical simulations, analysed observational and model data, and contributed to manuscript checking. M.Y. provided scientific guidance and contributed to manuscript checking.
The contact author has declared that none of the authors has any competing interests.
Publisher's note: Copernicus Publications remains neutral with regard to jurisdictional claims made in the text, published maps, institutional affiliations, or any other geographical representation in this paper. The authors bear the ultimate responsibility for providing appropriate place names. Views expressed in the text are those of the authors and do not necessarily reflect the views of the publisher.
The authors thank the Japan Meteorological Agency for providing MSM meteorological data. Tide gauge observations at Hirado Seto and Karatsu were provided by the MLIT Ports and Harbours Bureau, and the Hakata tide gauge data were provided by the Japan Coast Guard. The numerical computations were performed using the computational facilities of Kyushu University. We also thank colleagues in the Coastal and Ocean Engineering Laboratory for their helpful discussions.
This paper was edited by John M. Huthnance and reviewed by two anonymous referees.
Chen, C., Liu, H., and Beardsley, R. C.: An Unstructured Grid, Finite-Volume, Three-Dimensional, Primitive Equations Ocean Model: Application to Coastal Ocean and Estuaries, J. Atmos. Ocean. Tech., 20, 159–186, https://doi.org/10.1175/1520-0426(2003)020<0159:AUGFVT>2.0.CO;2, 2003. a
Horsburgh, K. J. and Wilson, C.: Tide–Surge Interaction and Its Role in the Distribution of Surge Residuals in the North Sea, J. Geophys. Res.-Oceans, 112, C08003, https://doi.org/10.1029/2006JC004033, 2007. a
Huthnance, J. M.: On Coastal Trapped Waves: Analysis and Numerical Calculation by Inverse Iteration, J. Phys. Oceanogr., 8, 74–92, https://doi.org/10.1175/1520-0485(1978)008<0074:OCTWAA>2.0.CO;2, 1978. a
Ide, Y., Yamashiro, M., and Hashimoto, N.: Proposal of New Indexes for Development Characteristics of Storm Surge Considering Topographical Features and Tides, Coast. Eng. J., 63, 107–125, https://doi.org/10.1080/21664250.2021.1883292, 2021. a
Ide, Y., Ozaki, S., Hiroshiro, Y., Yamashiro, M., and Kodama, M.: Study on Characteristics of Sea Level Anomalies along the Tsushima Straits, Japanese Journal of JSCE, 79, 23–17056, https://doi.org/10.2208/jscejj.23-17056, 2023 (in Japanese). a, b, c
Ide, Y., Ozaki, S., Yamashiro, M., and Kodama, M.: Development and Improvement of a Method for Determining the Worst-Case Typhoon Path for Storm Surge Deviation through Bayesian Optimization, Eng. Appl. Artif. Intell., 132, 107950, https://doi.org/10.1016/j.engappai.2024.107950, 2024a. a
Ide, Y., Yamashiro, M., Umemura, R., Ogawa, M., Shimada, T., and Takaoka, H.: Investigating Influence of Computational Parameters on Storm Surge Simulation in Ariake Sea, Japanese Journal of JSCE, 80, 24–18153, https://doi.org/10.2208/jscejj.24-18153, 2024b (in Japanese). a
ikasuminw: Typhoon Maysak storm surge in Dokai Bay, YouTube [video], https://www.youtube.com/watch?v=G4IP9eHaw8Y (last access: 4 December 2025), 2020 (in Japanese). a
Janjic, Z. I.: Nonsingular Implementation of the Mellor–Yamada Level 2.5 Scheme in the NCEP Meso Model, NCEP Office Note, 437, https://repository.library.noaa.gov/view/noaa/11409 (last access: 14 April 2026), 2001. a
Kojima, H. and Fujii, H.: Storm Surge Characteristics along the Coasts of the Suo, Genkai and Hibiki Seas, Proceedings of Civil Engineering in the Ocean, 18, 227–232, https://doi.org/10.2208/prooe.18.227, 2002 (in Japanese). a
Large, W. G. and Pond, S.: Open Ocean Momentum Flux Measurements in Moderate to Strong Winds, J. Phys. Oceanogr., 11, 324–336, https://doi.org/10.1175/1520-0485(1981)011<0324:OOMFMI>2.0.CO;2, 1981. a
Niimi, M., Ide, Y., Yamashiro, M., Hashimoto, N., and Kodama, M.: A Case Study of Storm Surge Inundation in Dokai Bay by Typhoon Maysak in 2020 and Its Generation Mechanism, Journal of Japan Society of Civil Engineers, Ser. B2 (Coastal Engineering), 78, I_217–I_222, https://doi.org/10.2208/kaigan.78.2_I_217, 2022 (in Japanese). a
NOAA: Persistent Low Pressure Systems and Wind Stress Are Causing Sea Level Rise on the East Coast, NOAA Climate Program Office, https://cpo.noaa.gov/persistent-low-pressure-systems-and-wind-stress-are-causing-sea-level-rise-on-the-east-coast/ (last access: 14 April 2026), 2023. a
Odamaki, M., Kuwakino, F., Imanishi, T., Fukushima, S., Matsushima, H., Nishida, H., Suzuki, E., Ishii, M., and Ito, K.: Records of Storm Surge and Secondary Oscillations Induced by Typhoon No. 19, 1991, Report of Hydrographic Researches, 29, 65–85, https://www1.kaiho.mlit.go.jp/kenkyu/report/article.html (last access: 14 April 2026), 1993 (in Japanese). a
Ozaki, S., Ide, Y., and Yamashiro, M.: Mechanism of delayed storm surges in straits: seiche-induced oscillations triggered by typhoon passage, Ocean Sci., 21, 2443–2461, https://doi.org/10.5194/os-21-2443-2025, 2025. a, b, c, d
Särkkä, J., Räihä, J., Rantanen, M., and Kämäräinen, M.: Simulating sea level extremes from synthetic low-pressure systems, Nat. Hazards Earth Syst. Sci., 24, 1835–1842, https://doi.org/10.5194/nhess-24-1835-2024, 2024. a
Yamashiro, M., Sonoda, A., Yurino, A., Kubo, T., Yokota, M., and Hashimoto, N.: Study on Basic Characteristics of Storm Surge in Hakata Bay, Journal of Japan Society of Civil Engineers, Ser. B3 (Ocean Engineering), 72, I_348–I_353, https://doi.org/10.2208/jscejoe.72.I_348, 2016 (in Japanese). a, b