the Creative Commons Attribution 4.0 License.
the Creative Commons Attribution 4.0 License.
 | 14 Apr 2026
Year-round characterization of upwelling along the Uruguayan coast using a high-resolution regional ocean model
Camila de Mello
Marcelo Barreiro
Madeleine Renom
Upwelling along the Uruguayan coast has largely been interpreted as a summertime process, primarily based on surface temperature signals. Here, we investigate coastal upwelling year-round using a high-resolution regional ocean model (Coastal and Regional Ocean Community, CROCO), with the aim of reassessing how upwelling manifests across seasons under contrasting thermohaline conditions. The seasonal covariability between daily winds and sea surface salinity anomalies was analyzed through a Maximum Covariance Analysis, revealing upwelling signatures during spring, autumn, and summer, marked by positive sea surface salinity anomalies (SSSa) along the Uruguayan coast. Summer upwelling events were characterized by positive SSSa and negative sea surface temperature anomalies (SSTa), indicating that both are reliable upwelling proxies during this season. In contrast, during spring and autumn, SSSa resulted in a better proxy. In this regard, upwellings were clearly marked by increases in SSSa, but the SSTa pattern in the coast was variable due to distinct vertical temperature stratification patterns. Based on the thermal properties of the upwelled waters, three upwelling regimes can be identified: cold-water upwellings associated with warm-season stratified conditions, transitional upwellings occurring under weak or absent thermal stratification, and warm-water upwellings linked to cold-season conditions, characterized by inverse thermal stratification. Overall, our results highlight that upwelling events along the Uruguayan coast cannot be described by a single thermal signature, but rather by seasonally dependent thermohaline regimes.
- Article
(3818 KB) - Full-text XML
- BibTeX
- EndNote


Major coastal upwelling systems, which are typically identified by negative sea surface temperature anomalies, are known to be key oceanographic processes that influence the physical, chemical, and biological structure of coastal ecosystems (Wang et al., 2015; Aguiar et al., 2014; Cao et al., 2014). Owing to the upward transport of nutrient-rich subsurface waters into the euphotic layer, these systems sustain some of the most productive marine ecosystems on Earth and a substantial fraction of global fisheries (Pauly and Christensen, 1995; Carr, 2001; Chavez and Messié, 2009). Upwelling-related frontal regions may enhance nutrient retention in bays, promote phytoplankton blooms, and favor the accumulation of early life stages, with potential consequences for higher trophic levels (Pitcher et al., 2010; Largier, 2020; de Mello et al., 2022b). In addition, circulation patterns associated with upwelling can influence the offshore transport of suspended material and organisms (de Mello et al., 2023).
Wind-driven upwelling also occur at small spatial scales outside major upwelling regions, although their characteristics and variability are generally less well documented (Belem et al., 2013; Aguiar et al., 2014; Trinchin et al., 2019; de Mello et al., 2022a). One such region is the Uruguayan coastal and estuarine zone, which is part of a highly dynamic system characterized by strong spatial and temporal variability driven by atmospheric forcing and variable Río de la Plata freshwater discharge (Guerrero and Piola, 1997; Nagy et al., 2002; Piola et al., 2005; Acha et al., 2008; Ortega and Martínez, 2007; Martínez and Ortega, 2015). Within this system, upwelling processes have the potential to modulate coastal circulation and surface hydrographic properties (Simionato et al., 2010; Meccia et al., 2013; Trinchin et al., 2019; de Mello et al., 2022a).
Most of the current understanding of upwelling along the Uruguayan coast has been derived from satellite observations and numerical modeling studies, motivated in part by the limited availability of continuous in situ data with adequate spatial coverage. These studies have documented the spatial structure, temporal variability, and three-dimensional characteristics of wind-induced upwelling during summer, when alongshore winds are more frequent and thermal stratification tends to enhance the surface expression of upwelling (Simionato et al., 2010; Meccia et al., 2013; Trinchin et al., 2019; de Mello et al., 2022a, b, 2023).
As a result, the occurrence of upwelling during the rest of the year, as well as its hydrographic characteristics and associated processes, remain largely unexplored. Although easterly winds are more frequent and persistent during summer, upwelling-favorable winds also occur throughout the year (Simionato et al., 2005). While the underlying mechanism is expected to be similar, the properties of the upwelled waters and their surface expression are likely to differ across seasons due to changes in surface heat fluxes and vertical thermal structure.
During summer, atmospheric heat fluxes warm surface waters, enhancing vertical temperature stratification. In estuarine shallow systems, however, surface heat fluxes may result in weak or even inverse temperature stratification during transitional months and winter, with warmer but saltier waters near the bottom (Knauss, 1997; Geyer, 2010). Thermal inversions of this type have been documented in estuaries for other regions (Mahardja et al., 2022). In the Río de la Plata estuary, observational evidence remains limited. However, two hydrographic transects conducted in autumn and spring, respectively, showed the presence of warmer and saltier waters near the bottom (Martínez and Ortega, 2015). Similar patterns are suggested for the cold period in regional hydrographic atlases based on observations compiled by Guerrero et al. (2003, 2010); and by Baldoni et al. (2015). Additionally, wintertime thermal inversions associated with freshwater discharge have been documented over the southern Brazilian inner shelf (∼30–35° S), in coastal waters influenced by the Río de la Plata plume and the Patos–Mirim lagoon outflow (Castello and Möller, 1977; Zavialov et al., 2003). Consequently, upwelling occurring outside of summer may exhibit different SST characteristics depending on the timing of the event, complicating their identification through the SST distribution.
In this context, Sea Surface Salinity (SSS) distribution could serve as an alternative proxy to SST for identifying upwelling along the Uruguayan coast throughout the year, as the water column is expected to remain on average vertically stratified with saltier water closer to the bottom, as this is a salt wedge estuary (Guerrero et al., 1997). Therefore, during upwelling the surface water would likely show positive SSS anomalies regardless of the time of year. In this regard, increased surface salinity in the Uruguayan coast (particularly between Montevideo and Punta del Este) under upwelling-favorable wind conditions has been reported in numerical simulations (Meccia et al., 2013; de Mello et al., 2022a).
Although localized in situ observations of temperature and salinity vertical structure exist from specific oceanographic campaigns (e.g., Pimenta et al., 2008; Burone et al., 2013; Martínez and Ortega, 2015; BaRDO INIDEP database, 2025), a comprehensive characterization of the mean water column properties along the Uruguayan coast is still lacking. This limitation highlights the importance of numerical simulations for understanding regional ocean conditions and particularly the vertical structure and surface salinity response associated with upwelling events.
To enhance our understanding of upwelling along the Uruguayan coast, the objectives of this study were to identify and characterize upwelling events occurring throughout the year using a high-resolution regional ocean model (CROCO), previously applied to investigate summer upwelling dynamics in the region (de Mello et al., 2023). Given the expected seasonal changes in the vertical thermal profiles near the coast, SST might not be a reliable proxy for identifying wind-induced upwelling events outside summer. Therefore, this study evaluates the use of SSS anomalies in conjunction with surface winds to detect upwellings across seasons.
This article is organized as follows. Section 2 describes the methods, including the model setup, the datasets used for comparison with simulated variables, and the statistical approach applied to identify upwelling events. Section 3 presents the simulated fields and evaluates the model's ability to reproduce the mean and interannual variability of surface coastal properties through comparisons with reanalyses, in situ observations, and published studies. Section 4 focuses on the analysis of upwelling events, including the analysis of the average distribution of SST and SSS anomalies during upwelling, and the examination of selected spring and autumn events with their vertical structure. Finally, Sect. 5 summarizes the main findings and provides concluding remarks.
2.1 Model setup
The model used in this study is the Coastal and Regional Ocean Community Model CROCO, https://www.croco-ocean.org/, last access: 20 September 2025). It is designed for simulating high-resolution offshore and nearshore dynamics in regional domain configurations (Shchepetkin and McWilliams, 2005; Debreu et al., 2012). CROCO is a split-explicit free surface, and σ terrain-following vertical coordinate oceanic model configured with a horizontal resolution of 1/36° (about 2.5 km in the region of interest) and 40σ vertical layers. The model bathymetry is derived from the 1 min Gridded Global Relief Data (ETOPO1) topography (Amante and Eakins, 2009), interpolated to the model grid, and modified to reduce horizontal pressure gradient errors. A maximum slope parameter of r=0.1 () was imposed following Haney (1991). A minimum depth of 5 m was imposed to ensure numerical stability and avoid the occurrence of dry grid cells in shallow coastal regions. The simulated domain considers the area defined by 31–36° S and 50–59° W, which includes the Uruguayan coast (Fig. 1). Open boundaries are located along the eastern, western and southern sides of the domain. All lateral boundary conditions (sea surface height, velocities, temperature, and salinity) were obtained from the GLORYS reanalysis (Lellouche et al., 2018) at 1/12° of horizontal resolution for the period 1993–2020. A Flather-type condition was applied to the barotropic velocities, while radiation-type conditions were used for baroclinic velocities and tracers, together with sponge layers near the open boundaries. This configuration follows the implementation described and validated in de Mello et al. (2022a, 2023).
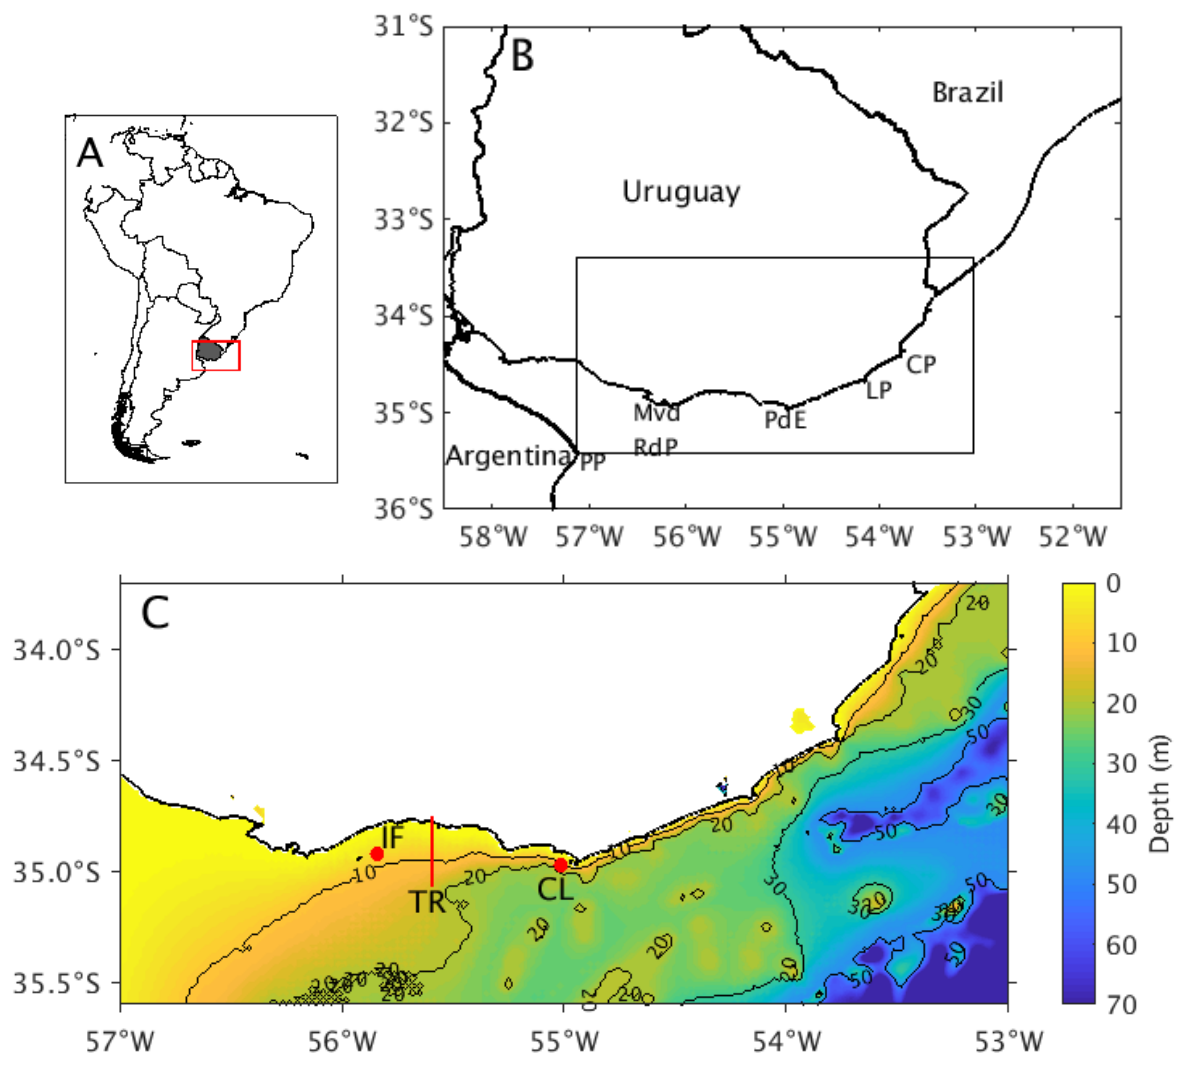
Figure 1(a) Geographical context of the study area, showing Uruguay within South America; the red rectangle indicates the region displayed in panel (b). (b) Model setup area along the Uruguayan shelf. The inner rectangle indicates the subdomain used for the analysis and identification of upwelling events. Mvd: Montevideo; PdE: Punta del Este; LP: La Paloma; CP: Cabo Polonio; PP: Punta Piedras; RdP: Río de la Plata. (c) ETOPO1 bathymetry (color scale in meters). Black contours indicate selected isobaths. IF marks Isla de Flores (location used for model – observation comparison of SST and SSS); CL indicates the coastal location used to extract vertically averaged seasonal profiles; TR denotes the transect used to analyze the vertical structure of simulated upwelling.
Interannual daily Río de la Plata freshwater discharge was provided by the Instituto Nacional del Agua in Argentina (J. Borús, unpublished data), and introduced in the model divided into 2 source points at the Río de la Plata's head (at the confluence of the Paraná and Uruguay River) in order to better distribute the freshwater input. Daily wind stress from NCEP-DOE Reanalysis 2, for the period 1993–2020 (Kanamitsu et al., 2002), as well as monthly mean heat and freshwater (precipitation minus evaporation) fluxes derived from the Comprehensive Ocean Atmosphere Data Set (COADS, da Silva et al., 1994) were applied together with restoring terms toward observed sea surface temperature and salinity climatologies. This approach allows maintaining realistic hydrographic conditions while preventing long-term model drift and ensuring a stable representation of surface buoyancy forcing, without affecting the wind-driven nature of coastal upwelling.
Tidal forcing was incorporated using harmonic constituents derived from the TPXO7 global tidal model (Egbert and Erofeeva, 2002). The amplitudes and phases of the main tidal constituents were included directly in the CROCO forcing file, following the standard CROCO tidal forcing framework. These constituents are applied dynamically at the open boundaries using Flather-type conditions for barotropic velocities, allowing realistic tidal propagation into the model domain. This configuration follows the implementation described and validated in de Mello et al. (2023). Mean and instantaneous fields: temperature, salinity, velocities and heat fluxes (representing the net exchange of heat between the ocean and the atmosphere) for the period 2005–2020 were saved every day and analyzed in the present manuscript.
2.2 Datasets used for model validation
In order to evaluate the model's ability to reproduce the conditions in the Uruguayan estuarine and oceanic region, the simulated variables were compared with data coming from reanalysis, observational and published articles. The simulated mean and daily variability of SST, SSS and surface currents were compared with the GLORYS reanalysis (which was used as lateral boundary condition). In this sense, ocean reanalysis products, such as GLORYS, provide dynamically consistent fields of temperature, salinity, and circulation, making them suitable references for evaluating regional ocean model simulations across multiple hydrographic variables.
Daily SSS and SST simulated variability for the period 2018–2020; were also compared to in situ observations obtained from an instrumented coastal monitoring station located at Isla de Flores (IF, marked in Fig. 1c; 55.9 °W–34.9 °S), which provides continuous near-surface measurements of temperature and salinity (Trinchin et al., 2021; Brum, 2024). In addition, vertical simulated temperature and salinity distributions were compared with measured data from one Argentine research campaign conducted aboard the Dr. Eduardo Holmberg vessel in June 2006 (BaRDO INIDEP database, 2025). Conductivity–temperature–depth (CTD) profiles were collected in the Uruguayan coastal and adjacent oceanic regions. Those data are freely available in the BARDO web page.
2.3 Statistical identification and analysis of upwelling events
To identify intense upwelling dates, a Maximum Covariance Analysis (MCA, Wallace et al., 1992) between the daily mean simulated SSS anomalies (SSSa) and the zonal component of daily surface zonal wind anomalies for the period 2005–2020 was applied for each season: December–January–February (DJF), March–April–May (MAM), June–July–August (JJA) and September–October–November (SON). This statistical technique finds patterns in two space-time data sets that explain the maximum fraction of the covariance between them and provides insight into the physical processes that lead to the spatial and temporal variations exhibited in the fields being analyzed; and has been shown to be suitable for detecting intense upwelling events in previous studies (with SSTa instead of SSSa; de Mello et al., 2022a, b, 2023). Daily SSSa were computed as the difference between the simulated value and the simulated daily climatology. The daily climatology was smoothed considering a 5 d moving average. Anomalies were also detrended previous to the analysis. Intense upwelling dates were considered as those when the time series of simulated SSSa exceeded +1.5 SD (standard deviations) for each analyzed season in which upwelling pattern was observed.
The mean characteristics of upwelling events were analyzed for each season. In addition, particular events were selected and analyzed for transitional seasons.
The simulation shows a circulation dominated by currents that run parallel to the coast, which are stronger in CROCO compared to GLORYS, possibly due to the higher resolution as was also seen in de Mello et al. (2022a, 2023). The simulated mean sea surface temperature resulted concordant with the literature (Guerrero et al., 1997; Guerrero et al., 2003; Möller et al., 2008; Simionato et al., 2010; Guerrero et al., 2010; Rabellino, 2016). Nevertheless, compared to GLORYS, the model has a cold bias located mainly in the oceanic and offshore area, as observed in de Mello et al. (2022a) for the summer period. A marked east-west Sea Surface Salinity (SSS) gradient along the estuary axis is observed in the surface and reproduced by the model (Piola et al., 2000, 2008, Möller et al., 2008; Guerrero et al., 1997, 2010). The simulation outputs were similar to those obtained by de Mello et al. (2022a, 2023), which used a similar configuration but for a shorter period. Overall, the model realistically reproduces the main observed hydrographic features of the region (Fig. 2a–d). A more detailed description and validation of the model outputs (explicitly for the summer period) can be found in de Mello et al. (2022a).
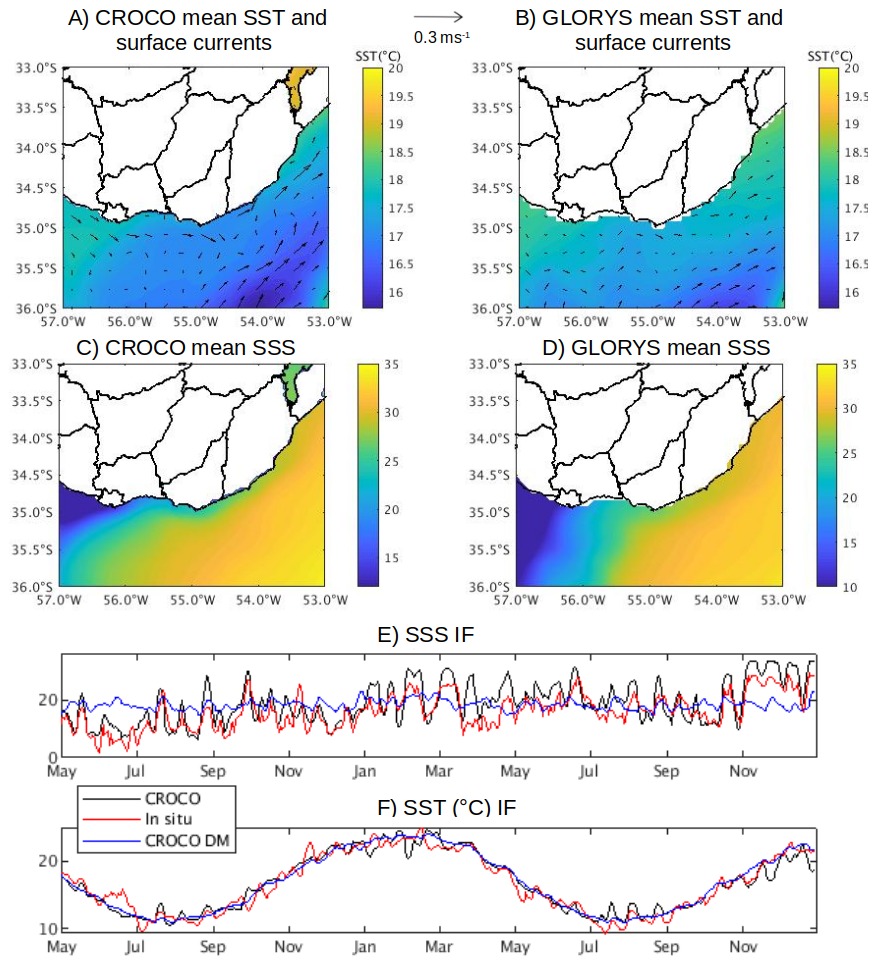
Figure 2Mean SST (°C) and velocity vectors, and mean SSS simulated by CROCO (a, c) and by GLORYS reanalysis (b, d). Evolution of daily SST (e) and SSS (f) for the period May 2019–December 2020 simulated by CROCO (black line), and measured in situ (red line) at Isla de Flores Location. The CROCO daily mean (DM) is shown in blue line for both plots.
At the Isla de Flores location (55.9° W, 34.9° S), the model simulates the daily mean and variability of both SST and SSS. The simulated climatological SST and SSS closely match observed climatological values (Brum, 2024; Trinchin et al., 2021; Trinchin et al., 2024). The highest simulated climatological temperature occurs in February (23.7 °C), while July is the month with the lowest average simulated temperature (11.3 °C), consistent with in situ observations. Similarly, the simulated salinity values fall within the range of observed values for Isla de Flores, with the highest monthly average salinity occurring in December (22.0) and the lowest in July (11.4), consistent with observations. However, the minimum average simulated salinity is slightly lower than the climatological measurements. It is important to note that the in situ data we compared against is from a five-year series (2018 to 2023), during which the region experienced a drought between 2020 and 2022 (D'Agosto and Barreiro, 2026), leading to extremely low freshwater discharges from the Río de la Plata and consequently affecting coastal salinity. Therefore, some differences between the simulated and observed climatological values were expected.
A comparison between CROCO and GLORYS reanalysis data at the Isla de Flores location shows a significant daily correlation for SST and SSS during the period 2005–2020, with correlation coefficients of 0.97 and 0.62, respectively (not shown). A comparison between CROCO and in situ measured SST and SSS at Isla de Flores for the period May 2019 to December 2020 is presented in Fig. 2e and f. Both correlations are significant, with r=0.96 for SST and r=0.83 for SSS.
Vertical simulated profiles align well with GLORYS Reanalysis profiles (not shown) and are consistent with the patterns observed in climatological atlases based on in situ measurements showing warmer and fresher waters at surface along the Uruguayan coast during the warm season, and colder (yet still fresher) waters at surface along the coast during the cold season (Guerrero et al., 2003, 2010; Baldoni et al., 2015). In the Coastal Location (CL, Fig. 1c) climatological simulated salinity profiles consistently show an average stratified pattern throughout the year, with fresher waters near the surface. Temperature profiles, however, reveal marked seasonal differences. During summer, the model indicates average vertical stratification, consistent with heat influx warming the surface waters. As autumn progresses, surface waters begin losing heat to the atmosphere, reducing both temperature and thermal stratification, leading to a weak average inverse vertical pattern, and a pronounced average inverse thermal stratification in winter. Finally, as spring advances, surface waters warm again, reducing the inverse thermal stratification and resulting in an almost mean unstratified pattern for the spring trimester (Fig. 3).
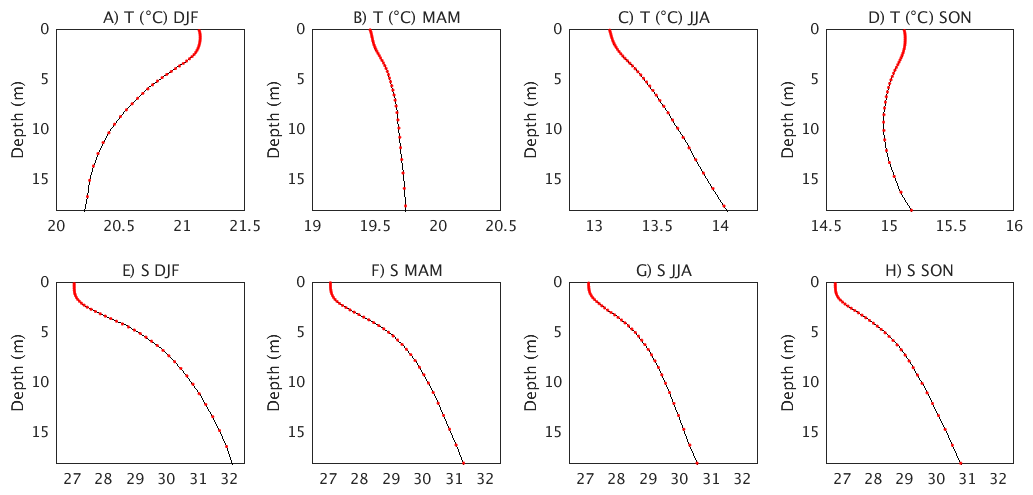
Figure 3Simulated seasonal average vertical profiles of temperature (a–d) and salinity (e–h) at the coastal location (35.1° S, 55° W). Different scales were used for temperature profiles.
The limited availability of in situ data prevents the development of a reliable climatology for direct comparison with our simulations, emphasizing the importance of numerical modeling for understanding coastal dynamics. Despite the lack of continuous observational data to construct climatological profiles, a consistent pattern with the simulations was observed during the Argentine research campaign conducted aboard the Dr. Eduardo Holmberg vessel in June 2006 (BaRDO INIDEP database, 2025), These allowed a comparison between the average vertical profiles from stations located in the estuarine and oceanic regions; and the average profiles simulated by CROCO for the same locations and period. The observed and simulated profiles were found to be consistent with the winter climatological simulated profile, showing warmer and saltier waters at depth for both regions (Fig. 4). Some differences between observed and simulated gradients were expected due to spatial mismatches between station locations and model grid cells, as well as temporal variability not resolved by daily model averages.
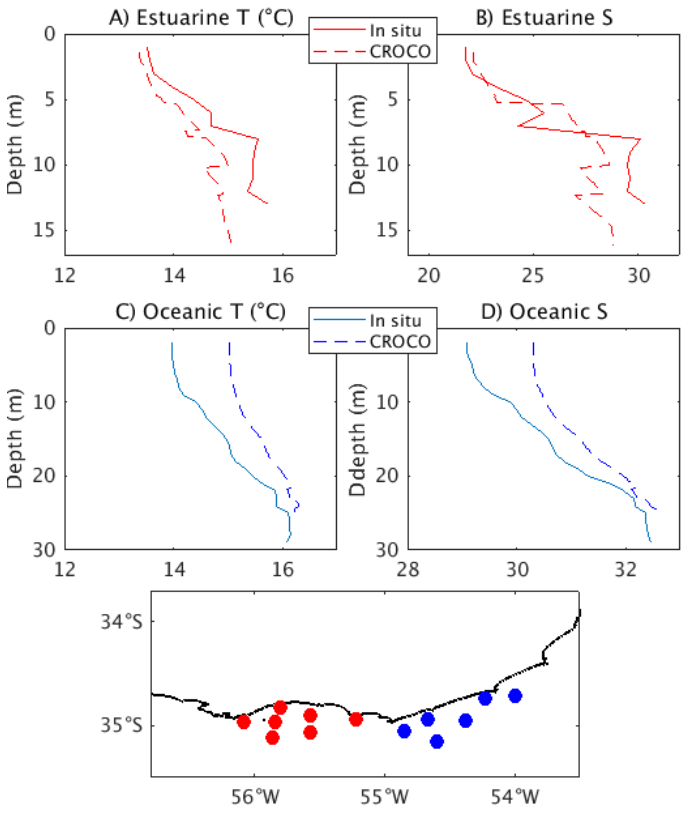
Figure 4Mean vertical profiles of temperature and salinity simulated by the model (dashed lines) and observed (solid lines) during June 2006. Profiles correspond to stations located in the estuarine region (a, b, red dots in the inset map) and in the oceanic region (b, c, blue dots in the inset map).
4.1 Identification of upwelling dates and average properties
The MCA applied revealed coastal upwelling for summer (DJF), autumn (MAM) and spring (SON). The leading mode explained 87 %, 79 % and 77 % of the variance, respectively, and showed maximum coastal amplitude from Montevideo to La Paloma (for DJF and MAM) and from Montevideo to Punta del Este for SON. Using this approach, we did not find a clear upwelling pattern during winter (Fig. 5). This may reflect a weaker and less coherent surface salinity response in winter, when the mean vertical stratification could be reduced and mostly controlled by salinity, potentially leading to smaller SSS anomalies during upwelling. In addition, fewer or less persistent upwelling-favourable wind events in winter could further reduce the robustness of the MCA signal.
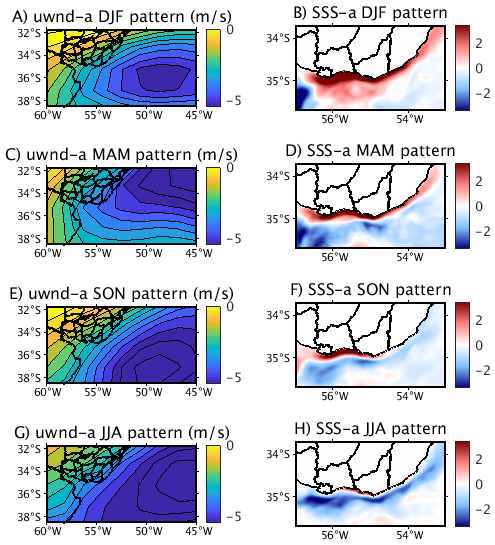
Figure 5SVD leading mode for each season. The left panel (a, c, e, g) represent the u-wind anomalies pattern while the right panel (b, d, f, h) represent the Sea Surface Salinity anomalies pattern for each analyzed season (summer, autumn, spring and winter, respectively).
As mentioned in Sect. 2.3, intense upwelling dates were considered as those when the time series of simulated SSSa from the leading mode of the MCA (Fig. 5b, d, and f) exceeded +1.5 SD (standard deviations) for each analyzed season During summer, events lasting up to 10 d were observed, while in spring and autumn, they were shorter (Fig. 6). This finding is consistent with the stronger influence and persistence of easterly winds driving upwelling during summer (Simionato et al., 2005). It is important to note that the rather restrictive definition used when selecting intense upwelling events may have excluded the initial dates of some events where anomalies were smaller. As a result, the actual duration of many events might be slightly longer than identified.
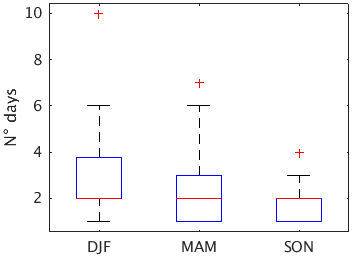
Figure 6Distribution of intense upwelling events duration for each season. The red line inside each box indicates the median, the box spans the interquartile range (difference between the 75th and 25th percentiles), whiskers extend to 1.5 times the interquartile range, and crosses denote outliers.
Composites of simulated SSSa and SSTa for the identified upwelling dates, along with composites of observed SSTa (obtained from the Group of High Resolution Sea Surface Temperature, MUR-GHRSST; Chin et al., 2017) during the same dates were constructed to assess the model's accuracy in representing real patterns during the simulated upwelling events (Fig. 7). The SSSa distribution during upwelling dates revealed a pattern similar to the first SVD mode for each season, with saltier waters near the coast, consistent with deeper saltier waters surfacing during upwelling. On average, during summer upwelling dates, anomalously saltier waters extended farther offshore compared to spring and autumn dates, reaching up to 60 km offshore during summer, 35 km during autumn, and 12 km during spring off the coast of Montevideo.
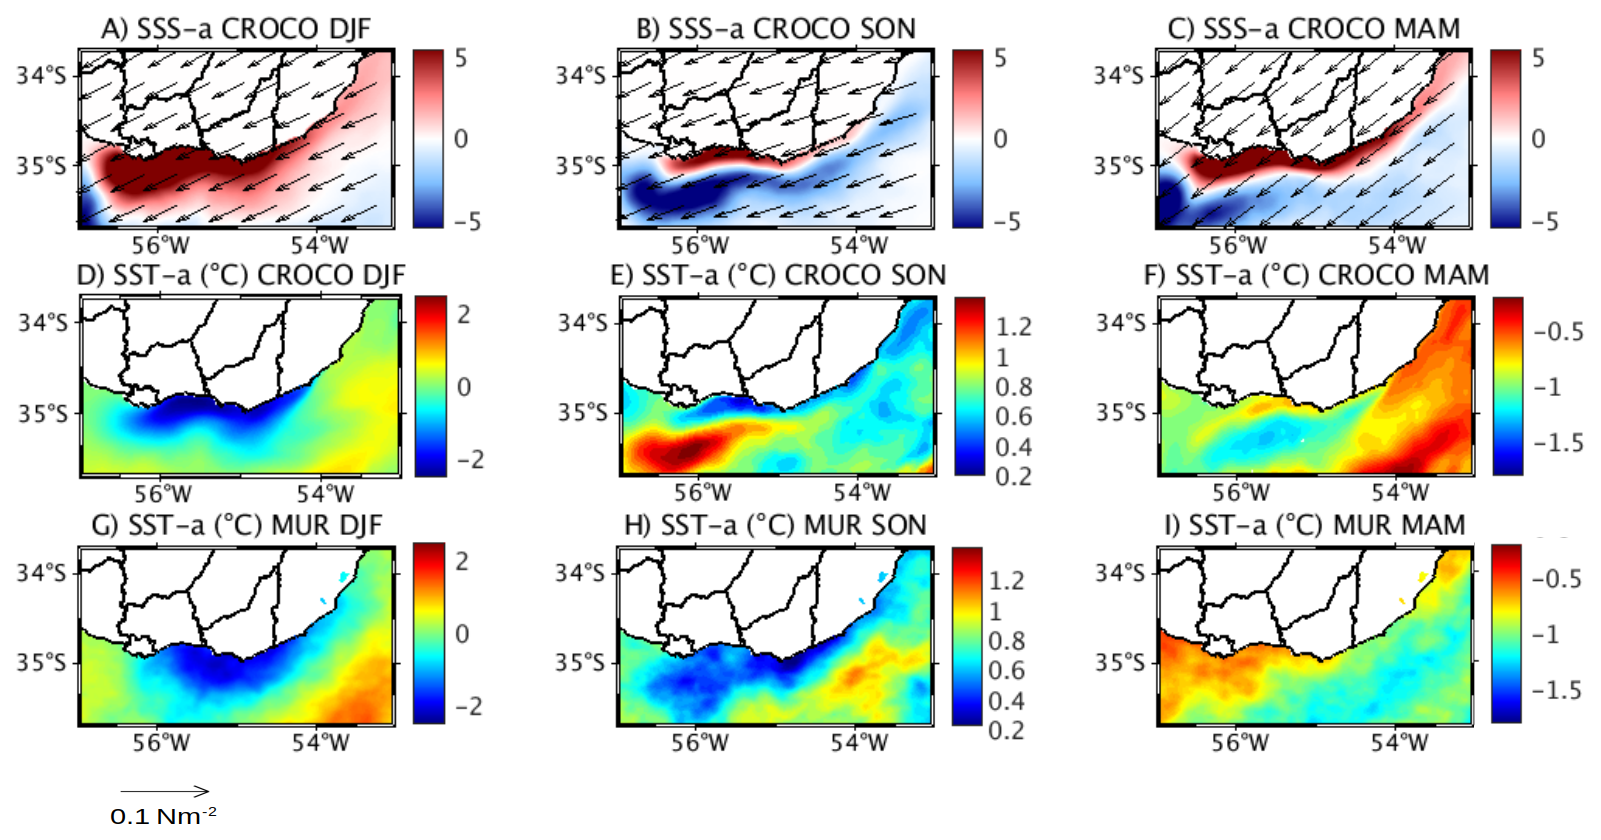
Figure 7Composites of simulated SSSa (a–c), SSTa (d–f) and observed SSTa (g–i) during upwelling dates. Note in SSTa different color scales are shown between seasons in order to enhance the visibility of the spatial structure of the upwelling signal. Composites of wind stress anomalies (Nm−2) are shown.
The simulated and observed SSTa composites patterns were consistent (Fig. 7d–i), though some differences were expected due to model biases, as discussed in Sect. 3 and in de Mello et al. (2022a, b, 2023). Seasonal variations in SST anomaly patterns were evident. During summer, an inverse relationship between SSTa and SSSa was observed, with colder, saltier water surfacing during upwelling events (Fig. 7a–d), a pattern also identified by de Mello et al. (2022a, 2023). As shown in Fig. 3, summer typically features both thermal and salinity vertical stratification, indicating that upwelled water would be colder and saltier, making upwelling events distinguishable through both salinity and temperature surface anomalies.
Both intermediate seasons, autumn and spring, exhibited different average SSTa distribution patterns during upwelling events. In autumn, SSTa were negative along the coast, with less intense anomalies nearshore compared to offshore. In contrast, during spring, SSTa were positive along the coast, with warm anomalies nearshore but less intense than those offshore (Fig. 7e and f). It is noteworthy that on average during both seasons, the coastal region shows vertical salinity stratification but lacks significant thermal stratification (Fig. 3). As autumn progresses, surface temperatures decrease, leading to reduced thermal stratification until winter, when an inverse stratification pattern emerges. Conversely in spring, surface waters warm, gradually increasing thermal stratification. Consequently, the timing of upwelling events in these seasons probably leads to different surface thermal patterns. The apparent contrast with the seasonal mean vertical structure shown in Fig. 3 reflects the fact that the composites integrate events occurring under different stratification regimes, including both cold-water and warm-water upwelling events, as demonstrated by the analysis of individual cases presented in the following section.
4.2 Specific upwelling events during transitional seasons
Six upwelling events are analyzed in this section; they were selected from the set of intense upwelling events identified in Sect. 4.2, based on the SSS anomaly threshold derived from the MCA analysis. Representative cases were chosen to illustrate the different thermal responses associated with upwelling during the transitional seasons. Across the analyzed cases, positive SSSa were simulated, accompanied by varying surface thermal and heat flux patterns. Additionally, positive vertical velocity anomalies were consistently found near the coast in all the analyzed cases, indicating upwelling. When analyzing the specific events, we observed that the closer the event occurred to the summer, the more it resembled the typical summer upwelling pattern (with saltier and colder water reaching the surface). This reflects that the surface temperature response during upwelling is primarily controlled by the thermal structure of waters present in the coastal region at the time of the event, rather than by the seasonal mean vertical temperature structure. As a result, upwelling during the transition seasons involved both, colder and warmer subsurface waters reaching the surface, depending on the event (Figs. 8–12).
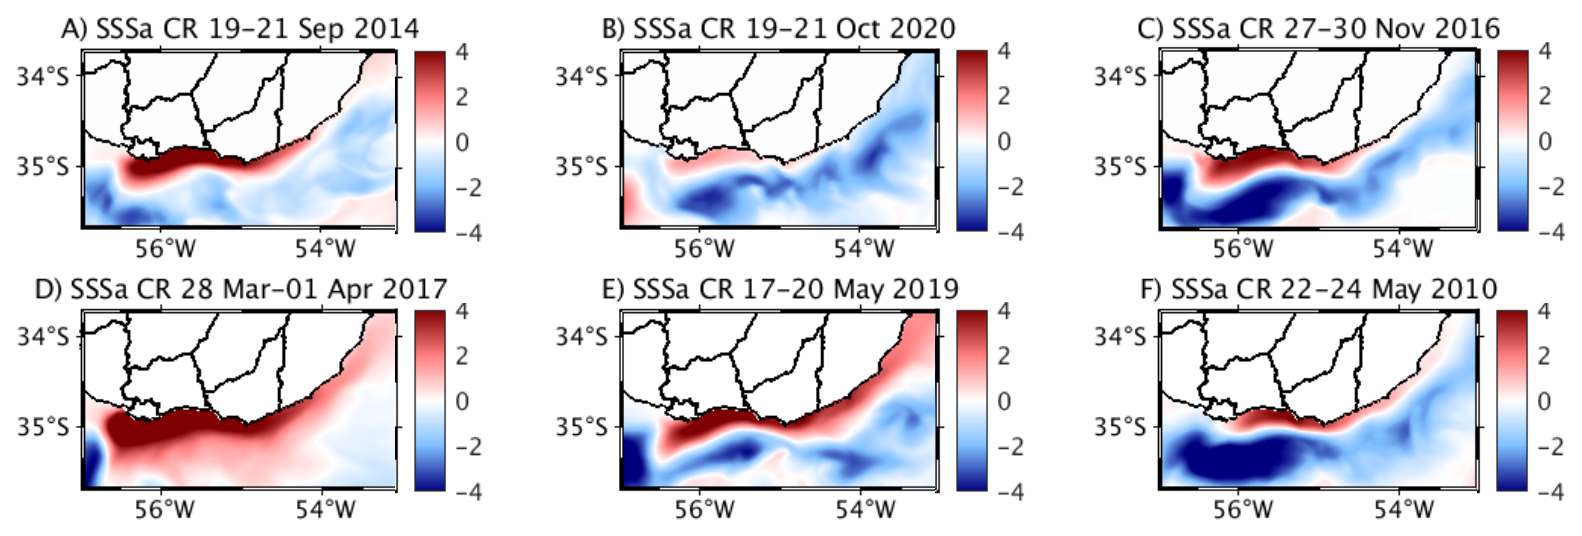
Figure 8Average simulated Sea Surface Salinity anomalies (SSSa) distribution during selected upwelling events.
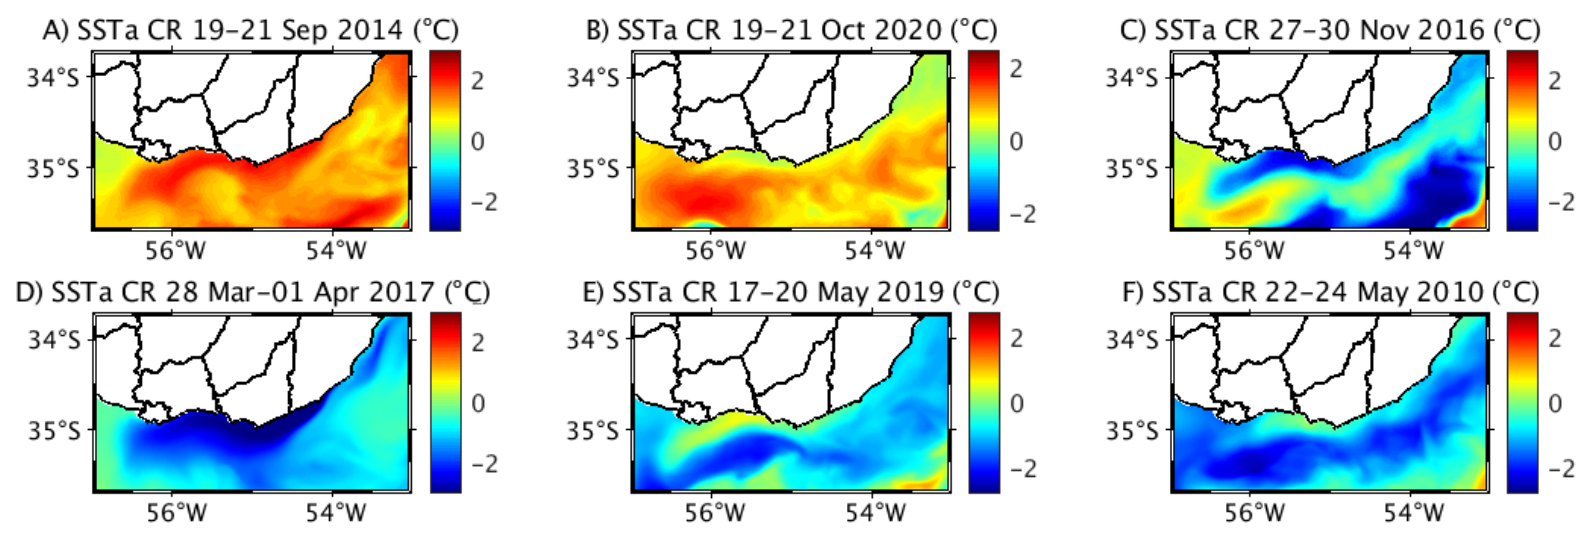
Figure 9Average simulated Sea Surface Temperature anomalies distribution during selected upwelling events. Note in SSTa different color scales are shown between seasons in order to enhance the visibility of the spatial structure associated to the upwelling signal.
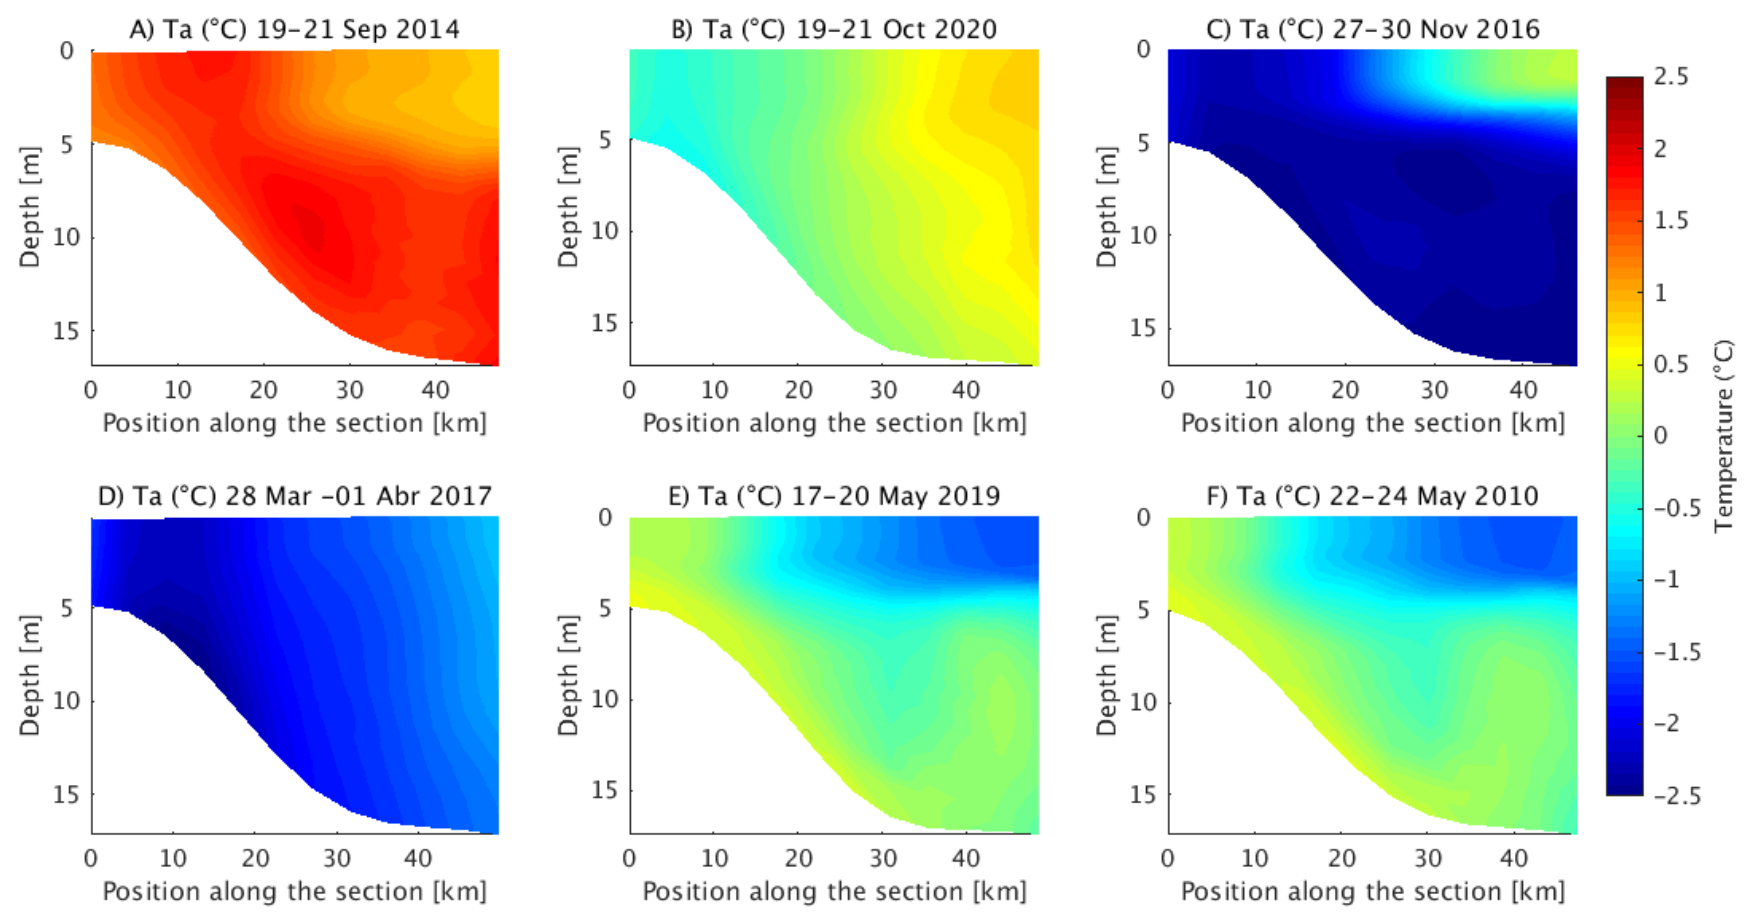
Figure 10Vertical temperature anomalies (Ta) profiles for spring (a–c) and autumn upwelling events (d–f).
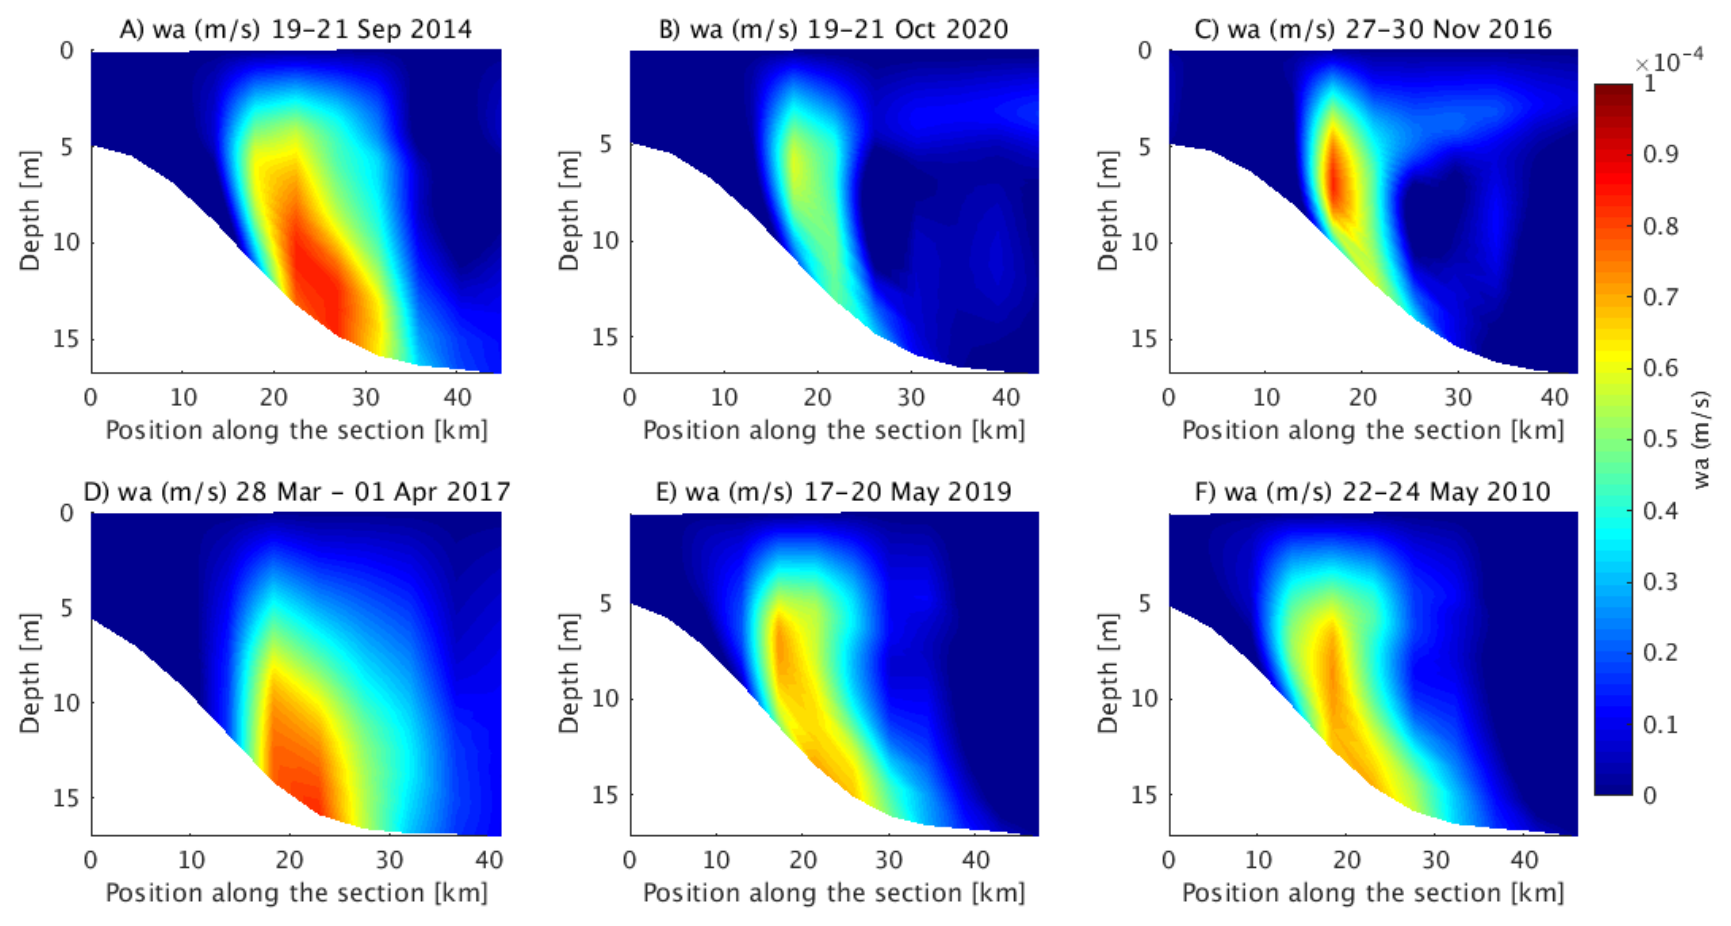
Figure 11Vertical velocity anomalies (wa) profiles for spring upwelling (a–c) and autumn upwelling events (d–f).
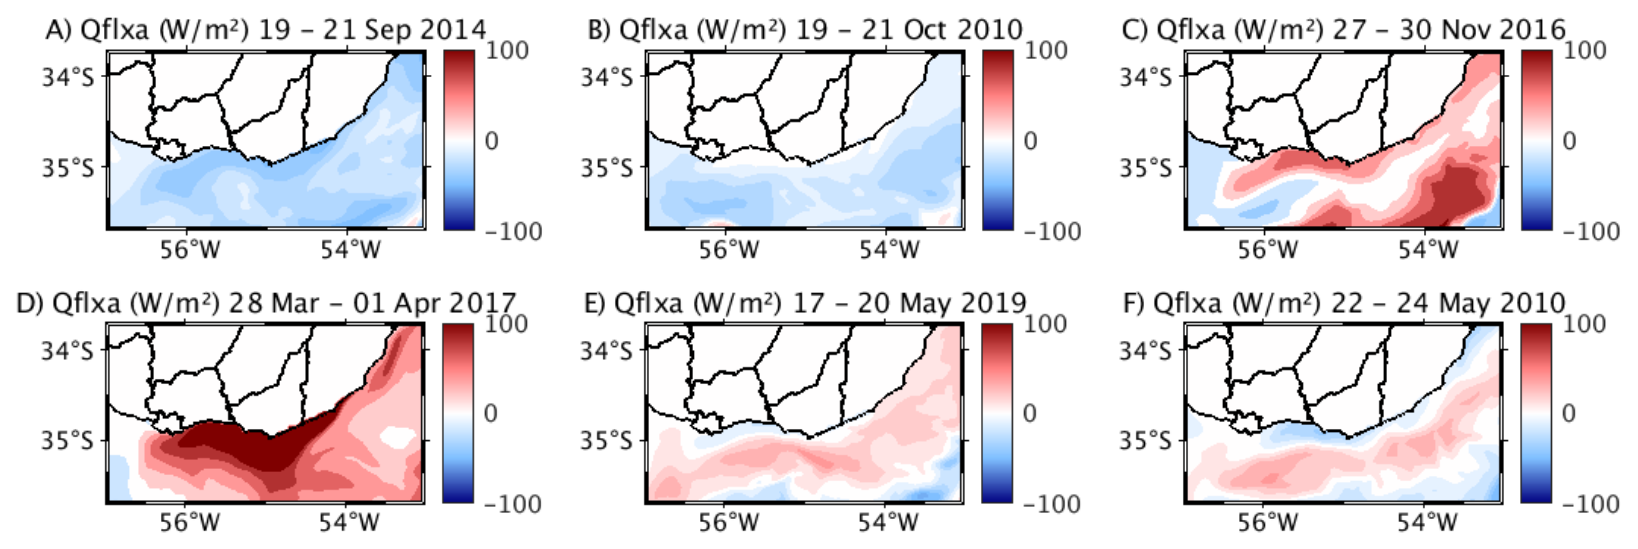
Figure 12Simulated net heat flux anomalies distribution during selected upwelling events (positive values represents a gain of heat into the ocean).
During spring, one event for each month was analyzed: September (19–21 September 2014), October (19–21 October 2020), and November (27–30 November 2016). The September event exhibited positive SSSa and SSTa near the coast, together with also positive SSTa offshore but less intense. In concordance with the surface pattern, the vertical section shows anomalously warm water not vertically stratified close to the coast (indicating upwelling) and warmer subsurface water reaching the surface during the upwelling (Figs. 9a and 10a). There is also simulated heat loss to the atmosphere, maximum in the upwelling region, also concordant with warm water upwelling (Fig. 12a). During the October event, close to zero SSTa were observed in the coastal region together with positive SSTa offshore (Figs. 9b and 10b). Contrary to the September event, during October in the upwelled water region there is no heat loss to the atmosphere (Fig. 12b). Finally, the November event displayed a similar pattern to the summer upwelling events described in detail by de Mello et al. (2022a), characterized by saltier and colder water reaching the surface and a gain of heat from the atmosphere buffering the cold water upwelling (Figs. 9c, 10c and 12c).
During autumn, two events were selected in May (17–20 May 2019 and 22–24 May 2010), along with another event occurring between March and April (28 March–1 April 2017). The March–April event exhibited a similar pattern to the November upwelling event, resembling summer upwellings (Figs. 9f, 10f and 12f). Unlike the spring events (but consistent with the composites of upwelling for each season), the selected May cases showed close to zero and positive SSTa in the upwelling region together with negative SSTa offshore (Fig. 9e and f). In concordance with the surface patterns, during both events the vertical sections show slightly anomalously warm water not vertically stratified close to the coast (indicating upwelling) (Fig. 10e and f). Finally, the heat flux simulated was consistent with warmer water reaching the surface during autumn, with a loss of heat in the upwelling region; and a gain of heat from the atmosphere to the anomalously cold water offshore, where the negative SSTa simulated could possibly be related to advection processes (Fig. 12e and f).
To conclude, our analysis focused on the 17–20 May 2019 event, as it is the only event with in situ data available for comparison from the Isla de Flores monitoring station (Trinchin et al., 2024). Both measured and simulated data showed an increase in salinity and temperature during the event. Specifically, in situ salinity increased from around 8 before the event to over 18 during the upwelling, then dropped back to close to 8. Similarly, in situ temperature rose from 16.5 °C before the event to 18 °C during the upwelling, before falling back to around 16 °C (Fig. 13a). The model is able to capture the behavior of the two variables both in timing and amplitude, giving credibility to the results presented above. This underscores the value of in situ measurements for detecting upwellings and for validating the model's performance in simulating real processes. The zonal wind evolution was consistent with upwelling-favorable conditions and exhibited a slight temporal lag relative to the surface hydrographic response, in agreement with previous studies (de Mello et al., 2022a).
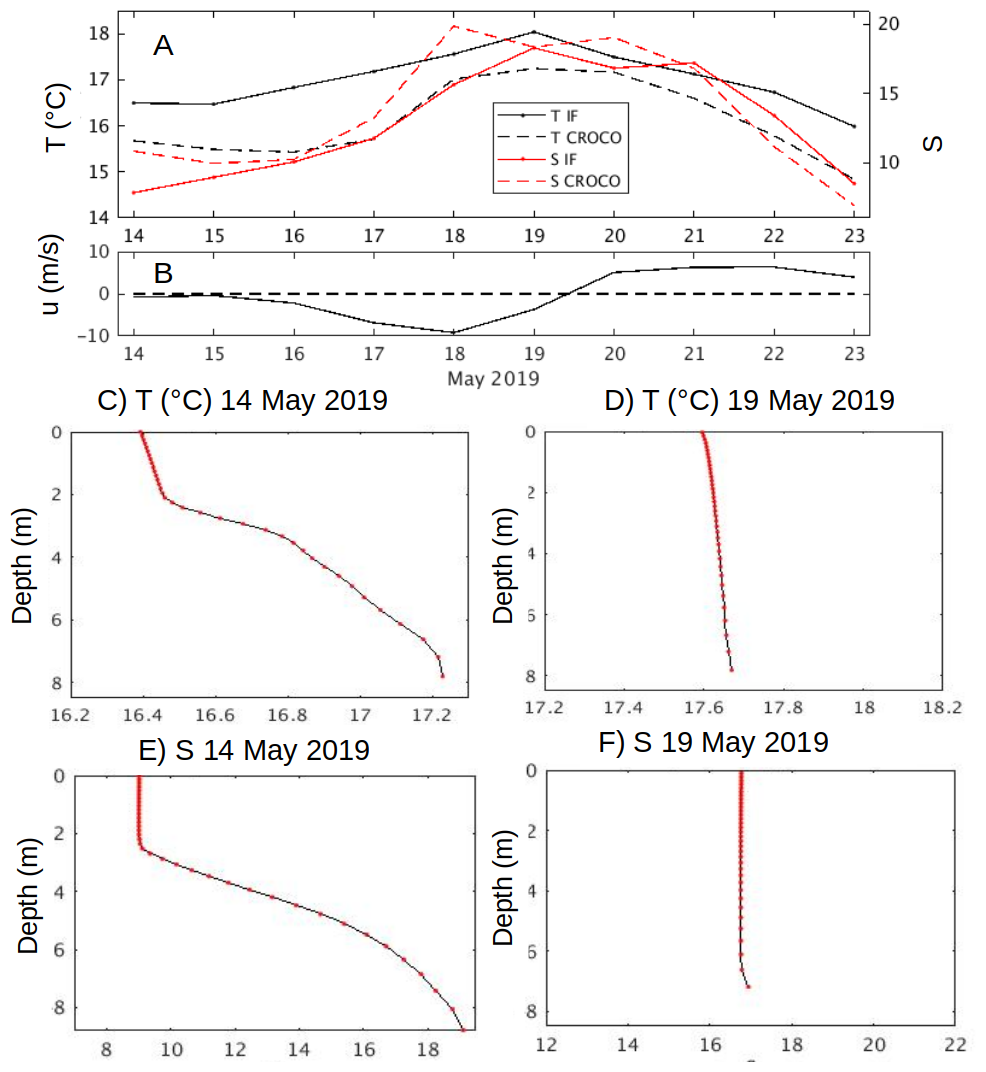
Figure 13(a) In situ (T IF and S IF) and simulated (T CROCO and S CROCO) temperature and salinity at Isla de Flores Location during the period 14–23 May 2019. NCEP2 zonal wind component for the Uruguayan coast (b). Simulated vertical profiles of salinity and temperature for 14 and 19 May 2019 at Isla de Flores location (d–f).
Furthermore, the vertical profiles of simulated variables at the Isla de Flores location revealed a stable salinity stratification and an inverse temperature profile prior to the event, transitioning to a mixed water column during the event, characterized by warmer surface temperatures and higher surface salinity compared to earlier dates (Fig. 13b–e).
We implemented and validated the CROCO ocean model in an interannual configuration similar to that used by de Mello et al. (2023) to study upwelling processes year-round. The model successfully represented the average and variability conditions throughout the year, accurately capturing salinity and temperature patterns consistent with observational data during both upwelling and not upwelling dates.
Seasonal vertical profiles of temperature and salinity were described for the first time for a coastal location in Uruguay from numerical simulations. These profiles reveal a salinity stratification throughout the year, along with variations in thermal stratification. Thermal stratification was found during the summer season. In contrast, during both intermediate seasons, there is on average little to no stratification, while in winter the model simulates an inverse thermal profile, with warmer waters near the bottom. These water column characteristics variations throughout the year provided a framework to interpret the upwelling patterns observed during spring and autumn.
Upwelling events along the Uruguayan coast were studied throughout the year by analyzing the relationship between zonal wind and sea surface salinity anomalies. Under this approach upwellings were detected for all seasons, except winter.
As evidenced in previous studies for the summer (de Mello et al., 2022a) or using idealized setups (Meccia et al., 2013), maximum salinity anomalies located in the estuarine coastal region (between Montevideo and Punta del Este) were evidenced during intense upwelling dates irrespective of the season. This is particularly important given the recognized role salinity has in structuring the biological communities in the RdP estuary (Jaureguizar et al., 2004, 2016; Giménez et al., 2010; Martínez and Ortega, 2015).
As expected, summer upwelling events were characterized not only by positive SSSa but by negative SSTa as well, indicating that both SSTa and SSSa would be reliable indicators for identifying upwelling during this season. In contrast, during spring and autumn, SSSa resulted in a better proxy. In this regard, upwellings were clearly marked by increments in SSSa (which was also evidenced in the in-situ data), but the SSTa pattern in the upwelling region was variable due to different thermal vertical profiles during these seasons. Detailed analysis of specific events was necessary to explain the simulated SSTa distributions.
From the analysis of particular cases, different types of upwelling events could be distinguished based on the thermal characteristics of the upwelled waters: warm water upwelling events, where anomalously warm subsurface water is brought to the surface during the upwelling (with varying anomaly intensity). Those are typical of the colder months of spring and autumn and characterized also by a heat loss from the surface water to the atmosphere in the upwelling region. Cold water upwelling events (similar to those occurring in summer) where colder subsurface water is brought to the surface. Those are typical from the warm season and are characterized also by a heat influx from the atmosphere to the surface water in the upwelling region. And lastly, transitional upwelling events not distinguishable from SSTa, that occur when there is not a marked thermal stratification. Those are also characterized by almost no heat flux anomalies in the upwelling region near the coast.
Given the limited oceanographic data with extensive spatial and temporal coverage of the water column properties, model simulations as the ones of the present study provide a valuable dataset for describing processes along the Uruguayan coast throughout the year. However, it is crucial to emphasize the importance of having in situ oceanographic data with broad spatial temporal coverage to validate and correct biases in the simulations. This would make the models more realistic, improve the representation of oceanographic processes, and enable more accurate explanations.
Finally, this study represents a first identification of wind induced upwelling events year round in the Uruguayan coast. Considering the amount and diversity of human activities currently taking place in the Uruguayan coastal and adjacent marine region (e.g. hydrocarbon exploration, transport, tourism, and fishing), the consequences of upwelling events occurring during other seasons in the resuspension of sediments, productivity, frontal regions and transport mechanisms are important issues that future studies should include in order to better assess the upwelling socio-ecological importance.
The GLORYS reanalysis data were obtained from the Copernicus Marine Service (https://marine.copernicus.eu, last access: 30 September 2025). In situ temperature and salinity observations at Isla de Flores are available from the corresponding author upon reasonable request. Finally, model outputs and analysis scripts used to produce the results presented in this study are available from the corresponding author upon reasonable request.
CdM designed the study, performed the numerical simulations, carried out the analyses, and wrote the manuscript. MB supervised the work, contributed to the interpretation of the results, and participated in the revision and editing of the manuscript. MR supervised the study. All authors approved the final version of the manuscript.
The contact author has declared that none of the authors has any competing interests.
Publisher's note: Copernicus Publications remains neutral with regard to jurisdictional claims made in the text, published maps, institutional affiliations, or any other geographical representation in this paper. The authors bear the ultimate responsibility for providing appropriate place names. Views expressed in the text are those of the authors and do not necessarily reflect the views of the publisher.
Camila de Mello acknowledges the PEDECIBA Geociencias program.
This paper was edited by Denise Fernandez and reviewed by Sebastian Loyola and one anonymous referee.
Acha, E. M., Mianzan, H., Guerrero, R., Carreto, J., Giberto, D., Montoya, N., and Carignan, M.: An overview of physical and ecological processes in the Rio de la Plata Estuary, Cont. Shelf Res., 28, 1579–1588, 2008.
Aguiar, A. L., Cirano, M., Pereira, J., and Marta-Almeida, M.: Upwelling processes along a western boundary current in the Abrolhos–Campos region of Brazil, Cont. Shelf Res., 85, 42–59, 2014.
Amante, C. and Eakins, B. W.: ETOPO1 1 arc-minute global relief model: Procedures, data sources and analysis, NOAA Tech. Memo., NESDIS NGDC-24, https://doi.org/10.7289/V5C8276M, 2009.
Baldoni, A. G., Molinari, G., Reta, R., and Guerrero, R. A.: Atlas de temperatura y salinidad de la plataforma continental del Atlántico Sudoccidental: Períodos cálido y frío, INIDEP – Instituto Nacional de Investigación y Desarrollo Pesquero, https://doi.org/10.7289/V5C8276M, 2015.
BaRDO INIDEP database: CTD data, https://catalogo.inidep.edu.ar/geonetwork/srv/spa/catalog.search#/home, last access: 30 September 2025.
Belem, A. L., Castelao, R. M., and Albuquerque, A. L.: Controls of subsurface temperature variability in a western boundary upwelling system, Geophys. Res. Lett., 40, 1362–1366, 2013.
Brum, A.: Variabilidad de la salinidad en la zona media del Río de la Plata y su impacto sobre la productividad primaria en la costa Atlántica uruguaya, Tesina de grado, Facultad de Ciencias, Universidad de la República, https://www.colibri.udelar.edu.uy/jspui/handle/20.500.12008/48472 (last access: 30 September 2025), 2024.
Burone, L., Ortega, L., Franco-Fraguas, P., Mahiques, M., García-Rodriguez, F., Venturini, N., and Salaroli, A.: A multiproxy study between the Río de la Plata and the adjacent southwestern Atlantic inner shelf to assess the sediment footprint of river vs. marine influence, Cont. Shelf Res., 55, 141–154, 2013.
Cao, Z., Dai, M., Evans, W., Gan, J., and Feely, R.: Diagnosing CO2 fluxes in the upwelling system off the Oregon–California coast, Biogeosciences, 11, 6341–6354, https://doi.org/10.5194/bg-11-6341-2014, 2014.
Carr, M. E.: Estimation of potential productivity in Eastern Boundary Currents using remote sensing, Deep-Sea Res. Pt. II, 49, 59–80, https://doi.org/10.1016/S0967-0645(01)00094-7, 2001.
Castello, J. and Möller, O.: Sobre as condições oceanográficas no Rio Grande do Sul, Atlântica, 2, 25–110, 1977.
Chavez, F. P. and Messié, M.: A comparison of eastern boundary upwelling ecosystems, Prog. Oceanogr., 83, 80–96, https://doi.org/10.1016/j.pocean.2009.07.032, 2009.
Chin, T. M., Vazquez-Cuervo, J., and Armstrong, E. M.: A multi-scale high-resolution analysis of global sea surface temperature, Remote Sens. Environ., 200, 154–169, https://doi.org/10.1016/j.rse.2017.07.029, 2017.
D'Agosto, E. and Barreiro, M.: Climatological analysis of the 2022–2023 unprecedented dry period in southwestern Uruguay, Int. J. Climatol., 46, e70260, https://doi.org/10.1002/joc.70260, 2026.
da Silva, A. M., Young, C. C., and Levitus, S.: Atlas of surface marine data 1994, Vol. 1: Algorithms and procedures, NOAA Atlas NESDIS 6, U.S. Department of Commerce, Washington, D.C., https://www.nodc.noaa.gov/OC5/indprod.html (last access: 30 September 2025), 1994.
Debreu, L., Marchesiello, P., Penven, P., and Cambon, G.: Two-way nesting in split-explicit ocean models: Algorithms, implementation and validation, Ocean Model., 49, 1–21, 2012.
de Mello, C., Barreiro, M., Ortega, L., Trinchin, R., and Manta, G.: Coastal upwelling along the Uruguayan coast: Structure, variability and drivers, J. Mar. Syst., 230, 103735, https://doi.org/10.1016/j.jmarsys.2022.103735, 2022a.
de Mello, C., Barreiro, M., Marin, Y., Ortega, L., Trinchin, R., and Manta, G.: Relación entre frentes de convergencia y localización de la flota pesquera durante la ocurrencia de surgencia costera en Uruguay, Innotec, 24, e624, https://doi.org/10.26461/24.03, 2022b.
de Mello, C., Barreiro, M., Hernández-García, E., Trinchin, R., and Manta, G.: A Lagrangian study of summer upwelling along the Uruguayan coast, Cont. Shelf Res., 258, 104987, https://doi.org/10.1016/j.csr.2023.104987, 2023.
Egbert, G. D. and Erofeeva, S. Y.: Efficient inverse modeling of barotropic ocean tides, J. Atmos. Ocean. Tech., 19, 183–204, https://doi.org/10.1175/1520-0426(2002)019<0183:EIMOBO>2.0.CO;2, 2002.
Geyer, W. R.: Estuarine salinity structure and circulation, in: Contemporary Issues in Estuarine Physics, edited by: Valle-Levinson, A., Cambridge University Press, Cambridge, 12–26, ISBN 9780511676567, 2010.
Giménez, L., Borthagaray, A. I., Carranza, A., and Scarabino, F.: Rocky intertidal macrobenthic communities across a large-scale estuarine gradient (Río de la Plata, Uruguay), Sci. Mar., 74, 161–173, 2010.
Guerrero, R. A. and Piola, A. R.: Masas de agua en la plataforma continental, http://hdl.handle.net/1834/1703 (last access: 30 September 2025), 1997.
Guerrero, R. A., Acha, E. M., Framin, M. B., and Lasta, C. A.: Physical oceanography of the Río de la Plata Estuary, Argentina, Cont. Shelf Res., 17, 727–742, 1997.
Guerrero, R. A., Osiroff, A. P., Molinari, G., and Piola, A. R.: Análisis de datos históricos de temperatura y salinidad del Río de la Plata y la plataforma adyacente, Informe técnico FREPLATA–INIDEP–SIHN, https://www.argentina.gob.ar/interior/ambiente/audiovisual/arboles-nativos (last access: 30 September 2025), 2003.
Guerrero, R. A., Piola, A. R., Molinari, G. N., Osiroff, A. P., and Jáuregui, S. I.: Climatología de temperatura y salinidad en el Río de la Plata y su frente marítimo, Contribución No. 1555, INIDEP, https://www.researchgate.net/publication/235322213 (last access: 30 September 2025), 2010.
Haney, R. L.: On the pressure gradient force over steep topography in sigma coordinate ocean models, J. Phys. Oceanogr., 21, 610–619, https://doi.org/10.1175/1520-0485(1991)021<0610:OTPGFO>2.0.CO;2, 1991.
Jaureguizar, A. J., Menni, R., Guerrero, R., and Lasta, C.: Environmental factors structuring fish communities of the Río de la Plata estuary, Fish. Res., 66, 195–211, https://doi.org/10.1016/S0165-7836(03)00200-5, 2004.
Jaureguizar, A. J., Solari, A., Cortés, F., Milessi, A. C., Militelli, M. I., Camiolo, M. D., and García, M.: Fish diversity in the Río de la Plata and adjacent waters: an overview of environmental influences on its spatial and temporal structure, J. Fish Biol., 89, 569–600, https://doi.org/10.1111/jfb.12975, 2016.
Kanamitsu, M., Ebisuzaki, W., Woollen, J., Yang, S.-K., Hnilo, J. J., Fiorino, M., and Potter, G. L.: NCEP–DOE AMIP-II reanalysis (R-2), B. Am. Meteorol. Soc., 83, 1631–1644, 2002.
Knauss, J. A.: Introduction to Physical Oceanography, Waveland Press, ISBN 9781577664291, 1997.
Largier, J. L.: Upwelling bays: How coastal upwelling controls circulation, habitat, and productivity in bays, Annu. Rev. Mar. Sci., 12, 415–447, https://doi.org/10.1146/annurev-marine-010419-011020, 2020.
Lellouche, J.-M., Le Galloudec, O., Greiner, E., Garric, G., Regnier, C., Drevillon, M., and Le Traon, P.-Y.: The Copernicus Marine Environment Monitoring Service global ocean 1/12° physical reanalysis GLORYS12V1: Description and quality assessment, EGU General Assembly Conference Abstracts, 20, 19806, 2018.
Mahardja, B., Bashevkin, S. M., Pien, C., Nelson, M., Davis, B. E., and Hartman, R.: Escape from the heat: Thermal stratification in a well-mixed estuary and implications for fish species facing a changing climate, Hydrobiologia, 849, 2895–2918, https://doi.org/10.1007/s10750-022-04886-w, 2022.
Martínez, A. and Ortega, L.: Delimitation of domains in the external Río de la Plata estuary, involving phytoplanktonic and hydrographic variables, Braz. J. Oceanogr., 63, 217–227, 2015.
Meccia, V. L., Simionato, C. G., and Guerrero, R. A.: The Río de la Plata Estuary response to wind variability on synoptic timescale: Salinity fields and salt wedge structure, J. Coast. Res., 29, 61–77, 2013.
Möller, O. O., Piola, A. R., Freitas, A. C., and Campos, E. J. D.: The effects of river discharge and seasonal winds on the shelf off southeastern South America, Cont. Shelf Res., 28, 1607–1624, 2008.
Nagy, G. J., Gómez-Erache, M., López, C. H., and Perdomo, A. C.: Distribution patterns of nutrients and symptoms of eutrophication in the Río de la Plata River Estuary System, in: Nutrients and Eutrophication in Estuaries and Coastal Waters, Springer, 125–139, https://doi.org/10.1023/A:1020300906000, 2002.
Ortega, L. and Martínez, A.: Multiannual and seasonal variability of water masses and fronts over the Uruguayan shelf, J. Coast. Res., 23, 618–629, 2007.
Pauly, D. and Christensen, V.: Primary production required to sustain global fisheries, Nature, 374, 255–257, https://doi.org/10.1038/374255a0, 1995.
Pimenta, F., Garvine, R. W., and Münchow, A.: Observations of coastal upwelling off Uruguay downshelf of the Plata estuary, South America, J. Mar. Res., 66, 835–872, 2008.
Piola, A. R., Campos, E. J. D., Möller, O. O., Charo, M., and Martinez, C.: Subtropical shelf front off eastern South America, J. Geophys. Res., 105, 6565–6578, 2000.
Piola, A. R., Matano, R. P., Palma, E. D., Möller, O. O., and Campos, E. J. D.: The influence of the Plata River discharge on the western South Atlantic shelf, Geophys. Res. Lett., 32, L01603, https://doi.org/10.1029/2004GL021638, 2005.
Piola, A. R., Möller, O. O., Guerrero, R. A., and Campos, E. J. D.: Variability of the Subtropical Shelf Front off eastern South America: Winter 2003 and summer 2004, Cont. Shelf Res., 28, 1639–1648, 2008.
Pitcher, G. C., Figueiras, F. G., Hickey, B. M., and Moita, M. T.: The physical oceanography of upwelling systems and the development of harmful algal blooms, Prog. Oceanogr., 85, 5–32, 2010.
Rabellino, J.: Análisis del rol del frente subtropical de plataforma sobre huevos y larvas de Engraulis anchoita utilizando un enfoque biofísico, Tesis de maestría, PEDECIBA-Geociencias, Universidad de la República, https://www.colibri.udelar.edu.uy/jspui/handle/20.500.12008/8183 (last access: 30 September 2025), 2016.
Shchepetkin, A. F. and McWilliams, J. C.: The Regional Oceanic Modeling System (ROMS): A split-explicit, free-surface, topography-following-coordinate oceanic model, Ocean Model., 9, 347–404, 2005.
Simionato, C. G., Vera, C. S., and Siegismund, F.: Surface wind variability on seasonal and interannual scales over Río de la Plata area, J. Coast. Res., 21, 770–783, 2005.
Simionato, C. G., Tejedor, M. L. C., Campetella, C., Guerrero, R., and Moreira, D.: Patterns of sea surface temperature variability on seasonal to sub-annual scales at and offshore the Río de la Plata estuary, Cont. Shelf Res., 30, 1983–1997, 2010.
Trinchin, R., Ortega, L., and Barreiro, M.: Spatiotemporal characterization of summer coastal upwelling events in Uruguay, South America, Reg. Stud. Mar. Sci., 31, 100787, https://doi.org/10.1016/j.rsma.2019.100787, 2019.
Trinchin, R., Manta, G., Santana, R., Rubio, L., Horta, S., Passadore, C., and Barreiro, M.: Hacia un monitoreo continuo de variables oceanográficas en el Parque Nacional Isla de Flores, Uruguay, Innotec, LATU, 89–108, 2021.
Trinchin, R., Manta, G., Horta, S., Barreiro, M., Santana, R., and Rubio, L.: Temperatura y salinidad en Isla de Flores con resolución horaria, Version 1, Repositorio de datos abiertos de investigación de Uruguay [data set], https://doi.org/10.60895/redata/X3FUPX, 2024.
Wallace, J. M., Smith, C., and Bretherton, C. S.: Singular value decomposition of wintertime sea surface temperature and 500-mb height anomalies, J. Climate, 5, 561–576, 1992.
Wang, D., Gouhier, T. C., Menge, B. A., and Ganguly, A. R.: Intensification and spatial homogenization of coastal upwelling under climate change, Nature, 518, 390–394, https://doi.org/10.1038/nature14235, 2015.
Zavialov, P. O., Kostianoy, A. G., and Möller Jr., O. O.: SAFARI cruise: Mapping river discharge effects on Southern Brazilian shelf, Geophys. Res. Lett., 30, 2126, https://doi.org/10.1029/2003GL018265, 2003.