the Creative Commons Attribution 4.0 License.
the Creative Commons Attribution 4.0 License.
 | 09 Apr 2025
Operational hydrodynamic service as a tool for coastal flood assessment
Xavier Sánchez-Artús
Vicente Gracia
Manuel Espino
Manel Grifoll
Gonzalo Simarro
Jorge Guillén
Marta González
Agustín Sanchez-Arcilla
Coastal communities are increasingly vulnerable to storm impacts, highlighting the urgent need for predictive tools and enhanced preparedness. In this work, a comprehensive, high-resolution hydrodynamic operational service using the XBeach model is presented and tested for three urban beaches in Barcelona, NW Mediterranean Sea. The operational system is designed to provide early warnings of coastal flooding at a 3 d horizon. The operational architecture is based on Python scripts combined with task automation tools, ensuring a user-friendly system implemented on a standard desktop computer. Hydrodynamic validation of the model is carried out using data gathered during a field campaign in 2022, when a high-intensity storm occurred, resulting in a root mean square error of around 0.4 m and a skill score assessment index of 0.82. Flooding predictions were validated using videometry systems, yielding satisfactory Euclidean distances of less than 5 m for storms close to the topobathymetry collection. For storms occurring years earlier, the distances ranged between 7–15 m, underscoring the need for regular topobathymetry updates to maintain forecasting accuracy. The service provides a warning system with a specific categorisation of the event, enabling the end-users to prepare for a possible flooding. The strategy is currently running in operational mode, issuing alert warnings at the correct severity level. The outcome assists in decision-making relating to such events by utilising the operational system. The presented methodology is easily adaptable and replicable to meet user requirements or to be applied in other areas of interest.
- Article
(8548 KB) - Full-text XML
- BibTeX
- EndNote


Currently, nearly 600 million people reside in low-lying coastal areas, defined as zones less than 10 m above mean water level (McGranahan et al., 2007; Idier et al., 2021). These zones are highly susceptible to flooding during storms due to their low elevation (Romero-Martín et al., 2024). Climate change exacerbates this threat by causing the sea level to rise, which is expected to increase the frequency and severity of flooding if no additional measures are taken (Cid et al., 2016; IPCC, 2022). Jongman (2018) talks about the necessity of coping with these challenges by implementing diverse solutions such as flood protection measures, risk prevention plans, nature-based solutions, and early-warning systems (EWSs). Thus, continuous monitoring and protection are required actions to increase the resilience of such areas (Baschek et al., 2017). In addition to these problems, the rapid urbanisation in recent decades and the lack of adequate coastal protection infrastructures have increased the impacts of flooding events (Chondros et al., 2021). Decision makers must have suitable tools to mitigate current impacts and prepare the coasts for the future. For the short-term actions, EWSs are vital for safeguarding coastal areas by providing enough time to act and to minimise the damages before they occur, while, for the long term, understanding potential impacts under various scenarios is crucial for risk reduction planning.
To efficiently implement these EWSs, an operational architecture is necessary to automate all modules and facilitate communication with users, primarily stakeholders, via e-mail, alerts, or applications. These channels enable them to make sound decisions before the events occur. To monitor and forecast coastal areas accurately, it is crucial to use different levels of information, from the open sea to the beach, including wave, topobathymetric, and morphology data. Specifically, operational oceanography involves systematic measurement and modelling of seas, oceans, and the atmosphere, with rapid data interpretation and dissemination to meet societal and scientific needs (Capet et al., 2020; Schiller et al., 2018). Ocean forecasting, a subset of operational oceanography, uses data and numerical models to predict conditions days in advance (Pérez Gómez et al., 2022). Coastal ocean forecasting systems (COFSs) enhance this by focusing on local areas, usually integrating data from different numerical models, products, and observations to provide advanced information about the areas of interest (Kourafalou et al., 2015). Increasing integration of coastal observation data for model inputs and calibration improves forecast quality, leading to better decision-making and significant economic and social benefits by reducing storm impact consequences (Walstad and McGillicuddy, 2000; De Mey-Frémaux et al., 2019).
The forecast results provided by models at coastal areas have to be provided to the stakeholders as swiftly as possible to give them leeway with regard to action management (She et al., 2016). Fortunately, advances in technology and computing power over the past few decades have significantly improved the quality of these steps (Pinardi and Woods, 2002). Data can now be analysed faster, and models can produce reliable results quicker. Moreover, databases have become more accessible, offering high-quality hindcast and forecast data daily. This availability allows for the creation of local systems based on these datasets, focusing only on specific local areas. Modern operational services used to forecast coastal-area hazards no longer rely on a single model or a few variables (Mateus et al., 2012); they utilise a combination of data from specialised models to address different issues, such as storm surges, currents, water levels, waves, winds, flooding, and erosion. These problems are solved using various meteorologic, hydrodynamic, and morphodynamic models, which help reduce computational time and resources (Wilkin et al., 2017; Bogden et al., 2006). This approach also facilitates data collection from servers and the integration of models into a coherent system. Despite these advancements, EWSs that forecast coastal flooding still face challenges, such as computational time and the correct calculation of physical hydrodynamic and morphodynamic processes, as noted by Basher (2006). To address them, common solutions include utilising high-performance-computing (HPC) environments, simplifying and reducing the resolution of the model grids, pre-calculating flooding scenarios, and depending on expert judgement instead of strict metrics.
The proposed operational service in this work, created to forecast flooding impacts, is designed to deliver forecasts to end-users with sufficient lead time to act, featuring a solution that does not require a complex HPC environment. The EWS's most important feature is this rapidness in obtaining practical results, and so the whole strategy must be built around the ability to provide hazard alerts in advance (Quansah et al., 2010; Kelman and Glantz, 2014). Computational and hardware limitations force institutions to develop pre-operational chains that do not become fully operational and only prove to be effective for specific cases. The strategy developed in this contribution does not compromise the resolution of the model as it utilises hydrodynamic information from CMEMS products (https://marine.copernicus.eu/, last access: 26 June 2024). These data are automatically collected from servers and are employed to focus the study on a local area using a coastal hydro-morphodynamic model. This methodology provides end-users, such as local government authorities and those responsible for beach safety, with forecasting outcomes and relevant information about the study area, including warning alerts, to help them with the decision-making regarding potential hazards.
Thus, the objective of this study is to present the architecture of a high-resolution operational service designed to estimate coastal flooding and to provide timely results, enabling stakeholders to take action, all while being implementable on a standard desktop computer. To analyse and validate the effectiveness of this system, we have applied it to three urban beaches in Barcelona (NW Mediterranean Sea). These beaches were chosen due to the availability of hydro-topographic data and a videometry system, which facilitated the validation of the operational service.
This paper is structured as follows: Sect. 2 outlines the materials and methods used, including the description of the studied area used for developing the operational tool, an explanation of the system architecture, and with the strategy followed to calibrate and validate the models using a field campaign and cameras. Section 3 shows the results of the calibration and validation exercises in terms of hydrodynamics and flooding. Section 4 presents a discussion of the main characteristics of the system compared with other approaches, as well as the limitation of the strategy itself, the model capability, and the possibilities of tuning and making improvements to the strategy. Finally, Sect. 5 summarises the conclusions of the study.
2.1 Study area
This study focuses on three urban sandy beaches that are fully integrated into the city of Barcelona on the northeastern coast of Spain (NW Mediterranean). From south to north, they are named Sant Sebastià, Sant Miquel, and Barceloneta (Fig. 1). The area has a total length of approximately 1.5 km and a mean width of 45 m, with a median grain size of about 0.88 mm (CIIRC, 2010). The beaches are among the most visited in the region. The coast, oriented at 20° relative to the north, is fully exposed to storms. The highest-intensity events, mainly occurring from October to April, are from the eastern and northeastern directions and can cause severe damage to the existing infrastructures (Ribas et al., 2010).
The impact of storms forces the administration to regularly intervene in the emerged part of the beaches by adding or redistributing the sediment (Turki et al., 2013). Even in a microtidal environment, with a tidal range of approximately 0.25 m (Grifoll et al., 2012), variations in mean sea level can reach up to 0.9 m during storms due to the contribution of strong winds caused by low-atmospheric-pressure fronts, potentially leading to flooding. At present, the coast sees heavy interventions, with a small revetment at the beach of Sant Sebastià, a T-shape groin that separates Sant Miquel and Barceloneta and a double groin at the north of Barceloneta beach (Fig. 1). Sant Miquel and Sant Sebastià can be considered to be a single unit, and they will be referred to in this study as SMSS. The backshore is bordered by a seafront promenade that reaches a height of +7.5 m at Barceloneta, gradually decreasing towards the south until it reaches +3.5 m. The boardwalk provides access to the coast, as well as numerous establishments, including restaurants and a hotel.
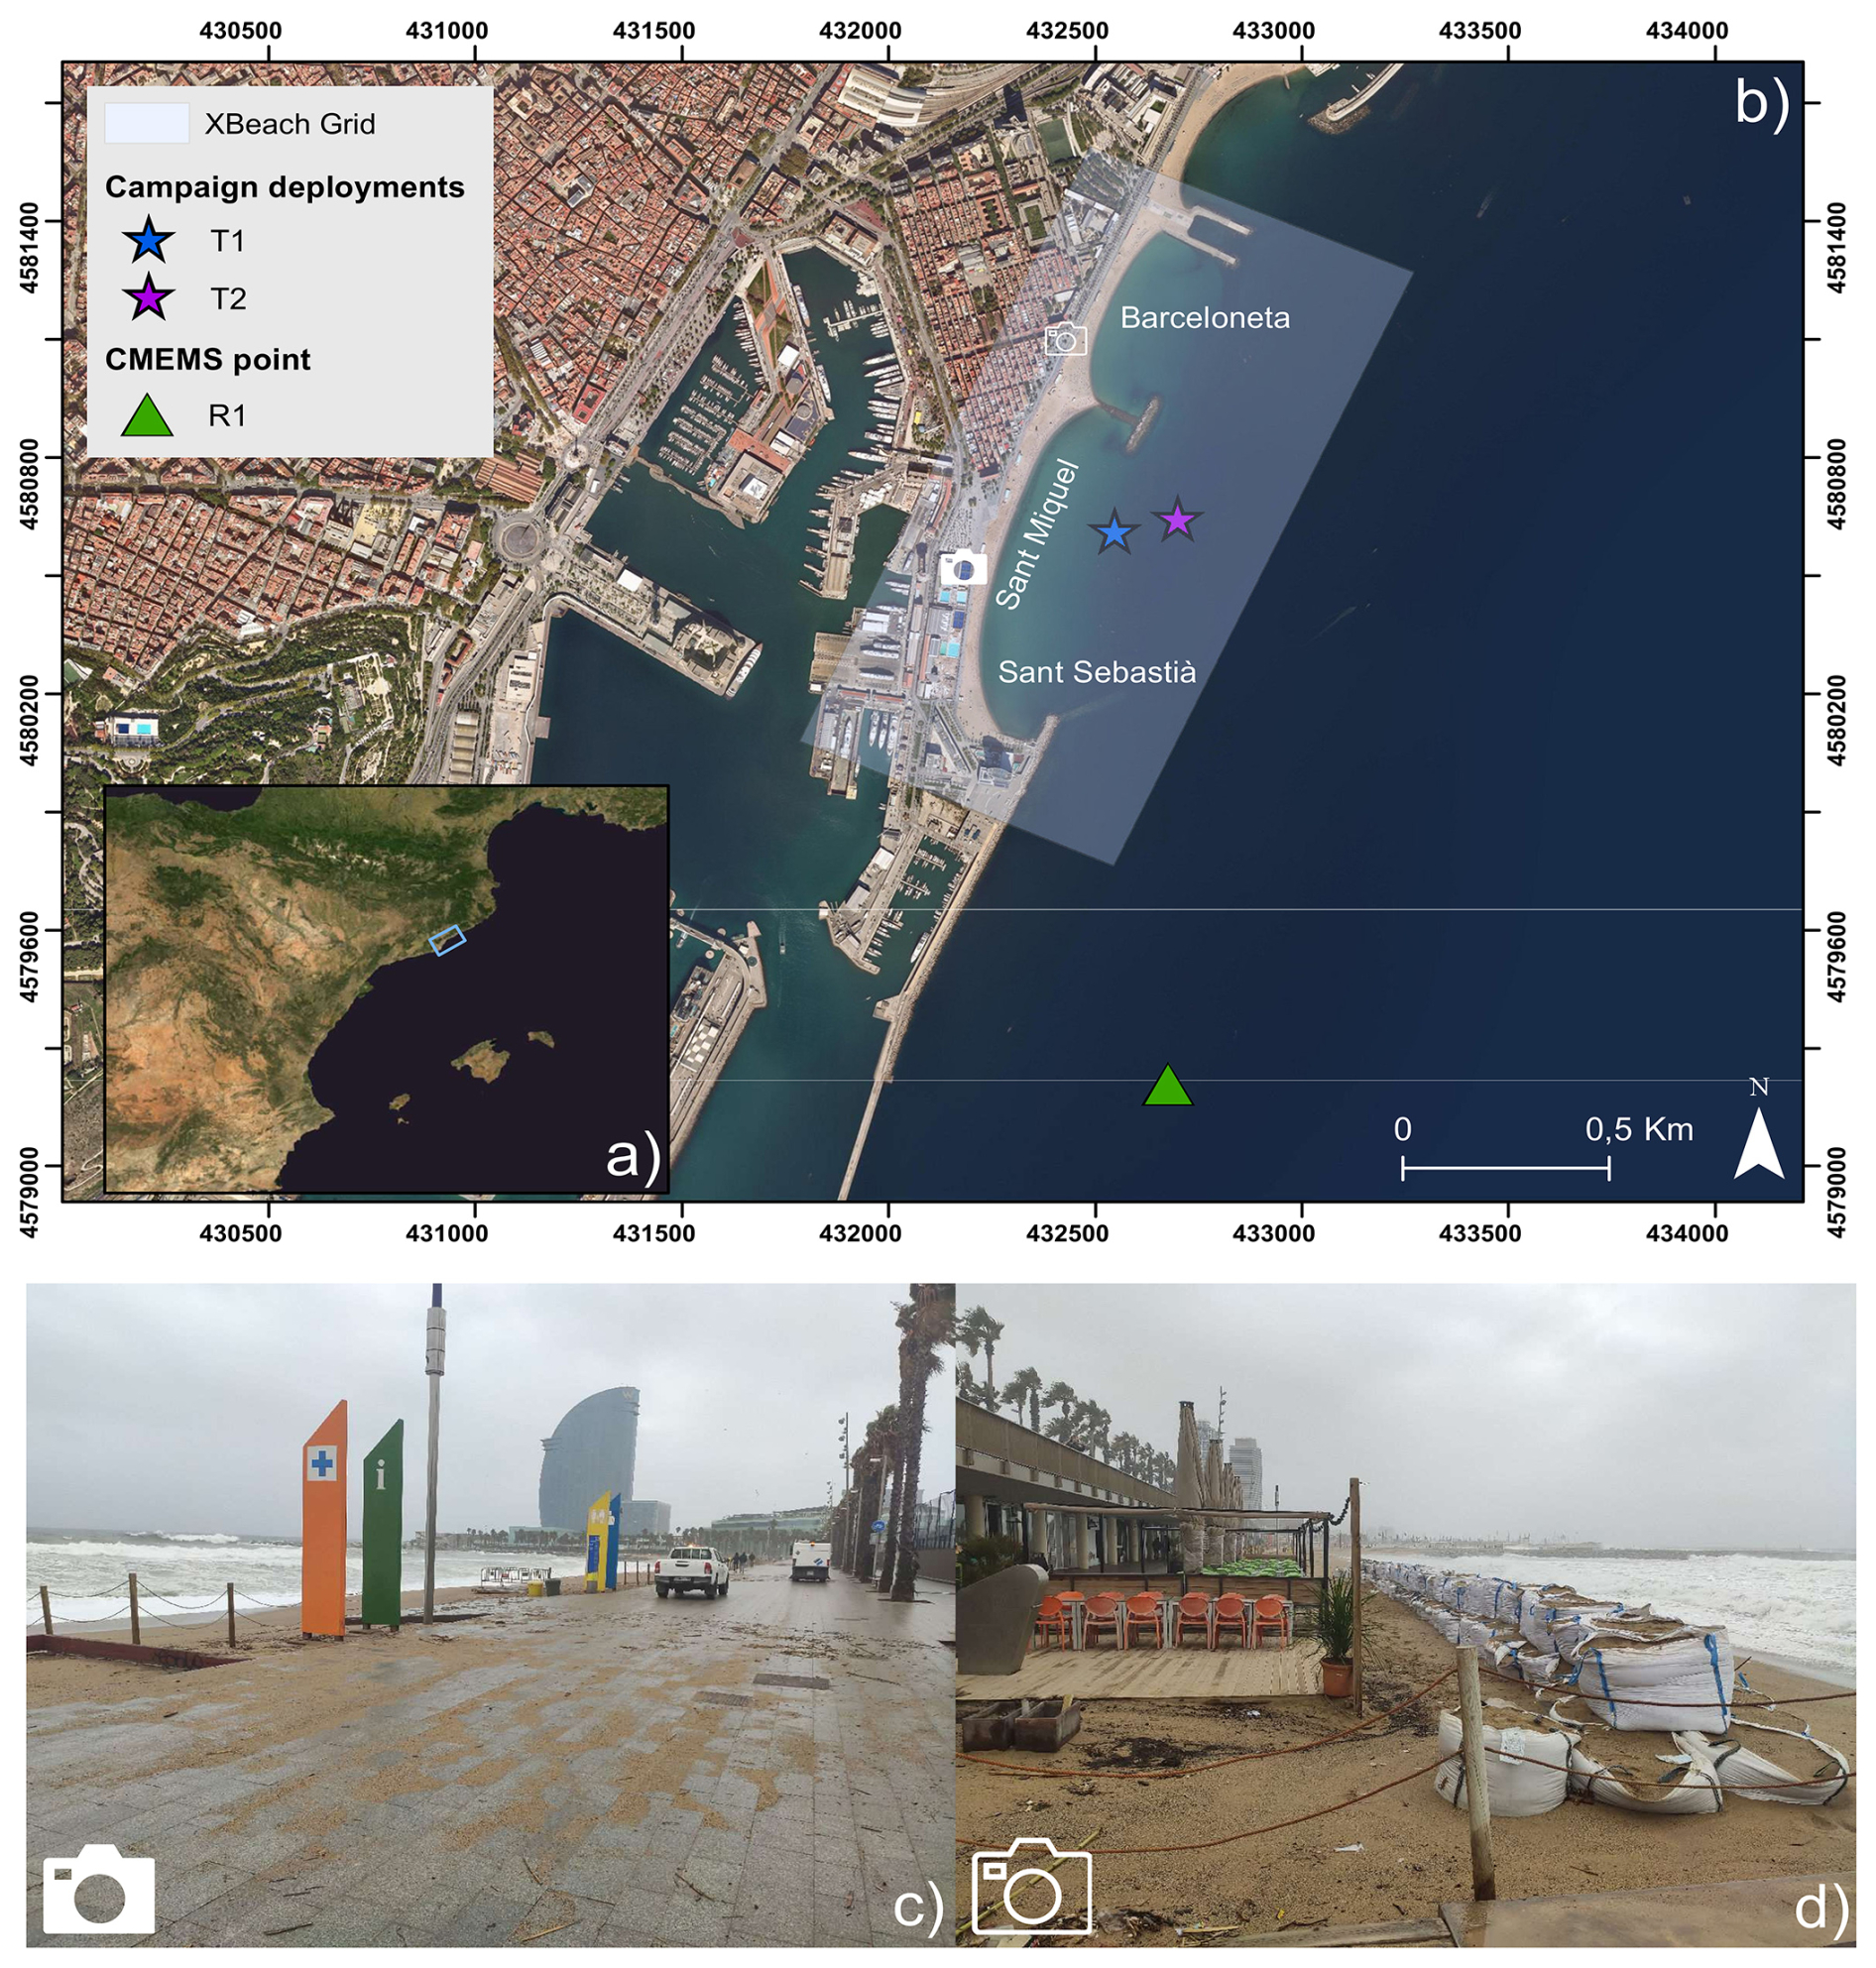
Figure 1Location map of the study area. (a) NW Mediterranean Sea. Blue rectangle marks Barcelona. (b) Close-up of southern region of Barcelona beaches. Stars (T1 and T2) show the location of the field campaign deployments. Triangle presents the location of the CMEMS reference point (R1). Grey rectangle represents the extent of the computational domain. Panels (c) and (d) show photographs taken during Storm Celia within the study area at the locations marked by the camera symbols on the general map. These images illustrate the impacts caused by the storm event. Orthophoto obtained from the ICGC WMS.
2.2 Operational architecture
The structure of the developed framework is shown in Fig. 2. The chain is controlled with task automation tools, in this case the Task Scheduler application for Windows OS. A similar approach for Linux could be implemented with equivalent settings through “at” package commands or the cron tab, while this can be done for macOS using Automator and iCalendar. Additionally, the Cylc Workflow Engine (Oliver et al., 2018) could be utilised for both operating systems as well. In our application, the chain starts at 02:00 local time and shares the result of the operational chain at 09:00 through the sending of an e-mail to the competent person. These initialisation times are arbitrarily selected and are subject to changes based on demands. Data request and threshold or flooding analysis are activated through Python scripts linked to the task automation tool.
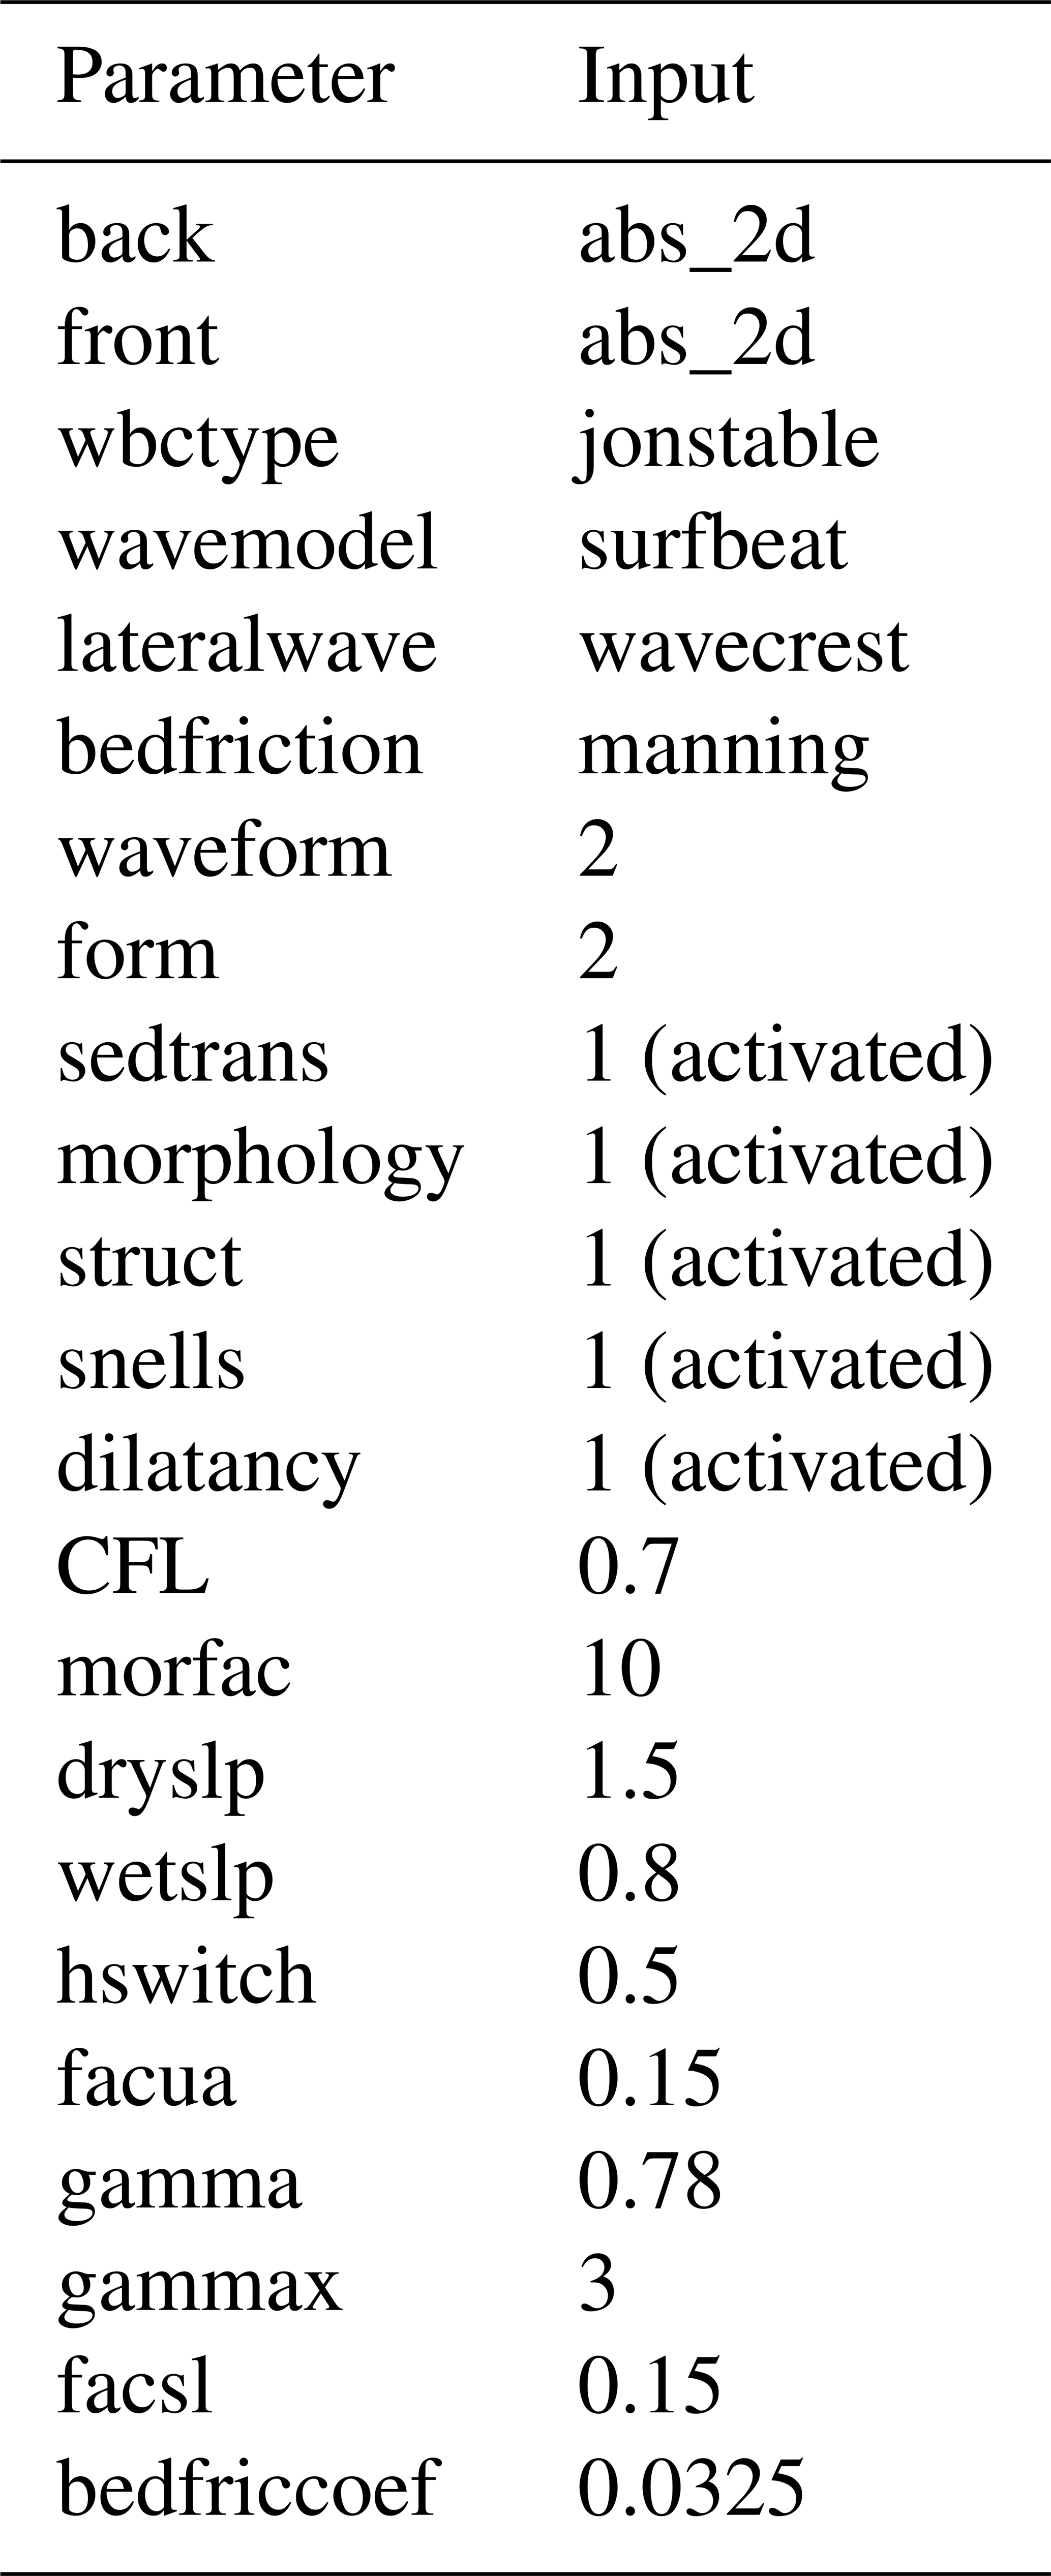
XBeach (version 1.23) is selected as the core model to simulate the response of the coast. XBeach is a two-dimensional model that encompasses wave propagation, sediment transport, and beach morphology changes among other processes (Roelvink et al., 2009, 2010; McCall et al., 2014). The surfbeat mode, which includes infragravity waves, is used in this study to simulate both flooding and coastal changes correctly. Modules for sediment transport and morphology changes are enabled since flooding is heavily influenced by the topobathymetry. The generated mesh, which features a rectangular configuration, has a 5 m resolution on both axes and is oriented to follow beach direction (see Fig. 1). Appendix A provides the parameters and the setup used in the simulations conducted for this study. Additional parameters, such as the median grain size (0.0008 m) (CIIRC, 2010) and the treatment of the city as a non-erodible layer, are also specified. The grid is referenced to ETRS89 UTM 31N and has been post-processed to improve the water–land interface coupling. A Python-based script, employing sub-process commands, activates the trigger for initiating XBeach simulations. The model is configured to run in parallel mode using MPI (message passing interface) settings.
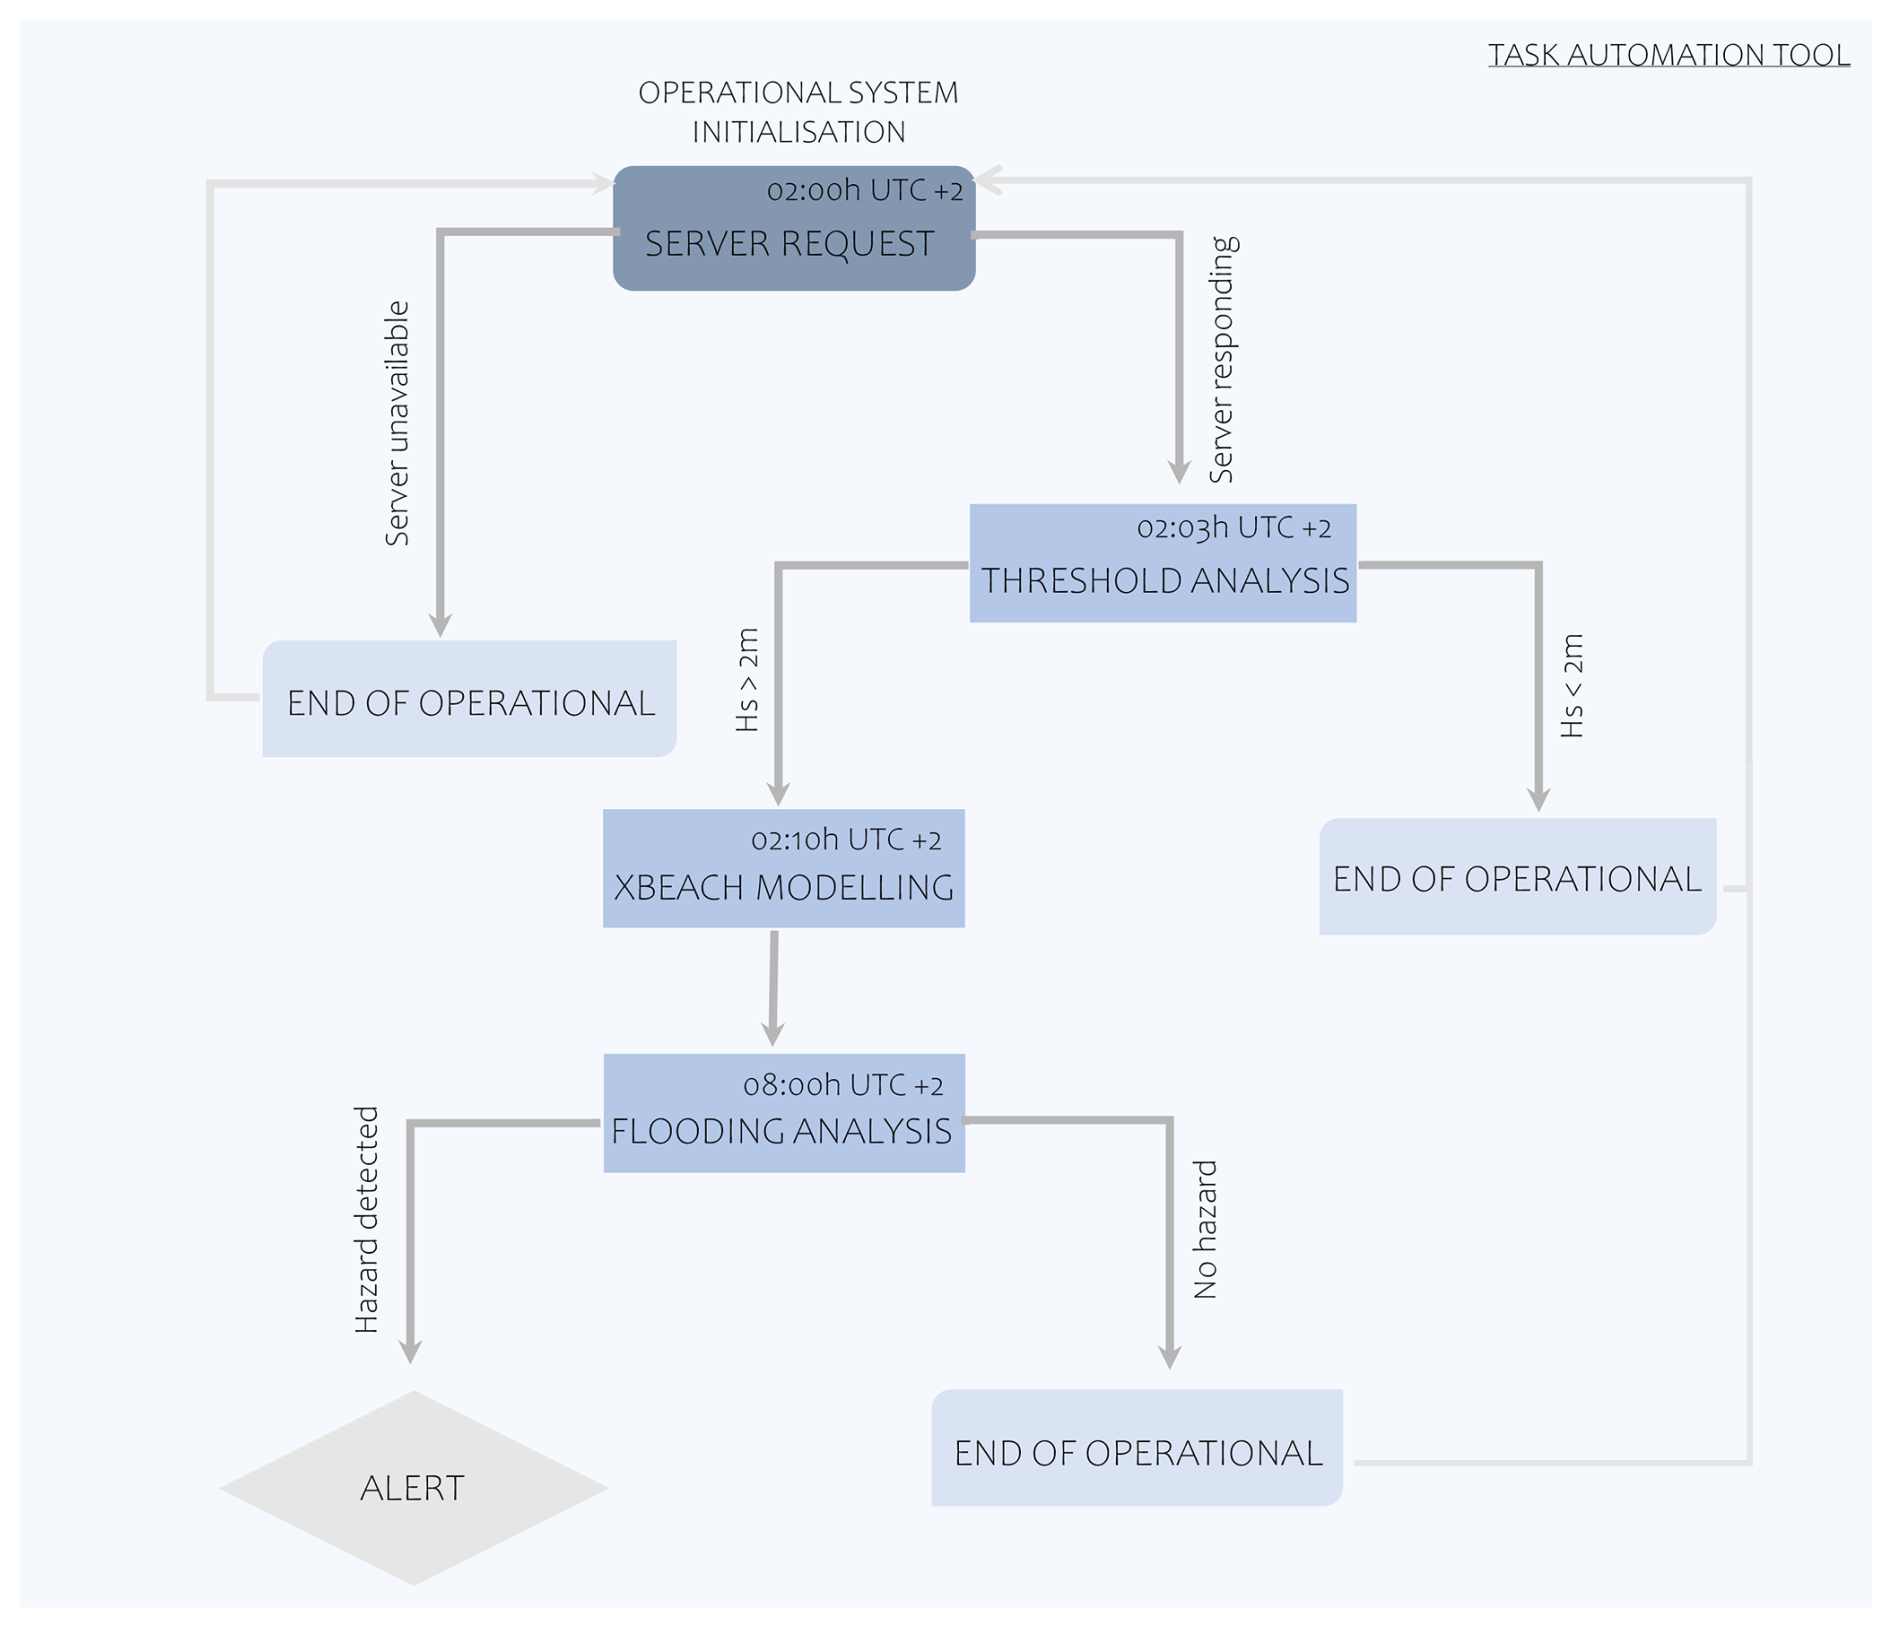
Figure 2Workflow for the automated operational service. A detailed explanation is provided in Sect. 2.2.
The chain starts with a hydrodynamic data request to the Copernicus Marine Environment Monitoring Service (CMEMS). This is a European programme for the establishment of a European capacity for Earth observation which provides oceanographic products and services for maritime safety, coastal and marine environments, climate and weather forecasting, and marine-resource users. For the study area, there are two different datasets available: the Atlantic-Iberian Biscay Irish (IBI) database (Aznar et al., 2016) and the Mediterranean Sea database (MEDSEA). For this work, we utilised the IBI dataset, although MEDSEA could also be used as a primary input according to the proposed approach. IBI has been widely used as a boundary condition to build operational downstream services through high-resolution hydrodynamic models (e.g. Sotillo et al. (2021); Lorente et al. (2019)), offering a daily updated high-resolution ocean analysis and forecast product. Hourly data for significant wave height, peak period, mean direction, and water level are requested from the closest CMEMS point to the XBeach computational grid, hereinafter referred to as R1 (Fig. 1). The information is gathered in the early morning for that same day and the subsequent 2 d, obtaining a 3 d forecasting. In the event of server or computer failure during data collection, the operational chain is ended until it can be restarted the following day. However, it can be manually reactivated on the same day if necessary.
The next step involves activating XBeach only if a significant wave height exceeding the 2 m threshold is detected in the forecasted time series from CMEMS. This threshold is commonly used to indicate storm conditions along the Catalan coast (Bosom and Jiménez, 2011). If no such value is observed, the XBeach module is not triggered, and the operational service ends as it is assumed that no hazards will be identified during the chain. Once the simulation is complete, XBeach provides the number of flooded cells using an output variable called wetz. This variable identifies wet and dry cells across the entire domain, with flooded cells being defined as those that start dry and become wet during the simulation. The total flooding is then calculated as the average number of these flooded cells over the simulation. To minimise model errors and exclude areas with very thin flooding layers, a cell is only considered to be wet when it surpasses a threshold of 5 cm. These XBeach flooding results, which take 3 h to process on a standard desktop computer (in this study, Intel Core i7-10700 with 16 GB RAM), are automatically analysed to assess the extent of inundation using Eq. (1). This equation considers the total number of cells between the coastline and the promenade and compares it to the number of cells that are flooded during the event, yielding the percentage of the flooded beach.
These percentages are used to establish a colour-coded alert level system, helping end-users assess the potential magnitude of the impacts. The alert levels are categorised as follows: green for no alert when 0 %–25 % of the area is flooded, yellow for moderate alert when 25 %–50 % of the area is flooded, orange for high alert when 50 %–75 % of the area is flooded, and red for extremely high alert when 75 %–100 % of the area is flooded. Additionally, if the forecasted wave height detected is always less than 2 m, the event is also classified as no alert. Figure 3 illustrates examples of images ranging from no alert to maximum alert and demonstrates how colour scales are used to classify the flood hazard.
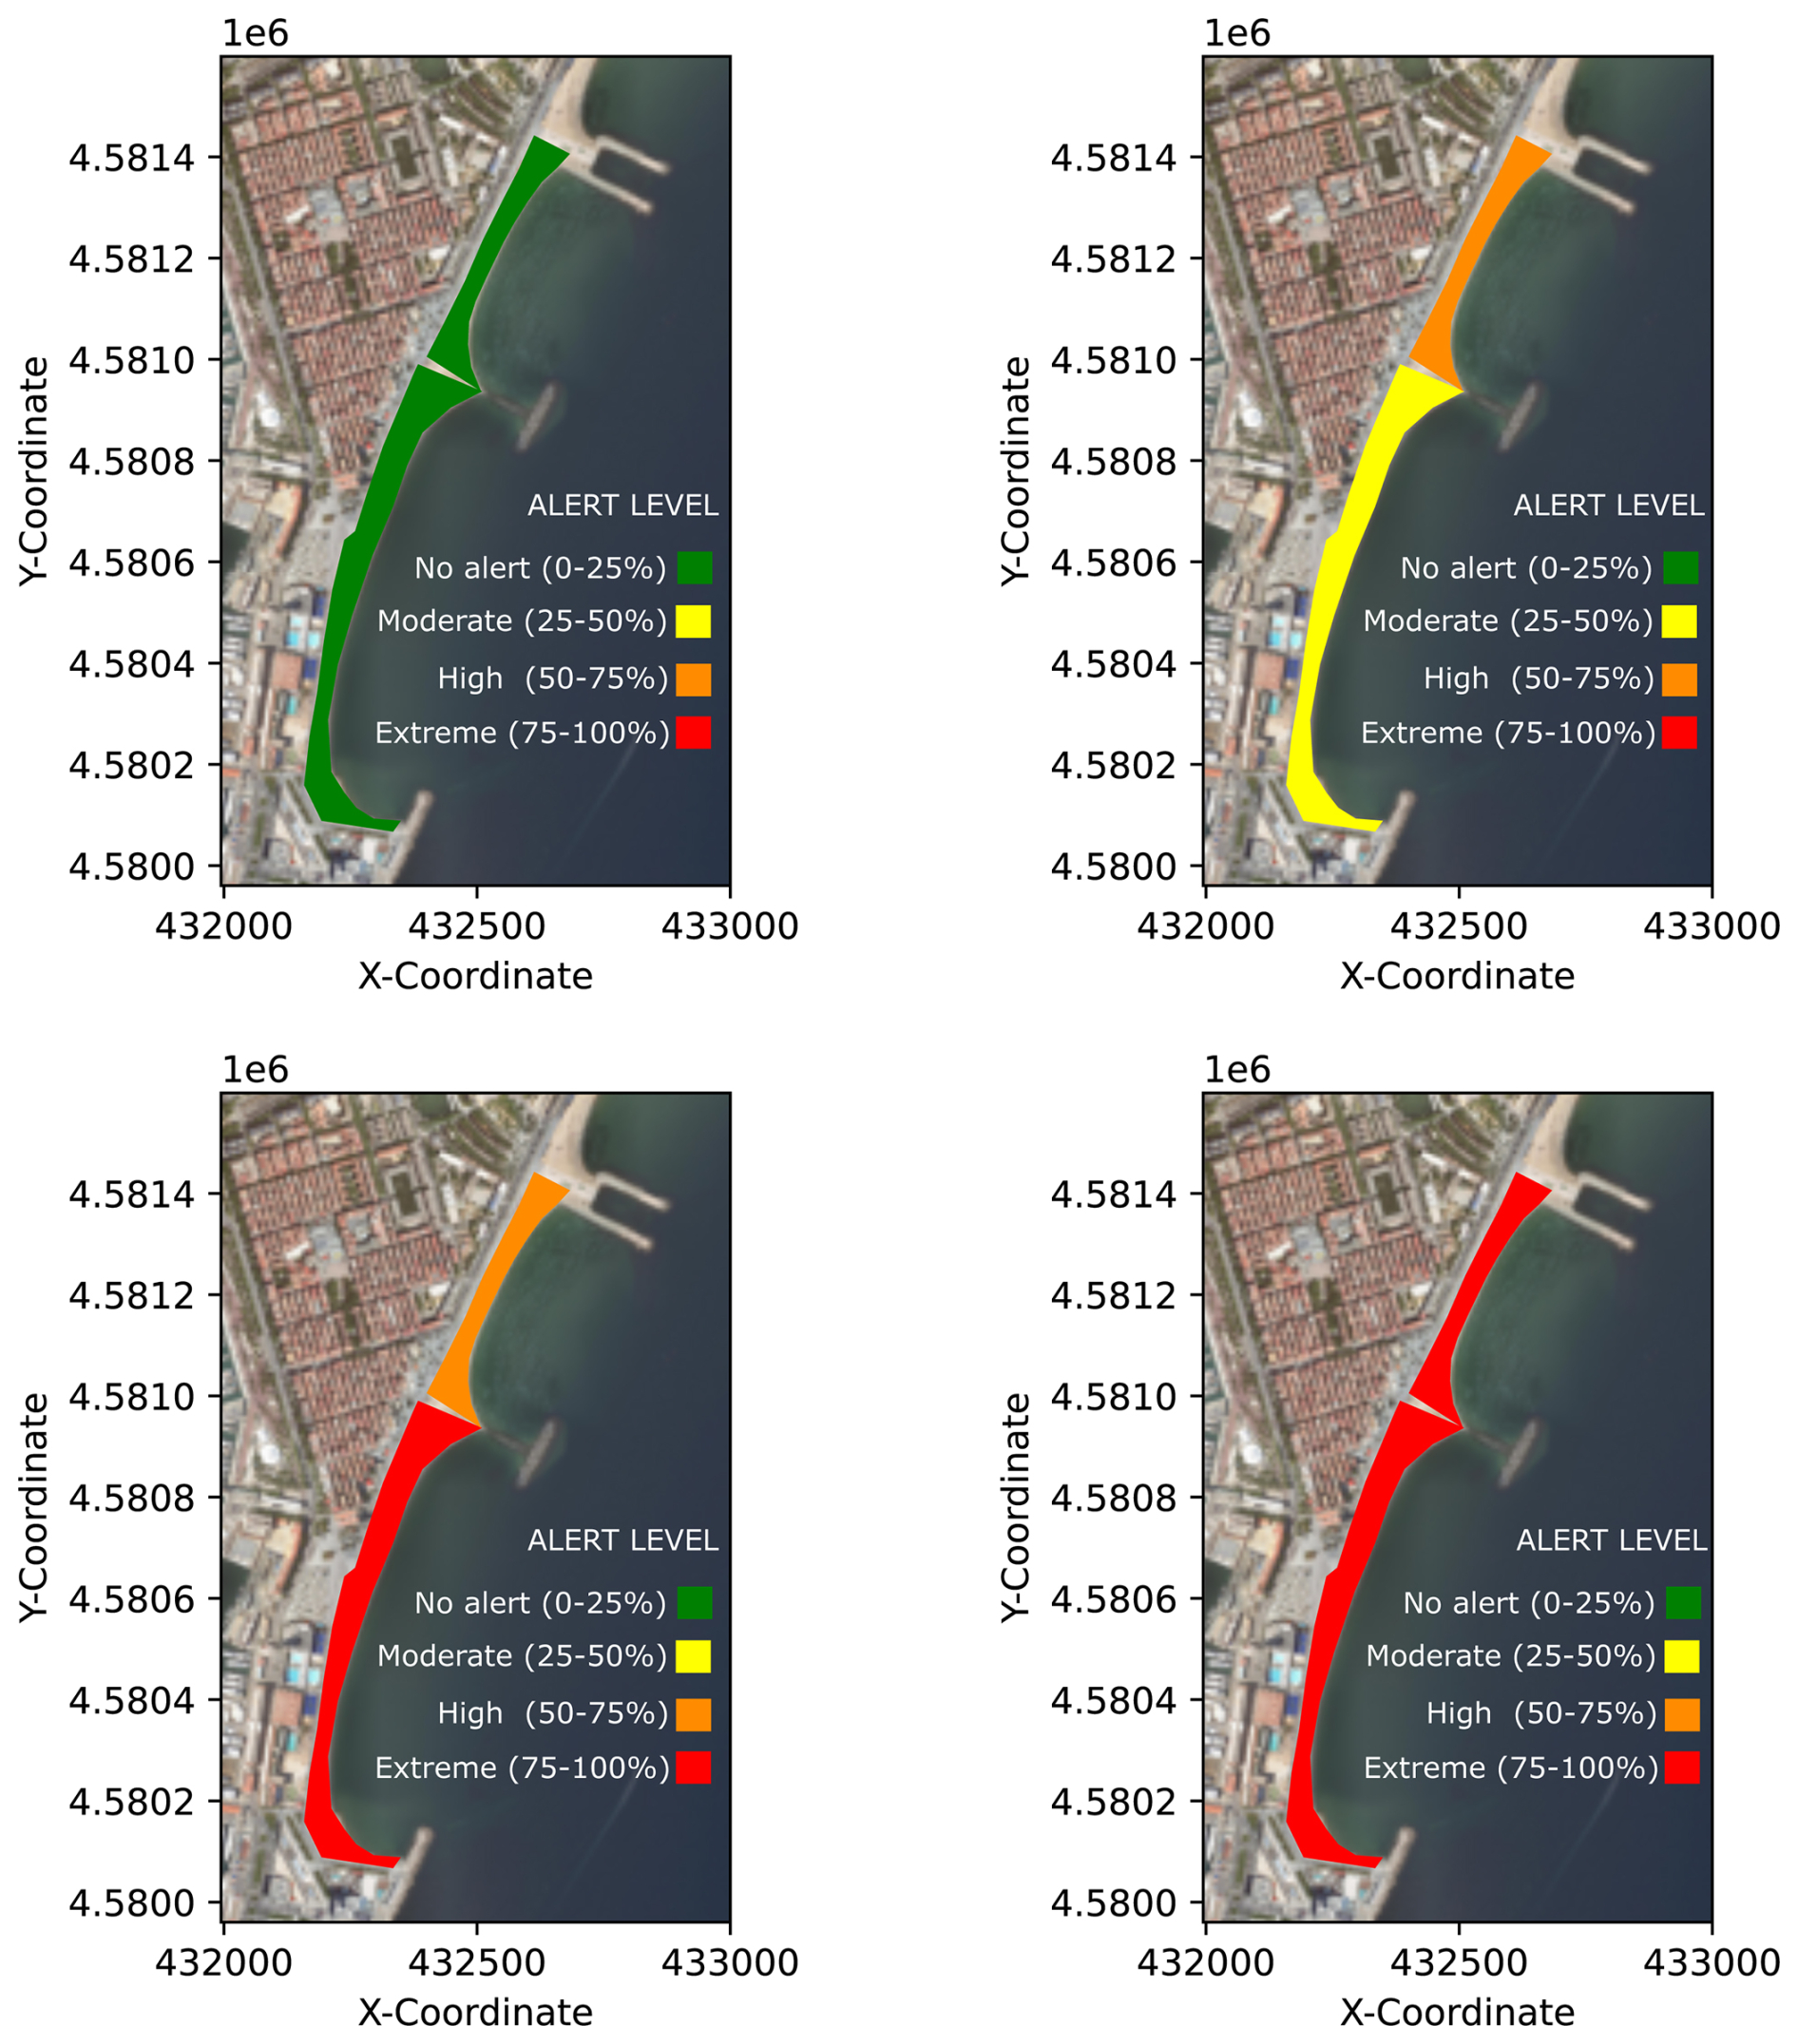
Figure 3Examples for different alert levels provided within the e-mail. Percentages represent total flooded area. From least to most impact: top left, top right, bottom left, and bottom right. Orthophoto obtained from the ICGC WMS.
Once the analysis of the XBeach results is completed, an e-mail is automatically sent to the selected recipients, which can be stakeholders, government authorities, or those responsible for the studied area. Each day, the user receives the status of the study area based on the described alert system, with the corresponding image as in Fig. 3. Within the e-mail, a graphical view of the flooded line for the forecast is also attached in order to ease the comprehension of the magnitude of the possible impact (Fig. 4). We chose to prioritise this output type over numerical information because users will find it easier to understand compared to statistical analysis of the event. Even so, additional metrics (e.g. total percentage of flooding or maximum flood extent in metres) could easily be included in the e-mail, and the format and type of data provided could be reviewed with the end-users to ensure that it meets their needs and expectations.
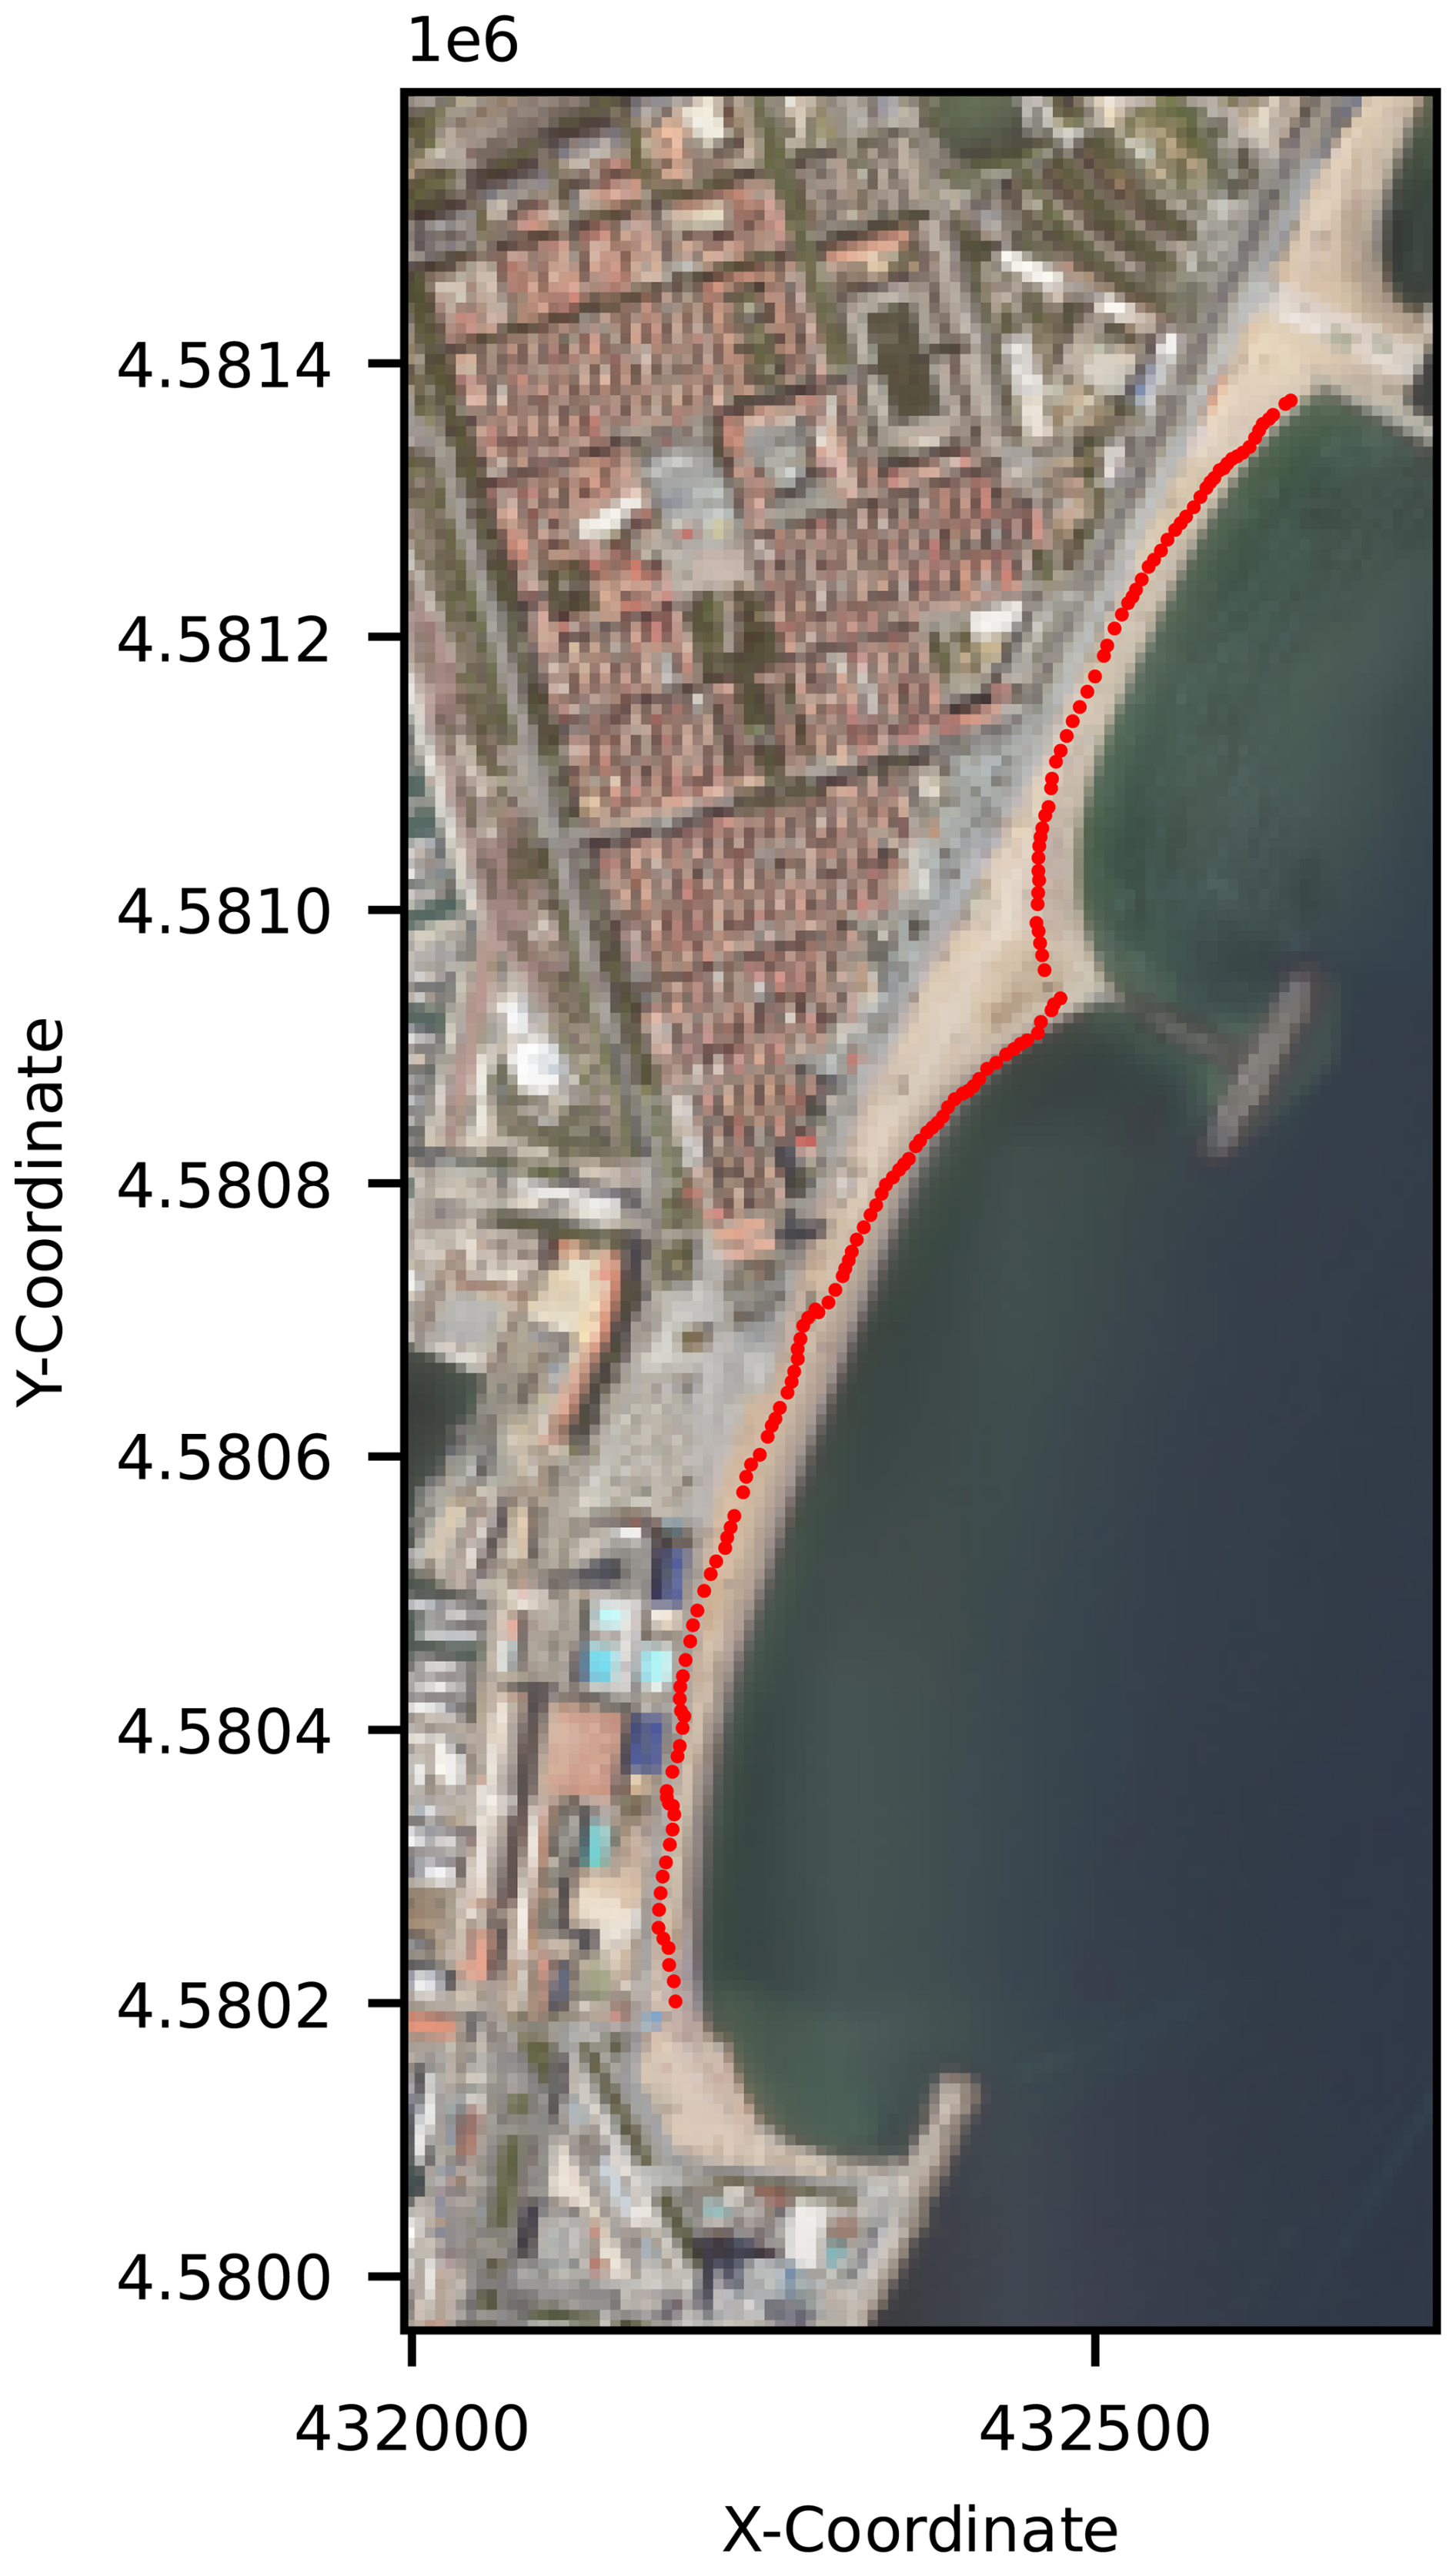
Figure 4Example of figure received within the e-mail showing the magnitude of flooding – in this case, for a high-intensity event. The red line shows the expected flooding line from the forecast. Orthophoto obtained from the ICGC WMS.
The explained workflow corresponds to the demonstration built to show the capacity of the operational service, but the developed strategy is fully adaptable and modular. The starting times, the total simulated days, the thresholds and analysis to determine if the alerts trigger, and the core of the sent e-mail, among all the other parts, can be totally changed, and more modules can be incorporated into the system. Figure 5 shows a complete synthesis of the operational chain, including inputs and the forecasting strategy for the current version.
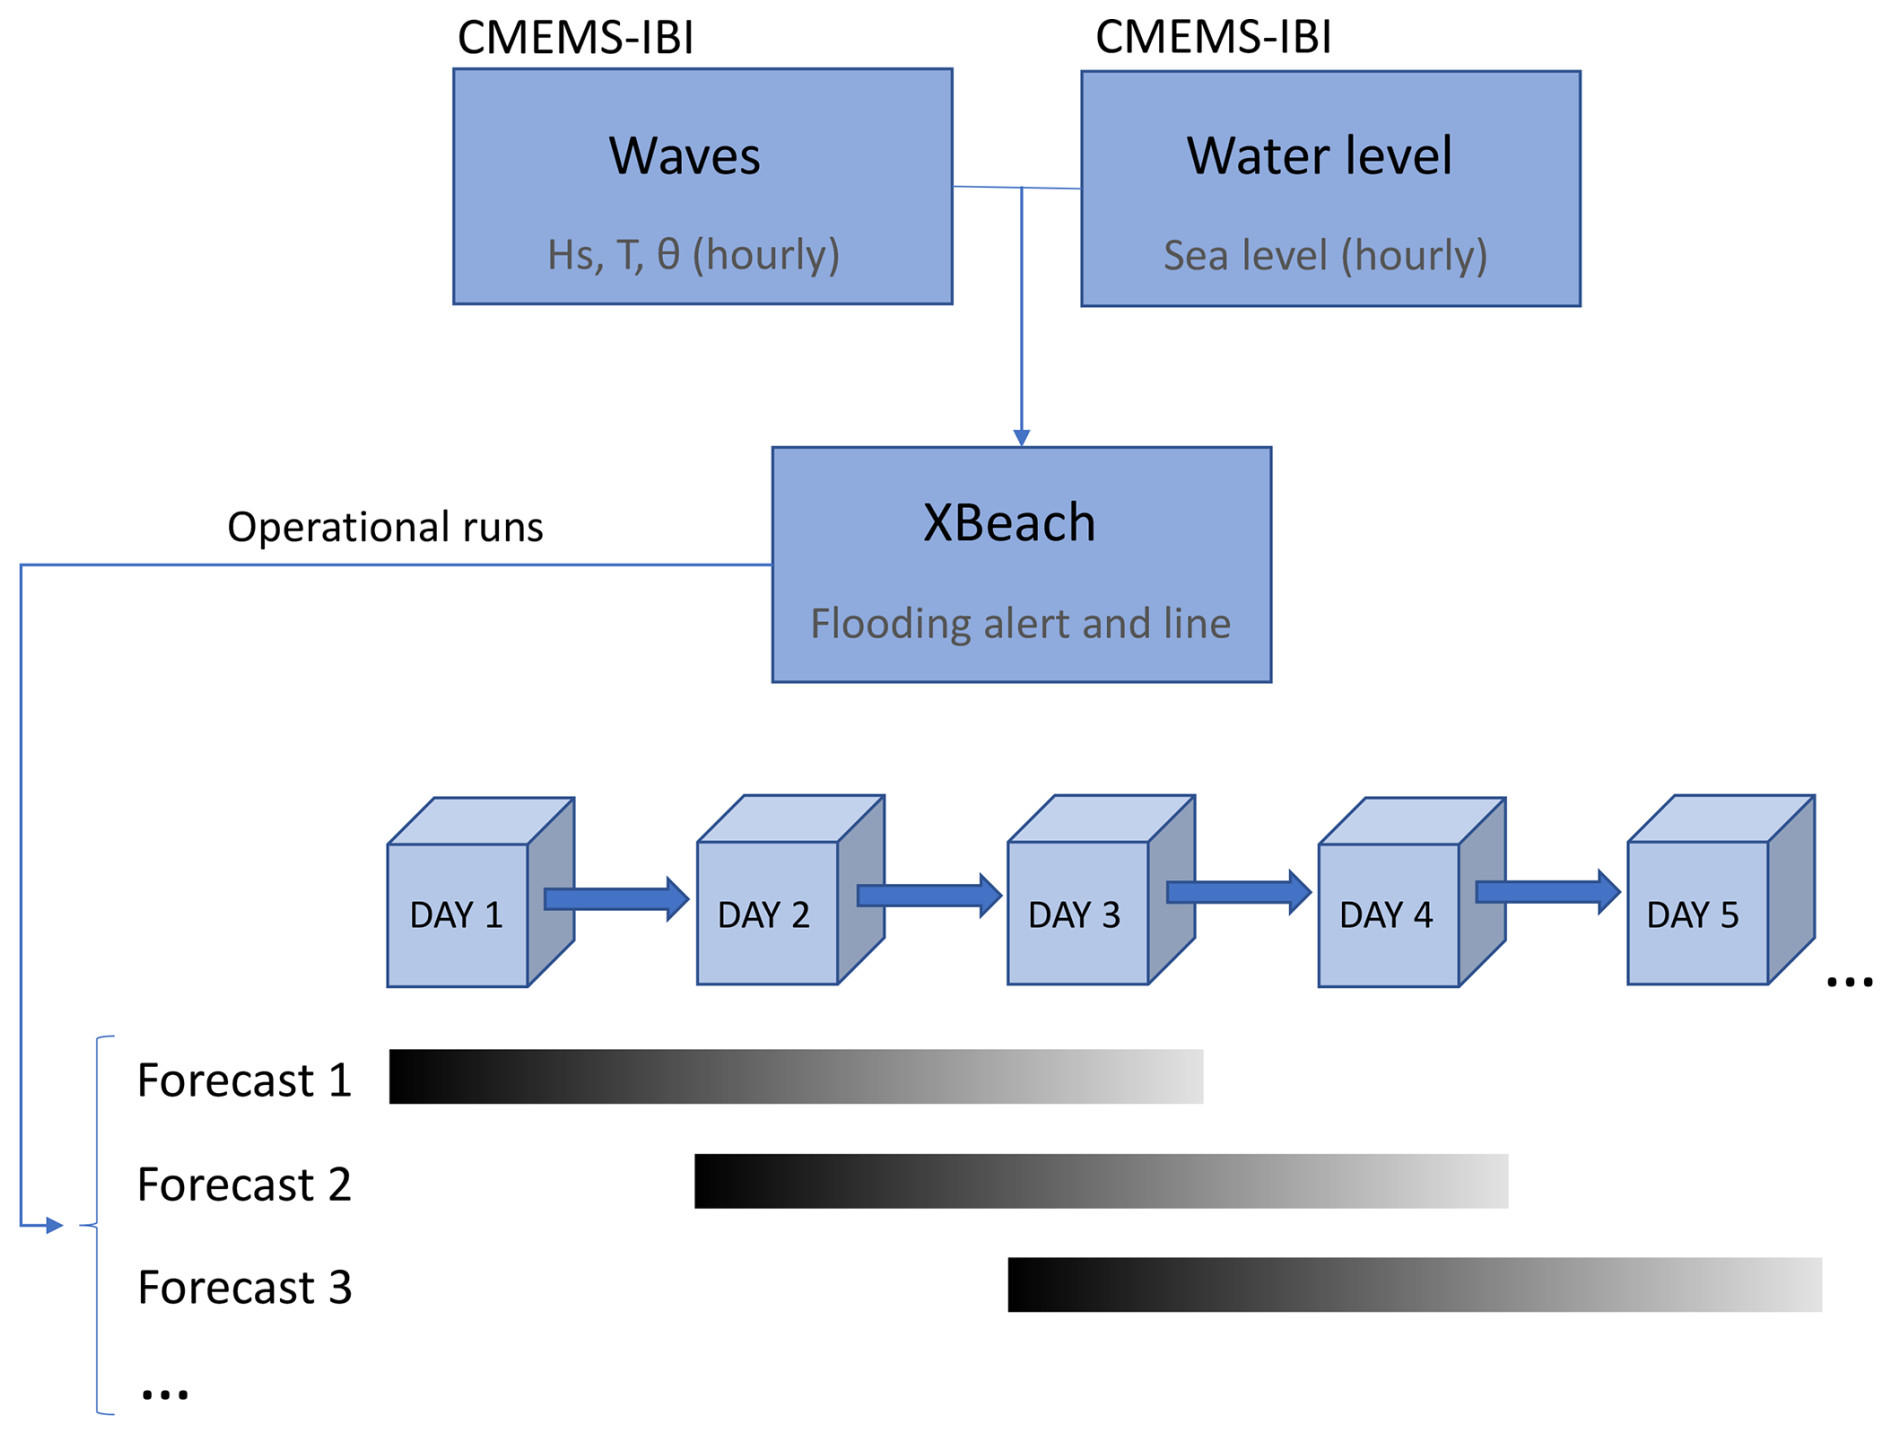
Figure 5Synthesis of the operational chain. Boxes refers to days of forecast. Horizontal bars define the 3 d forecasting simulations through XBeach model using CMEMS-IBI inputs. Grey scale shows qualitative approximation of the accuracy prediction, with black showing higher confidence and light grey showing lower confidence.
2.3 Validation strategy
The modelling part of the operational chain has to be validated with test cases beforehand to confirm that the results produced by XBeach accurately reproduce the real behaviour of the beaches. The XBeach model was originally designed for use in sandy beaches, as in the case study, and several papers have demonstrated the model's effective performance in these regions (Sánchez-Artús et al., 2023, 2024; Zhou et al., 2023; Roelvink et al., 2009; Carrion-Bertran et al., 2024), but a proper validation in each study area is needed to ensure the quality of the forecast. In this paper, we explore the validation for two different results.
First, the correct representation of the hydrodynamics based on wave height was verified using data from a field campaign conducted from 9 March to 27 April 2022 as part of the MARLIT project (MARLIT, 2021). In the campaign, two instrumented benthic tripods, each fixed to a concrete slab, were deployed at 8 and 13.4 m depth and will be referred hereinafter as T1 and T2, respectively. T1 was located at the coordinates 41°22.454′ N and 2°11.602′ E, whereas T2 was deployed at 41°22.472′ N and 2°11.712′ E. Wave height, period, and direction were acquired hourly by means of two acoustic current profilers (ADCPs). T1 was mounted on a Nortek Aquadopp 2 MHz placed 0.8 m above the bottom, whereas a Nortek AWAC 1 MHz ADCP® was installed 1 m above the bottom at T2. During the field campaign, data from a storm named Celia were recorded (Fig. 6). This event exhibited a significant wave height (Hs) at the peak of about 4 m and an associated peak period (Tp) of 10 s, with an almost constant wave direction of about 120° at both deployments. The 15 d storm caused significant coastal flooding on the beaches, damaging infrastructure such as beach bars and showers, displacing sand onto the promenade, and prompting the placement of sandbags to mitigate further damage, as illustrated in Fig. 1c and d. Additionally, two minor storms, occurring from 11 to 14 April and from 20 to 22 April, originating from the east and east–northeast, respectively, were recorded at the end of the campaign. However, these were excluded from the study due to their low wave heights. Figure 6 shows the wave conditions observed throughout the entire period. In addition, two topobathymetric surveys were conducted: the first on 4 March, just before the start of the hydrodynamic measurements, and the second on 24 April, at the end of the campaign. A small vessel equipped with a multi-beam echo sounder was used for the bathymetry, providing data with a horizontal resolution of 1 m. The emerged part was surveyed using an electronic total station by taking measurements along transects perpendicular to the beach, spaced approximately 10 m apart. After field collection, data were transferred into a geographic information system (GIS) to generate a high-resolution digital terrain model (DTM), which, after post-processing, was converted into the mesh described in Sect. 2.2.
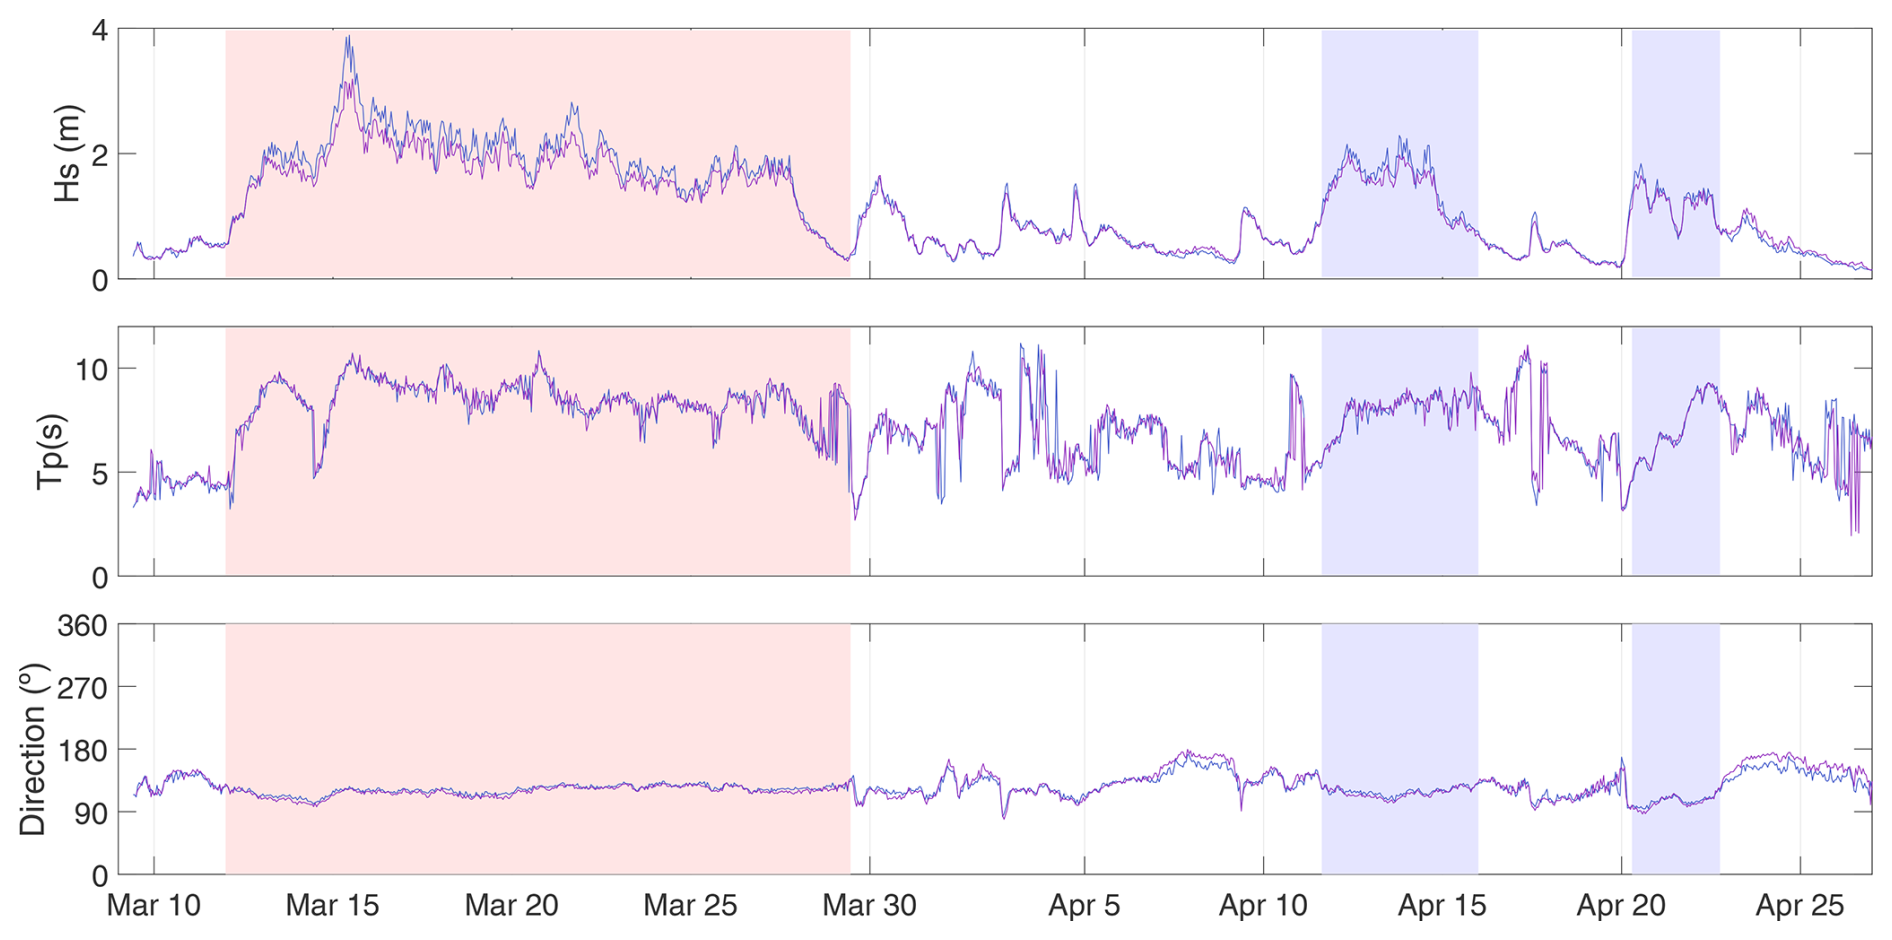
Figure 6Hydrodynamic analysis of the campaign. Blue line corresponds to T1, and purple line corresponds to T2. Red rectangle shows the period when Storm Celia hit the coast. Blue rectangles show the two minor storms that occurred during the campaign period.
Then, as the main focus of the operational alert, the model's flooding output was compared with videometry technology. Cameras have the advantage over satellite data in that, if the optical sensor is not heavily covered by rain, it is possible to define the flooding lines in storm conditions. Meanwhile, in the satellite data, clouds typically appear during these periods, making it impossible to detect them. Besides, cameras are able to provide a higher frequency of images for the study area, which improves monitoring. Therefore, for calm periods, both approaches are appropriate, but for validation of high-intensity events, which is the main aim of the study, data from cameras work better.
Images from one of the cameras from the fixed coastal video monitoring station in the city of Barcelona are considered in this work (Fig. 7, http://coo.icm.csic.es/, last access: 25 May 2024) for the validation. This station, placed 142 m above mean sea level, has provided overviews of Barcelona beaches since 2001. The original set of five cameras (Ojeda and Guillén, 2008) was replaced in 2015 by a set of six cameras of higher resolution. The only camera providing overviews of the beaches of interest in this work (SMSS and Barceloneta, Fig. 7) has a resolution of 2452 × 2056 pixels2 and provides snapshots that are 10 min time averaged (timex) and hourly variance images. The pixel footprint for the beaches of interest is, in the farthest part of the study area (SMSS), ∼ 0.6 m in the cross-shore direction, the one of most interest, and ∼ 4.5 m in the alongshore direction. The resolution improves for Barceloneta, closer to the station, up to ∼ 0.3 m in the cross-shore direction and up to ∼ 0.6 m in the alongshore direction. The cameras have been calibrated hourly using the automatic calibration methodology presented by Simarro et al. (2021) to avoid detected and significant changes in calibrations within a given day (mainly due to the dilatation of the building where the cameras are placed or due to undesired sudden changes). For this study, these timex images were used to determine flooding lines, defined as the maximum flooding observed in each image. Lines were manually digitised using Python scripts, with points being selected and then converted to pixel coordinates. The calibration of the cameras allows us to transform these pixel coordinates of the shoreline into real-world coordinates, provided that z, defined as the water level resulting from both meteorological and tidal forcings, is known at the shoreline. To facilitate this transformation, ULISES (Simarro et al., 2017), an open-source software developed for extrinsic calibration and the generation of plan views in coastal monitoring systems using videos, and related codes (https://github.com/Ulises-ICM-UPC, last access: 26 June 2024) were used.
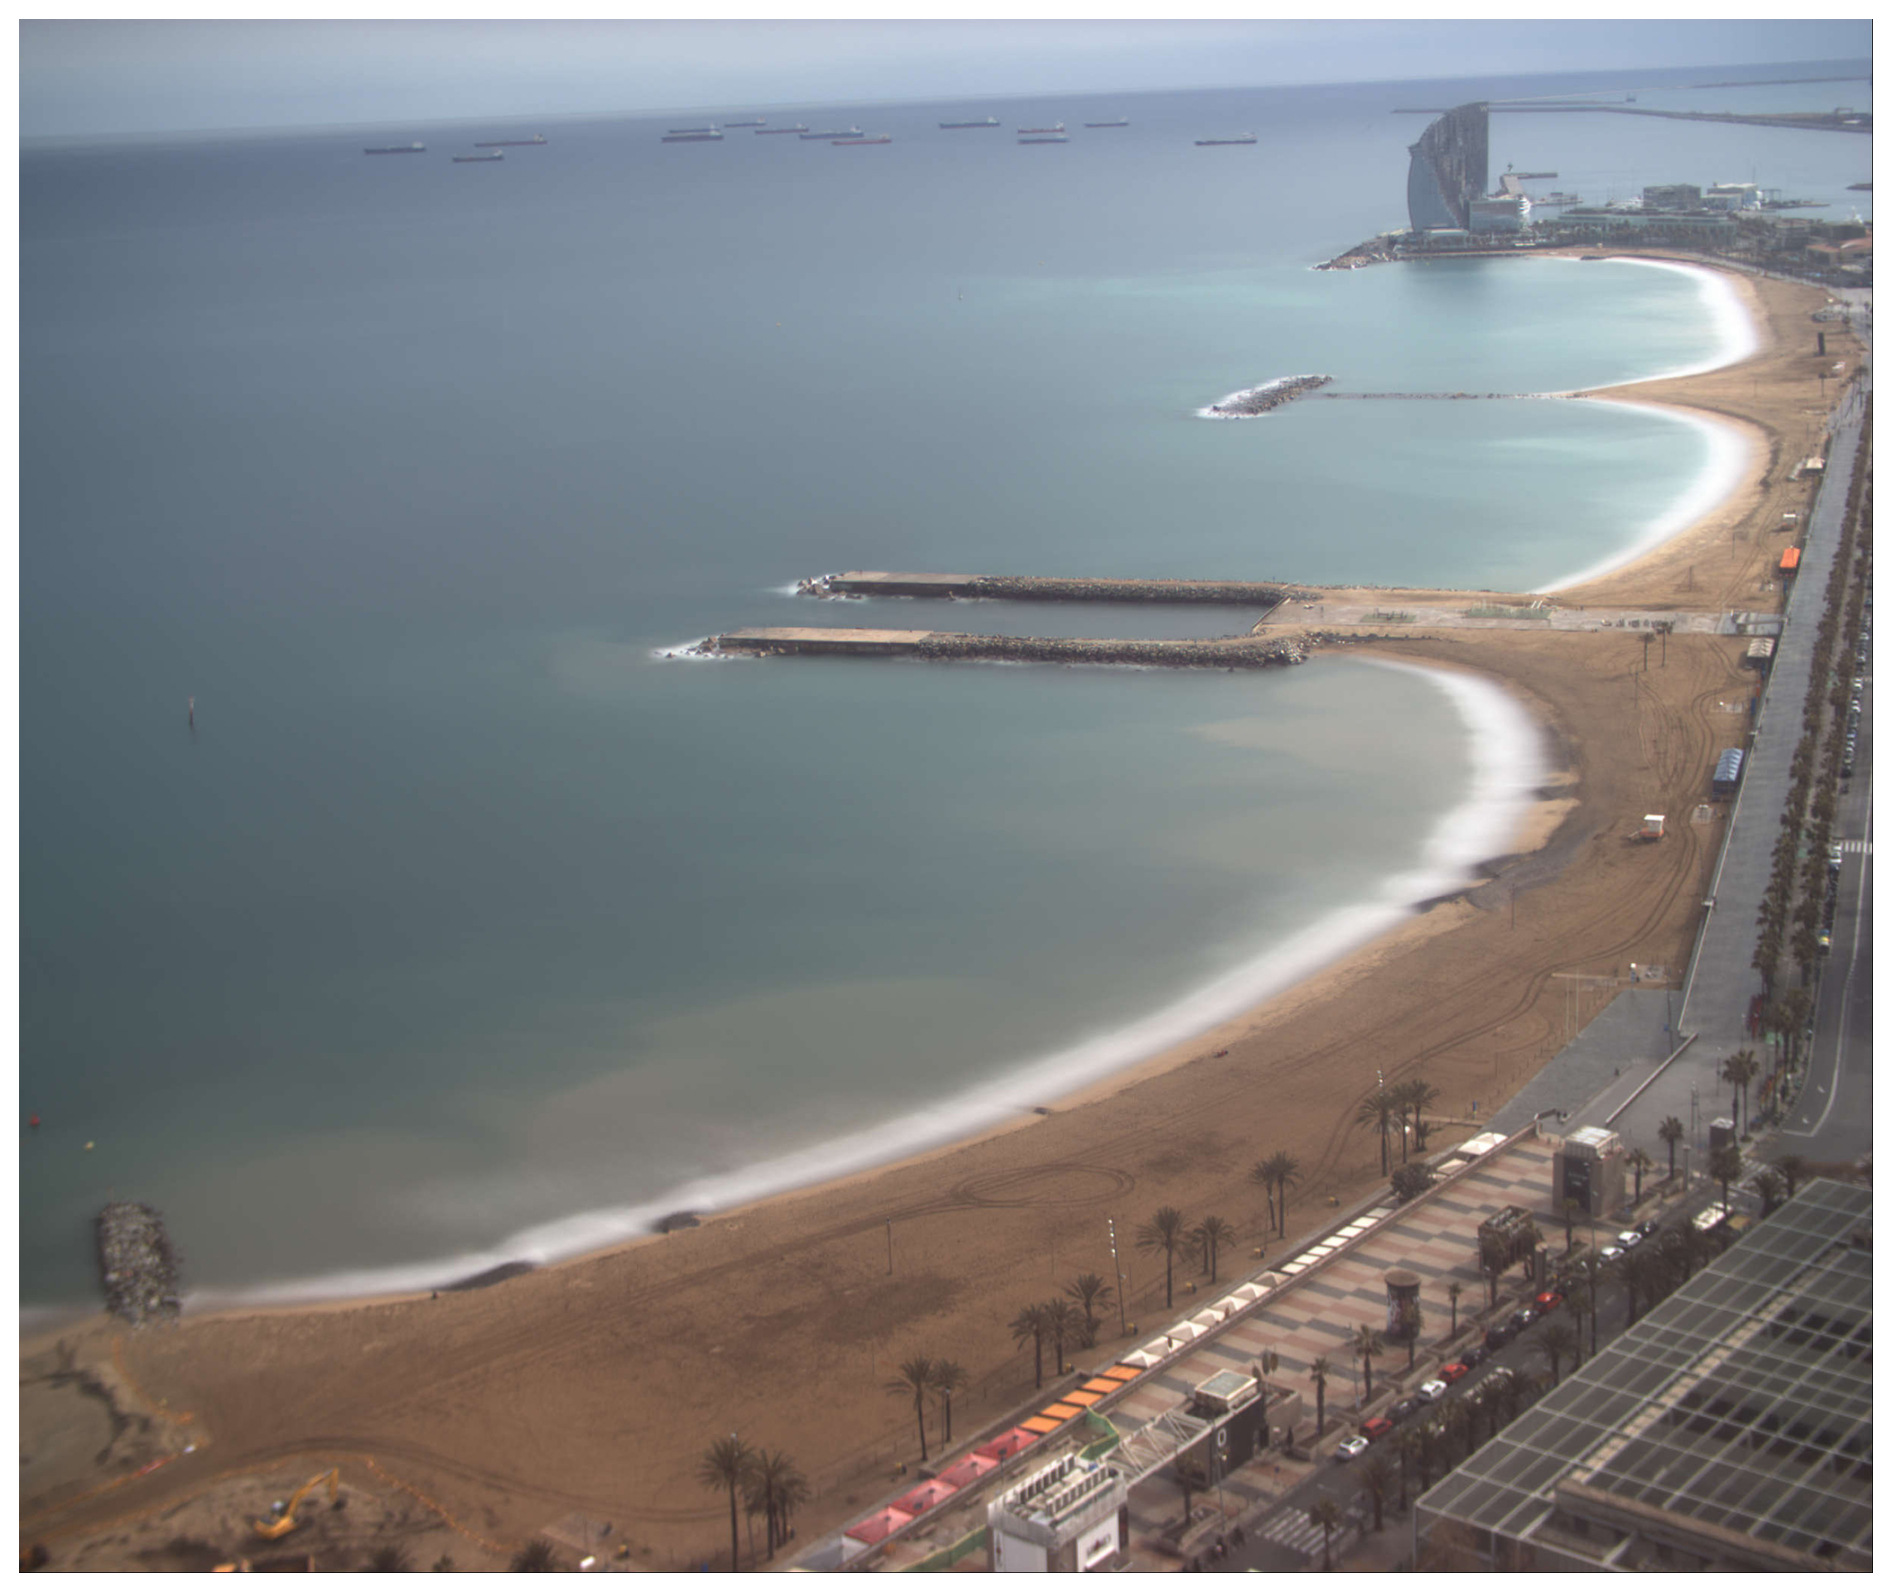
Figure 7Time-averaged (timex) image corresponding to 3 April 2022. From top to bottom: SMSS and Barceloneta, which is the study area of the work, and Somorrostro.
For each type of validation, different error metrics were considered based on data characteristics. The hydrodynamic model's performance was calculated through the root mean square error (RMSE), the mean bias error (MBE), and the skill score assessment index (SK) (Eqs. 2, 3, and 4). RMSE is a widely used and reliable metric for assessing the relationship between two data series, making it an appropriate choice for evaluating these types of results and models; MBE provides additional insight by quantifying the systematic tendency of the model to overestimate or underestimate observations (Williams and Esteves, 2017; McCall et al., 2014; Matias et al., 2019); and SK presents the agreement in a range from 0 to 1, with 0 being a complete disagreement and 1 being a perfect match between the model and observations (Willmott, 1981). The analysis considered Storm Celia as it is mainly responsible for the changes relevant to the objective of the forecast. In the formulas, the predicted value obtained from the model (Pi) is compared with the observed value from the deployment (Oi) for each point i in the time series, with n representing the total number of points. For SK analysis, the mean values for the observations (with the overbar ) are also considered.
To validate flooding, pre-processing was required before comparing the model and camera data for two reasons. First, the camera data covered a larger area than the model data, and so the lines were adjusted to have the same starting and ending points. Second, the datasets differed in terms of the number of data points, with one dataset containing fewer samples than the other, making direct comparison challenging. To address this, the number of points defining each line was resized to coincide between datasets, following the recommendations for such cases (Japkowicz, 2000). After these steps and because the flooding lines and points were defined in a 2D spatial field, the Euclidean distance was used to analyse the differences between both observed and modelled results. Based on these values, the averaged Euclidean distance was computed using Eq. (5). In this equation, n represents the total number of points, and p1 and q1 represent the x coordinates while p2 and q2 represent the y coordinates of the points (p) and (q), respectively. The averaged distance represents an error metric of the model performance.
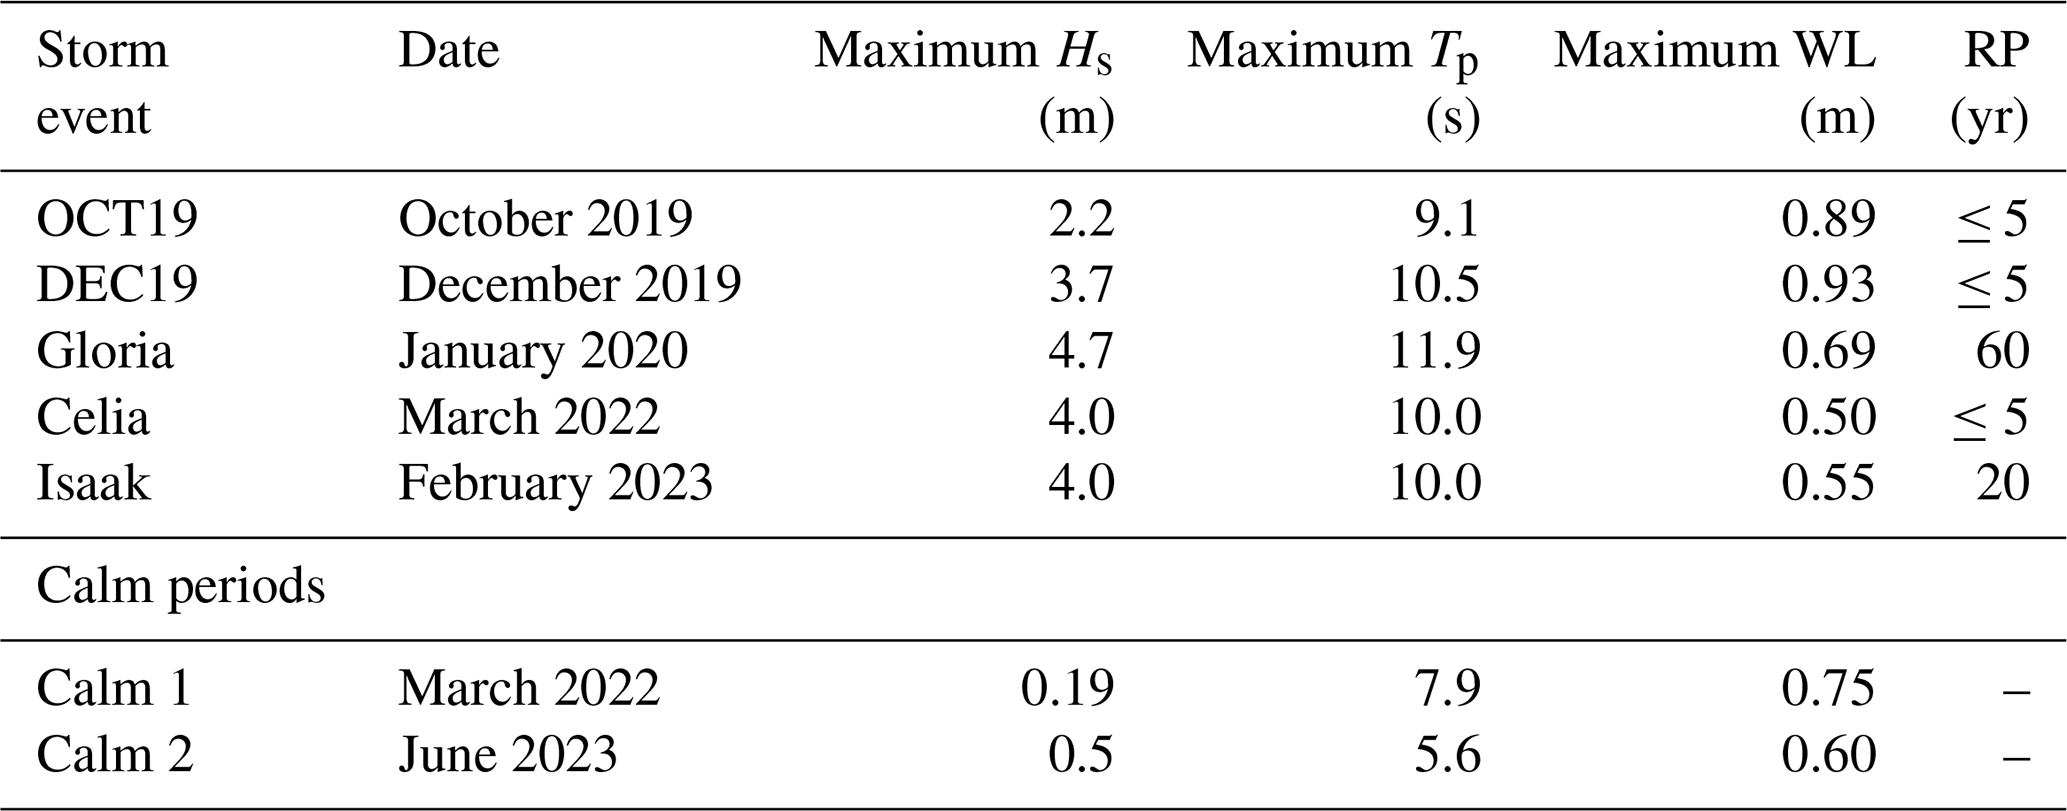
In addition to Storm Celia, which was used for both hydrodynamic and flooding validation, other storms were tested to enhance confidence in the model's flood results. These storms were documented by newspapers, and the flooding magnitude captured by the camera was examined. Table 1 provides a summary of the storm characteristics, including their storminess, expressed in terms of return period (RP) using data from the “Barcelona II” buoy managed by Puertos del Estado, which provides a longer time series. Scenarios with significant flooding were selected as validation cases, ensuring that various years were accurately represented and avoiding the selection of storms from only 1 or 2 years. Also, to enrich the study, two different calm periods were tested, one close to the time of the topobathymetry realisation and another from a year later, to observe changes in the coastline position (see Table 1).
Table 1Characteristics of the storm and calm events studied at the CMEMS reference point (R1).
3.1 Hydrodynamic validation
Figure 8 illustrates the comparison between the model results and observed values from both field campaign deployments T1 and T2 (Fig. 1) during Storm Celia. At T2, the one placed deeper, the model shows a closer match with the observed data at the storm's peak, whereas, for T1, the shallower one, it underestimates the wave height slightly. This underestimation pattern remains consistent throughout the entire event, as evidenced by the negative MBE of −0.43 m for T1 and −0.25 m for T2, and has also been observed in previous studies (De Beer et al., 2021; Oliveira et al., 2020; Buckley et al., 2014). Despite this, the discrepancies for both deployments are mainly observed during the setup and end phases of the storm, with the peak, typically associated with maximum flooding, being the most accurately represented. Quantitatively, the analysis obtained an RMSE of 0.33 m at T2, while, at T1, it increased to an RMSE of 0.49 m for the period corresponding to the storm passing. For SK analysis, T2 achieved a value of 0.86 out of 1, and for T1, it decreased until 0.80. However, both values still represent a great agreement between the model and the observed data (see Fig. 8).
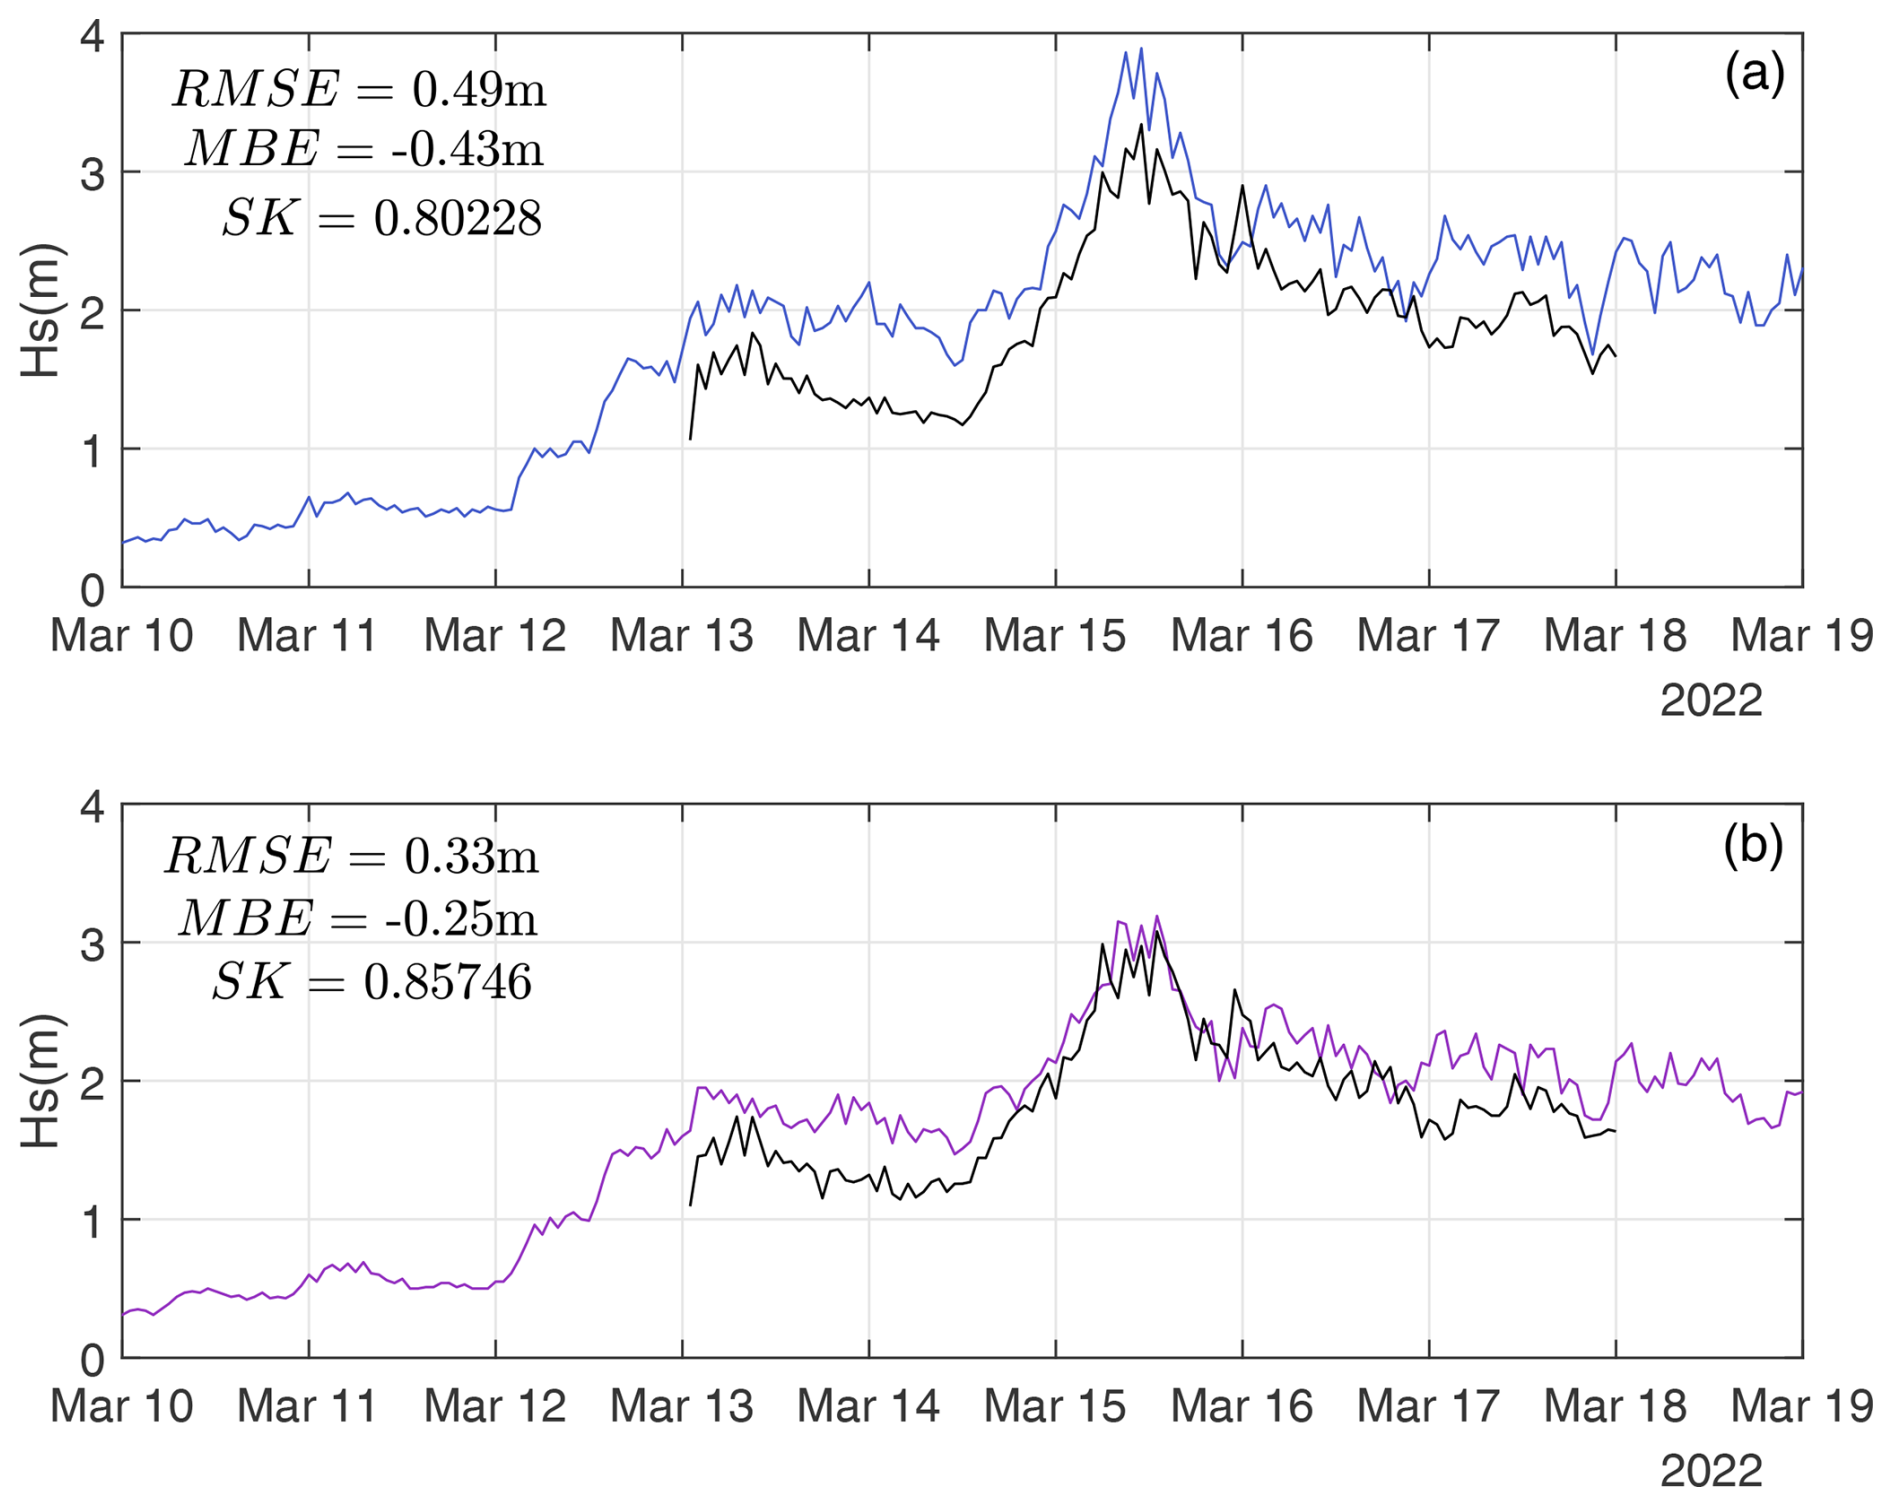
Figure 8Hydrodynamic response validation of the model. Top panel and the light-blue line correspond to T1, while bottom panel and purple line correspond to T2. Black lines show the model output for each point.
3.2 Flooding validation and sensitivity analysis
Figure 9 presents the flooding lines obtained from both the videometry and the model for SMSS and Barceloneta during the studied storm events. Figure 10 presents these results for both SMSS and Barceloneta under the calm-condition scenarios. Additionally, Table 2 summarises the averaged Euclidean distances obtained from the comparison between videometry and the model using Eq. (5) for all the studied cases.
In the context of Storm Celia, which hit the coast only 10 d after the collection of the topobathymetric data on 4 March, the comparison depicted in Fig. 9 reveals a strong correlation between the model and the camera across SMSS, as well as for Barceloneta. Supporting this observation, Table 2 provides quantitative evidence, with values from the Euclidean distance analysis of 2.7 m for SMSS and 2.9 m Barceloneta. Given the 5×5 m mesh resolution, this error is considered to be sub-pixel, suggesting that further theoretical improvements may not lead to real enhancement in the accuracy.
For the other studied storms, similar patterns emerge, as depicted in Fig. 9 for SMSS. The qualitative alignment, relevant for decision-making in the operational chain as a visual component, demonstrates a consistent match between both datasets. Notably, discrepancies tend to appear at the extremities of the beaches, while the central areas exhibit the highest coherence between videometry data and the model. Specifically, the biggest differences are observed for Storm Gloria, which happened 2 years before the topobathymetry gathering. Additional causes were the difficulty in simulating this long and extremely high-intensity event, along with the challenge of precisely defining the flooding line from the cameras due to heavy rain obscuring the lens and resulting in poor visibility. Two different time frames were simulated in an attempt to achieve more stable results, but the mentioned issues persisted in both study periods. The other storms exhibit a strong correlation between the camera and model results, with smaller distance discrepancies for storms closer to the topobathymetry gathering. As shown in Table 2, Storm Celia had the best approximation, followed by Isaak (which occurred 1 year after the topobathymetry collection), both achieving sub-pixel accuracy. Conversely, the accuracy decreased for storms that were farther away, with the OCT19 storm of 2019, 3 years before the gathering, showing the highest Euclidean distance value of 12 m, excluding Storm Gloria.
For Barceloneta, as can also be seen in Fig. 9, the behaviour is similar to that for SMSS. In this case, discrepancies generally do not exceed twice the mesh resolution (i.e. 10 m), except in the case of Storm Gloria. Comparing with SMSS, Barceloneta better catches the flooding extent for all the studied storm scenarios, except for Celia, where, as explained before, sub-pixel accuracy does not determine a difference between these values. Besides, the same pattern is observed where the model seems to underestimate the southern part of the beach flooding while overestimating the flooding in the northern parts. For the central parts, the correlation is the highest, as can be observed in Fig. 9.
Calm conditions, as shown in Fig. 10 for both studied cases, show a good visual correlation. The greatest differences were observed for Barceloneta during the calm conditions of June 2023, followed by SMSS for the same period. In contrast, the accuracy obtained for the calm scenario closer to the topobathymetry gathering was sub-pixel, following the same pattern as for storm conditions, as can be seen in Table 2. In this case, since the waves do not greatly affect the dynamics and because the flooding is minimal, the differences between the model and the camera are more homogeneous for Barceloneta, with the model consistently overestimating the coastline alongshore. For SMSS, although the overall correlation is higher, the model seems to slightly overestimate the camera at the beach extremities, while the centre shows the best match.
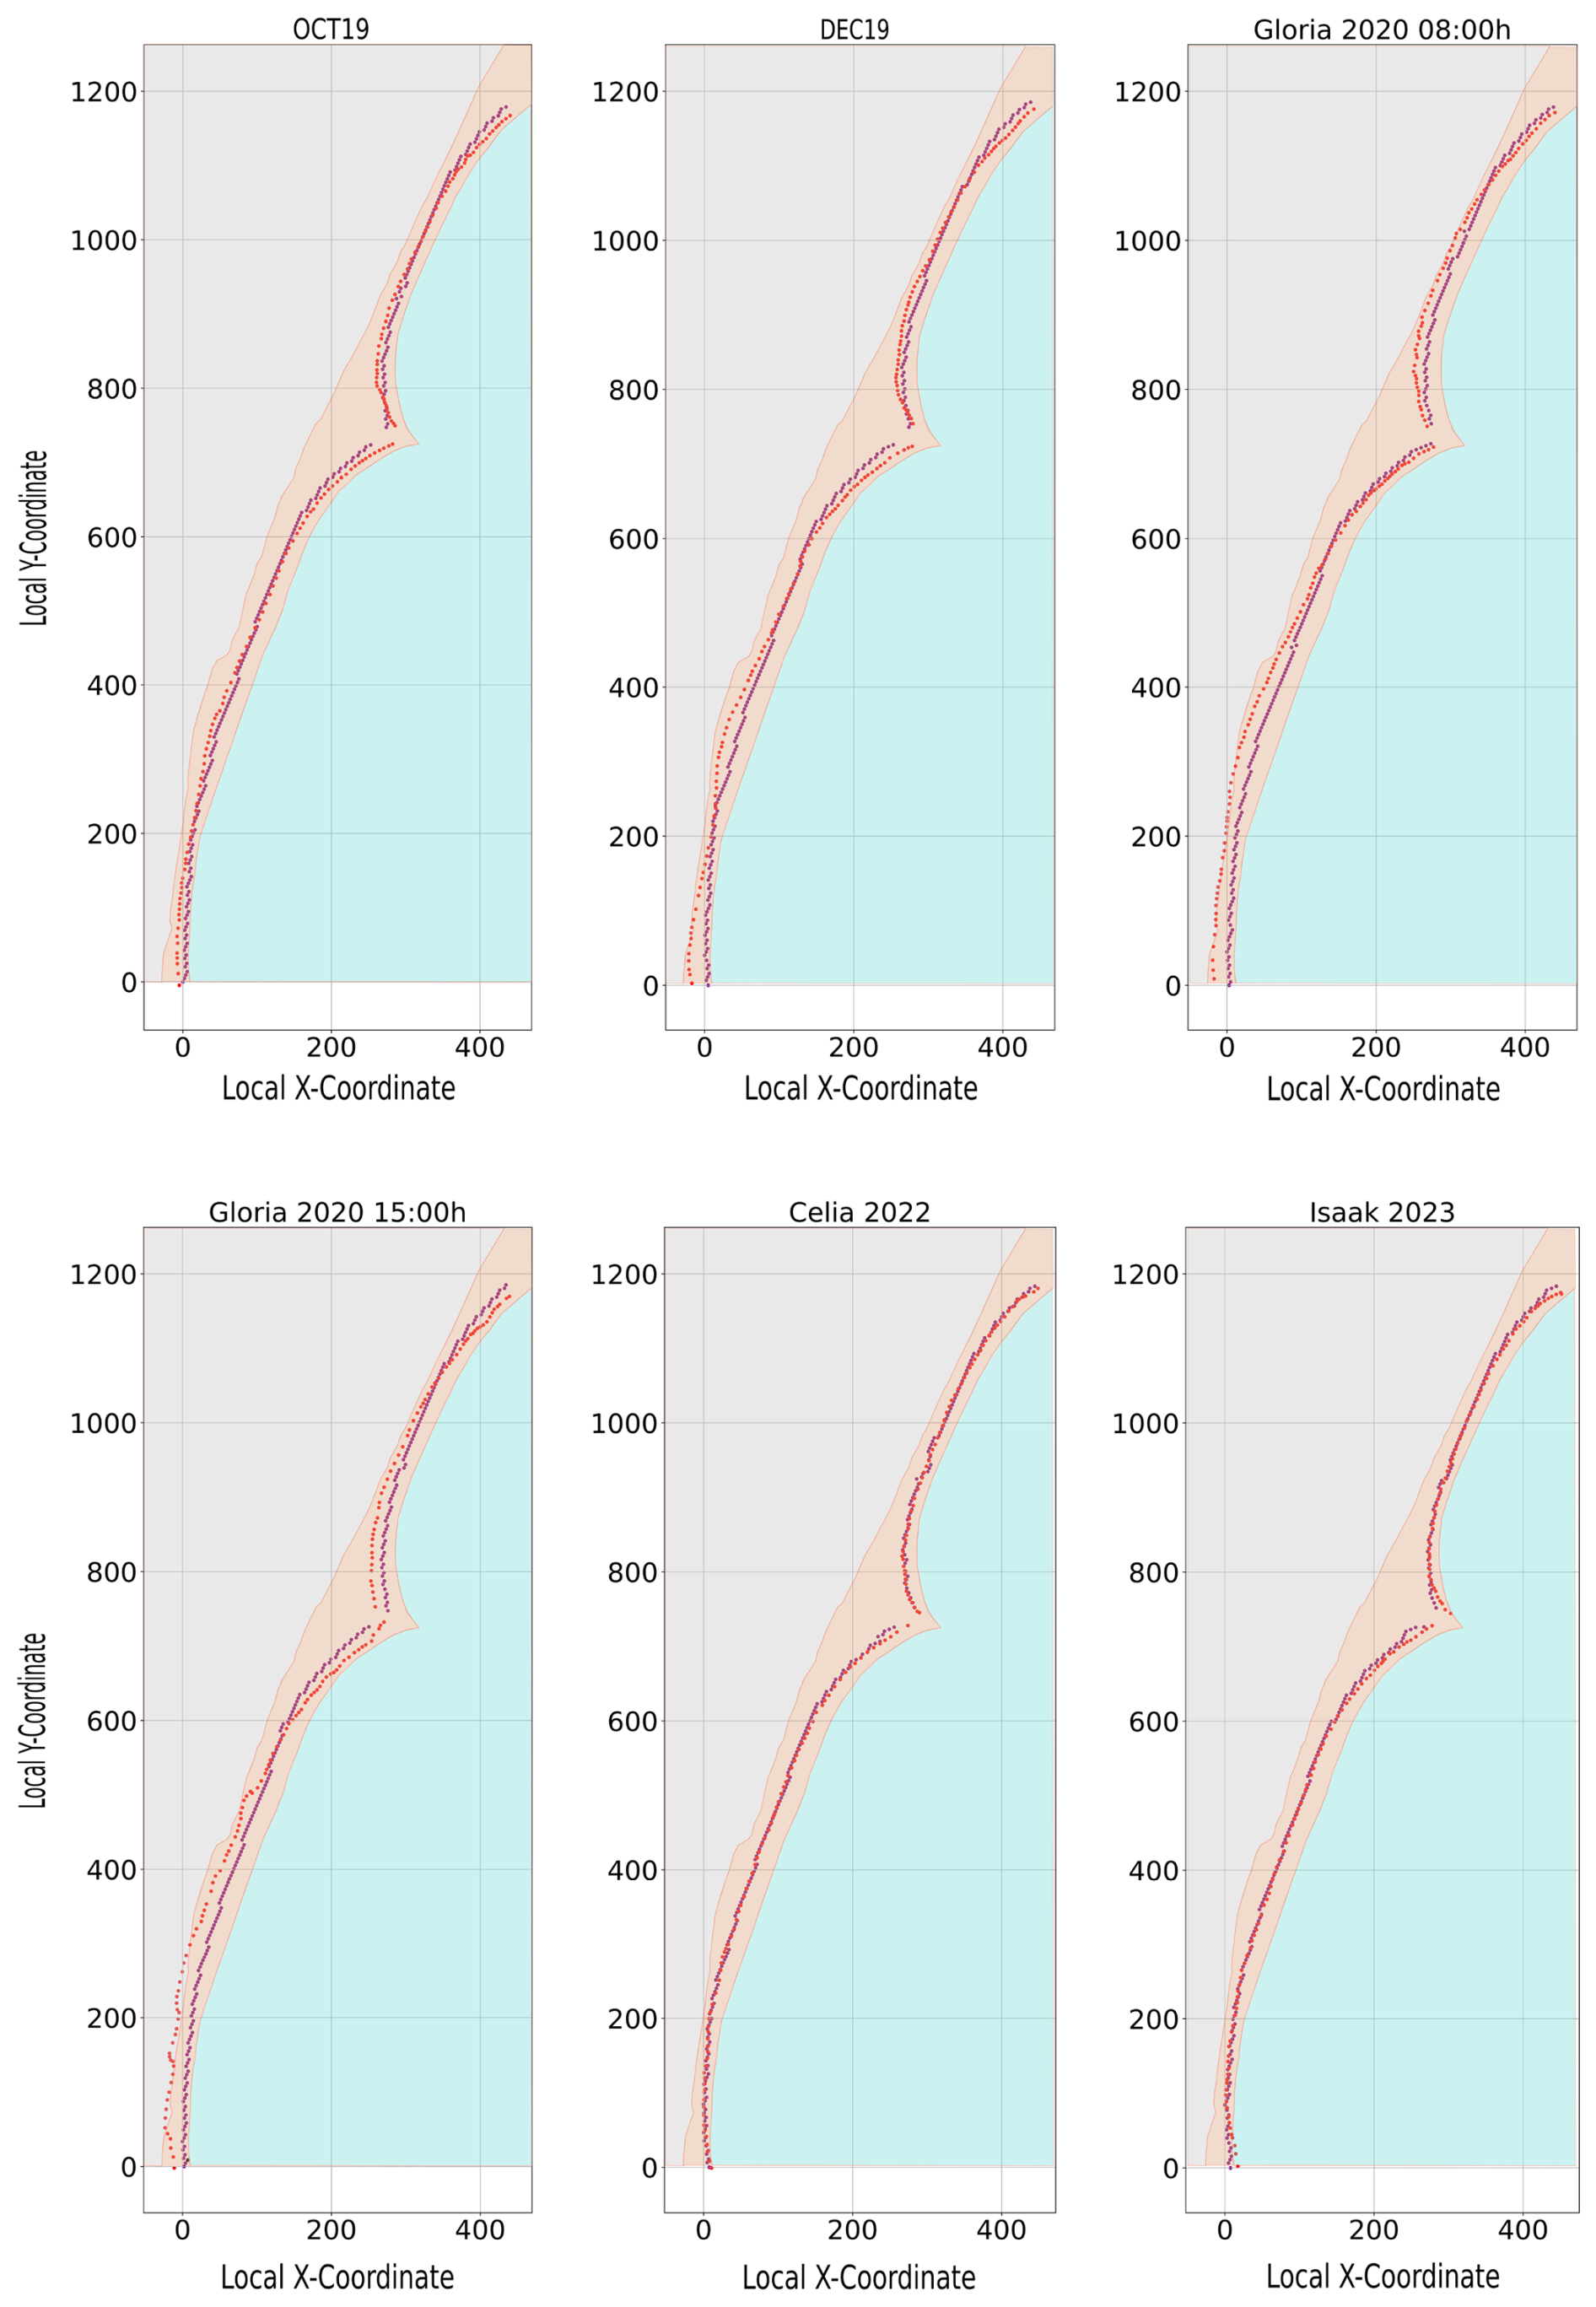
Figure 9Comparison of the flooding for selected storm events. In purple, model results; in red, videometry. Light-brown polygon indicates the extent of the beaches, blue represents water, and grey denotes the promenade and the city. Local axes are used, with distances measured in metres.
Table 2Euclidean distance, in metres, for each of the storm and calm conditions, separated for both studied areas.
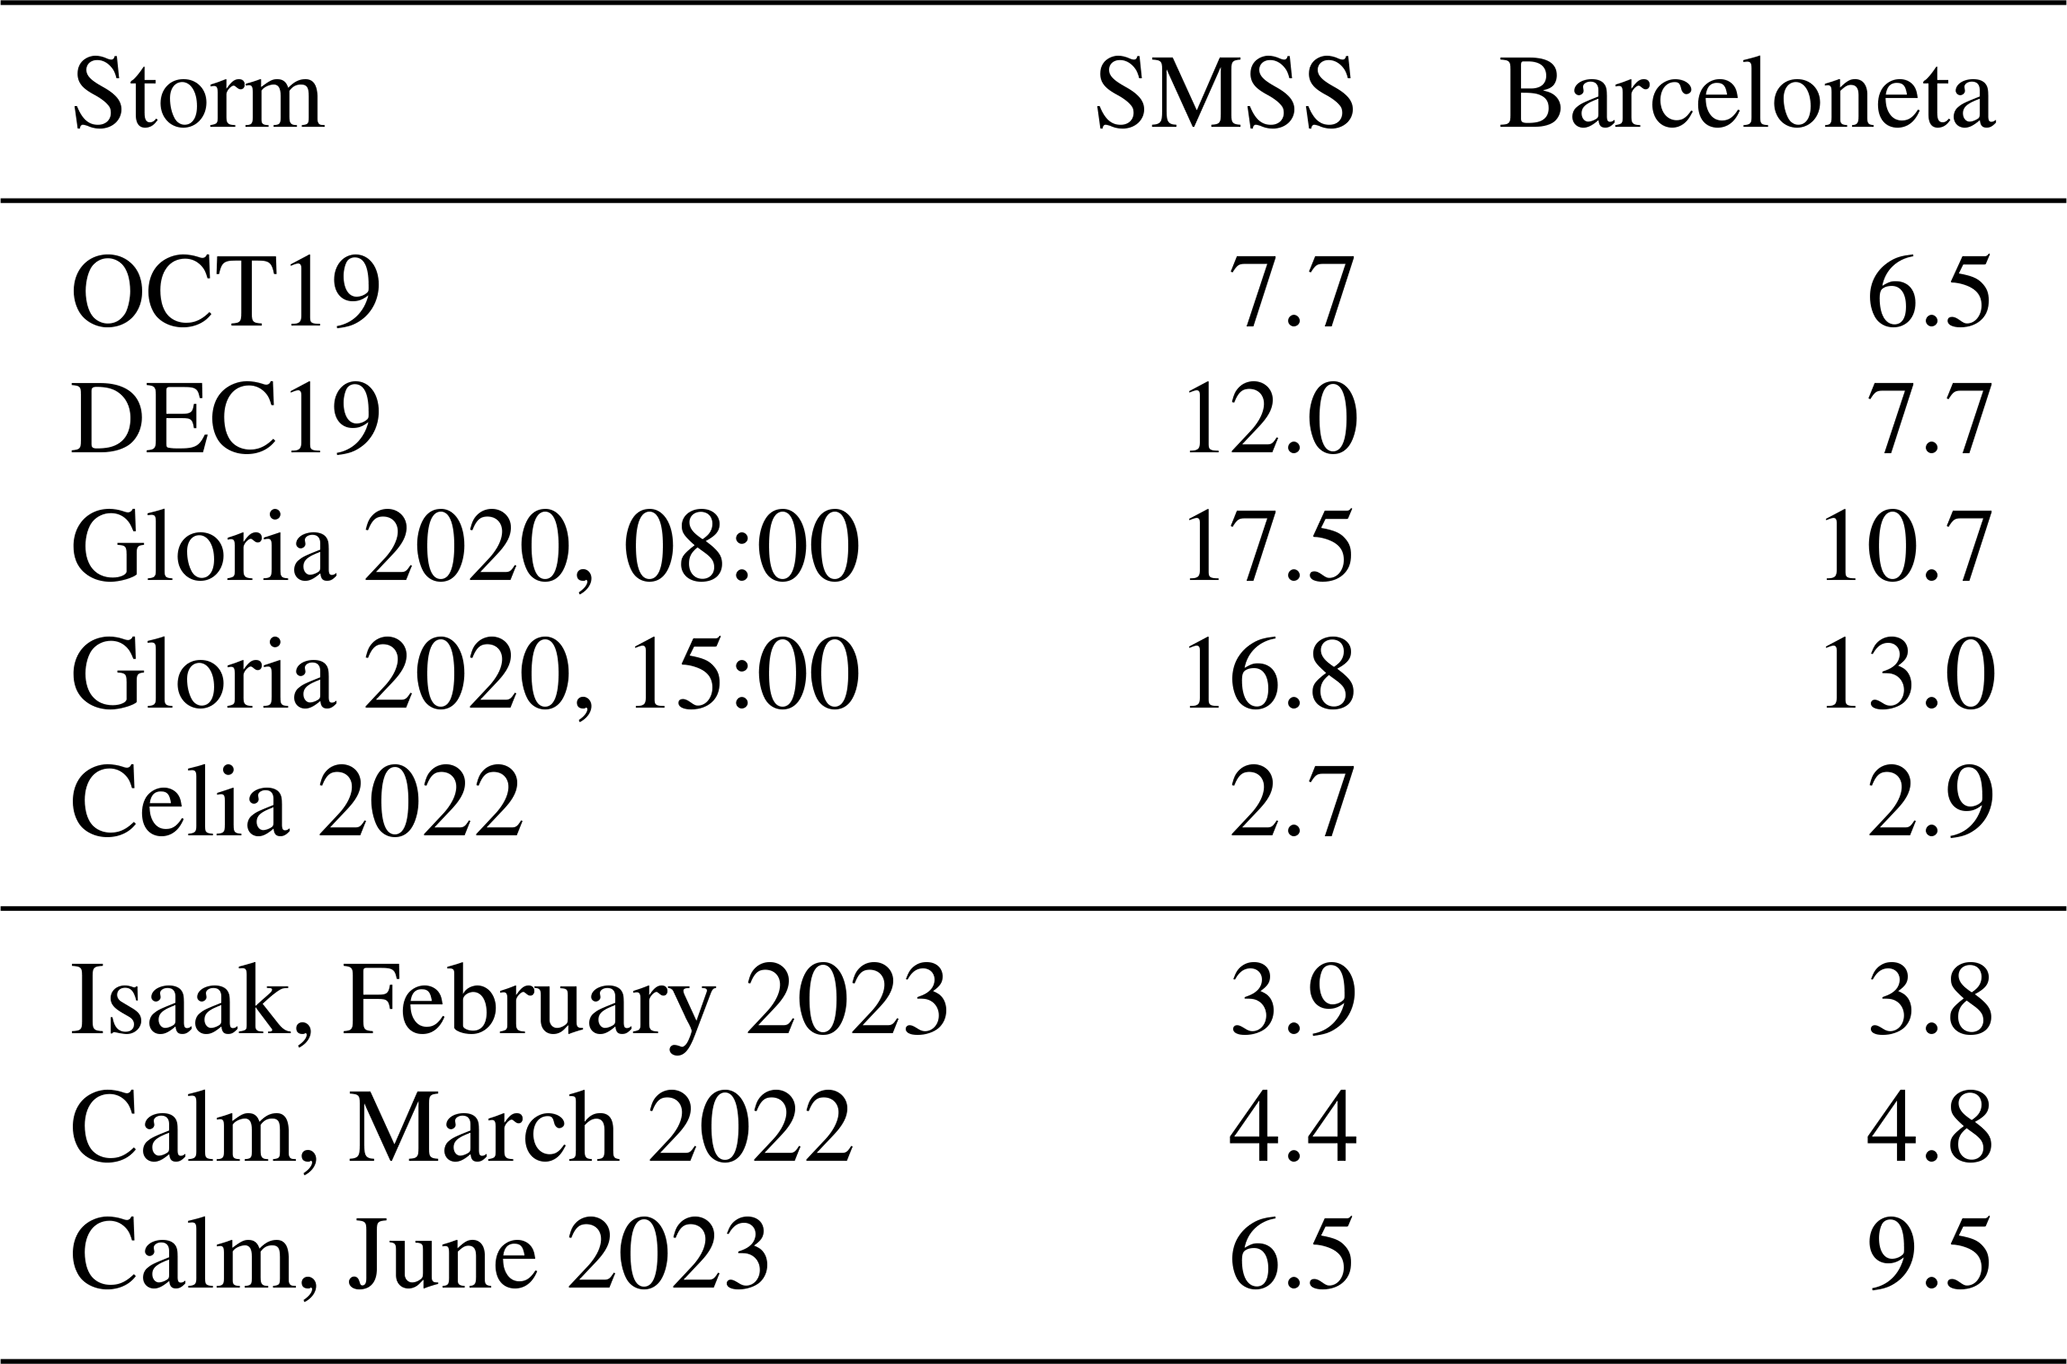
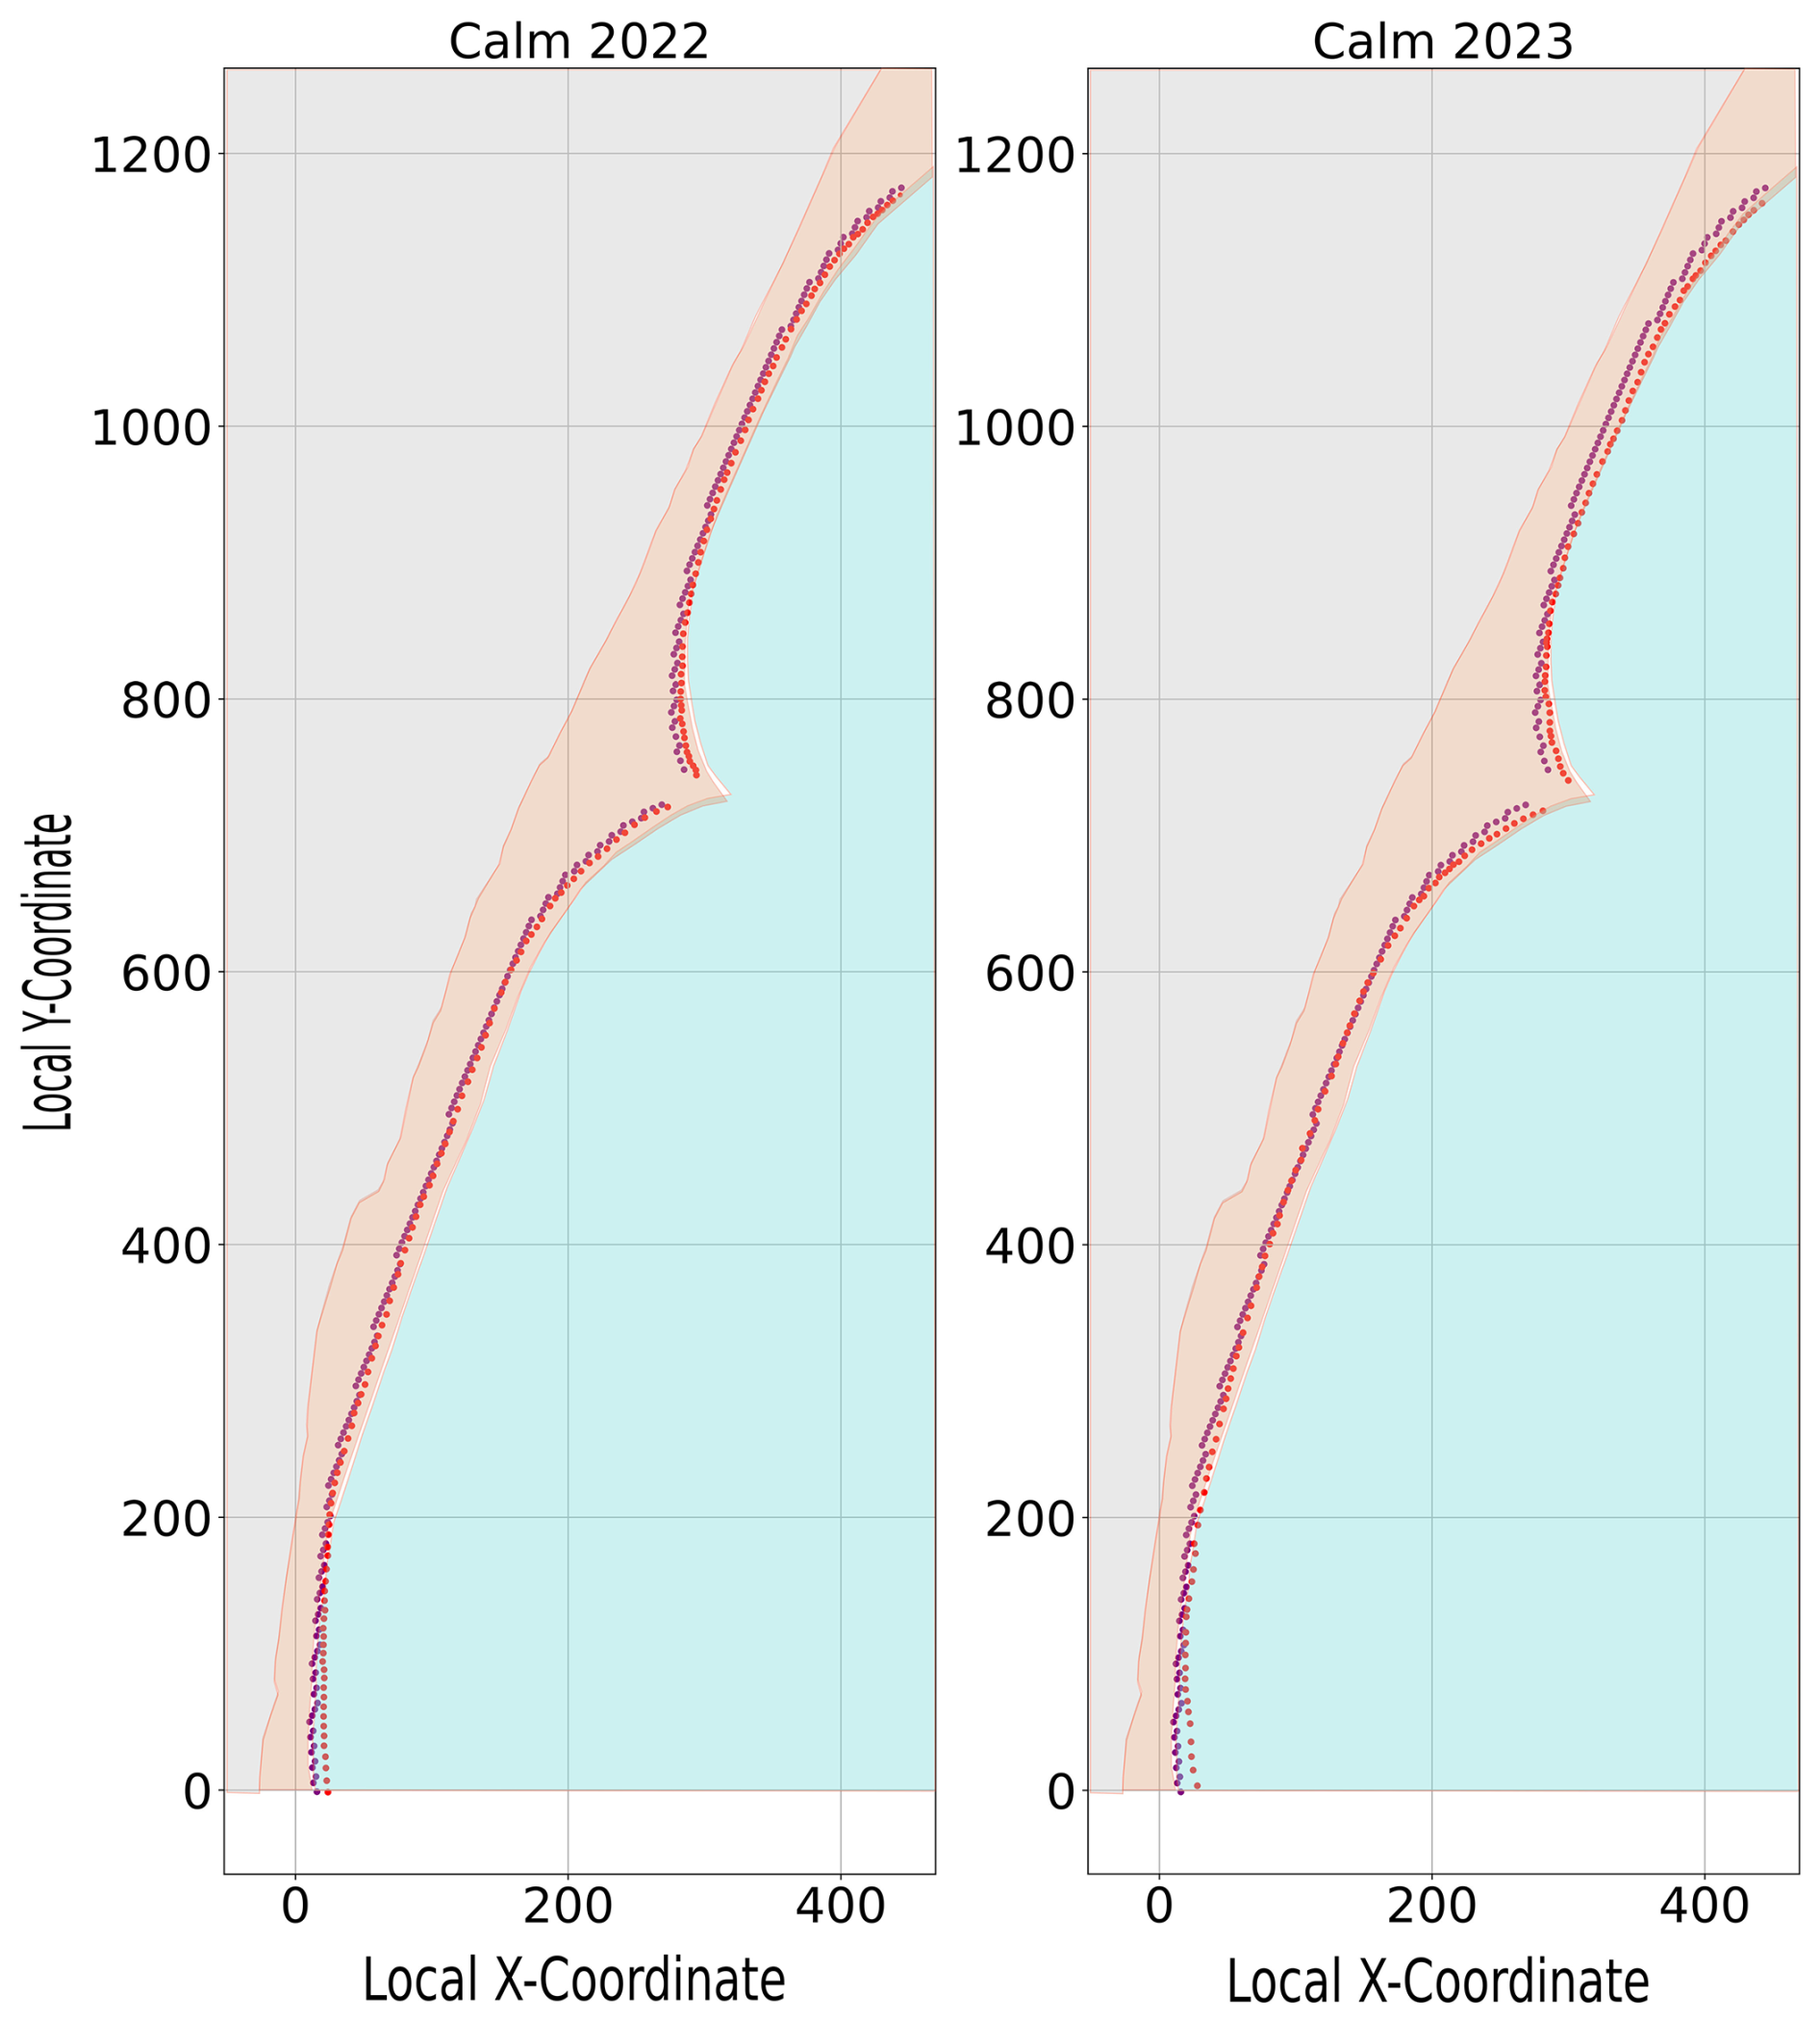
Figure 10Comparison of the flooding for selected calm conditions. In purple, model results; in red, videometry. Light-brown polygon indicates the extent of the beaches, blue represents water, and grey denotes the promenade and the city. Local axes are used, with distances measured in metres.
3.3 Operational analysis
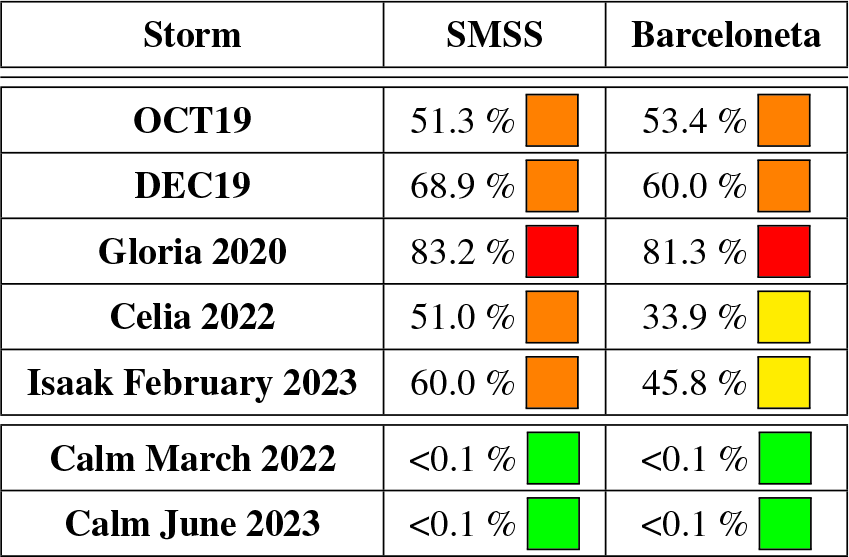
The metric used to characterise storms within the operational service, as described in Sect. 2.2, was applied to various storms during the validation process to evaluate the effectiveness of the alert system. Table 3 presents the alert levels obtained for different storms at each beach. Storm Gloria is the only one reaching a red alert level, indicating an extremely high alert, with flooding areas of 81.3 % at SMSS and 83.2 % at Barceloneta. This storm broke historical records for significant wave height and caused widespread damage along the entire Spanish Mediterranean coast, including severe beach erosion, extensive damage to coastal infrastructure, material losses due to flooding, and even some casualties (Sotillo et al., 2021). Storms OCT19 and DEC19 triggered orange alerts, classified as high alerts, for both SMSS and Barceloneta. The flooding areas for OCT19 were 53.6 % and 51.3 %, while, for the storm DEC19, they were 60 % and 68.9 %, respectively. The storms Celia and Isaak resulted in an orange alert for SMSS, with flooding areas of 51 % and 60 %, but only a yellow alert, indicating a moderate level, for Barceloneta. The flooding areas for Celia and Isaak at Barceloneta were 33.9 % and 45.8 %, respectively. Each of these storms also caused significant flooding impacts and infrastructure damages to the studied beaches. In particular, some impacts of Storm Celia are illustrated in Fig. 1c and d. Finally, during the calm periods, although the operational chain would have stopped before XBeach activation due to low wave height, the hypothetical flooding areas obtained would have been less than 0.1 % in both events.
Table 3Percentage of beach flooded area, calculated as the ratio between the number of flooded cells and the total number of cells within the model. Coloured squares indicate alert levels: green – no alert, yellow – moderate alert, orange – high alert, and red – extremely high alert level.
4.1 Modelling uncertainties
XBeach was used to simulate the beaches' responses within the operational chain. The validation of both hydrodynamics and flooding indicated that the model is an effective forecasting tool for inundation at SMSS and Barceloneta, delivering results in a reasonable computational time. However, during the sensitivity test conducted using the complete set of different storm conditions, some discrepancies were identified between the model results and camera observations, which increased the further the storm date was from the topobathymetry survey conducted on 4 March 2022. This is likely due to the fact that the topobathymetry is reset to its initial state at the start of each forecast simulation, suggesting that accurate topobathymetry is crucial for the model's performance, corroborating previous findings stating that bathymetry significantly influences XBeach outputs (Mickey et al., 2020; Schweiger et al., 2020; Matheen et al., 2019, 2021). To maintain an operational chain which remains reliable in the long term, using the methodology described in this paper, regular updates to the topobathymetry are necessary to enhance model accuracy. Given the high costs associated with this, a more feasible approach could be to periodically correct the coastline and adjust the shallower zones based on the lines extracted from the cameras to obtain an inferred bathymetry using video imagery (Simarro et al., 2019) or a combination of both strategies. This would help to better align the initial beach states with reality. The critical area appears to be the interface between the water and the coast, corresponding to the coastline, as this is where waves have a consistent impact (Armenio et al., 2019; Koroglu et al., 2019; Ojeda and Guillén, 2008; Franz et al., 2017). This was also observed in this study: during calm conditions in 2023, the differences were more pronounced compared to those in 2022 (see Fig. 10), whereas the differences between the storms Celia and Isaak, which had similar intervals, were less significant. Storms, by surpassing this dynamic coastal interface and reaching more stable areas, reproduced flooding impacts more accurately, resulting in outcomes closer to reality. However, for storms occurring years apart, the discrepancies increased because the overall beach dynamics changed, and the starting conditions of the coastline prior to the start of the storm differed more significantly. Despite this, the use of videometry allowed the validation of flooding events as it makes possible the observation of flooding lines under storm effects, which is very challenging with satellite data due to cloud coverage (Li et al., 2022; Shen et al., 2015; Fernandez-Moran et al., 2021). As stated by Arriaga et al. (2022), camera monitoring and video monitoring have become indispensable tools to understand beach processes, and a lot of systems have been developed, such as ARGUS (Holman and Stanley, 2007), SIRENA (Nieto et al., 2010), BEACHKEEPER (Brignone et al., 2012), or COSMOS (Taborda and Silva, 2012). Also, other camera-based initiatives have been designed, such as KOSTASystem (Liria et al., 2021), which underscores the need for continuous beach monitoring to enhance current approaches and models; and CoastSnap (Harley and Kinsela, 2022), which leverages citizen science, encouraging people to take photographs from specific locations with their smartphones. This not only involves the community in the study but also increases the amount of data collected, demonstrating, along with the other initiatives, the necessity of using videometry and constant monitoring to improve the modelling field.
The results also indicate that the Euclidean distances differences at SMSS are larger than those at Barceloneta (see Table 2). One reason for this could be that, during the topobathymetry survey, ongoing works at the groyne located in the south of the SMSS prevented the vessel from conducting bathymetric measurements in the area near to the structure. To address this data gap, interpolation was used, which may have reduced the accuracy. Additionally, the flooding lines for Barceloneta were easier to define in the images due to its closer proximity, which benefits from increased pixel resolution, as described in Sect. 2.3. This higher resolution allows for better image calibration, easing the process of defining the flooding lines and improving the precision of the statistical analysis.
Regarding the hydrodynamics, the results indicate an underestimation of wave height in shallow waters. This could happen due to several issues. The input waves from CMEMS are taken from the nearest point to the domain as a single point, which does not precisely correspond with the offshore boundary of the domain. Additionally, the significant resolution difference between CMEMS and the local grid introduces uncertainties, largely due to the absence of a downscaling process (Stanev et al., 2016). A potential solution could be nesting XBeach within a hydrodynamic model like SWAN (Booij et al., 1999) or something similar. This model would provide wave data at multiple exact offshore locations within the XBeach computational boundary, capturing variations in wave height and direction more accurately across different points, and it is more computationally efficient in larger areas as it does not require high-resolution bathymetry, thereby incorporating the CMEMS point within the domain. Besides, SWAN could also be used to smooth the transition between the input and XBeach and ensure better integration of the data. However, this strategy was not implemented in the current study, and it is planned to be deeply analysed in future research since incorporating another model introduces its own set of problems and errors, and it would increase computational time, reducing one of the key advantages of the current approach. Additionally, the study area is formed by a group of enclosed beaches separated by a groyne (see Fig. 1). This configuration produces complex physics by altering wave propagation due to this structure, which is more difficult to replicate with the model (Scott et al., 2016). At the deeper validation point, situated outside the beginning of the enclosed area, the wave magnitudes are more accurately reproduced at the peak of the storm, as shown in Fig. 8. This improvement can likely be attributed to the simpler and more stable bathymetry at these depths. Besides, unlike in shallower waters, the groyne's influence on wave dynamics is minimal here, and the difference in wave height between the CMEMS point and the deployment point is less pronounced at these greater depths.
Finally, the results from the flooding analysis indicate that the model successfully identifies all the studied storm events and accurately distinguishes periods of calm. The proposed metric classifies each event as hazardous storms, identifying Gloria as the most significant, despite some inaccuracies in validation through videometry. This finding enhances the overall strategy and demonstrates that, even though the accuracy concerning flooding lines is reduced over time, the approach remains capable of detecting the storms and providing alerts. The service enables accurate forecasting and timely warnings, allowing for more effective interventions to mitigate the associated impacts. For instance, sandbags or other quick defence measures could be strategically positioned or the promenade could be closed with adequate lead time to ensure public safety.
4.2 Operationality
The primary aim of this study was to develop a comprehensive methodology that works on a standard desktop computer while still providing timely and feasible coastal-flooding forecasts. The proposed strategy meets these initial requirements while allowing for the implementation of new features. For example, scripts to define erosion and sedimentation rates, other statistical analyses, or error variability could be added with minimal impact on computational time, enhancing the strategy's modularity. The current study focused on defining the methodology and developing a beta version, which is presented here but is not publicly accessible. Nevertheless, the approach is well-advanced, achieving a technology readiness level (TRL) of 6 out of 9, as classified by NASA and described in detail by Mankins (1995). In this case, the approach was adapted to software solutions by Horizon 2020, with level 6 indicating a “beta version of the software functionalities tested by selected end-users under controlled conditions”, which is the current state of the work. Advancing to TRL 8, implying a stable version available for the market, and TRL 9, with the version being available with full business plan conditions, is not currently planned as we do not intend to commercialise the product. Instead, the goal is to reach TRL 7, ensuring that the functionalities are widely available to end-users in an open and accessible manner, allowing them to run it on their own or to receive the outputs via e-mail, depending on preferences and needs.
The proposed operational approach, illustrated in Fig. 5, entails an easy increase in the number of the forecasted days as users demand. However, this would result in longer simulation times and, therefore, the competent person receiving the output later. Additionally, the model's accuracy is reduced, with longer simulations due to the accumulation of input and model errors. In the current approach, data are requested at 02:00 UTC +2, and results are e-mailed by 09:00 UTC +2, while the computational time of the XBeach model takes around 3 h to provide the forecasting. Then, with the current hardware specifications, the forecasted days could still be increased slightly, but this was not done as this version was planned as a beta version. For this study, a computer with an i7-10700 and 16 GB of RAM was used. Using a more powerful PC would accelerate the whole chain but increase the costs. The strategy is presented across three beaches, covering only a few kilometres. However, it may encounter computational limitations when applied to larger areas as the operational chain would require significantly more time to produce the forecasting. This approach was specifically designed for local areas, where stakeholders make decisions for smaller, focused regions. If larger areas need to be studied, it would be necessary to distribute the operational service across multiple computers, with each handling a specific area of action.
Table 4 outlines the procedures for various failures in the operational chain. As shown, if the operational forecast is interrupted due to server or connection issues, the system ceases to provide information and automatically restarts the following day. In the case of a model crash, the system follows the same procedure, but if the issue persists and in the case of connection errors, manual intervention is required. In contrast, if a computer crash occurs, the system must be manually restarted to ensure that the forecast is available the next day. However, if a problem is detected, the entire chain of scripts can be manually rerun, thereby preventing a loss of predictions for that day. Finally, if major updates need to be made to the computer, the chain must be paused until they are completed. Conversely, if a new version of the model or programming language is released, the operational chain can continue running with the previous version until the new one is fully implemented.
Table 4Recovery procedures for operational chain problems.
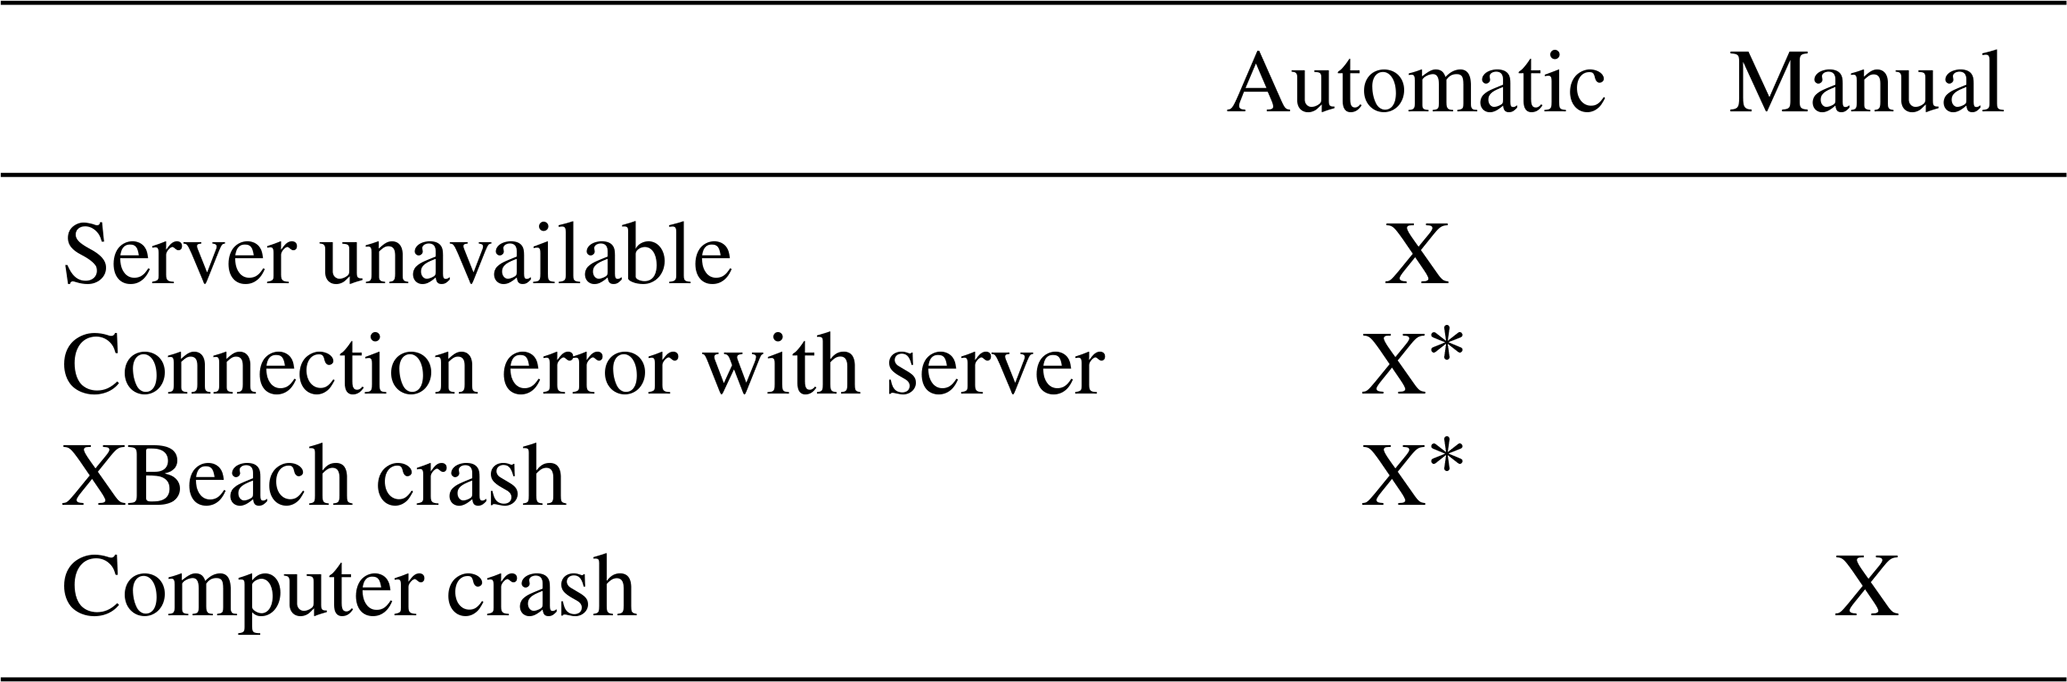
Note that * means automatic restart, but if the problem persists, manual actions are required.
The system has been developed to provide advance notice of potential flooding impacts during high-intensity storm conditions, allowing for the implementation of quick defence measures to mitigate associated damages, for example, to the promenade, showers, or beach bars (Fig. 1). The proposed methodology is designed to be easily adaptable for other local areas of similarly small scales, provided that initial forcing forecasts are available. Previous EWSs like iCoast and RISC-KIT (Van Dongeren et al., 2018) aimed for a similar approach but are not currently operational due to the nature of the project. The goal of the presented strategy is to remain available over time and to improve or add features through user feedback. For example, communication with Barcelona's port authorities has highlighted the system's utility for medium storms, where flooding is not extreme and, thus, where no damage occurs to infrastructures. In such cases, the system can help to prepare, in advance, the decision for a beach closing or for recreational use with red or yellow flags. Currently, in Catalonia, this task is based solely on meteorological forecasts. The introduction of wave and flooding data will significantly enhance decision-making in these cases.
This scientific contribution presents a comprehensive high-resolution operational system for assessing coastal flooding. This system utilises Python scripts and task automation tools, enabling the optimisation of local operational systems to predict flooding hazards during storms accurately. The model has been validated for both hydrodynamics and flooding, demonstrating its feasibility and accuracy using data from a field campaign and videometry. The loss of accuracy observed during the studied storms that took place long after the topobathymetry data were collected indicates that regularly updating the topobathymetry is an effective strategy for improving long-term results. A field campaign has been used to successfully validate the hydrodynamics, and cameras have been shown to be valuable tools for studying storm events. The defined alert system based on colours has been used to characterise the validated storms, ranging from a red alert level, indicating extremely high flooding, to a green alert level, signifying no hazard. The methodology has demonstrated the ability of the service to detect flooding hazards. The system's ability to send daily forecast updates via e-mail suggests a communication with users, and, besides this, the modular approach allows the addition of simple graphical images to complex statistical analyses and data, helping to meet user requirements. Future research could explore the introduction of hindcast data into the forecasting chain to enhance model accuracy further. Additionally, the use of videometry to infer bathymetry and correct the coastline presents a promising avenue for improving predictive capabilities in the long term, and further development could also focus on incorporating additional features, such as identifying predominant areas of erosion or specifying hazards based on vulnerable elements.
The XBeach initial and boundary conditions, along with the parameters used in the simulation presented in this study, are summarised in Table A1. The domain extends approximately 1 km perpendicular to the beach, reaching about 600 m offshore, and 1.5 km parallel to the shoreline. The computational domain encompasses all the beaches, which are analysed separately during the flooding assessment to issue individual alerts.
Table A1XBeach boundary conditions and physical parameters. The other parameters are defined as the default.
The code supporting the conclusions of this article will be made available by the authors on request.
The raw data supporting the conclusions of this article will be made available by the authors on GitHub after the finalisation of the REST-COAST project. Meanwhile, data can be provided by the authors on request.
Conceptualisation: XSA, VG, and MG. Methodology: XSA, VG, MG, GS, and JG. Software: XSA, GS, and JG. Validation: XSA, GS, and JG. Formal analysis: XSA, VG, ME, MG, and ASA. Investigation: XSA, VG, MG, ME, GS, JG, MGD, and ASA. Resources: VG, ME, MGD, and ASA. Data curation: XSA, GS, and JG. Writing (original draft preparation): XSA, VG, MG, GS, JG, and MGD. Writing (review and editing): XSA, VG, ME, MG, GS, JG, MGD, and ASA. Visualisation: XSA; Supervision: VG, ME, MG, MGD, and ASA. Project administration: VG, ME, and ASA. Funding acquisition: VG, ME, and ASA. All the authors have read and agreed to the published version of the paper.
The contact author has declared that none of the authors has any competing interests.
Publisher’s note: Copernicus Publications remains neutral with regard to jurisdictional claims made in the text, published maps, institutional affiliations, or any other geographical representation in this paper. While Copernicus Publications makes every effort to include appropriate place names, the final responsibility lies with the authors.
This article is part of the special issue “Oceanography at coastal scales: modelling, coupling, observations, and applications”. It is not associated with a conference.
This study has been conducted with support from the Secretariat for Universities and Research of the Ministry of Business and Knowledge of the Government of Catalonia and the European Social Fund. This study has been conducted using EU Copernicus Marine Service Information (https://doi.org/10.48670/moi-00025, CMEMS, 2024a; https://doi.org/10.48670/moi-00027, CMEMS, 2024b).
This project has received funding from the European Union's Horizon 2020 research and innovation programme under grant agreement no. 101037097 (REST-COAST project).
This paper was edited by John M. Huthnance and reviewed by two anonymous referees.
Armenio, E., De Serio, F., Mossa, M., and Petrillo, A. F.: Coastline evolution based on statistical analysis and modeling, Nat. Hazards Earth Syst. Sci., 19, 1937–1953, https://doi.org/10.5194/nhess-19-1937-2019, 2019. a
Arriaga, J., Medellin, G., Ojeda, E., and Salles, P.: Shoreline Detection Accuracy from Video Monitoring Systems, J. Mar. Sci. Eng., 10, 95, https://doi.org/10.3390/jmse10010095, 2022. a
Aznar, R., Sotillo, M., Cailleau, S., Lorente, P., Levier, B., Amo-Baladrón, A., Reffray, G., and Álvarez-Fanjul, E.: Strengths and weaknesses of the CMEMS forecasted and reanalyzed solutions for the Iberia–Biscay–Ireland (IBI) waters, J. Marine Syst., 159, 1–14, https://doi.org/10.1016/j.jmarsys.2016.02.007, 2016. a
Baschek, B., Schroeder, F., Brix, H., Riethmüller, R., Badewien, T. H., Breitbach, G., Brügge, B., Colijn, F., Doerffer, R., Eschenbach, C., Friedrich, J., Fischer, P., Garthe, S., Horstmann, J., Krasemann, H., Metfies, K., Merckelbach, L., Ohle, N., Petersen, W., Pröfrock, D., Röttgers, R., Schlüter, M., Schulz, J., Schulz-Stellenfleth, J., Stanev, E., Staneva, J., Winter, C., Wirtz, K., Wollschläger, J., Zielinski, O., and Ziemer, F.: The Coastal Observing System for Northern and Arctic Seas (COSYNA), Ocean Sci., 13, 379–410, https://doi.org/10.5194/os-13-379-2017, 2017. a
Basher, R.: Global early warning systems for natural hazards: systematic and people-centred, Philos. T. Roy. Soc. A, 364, 2167–2182, 2006. a
Bogden, P., Allen, G., Stone, G., MacLaren, J., Creager, G., Flournoy, L., Zhao, W., Graber, H., Graves, S., Conover, H., Luettich, R., Perrie, W., Ramkrishnan, L., Reed, D., Sheng, P., and Wang, H.: The SURA coastal ocean observing and prediction program (SCOOP) service-oriented architecture, in: OCEANS 2006, IEEE, 1–6, https://doi.org/10.1109/OCEANS.2006.306830, 2006. a
Booij, N., Ris, R. C., and Holthuijsen, L. H.: A third-generation wave model for coastal regions: 1. Model description and validation, J. Geophys. Res.-Oceans, 104, 7649–7666, https://doi.org/10.1029/98JC02622, 1999. a
Bosom, E. and Jiménez, J. A.: Probabilistic coastal vulnerability assessment to storms at regional scale – application to Catalan beaches (NW Mediterranean), Nat. Hazards Earth Syst. Sci., 11, 475–484, https://doi.org/10.5194/nhess-11-475-2011, 2011. a
Brignone, M., Schiaffino, C. F., Isla, F. I., and Ferrari, M.: A system for beach video-monitoring: Beachkeeper plus, Comput. Geosci., 49, 53–61, https://doi.org/10.1016/j.cageo.2012.06.008, 2012. a
Buckley, M., Lowe, R., and Hansen, J.: Evaluation of nearshore wave models in steep reef environments, Ocean Dynam., 64, 847–862, https://doi.org/10.1007/s10236-014-0713-x, 2014. a
Capet, A., Fernández, V., She, J., Dabrowski, T., Umgiesser, G., Staneva, J., Mészáros, L., Campuzano, F., Ursella, L., Nolan, G., and El Serafy, G.: Operational modeling capacity in European Seas – an EuroGOOS perspective and recommendations for improvement, Front. Mar. Sci., 7, 129, https://doi.org/10.3389/fmars.2020.00129, 2020. a
Carrion-Bertran, N., Falqués, A., Ribas, F., Calvete, D., de Swart, R., Durán, R., Marco-Peretó, C., Marcos, M., Amores, A., Toomey, T., Fernández-Mora, À., and Guillén, J.: Role of the forcing sources in morphodynamic modelling of an embayed beach, Earth Surf. Dynam., 12, 819–839, https://doi.org/10.5194/esurf-12-819-2024, 2024. a
Chondros, M., Metallinos, A., Papadimitriou, A., Memos, C., and Tsoukala, V.: A coastal flood early-warning system based on offshore sea state forecasts and artificial neural networks, J. Mar. Sci. Eng., 9, 1272, https://doi.org/10.3390/jmse9111272, 2021. a
Cid, A., Menéndez, M., Castanedo, S., Abascal, A. J., Méndez, F. J., and Medina, R.: Long-term changes in the frequency, intensity and duration of extreme storm surge events in southern Europe, Clim. Dynam., 46, 1503–1516, https://doi.org/10.1007/s00382-015-2659-1, 2016. a
CIIRC: Estat de la zona costanera a Catalunya, International Centre for Coastal Resources Research, https://www.icgc.cat/ca/Geoinformacio-i-mapes/Dades-i-productes/Bases-de-dades-i-catalegs/Llibre-verd-de-lEstat-de-la-zona-costanera-Catalunya-2010-Acces (last access: 22 December 2024), 2010. a, b
Copernicus Marine Service Information (CMEMS): Atlantic-Iberian Biscay Irish- Ocean Wave Analysis and Forecast, Marine Data Store (MDS), https://doi.org/10.48670/moi-00025, 2024a. a
Copernicus Marine Service Information (CMEMS): Atlantic-Iberian Biscay Irish- Ocean Physics Analysis and Forecast, Marine Data Store (MDS), https://doi.org/10.48670/moi-00027, 2024b. a
De Beer, A., McCall, R., Long, J., Tissier, M., and Reniers, A.: Simulating wave runup on an intermediate–reflective beach using a wave-resolving and a wave-averaged version of XBeach, Coast. Eng., 163, 103788, https://doi.org/10.1016/j.coastaleng.2020.103788, 2021. a
De Mey-Frémaux, P., Ayoub, N., Barth, A., Brewin, R., Charria, G., Campuzano, F., Ciavatta, S., Cirano, M., Edwards, C. A., Federico, I., Gao, S., Garcia Hermosa, I., Garcia Sotillo, M., Hewitt, H., Robert Hole, L., Holt, J., King, R., Kourafalou, V., Lu, Y., Mourre, B., Pascual, A., Staneva, J., Stanev, E., Wang, H., and Zhu, X.: Model-observations synergy in the coastal ocean, Front. Mar. Sci., 6, 436, https://doi.org/10.3389/fmars.2019.00436, 2019. a
Fernandez-Moran, R., Gómez-Chova, L., Alonso, L., Mateo-García, G., and López-Puigdollers, D.: Towards a novel approach for Sentinel-3 synergistic OLCI/SLSTR cloud and cloud shadow detection based on stereo cloud-top height estimation, ISPRS J. Photogramm., 181, 238–253, 2021. a
Franz, G., Delpey, M. T., Brito, D., Pinto, L., Leitão, P., and Neves, R.: Modelling of sediment transport and morphological evolution under the combined action of waves and currents, Ocean Sci., 13, 673–690, https://doi.org/10.5194/os-13-673-2017, 2017. a
Grifoll, M., Aretxabaleta, A. L., Espino, M., and Warner, J. C.: Along-shelf current variability on the Catalan inner-shelf (NW Mediterranean), J. Geophys. Res.-Oceans, 117, C09027, https://doi.org/10.1029/2012JC008182, 2012. a
Harley, M. D. and Kinsela, M. A.: CoastSnap: A global citizen science program to monitor changing coastlines, Cont. Shelf Res., 245, 104796, https://doi.org/10.1016/j.csr.2022.104796, 2022. a
Holman, R. A. and Stanley, J.: The history and technical capabilities of Argus, Coast. Eng., 54, 477–491, https://doi.org/10.1016/j.coastaleng.2007.01.003, 2007. a
Idier, D., Aurouet, A., Bachoc, F., Baills, A., Betancourt, J., Gamboa, F., Klein, T., López-Lopera, A. F., Pedreros, R., Rohmer, J., and Thibault, A.: A user-oriented local coastal flooding early warning system using metamodelling techniques, J. Mar.Sci. Eng., 9, 1191, https://doi.org/10.3390/jmse9111191, 2021. a
IPCC: Climate Change 2022: Impacts, Adaptation and Vulnerability, Summary for Policymakers, Cambridge University Press, Cambridge, UK and New York, USA, ISBN 9781009325844, 2022. a
Japkowicz, N.: Learning from imbalanced data sets: a comparison of various strategies, in: AAAI workshop on learning from imbalanced data sets, AAAI Press, Menlo Park, vol. 68, 10–15, 2000. a
Jongman, B.: Effective adaptation to rising flood risk, Nat. Commun., 9, 1986, https://doi.org/10.1038/s41467-018-04396-1, 2018. a
Kelman, I. and Glantz, M. H.: Early warning systems defined, Reducing disaster: Early warning systems for climate change, Springer, 89–108, https://doi.org/10.1007/978-94-017-8598-3_5, 2014. a
Koroglu, A., Ranasinghe, R., Jiménez, J. A., and Dastgheib, A.: Comparison of coastal vulnerability index applications for Barcelona Province, Ocean Coast. Manage., 178, 104799, https://doi.org/10.1016/j.ocecoaman.2019.05.001, 2019. a
Kourafalou, V., De Mey, P., Staneva, J., Ayoub, N., Barth, A., Chao, Y., Cirano, M., Fiechter, J., Herzfeld, M., Kurapov, A., Moore, A. M., Oddo, P., Pullen, J., van der Westhuysen, A., and Weisberg, R. H.: Coastal Ocean Forecasting: science foundation and user benefits, J. Oper. Oceanogr., 8, s147–s167, https://doi.org/10.1080/1755876X.2015.1022348, 2015. a
Li, Z., Shen, H., Weng, Q., Zhang, Y., Dou, P., and Zhang, L.: Cloud and cloud shadow detection for optical satellite imagery: Features, algorithms, validation, and prospects, ISPRS J. Photogramm., 188, 89–108, https://doi.org/10.1016/j.isprsjprs.2022.03.020, 2022. a
Liria, P., Epelde, I., De Santiago, I., Garnier, R., Abalia, A., and Mader, J.: KOSTASystem, a coastal videometry technology: development and applications, in: 9th EuroGOOS International conference, 485–491, https://hal.science/hal-03329155v2 (last access: 15 May 2024), 2021. a
Lorente, P., García-Sotillo, M., Amo-Baladrón, A., Aznar, R., Levier, B., Sánchez-Garrido, J. C., Sammartino, S., de Pascual-Collar, Á., Reffray, G., Toledano, C., and Álvarez-Fanjul, E.: Skill assessment of global, regional, and coastal circulation forecast models: evaluating the benefits of dynamical downscaling in IBI (Iberia–Biscay–Ireland) surface waters, Ocean Sci., 15, 967–996, https://doi.org/10.5194/os-15-967-2019, 2019. a
Mankins, J. C.: Technology readiness levels, White Paper, 6 April 1995. a
MARLIT: Means of assessing and mitigating local coastal risks due to storm surges, https://www.azti.es/en/proyectos/marlit/ (last access: 2 July 2024), 2021. a
Mateus, M., Riflet, G., Chambel, P., Fernandes, L., Fernandes, R., Juliano, M., Campuzano, F., de Pablo, H., and Neves, R.: An operational model for the West Iberian coast: products and services, Ocean Sci., 8, 713–732, https://doi.org/10.5194/os-8-713-2012, 2012. a
Matheen, N., Turner, I. L., Harley, M. D., Splinter, K. D., and Simmons, J. A.: How sensitive is storm erosion modelling to prior knowledge of pre-storm surf zone and nearshore bathymetry?, in: Australasian Coasts and Ports 2019 Conference: Future directions from 40 [degrees] S and beyond, Hobart, 10–13 September 2019, Engineers Australia Hobart, 819–824, ISBN 9781925627237, 2019. a
Matheen, N., Harley, M. D., Turner, I. L., Splinter, K. D., Simmons, J. A., and Thran, M. C.: Bathymetric data requirements for operational coastal erosion forecasting using XBeach, J. Mar. Sci. Eng., 9, 1053, https://doi.org/10.3390/jmse9101053, 2021. a
Matias, A., Carrasco, A. R., Loureiro, C., Masselink, G., Andriolo, U., McCall, R., Ferreira, Ó., Plomaritis, T. A., Pacheco, A., and Guerreiro, M.: Field measurements and hydrodynamic modelling to evaluate the importance of factors controlling overwash, Coast. Eng., 152, 103523, https://doi.org/10.1016/j.coastaleng.2019.103523, 2019. a
McCall, R., Masselink, G., Poate, T., Roelvink, J., Almeida, L., Davidson, M., and Russell, P.: Modelling storm hydrodynamics on gravel beaches with XBeach-G, Coast. Eng., 91, 231–250, https://doi.org/10.1016/j.coastaleng.2014.06.007, 2014. a, b
McGranahan, G., Balk, D., and Anderson, B.: The rising tide: assessing the risks of climate change and human settlements in low elevation coastal zones, Environ. Urban., 19, 17–37, https://doi.org/10.1177/0956247807076960, 2007. a
Mickey, R. C., Dalyander, P. S., McCall, R., and Passeri, D. L.: Sensitivity of storm response to antecedent topography in the XBeach model, J. Mar. Sci. Eng., 8, 829, https://doi.org/10.3390/jmse8100829, 2020. a
Nieto, M. A., Garau, B., Balle, S., Simarro, G., Zarruk, G. A., Ortiz, A., Tintoré, J., Álvarez-Ellacuría, A., Gómez-Pujol, L., and Orfila, A.: An open source, low cost video-based coastal monitoring system, Earth Surf. Proc. Land., 35, 1712–1719, https://doi.org/10.1002/esp.2025, 2010. a
Ojeda, E. and Guillén, J.: Shoreline dynamics and beach rotation of artificial embayed beaches, Mar. Geol., 253, 51–62, https://doi.org/10.1016/j.margeo.2008.03.010, 2008. a, b
Oliveira, J. N. C., Oliveira, F. S., Neves, M. G., Clavero, M., and Trigo-Teixeira, A. A.: Modeling wave overtopping on a seawall with XBeach, IH2VOF, and mase formulas, Water, 12, 2526, https://doi.org/10.3390/w12092526, 2020. a
Oliver, H. J., Shin, M., and Sanders, O.: Cylc: A workflow engine for cycling systems, J. Open Source Softw., 3, 737, https://doi.org/10.21105/joss.00737, 2018. a
Pérez Gómez, B., Vilibić, I., Šepić, J., Međugorac, I., Ličer, M., Testut, L., Fraboul, C., Marcos, M., Abdellaoui, H., Álvarez Fanjul, E., Barbalić, D., Casas, B., Castaño-Tierno, A., Čupić, S., Drago, A., Fraile, M. A., Galliano, D. A., Gauci, A., Gloginja, B., Martín Guijarro, V., Jeromel, M., Larrad Revuelto, M., Lazar, A., Keskin, I. H., Medvedev, I., Menassri, A., Meslem, M. A., Mihanović, H., Morucci, S., Niculescu, D., Quijano de Benito, J. M., Pascual, J., Palazov, A., Picone, M., Raicich, F., Said, M., Salat, J., Sezen, E., Simav, M., Sylaios, G., Tel, E., Tintoré, J., Zaimi, K., and Zodiatis, G.: Coastal sea level monitoring in the Mediterranean and Black seas, Ocean Sci., 18, 997–1053, https://doi.org/10.5194/os-18-997-2022, 2022. a
Pinardi, N. and Woods, J.: Ocean forecasting: conceptual basis and applications, Springer Science & Business Media, https://doi.org/10.1007/978-3-662-22648-3, 2002. a
Quansah, J. E., Engel, B., and Rochon, G. L.: Early warning systems: a review, Journal of Terrestrial Observation, 2, p. 5, 2010. a
Ribas, F., Ojeda, E., Price, T. D., and Guillén, J.: Assessing the suitability of video imaging for studying the dynamics of nearshore sandbars in tideless beaches, IEEE T. Geosci. Remote, 48, 2482–2497, https://doi.org/10.1109/TGRS.2009.2039576, 2010. a
Roelvink, D., Reniers, A., Van Dongeren, A., De Vries, J. V. T., McCall, R., and Lescinski, J.: Modelling storm impacts on beaches, dunes and barrier islands, Coast. Eng., 56, 1133–1152, https://doi.org/10.1016/j.coastaleng.2009.08.006, 2009. a, b
Roelvink, D., Reniers, A., Van Dongeren, A., Van Thiel de Vries, J., Lescinski, J., and McCall, R.: XBeach model description and manual, Unesco-IHE Institute for Water Education, Deltares and Delft University of Technology, Report 21 June 2010. a
Romero-Martín, R., Caballero-Leiva, I., Llasat, M. C., Llasat-Botija, M., Rigo, T., Valdemoro, H. I., Gilabert, J., Cortès, M., and Jiménez, J. A.: Mapping cumulative compound hydrometeorological and marine-induced risks on the NW Mediterranean coast, Sci. Rep., 14, 3237, https://doi.org/10.1038/s41598-024-53899-z, 2024. a
Sánchez-Artús, X., Gracia Garcia, V., Espino Infantes, M., Sierra Pedrico, J. P., Pinyol Guamis, J., and Sánchez-Arcilla Conejo, A.: Present and future flooding and erosion along the NW Spanish Mediterranean Coast, Front. Mar. Sci., 10, 1125138, https://doi.org/10.3389/fmars.2023.1125138, 2023. a
Sánchez-Artús, X., Subbiah, B., Gracia, V., Espino, M., Grifoll, M., Espanya, A., and Sánchez-Arcilla, A.: Evaluating barrier beach protection with numerical modelling. A practical case, Coast. Eng., 191, 104522, https://doi.org/10.1016/j.coastaleng.2024.104522, 2024. a
Schiller, A., Mourre, B., Drillet, Y., and Brassington, G.: Overview of operational oceanography, in: New frontiers in operational oceanography, edited by: Pascual, A., Tintoré, J., and Verron, J., GODAE OceanView, 1–26, https://doi.org/10.17125/gov2018.ch01, 2018. a
Schweiger, C., Koldrack, N., Kaehler, C., and Schuettrumpf, H.: Influence of nearshore bathymetry changes on the numerical modelling of dune erosion, J. Coast. Res., 36, 545–558, https://doi.org/10.2112/JCOASTRES-D-19-00067.1, 2020. a
Scott, T., Austin, M., Masselink, G., and Russell, P.: Dynamics of rip currents associated with groynes – field measurements, modelling and implications for beach safety, Coast. Eng., 107, 53–69, https://doi.org/10.1016/j.coastaleng.2015.09.013, 2016. a
She, J., Allen, I., Buch, E., Crise, A., Johannessen, J. A., Le Traon, P.-Y., Lips, U., Nolan, G., Pinardi, N., Reißmann, J. H., Siddorn, J., Stanev, E., and Wehde, H.: Developing European operational oceanography for Blue Growth, climate change adaptation and mitigation, and ecosystem-based management, Ocean Sci., 12, 953–976, https://doi.org/10.5194/os-12-953-2016, 2016. a
Shen, H., Li, X., Cheng, Q., Zeng, C., Yang, G., Li, H., and Zhang, L.: Missing information reconstruction of remote sensing data: A technical review, IEEE Geosci. Remote S. Mag., 3, 61–85, https://doi.org/10.1109/MGRS.2015.2441912, 2015. a
Simarro, G., Ribas, F., Álvarez, A., Guillén, J., Chic, Ò., and Orfila, A.: ULISES: An open source code for extrinsic calibrations and planview generations in coastal video monitoring systems, J. Coast. Res., 33, 1217–1227, 2017. a
Simarro, G., Calvete, D., Luque, P., Orfila, A., and Ribas, F.: UBathy: A new approach for bathymetric inversion from video imagery, Remote Sens., 11, 2722, https://doi.org/10.3390/rs11232722, 2019. a
Simarro, G., Calvete, D., and Souto, P.: UCalib: Cameras Autocalibration on Coastal Video Monitoring Systems, Remote Sens., 13, 2795, https://doi.org/10.3390/rs13142795, 2021. a
Sotillo, M. G., Mourre, B., Mestres, M., Lorente, P., Aznar, R., García-León, M., Liste, M., Santana, A., Espino, M., and Álvarez, E.: Evaluation of the operational CMEMS and coastal downstream ocean forecasting services during the storm Gloria (January 2020), Front. Mar. Sci., 8, 644525, https://doi.org/10.3389/fmars.2021.644525, 2021. a, b
Stanev, E. V., Schulz-Stellenfleth, J., Staneva, J., Grayek, S., Grashorn, S., Behrens, A., Koch, W., and Pein, J.: Ocean forecasting for the German Bight: from regional to coastal scales, Ocean Sci., 12, 1105–1136, https://doi.org/10.5194/os-12-1105-2016, 2016. a
Taborda, R. and Silva, A.: COSMOS: A lightweight coastal video monitoring system, Comput. Geosci., 49, 248–255, https://doi.org/10.1016/j.cageo.2012.07.013, 2012. a
Turki, I., Medina, R., Gonzalez, M., and Coco, G.: Natural variability of shoreline position: Observations at three pocket beaches, Mar. Geol., 338, 76–89, https://doi.org/10.1016/j.margeo.2012.10.007, 2013. a
Van Dongeren, A., Ciavola, P., Martinez, G., Viavattene, C., Bogaard, T., Ferreira, O., Higgins, R., and McCall, R.: Introduction to RISC-KIT: Resilience-increasing strategies for coasts, Coast. Eng., 134, 2–9, https://doi.org/10.1016/j.coastaleng.2017.10.007, 2018. a
Walstad, L. J. and McGillicuddy, D. J.: Data assimilation for coastal observing systems, Oceanography, 13, 47–53, 2000. a
Wilkin, J., Rosenfeld, L., Allen, A., Baltes, R., Baptista, A., He, R., Hogan, P., Kurapov, A., Mehra, A., Quintrell, J., Schwab, D., Signell, R., and Smith, J.: Advancing coastal ocean modelling, analysis, and prediction for the US Integrated Ocean Observing System, J. Oper. Oceanogr., 10, 115–126, https://doi.org/10.1080/1755876X.2017.1322026, 2017. a
Williams, J. J. and Esteves, L. S.: Guidance on setup, calibration, and validation of hydrodynamic, wave, and sediment models for shelf seas and estuaries, Adv. Civil Eng., 2017, 5251902, https://doi.org/10.1155/2017/5251902, 2017. a
Willmott, C. J.: On the validation of models, Phys. Geogr., 2, 184–194, https://doi.org/10.1080/02723646.1981.10642213, 1981. a
Zhou, Y., Feng, X., Liu, M., and Wang, W.: Influence of beach erosion during wave action in designed artificial sandy beach using XBeach model: profiles and shoreline, J. Mar. Sci. Eng., 11, 984, https://doi.org/10.3390/jmse11050984, 2023. a