the Creative Commons Attribution 4.0 License.
the Creative Commons Attribution 4.0 License.
 | 15 Dec 2025
Drivers of seasonal hydrography in Disko Bay, Greenland
Lars H. Smedsrud
Elin Darelius
Per Juel Hansen
Josh K. Willis
This study investigates the seasonal dynamics of Disko Bay (Qeqertarsuup Tunua) in west Greenland. On the eastern side, the bay's hydrography is influenced by ice-ocean interactions and exchange with Ilulissat Icefjord (Kangiata Sullua), while on the western side, the bay exchanges waters with Baffin Bay. Since the mid-1990s, this region has experienced ocean warming, sea-ice decline, and the retreat of Greenland's fastest-flowing marine-terminating glacier. Although West Greenland Irminger Water (WGIW) is known to be a significant heat source behind these changes, the timing and pathways of its entry into Disko Bay remain poorly understood. We present a two-year (2022–2024) observational record of Disko Bay hydrography, providing new insights into the seasonal evolution and spatial structure of Polar Water (PW) and WGIW. Each spring, dense WGIW crosses the topographic barrier between Baffin Bay and Disko Bay, filling the Disko Bay basin and producing the highest observed temperature and density at depth. The PW–WGIW boundary shoals to depths shallow enough for WGIW to renew the Ilulissat Icefjord basin. In autumn/winter 2022, an additional episodic renewal coincided with strong upwelling-favourable winds along the west Greenland shelf. While WGIW renewal dominates winter and spring seasonality (a period also marked by sea-ice presence), summer and autumn hydrography are shaped by PW. With the onset of the melt season, a fresh stratified layer forms in the upper 50 m and progressively thickens and extends downward, continuing to freshen and cool through autumn. Beneath this layer, denser PW warms steadily along isopycnals, with spatial analyses indicating an advective pathway transporting this warming signal along the bay's periphery.
- Article
(10039 KB) - Full-text XML
- BibTeX
- EndNote


Disko Bay (Qeqertarsuup Tunua) is the largest open-water embayment in west Greenland (Fig. 1). Bordered by Baffin Bay to the west and numerous glacial fjords to the east, its hydrography is shaped by a complex interplay of regional water mass exchanges, local oceanographic processes, and ice-ocean interactions. Since the late 1960s, oceanographic studies have provided valuable insights into its hydrography and circulation patterns (Petersen, 1964; Muench, 1971; Andersen, 1981a). Subsequent research explored seasonality and ecosystem functioning (Andersen, 1981b; Nielsen and Hansen, 1995), while more recent studies have documented significant changes in oceanographic conditions over the recent decades (Hansen et al., 2012; Myers and Ribergaard, 2013).
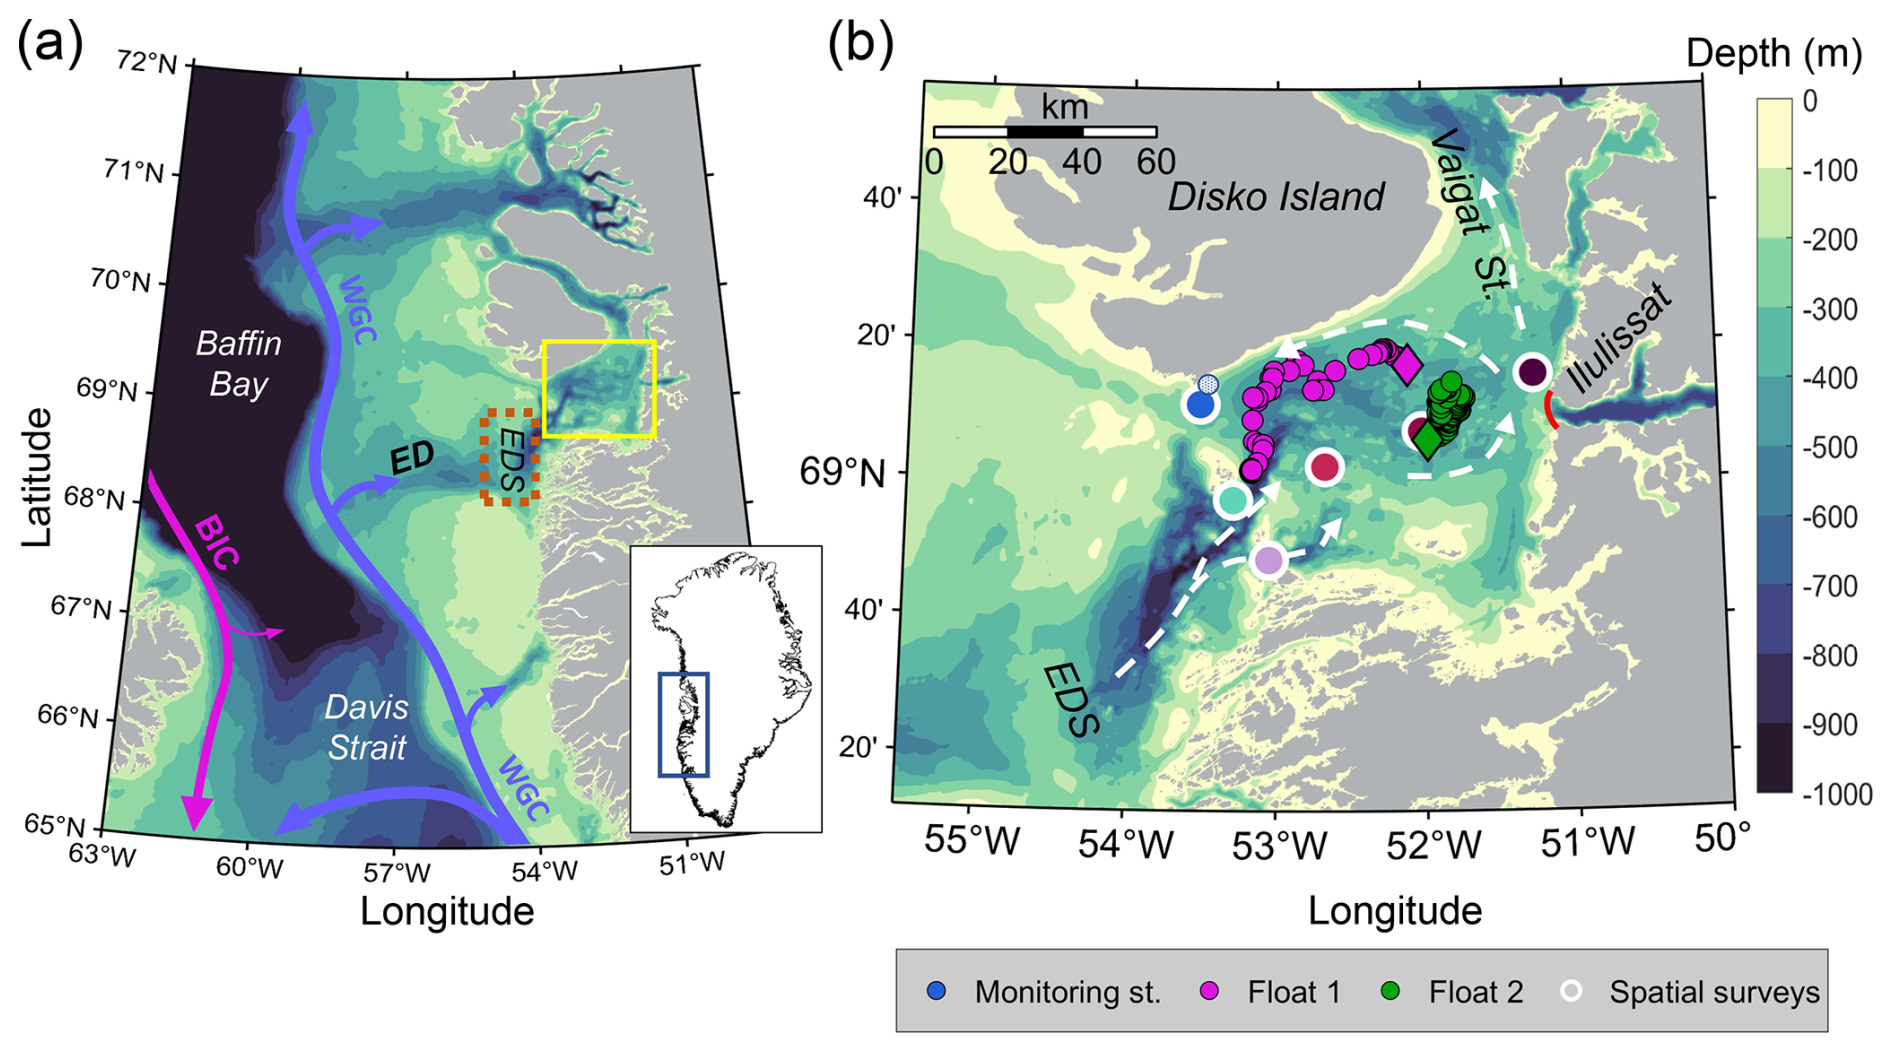
Figure 1(a) Baffin Bay and west Greenland bathymetry, overlaid with north-flowing West Greenland Current (WGC, blue) and south-flowing Baffin Island Current (BIC, pink). The Egedesminde Dyb trough (ED) cuts across the continental shelf into Disko Bay (yellow box). The shallow Egedesminde Dyb Sill (EDS) is where we analyse wind forcing with ERA5 reanalysis data (orange dashed box). (b) Disko Bay bathymetry, Ilulissat Icefjord Sill (red line) and general circulation (white arrows, adapted from Hansen et al., 2012). Location of oceanographic observations: Monitoring Station (blue circle with white outline), profile from landfast sea-ice (white circle with blue outline), Float 1 (August 2022–June 2023, magenta circles), Float 2 (August 2023–October 2024, green circles), and stations surveyed during spatial cruises (coloured circles with thick while outline, including the Monitoring Station). Each float's first profile is marked with a diamond. Bathymetric data are from BedMachine Version 5 dataset (Morlighem et al., 2022).
One of the most notable changes was a transition in the mid-1990s, when the increased presence of warm Atlantic-origin waters marked the shift from a cold to a warm regime in Disko Bay (Holland et al., 2008; Hansen et al., 2012). This warming was particularly evident at 200–250 m depth, where temperatures rose from ∼ 1.5 °C in the early 1990s to ∼ 2–2.5 °C by the late 1990s, eventually surpassing 3 °C in the early 2000s (Hansen et al., 2012; Khazendar et al., 2019; Joughin et al., 2020).
These warm waters, upon entering Ilulissat Icefjord (Kangiata Sullua) above its 245 m sill (Fig. 1b), have contributed to the disintegration of the floating ice tongue, retreat, acceleration, and increased melting of Sermeq Kujalleq (Jakobshavn Glacier), Greenland's fastest flowing marine-terminating glacier (Joughin et al., 2004; Holland et al., 2008; Motyka et al., 2011; Khazendar et al., 2019; Joughin et al., 2020; Picton et al., 2025). More recently, oceanic forcing has also been linked to a period of slowdown, thickening, and terminus re-advance in 2016–2018 (Joughin et al., 2018, 2020), as well as to renewed acceleration and increased solid ice discharge in subsequent years (Picton et al., 2025). Because Sermeq Kujalleq is highly sensitive to oceanic forcing, and the waters that fill Ilulissat Icefjord originate in Disko Bay (Gladish et al., 2015a), an improved understanding and continued monitoring of Disko Bay's hydrography is essential.
Although Disko Bay has been the focus of long-term observations, data coverage is biased towards April–September period. As a result, key processes such as the seasonality of warm subsurface waters remain poorly understood. While it has been hypothesised that these deep warm waters renew in Disko Bay during winter and early spring (Gladish et al., 2015a), the lack of observations during these seasons has left this process largely unexplored.
This study addresses these gaps by presenting oceanographic observations spanning two annual cycles from June 2022–November 2024. These observations provide new insights into the seasonal processes shaping Disko Bay's hydrography and its response to external forcing, particularly during the poorly observed autumn-to-spring transition
The regional circulation in Baffin Bay consists of two major currents: the northward-flowing West Greenland Current (WGC) and the southward-flowing Baffin Island Current (BIC) (Fig. 1a). The WGC carries warm and saline subsurface waters of North Atlantic origin along the continental shelfbreak of west Greenland (Pacini et al., 2020; Huang et al., 2024). While most of these warm waters divert west and south in the northern Labrador Sea, some continue northward through Davis Strait into Baffin Bay (Cuny et al., 2005; Curry et al., 2011, 2014). Upon crossing the Davis Strait, the warm waters subduct below fresher and colder Polar-origin waters and propagate northward as a bottom-intensified current along the continental slope (Huang et al., 2024). Despite the heat loss caused by mixing with the Polar-origin waters above, these subsurface warm waters remain the predominant heat source and a major driver of accelerated melt of many marine-terminating glaciers along the west Greenland coast (Holland et al., 2008; Straneo et al., 2012; Khazendar et al., 2019; Joughin et al., 2020; Wood et al., 2021).
The exchange of waters between Baffin Bay and Disko Bay is strongly modulated by topography. A 300–900 m deep trough, Egedesminde Dyb (ED), cuts across the continental shelf and provides a pathway for dense, warm waters from the shelf break into Disko Bay (Fig. 1a). This inflow is partially obstructed by Egedesminde Dyb Sill (EDS), a topographic barrier reaching 300 m depth that functions similarly to a fjord sill (Fig. 1b) (Gladish et al., 2015a). We view EDS as the western boundary of Disko Bay and the approximate delineation of the Disko Bay–Baffin Bay boundary. The coast defines the eastern and southern boundaries. In the east, Disko Bay connects with Ilulissat Icefjord (750–800 m deep), which is separated by a shallow sill (deepest point of 245 m), also known as the Iceberg Bank (Gladish et al., 2015b; Morlighem et al., 2022). Disko Island is located in the north of the bay, separated from the mainland by the Vaigat Strait (Sullorsuaq Strait), where a shallow bathymetry (245 m) also restricts exchange (Andersen, 1981a; Morlighem et al., 2022). Thus, Disko Bay (100 km wide and ∼ 120 km long) is confined by shallow and complex bathymetry, with its central basin (300–500 m deep) isolated from direct water mass exchanges.
Previous studies indicate a cyclonic circulation within Disko Bay (Andersen, 1981a; Sloth and Buch, 1984), following bathymetric contours, with northward flow past Ilulissat Icefjord (Beaird et al., 2017), and outflow primarily through Vaigat Strait and along the southern coast of Disko Island (Andersen, 1981a; Hansen et al., 2012).
3.1 Oceanographic observations
We combine new observations from two drifting profilers and a hydrographic field campaign with existing data from the monitoring station in Disko Bay to construct a hydrographic time series for 2022–2024 (Fig. 2). Table 1 gives an overview of all hydrographic profiles included in the time series, and profile locations are shown in Fig. 1b. Additionally, we utilise profiles from five hydrographic surveys between 2022 and 2024 for a spatial analysis.
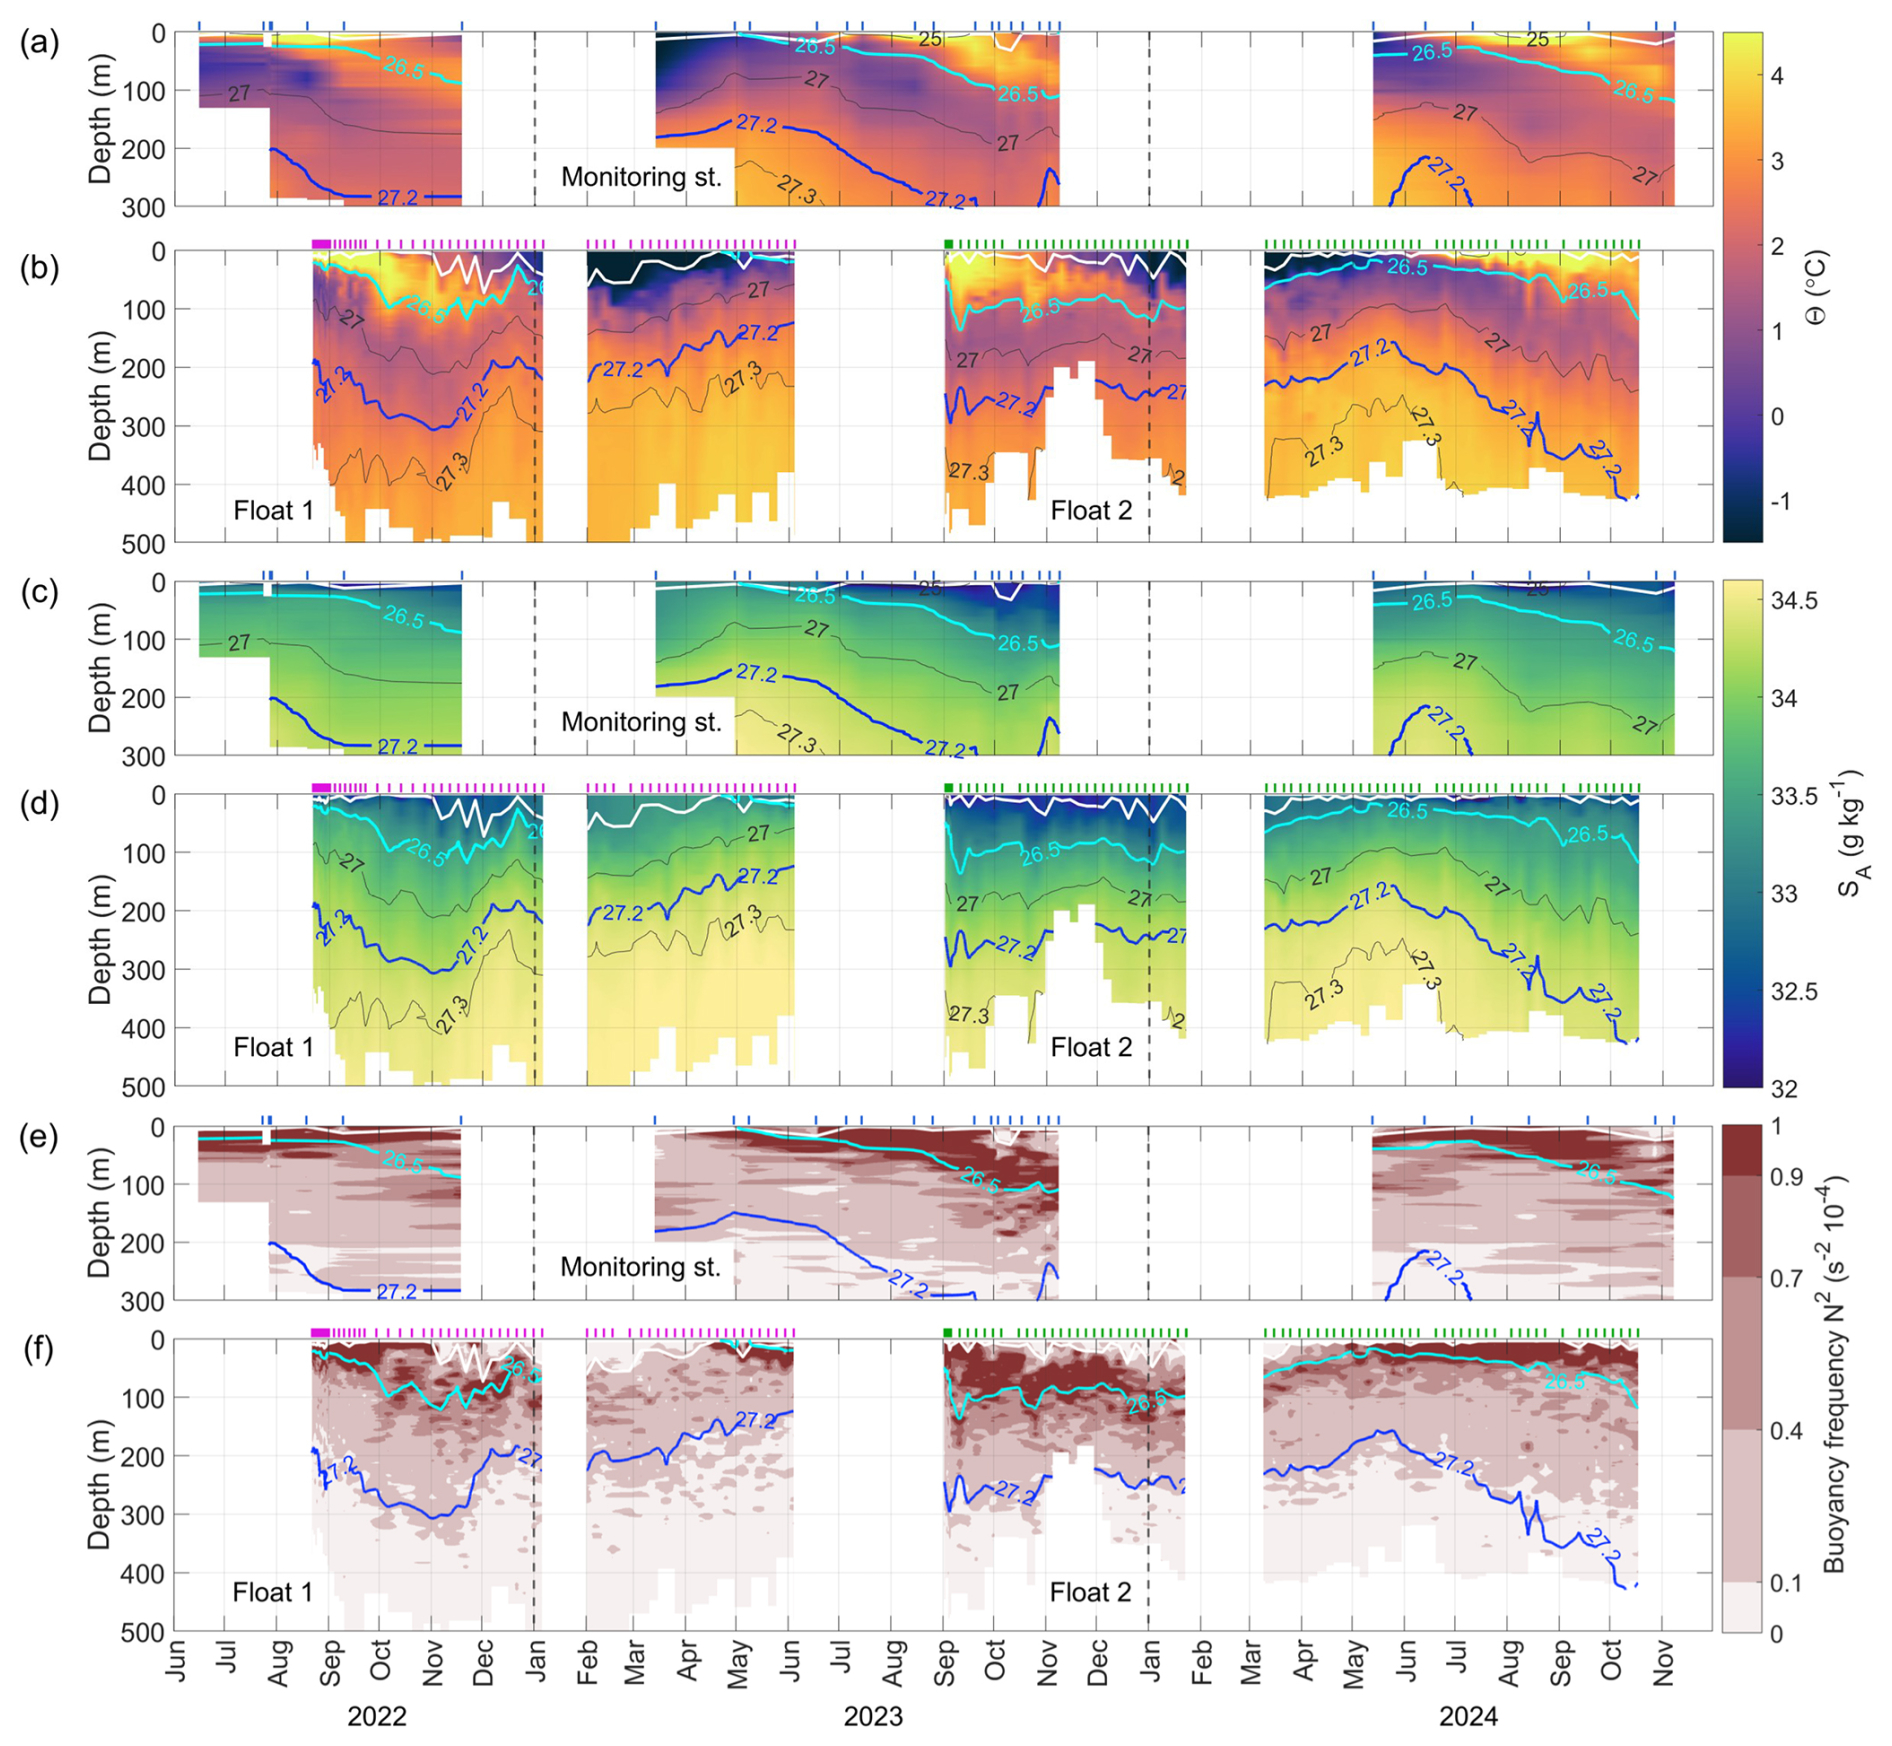
Figure 2Hydrography in Disko Bay from June 2022 to November 2024. Temperature for the Monitoring Station (a) and profiling floats (b). Salinity for the Monitoring Station (c) and profiling floats (d). Buoyancy frequency for the Monitoring Station (e) and profiling floats (f). Temperature, Salinity, and Buoyancy Frequency are overlaid by labelled isopycnals (blue thick line σ0 = 27.2 kg m−3 showing the upper WGIW boundary) and mixed-layer depth (white lines). Vertical ticks on the upper x-axis in (a)–(f) show the time of profile acquisitions (blue – Monitoring Station, magenta – Float 1, green – Float 2), while dashed vertical lines through all panels mark the start of each calendar year.
Table 1Overview of analysed hydrographic observations.
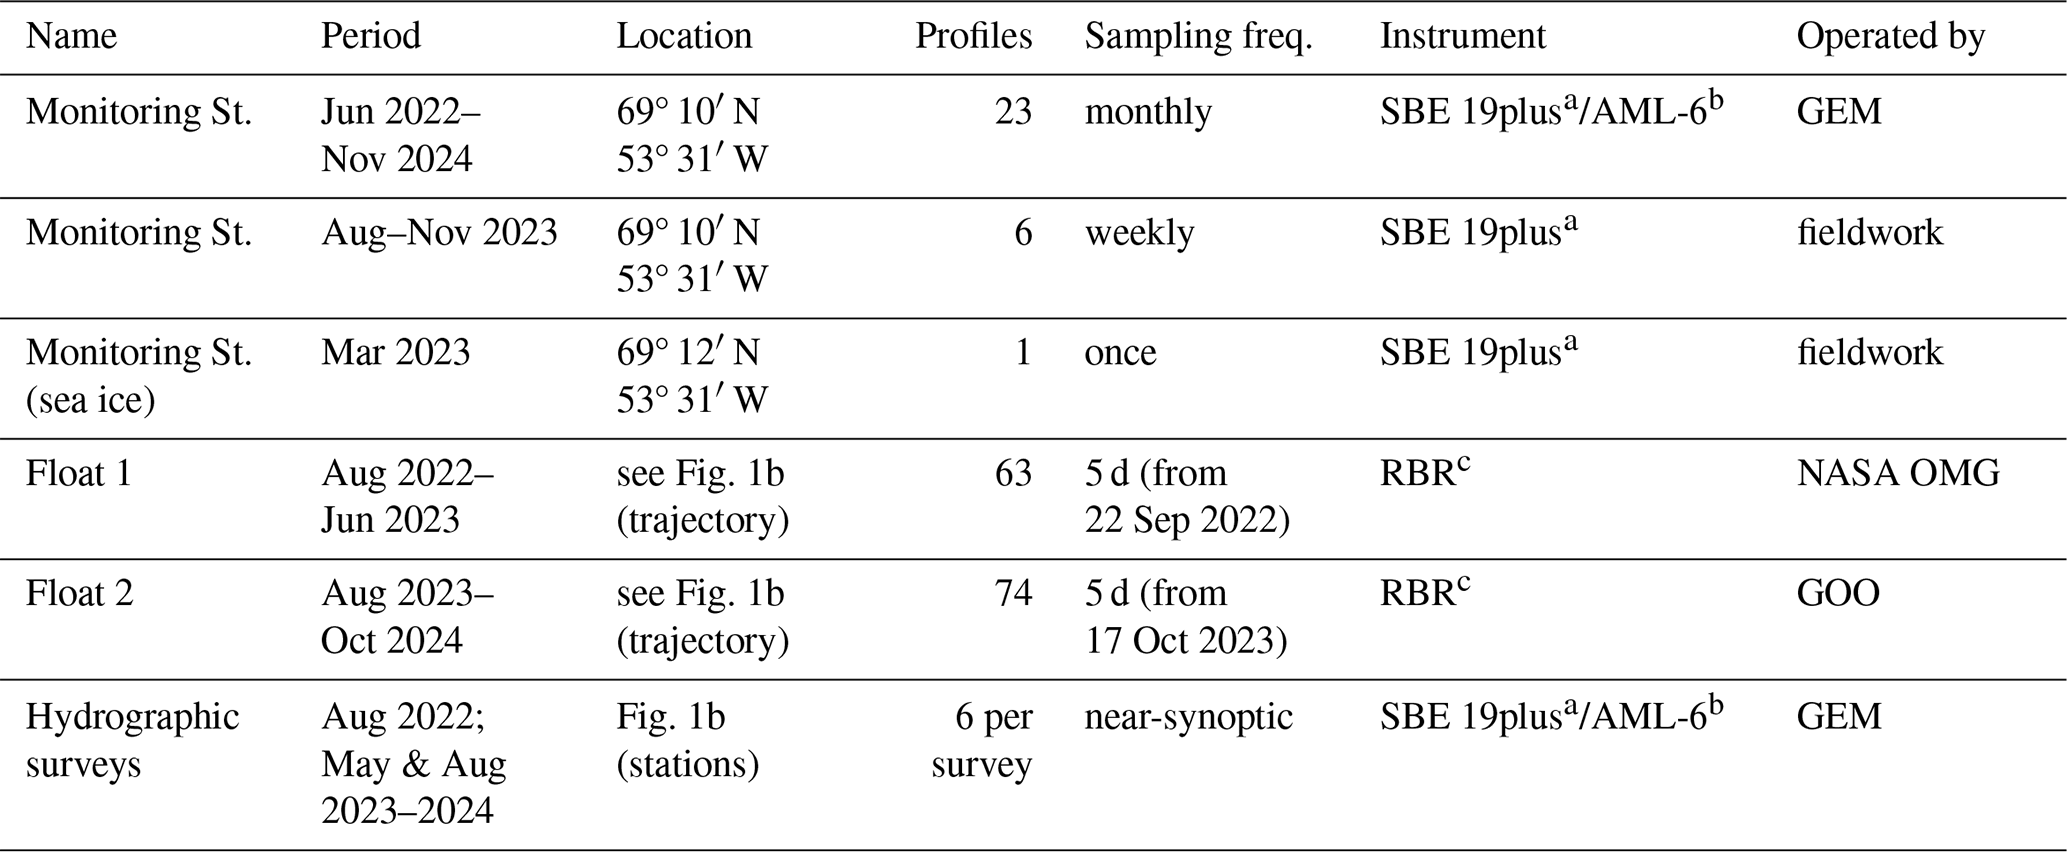
a Sea-Bird SBE 19plus (T: ± 0.005 °C; C: ± 0.005 mS cm−1; P: 0.1 % FS). b AML-6 (T: ± 0.005 °C; C: ± 0.01 mS cm−1; P: 0.05 % FS). c RBR sensors (T: ± 0.002 °C; C: ± 0.003 mS cm−1; P: ± 1 dbar). Note: At the Monitoring Station and in hydrographic surveys, SBE 19plus was used in 2022–2023 and AML-6 in 2024.
3.1.1 Monitoring Station
We use hydrographic data from the Greenland Ecosystem Monitoring Programme (GEM), collected on board RV Porsild at a fixed oceanographic monitoring station in northwestern Disko Bay (Table 1, Fig. 1b, Greenland Ecosystem Monitoring, 2025a). We obtained all available processed profiles, taken with a Sea-Bird SBE 19plus instrument from June 2022–November 2023, and with an AML Oceanographic AML-6 instrument from May–November 2024. Instrument accuracies are given in Table 1.
To improve temporal resolution during the undersampled autumn period, we also conducted weekly measurements at the monitoring station from RV Porsild between August and November 2023 (Table 1, Fig. 1b), using the same Sea-Bird SBE 19plus instrument as GEM. We processed the raw data using Sea-Bird Scientific's SBE Data Processing (v7.26.7) application, following standard quality control, correction, and processing steps. In addition, one profile was taken in March 2023 at the landfast sea-ice edge, located 2.8 km landward from the monitoring station (Table 1, Fig. 1b).
We combined our field observations (including the profile taken from sea ice) with GEM data to construct a spatially fixed time series, hereafter referred to as “Monitoring Station” (Fig. 2a, c). We use TEOS10 Gibbs-Sea Water Oceanographic Toolbox (McDougall and Barker, 2011) to convert conductivity to Absolute Salinity (SA), temperature to Conservative Temperature (Θ), and pressure to depth. Throughout this paper, we refer to Absolute Salinity and Conservative Temperature as salinity and temperature, respectively. Hereafter, we refer to potential density anomaly with a reference pressure of 0 dbar (σ0) as density.
3.1.2 Profiling float data
We use temperature and salinity profiles from an Air-Launched Autonomous Micro Observer (Alamo) float (ID: F9313), deployed in Disko Bay as part of the NASA Oceans Melting Greenland (OMG) Mission (Table 1, Oceans Melting Greenland, 2022). The float drifted cyclonically within the bay at a mean speed of 0.4 cm s−1, with a higher mean of 0.75 cm s−1 while drifting westward before turning south and slowing (Fig. 1b). Between 6 February 2023 and 4 April 2023, the float profiled underneath the sea ice, and position data during that period were unavailable. However, between the acquisitions with known positions, the float's position changed only by 3.1 km. The float data were quality controlled following the recommended procedures in Wong et al. (2024). Hereafter, we refer to this profiling float as “Float 1” (Fig. 2b, d).
Additional profiles were retrieved by an Apex float (WMO ID: 6990591) (Argo, 2024), deployed in Disko Bay in August 2023 as part of the Greenland Ocean Observations (GOO) project (Table 1, Fig. 1b). The data are Real-time and quality-controlled. We use only the data with a “good data” quality flag and follow the same quality control checks and processing as for Float 1. Hereafter, we refer to this profiling float as “Float 2” (Fig. 2b, d).
Both floats were fitted with RBR sensors (Table 1). Salinity obtained from both floats was compared against CTD observations collected at the Monitoring Station during periods of temporal overlap, and against data from the hydrographic surveys (Sect. 3.1.3). These comparisons confirmed that the Θ-SA relationship at higher densities exhibits spatial heterogeneity across Disko Bay (see Sect. 4.2). Accordingly, float salinities in these density ranges were compared against the full set of available CTD observations in Θ-SA space, from which we estimate that salinity sensor drift did not exceed 0.02 g kg−1 over the period of data used from either float.
3.1.3 Spatial hydrographic surveys in 2022–2024
We use data from five hydrographic surveys conducted in Disko Bay during the summers of 2022, 2023 and 2024 (Table 1, Fig. 1b) to analyse the spatial variability during this period. These near-synoptic cruises were conducted as part of the GEM programme (Greenland Ecosystem Monitoring, 2025b), covering most of Disko Bay's deep basin. Instrumentation was consistent with the Monitoring Station observations: a Sea-Bird SBE 19plus in 2022 and 2023, and an AML Oceanographic AML-6 in 2024. The cruises took place on 18–21 August 2022, 9–12 May 2023 and 14–16 August 2023, as well as 16–19 May 2024 and 21–22 August 2024. All cruises had the same sampling locations marked in Fig. 1b.
3.2 Atmospheric and sea-ice data
To estimate atmospheric forcing on local ocean variability in Disko Bay and across the shelf region, we use the European Centre for Medium-Range Weather Forecasts ERA5 reanalysis product (Hersbach et al., 2023). The product has 0.25° spatial and hourly temporal resolution. We obtained sea-ice concentration and 10 m u and v wind components over a region covering EDS (Fig. 1a).
For sea-ice concentration inside Disko Bay, we use data from the merged MODIS-AMSR2 satellite product (Ludwig et al., 2020). Daily sea-ice concentration (SIC) with 1 km resolution was downloaded for the Disko Bay region (68° 42′ N–69° 31′ N, 51° 24′ W–53° W) and averaged spatially to obtain a time series of weekly mean SIC.
3.3 Methods
3.3.1 Determination of the mixed-layer depth
We determined the mixed-layer depth (MLD) for each hydrographic profile using the two-step method of Semper et al. (2025), adapted for use with density profiles. First, for each profile, we obtained the preliminary MLD by computing the normalised sum-of-squared errors (SSE) over all possible surface-to-depth ranges. Within the mixed layer, normalised SSE values remained small but increased once stratified waters were included as the depth range was extended below the mixed layer. The preliminary MLD was taken as the maximum depth for which normalised SSE values stayed below the threshold of kg2 m−6. In some cases, no MLD was detected, either because the mixed layer was shallower than the first available measurement depth or because no well-mixed surface layer was present.
Second, we verified the preliminary MLD by checking whether temperature, salinity, and density from the surface to the computed MLD lay within one standard deviation of their respective mean values (Pickart et al., 2002; Semper et al., 2025). In a small number of profiles where one or more properties fell outside the standard deviation envelope, the MLD was manually reassigned to satisfy this criterion.
3.3.2 Water mass definitions
Two water masses broadly describe the vertical structure of Disko Bay: a relatively cool and fresh layer of Arctic origin (solid lines in Fig. 3d–e), which overlays warmer and more saline waters of Atlantic origin (dashed lines in Fig. 3d–e).
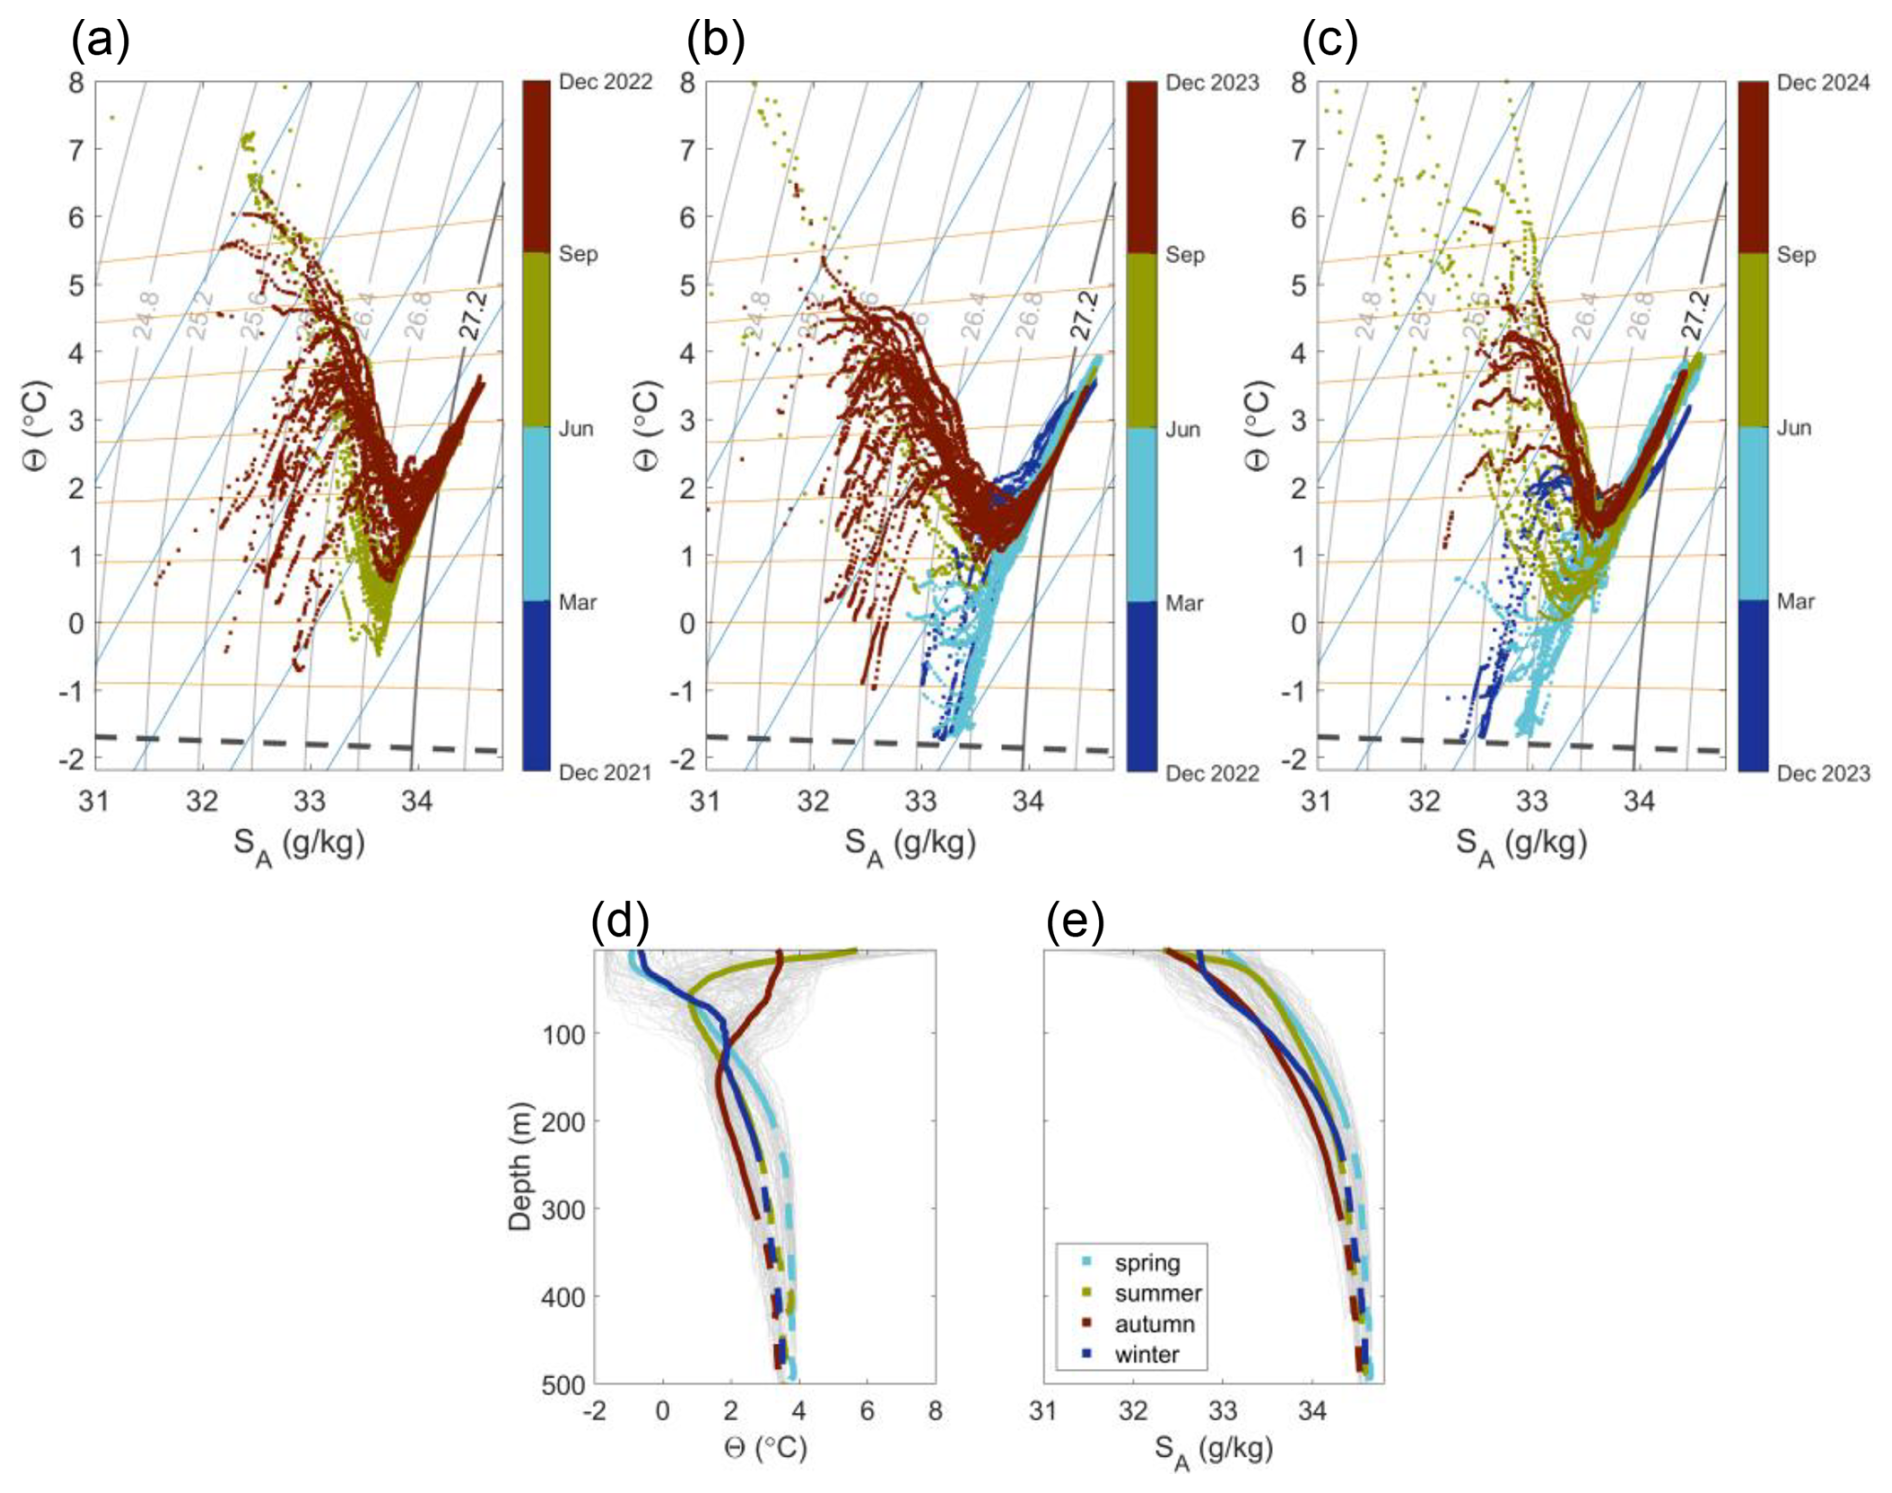
Figure 3(a–c) Temperature–Salinity (Θ–SA) diagrams from Monitoring Station and float observations for annual cycles spanning June 2022–November 2024 (circle markers coloured by season). Grey contours are isopycnals at 0.4 kg m−3 intervals; the thick grey line at 27.2 kg m−3 delineates West Greenland Irminger Water (WGIW) from Polar Water (PW). Orange and blue lines indicate mixing lines with subglacial discharge/runoff (Θ = 0 °C, SA = 0 g kg−1) and submarine meltwater ( °C, SA = 0 g kg−1), respectively. The dashed grey line marks the surface freezing point. (d–e) Vertical temperature and salinity profiles from all observations in (a)–(c) (thin grey lines), overlaid with mean seasonal profiles (thick coloured lines, with solid segments corresponding to PW and dashed segments to WGIW).
The Atlantic-origin waters in the region are often called Modified Irminger Water (Gladish et al., 2015a), Subpolar Mode Water (Rysgaard et al., 2020), Atlantic Water (Beaird et al., 2017) and West Greenland Irminger Water (Curry et al., 2014; Carroll et al., 2018; Huang et al., 2024). These definitions broadly overlap, and we refer to this water mass as West Greenland Irminger Water (WGIW) and define it as waters with a density σ0>27.2 kg m−3 (thick grey isopycnal in Fig. 3a–c). This definition matches the properties presented by Curry et al. (2014) and those found to be relevant for Disko Bay and Ilulissat Icefjord basin exchanges (Gladish et al., 2015a, b).
The Arctic-origin waters have also been described using multiple names, depending on origin and formation processes: West Greenland Shelf Water and Arctic Water (Curry et al., 2014; Carroll et al., 2018), Baffin Bay Polar Water and Coastal Water (Rysgaard et al., 2020), cold Polar Water and warm Polar Water (Huang et al., 2024). Because we focus on seasonal evolution rather than source differentiation, we use the general term Polar Water (PW), similar to Myers and Ribergaard (2013), Beaird et al. (2017) and Muilwijk et al. (2022). The PW has density σ0 < 27.2 kg m−3. Through this paper, we also refer to the surface layer, which is defined as the extent of the mixed layer found within PW. We emphasise that this PW definition merges waters from distinct sources into a single, cool and fresh layer. This simplification is necessary as distinguishing individual water mass sources/types is challenging with the data used in this study. Although each of the water types within our PW definition may have distinct origins and seasonal behaviours, we will assess their combined effect on the upper-layer hydrography in Disko Bay.
Glacial freshwater input, a significant component of what we term PW in Disko Bay, primarily originates from Ilulissat Icefjord. This includes both liquid and solid fluxes, with the liquid component consisting of runoff and submarine meltwater (Mernild et al., 2015; Enderlin et al., 2016; Beaird et al., 2017). Submarine meltwater forms through direct melting of marine-terminating glaciers or icebergs by ocean heat ( °C, SA = 0 g kg−1) (Gade, 1979). Runoff, from surface melt of glaciers and snow, typically enters the fjord at depth via subglacial pathways, forming subglacial discharge (Θ = 0 °C, SA = 0 g kg−1) (Straneo and Cenedese, 2015). Together, subglacial discharge and submarine meltwater drive convective upwelling in the fjord, entraining ambient waters and producing glacially modified water (Straneo et al., 2011; Beaird et al., 2015; Stevens et al., 2016; Beaird et al., 2018; Mortensen et al., 2020; Muilwijk et al., 2022). The glacially modified water equilibrates at its level of neutral buoyancy (Jackson et al., 2017; Cowton et al., 2015; Mankoff et al., 2016; Slater et al., 2022) and is exported into Disko Bay if it extends above the Ilulissat Icefjord sill depth (Jenkins, 2011; Gladish et al., 2015b; Carroll et al., 2016; Beaird et al., 2017; Kajanto et al., 2023).
3.3.3 Wind stress and Ekman pumping calculation
Zonal wind stress (τx) and meridional wind stress (τy) are computed for each grid point of the ERA5 fields of u10 and v10 wind speed components as follows:
where ρa is air density (1025 kg m−3), is the magnitude of the wind vector, and Cd is the drag coefficient. To incorporate the effect of sea ice on the surface wind stress, we use a parameterisation CD = Cd(A), where A is sea ice concentration (Lüpkes and Birnbaum, 2005). The Ekman pumping velocity (WE) is then calculated with the curl of the surface wind stress as
where f0 is Coriolis parameter calculated for each latitude, ρ0 = 1027.0 kg m−3 is a reference density and ∂x and ∂y are grid size.
4.1 Water masses
The two principal water masses are evident in the Temperature–Salinity (Θ–SA) diagrams from the Monitoring Station and Floats (Fig. 3a–c). At the surface, PW varies strongly over the seasonal cycle, with temperatures ranging from the in situ freezing point in winter to ∼ 8 °C in summer (Fig. 3a–c, d) and salinity ranging from ∼ 31 g kg−1 in summer to 33–33.4 g kg−1 in winter and early spring (Fig. 3a–c, e).
Between 50 m depth and the WGIW boundary, PW maintains a broad temperature range (∼ 0 to 4 °C), with the coldest subsurface temperatures in winter and early spring (Fig. 3b–c, d). After sea-ice melt, surface waters re-stratify and warm, while subsurface PW retains a characteristic temperature minimum. This minimum is most pronounced in summer and persists at greater depths in autumn (Fig. 3d).
Mixing with other water sources accounts for the wide property range of PW. Fresh meltwater pulls the near-surface observations along the runoff line in spring (Fig. 3a–c). Similarly, early autumn observations align with the runoff line, while later in autumn they shift towards the mixing line with submarine meltwater (Fig. 3a–c).
In contrast, WGIW (σ0 > 27.2 kg m−3) shows less temporal variability, with temperatures of 2–4 °C and salinity near ∼ 34.6 g kg−1 (Fig. 3a–e).
4.2 Spatial variability
The five near-synoptic GEM cruises (summers 2022–2024), together with overlapping Float 1 and 2 profiles, reveal significant spatial variability in PW properties across Disko Bay (Fig. 4). This variability is especially pronounced in August, with differences of up to 3 °C along isopycnals in the σ0 < 27.1 kg m−3 range (Fig. 4b, d, f). In all August cruises, the coldest upper layer consistently occurred north of Ilulissat Icefjord, while the southwestern region near Aasiaat exhibited a notably warmer subsurface PW relative to all other areas. The spatial contrasts were most distinct in August 2022 (Fig. 4b), when the southern arm of the trough (near Aasiaat) contained the warmest subsurface PW, the middle arm was slightly cooler, and progressively colder conditions were observed towards the station nearest to the trough, then north of Ilulissat Icefjord, and finally at the Monitoring Station south of Disko Island. The central basin was the coldest area overall, aside from a sharp subsurface temperature minimum at the Monitoring Station.
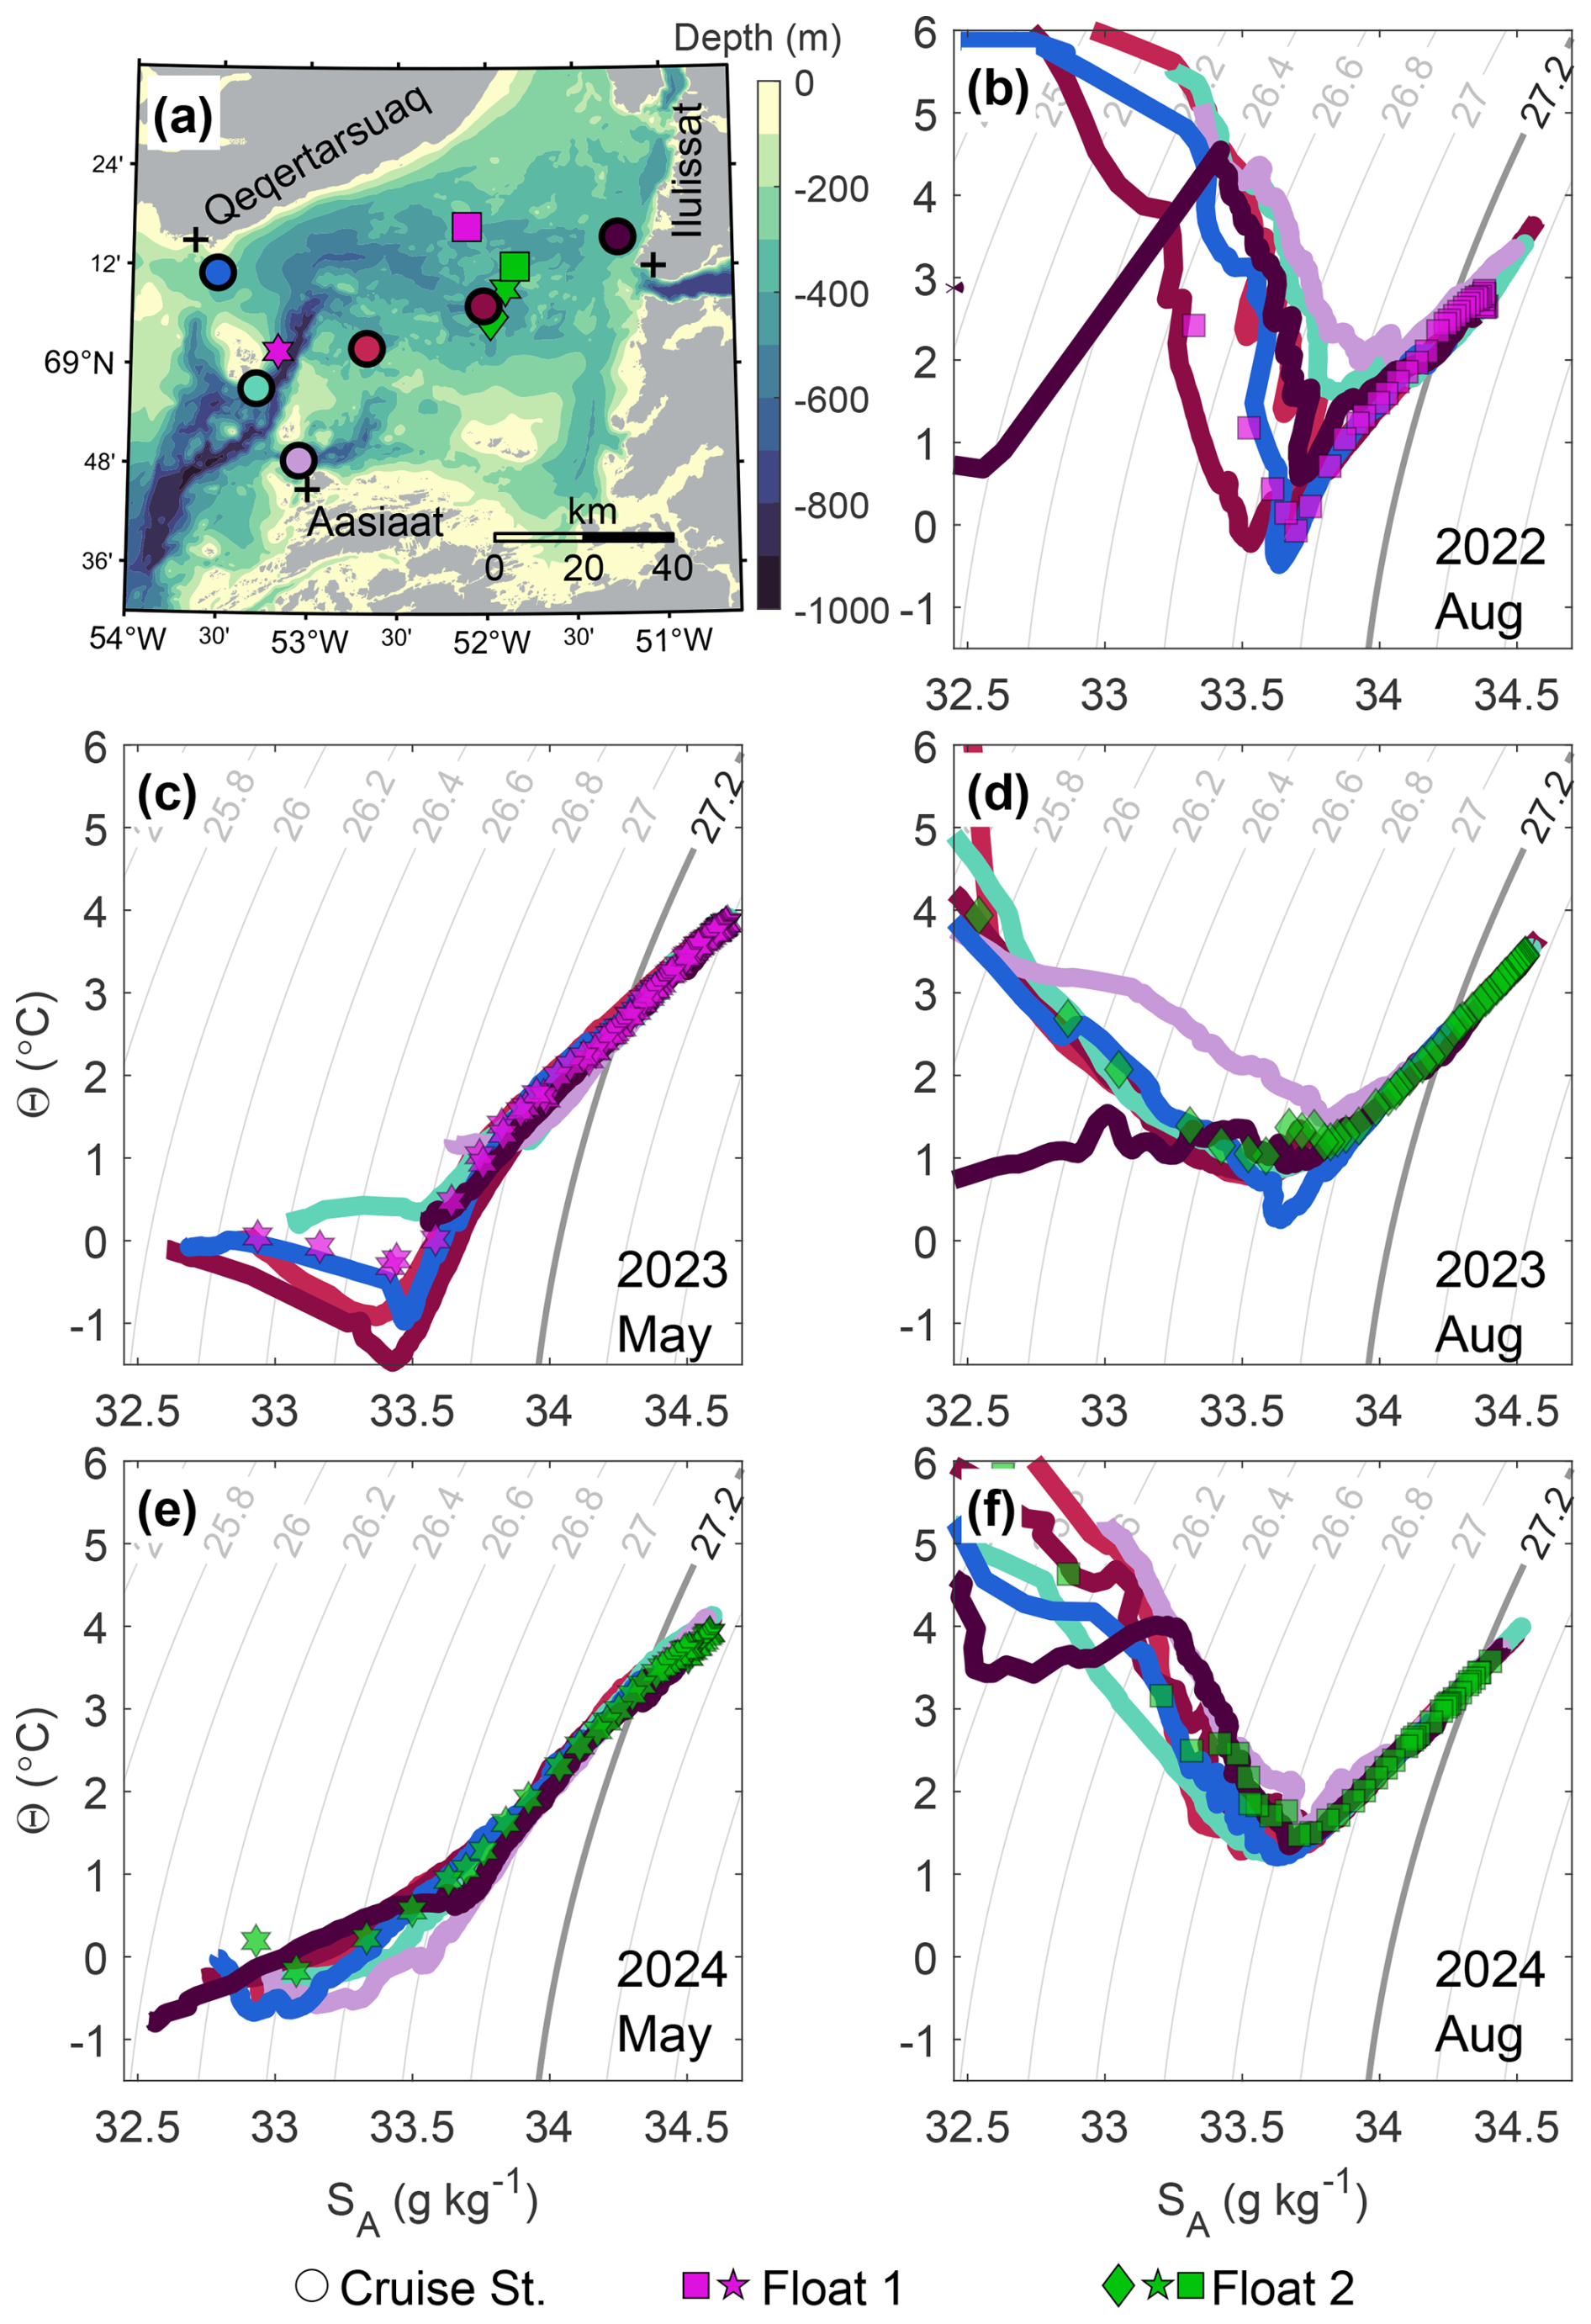
Figure 4Spatial hydrographic variability across Disko Bay from GEM spatial surveys (2022–2024) and float observations. (a) Map of station locations (circle markers). Float 1 profiles are shown as magenta markers (square, pentagram) and Float 2 as green markers (diamond, pentagram, square). (b–f) Temperature–Salinity (Θ–SA) diagrams for each cruise. Left column: May (2023, 2024). Right column: August (2022, 2023, 2024). Coloured lines and float markers correspond to stations and colours shown in (a). Grey contours show isopycnals, with the thick grey contour delineating West Greenland Irminger Water (WGIW) and Polar Water (PW).
In addition to along-isopycnal variability, PW also exhibits substantial variability along depth levels, particularly in August. The pattern is consistent with isopycnals sloping downward towards the coast, as previously documented north of Ilulissat Icefjord (Beaird et al., 2017). In the spatial cruises, the same tendency is evident at the near-coastal stations both north of Ilulissat Icefjord and near Aasiaat, where, for example, the σ0 = 26.7 kg m−3 isopycnal was more than 60 m deeper than in the central parts of the bay.
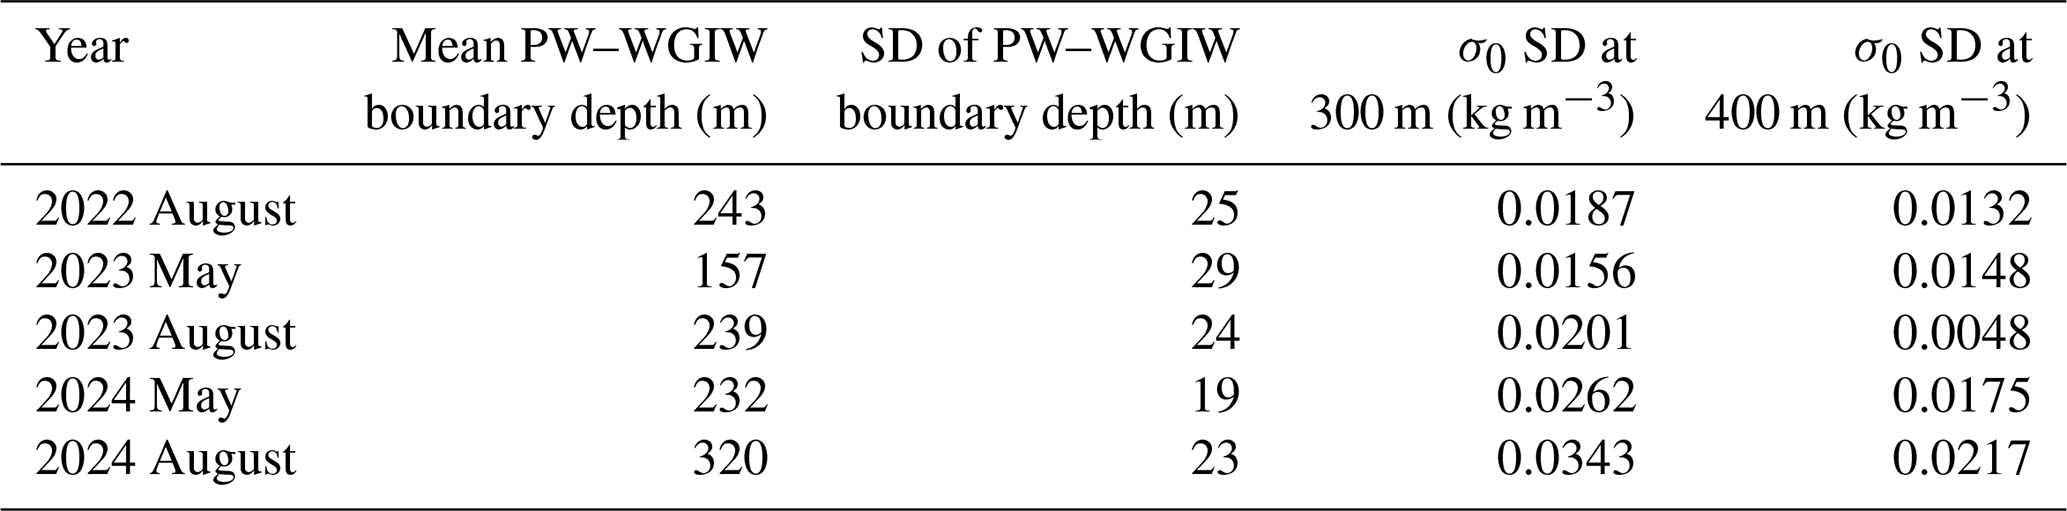
In contrast, WGIW exhibits much weaker spatial variability. Near-synoptic observations within WGIW fall along a narrow line in the Θ–SA space (Fig. 4b–f), indicating minimal variability along isopycnals. Differences are somewhat greater along depth levels, but remain small: the PW–WGIW boundary depth varied by 20–30 m across the bay, and standard deviations in density at fixed depths were relatively small and decreased with depth. The average within-cruise standard deviation was ∼ 0.023 kg m−3 at 300 m and ∼ 0.014 kg m−3 at 400 m, with slightly larger variability in 2024 (both May and August), compared to 2022 and 2023 (Table 2).
Because floats sampled the deeper parts of the bay, analysis of WGIW seasonality relies largely on float data. These observations can be used to assess WGIW variability along isopycnals with confidence, as well as at depth levels, provided that the variability in time exceeds the background spatial variability noted above. The wide spatial coverage of Float 1 in 2022–2023 is considered acceptable for studying WGIW properties, as that period showed limited spatial variability (Fig. 4b, c; Table 2). In contrast, PW seasonality is better assessed from fixed-point observations at the Monitoring Station, since the pronounced spatial variability in PW would obscure the seasonal patterns if Float data are used.
Table 2Spatial variability of West Greenland Irminger Water (WGIW) across Disko Bay from GEM spatial surveys (2022–2024). Variability is reported as the standard deviation of PW–WGIW boundary depth and density at 300 and 400 m depth. Values are calculated within each cruise across all stations.
4.3 Surface mixed-layer modifications
The MLD, mixed-layer salinity, and mixed-layer temperature all exhibit a consistent annual cycle over the observation period (Fig. 5). During winter, mixed-layer temperatures remain at the in situ freezing point (Fig. 5b), while sea-ice formation increases mixed-layer salinity through brine rejection (Fig. 5c). The maximum MLD occurs in winter, reaching 61 m in February 2023 and 48 m in January 2024. Continued sea-ice formation increases mixed-layer salinity to a peak of 30–33.4 g kg−1 in March (Fig. 5c), although enhanced stratification and elevated salinity below the mixed layer limit further deepening (Fig. 2e–f).
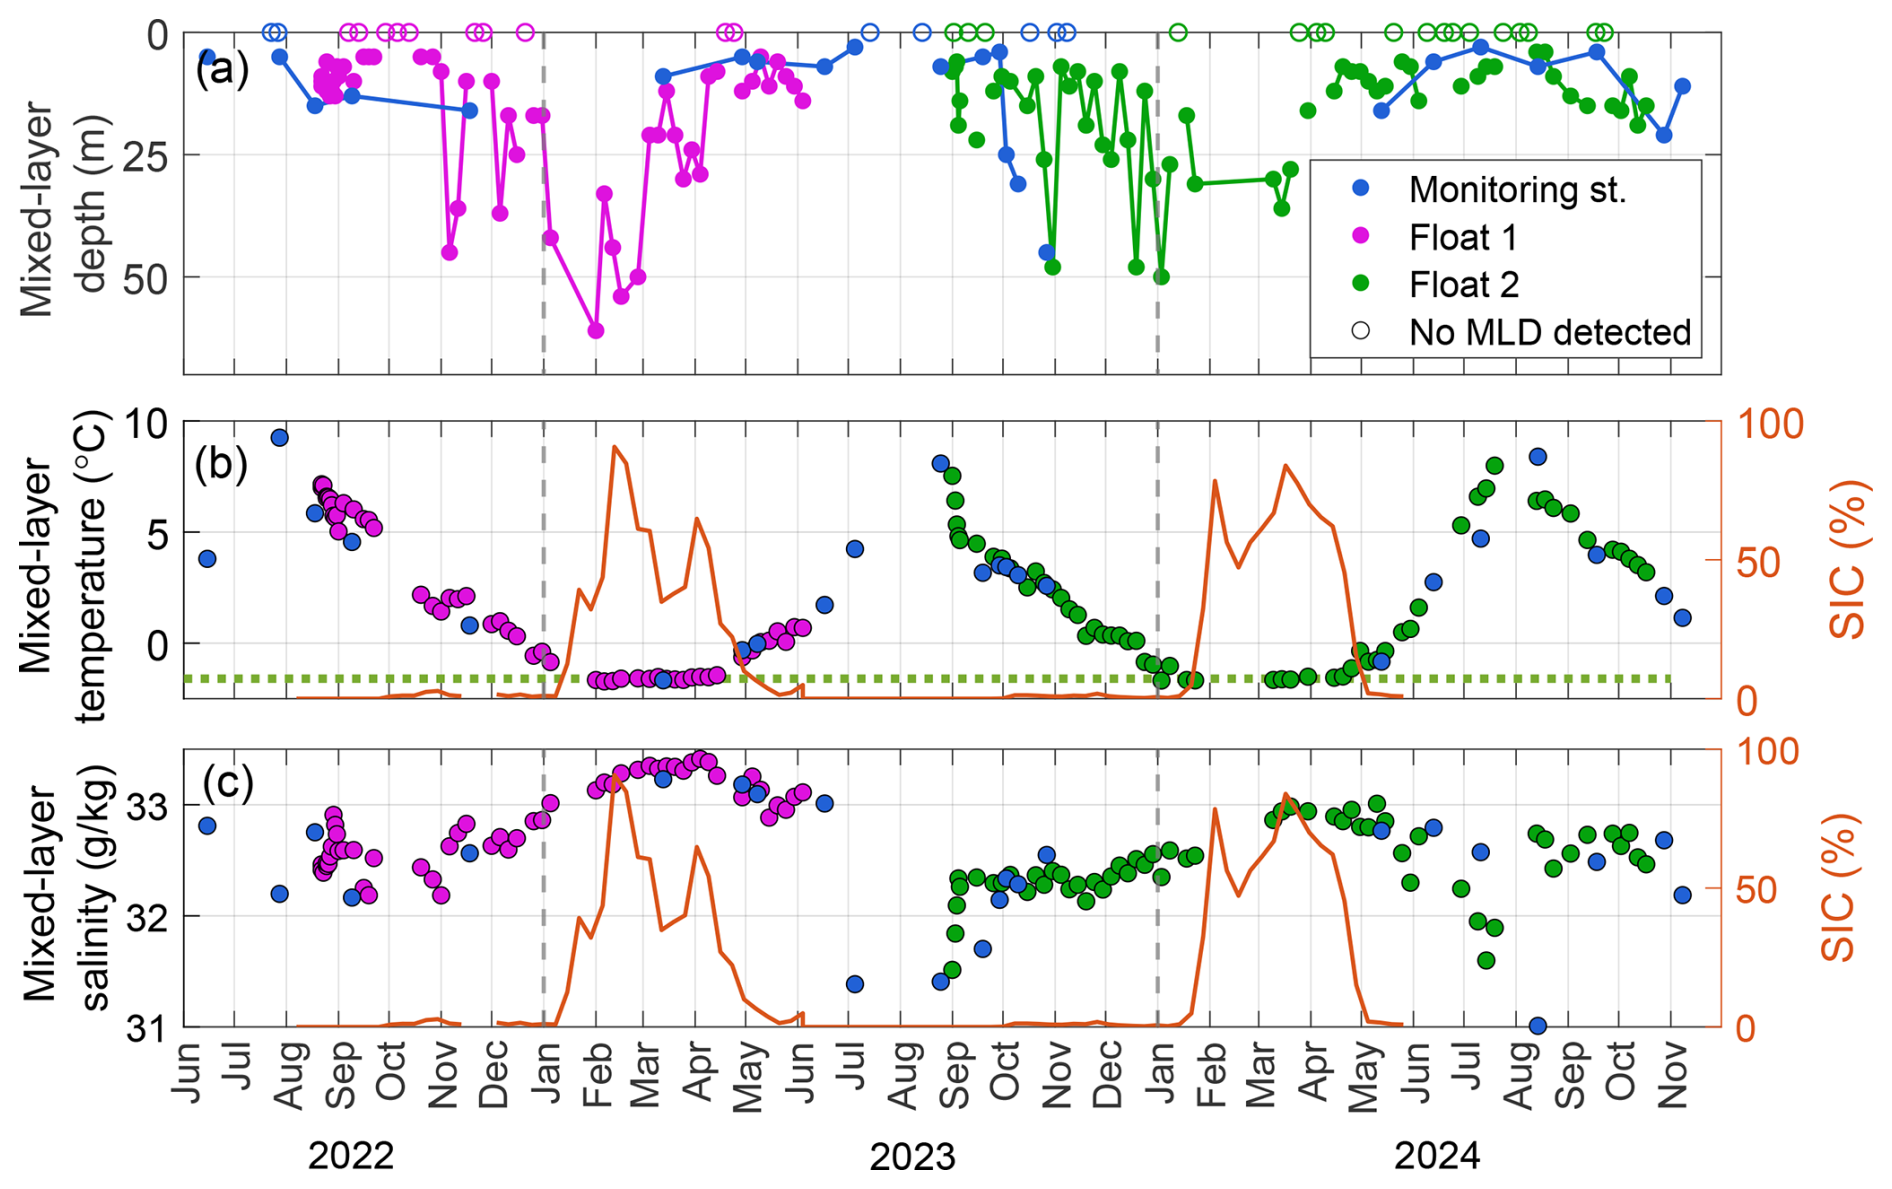
Figure 5Time series of mixed-layer properties in Disko Bay from 2022 to 2024. (a) Mixed-layer depth (MLD), (b) mixed-layer temperature, and (c) mixed-layer salinity. Sea-ice concentration (SIC) within Disko Bay is shown in orange (right axis in b–c). Data are from the Monitoring Station (blue), Float 1 (magenta), and Float 2 (green). Empty circle markers in (a) indicate times when the mixed layer was not detectable.
As sea ice starts to melt in late April, the mixed layer warms and freshens. This timing is consistent for both 2023 and 2024 and agrees well with satellite-derived SIC, which drops below 10 % at that time (Fig. 5b–c). Sea-ice melt establishes a shallow mixed-layer (MLD < 20 m), which warms rapidly due to solar insolation (Fig. 5a–b). Through summer, increasing freshwater input lowers mixed-layer salinity by ∼ 2 g kg−1, resulting in either a shallow or absent mixed layer (empty markers in Fig. 5a). By August–September, mixed-layer salinity reaches its minimum (31–31.4 g kg−1), while temperature peaks at 8–10 °C (Fig. 5b–c).
In autumn, the mixed layer cools and deepens, accompanied by a gradual increase in salinity, returning the system to winter conditions and completing the annual cycle.
4.4 Seasonality of Polar Water
At the onset of summer, near-surface salinity reduces in conjunction with mixed-layer freshening (Fig. 2c–d), establishing a stratified layer with a core that is bound approximately by the σ0 = 26.5 kg m−3 isopycnal (Fig. 2e–f). As freshwater input and surface warming intensify, the stratified layer thickens and extends to greater depths, reaching 50 m by late summer, and rapidly extending to > 100 m during autumn (Fig. 2e–f). Although both the Floats and the Monitoring Station capture this seasonal evolution, we assess PW seasonality primarily from the three-year Monitoring Station observations to avoid conflating the substantial spatial variability in PW that Floats would capture (Sect. 4.2).
The mean salinity of the upper 120 m, encompassing the depth range of the stratified fresh layer (σ0 < 26.5 kg m−3), shows a recurring seasonal reduction beginning in June (2023) or July (2022, 2024) and continuing until Monitoring Station observations end in November (Fig. 6a). The magnitude of the summer–autumn freshening varies interannually, reaching ∼ 0.5 g kg−1 in 2022, ∼ 1 g kg−1 in 2023, and ∼ 0.6 g kg−1 in 2024. Within the σ0 < 26.5 kg m−3 layer, temperature rises through summer, peaks in August–September, and subsequently cools in autumn while salinity continues to decline (Fig. 6a–b).
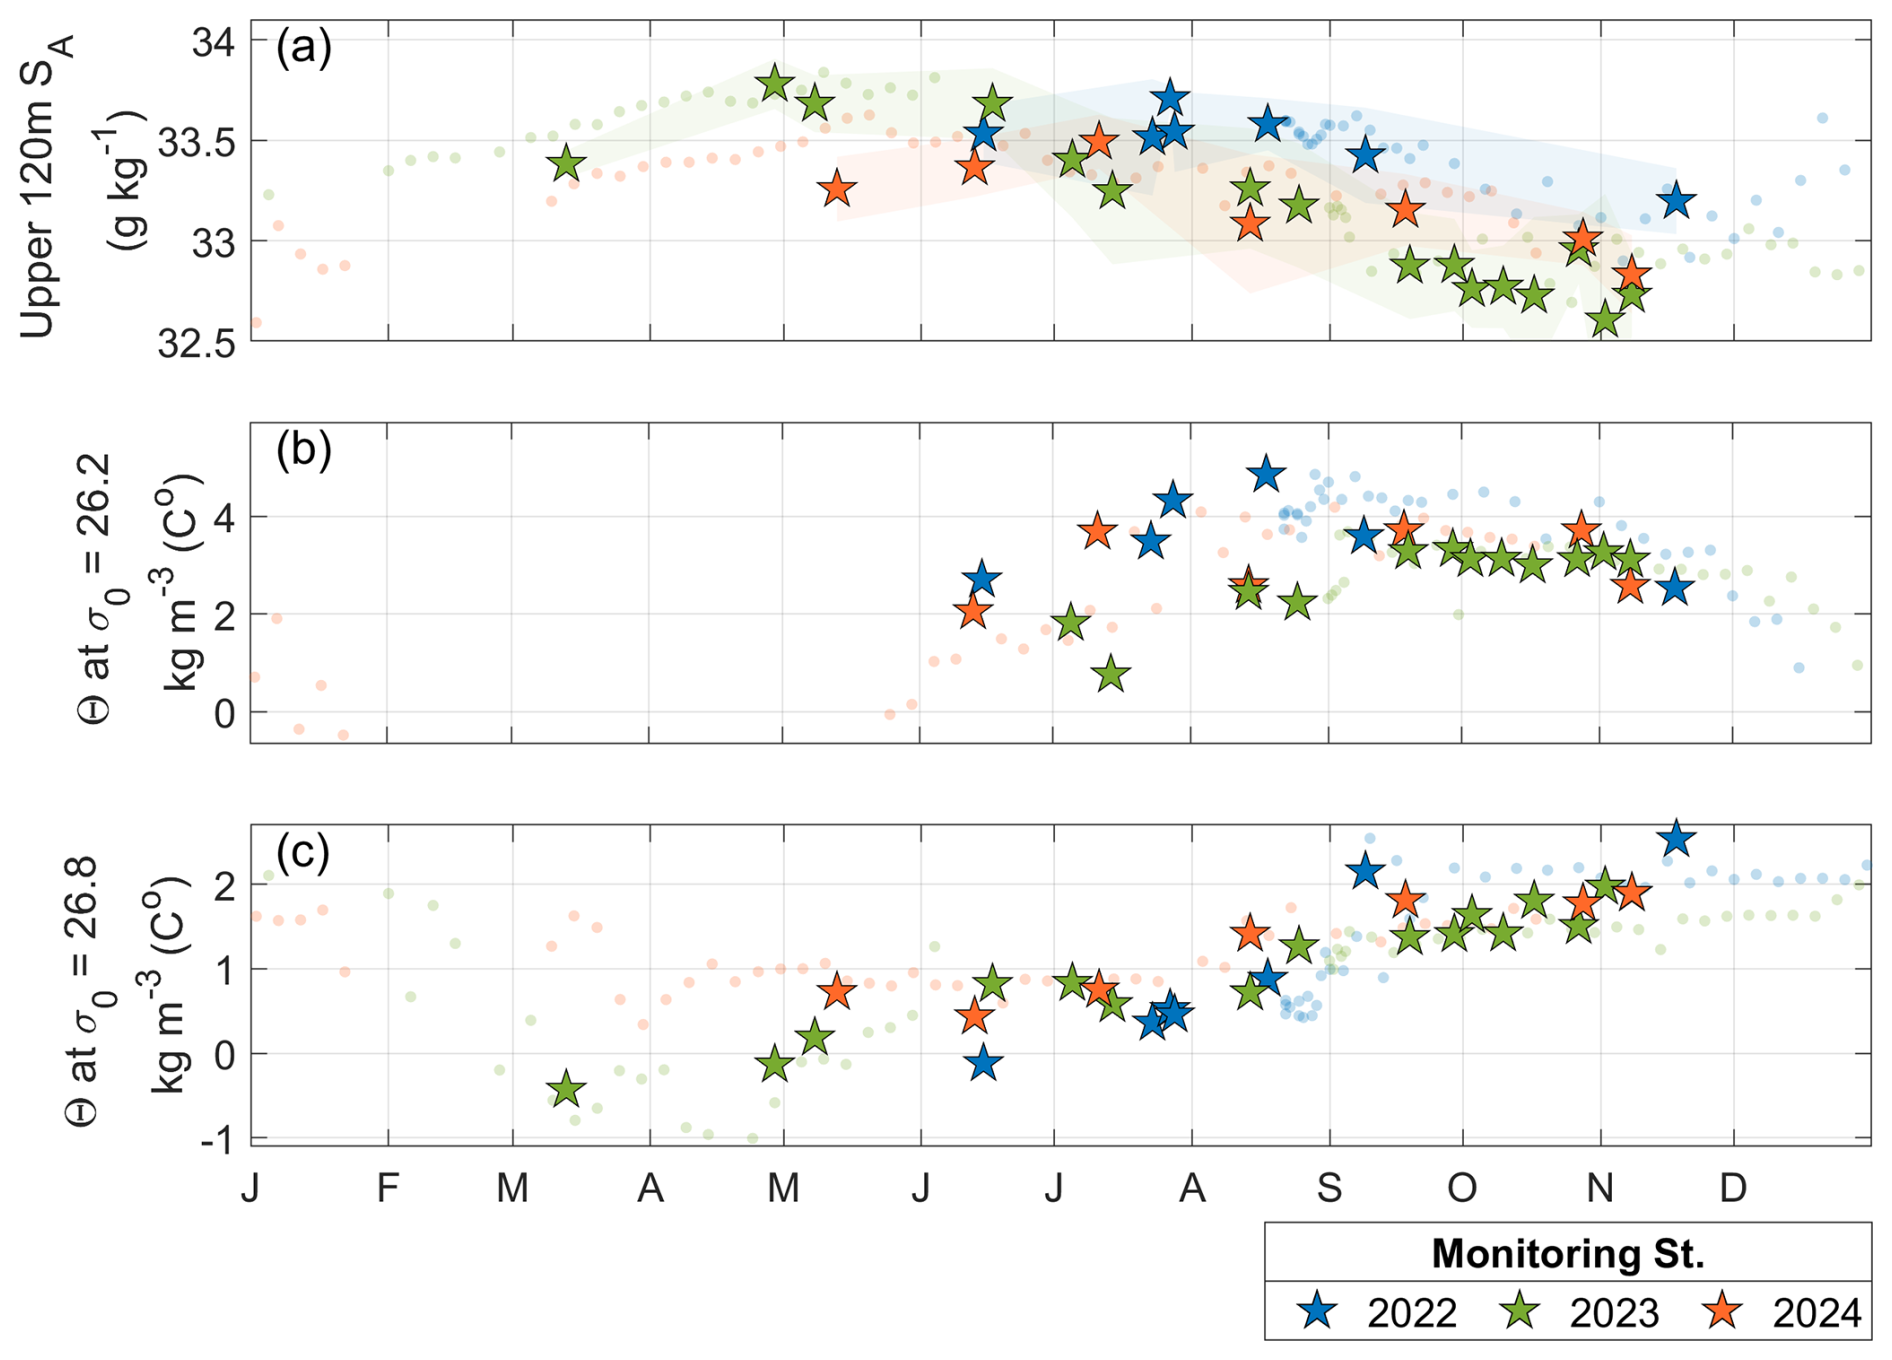
Figure 6Seasonal cycle of (a) mean salinity in the upper 120 m (one standard deviation shaded in the background), (b) along-isopycnal temperature at σ0 = 26.2 kg m−3, and (c) along-isopycnal temperature at σ0 = 26.8 kg m−3. Monitoring Station observations for 2022, 2023, and 2024 are shown with blue, green, and orange star markers, respectively. Faint background markers show Float 1 and 2 observations, included here for reference.
Beneath this layer, denser PW (σ0≈26.5–27.1 kg m−3) maintains the summer temperature minimum characteristic of PW (Fig. 3d). In contrast to the lighter PW above (Fig. 6b), along-isopycnal temperatures within this denser PW layer continue to increase steadily through autumn – rising by 1.6 °C in 2022, 1.1 °C in 2023, and 0.4 °C in 2024 between August and November (Fig. 6c).
In Θ–SA space, this steady autumn warming of the denser PW (σ0≈26.5–27.1 kg m−3) appears as a gradual erosion of its sharp summer temperature minimum, with Θ–SA properties shifting towards warmer values during autumn (Fig. 7a–c). Given the strong spatial variability in August PW properties (Sect. 4.2; Fig. 4b, d, f), the warming at the Monitoring Station likely reflects advection from upstream. In August, the station near Aasiaat, in the bay's southwestern corner, consistently had the warmest PW, whereas the Monitoring Station had the coldest PW temperature minimum. When the August Θ–SA properties from Aasiaat are overlaid onto the Monitoring Station data, the latter's October–November properties closely resemble those observed upstream two to three months earlier (Fig. 7a–c), consistent with cyclonic circulation and advection of water masses. The ∼ 170–200 km distance between Aasiaat and Monitoring Station implies mean velocities of ∼ 3.3–3.9 and ∼ 2.2–2.6 cm s−1 for a two- and three-month lag, respectively.
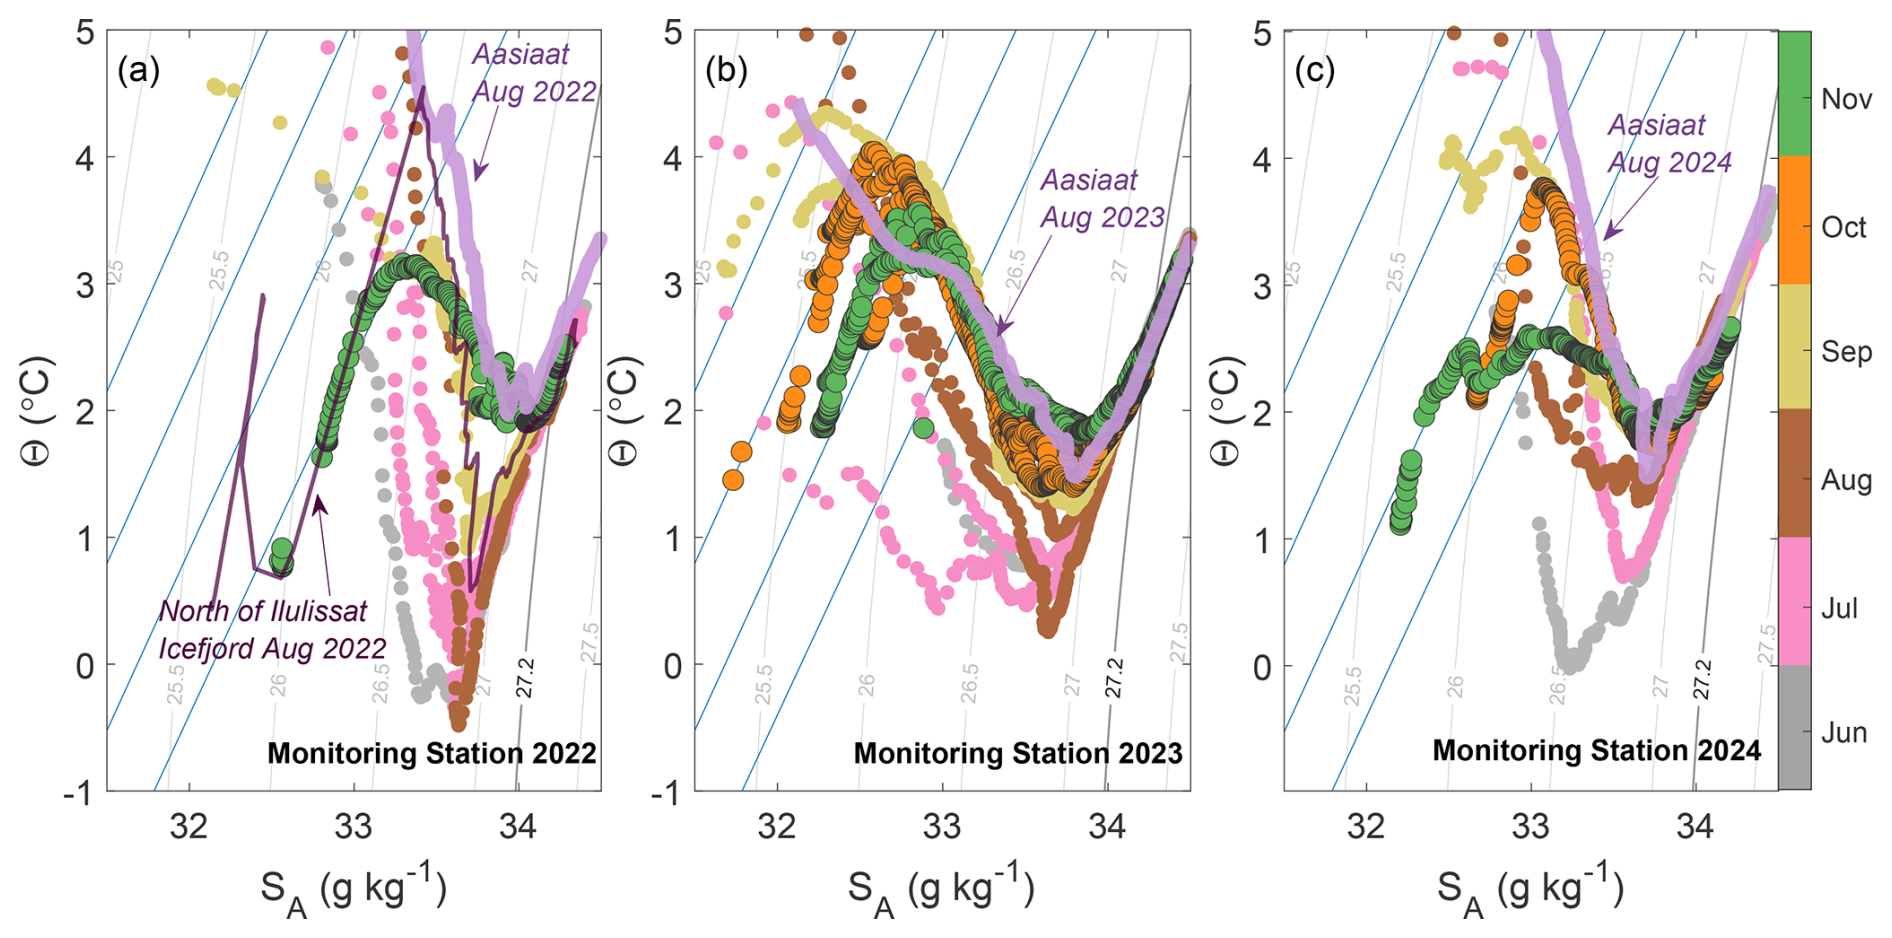
Figure 7Temperature–Salinity (Θ–SA) diagrams for the Monitoring Station for (a) 2022, (b) 2023, and (c) 2024, covering June–November. Circle markers are observations coloured by month; October–November are shown with a black outline. The thick lilac line in (a)–(c) shows Θ–SA properties at the station near Aasiaat during August of the same year (previously shown in Fig. 4b, d, f); the thin purple line in (a) is the same, but for the station north of Ilulissat Icefjord. Isopycnals are shown in grey, with the thick contour delineating West Greenland Irminger Water (WGIW) and Polar Water (PW). Submarine meltwater ( °C, SA = 0 g kg−1) mixing lines are shown in blue.
The magnitude of autumn warming at the Monitoring Station along a given isopycnal matches the temperature difference between the Monitoring Station and the Aasiaat station along that same isopycnal in August. For example, along σ0 = 26.8 kg m−3, warming from August to November was 1.65 °C in 2022, 1.1 °C in 2023, and 0.48 °C in 2024 along σ0 = 26.8 kg m−3 (Fig. 6c). These values are comparable to the corresponding along-isopycnal temperature offsets between the Monitoring Station and Aasiaat station in August: 1.89 °C in 2022, 1.1 °C in 2023, and 0.56 °C in 2024 (Fig. 7).
A similar relationship was found only once between the Monitoring Station and the station north of Ilulissat Icefjord. In 2022, denser PW properties at the Monitoring Station in September resembled those north of Ilulissat Icefjord in August. The 1.2 °C warming along σ0 = 26.8 kg m−3 between August and September at the Monitoring Station (Fig. 6c) was comparable to the 1.04 °C temperature difference between the two locations in August 2022 survey (Fig. 7a). The distance of ∼ 90 km and a 1-month lag yield mean velocities of ∼ 3.5 cm s−1.
4.5 Seasonality of West Greenland Irminger Water
At depths larger than 300 m, WGIW is isolated within Disko Bay by shallow bathymetric barriers (245 m at the entrance to Vaigat Strait, 245 m at Ilulissat Icefjord, 300 m at EDS; Fig. 1b). Regarded as basin water, WGIW can be renewed if equally dense or denser waters pass over the topographic constraints (Gade and Edwards, 1980), with the deepest and most relevant being the EDS (Andersen, 1981a; Gladish et al., 2015a). The onset of a WGIW renewal is characterised by an increase in density below 300 m.
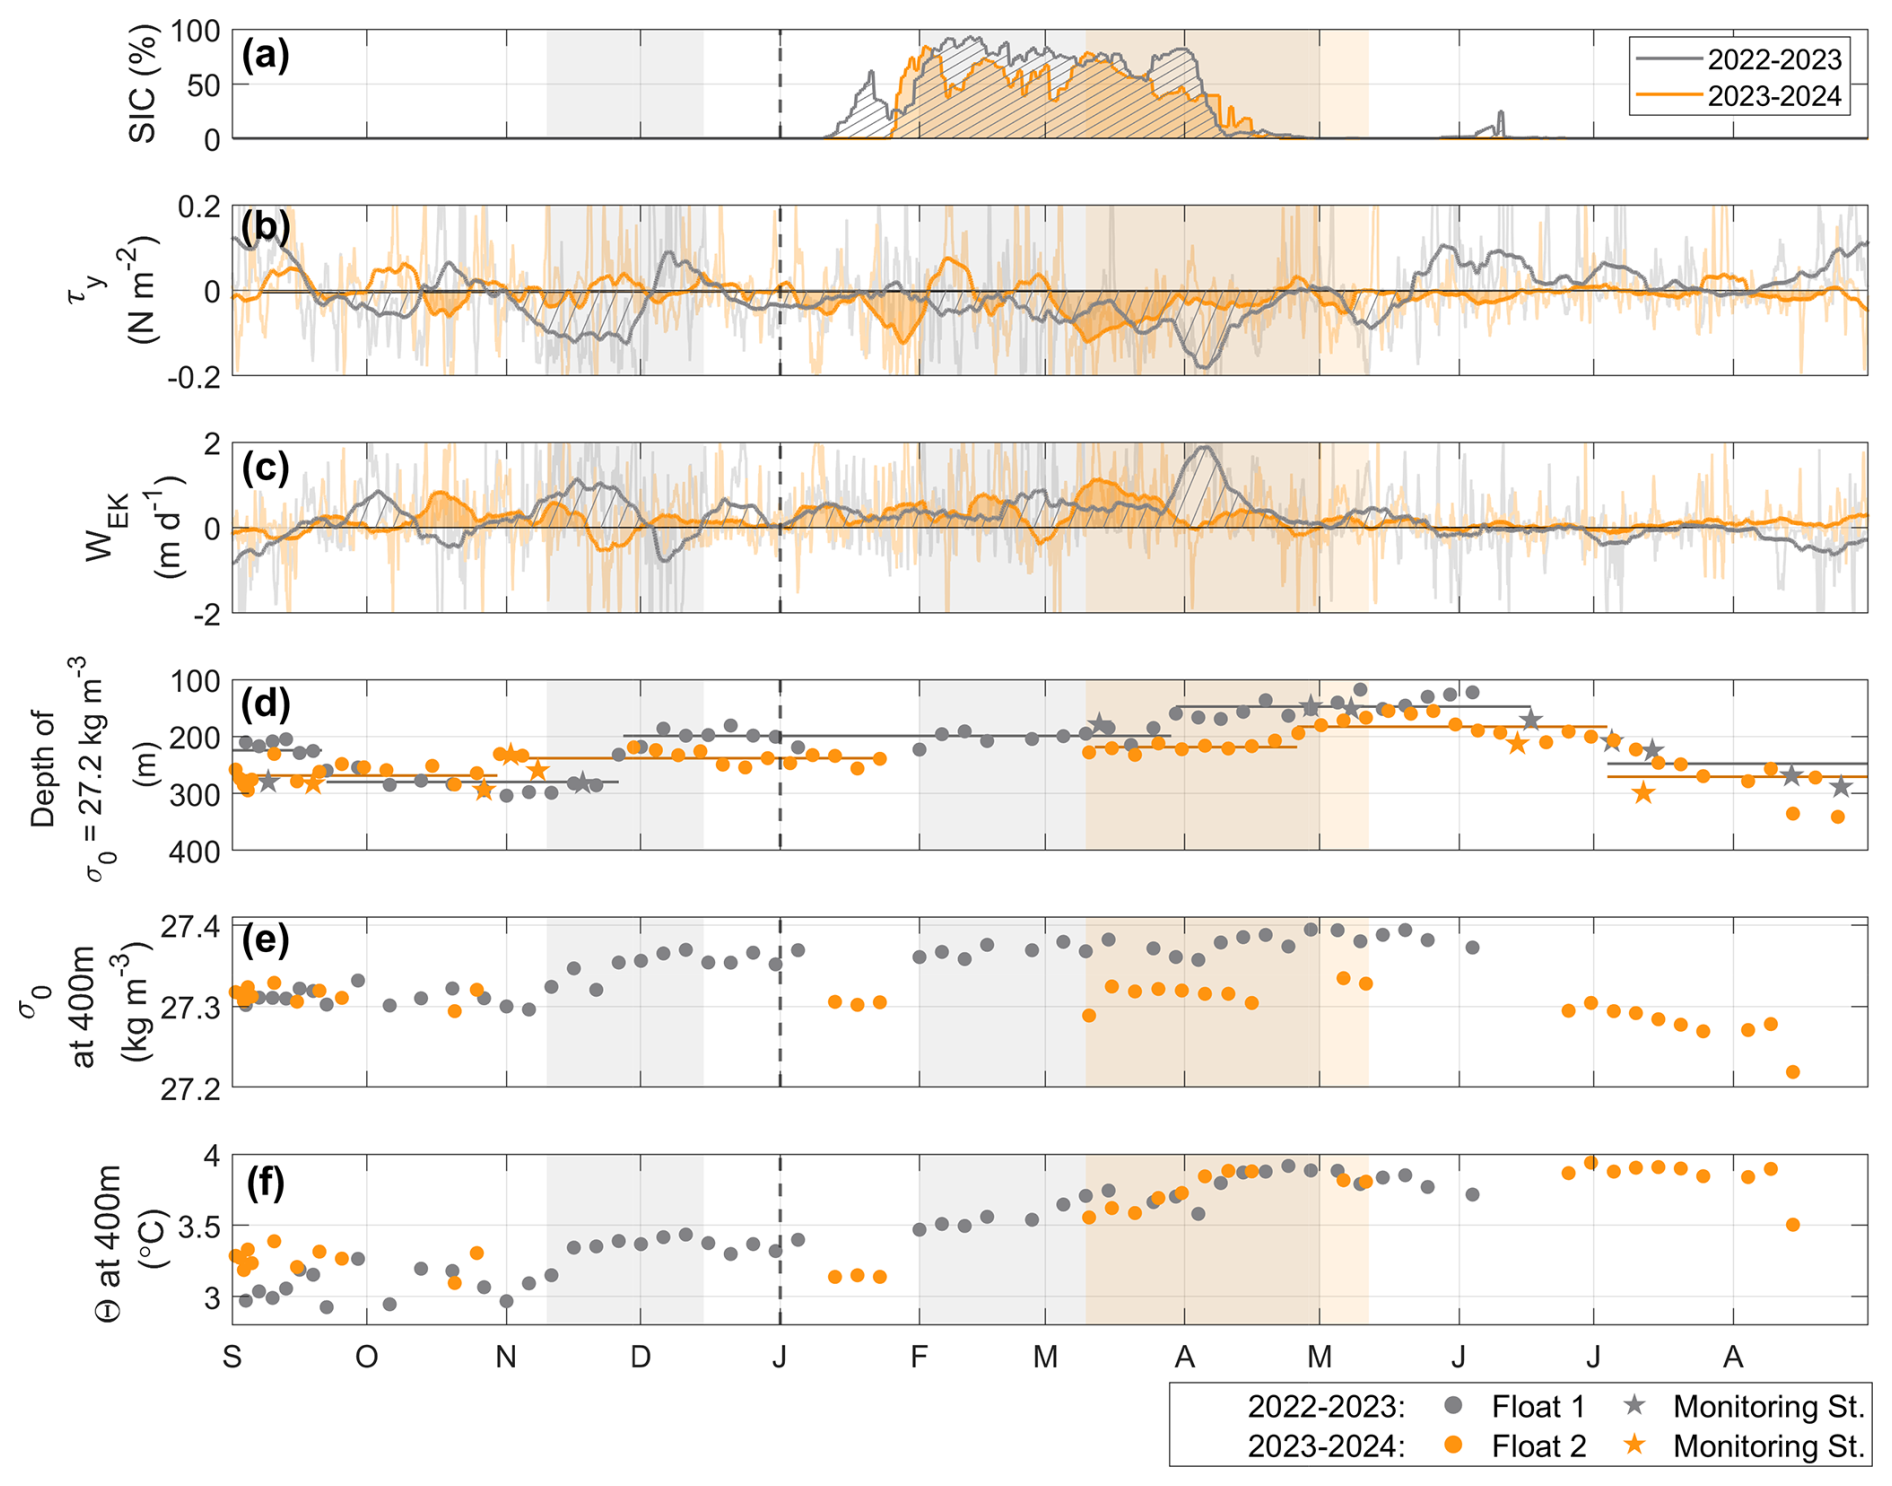
Figure 8Seasonality of atmospheric forcing and WGIW properties in Disko Bay over two annual cycles (2022–2023 in grey, 2023–2024 in orange, circle markers for the Floats, star markers for the Monitoring Station). Mean sea-ice cover (a), along-shore wind stress (τy) (b), and vertical velocity WE (Ekman pumping) over the EDS area (Fig. 1a) (c). In (b)–(c), hourly data are overlaid with a 10 d running mean (thick lines); shaded and hatched areas highlight the negative and positive ranges in (b) and (c), respectively. Depth of the σ0 = 27.2 kg m−3 – upper WGIW boundary (d), with horizontal lines indicating the mean depth before abrupt changes, identified using MATLAB findchangepts() function (MathWorks Inc., 2025). Density (e) and temperature (f) at 400 m depth from Float 1 and Float 2. Basin renewal periods are shaded in all panels. The dashed vertical line in all panels marks a new year.
In early November 2022, basin density at 400 m increased from a September–October mean of σ0(400 m) = 27.31 to 27.36 kg m−3 by early December (grey shading in November–December in Fig. 8e). Basin temperatures rose simultaneously by ∼ 0.3 °C (Fig. 8f). Around two weeks after the onset of density increase, the upper WGIW boundary (σ0 = 27.2 kg m−3) shoaled rapidly by > 100 m within a span of two weeks (Fig. 8d), reflecting the uplift of lighter WGIW that previously resided in the basin. This renewal coincided with a seasonal shift in prevailing wind direction, whereby the along-coast (north–south) winds switched from being predominantly southerly in summer to northerly in autumn to spring (from positive wind stress values to negative in Fig. 8b). In the absence of strong sea-ice cover, northerly winds (negative wind stress) drive upwelling over the Egedesminde Dyb and its sill (Egedesminde Dyb Sill, EDS). Using hourly data, we define “strong upwelling” as WE ≥ 0.45 m d−1 (upper quartile of the hourly data distribution), typically derived under N m−2. November 2022 exceeded these thresholds with N m−2 and m d−1 (Fig. 8b, c); WE frequently exceeded 1 m d−1 (upper quartile), with episodic peaks approaching 3 m d−1. The strength and persistence of this forcing appear to have lifted the dense waters to the west over EDS, initiating the observed basin renewal in November–December 2022 (Fig. 8d–f).
Through winter 2022–2023, basin density continued to rise gradually from σ0(400 m) = 27.36 to 27.39 kg m−3 between February and late April (Fig. 8e), accompanied by a further ∼ 0.5 °C increase in basin temperature which reached the annual peak at the end of April 2023 (Fig. 8f). This dense renewal lifted the overlying WGIW, which continued to rise until early June, when the upper WGIW boundary (σ0 = 27.2 kg m−3) rose to a minimum depth of 120 m (Fig. 8d). Northerly winds ( to −0.07 N m−2, upper quartile N m−2), Ekman divergence, and positive vertical velocities (–0.82 m d−1, upper quartile ≥ 1.5 m d−1) persisted through February–April until the prevailing winds reversed in mid-May, ending the upwelling-favourable conditions (Fig. 8b–c).
In autumn 2023, the upper WGIW boundary (σ0 = 27.2 kg m−3) shoaled by ∼ 50 m in early November (Fig. 8d). There were no Float observations deep enough in the basin to document subsequent changes until early winter. However, as neither density nor temperature increased from October 2023 until January 2024, basin renewal likely did not occur. The average wind stress was near zero from September to December, with brief episodes of negative τy in October and November (Fig. 8b). Calculated upwelling velocities were m d−1 in October, with short-lived episodes of WE>0.6 m d−1 (upper quartile), but overall, the forcing was weaker and less persistent than in November 2022 (Fig. 8c).
There are signs of a renewal in March–April 2024, when σ0(400 m) increased by 0.01 kg m−3 and the temperature rose by ∼ 0.3 °C within one month (orange shadings in Fig. 8e, f). Lack of observations between 23 January and 11 March hinders the ability to determine when this renewal began; however, density and temperature in the basin were already higher by 0.02 kg m−3 and ∼ 0.4 °C by 11 March, suggesting it was already underway. Winds during January–April were upwelling-favourable ( to 0.05 N m−2), with mean vertical velocities of 0.1–0.6 m d−1. The strongest forcing (upper quartile) occurred in March with N m−2 and WE ≥ 1.1 m d−1. By late May–early June 2024, the WGIW boundary rose to a minimum depth of ∼ 150 m (Fig. 8d).
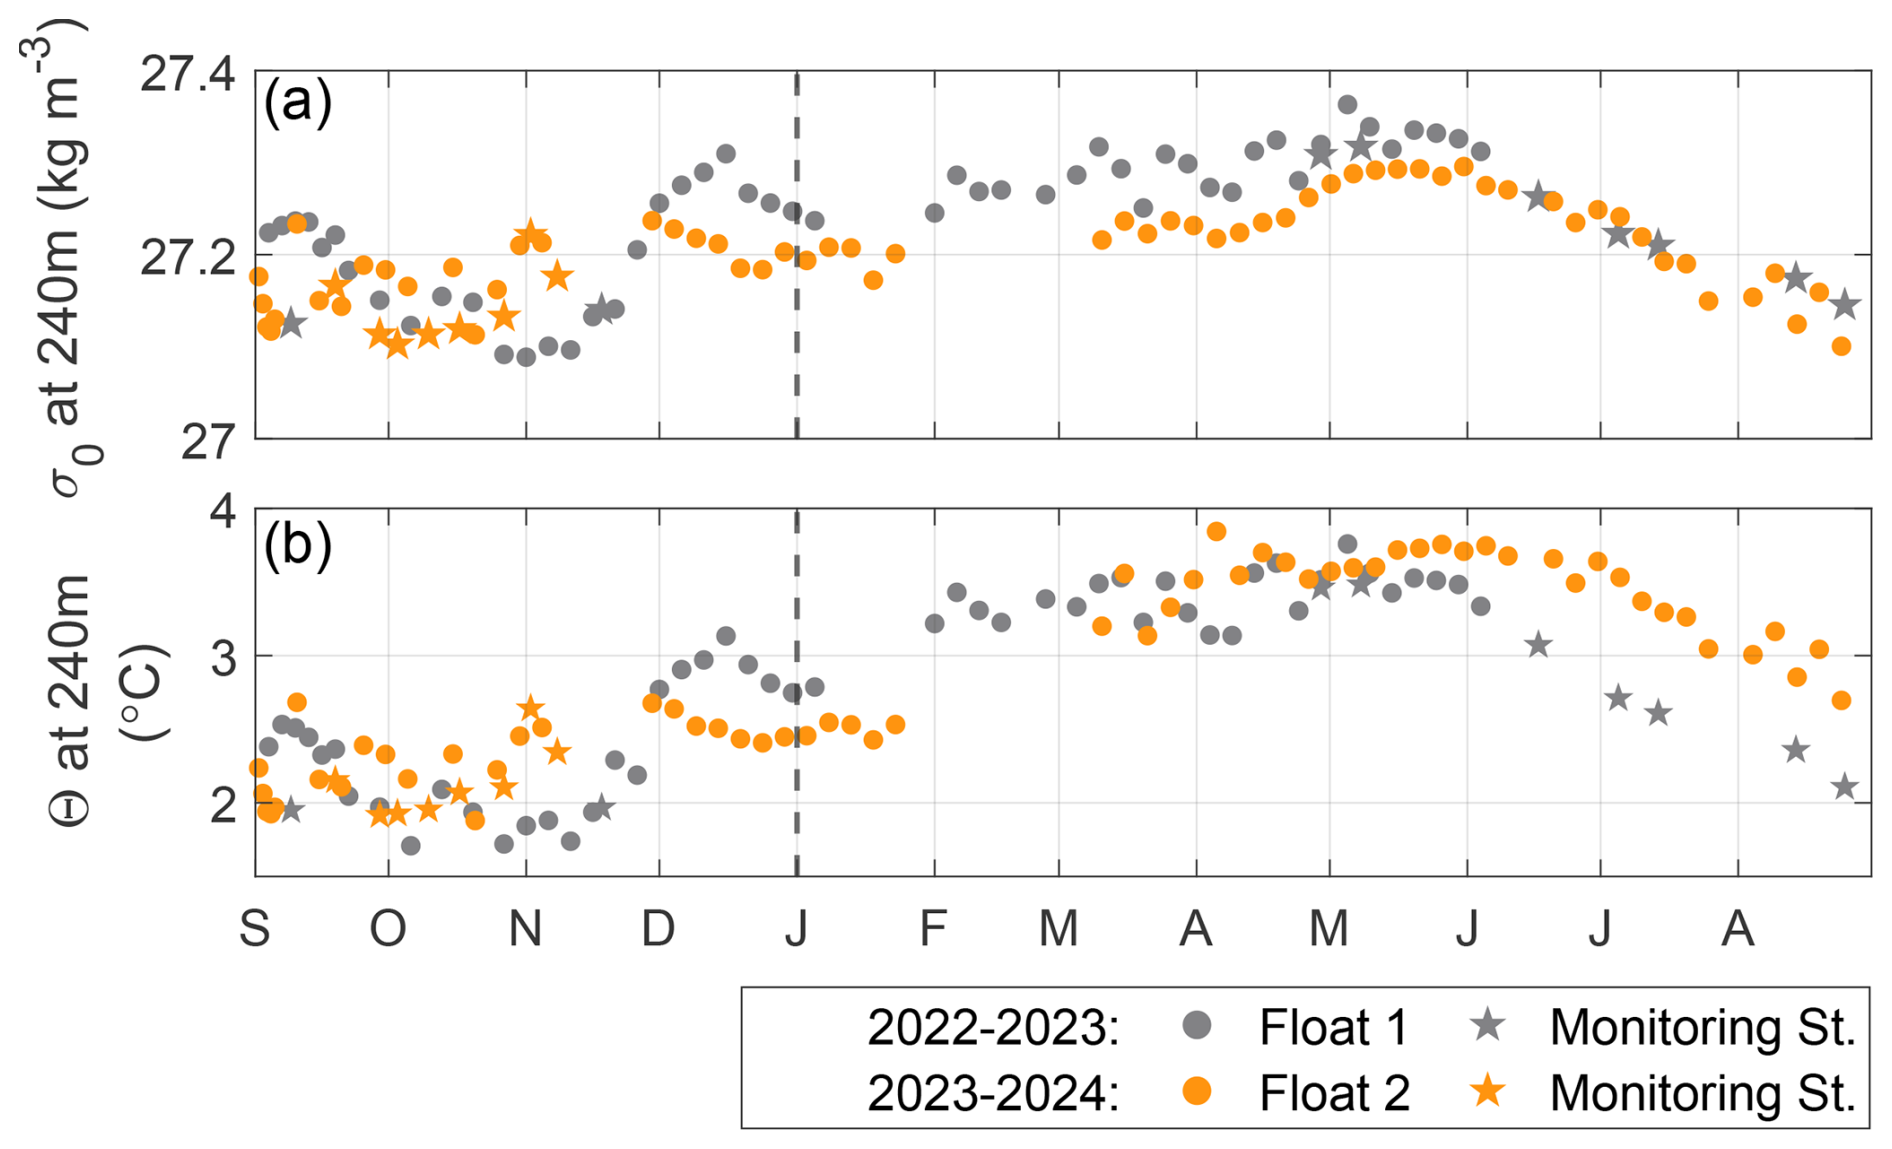
Figure 9Seasonal cycle of (a) density and (b) temperature at 240 m depth, corresponding to the Ilulissat Icefjord Sill depth. Grey markers are observations from 2022–2023, and orange from 2023–2024. Star markers are for the Monitoring Station observations, and circles for the Floats 1 and 2.
In both years, the upper WGIW boundary was shallowest in May–June, shoaling to 120 m in 2023 and 150 m in 2024 (Fig. 8d). This uplift brought WGIW waters in Disko Bay above 240 m depth, corresponding to the Ilulissat Icefjord sill depth. At 240 m depth, density showed a pronounced seasonal cycle, peaking at σ0 = 27.3–27.35 kg m−3 in May and declining to a minimum of σ0 = 27.1 kg m−3 in August–November (Fig. 9a). Temperature at 240 m varied in parallel, with an amplitude of ∼ 2 °C and maxima above 3.5 °C in May–June (Fig. 9b). A renewal event in November–December 2022 resulted in ∼ 1 °C warming at 240 m (Fig. 9b).
Our results documented two full annual cycles (2022–2024) of hydrographic properties within Disko Bay. Beyond the expected seasonality in the surface mixed layer (Fig. 5), we observed notable seasonal and spatial variability within PW and a recurring inflow of dense WGIW that replenishes the deep basin and elevates the WGIW–PW interface. Our results reflect the renewed “warm” state of Disko Bay that has persisted since 2020 (Picton et al., 2025), following the short-lived anomalously cool period of 2015–2019 (Khazendar et al., 2019; Picton et al., 2025).
The seasonal cycle of PW can be divided into three phases: (1) in winter–spring, cooling, sea-ice formation, and brine rejection increase the density and depth of the mixed layer; (2) with the onset of the melt season, a fresh stratified layer develops in the upper 50 m, bounded by the σ0 = 26.5 kg m−3 isopycnal (Fig. 2e); and (3) in late summer–autumn, stratified layer (σ0 < 26.5 kg m−3) extends over 120 m while freshening and cooling (Fig. 6a–b), and the denser PW beneath (σ0 ≈ 26.5–27.1 kg m−3) warms steadily along isopycnals (Figs. 6c; 7). In the following sections, we examine the mechanisms driving this autumn evolution of PW before turning to the renewal of WGIW.
5.1 Autumn evolution of Polar Water
5.1.1 Remote and local drivers of autumn freshening
Both remote and local processes can contribute to the autumn freshening observed in the upper 120 m (Fig. 6a) and the associated vertical expansion of the stratified layer (Fig. 2e). The primary remote source is advection of signals from the West Greenland Current (WGC). Observations from the Davis Strait show a clear annual cycle in salinity, with peak salinities along the west Greenland shelf between April–June (33.66 g kg−1) and a decrease towards the annual minimum in August–October (32.75 g kg−1) (Curry et al., 2014; Carroll et al., 2018). Similar seasonality occurs along the shelf-slope at ∼ 150 m (Gladish et al., 2015b). Given that Davis Strait lies ∼ 400 km south of Disko Bay and the subsurface WGC velocity is ∼ 0.07 m s−1 in autumn (Curry et al., 2014), these signals could reach Disko Bay with a delay of about two months, consistent with the timing of autumn freshening at the Monitoring Station (Figs. 2d, f; 6a). However, minimum density and salinity at ∼ 150 m in Davis Strait tend to be higher (σ0 > 27 kg m−3 and SA > 33.8 g kg−1) (Gladish et al., 2015b) than those observed at the same depth in Disko Bay during autumn (Fig. 2c–d), suggesting that local freshwater inputs within Disko Bay likely contribute as well.
The significant local source is Sermeq Kujalleq, which delivers large summertime freshwater fluxes through subglacial discharge (900 m3 s−1) (Mernild et al., 2015; Enderlin et al., 2016) and submarine meltwater (70–400 m3 s−1) (Enderlin et al., 2016; Kajanto et al., 2023). A mix of these melt products, together with entrainment of PW and WGIW, forms glacially modified water, whose vertical reach is strongly controlled by subglacial discharge seasonality (Cowton et al., 2023; Kajanto et al., 2023; Hager et al., 2024). Icebergs within Ilulissat Icefjord are a dominant freshwater contributor (700–1000 m3 s−1 in winter, up to 1200–1800 m3 s−1 in August) (Enderlin et al., 2016; Kajanto et al., 2023), altering water mass properties within the fjord, modifying the neutral buoyancy depth of glacially modified water, and cooling the fjord basin through reflux of outflowing water (Kajanto et al., 2023; Hager et al., 2024). The glacially modified water exported from the fjord over the sill flows north in Disko Bay as a buoyant stratified current, with a cold, fresh signature extending to at least 100 m depth near the shore (Beaird et al., 2017). Offshore, this layer shoals to ∼ 35 m, but retains its signature up to 10 km offshore (Beaird et al., 2017). Our spatial analysis detected similar anomalies each August north of Ilulissat Icefjord (Fig. 2b, d, f). Given that the peak melt season in the fjord occurs in July–August (Wood et al., 2025; Picton et al., 2025; Mernild et al., 2015; Enderlin et al., 2016; Kajanto et al., 2023), the export of a thick meltwater-laden layer of glacially modified water could contribute to the freshening observed downstream at the Monitoring Station during autumn. Continued iceberg melt after the melt season (Moon et al., 2018; Kajanto et al., 2023) may also explain why autumn observations in the Θ–SA diagram aligned with the submarine meltwater mixing line (Figs. 3a–c; 7a–c). While such alignment could reflect inputs of iceberg melt, it might also result coincidentally from autumn cooling, and disentangling these processes would require additional tracers (Beaird et al., 2015, 2018; Lindeman et al., 2024).
Finally, the iceberg melt within Disko Bay itself provides an additional but smaller freshwater input. The annual average solid ice discharge at the terminus of Sermeq Kujalleq is ∼ 50 Gt yr−1, equivalent to ∼ 1500 m3 s−1 (Mankoff et al., 2020). Given that the annual average iceberg melt inside the fjord is ∼ 1200 m3 s−1 (Kajanto et al., 2023), up to 80 % of discharged icebergs likely melt inside Ilulissat Icefjord. The remaining fraction can cross the sill and enter Disko Bay, where more than 1000 small icebergs (with an area of about 1800 m2) can be observed simultaneously (Scheick et al., 2019). To estimate their potential freshwater flux, we represent an average iceberg of this size as ∼ 130 m in length and width. Icebergs in Ilulissat Icefjord are typically twice as wide as they are thick (Enderlin et al., 2016), giving an estimated thickness of ∼ 65 m (freeboard+draft). Using the freeboard-to-draft ratio of 1 : 7 (Cenedese and Straneo, 2023), we estimate the draft of ∼ 55 m. Given the average summertime temperature of 2 °C in the upper 50 m, and assuming fully turbulent conditions around the iceberg, we estimate that the upper bound of summertime meltwater flux from 1000 of such icebergs would be around 65 m3 s−1. While non-negligible, this contribution is small compared to freshwater inputs within Ilulissat Icefjord and therefore unlikely to be the primary driver of the continued autumn freshening observed at the Monitoring Station.
5.1.2 Along-isopycnal warming at depth
Beneath the stratified fresh layer, a continued along-isopycnal warming was observed within denser PW (σ0 ≈ 26.5–27.1 kg m−3; Figs. 6c; 7). By October–November, hydrographic properties at the Monitoring Station closely matched those measured near Aasiaat two to three months earlier, suggesting an advective signal that may enter Disko Bay from the southwest and be advected cyclonically around the bay.
A similar late-autumn warming below 150 m was previously documented by Hansen et al. (2012), who attributed it to entrainment of warm surface waters. In our observations, however, the overlying PW layer cools and continues to freshen during this period, while the warming at depth is accompanied by a slight increase in salinity (Fig. 7b, d, f). These features are more consistent with the advection of warmer, saltier water masses than with vertical mixing from the surface.
Without hydrographic profiles outside Disko Bay, we cannot definitively establish the sources of this warming before it appears near Aasiaat. However, at depths comparable to those of the σ0 ≈ 26.5–27.1 kg m−3 PW layer in autumn (Fig. 2), long-term moorings at Davis Strait record a pronounced seasonal temperature cycle along the west Greenland shelf and slope. Instruments at 151 and 252 m show temperatures increasing from summer minima to peak values in December–February, while water masses remain least dense during autumn (Gladish et al., 2015b; Carroll et al., 2018). Although mooring records are not yet available for our study period, the warming observed propagating towards the Monitoring Station in autumn may represent the advection of this recurring Davis Strait signal.
Glacial processes may also contribute to the observed warming. Buoyant plumes of subglacial discharge and submarine meltwater drive turbulent upwelling that entrains the warm and saline Atlantic-origin waters, producing glacially modified water that is commonly warmer and more saline than unmodified PW of the same density found at a distance away from the glacier (Straneo et al., 2012; Beaird et al., 2017, 2018; Mortensen et al., 2020; Muilwijk et al., 2022; Cowton et al., 2023). For instance, glacially modified water exported from Ilulissat Icefjord has been estimated to contain about 40 % of WGIW (Beaird et al., 2017), making it distinctly warmer and saltier than ambient PW. Export of glacially modified water from Ilulissat Icefjord may therefore enhance autumn anomalies in PW. However, our spatial analysis showed that the highest along-isopycnal temperatures in August occurred further upstream, near Aasiaat (and, in 2023, within the deep trough entering Disko Bay), rather than near Ilulissat Icefjord. We therefore interpret the autumn along-isopycnal warming primarily as the seasonal signal of the WGC, while glacially modified water exported from Ilulissat Icefjord may provide a secondary, but smaller, contribution.
5.2 West Greenland Irminger Water renewal
Over two annual cycles (2022–2023, 2023–2024), renewal of WGIW in Disko Bay occurred primarily in spring, when the densest WGIW filled the basin, resulting in annual maxima in density, temperature, salinity, and vertical extent of WGIW (Fig. 8d–f). The springtime renewal began in February–March and lasted until May–June. This provides direct observational evidence supporting the hypothesis of Gladish et al. (2015a, b), who proposed that exchange over the EDS likely occurs in spring. This timing also matches observations further north in Uummannaq fjord system (Carroll et al., 2018), and south in Godthåbsfjord (Mortensen et al., 2011, 2014). At 240 m in Disko Bay (Ilulissat Icefjord sill depth equivalent), WGIW density peaks at σ0 = 27.3–27.35 kg m−3 in May (Fig. 9a), matching the density range observed within Ilulissat Icefjord basin (Gladish et al., 2015a, b; Beaird et al., 2017). This correspondence suggests that spring renewal in Disko Bay delivers the densest waters entering the fjord basin.
The repeated springtime renewal in Disko Bay is consistent with regional-scale hydrographic variability. At Davis Strait, isopycnals tilt up towards the Greenland shelf in spring, with ∼ 140 m vertical displacement of WGIW at the shelfbreak coincident with densification along the shelf (Curry et al., 2011, 2014; Gladish et al., 2015b; Carroll et al., 2018). Increasingly dense waters thus become available over the EDS, eventually exceeding the density of resident basin waters in Disko Bay and driving the springtime renewal (Fig. 10b). Persistent upwelling-favourable winds locally through spring likely enhance the renewal process (Fig. 8b–c).
In addition to the repeated spring renewal, we observed a distinct renewal in November–December 2022, marked by rapid increases in basin density and temperature and a more than 100 m shoaling of the WGIW boundary (Fig. 8d–f). This autumn/winter renewal was unique to the 2022–2023 annual cycle and coincided with particularly strong and persistent upwelling-favourable winds. These conditions likely induced upwelling over the EDS, lifting the dense waters over the sill and into Disko Bay (Fig. 10a). Estimated vertical velocities frequently exceeded 1 m d−1, with episodic peaks approaching 3 m d−1, implying uplift on the order of 20 m during this period. The actual uplift may have been greater, as our estimates only quantify the effect of wind stress curl, and not coastal upwelling, which could also contribute, given the proximity of the coastline east of EDS.
While we cannot determine the precise magnitude of upwelling or the properties of upwelled waters over the EDS without hydrographic observations on the shelf, the conditions observed are consistent with other studies linking upwelling-favourable winds to WGIW intrusions along the west Greenland shelf. For example, upwelling-favourable winds were linked to the observed increased WGIW presence in the Uummannaq trough (300 km north of Disko Bay) during December–January (Carroll et al., 2018), and to modelled areas of frequent upwelling along the coast both north and south of Disko Bay (Ribergaard et al., 2004; Söderkvist et al., 2006). Near Cape Farewell, wind-driven upwelling events have been shown to draw Atlantic-origin waters from ∼ 250 m depth onto the shelf (∼ 150 m), raising both temperature and salinity (Pacini and Pickart, 2023). In southeast Greenland, at Sermilik Fjord, along-shelf winds were also shown to play an important role in uplift and onshore intrusion of dense Atlantic Waters (Snow et al., 2023; Sanchez et al., 2024).
Our results highlight that a pronounced autumn/winter WGIW renewal, such as in 2022, can shoal the WGIW boundary enough to increase the temperatures at Ilulissat Icefjord sill depth by ∼ 1 °C (Fig. 9b). Ilulissat Icefjord renewal is thought to be primarily driven by subglacial discharge during the melt season (Gladish et al., 2015a, b; Carroll et al., 2017). However, our observations show that episodic uplift of dense waters in Disko Bay during autumn–winter can also bring dense waters above the fjord sill and possibly initiate fjord basin renewal earlier in the year than previously expected (Gladish et al., 2015a, b), even during periods of limited subglacial discharge forcing (Mernild et al., 2015; Enderlin et al., 2016). Observations in Disko Bay reported by Picton et al. (2025) indicate that late autumn–early winter renewal may have taken place in 2021 as well, as temperatures at 240 m increased rapidly by ∼ 0.5 °C.
We therefore extend the schematic of Gladish et al. (2015a) to include a wind-driven autumn/winter renewal pathway across the EDS into Disko Bay, while also acknowledging the possibility that such events may enable dense inflow into Ilulissat Icefjord basin (Fig. 10a), although direct evidence for this process is not yet available.
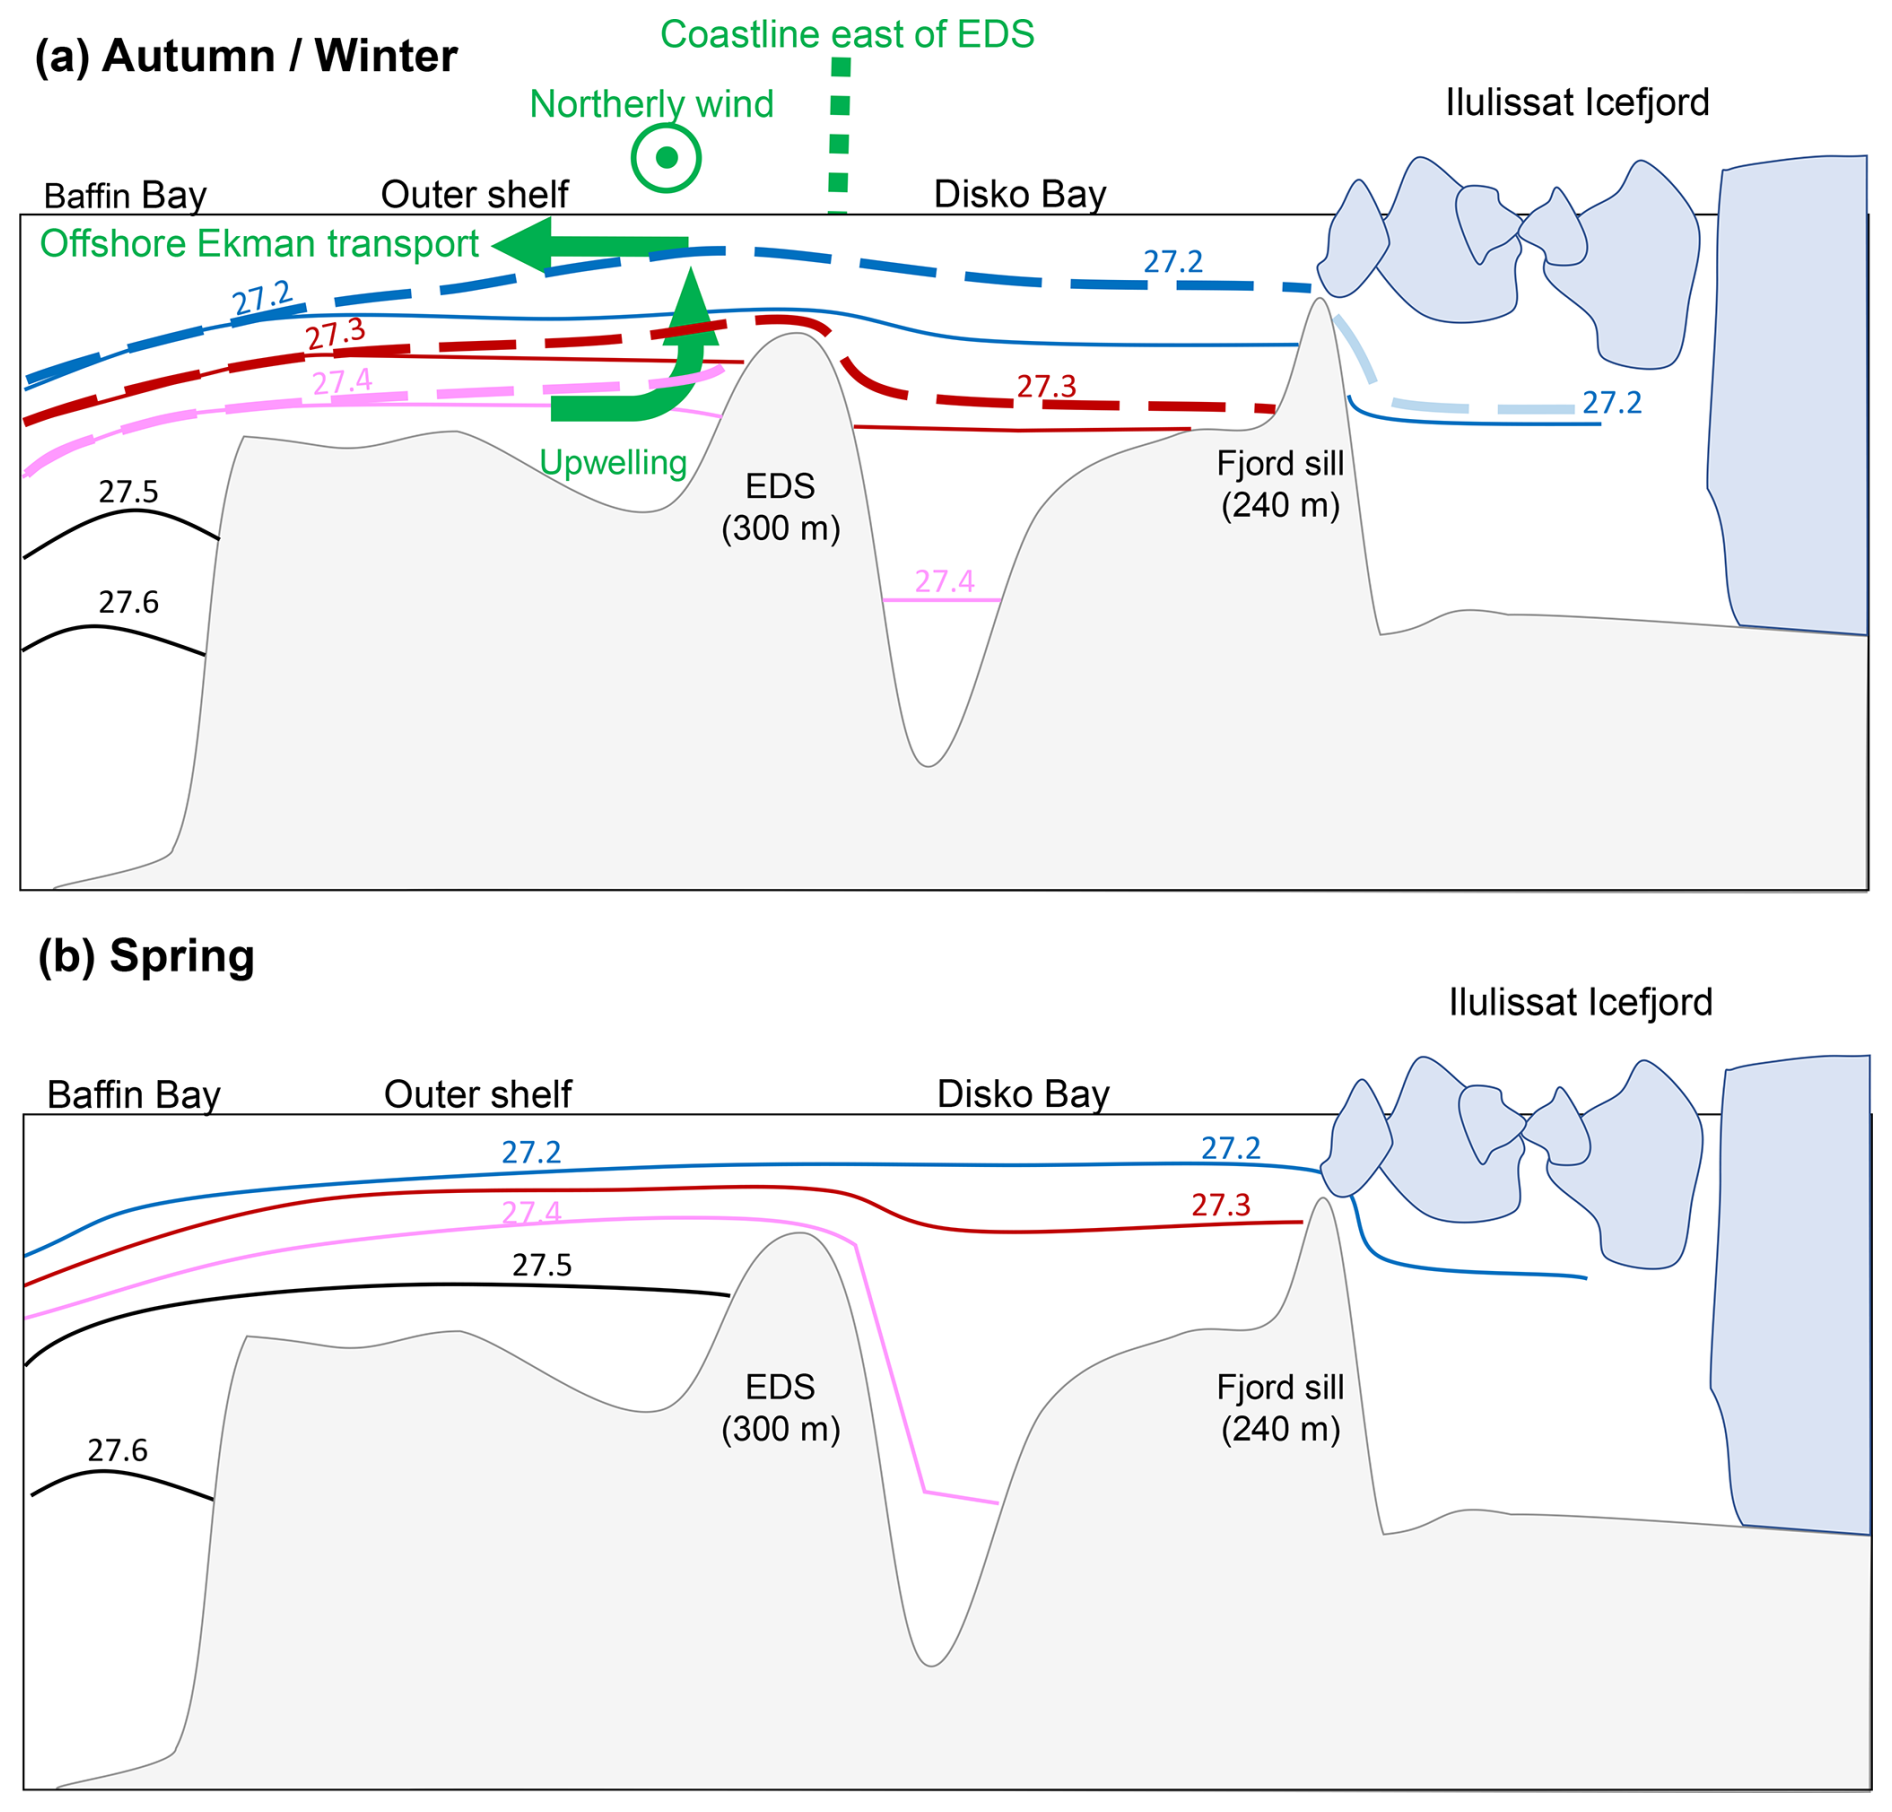
Figure 10Schematic of West Greenland Irminger Water (WGIW) exchange between the west Greenland Shelf, Disko Bay, and Ilulissat Icefjord, adapted from Gladish et al. (2015a). Solid isopycnals and bathymetry in (a)–(b) are reproduced from the original schematic. Panel (a) has been updated to illustrate a potential autumn/winter wind-driven renewal mechanism: Northerly along-shore winds (negative wind stress, ⊙) drive offshore Ekman transport and upwelling (green arrows), lifting dense isopycnals over the Egedesminde Dyb Sill (EDS) and allowing renewal of Disko Bay (dashed lines), and possibly Ilulissat Icefjord (fainter dashed line). The coastline east of EDS is indicated as it likely enhances wind-driven upwelling. Panel (b) shows spring renewal process, when seasonal densification of WGIW on the west Greenland Shelf raises isopycnals above sill depth, enabling Disko Bay and Ilulissat Icefjord renewal.
We examined two full annual cycles (June 2022–November 2024) of Disko Bay hydrography using fixed-point observations from a monitoring station, two profiling floats, and near-synoptic surveys to resolve the seasonal evolution and spatial structure of PW and WGIW.
Sea-ice melt initiates a shallow mixed-layer that warms up to ∼ 8–10 °C while freshening to ∼ 31–31.4 g kg−1 by late summer. Spatially, the surface layer varies across the bay, with the coldest and freshest waters found near Ilulissat Icefjord. Below, freshwater input establishes a stratified layer bounded by σ0 ≈ 26.5 kg m−3, which progressively thickens and extends downward from the upper ∼ 50 m in summer to depths exceeding 100 m in autumn. This layer cools and continues to freshen during autumn. Along isopycnals within denser PW (σ0 ≈ 26.5–27.1 kg m−3), temperatures steadily increase through autumn. Near-synoptic surveys show that the warmest August PW of such densities occurs upstream at the southwestern end of the bay, and that Monitoring Station properties in October–November match those found upstream with a 2–3 month delay, consistent with cyclonic advection around the bay. PW exhibits strong spatial variability, supporting the use of the Monitoring Station as the site for studying PW seasonality. In contrast, WGIW properties fall along a narrow Θ–SA line, and spatial variance along depth levels is small below 300 m, supporting the use of float data to characterise WGIW seasonality.
At depths > 300 m, WGIW is isolated by bathymetry and is renewed when denser waters cross Egedesminde Dyb Sill (EDS). Our observations reveal that WGIW is renewed annually. Renewal occurs in the spring, with an additional episode of renewal also observed in late autumn 2022. During spring, the densest WGIW fills the Disko Bay basin, peaking in temperature, salinity, and vertical extent by late spring/early summer. The seasonal springtime renewal, previously suggested by Gladish et al. (2015a), is confirmed by our observations. Its timing is consistent with regional isopycnal uplift and densification along the west Greenland shelf. The distinct autumn/winter renewal in November–December 2022 coincided with unusually strong and persistent northerly winds over the EDS, which likely lifted denser waters over the topographic barrier, enabling the renewal. This suggests an additional mechanism and timing of intermittent WGIW renewal in Disko Bay.
Overall, Disko Bay hydrography reflects the superposition of seasonal signals within WGC, spatially heterogeneous local freshwater inputs, local air- and ice-ocean interactions, and episodic wind-driven exchanges across EDS. The improved understanding of seasonality and spatial context provides a baseline for interpreting and predicting variability relevant to ice-ocean coupling and ecosystem dynamics within Disko Bay.
The merged MODIS-AMSR2 sea-ice concentration data are available at: https://data.seaice.uni-bremen.de/modis_amsr2 (last access: 31 June 2024). Greenland Ecosystem Monitoring (GEM) data are available at: https://data.g-e-m.dk/datasets (last access: 22 May 2025). Additional observations collected for this study at the Monitoring Station in 2023 will be available through the GEM database. ERA5 data are available at the Copernicus Climate Change Service (C3S) Climate Data Store (CDS) at: https://doi.org/10.24381/cds.adbb2d47 (Hersbach et al., 2023). Bathymetry data are available from the NASA National Snow and Ice Data Center Distributed Active Archive Center at: https://doi.org/10.5067/GMEVBWFLWA7X (Morlighem et al., 2022). Oceans Melting Greenland Data for the profiling floats are available at: https://doi.org/10.5067/OMGEV-ALMO1 (Oceans Melting Greenland, 2022). Greenland Ocean Observations Apex-float data are available at: https://fleetmonitoring.euro-argo.eu/float/6990591 (last access: 22 October 2024).
LL: Writing – review and editing, Writing – original draft, Visualisation, Methodology, Investigation, Formal analysis, Conceptualisation. LH: Writing – review and editing, Writing – original draft, Methodology, Investigation, Conceptualisation, Supervision. ED: Writing – review and editing, Writing – original draft, Visualisation, Methodology, Investigation. PJH: Writing – review and editing, Resources, Data curation. JKW: Writing – review and editing, Resources, Data curation
The contact author has declared that none of the authors has any competing interests.
Publisher's note: Copernicus Publications remains neutral with regard to jurisdictional claims made in the text, published maps, institutional affiliations, or any other geographical representation in this paper. While Copernicus Publications makes every effort to include appropriate place names, the final responsibility lies with the authors. Views expressed in the text are those of the authors and do not necessarily reflect the views of the publisher.
We thank Dana Margareta King for processing the sea-ice data, Iliana Vasiliki Ntinou for assisting with the fieldwork, and Torkel Gissel Nielsen for support with planning the fieldwork. We gratefully acknowledge the crew of RV Porsild and the staff at the Arctic Station (University of Copenhagen) in Qeqertarsuaq for their hard work and expertise in safely and effectively carrying out the fieldwork. We thank the NASA OMG Mission, as well as the GEM programme, for making observational data freely available. We acknowledge the collaborative efforts of scientists at the Greenland Institute of Natural Resources in collecting the NASA and NOAA “Greenland Ocean Observations” (GOO) float data that contributed to this study. This work was carried out in part at the Jet Propulsion Laboratory, California Institute of Technology, under a contract with the National Aeronautics and Space Administration (80NM0018D0004). This work was supported financially by the Research Council of Norway through the project ClimateNarratives (no. 324520). The authors thank the two anonymous reviewers for their careful reading and helpful recommendations, which enhanced the overall quality of the manuscript.
This research has been supported by the Norges Forskningsråd (grant no. 324520) and carried out in part at the Jet Propulsion Laboratory, California Institute of Technology, under a contract with the National Aeronautics and Space Administration (80NM0018D0004).
This paper was edited by Mario Hoppema and reviewed by two anonymous referees.
Andersen, O. G. N.: The annual cycle of temperature, salinity, currents and water masses in Disko Bugt and adjacent waters, West Greenland, Meddelelser om Grønland, Bioscience, 5, 1–33, https://doi.org/10.7146/mogbiosci.v5.142180, 1981a. a, b, c, d, e
Andersen, O. G. N.: The annual cycle of phytoplankton primary production and hydrography in the Disko Bugt area, West Greenland, Meddelelser om Grønland, Bioscience, 6, 1–65, https://doi.org/10.7146/mogbiosci.v6.142187, 1981b. a
Argo: Argo float data and metadata from Global Data Assembly Centre (Argo GDAC), Argo [data set], https://doi.org/10.17882/42182, 2024. a
Beaird, N., Straneo, F., and Jenkins, W.: Spreading of Greenland meltwaters in the ocean revealed by noble gases, Geophysical Research Letters, 42, 7705–7713, https://doi.org/10.1002/2015GL065003, 2015. a, b
Beaird, N., Straneo, F., and Jenkins, W.: Characteristics of meltwater export from Jakobshavn Isbræ and Ilulissat Icefjord, Annals of Glaciology, 58, 107–117, https://doi.org/10.1017/aog.2017.19, 2017. a, b, c, d, e, f, g, h, i, j, k
Beaird, N., Straneo, F., and Jenkins, W.: Export of Strongly Diluted Greenland Meltwater From a Major Glacial Fjord, Geophysical Research Letters, 45, 4163–4170, https://doi.org/10.1029/2018GL077000, 2018. a, b, c
Carroll, D., Sutherland, D. A., Hudson, B., Moon, T., Catania, G. A., Shroyer, E. L., Nash, J. D., Bartholomaus, T. C., Felikson, D., Stearns, L. A., Noël, B. P. Y., and van den Broeke, M. R.: The impact of glacier geometry on meltwater plume structure and submarine melt in Greenland fjords, Geophysical Research Letters, 43, 9739–9748, https://doi.org/10.1002/2016GL070170, 2016. a
Carroll, D., Sutherland, D. A., Shroyer, E. L., Nash, J. D., Catania, G. A., and Stearns, L. A.: Subglacial discharge-driven renewal of tidewater glacier fjords, Journal of Geophysical Research: Oceans, 122, 6611–6629, https://doi.org/10.1002/2017JC012962, 2017. a
Carroll, D., Sutherland, D. A., Curry, B., Nash, J. D., Shroyer, E. L., Catania, G. A., Stearns, L. A., Grist, J. P., Lee, C. M., and de Steur, L.: Subannual and Seasonal Variability of Atlantic-Origin Waters in Two Adjacent West Greenland Fjords, Journal of Geophysical Research: Oceans, 123, 6670–6687, https://doi.org/10.1029/2018JC014278, 2018. a, b, c, d, e, f, g
Cenedese, C. and Straneo, F.: Icebergs Melting, Annual Review of Fluid Mechanics, 55, 377–402, https://doi.org/10.1146/annurev-fluid-032522-100734, 2023. a
Cowton, T., Slater, D., Sole, A., Goldberg, D., and Nienow, P.: Modeling the impact of glacial runoff on fjord circulation and submarine melt rate using a new subgrid-scale parameterization for glacial plumes, Journal of Geophysical Research: Oceans, 120, 796–812, https://doi.org/10.1002/2014JC010324, 2015. a
Cowton, T. R., Slater, D. A., and Inall, M. E.: Subglacial-Discharge Plumes Drive Widespread Subsurface Warming in Northwest Greenland's Fjords, Geophysical Research Letters, 50, e2023GL103801, https://doi.org/10.1029/2023GL103801, 2023. a, b
Cuny, J., Rhines, P. B., and Kwok, R.: Davis Strait volume, freshwater and heat fluxes, Deep Sea Research Part I: Oceanographic Research Papers, 52, 519–542, https://doi.org/10.1016/j.dsr.2004.10.006, 2005. a
Curry, B., Lee, C. M., and Petrie, B.: Volume, Freshwater, and Heat Fluxes through Davis Strait, 2004–05, Journal of Physical Oceanography, 41, 429–436, https://doi.org/10.1175/2010JPO4536.1, 2011. a, b
Curry, B., Lee, C. M., Petrie, B., Moritz, R. E., and Kwok, R.: Multiyear Volume, Liquid Freshwater, and Sea Ice Transports through Davis Strait, 2004–10, Journal of Physical Oceanography, 44, 1244–1266, https://doi.org/10.1175/JPO-D-13-0177.1, 2014. a, b, c, d, e, f, g
Enderlin, E. M., Hamilton, G. S., Straneo, F., and Sutherland, D. A.: Iceberg meltwater fluxes dominate the freshwater budget in Greenland's iceberg-congested glacial fjords, Geophysical Research Letters, 43, 11287–11294, https://doi.org/10.1002/2016GL070718, 2016. a, b, c, d, e, f, g
Gade, H. G.: Melting of Ice in Sea Water: A Primitive Model with Application to the Antarctic Ice Shelf and Icebergs, Journal of Physical Oceanography, 9, 189–198, https://doi.org/10.1175/1520-0485(1979)009<0189:MOIISW>2.0.CO;2, 1979. a
Gade, H. G. and Edwards, A.: Deep Water Renewal in Fjords, in: Fjord Oceanography, edited by: Freeland, H. J., Farmer, D. M., and Levings, C. D., 453–489, Springer US, Boston, MA, ISBN 978-1-4613-3105-6, https://doi.org/10.1007/978-1-4613-3105-6_43, 1980. a
Gladish, C. V., Holland, D. M., and Lee, C. M.: Oceanic Boundary Conditions for Jakobshavn Glacier. Part II: Provenance and Sources of Variability of Disko Bay and Ilulissat Icefjord Waters, 1990–2011, Journal of Physical Oceanography, 45, 33–63, https://doi.org/10.1175/JPO-D-14-0045.1, 2015a. a, b, c, d, e, f, g, h, i, j, k, l, m
Gladish, C. V., Holland, D. M., Rosing-Asvid, A., Behrens, J. W., and Boje, J.: Oceanic Boundary Conditions for Jakobshavn Glacier. Part I: Variability and Renewal of Ilulissat Icefjord Waters, 2001–14, Journal of Physical Oceanography, 45, 3–32, https://doi.org/10.1175/JPO-D-14-0044.1, 2015b. a, b, c, d, e, f, g, h, i, j, k
Greenland Ecosystem Monitoring: MarineBasis Disko – Water column – CTD measurements, Greenland Ecosystem Monitoring [data set], https://doi.org/10.17897/WH30-HT61, 2025a. a
Greenland Ecosystem Monitoring: MarineBasis Disko – Water column – Disko Bay Cruise 2018, CTD measurements, Greenland Ecosystem Monitoring [data set], https://doi.org/10.17897/75KS-G922, 2025b. a
Hager, A. O., Sutherland, D. A., and Slater, D. A.: Local forcing mechanisms challenge parameterizations of ocean thermal forcing for Greenland tidewater glaciers, The Cryosphere, 18, 911–932, https://doi.org/10.5194/tc-18-911-2024, 2024. a, b
Hansen, M. O., Nielsen, T. G., Stedmon, C. A., and Munk, P.: Oceanographic regime shift during 1997 in Disko Bay, Western Greenland, Limnology and Oceanography, 57, 634–644, 2012. a, b, c, d, e, f
Hersbach, H., Bell, B., Berrisford, P., Biavati, G., Horányi, A., Muñoz Sabater, J., Nicolas, J., Peubey, C., Radu, R., Rozum, I., Schepers, D., Simmons, A., Soci, C., Dee, D., and Thépaut, J.-N.: ERA5 hourly data on single levels from 1940 to present, Copernicus Climate Change Service (C3S) Climate Data Store (CDS) [data set], https://doi.org/10.24381/cds.adbb2d47, 2023. a, b
Holland, D. M., Thomas, R. H., de Young, B., Ribergaard, M. H., and Lyberth, B.: Acceleration of Jakobshavn Isbræ triggered by warm subsurface ocean waters, Nature Geoscience, 1, 659–664, https://doi.org/10.1038/ngeo316, 2008. a, b, c
Huang, J., Pickart, R. S., Bahr, F., McRaven, L. T., Tremblay, J.-É., Michel, C., Jeansson, E., Kopec, B., Welker, J. M., and Ólafsdóttir, S. R.: Water mass evolution and general circulation of Baffin Bay: Observations from two shipboard surveys in 2021, Progress in Oceanography, 103322, https://doi.org/10.1016/j.pocean.2024.103322, 2024. a, b, c, d
Jackson, R. H., Shroyer, E. L., Nash, J. D., Sutherland, D. A., Carroll, D., Fried, M. J., Catania, G. A., Bartholomaus, T. C., and Stearns, L. A.: Near-glacier surveying of a subglacial discharge plume: Implications for plume parameterizations, Geophysical Research Letters, 44, 6886–6894, https://doi.org/10.1002/2017GL073602, 2017. a
Jenkins, A.: Convection-Driven Melting near the Grounding Lines of Ice Shelves and Tidewater Glaciers, Journal of Physical Oceanography, 41, 2279–2294, https://doi.org/10.1175/JPO-D-11-03.1, 2011. a
Joughin, I., Abdalati, W., and Fahnestock, M.: Large fluctuations in speed on Greenland's Jakobshavn Isbræ glacier, Nature, 432, 608–610, https://doi.org/10.1038/nature03130, 2004. a
Joughin, I., Smith, B. E., and Howat, I.: Greenland Ice Mapping Project: ice flow velocity variation at sub-monthly to decadal timescales, The Cryosphere, 12, 2211–2227, https://doi.org/10.5194/tc-12-2211-2018, 2018. a
Joughin, I., Shean, D. E., Smith, B. E., and Floricioiu, D.: A decade of variability on Jakobshavn Isbræ: ocean temperatures pace speed through influence on mélange rigidity, The Cryosphere, 14, 211–227, https://doi.org/10.5194/tc-14-211-2020, 2020. a, b, c, d
Kajanto, K., Straneo, F., and Nisancioglu, K.: Impact of icebergs on the seasonal submarine melt of Sermeq Kujalleq, The Cryosphere, 17, 371–390, https://doi.org/10.5194/tc-17-371-2023, 2023. a, b, c, d, e, f, g, h
Khazendar, A., Fenty, I. G., Carroll, D., Gardner, A., Lee, C. M., Fukumori, I., Wang, O., Zhang, H., Seroussi, H., Moller, D., Noël, B. P. Y., van den Broeke, M. R., Dinardo, S., and Willis, J.: Interruption of two decades of Jakobshavn Isbrae acceleration and thinning as regional ocean cools, Nature Geoscience, 12, 277–283, https://doi.org/10.1038/s41561-019-0329-3, 2019. a, b, c, d
Lindeman, M. R., Straneo, F., Adams, H. M., Nelson, M. J. S., and Schartup, A. T.: Low mercury concentrations in a Greenland glacial fjord attributed to oceanic sources, Communications Earth & Environment, 5, 1–10, https://doi.org/10.1038/s43247-024-01474-9, 2024. a
Ludwig, V., Spreen, G., and Pedersen, L. T.: Evaluation of a New Merged Sea-Ice Concentration Dataset at 1 km Resolution from Thermal Infrared and Passive Microwave Satellite Data in the Arctic, Remote Sensing, 12, 3183, https://doi.org/10.3390/rs12193183, 2020. a
Lüpkes, C. and Birnbaum, G.: Surface Drag in the Arctic Marginal Sea-ice Zone: A Comparison of Different Parameterisation Concepts, Boundary-Layer Meteorology, 117, 179–211, https://doi.org/10.1007/s10546-005-1445-8, 2005. a
Mankoff, K. D., Straneo, F., Cenedese, C., Das, S. B., Richards, C. G., and Singh, H.: Structure and dynamics of a subglacial discharge plume in a Greenlandic fjord, Journal of Geophysical Research: Oceans, 121, 8670–8688, https://doi.org/10.1002/2016JC011764, 2016. a
Mankoff, K. D., Solgaard, A., Colgan, W., Ahlstrøm, A. P., Khan, S. A., and Fausto, R. S.: Greenland Ice Sheet solid ice discharge from 1986 through March 2020, Earth Syst. Sci. Data, 12, 1367–1383, https://doi.org/10.5194/essd-12-1367-2020, 2020. a
MathWorks Inc.: findchangepts – Find abrupt changes in signal (Signal Processing Toolbox), MATLAB Help Center [code], https://se.mathworks.com/help/signal/ref/findchangepts.html (last access: 10 December 2025), 2025. a
McDougall, T. J. and Barker, P. M.: Getting started with TEOS-10 and the Gibbs Seawater (GSW) Oceanographic Toolbox, Tech. Rep. WG127, ISBN 978-0-646-55621-5, https://www.teos-10.org/pubs/Getting_Started.pdf (last access: 10 July 2023), 2011. a
Mernild, S. H., Holland, D. M., Holland, D., Rosing-Asvid, A., Yde, J. C., Liston, G. E., and Steffen, K.: Freshwater Flux and Spatiotemporal Simulated Runoff Variability into Ilulissat Icefjord, West Greenland, Linked to Salinity and Temperature Observations near Tidewater Glacier Margins Obtained Using Instrumented Ringed Seals, Journal of Physical Oceanography, 45, 1426–1445, https://doi.org/10.1175/JPO-D-14-0217.1, 2015. a, b, c, d
Moon, T., Sutherland, D. A., Carroll, D., Felikson, D., Kehrl, L., and Straneo, F.: Subsurface iceberg melt key to Greenland fjord freshwater budget, Nature Geoscience, 11, 49–54, https://doi.org/10.1038/s41561-017-0018-z, 2018. a
Morlighem, M., Williams, C., Rignot, E., An, L., Arndt, J. E., Bamber, J., Catania, G., Chauché, N., Dowdeswell, J. A., Dorschel, B., Fenty, I., Hogan, K., Howat, I., Hubbard, A., Jakobsson, M., Jordan, T. M., Kjeldsen, K. K., Millan, R., Mayer, L., Mouginot, J., Noël, B., O'Cofaigh, C., Palmer, S. J., Rysgaard, S., Seroussi, H., Siegert, M. J., Slabon, P., Straneo, F., van den Broeke, M. R., Weinrebe, W., Wood, M., and Zinglersen, K.: IceBridge BedMachine Greenland (IDBMG4, Version 5), NASA National Snow and Ice Data Center Distributed Active Archive Center, Boulder, Colorado USA [data set], https://doi.org/10.5067/GMEVBWFLWA7X, 2022. a, b, c, d
Mortensen, J., Lennert, K., Bendtsen, J., and Rysgaard, S.: Heat sources for glacial melt in a sub-Arctic fjord (Godthåbsfjord) in contact with the Greenland Ice Sheet, Journal of Geophysical Research: Oceans, 116, https://doi.org/10.1029/2010JC006528, 2011. a
Mortensen, J., Bendtsen, J., Lennert, K., and Rysgaard, S.: Seasonal variability of the circulation system in a west Greenland tidewater outlet glacier fjord, Godthåbsfjord (64° N), Journal of Geophysical Research: Earth Surface, 119, 2591–2603, https://doi.org/10.1002/2014JF003267, 2014. a
Mortensen, J., Rysgaard, S., Bendtsen, J., Lennert, K., Kanzow, T., Lund, H., and Meire, L.: Subglacial Discharge and Its Down-Fjord Transformation in West Greenland Fjords With an Ice Mélange, Journal of Geophysical Research: Oceans, 125, e2020JC016301, https://doi.org/10.1029/2020JC016301, 2020. a, b
Motyka, R. J., Truffer, M., Fahnestock, M., Mortensen, J., Rysgaard, S., and Howat, I.: Submarine melting of the 1985 Jakobshavn Isbræ floating tongue and the triggering of the current retreat, Journal of Geophysical Research: Earth Surface, 116, https://doi.org/10.1029/2009JF001632, 2011. a
Muench, R. D.: Oceanographic observations in Baffin Bay during July–September 1968, Tech. rep., Washington, D.C., Coast Guard, Oceanographic Unit, https://doi.org/10.5962/bhl.title.17035, 1971. a
Muilwijk, M., Straneo, F., Slater, D. A., Smedsrud, L. H., Holte, J., Wood, M., Andresen, C. S., and Harden, B.: Export of Ice Sheet Meltwater from Upernavik Fjord, West Greenland, Journal of Physical Oceanography, 52, 363–382, https://doi.org/10.1175/JPO-D-21-0084.1, 2022. a, b, c
Myers, P. G. and Ribergaard, M. H.: Warming of the Polar Water Layer in Disko Bay and Potential Impact on Jakobshavn Isbrae, Journal of Physical Oceanography, 43, 2629–2640, https://doi.org/10.1175/JPO-D-12-051.1, 2013. a, b
Nielsen, T. G. and Hansen, B.: Plankton community structure and carbon cycling on the western coast of Greenland during and after the sedimentation of a diatom bloom, Marine Ecology Progress Series, 125, 239–257, 1995. a
Oceans Melting Greenland: OMG Ocean Water Properties Data from Alamo Floats, Oceans Melting Greenland [data set], https://doi.org/10.5067/OMGEV-ALMO1, 2022. a, b
Pacini, A. and Pickart, R. S.: Wind-Forced Upwelling Along the West Greenland Shelfbreak: Implications for Labrador Sea Water Formation, Journal of Geophysical Research: Oceans, 128, e2022JC018952, https://doi.org/10.1029/2022JC018952, 2023. a
Pacini, A., Pickart, R. S., Bahr, F., Torres, D. J., Ramsey, A. L., Holte, J., Karstensen, J., Oltmanns, M., Straneo, F., Bras, I. A. L., Moore, G. W. K., and Jong, M. F. d.: Mean Conditions and Seasonality of the West Greenland Boundary Current System near Cape Farewell, Journal of Physical Oceanography, 50, 2849–2871, https://doi.org/10.1175/JPO-D-20-0086.1, 2020. a
Petersen, G.: The hydrography, primary production, bathymetry and “Tagsaq” of Disko Bugt, West Greenland, Meddelelser om Grønland, 159, 1–45, 1964. a
Pickart, R. S., Torres, D. J., and Clarke, R. A.: Hydrography of the Labrador Sea during Active Convection, Journal of Physical Oceanography, 428–457, https://doi.org/10.1175/1520-0485(2002)032<0428:HOTLSD>2.0.CO;2, 2002. a
Picton, H. J., Nienow, P. W., Slater, D. A., and Chudley, T. R.: A Reassessment of the Role of Atmospheric and Oceanic Forcing on Ice Dynamics at Jakobshavn Isbræ (Sermeq Kujalleq), Ilulissat Icefjord, Journal of Geophysical Research: Earth Surface, 130, e2024JF008104, https://doi.org/10.1029/2024JF008104, 2025. a, b, c, d, e, f
Ribergaard, M. H., Pedersen, A. S., Ådlandsvik, B., and Kliem, N.: Modelling the ocean circulation on the West Greenland shelf with special emphasis on northern shrimp recruitment, Continental Shelf Research, 24, 1505–1519, https://doi.org/10.1016/j.csr.2004.05.011, 2004. a
Rysgaard, S., Boone, W., Carlson, D., Sejr, M. K., Bendtsen, J., Juul-Pedersen, T., Lund, H., Meire, L., and Mortensen, J.: An Updated View on Water Masses on the pan-West Greenland Continental Shelf and Their Link to Proglacial Fjords, Journal of Geophysical Research: Oceans, 125, e2019JC015564, https://doi.org/10.1029/2019JC015564, 2020. a, b
Sanchez, R., Straneo, F., Hughes, K., Barbour, P., and Shroyer, E.: Relative Roles of Plume and Coastal Forcing on Exchange Flow Variability of a Glacial Fjord, Journal of Geophysical Research: Oceans, 129, e2023JC020492, https://doi.org/10.1029/2023JC020492, 2024. a
Scheick, J., Enderlin, E. M., and Hamilton, G.: Semi-automated open water iceberg detection from Landsat applied to Disko Bay, West Greenland, Journal of Glaciology, 65, 468–480, https://doi.org/10.1017/jog.2019.23, 2019. a
Semper, S., Våge, K., Fer, I., Latuta, L., and Skjelsvik, S.: Formation and Circulation of Dense Water From a Two-Year Moored Record in the Northwestern Iceland Sea, Journal of Geophysical Research: Oceans, 130, e2024JC021691, https://doi.org/10.1029/2024JC021691, 2025. a, b
Slater, D. A., Carroll, D., Oliver, H., Hopwood, M. J., Straneo, F., Wood, M., Willis, J. K., and Morlighem, M.: Characteristic Depths, Fluxes, and Timescales for Greenland's Tidewater Glacier Fjords From Subglacial Discharge-Driven Upwelling During Summer, Geophysical Research Letters, 49, e2021GL097081, https://doi.org/10.1029/2021GL097081, 2022. a
Sloth, P. and Buch, E.: On the hydrography and watermass exchange of Disko Bay, Consultative Meeting Document ICES C.M. 1984/C:26, ICES, Copenhagen, https://www.ices.dk/sites/pub/CM Doccuments/1984/C/1984_C26.pdf (last access: 27 August 2025), 1984. a
Snow, T., Zhang, W., Schreiber, E., Siegfried, M., Abdalati, W., and Scambos, T.: Alongshore Winds Force Warm Atlantic Water Toward Helheim Glacier in Southeast Greenland, Journal of Geophysical Research: Oceans, 128, e2023JC019953, https://doi.org/10.1029/2023JC019953, 2023. a
Stevens, L. A., Straneo, F., Das, S. B., Plueddemann, A. J., Kukulya, A. L., and Morlighem, M.: Linking glacially modified waters to catchment-scale subglacial discharge using autonomous underwater vehicle observations, The Cryosphere, 10, 417–432, https://doi.org/10.5194/tc-10-417-2016, 2016. a
Straneo, F. and Cenedese, C.: The Dynamics of Greenland's Glacial Fjords and Their Role in Climate, Annual Review of Marine Science, 7, 89–112, https://doi.org/10.1146/annurev-marine-010213-135133, 2015. a
Straneo, F., Curry, R. G., Sutherland, D. A., Hamilton, G. S., Cenedese, C., Våge, K., and Stearns, L. A.: Impact of fjord dynamics and glacial runoff on the circulation near Helheim Glacier, Nature Geoscience, 4, 322–327, https://doi.org/10.1038/ngeo1109, 2011. a
Straneo, F., Sutherland, D. A., Holland, D., Gladish, C., Hamilton, G. S., Johnson, H. L., Rignot, E., Xu, Y., and Koppes, M.: Characteristics of ocean waters reaching Greenland's glaciers, Annals of Glaciology, 53, 202–210, https://doi.org/10.3189/2012AoG60A059, 2012. a, b
Söderkvist, J., Nielsen, T. G., and Jespersen, M.: Physical and biological oceanography in West Greenland waters with emphasis on shrimp and fish larvae distribution, Tech. Rep. NERI Technical Report No. 581, National Environmental Research Institute, Denmark, 2006. a
Wong, A., Keeley, R., and Carval, T.: Argo Quality Control Manual for CTD and Trajectory Data, Ifremer, https://doi.org/10.13155/33951, 2024. a
Wood, M., Rignot, E., Fenty, I., An, L., Bjørk, A., Van Den Broeke, M., Cai, C., Kane, E., Menemenlis, D., Millan, R., Morlighem, M., Mouginot, J., Noël, B., Scheuchl, B., Velicogna, I., Willis, J. K., and Zhang, H.: Ocean forcing drives glacier retreat in Greenland, Science Advances, 7, https://doi.org/10.1126/sciadv.aba7282, 2021. a
Wood, M., Carroll, D., Fenty, I., Bertin, C., Darby, B., Dutkiewicz, S., Hopwood, M., Khazendar, A., Meire, L., Oliver, H., Parker, T., and Willis, J.: Increased melt from Greenland's most active glacier fuels enhanced coastal productivity, Communications Earth & Environment, 6, 626, https://doi.org/10.1038/s43247-025-02599-1, 2025. a