the Creative Commons Attribution 4.0 License.
the Creative Commons Attribution 4.0 License.
 | 28 Oct 2025
Geostrophic circulation and tidal effects in the Gulf of Gabès
Maher Bouzaiene
Antonio Guarnieri
Damiano Delrosso
Ahmad F. Dilmahamod
Simona Simoncelli
Claudia Fratianni
The mean kinematic features in the Gulf of Gabès region are analyzed based on 30 years of altimetry data (1993–2022) and the outputs of a high-resolution ocean model for the year 2022. A comparison of the seasonal variability in three different geographical areas within the gulf is presented. In the northern and southern parts of the gulf, anticyclonic structures prevail, while the central area is dominated by divergence. Similarity in flow topology is found in these three areas of the gulf due to the signature of hyperbolic regions. In winter and fall, the mean flow is oriented northward, while it is reversed in spring and summer. The tidal perturbations influence sea level, kinetic energy and hyperbolic geostrophic structures, leading to the generation of a cyclonic current in the central part of the gulf and to the presence of persistent strain gradients amplifying hyperbolic structures. The finite-time Lyapunov exponent (FTLE) computed using altimetry data highlights the link between physical and biogeochemical dispersion, with the Gulf of Gabès mean circulation features acting as transport barriers for phytoplankton dispersion.
- Article
(21695 KB) - Full-text XML
- BibTeX
- EndNote


Tidal forcing plays a crucial role in ocean circulation, and the Gulf of Gabès (GG) is notably influenced by this phenomenon. Understanding tidal interactions with complex dynamics and their impact on the transport of passive and active tracers (such as pollutants and marine species) is challenging (Meyerjürgens et al., 2020). Well known as a region of relevant tides within the Mediterranean Sea (Abdennadher and Boukthir, 2006) with a semi-arid climate, high temperature, relatively high salinity and strong density gradients, the GG is located in the southern part of the Sicily Channel and represents a site of water mass exchange between the western and the eastern Mediterranean Sea basins.
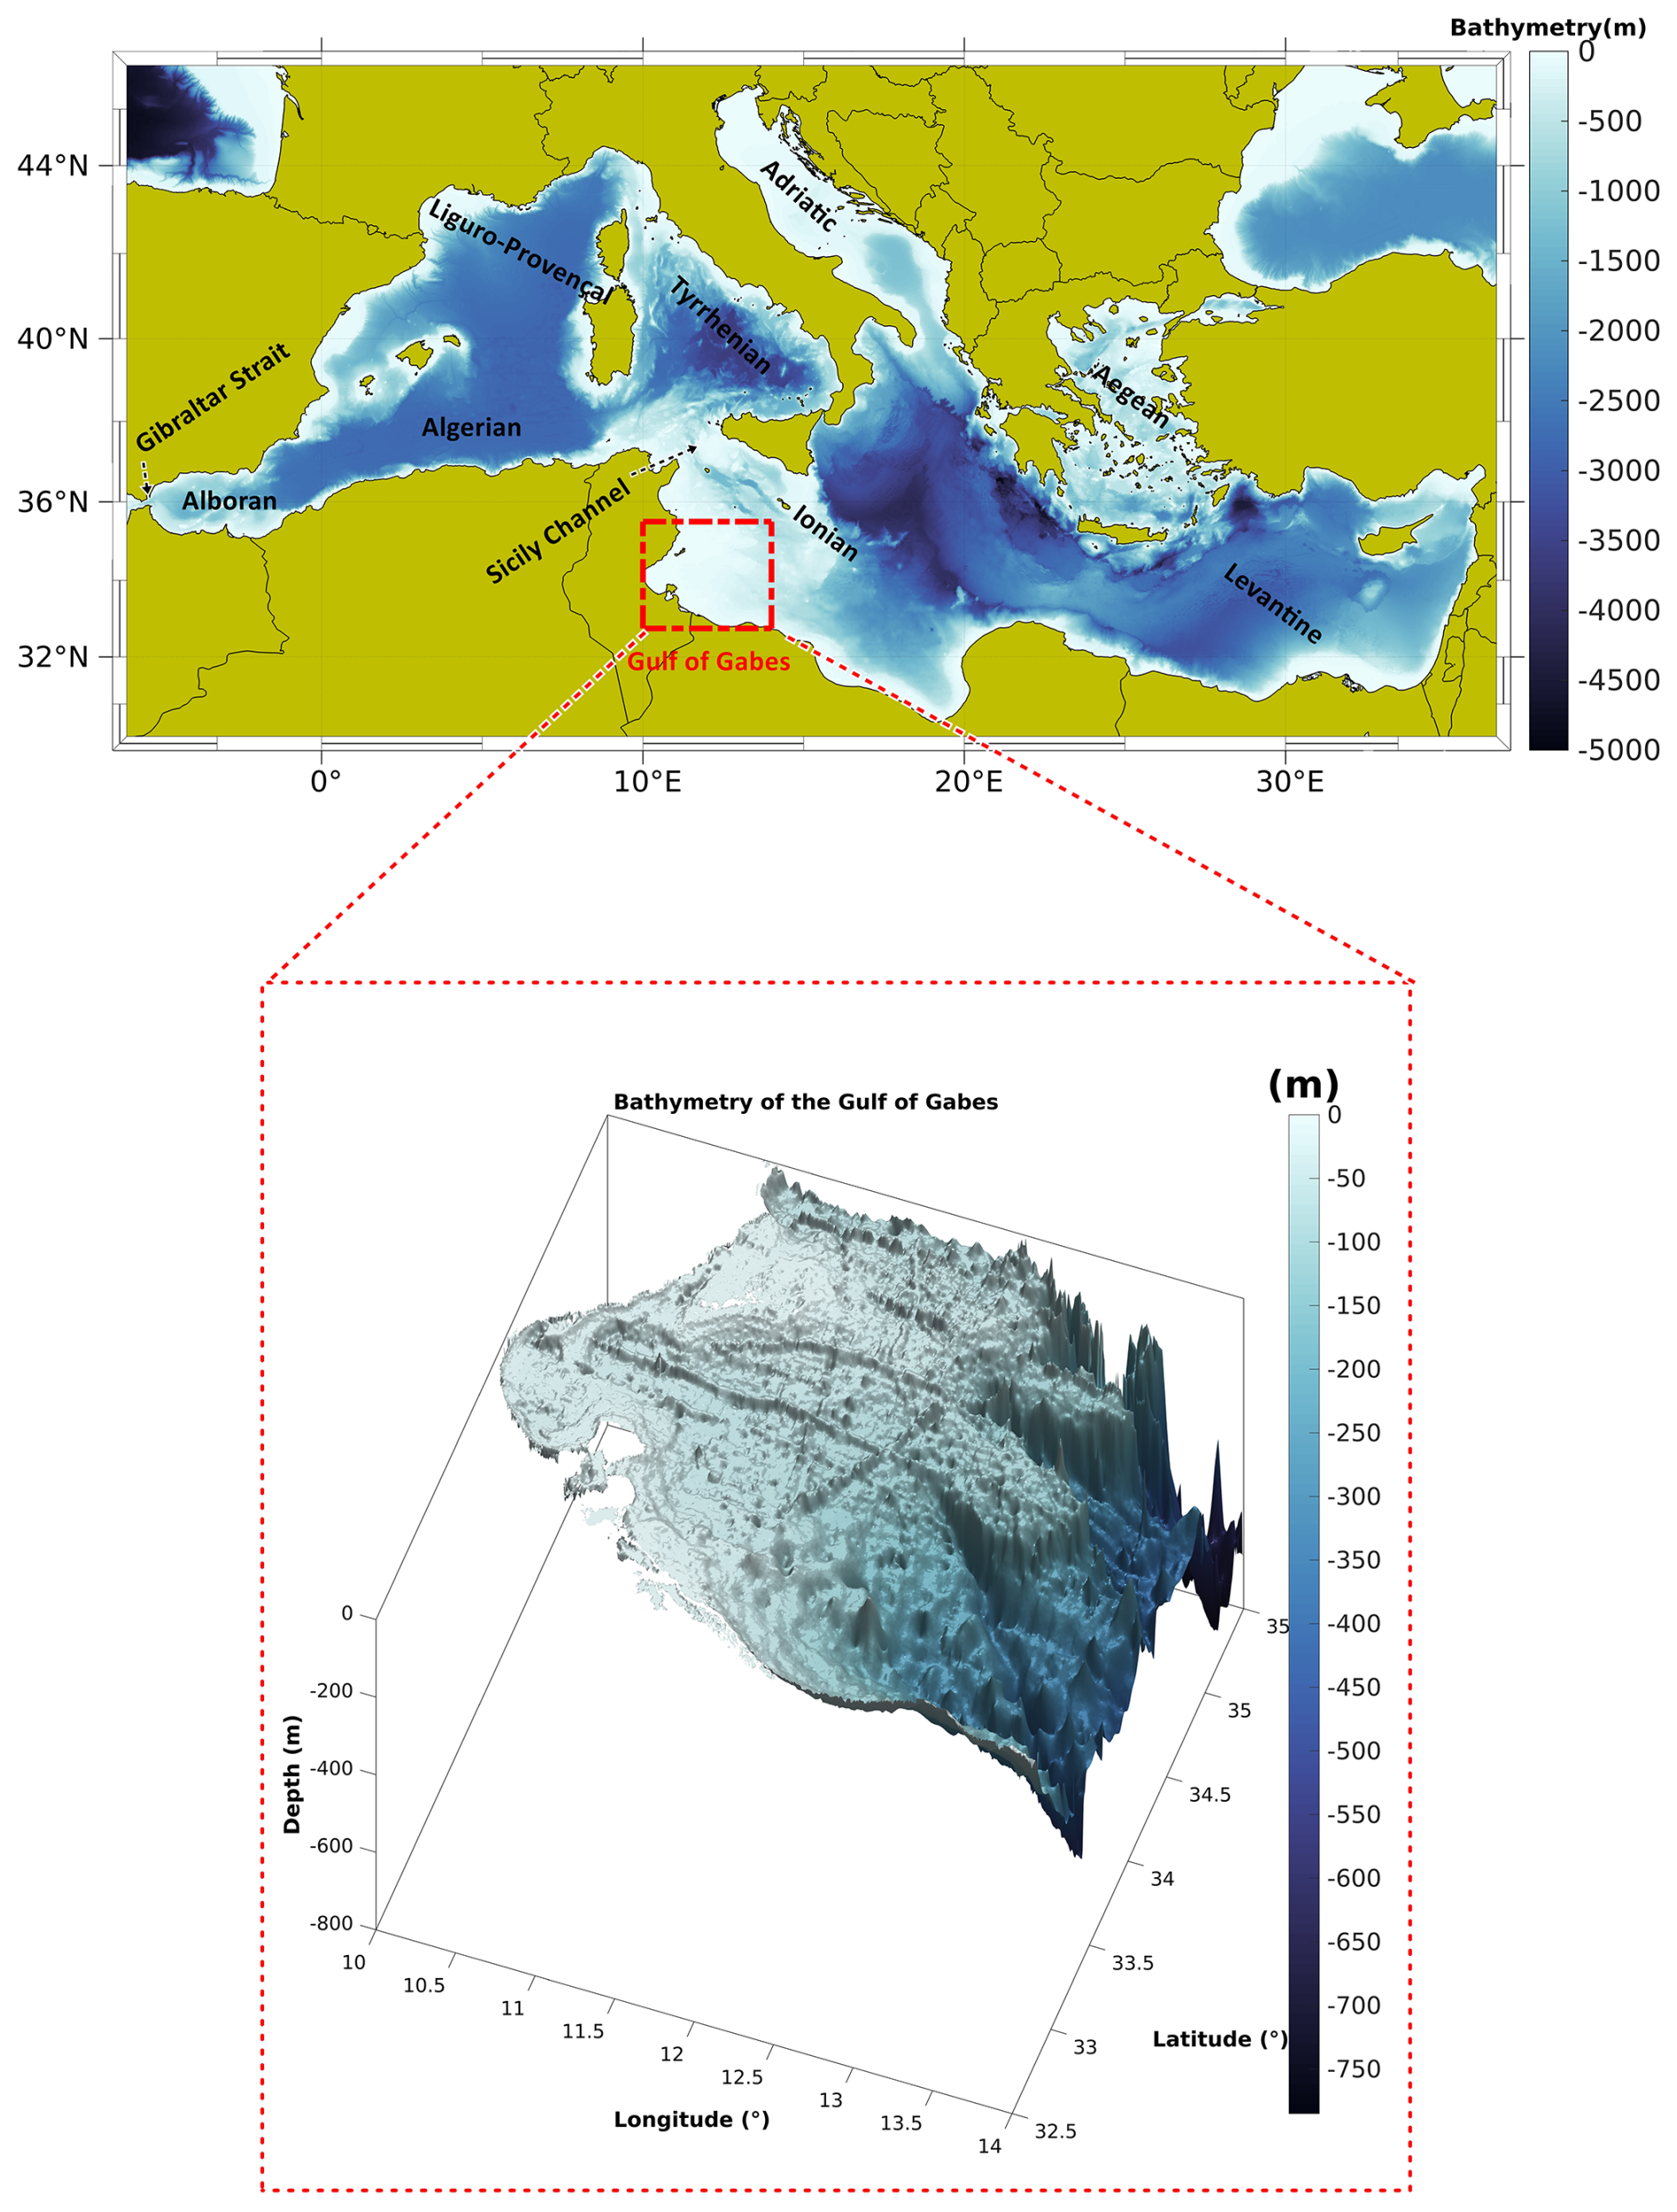
Figure 1Bathymetry of the Mediterranean Sea with the main geographical sub-basin and strait locations. The dashed red rectangle in the upper panel shows the geographical limits of the larger Gulf of Gabès domain. A detail of 3D bathymetry in the Gulf of Gabès is shown in the lower panel. The bathymetry was derived from the Global Earth Bathymetric Chart of the Oceans, 2022 version, with a spatial resolution of ∼0.45 km (GEBCO_2022, https://www.gebco.net, last access: 20 October 2025).
The gulf is considered one of the richest areas of the Mediterranean Sea in terms of nutrients availability and biological production (Béjaoui et al., 2019; Ben Ismail et al., 2022; Salgado-Hernanz et al., 2019). Due to the gentle slope of its continental shelf and its shallow depth (Fig. 1), the GG has the highest tidal range (with differences between high and low tides up to almost 2 m) in the Mediterranean Sea and is one of the areas in the Mediterranean Sea where the highest tides can be found (Othmani et al., 2017), which strongly influences its circulation (Abdennadher and Boukthir, 2006; Sammari et al., 2006; Poulain and Zambianchi, 2007). Apart from the tides, anticyclonic winds are also one of the drivers of the GG circulation (Sammari et al., 2006). Originating from the Atlantic Water (AW), the Atlantic Tunisian Current (ATC) and the Bifurcation Atlantic Tunisian Current (BATC) are the strongest surface currents evolving in the gulf (Ben Ismail et al., 2015), while the Atlantic Ionian Stream (AIS) is generated by current instability and topography (Menna et al., 2019), and it flows north of the island of Malta without penetrating into the GG (Fig. 2a) (Pinardi et al., 2015; Bouzaiene et al., 2020). The ATC is a permanent surface current characterized by low salinity (Sammari et al., 1999). It crosses the Strait of Sicily and circulates along the Tunisian coast (Sorgente et al., 2011), where it splits into two branches. One of them intersects the coastal strip and flows in a southwesterly direction (Ben Ismail et al., 2010). Due to its lower salinity, the ATC branch circulates further offshore from the coast in a southeastern direction, where it eventually follows the Libyan plateau (Fig. 2a) (Millot and Taupier-Letage, 2005). This branch, observed especially in winter, is called the Atlantic Libyan Current (ALC). It circulates along the Libyan shelf break, where the mean flow is represented by a weak current bounded by a cyclonic vortex referred to as the Libyan Shelf Break Vortex (LSBV; Sorgente et al., 2011; see Fig. 2a). The BATC continues to circulate offshore, generating the Medina Gyre (MG) and the Southern Medina Gyre (SMG) (Fig. 2a), whose formation is due to current instability or/and topography (Jouini et al., 2016; Menna et al., 2019). Some efforts have been made to focus on the dynamics of offshore waters in the central Mediterranean Sea from satellite-derived products; i.e., the dynamics in the Sicily Channel show multi-scale spatial and temporal variability (Menna et al., 2019). Nevertheless, a long-term analysis for inadequately regions like the coastal GG areas could be of benefit to an overview of persistent Lagrangian structures, attracting and repelling coastal zones, trends, and upwelling flows.
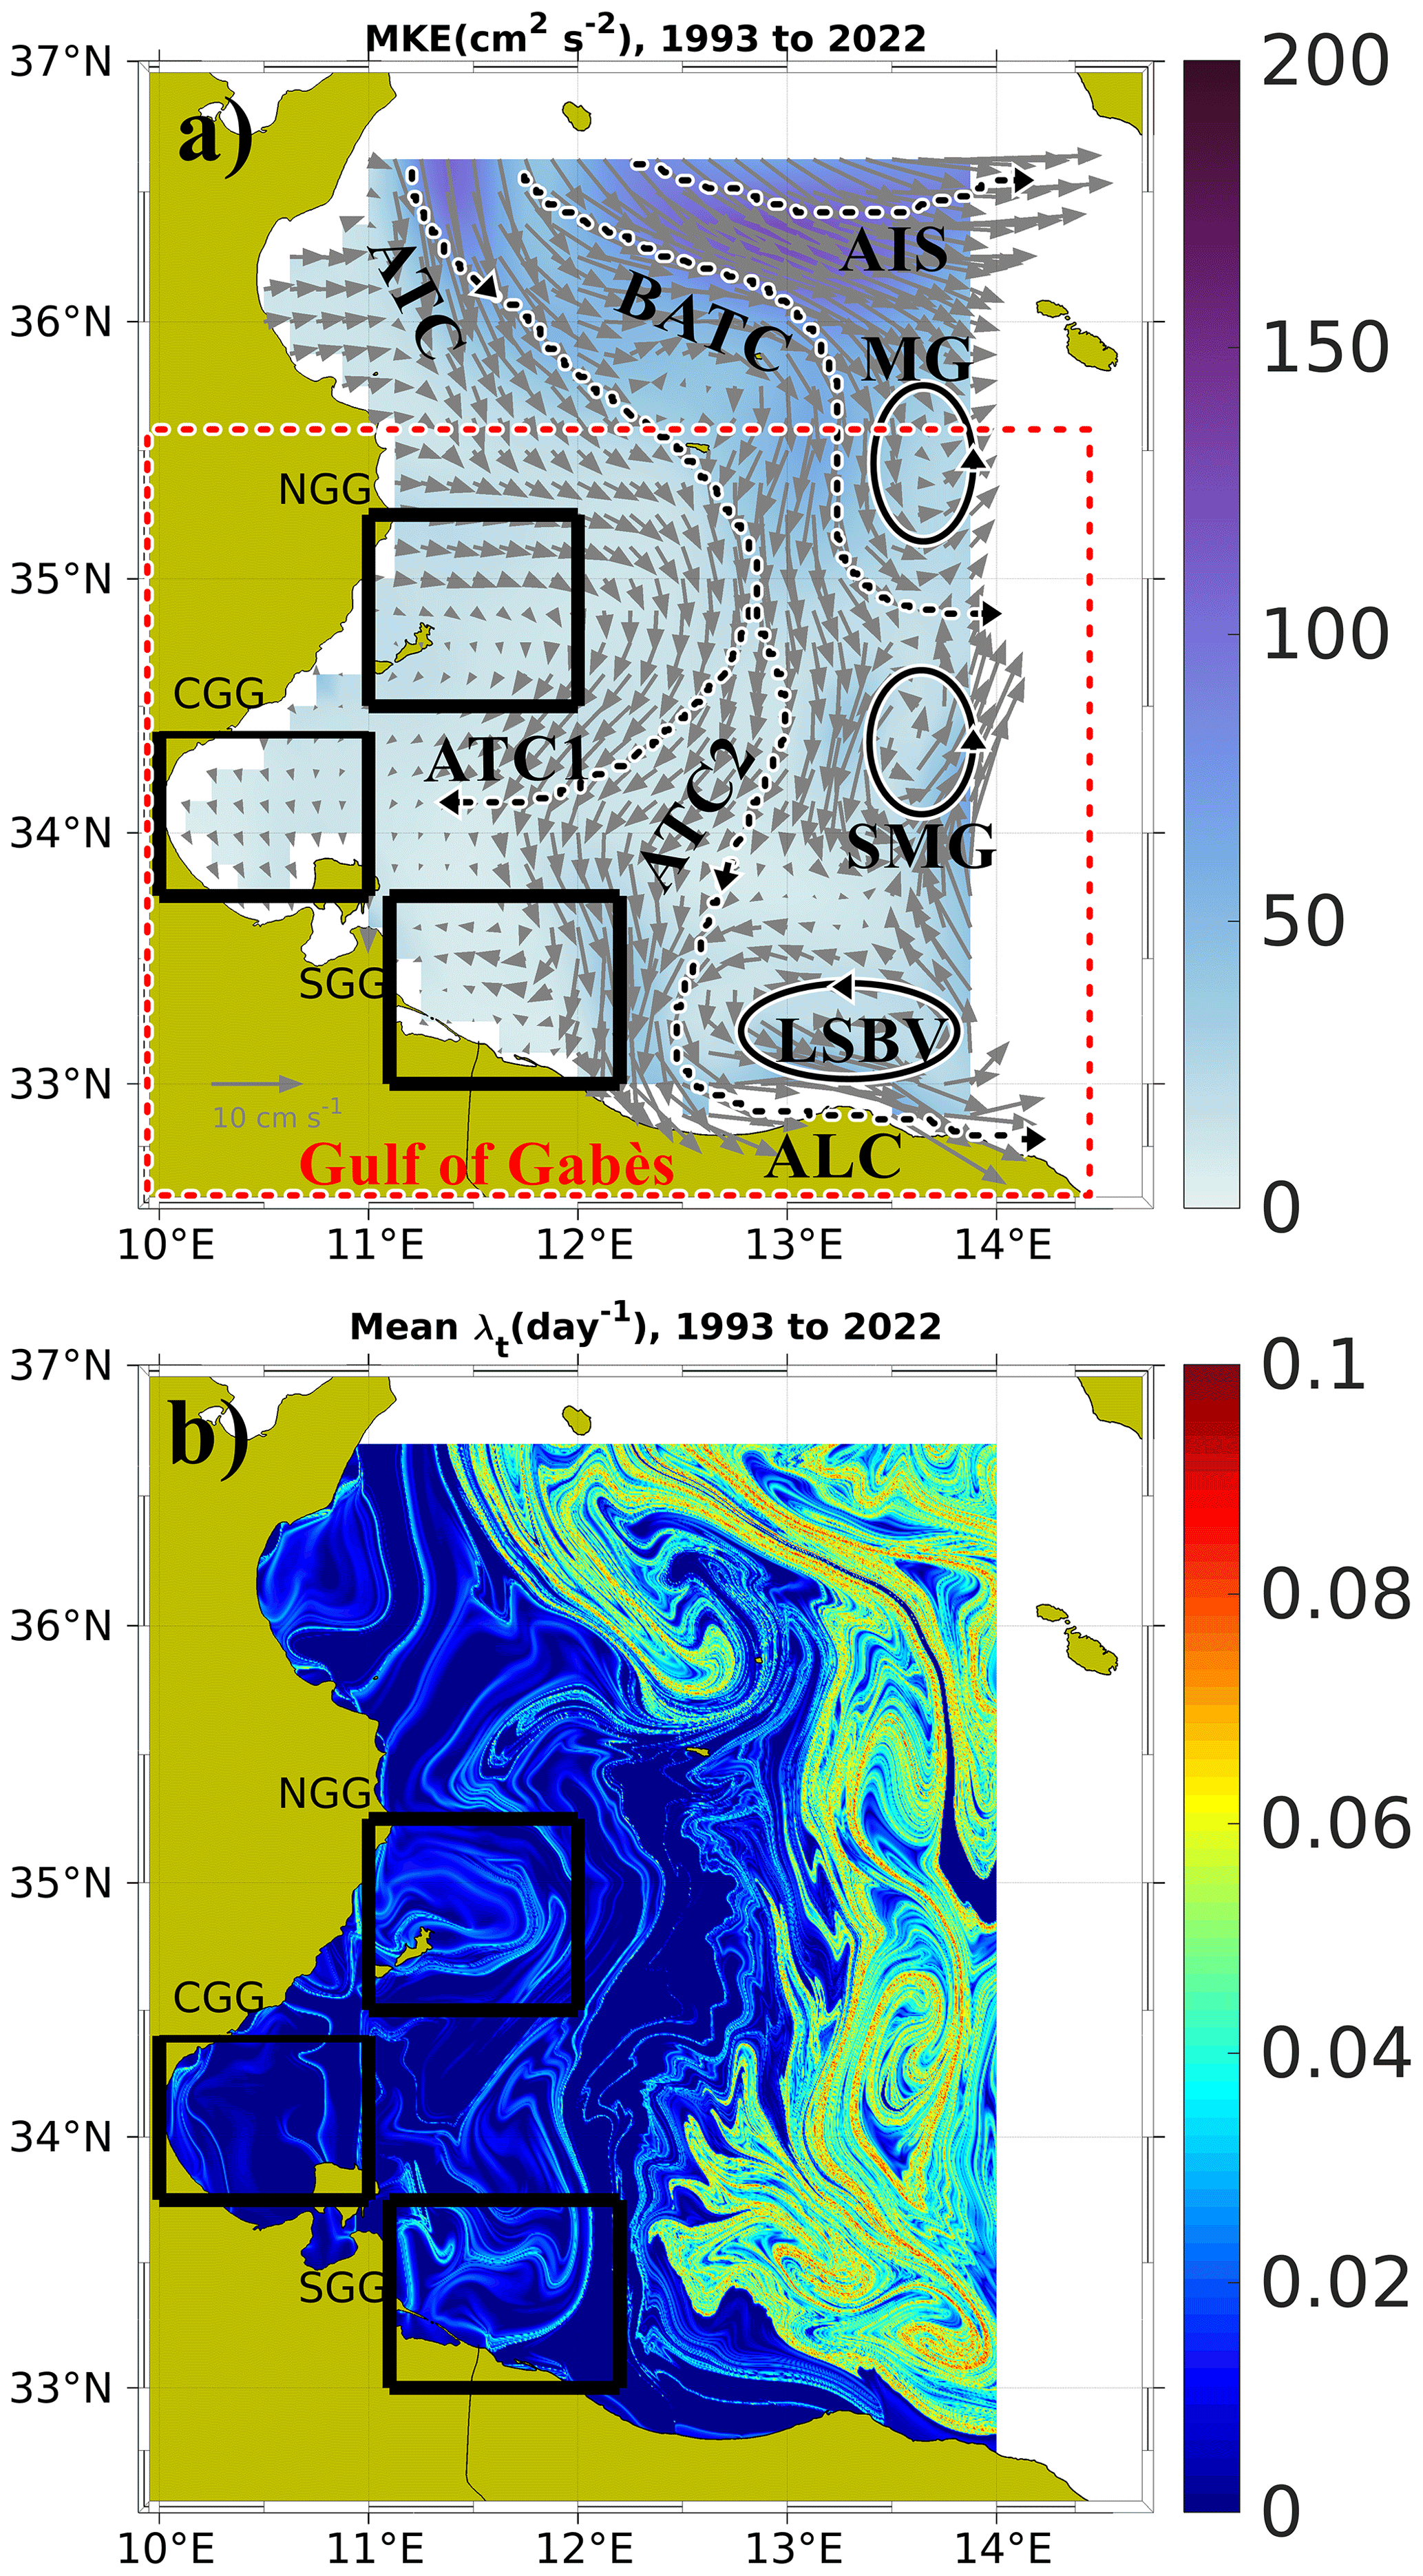
Figure 2(a) Mean kinetic energy (MKE) with superimposed mean geostrophic currents estimated over the period 1993–2022; (b) mean finite-time Lyapunov exponent (λt) computed from geostrophic velocities from altimetry data (SEALEVEL_EUR_PHY_L4_MY_008_068) in the same period. Three subareas are selected close to the coastal areas of the gulf as follows: NGG, Northern Gulf of Gabès; CGG, Central Gulf of Gabès; SGG, Southern Gulf of Gabès. List of abbreviations of the main circulation features: MG, Medina Gyre; SMG, Southern Medina Gyre; LSBV, Libyan Shelf Break Vortex; ATC, Atlantic Tunisian Current; ATC1, First Atlantic Tunisian Current; ATC2, Second Atlantic Tunisian Current; ALC, Atlantic Libyan Current; AIS, Atlantic Ionian Stream; BATC, Bifurcation Atlantic Tunisian Current.
The GG dynamics are characterized by small- and large-scale inter-annual and seasonal variability in the surface layer (Jebri et al., 2016). This system is identified by many spatiotemporal structures interacting with each other and producing an extremely complex and variable circulation.
Currents, filaments and eddies are responsible for water mass transport; thus the understanding of their seasonal and inter-annual variability is crucial for a wide variety of reasons, such as regional water exchanges with the open sea, large-scale turbulent flow spreading, propagation of particles and dispersion of sediments in the coastal zones. This is even more important in the GG environment, where the anthropogenic pressure has dramatically increased due to coastal phosphate processing plant by-products, frequent oil spill episodes, and general pollution factors such as floating marine debris or plastic and micro- and macro-litter (Ben Ismail et al., 2022). In addition, Lagrangian studies on the transport of nutrients, jellyfish, eggs and larvae would benefit from better knowledge of the mean circulation variability. To provide a realistic study for the GG circulation, it is necessary to evaluate in detail the long-term variability and the influence that tidal forcing, interacting with topography, has on the system, resulting in the generation of new structures influencing turbulence and circulation in the entire gulf.
It has been shown in Elhmaidi et al. (1993) that turbulent features induce a discrepancy between modeled and theoretical dispersion laws in the case of two-dimensional turbulent dispersion theory for isotropic and homogeneous flow. Two anomalous absolute dispersion (, elliptic, and , hyperbolic) power laws have been found in previous studies (Bouzaiene et al., 2021). These anomalous regimes have been related to sea topology through the presence of elliptic and hyperbolic structures (Bouzaiene et al., 2018, 2021). In the eddy inner parts, these areas are referred to as elliptic regions characterized by high vorticity gradients, while hyperbolic features are detected in the coherent-structure outer parts and can be related to sheared/stretched ocean flow. In Gomez-Navarro et al. (2024) the impact of tidal forcing on surface particle transport is explored, while the influence of tidal perturbation on the dispersion of elliptic and hyperbolic regions lacks, in our opinion, a certain degree of discussion.
To our knowledge, the impact of tides on topology (the distribution of elliptic and hyperbolic regions) in the GG has not been studied before, even though tidal forcing is very important in this area. Hence, given their potential influence on phytoplankton blooms, nutrient distribution and marine litter dispersion, it is essential to gain a better understanding of how tides influence circulation, dynamics and sea topology. Altimetry data analysis allows the analysis of the geostrophic circulation and the kinematic properties of mesoscale structures.
However, the low temporal and spatial resolutions of such data do not allow performing a realistic study on the dynamics introduced by tides. In order to address this issue, we leveraged high-temporal-resolution (hourly) model outputs from a numerical system which includes tides.
In this study, we focus on the kinematic properties of the geostrophic component of the circulation in the GG and on how tides affect currents. We do this using altimetry data covering the time period 1993–2022 and model analysis data for the year 2022, both distributed by the Copernicus Marine Service (CMS, http://marine.copernicus.eu/, last access: 20 October 2025). Previously, some efforts to understand this oceanographic system have been made by focusing on the general aspects of the Gulf of Gabès circulation (Ben Ismail et al., 2015, 2022; Zayen et al., 2020). The impact of internal waves on mesoscale eddies is studied in Barkan et al. (2017, 2021), where the signal increases significantly when tidal forcing is present. Furthermore, the impact of the velocity fields from a high-resolution coupled ocean–wave model simulation (Clementi et al., 2023) on simulated surface particle dispersal was studied in the Mediterranean Sea (Rühs et al., 2025). How tides influence the geostrophic features is still an open question.
Our aim is to investigate new features of the geostrophic circulation and to assess the impact of tides on it. High-resolution ocean circulation modeling and satellite altimetry could enhance our understanding of the geostrophic transport. The paper is organized as follows: in Sect. 2 we describe the datasets used and the methods applied. The results on geostrophic structures from altimetry and model data are presented in Sect. 3. A summary and conclusions are proposed in Sect. 4.
2.1 Datasets
The geostrophic circulation in the GG has been investigated by means of remotely sensed altimetry data and outputs from a high-resolution oceanographic numerical system.
2.1.1 Altimetry data
The satellite altimetry dataset used in this study is a subset of the CMS SEALEVEL_EUR_PHY_L4_MY_008_068 product (CMEMS, 2021, Mercator Ocean International, https://doi.org/10.48670/MOI-00141), with a spatial resolution of 0.125°×0.125° and a daily temporal resolution. Our analyses were conducted over a 30-year period, from 1993 to 2022. For more details, see the Quality Information Document (QUID) (https://documentation.marine.copernicus.eu/QUID/CMEMS-SL-QUID-008-032-068.pdf, last access: 20 October 2025). The variable used is the absolute surface geostrophic velocity, and we inferred the vorticity, the divergence, the Okubo–Weiss parameter, the deformation gradients and the finite-time Lyapunov exponent (FTLE) from the surface geostrophic velocity variable from the absolute dynamic topography (ADT). These parameters were investigated in order to elucidate the mean circulation, persistent currents, eddies and gyres.
2.1.2 Chlorophyll a data
The chlorophyll a dataset used in this study is the CMS OCEANCOLOUR_MED_BGC_L4_MY_009_144 product. We used the daily mass concentration of chlorophyll a in seawater (CHL) at 1 km resolution from the Ocean Satellite Observations for multi-year Bio-Geo_Chemical (BGC) regional datasets (https://doi.org/10.48670/moi-00300, CMEMS, 2022).
2.1.3 Model data
Hourly sea surface height (SSH) fields from model data (CMS MEDSEA_ANALYSISFORECAST_PHY_006_013 (Clementi et al., 2023) covering the year 2022 are used to compute geostrophic currents. We have chosen the year 2022 since at the time the dataset was processed it was the only complete year for the CMS system including tidal signals in the hydrodynamic model used. The physical component of the Mediterranean Sea within the framework of CMS (Med-Physics) is a tidal coupled hydrodynamic-wave model with a data assimilation system implemented over the whole of the Mediterranean Sea, a horizontal resolution of ° (∼4 km) and 141 unevenly spaced vertical z* levels (Clementi et al., 2017). More detailed information on the system and its products can be found in the Quality Information Document (https://catalogue.marine.copernicus.eu/documents/QUID/CMEMS-MED-QUID-006-013.pdf, last access: 20 October 2025).
2.2 Methods
To describe the kinematic properties and the circulation of the GG, we estimated the geostrophic currents for the year 2022 from the model data (MEDSEA_ANALYSISFORECAST_PHY_006_013) SSH fields, and we then computed the four following quantities from the altimetry data and model data (described in Sect. 2.1.1 and 2.1.3, respectively): the normalized vorticity (with respect to f), normalized divergence, normalized Okubo–Weiss parameter and FTLE.
2.2.1 Estimation of the geostrophic currents
The model SSH field (Sect. 2.1.3) was used to estimate the geostrophic currents, resulting from the balance between the Coriolis force and the horizontal pressure gradient. The zonal (ugeos) and the meridional (vgeos) components of the geostrophic velocities are derived from the geostrophic equations as follows (Apel, 1987; Vigo et al., 2018a, b):
where x and y are the longitude and the latitude components, respectively; η is the model SSH; g=9.81 m s−2 is the gravity acceleration; and f=2Ωsin (λ) is the Coriolis parameter, with λ being the latitude in degrees, the Earth angular velocity and T the period of rotation.
In order to evaluate the tidal residual from the full SSH signal, a Doodson filter was applied to the dataset, following the approach proposed in the “Manual on Sea Level Measurement and Interpretation” of the IOC (1985). The Doodson is a low-pass, symmetric filter based on the definition of 19 coefficients as follows:
The value of the de-tided sea level SSHres at time t0 is calculated as
where SSH denotes the sea level elevation, t0 is the time expressed in hours, and the coefficients d represent the increasing or decreasing hours with respect to the central value t0.
2.2.2 The normalized vorticity
The normalized vorticity, which is equivalent to the Rossby number (Ro), is defined as (Poulain et al., 2023)
where ζ is the relative vorticity; ζ* is a good indicator of feature activity in the ocean. If ζ* ∼ O(1), the flow shows ageostrophic features, while for , the flow shows quasi-geostrophic structures (Siegelman, 2020). indicates the presence of cyclonic structures, whereas when ζ* is negative, the flow shows anticyclonic features.
2.2.3 The normalized divergence
The normalized divergence, a fundamental metric to characterize the transport of passive and active tracers, is defined as (Poulain et al., 2023)
where δ is the horizontal divergence of the velocity field. It allows us to detect two different dynamical oceanic zones: for (divergence), the flow fields tend to propagate outward through the surrounding surface of a closed control volume, diverging from its center, whereas for (convergence), the flow particles tend to converge to the center of the volume.
2.2.4 The normalized Okubo–Weiss parameter
The normalized Okubo–Weiss parameter serves as a powerful indicator to distinguish between two different topological domains: elliptic or hyperbolic. It is defined as
where S is the strain or rate of deformation of the flow, and it is composed of a shear term Ss and of a normal term Sn. It is defined as follows:
where Ss and Sn are defined as
is an elliptic domain that can be defined, while is a hyperbolic region that can be identified (Okubo, 1970; Weiss, 1991; Elhmaidi et al., 1993; Bouzaiene et al., 2018, 2021). As shown by Bouzaiene et al. (2021), the flow dynamical properties in the eddy inner parts (elliptic regions) and surrounding coherent structures (hyperbolic structures) are very different. In this study S is normalized by f to identify the sheared and/or stretched regions:
2.2.5 The finite-time Lyapunov exponent
The finite-time Lyapunov exponent (FTLE) λt is a parameter which describes the separation amongst particles in a specific time interval, and it has been used in several ocean applications to identify the Lagrangian coherent structures (LCSs) (Shadden et al., 2005; Farazmand and Haller, 2012; d'Ovidio et al., 2010; Rousselet et al., 2025). In previous investigations within the Mediterranean region, the emphasis was on the finite-scale Lyapunov exponent (FSLE) rather than the FTLE. The FSLE was calculated on the basis of the exponential growth of distances between Lagrangian particle pairs initially separated. This calculation served the dual purpose of identifying Lagrangian coherent structures (LCSs), as demonstrated by d'Ovidio et al. (2004, 2009), and comparing LCSs with Lagrangian surface drifter trajectories, as explored by Bouzaiene et al. (2020).
More recently, Morales-Márquez et al. (2023) investigated the use of FSLE to characterize LCSs concerning mixing and transport properties in the upper layer of the entire Mediterranean Sea. Despite these advancements, the application of the parameter λt in coastal Mediterranean zones, particularly in the GG, remains an unanswered question. The implementation of FTLE in coastal areas, namely from altimetry data, has been limited by the error in the data in very coastal areas. This study seeks to address this gap by computing λt specifically for LCS analysis in these areas. The implementation of FTLE using particle trajectories with increasing resolution (Onu et al., 2015) in the GG could bring new insight into how coastal features impact biology. The use of FTLE in coastal areas is reliable for detecting LCSs (Peng et al., 2024).
FTLE is a local scalar that represents the separation rate of initially neighboring particles for a finite time [t0, t0+T]. At position x0 and time t0, λt is defined as follows (Haller, 2002, 2015; Liu et al., 2018):
where λmax is the largest eigenvalue of the Cauchy–Green stress tensor, while the flow field of fluid particle trajectories is defined as and tr indicates the matrix transpose.
In 2D turbulence theory, the eigenvalues of the Cauchy–Green tensor quantify the stretching of fluid particles along their relevant directions (Liu et al., 2018). FTLE can be implemented forward in time and/or backward in time, which has implications for phytoplankton as one shows attracting and the other repelling structures. In this work, we compute the forward-in-time or positive-time (T>0) values of the λt field. This eigenvector is called the “forward finite-time Lyapunov vector”. It has been shown that λt is predominantly reliable in terms of capturing coherent structures starting from an integration time of 6 d, with no upper limit (Du Toit, 2010; Rypina et al., 2011; Liu et al., 2018). In this study, daily FTLE fields are computed and then averaged seasonally over a 30-year period to detect the mean features and over 7 d to compare them to phytoplankton blooms occurring in GG. Here, λt is calculated from the velocity fields derived from satellite altimetry data at temporal and spatial resolutions of 1 d and °, respectively. Our choice is to set the resolution of the mean initial trajectory conditions to 800 m × 800 m, corresponding to °, about 16 times larger than the velocity field resolution, which guarantees an LCS accurate enough for capturing oceanic features (Onu et al., 2015). In general, high values of λt indicate the edges of coherent structures, fronts and filaments (hyperbolic regions), while low values correspond to the inner parts of the eddies (elliptic areas). Both are considered transport barriers (Blazevski and Haller, 2014). Intense stirring induced by strong turbulence disperses the high input of nutrients when uplifted from deeper layers, whereas larger quantities of nutrients remain in more quiescent zones (decreased turbulence; Hernandez-Garcia et al., 2010).
Three subareas were identified in the GG (black boxes in Fig. 2) in order to highlight differences and similarities in the dynamical features: the Northern Gulf of Gabès (NGG, 11–12° E and 34.6–35.25° N), Central Gulf of Gabès (CGG, 10–11° E and 33.75–34.4° N) and Southern Gulf of Gabès (SGG, 11.1–12.2° E and 33–33.75° N). The Mediterranean features are strongly driven by the instability of intense coastal currents, which have frequently changed their location and lifespan over the past decades (Bouzaiene et al., 2020; Poulain et al., 2012). In order to investigate the kinematic properties of mesoscale features, we used 30 years of altimetry data in the present paper, focusing on the main circulation features in the GG. This 30-year dataset allows for the detection of mean patterns across three decades, providing a basis to discuss the well-known mean features during the observational data availability period. The satellite altimetry data spanning 30 years are used to give an overview of the mean kinematic features in the GG domain and in the three specified subareas, as detailed in Sect. 3.1. The altimetry analysis could help to overview long-term kinematic properties in the coastal regions (Srinivasan and Tsontos, 2023).
The relatively low temporal and spatial resolutions of the data do not allow us to consider the impact that tides have on GG features in a smaller area. Hence, we focused on the smaller GG domain (CGG, 10.00–11.35° E and 33.40–34.75° N), where we derived geostrophic currents from the SSH model fields, allowing us to test the impact of tides in the GG, as explained in Sect. 3.2. SSH spatial and temporal averages in the CGG have been removed from the native SSH fields.
The resulting mean seasonal geostrophic circulation in the CGG was compared to its counterpart computed from the de-tided SSH fields in order to assess the impact of tides on the geostrophic dynamics of the gulf. The de-tiding on the native SSH fields was performed using a Doodson filter (see Sect. 2.2.1 for details).
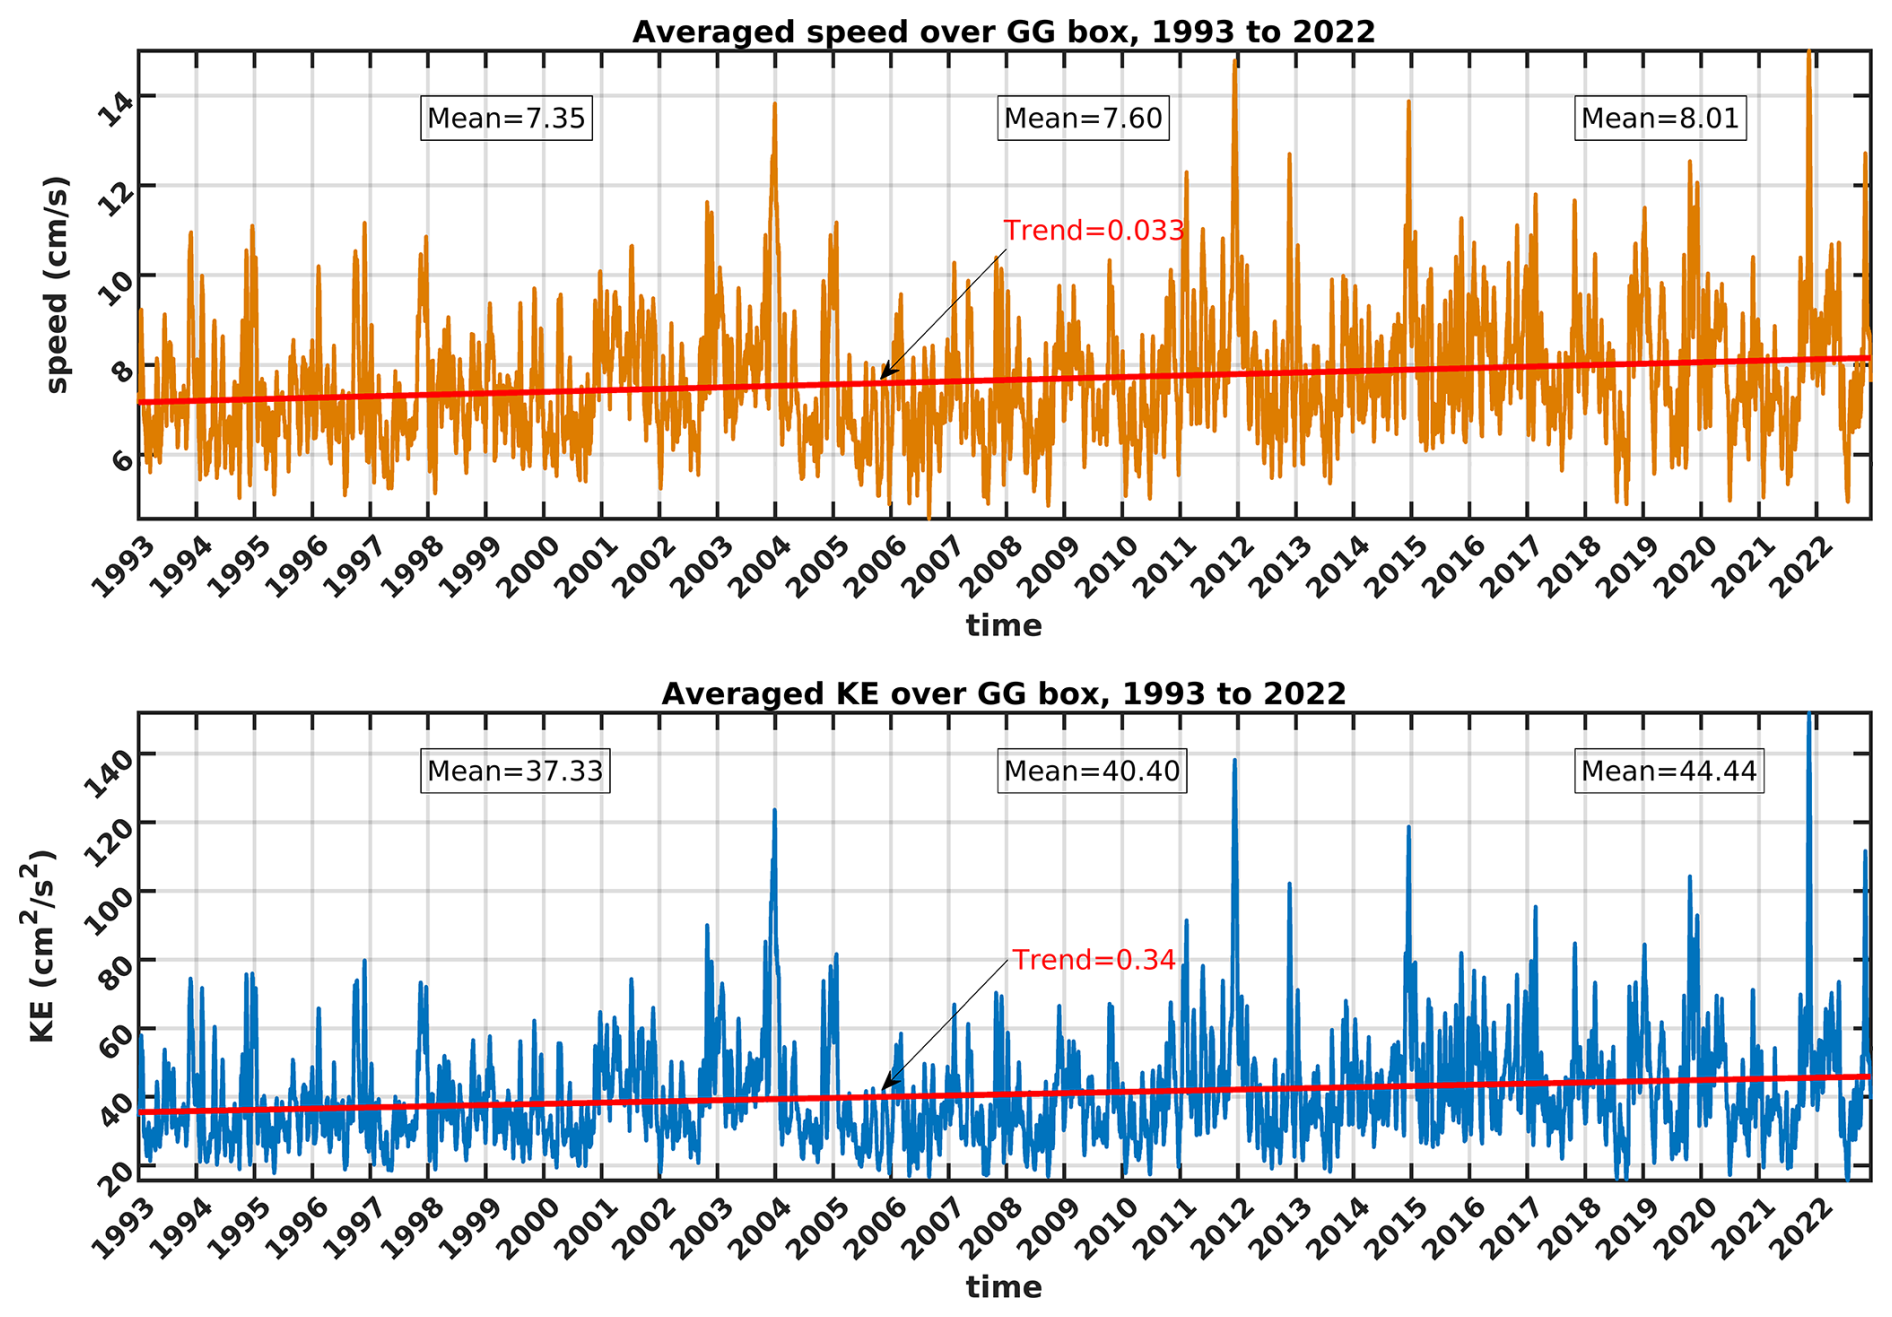
Figure 3Time series of (top) mean speed and (bottom) kinetic energy estimated from geostrophic velocities provided by altimetry data (SEALEVEL_EUR_PHY_L4_MY_008_068) in the Gulf of Gabès over the period 1993–2022. The quantities are the mean over the larger GG box as displayed with the red rectangle in Fig. 1.
3.1 Altimetry data analysis of the mean geostrophic circulation
Figure 2a shows the geostrophic circulation (grey arrows) averaged over the period 1993-2022, superimposed on the mean kinetic energy, , for the same period, where 〈 … 〉 represents the average over the 30 years. Several well-known structures are clearly visible, namely (1) the edges of the cyclonic features referred to as the Medina Gyre (MG), the Southern Medina Gyre (SMG) and the Libyan Shelf Break Vortex (LSBV); (2) the first Atlantic Tunisian Current (ATC1), which is well developed along the Tunisian coasts; and (3) the second Atlantic Tunisian Current (ATC2), flowing near the Libyan boundaries and forming the Atlantic Libyan Current (ALC), in agreement with the results of Sorgente et al. (2011), Jebri et al. (2016) and Menna et al. (2019).
The MKE shows the presence of energetic features flowing into the GG as well as surrounding eddies, BATC, ATC1 and ATC2, with MKE of ∼50–100 cm2 s−2, while the Atlantic Ionian Stream (AIS) flows in through the northeastern Ionian Sea with a maximum MKE of approximately 100–150 cm2 s−2. The mean FTLE averaged over the 30-year altimetry data period (λt; Eq. 9) is shown in Fig. 2b. λt can be applied to investigate the link between the GG dynamics and the chlorophyll concentration, which are known to be related by inverse proportionality (Rossi et al., 2008; Hernández-García et al., 2010). The regions located far from the GG are characterized by a large λt, close to 0.1 d−1, indicating strong chaotic advection clearly evidenced by the presence of intense eddies and persistent currents (MG, SMG, LSBV, AIS; see Fig. 2a vs. Fig. 2b). These features appear as local barriers to transport, inhibiting biological production. On the contrary, in the coastal zones of the GG, λt tends to zero. These zones may favor the nutrient standing stocks due to the weak effect of the horizontal mixing and stirring. This could be one of the causes of the observed high chlorophyll concentration close to the Tunisian boundaries, as supported by previous studies (Bel Hassen et al., 2010; Macias et al., 2018; Kotta and Kitsiou, 2019), where nutrients have been shown to flee from highly turbulent zones to settle in less chaotic areas. We computed the daily mean speed and kinetic energy (KE) time series over 30 years (1993–2022) using altimetry data, as shown in Fig. 3. The quantities are averaged over the larger GG box, indicated by the red rectangle in Fig. 1. Higher speed and KE values are mostly observed in winter and fall, while lower values occur in spring and summer. This variability is likely strongly related to atmospheric forcing. In order to evaluate the evolution of regional dynamics over the decades, we computed the means of the two quantities separately for the three following periods: 1993–2002, 2003–2012 and 2013–2022. The mean speed increased over the decades, from 7.35 cm s−1 in 1993–2002 to 7.6 cm s−1 in 2003–2012 and 8.01 cm s−1 in 2013–2022. Similarly to the averaged speed, the mean kinetic energy also increased by approximately 7 cm2 s−2 from the beginning to the end of the considered period.
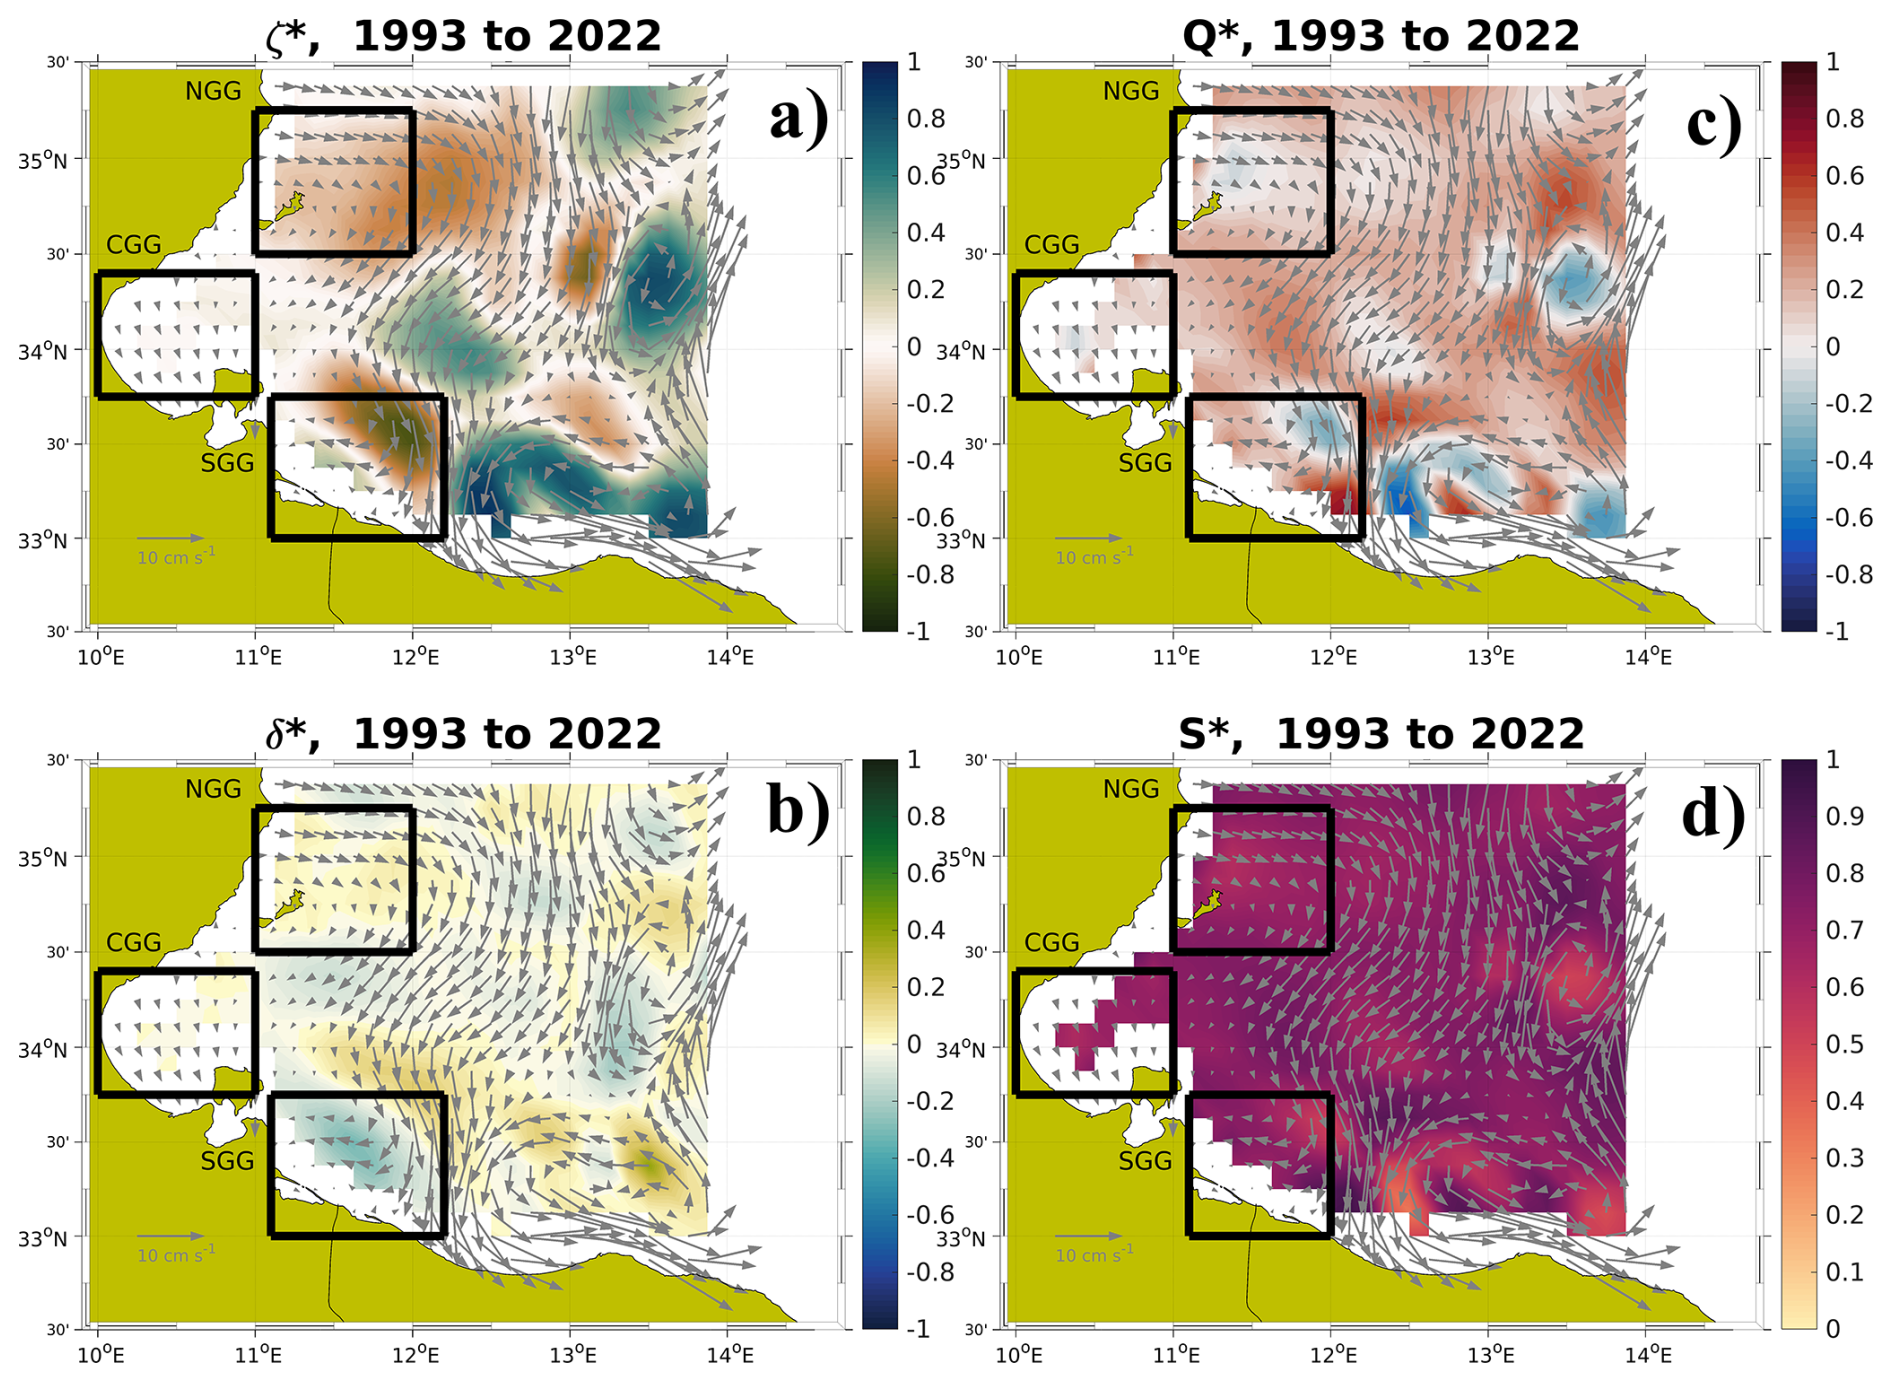
Figure 4Mean circulation from altimetry data (SEALEVEL_EUR_PHY_L4_MY_008_068) estimated over the period 1993–2022. (a) Normalized vorticity (ζ*), (b) normalized Okubo–Weiss parameter Q*, (c) normalized divergence (δ*) and (d) normalized deformation (S*), with superimposed mean geostrophic velocities. Three subareas are selected close to the coastal areas of the gulf as follows: NGG, Northern Gulf of Gabès; CGG, Central Gulf of Gabès; SGG, Southern Gulf of Gabès.
The NGG is clearly evidenced by the presence of a large anticyclonic current with λt∼0 in its core, while λt is greater than zero in the eddy outer part. A similar pattern can also be observed in the SGG. On the contrary, the mean FTLE in the CGG suggests the presence of filaments and fronts (Fig. 2b). The normalized vorticity (ζ*), normalized Okubo–Weiss parameter (Q*), normalized divergence (δ*) and normalized deformation (S*) over the 30 years (1993–2022) from the altimetry product are shown in Fig. 4a–d, respectively, confirming the presence of the MG, SMG and LSBV eddies. Except for the MG, within the interior of these structures, the value of Q* is negative (elliptic regions) due to high vorticity gradients, whereas in the surrounding coherent structures the value of Q* is positive, with predominantly hyperbolic areas due to strong deformation gradients (Fig. 4b).
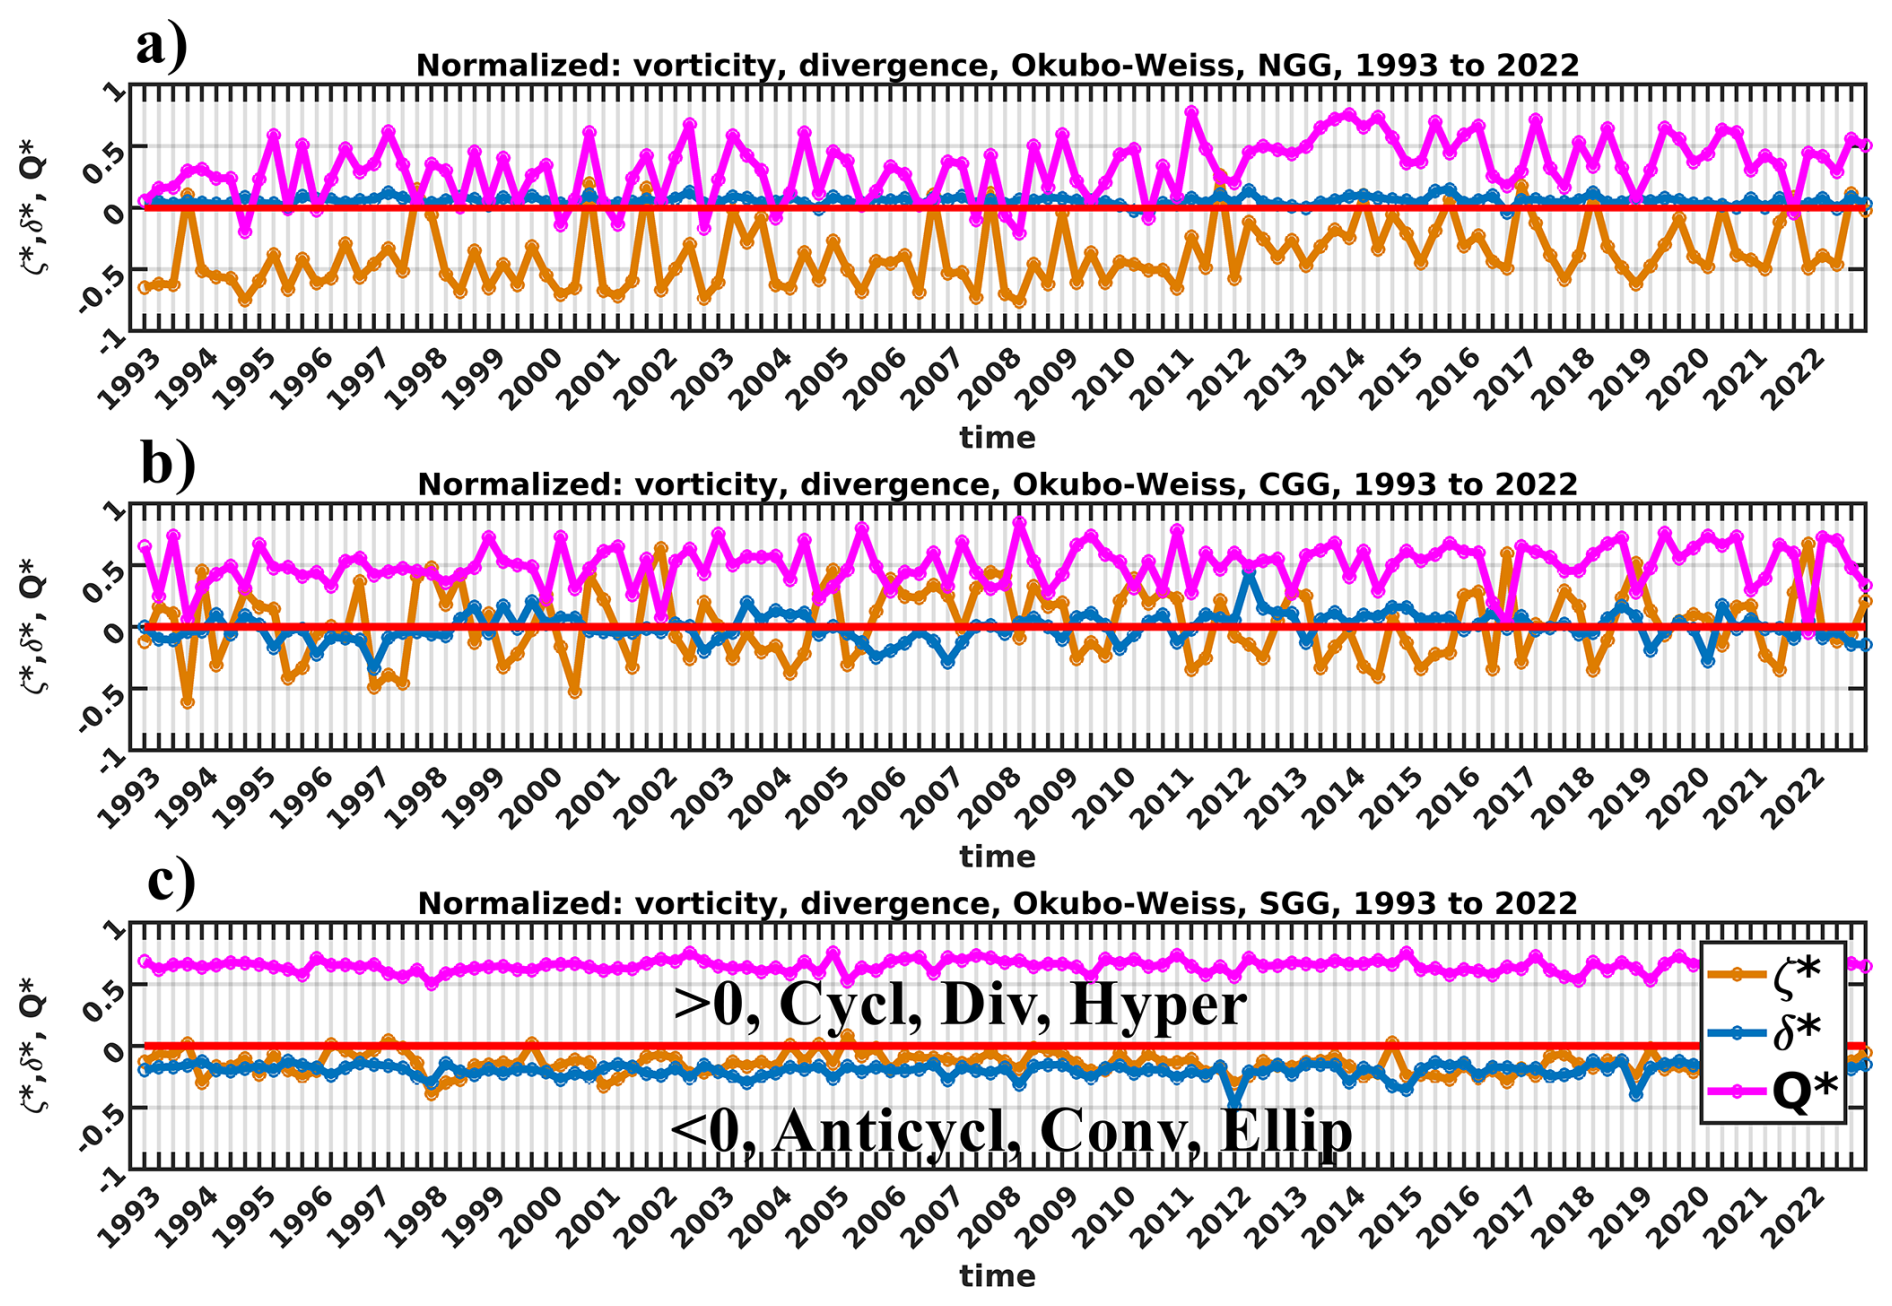
Figure 5Time series of normalized vorticity (ζ*; orange), normalized divergence (δ*; blue) and normalized Okubo–Weiss parameter (Q*, magenta) estimated from geostrophic velocities provided by altimetry data (SEALEVEL_EUR_PHY_L4_MY_008_068) in the Gulf of Gabès over the period 1993–2022. (a) North GG; (b) Central GG; (c) South GG. The quantities are averages over each of the boxes defined in Fig. 4.
The vorticity mostly agrees with the divergence (Fig. 4a and c) for ζ* and δ* higher than zero, implying the presence of several permanent/recurrent eddies and gyres where the flow tends to propagate outward through the surrounding eddy cores (divergence). Upwelling of deep, nutrient-rich water masses occurs in these areas, leading to enhanced biological production at the surface. In the opposite scenario (negative ζ* and δ*), the surface flow is pointing towards the inner parts of the anticyclonic eddy (convergence), pushing water towards its center of mass and then sinking to the bottom layers. The flow is sheared or stretched (S* ∼ O(1)) in the eddy outer parts where the current is very unstable. These zones can be identified as hyperbolic regions due to strong deformation gradients, while for (inside coherent vortices), the rotation is dominant (Fig. 4b and d). In order to compare the dynamics of regions relatively close to the GG with farther ones, ζ*, δ* and Q* are seasonally evaluated in the three subareas displayed in Fig. 5. They can all be classified as hyperbolic regions (, magenta lines in Fig. 5), meaning that the flow can be stretched or sheared. Except for some seasons, the NGG and CGG surface waters tend to rotate into gyres (elliptic areas, ). In the CGG, the vorticity oscillates from (anticyclonic) to ∼0.5 (cyclonic), while ζ* shows mostly negative values in the two other areas considered (thus indicating the presence of anticyclonic vortices). In agreement with the vorticity values, the divergence is negative in the SGG (convergent flow, Fig. 5c). In the NGG and CGG, δ* indicates positive values, mostly greater than zero in the NGG, thus denoting the presence of upwelling flows (Fig. 5a and b, blue line). The difference in the divergence of the three subareas might be related to the different interaction of the main forces (i.e., tides and winds) with the bottom topography.
3.2 Model data analysis of the geostrophic circulation in 2022
The GG surface circulation is strongly controlled by tides (Zayen et al., 2020). The highest tidal ranges can be detected in the central part of the GG, whilst they are much less significant outside of the gulf (Abdennadher and Boukthir, 2006). Tidal movements, which induce vertical mixing, could be considered a potential cause of high chlorophyll concentration in the CGG (Macias et al., 2018).
The following sections will focus on the CGG dynamics, both because of their importance from the biological production point of view, as shown previously by Feki-Sahnoun et al. (2018), and because they represent a site of particular interest to investigate the influence of tidal forcing on dynamics.
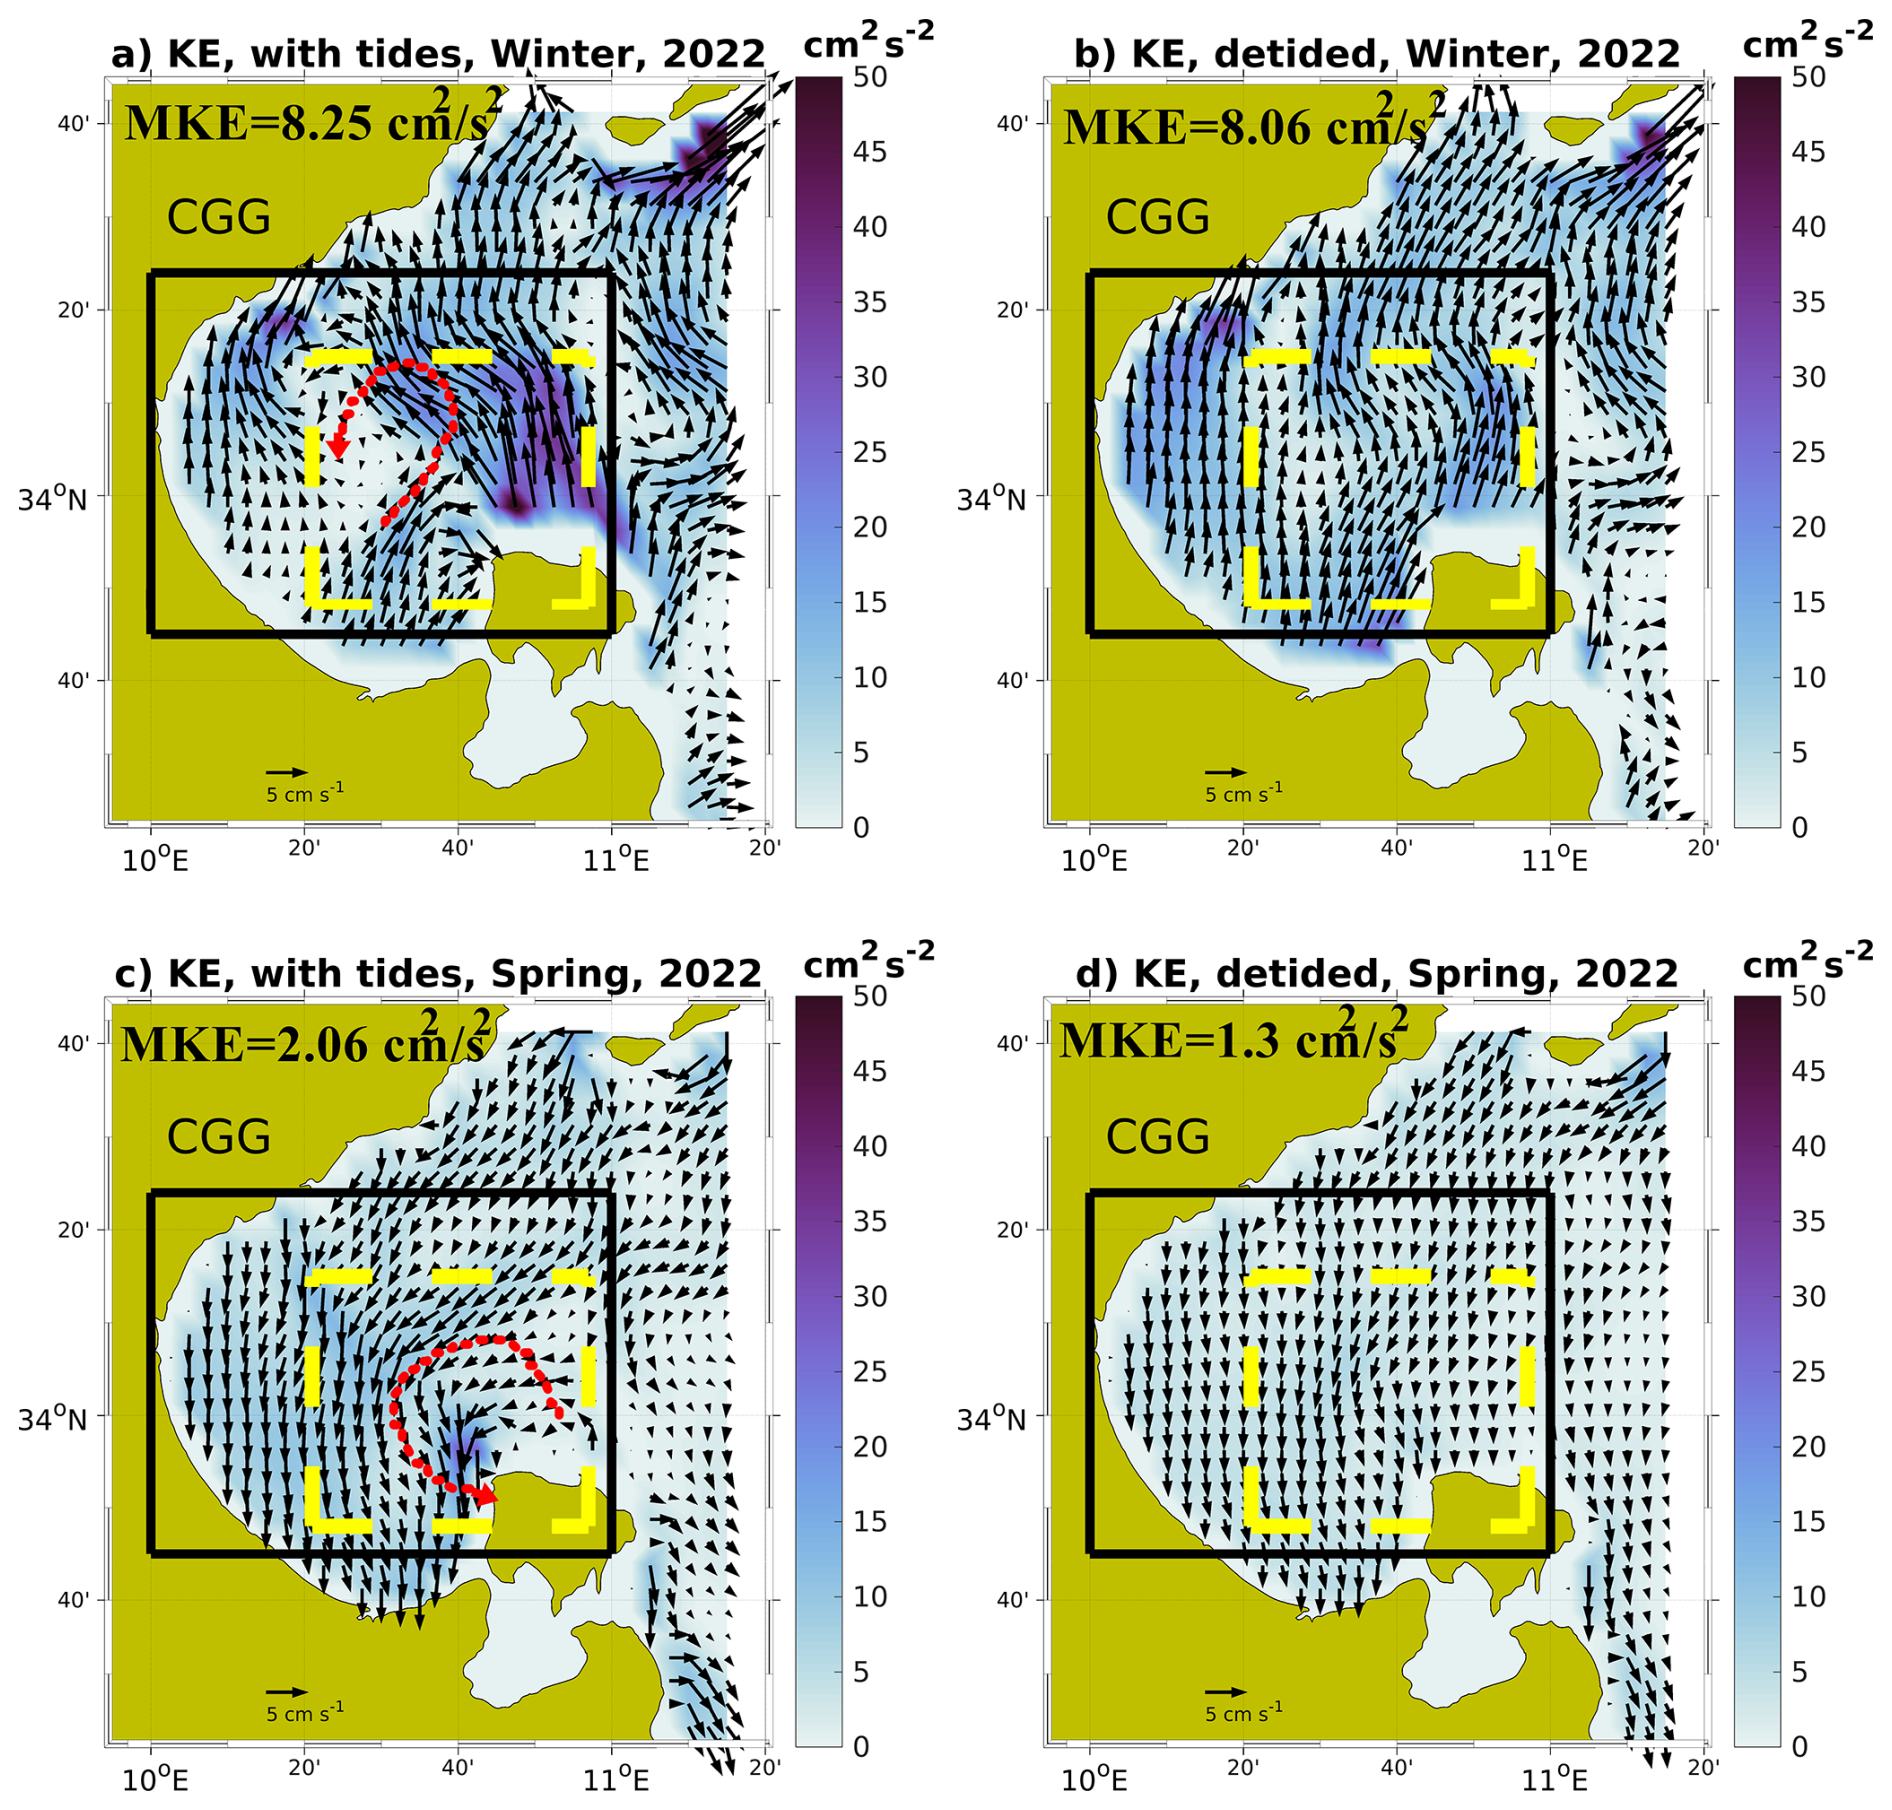
Figure 6Seasonal mean geostrophic currents computed from MEDSEA_ANALYSISFORECAST_PHY_006_013 product SSH fields; both native with tidal forcing included (a, c) and de-tided (b, d) superimposed on seasonal mean kinetic energy (MKE), in winter and spring, for the year 2022. The average MKE values are shown in the top left of each panel. The black rectangles show the CGG, while the dashed red lines show the cyclonic currents. The dashed yellow boxes show the areas where the cyclonic currents are formed.
3.2.1 Seasonal variability
The comparison of the mean seasonal geostrophic circulation in 2022 derived from full SSH and de-tided SSH is shown in Figs. 6 and 7, where the arrows representing the geostrophic velocities are superimposed on the kinetic energy. During winter/fall, the mean flow tends to flow in from the south to the north, while in spring and summer its circulation is mainly cyclonic bordering the coastline. Our results are in good agreement with previous studies in the Mediterranean Sea (Vigo et al., 2018a). The difference in flow direction in the CGG can be related to the topography of the gulf (Fig. 1) and/or to the horizontal pressure force influenced by anomalous cyclonic and anticyclonic atmospheric conditions which were present in 2022, as found in Marullo et al. (2023). These atmospheric conditions could also be potential causes of the different seasonal geostrophic patterns shown in Figs. 6 and 7. The influence of tides can also be found in the difference in the seasonally averaged KE computed in the case of full SSH and de-tided SSH. In winter, in the case of geostrophic currents computed from full SSH, the KE can reach ∼50 cm2 s−2, while it decreases in the other seasons with the lowest values detected in summer/fall (KE < 5 cm2 s−2). The tides' influence on geostrophic circulation can be also quantified by the differences in mean KE computed from full SSH and de-tided SSH fields. The largest MKE values (8.25 and 8.06 cm2 s−2 for tidal and de-tided fields, respectively) can be observed in winter, while the lowest values are observable in fall, with an average value of about 0.17/0.14 cm2 s−2. In spring and summer, the MKE values are 2.06/1.3 and 0.43/0.23 cm2 s−2, respectively. Moreover, in spring and summer the relative weight of the tidal component of the KE is much stronger (46 % and 37 %, respectively) than in winter and fall (2 % and 17 %). Since tidal forcing itself does not have significant seasonal variability, it is clear that it does not affect the varying seasonal patterns shown in Figs. 6a, c and 7a, c. The impact of tides on geostrophic circulation can be observed for the cyclonic vortex detectable in spring, summer and fall northwest of the island of Djerba (∼10.4–10.9° E and ∼33.8–34.15° N; see the red lines in Figs. 6 and 7) in the full SSH field, which disappears when deriving geostrophic circulation from de-tided SSH fields.
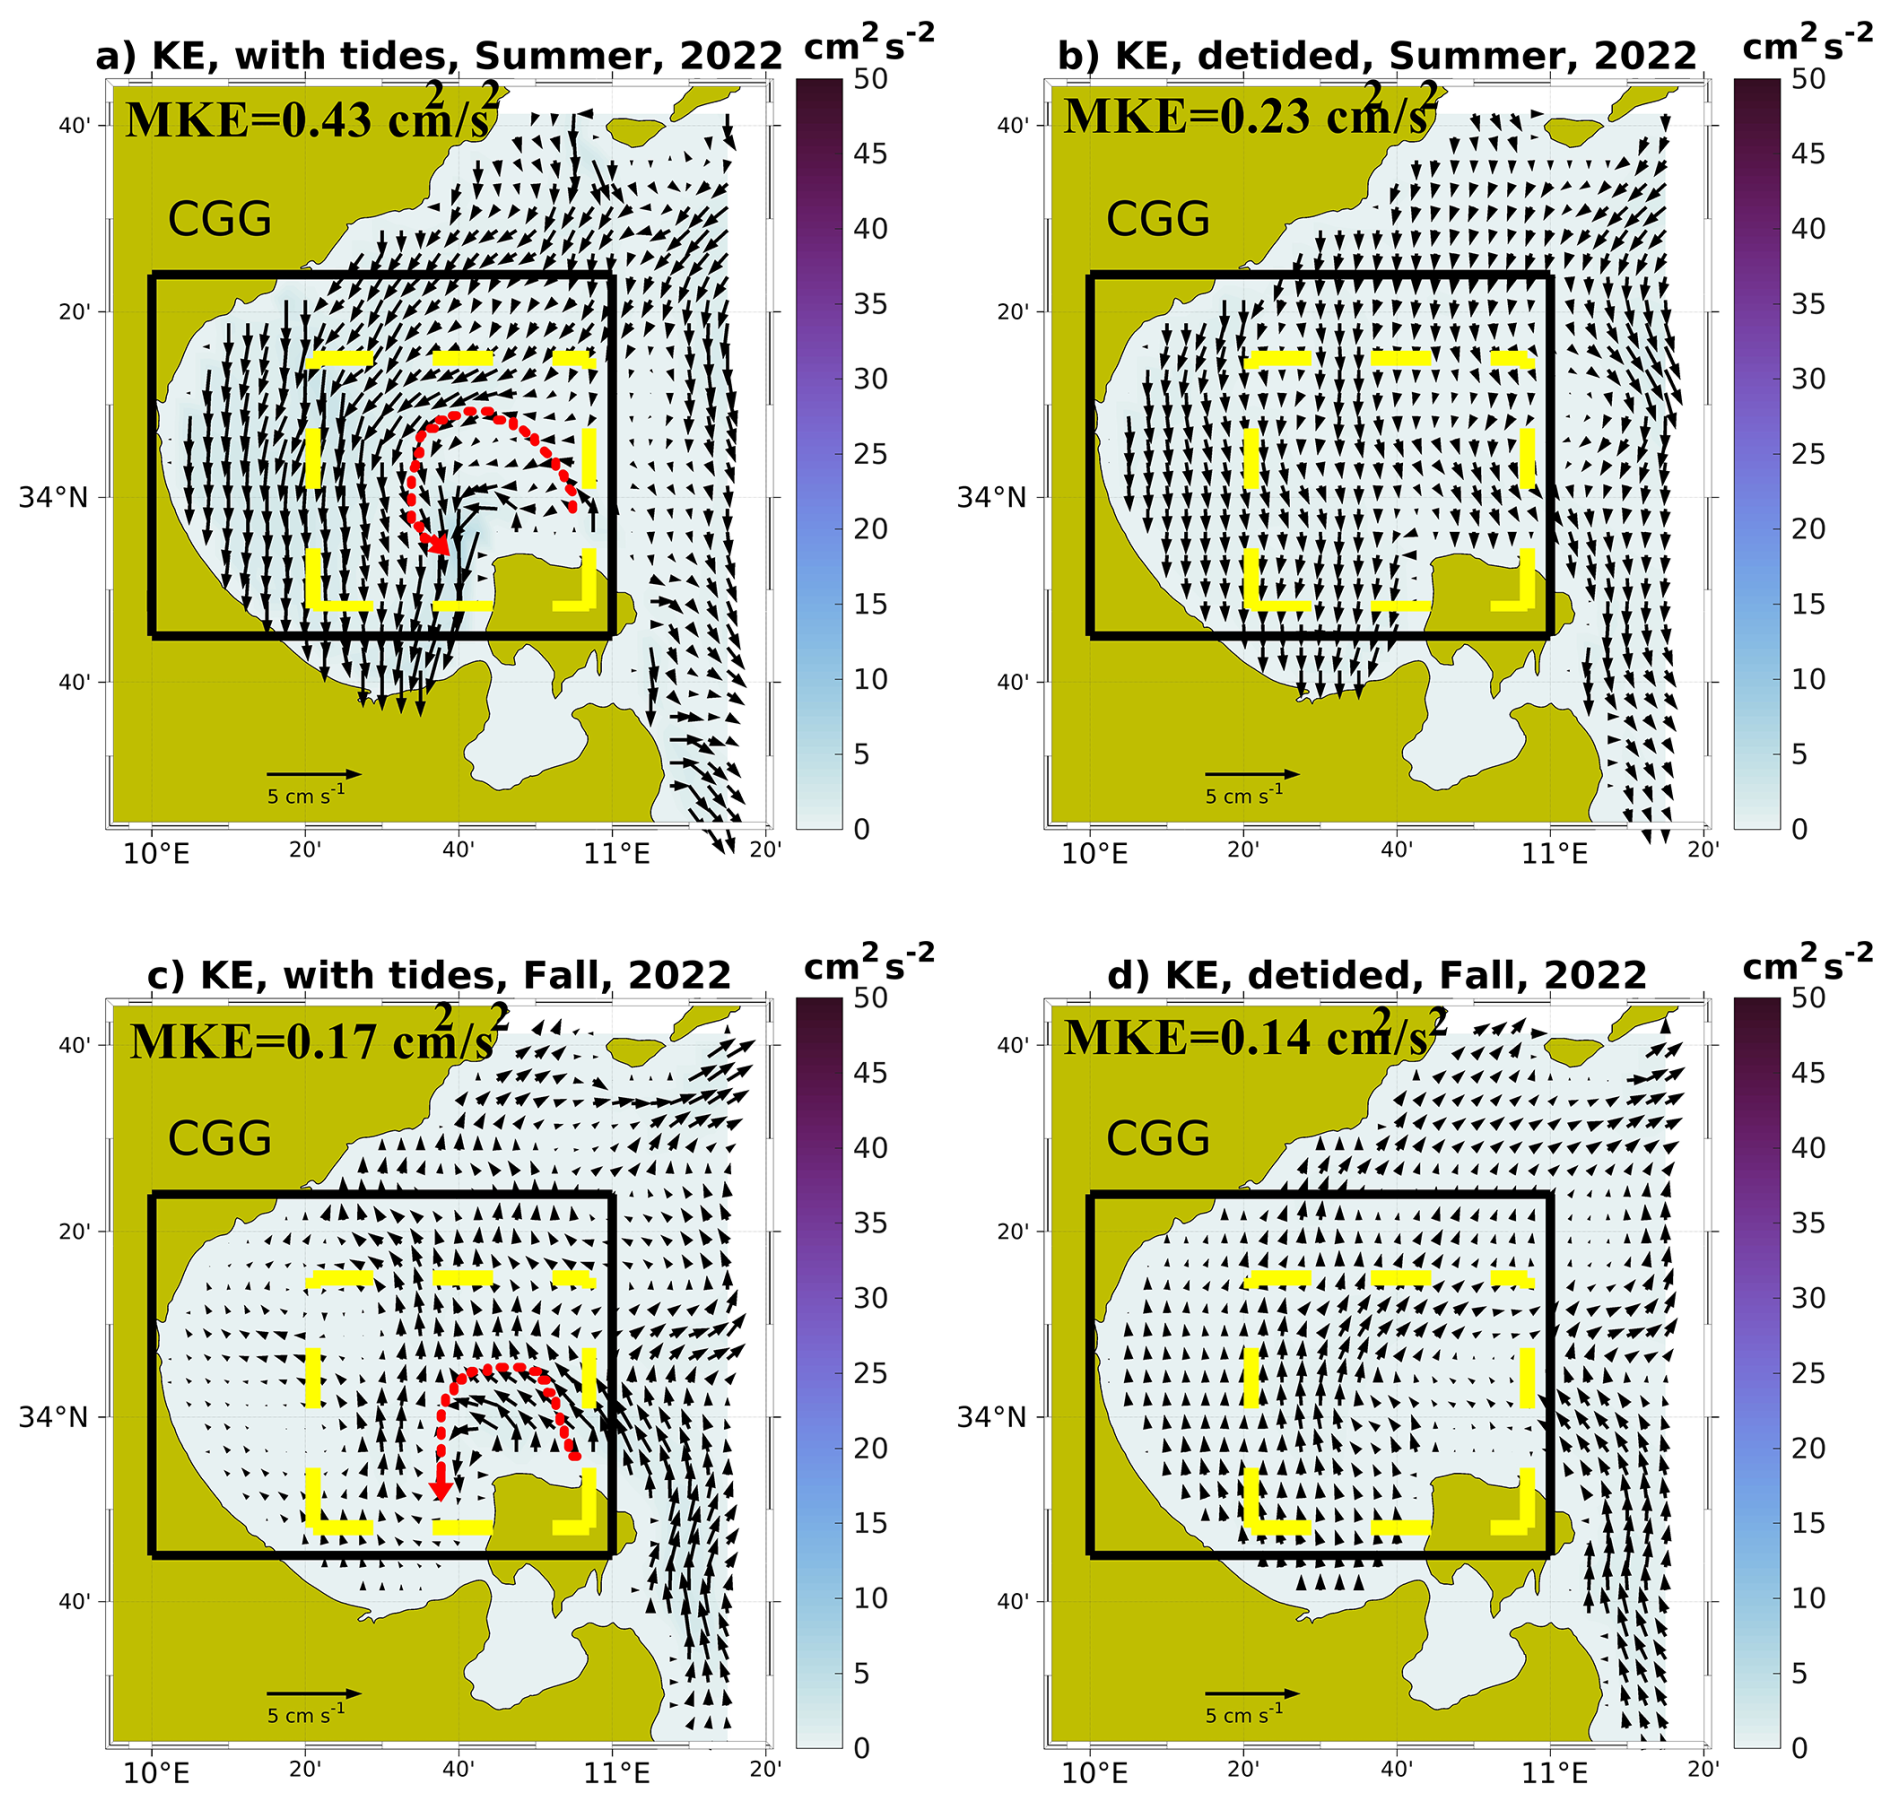
Figure 7Seasonal mean geostrophic currents computed from MEDSEA_ANALYSISFORECAST_PHY_006_013 product SSH fields; both native with tidal forcing included (a, c) and de-tided (b, d) superimposed on seasonal mean kinetic energy (MKE), in summer and fall for the year 2022. The average MKE values are shown in the top left of each panel. The black rectangles show the CGG, while the dashed red lines show the cyclonic currents. The dashed yellow boxes show the areas where the cyclonic currents are formed.
We quantified the impact of tides on the dynamics of the CGG by computing the normalized Okubo–Weiss parameter Q* (Eq. 6) from the geostrophic currents derived from the model SSH fields in 2022. The results are displayed in Figs. 8a, c and 9a, c for the full signal and Figs. 8b, d and 9b, d for the tidal residual. Analyzing the geostrophic circulation derived from full SSH fields in the CGG, the study area can be classified as a hyperbolic region throughout all the seasons, with a value of Q* clearly close to 1 for most of the time (>90 %), due to strong deformation gradients. On the contrary, the diminished effect of rotation on CGG topology can be clearly observed for a small portion of the study area (<8 %), where values of Q* are close to −1.
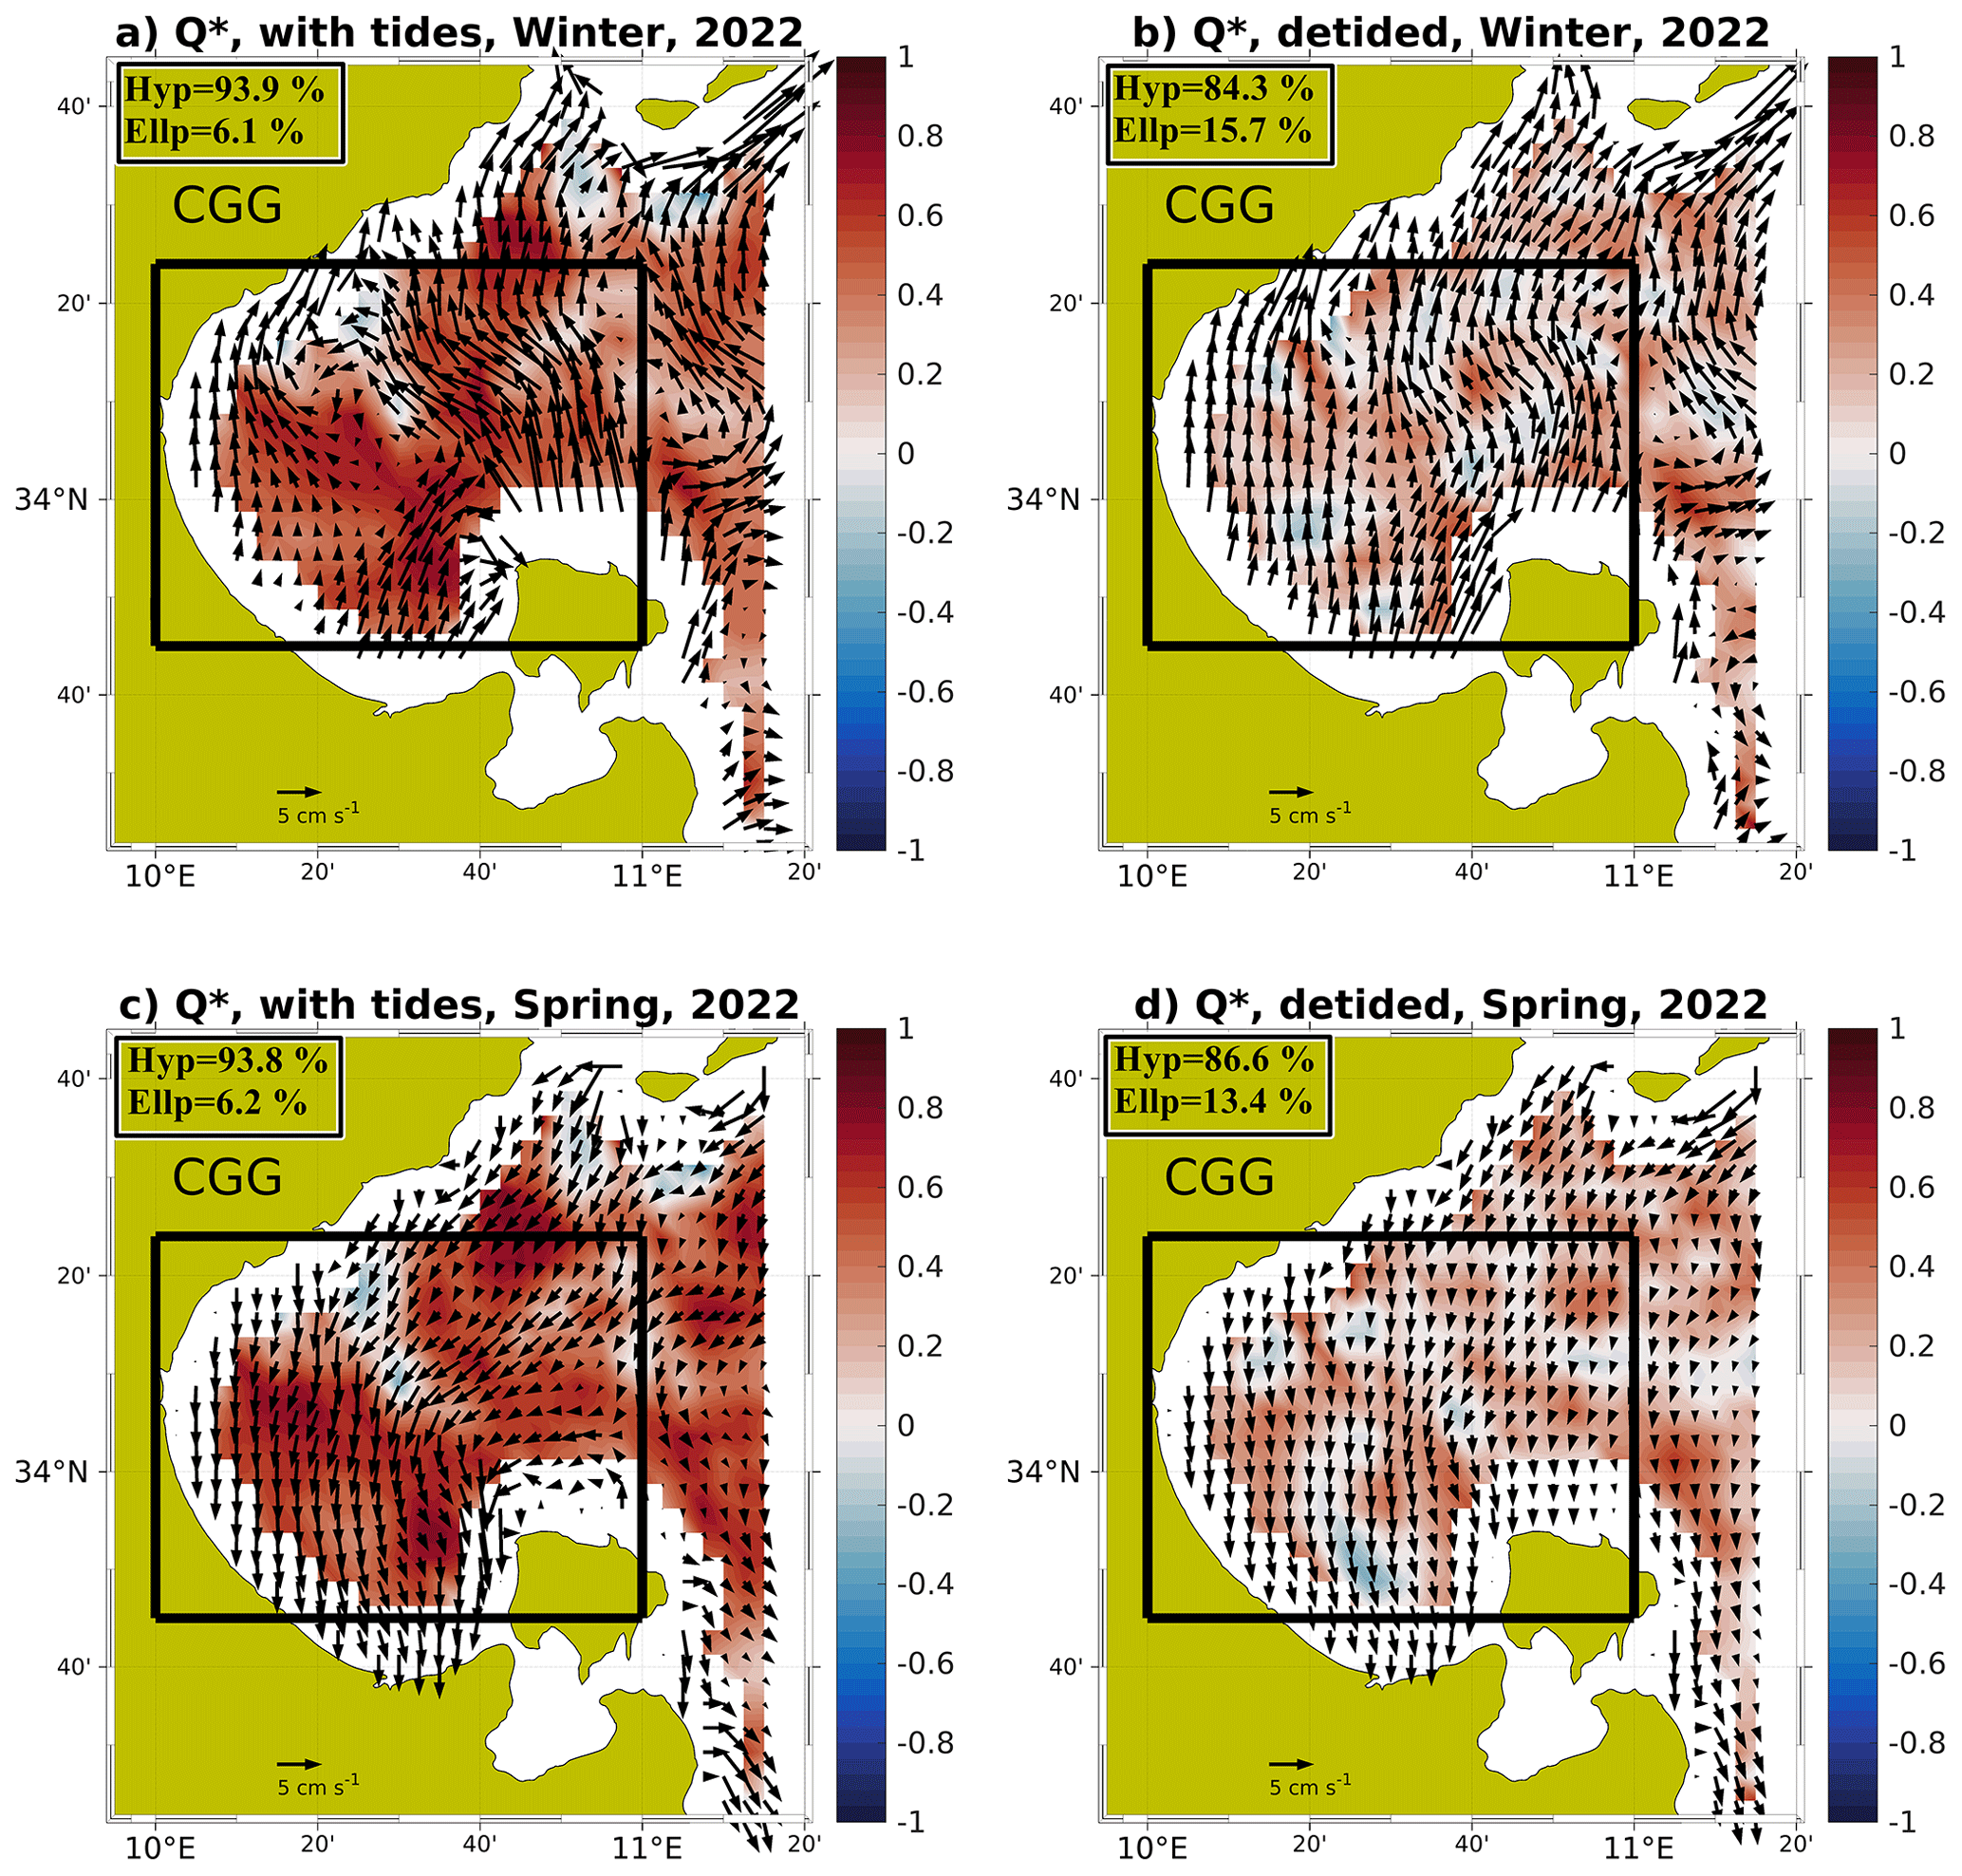
Figure 8Seasonal mean normalized Okubo–Weiss parameter Q* with superimposed mean geostrophic currents computed from MEDSEA_ANALYSISFORECAST_PHY_006_013 product SSH fields, both native with tidal forcing included (a, c) and de-tided (b, d), in winter and spring for the year 2022. The inserts at the top left of each panel show the percentage of the domain where (elliptic grid cells) and (hyperbolic grid cells). The black rectangles show the CGG.
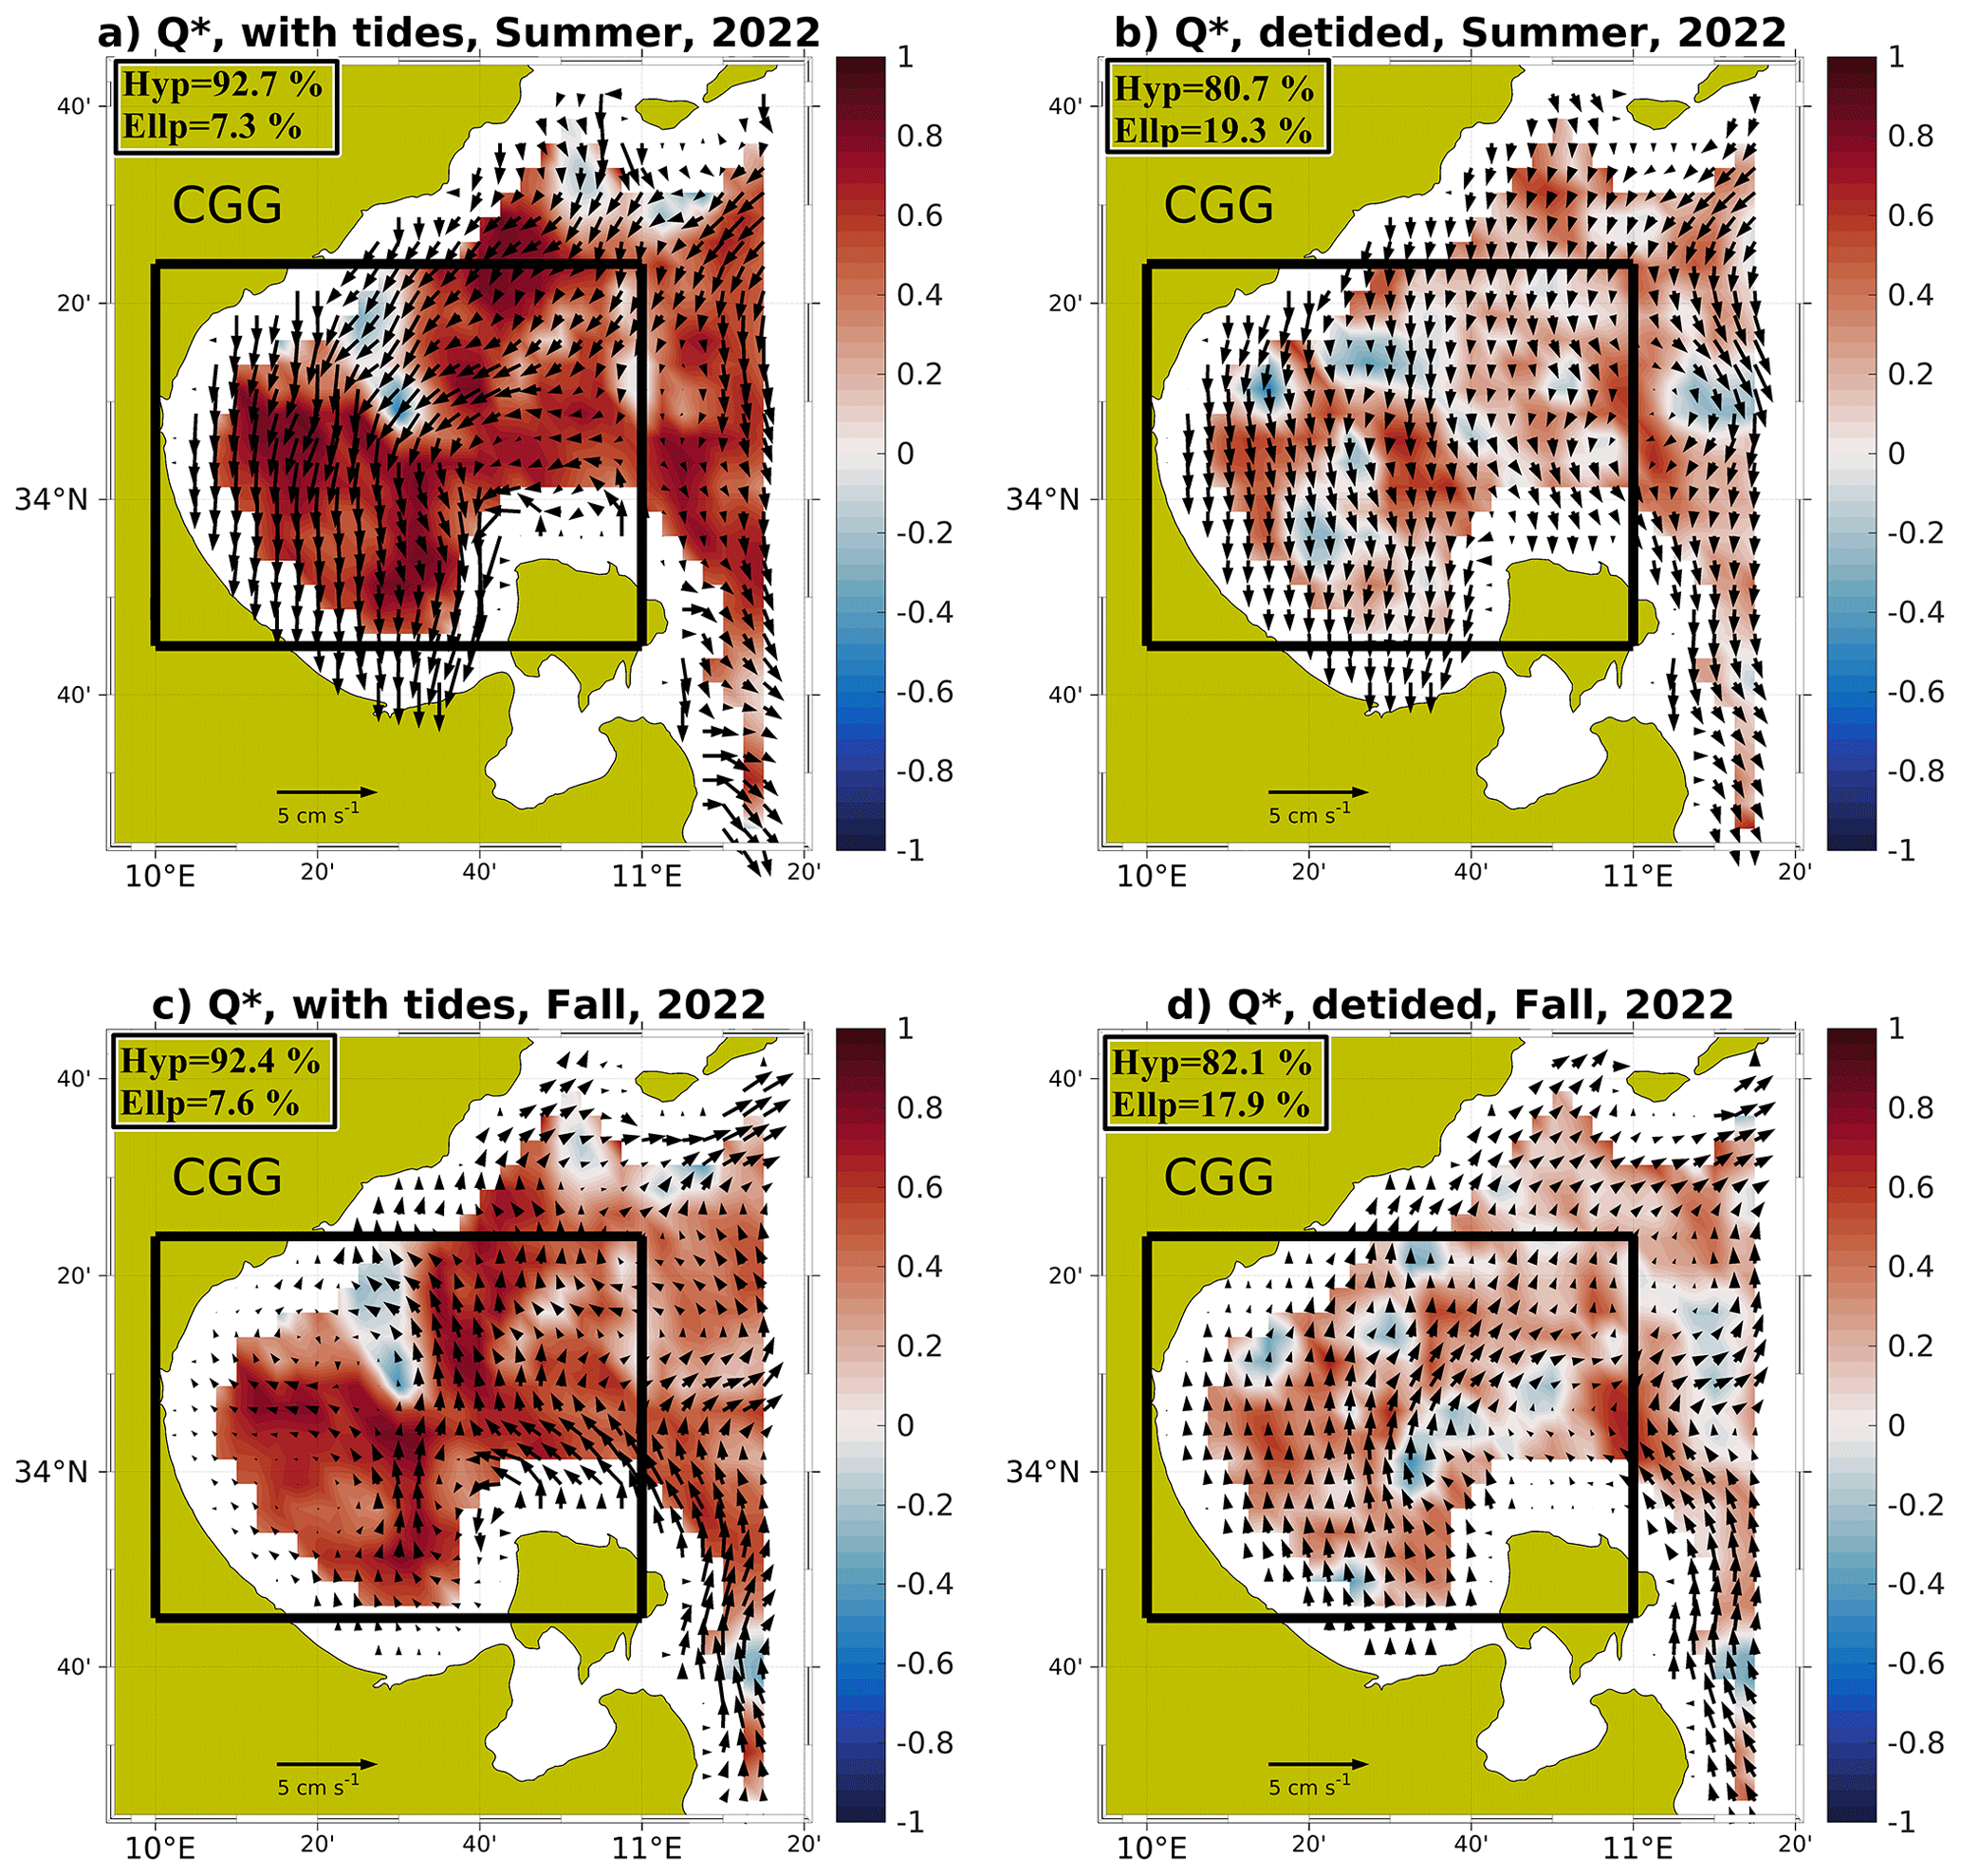
Figure 9Seasonal mean normalized Okubo–Weiss parameter Q* with superimposed mean geostrophic currents computed from MEDSEA_ANALYSISFORECAST_PHY_006_013 product SSH fields, both native with tidal forcing included (a, c) and de-tided (b, d), in summer and fall for the year 2022. The inserts at the top left of each panel show the percentage of the domain where (elliptic grid cells) and (hyperbolic grid cells). The black rectangles show the CGG.
The highest elliptic grid cell percentages were detected in summer (7.3 %) and fall (7.6 %), when the flow becomes more meandering than in winter and spring. By removing the tidal signal from SSH fields, a decrease of ∼10 % of the hyperbolic areas (Figs. 8b, d and 9b, d) can be observed. In contrast, an increase of ∼10 % of elliptic regions can be noticed, with the flow becoming meandering. In general, the CGG is dominated by hyperbolic regions, and the presence of tides clearly enhances this tendency by approximately 10 %. A possible explanation for the dominating hyperbolic structures even in the case of the absence of tides might be related to the impact of wind on geostrophic circulation. Similar results were found in the Black Sea (Bouzaiene et al., 2021), where the hyperbolic regions are strongly dominant in winter due to larger wind stress, while in summer the elliptic areas are more pronounced because of the meandering currents.
3.2.2 Impact of tides on strain and effect on biogeochemical distribution
In order to confirm that tidal forcing amplifies the deformation rate S*, which could increase the recorded hyperbolic grid cells found in Figs. 8 and 9, we computed the normalized deformation rate from both full SSH (case 1) and de-tided SSH (case 2) fields, and the corresponding time series are shown in Fig. 10. In the presence of tides (blue dots), the S* is larger than in the absence of tides (red dots) throughout the entire considered period. The difference between S* in the two cases has an average of approximately 0.1 (yellow dots), meaning that tides produce stretching/deformation rates in the CGG and potentially enhance the presence of hyperbolic regions.
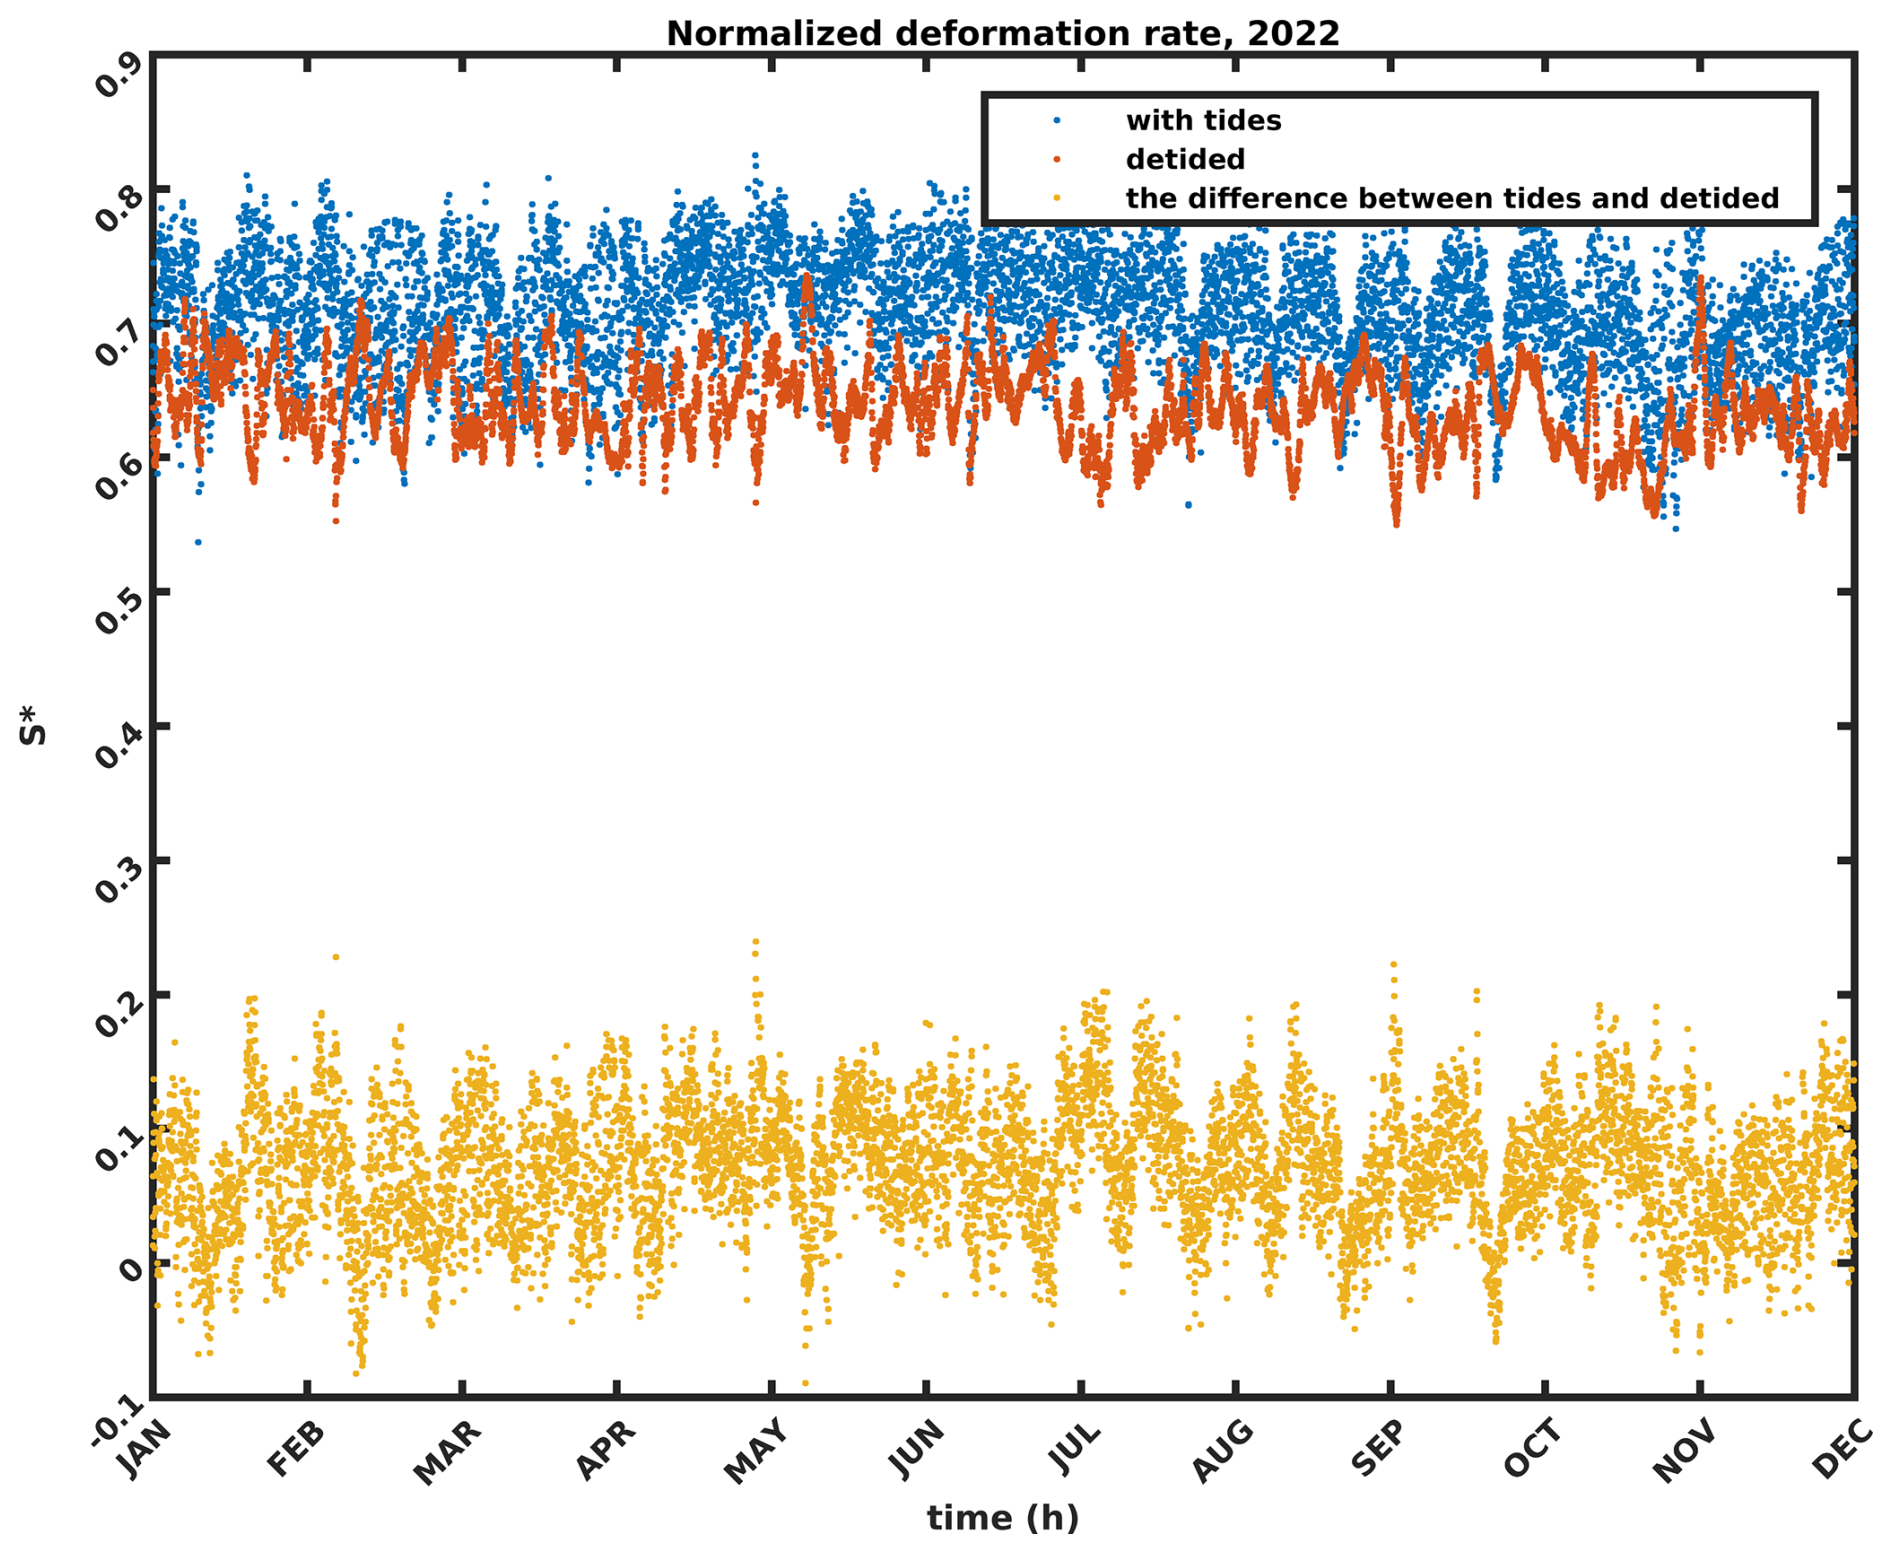
Figure 10Time series of the deformation rate (S*) computed from MEDSEA_ANALYSISFORECAST_PHY_006_013 product in 2022: full SSH fields (blue dots), de-tided SSH fields (red dots) and their difference (yellow dots).
To investigate the influence of tides on CGG turbulence, the probability density function (PDF) of the normalized vorticity (ζ*) has been computed on a seasonal basis in the two different cases mentioned above, and the results are shown in Fig. 11. In the case of a 2D theoretical isotropic and homogeneous turbulent flow, the PDF shows a Gaussian shape without intermittency (absence of tails).
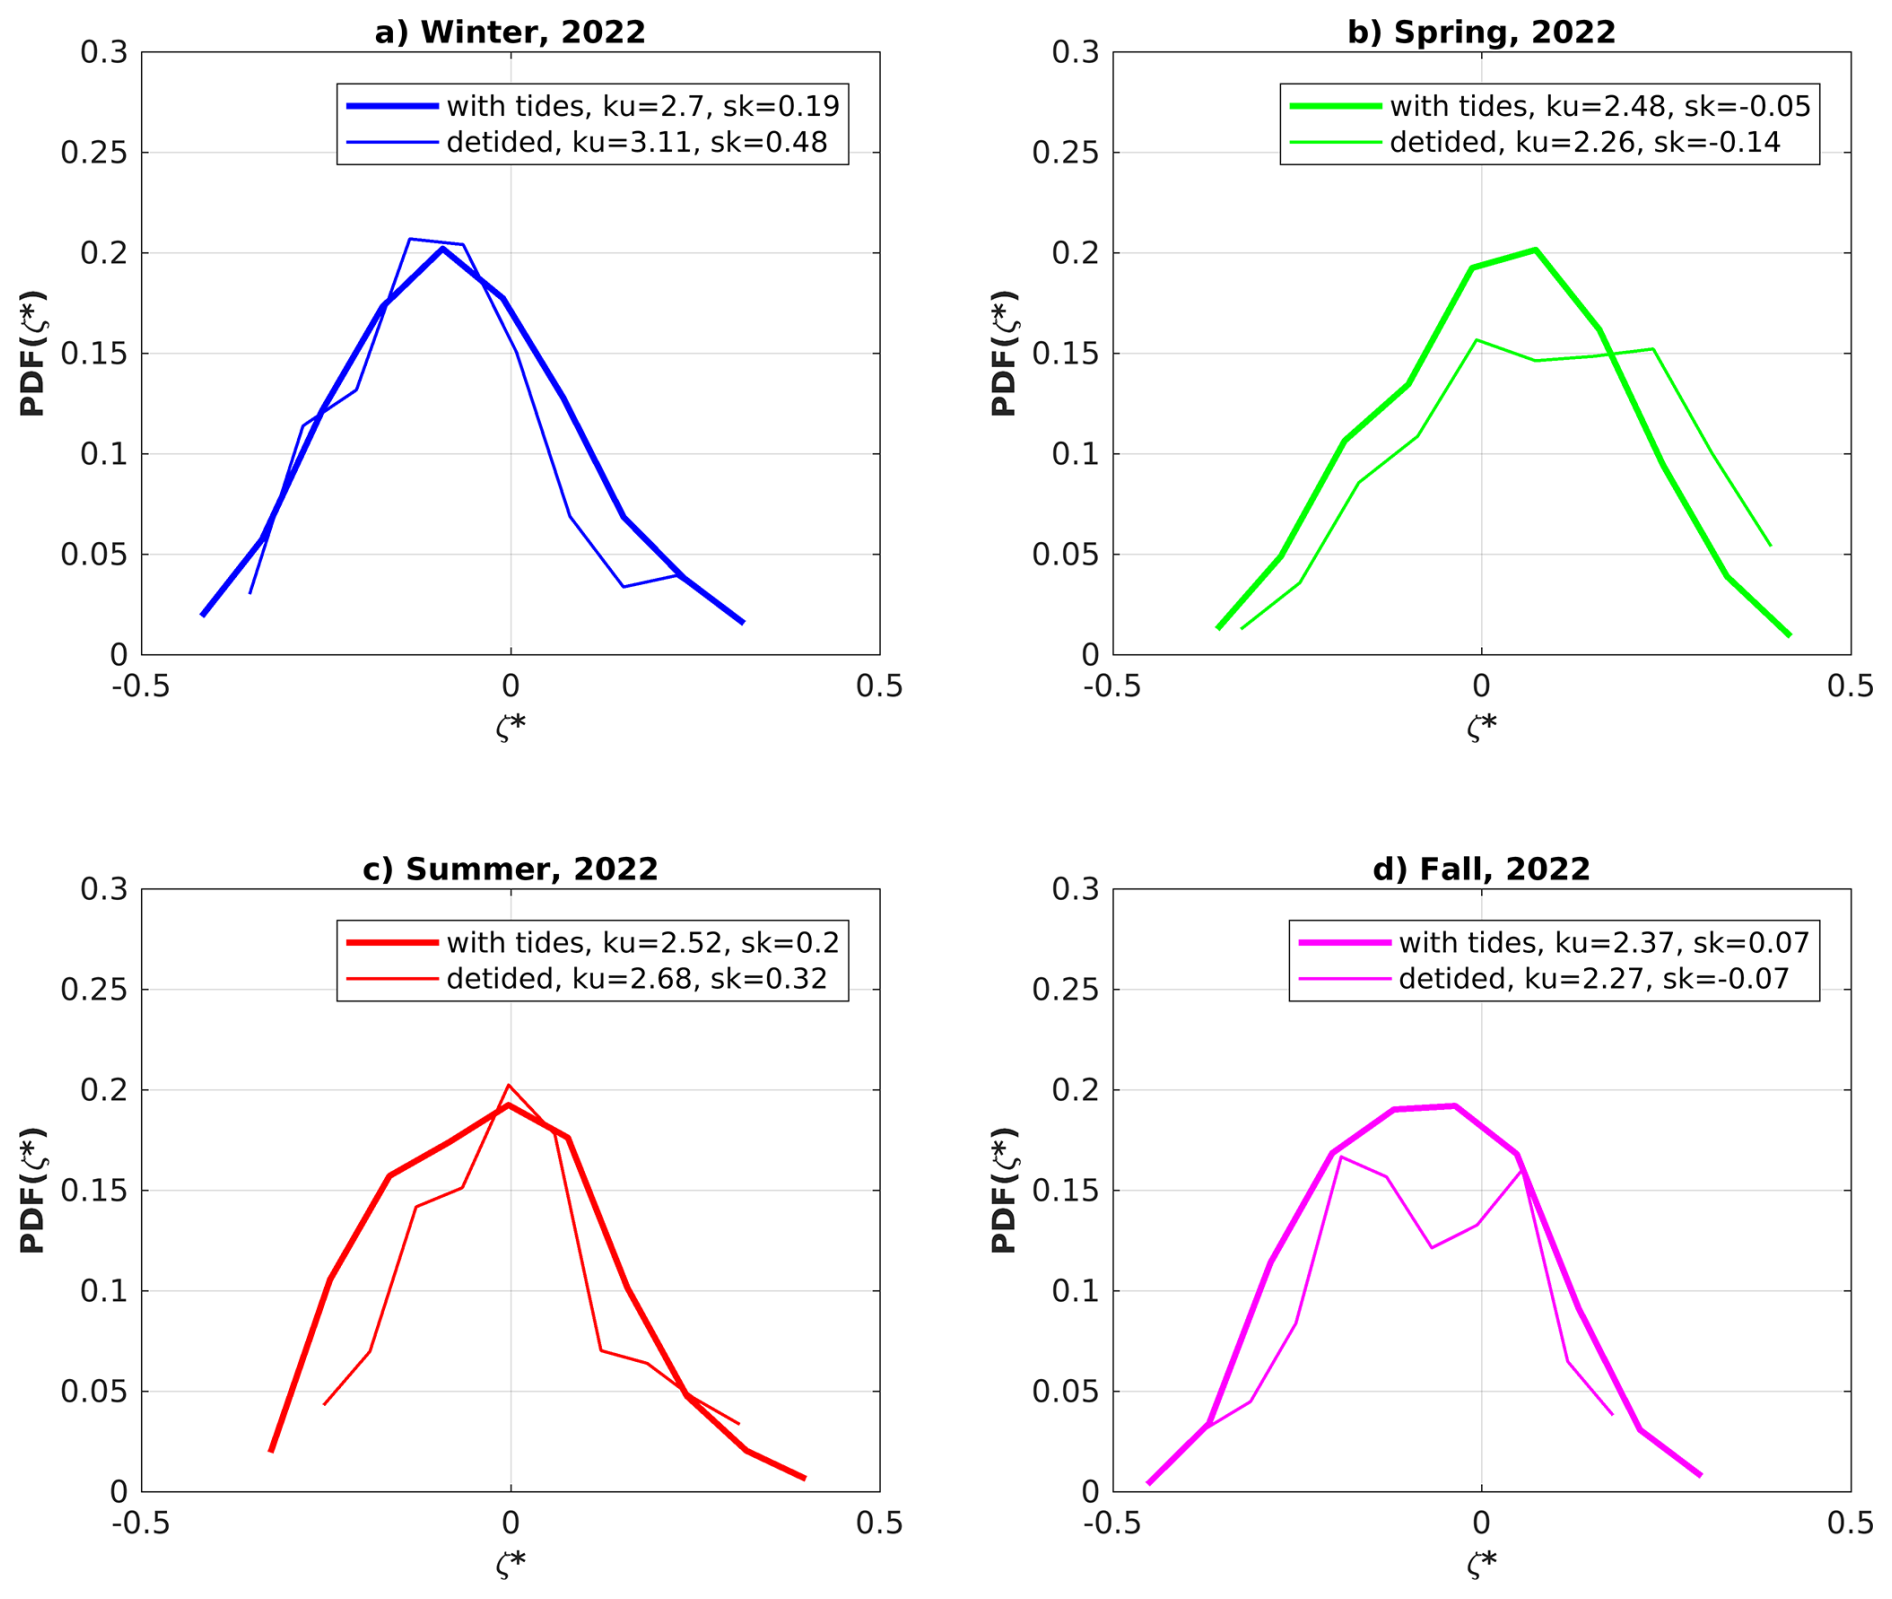
Figure 11Seasonal probability density function (PDF) of normalized vorticity (ζ*) computed from the MEDSEA_ANALYSISFORECAST_PHY_006_013 product in 2022: full SSH fields (bold curves) and de-tided SSH fields (thin curves) in (a) winter, (b) spring, (c) summer and (d) fall.
In our study, the PDFs exhibit nearly Gaussian shapes. These appear to be regular shapes for all the seasons in the case of flow affected by tides, with observable intermittency (long tails, to 0.4) associated with the presence of coherent structures. The first case (SSH fields including tides) is well known as 2D quasi-geostrophic turbulence. Different kurtosis and skewness values depending on the season have been found. Low skewness values were detected in spring (sk = −0.05) and in fall (sk = 0.07). Larger values were found in winter (sk = 0.19) and summer (sk = 0.2), with corresponding kurtosis values of 2.48, 2.37, 2.7 and 2.52, respectively. The difference in skewness and kurtosis is essentially due to (1) non-homogeneous and anisotropic turbulent flow, (2) the influence of coherent vortices, and (3) the presence of stretching/deformation. The anisotropic flow for asymmetric PDFs may be due to the asymmetry in flood and ebb tidal currents (Song et al., 2011). For the second case (i.e., the non-tidal forcing CGG dynamic), the shapes of all the normalized vorticity PDFs are irregular.
The central part of the GG is dominated by the presence of cyclonic eddies where the divergence is mostly positive, as shown in Fig. 4. The dynamics in the central GG region, as shown through the analysis of the altimetry data, are very different with respect to their northern and southern subareas, where prominent filaments and upwelling currents enhance phytoplankton blooms. Furthermore, the CGG, as shown through model data analysis, is rich in tidal activity, leading to the generation of cyclonic currents and relevant hyperbolic regions characterized by shearing and stirring oceanic flows. The tidal perturbation may impact the mixed layer, promoting upwelling processes that supply nutrients to the euphotic zone. The dispersion of phytoplankton blooms, when compared to FTLE, exemplifies how metrics like FTLE can be used to demonstrate the physical control on biogeochemical dispersion. One of the possible applications of the results of our work is the study of the dispersion of nutrients connected to phytoplankton bloom events that occurred in the GG and captured by NASA satellite images in March 2013 and 2017, as shown in Fig. 12. The concept behind this application is to enhance knowledge on how physics drives biogeochemistry: by comparing the phytoplankton blooms to the λt integrated over 7 d for the high resolution of initial particle grid positions of 1/128°, this method may effectively enhance our comprehension of the link between physical processes and biogeochemistry. The qualitative correlation between algal bloom and λt shows how the latter can be used as a proxy for the distribution of the biomass and nutrients within the gulf. The positive divergence detected in the central Gulf of Gabès (Fig. 4b) explains the tendency to upwelling in this area (Poulain, 1993). The surface chlorophyll concentration from CMS multi-satellite observations at 1 km resolution is displayed in the insets of Fig. 12 along with the phytoplankton blooms captured from NASA (12 March 2013, 23 March 2017). A link between physics (FTLE) and biogeochemistry (Chl a bloom) is noticeable, with the Chl a being dispersed on the edges of the GG coherent structures.
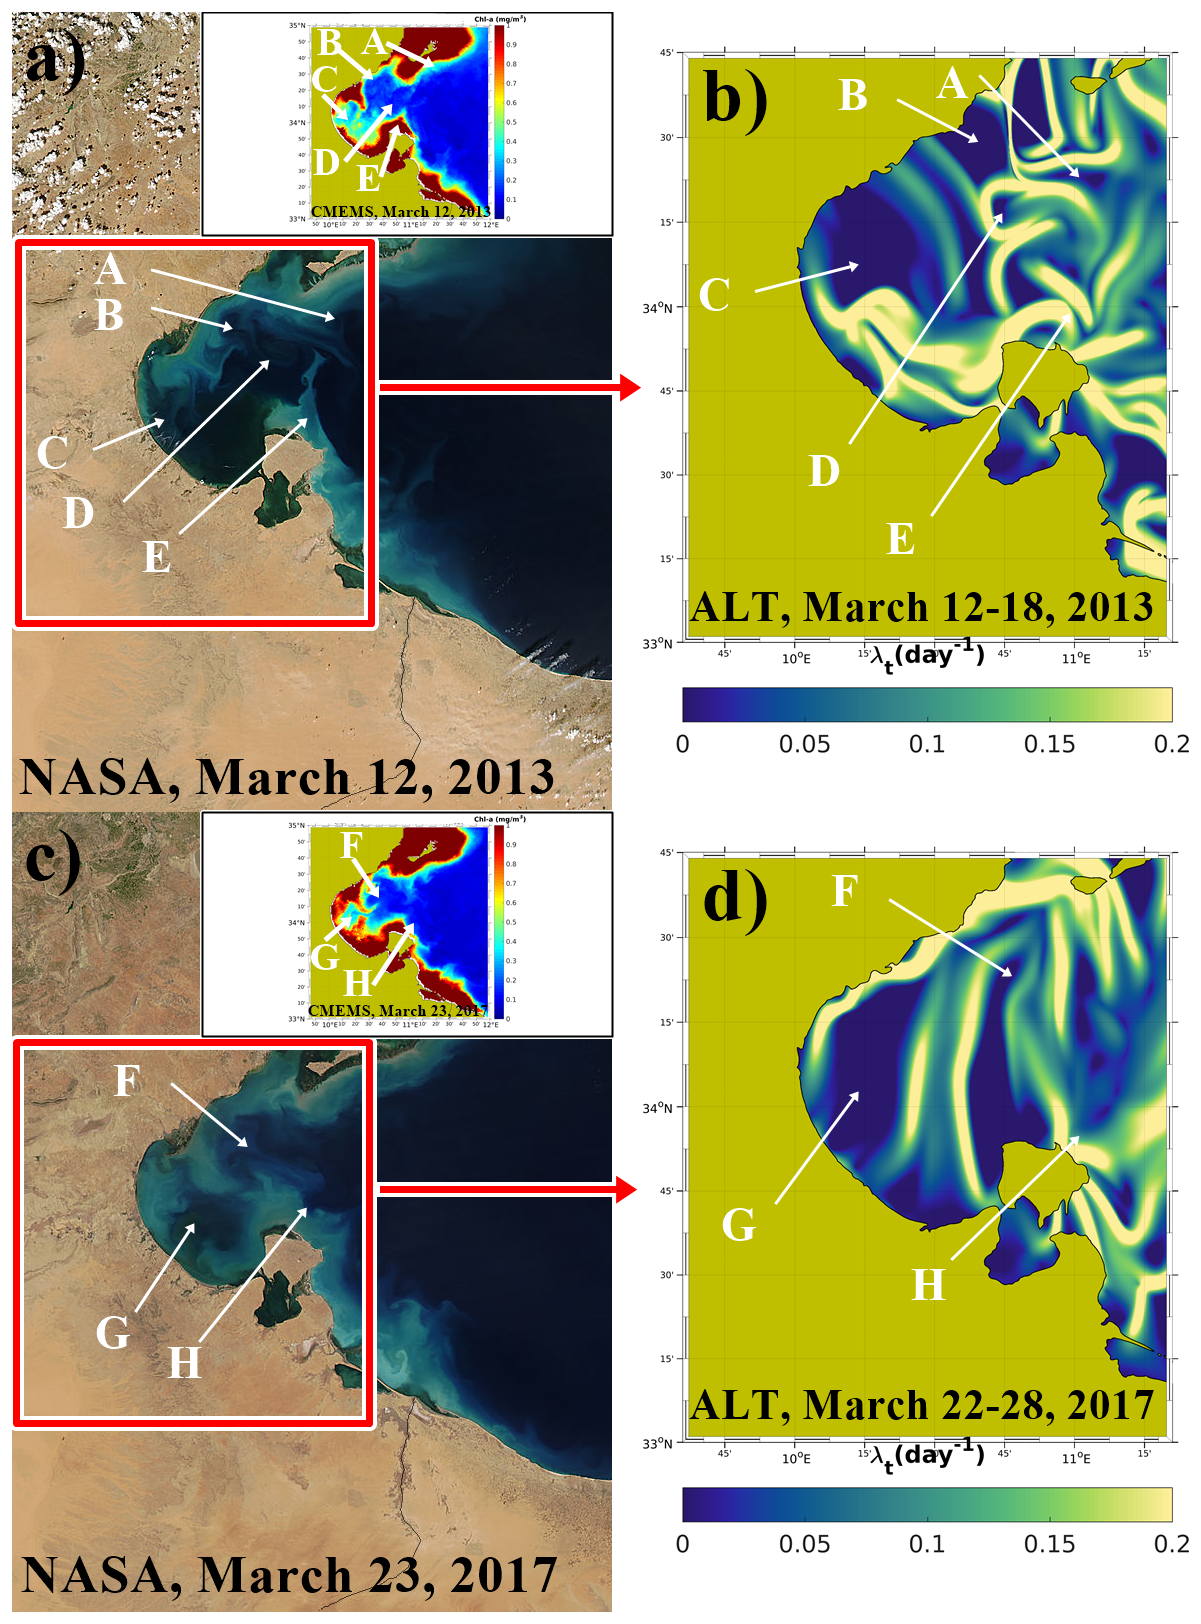
Figure 12(a) Phytoplankton bloom off the coast of Tunisia – NASA MODIS Image of the Day, 12 March 2013 (https://modis.gsfc.nasa.gov/, last access: 20 October 2025). (b) Spatial distribution of λt computed from altimetry data (SEALEVEL_EUR_PHY_L4_MY_008_068) for 12–18 March 2013. (c) Phytoplankton blooms in the GG from NASA on 23 March 2017 and (d) spatial distribution of FTLE for 22–28 March 2017. Labels A–H denote the features detected by NASA. In the insets we show chlorophyll a concentration from the CMEMS (2022) for the same period as phytoplankton blooms were captured by NASA.
This area is therefore the natural location for a high concentration of nutrients, favored also by the presence of cyclones (Salgado-Hernanz et al., 2019). GG features appear as transport barriers for phytoplankton dispersion. The phytoplankton blooms are driven by fronts, filaments and mesoscale structures labeled A–H in Fig. 12. A similar scenario has been observed in the northeastern Atlantic Ocean, where phytoplankton spring blooms are modulated by the mesoscale dynamics (Lehahn et al., 2007). It has been found in some cases that FTLE/FSLE can show fronts producing Chl a filaments controlling phytoplankton bloom (Lehahn et al., 2007; Guinder et al., 2025; Bouzaiene et al., 2025) and λt can be used as a good indicator of phytoplankton blooms.
Starting from the hypothesis adopted in Suthers et al. (2023), i.e., that frontal eddies interacting with boundary currents may provide a suitable offshore nursery habitat, we filtered the OCEANCOLOUR_MED_BGC_L4_MY_009_144 dataset in order to define the areas of the domain with Chl a concentration larger than 0.6 mg m−3. Then we superimposed these areas on the FTLE fields for the same aforementioned phytoplankton bloom events in 2013 and 2017 (see Fig. 13). Large amounts of Chl a were dispersed into GG frontal boundary eddies in both cases. Therefore, the GG coastal fronts appear to be the most significant driver of phytoplankton bloom dispersion. FTLE can explain the relative 2D horizontal dispersion/distribution of some biological quantities and thus provide some insights into potential vertical processes that may engender phytoplankton blooms (Lévy et al., 2018).
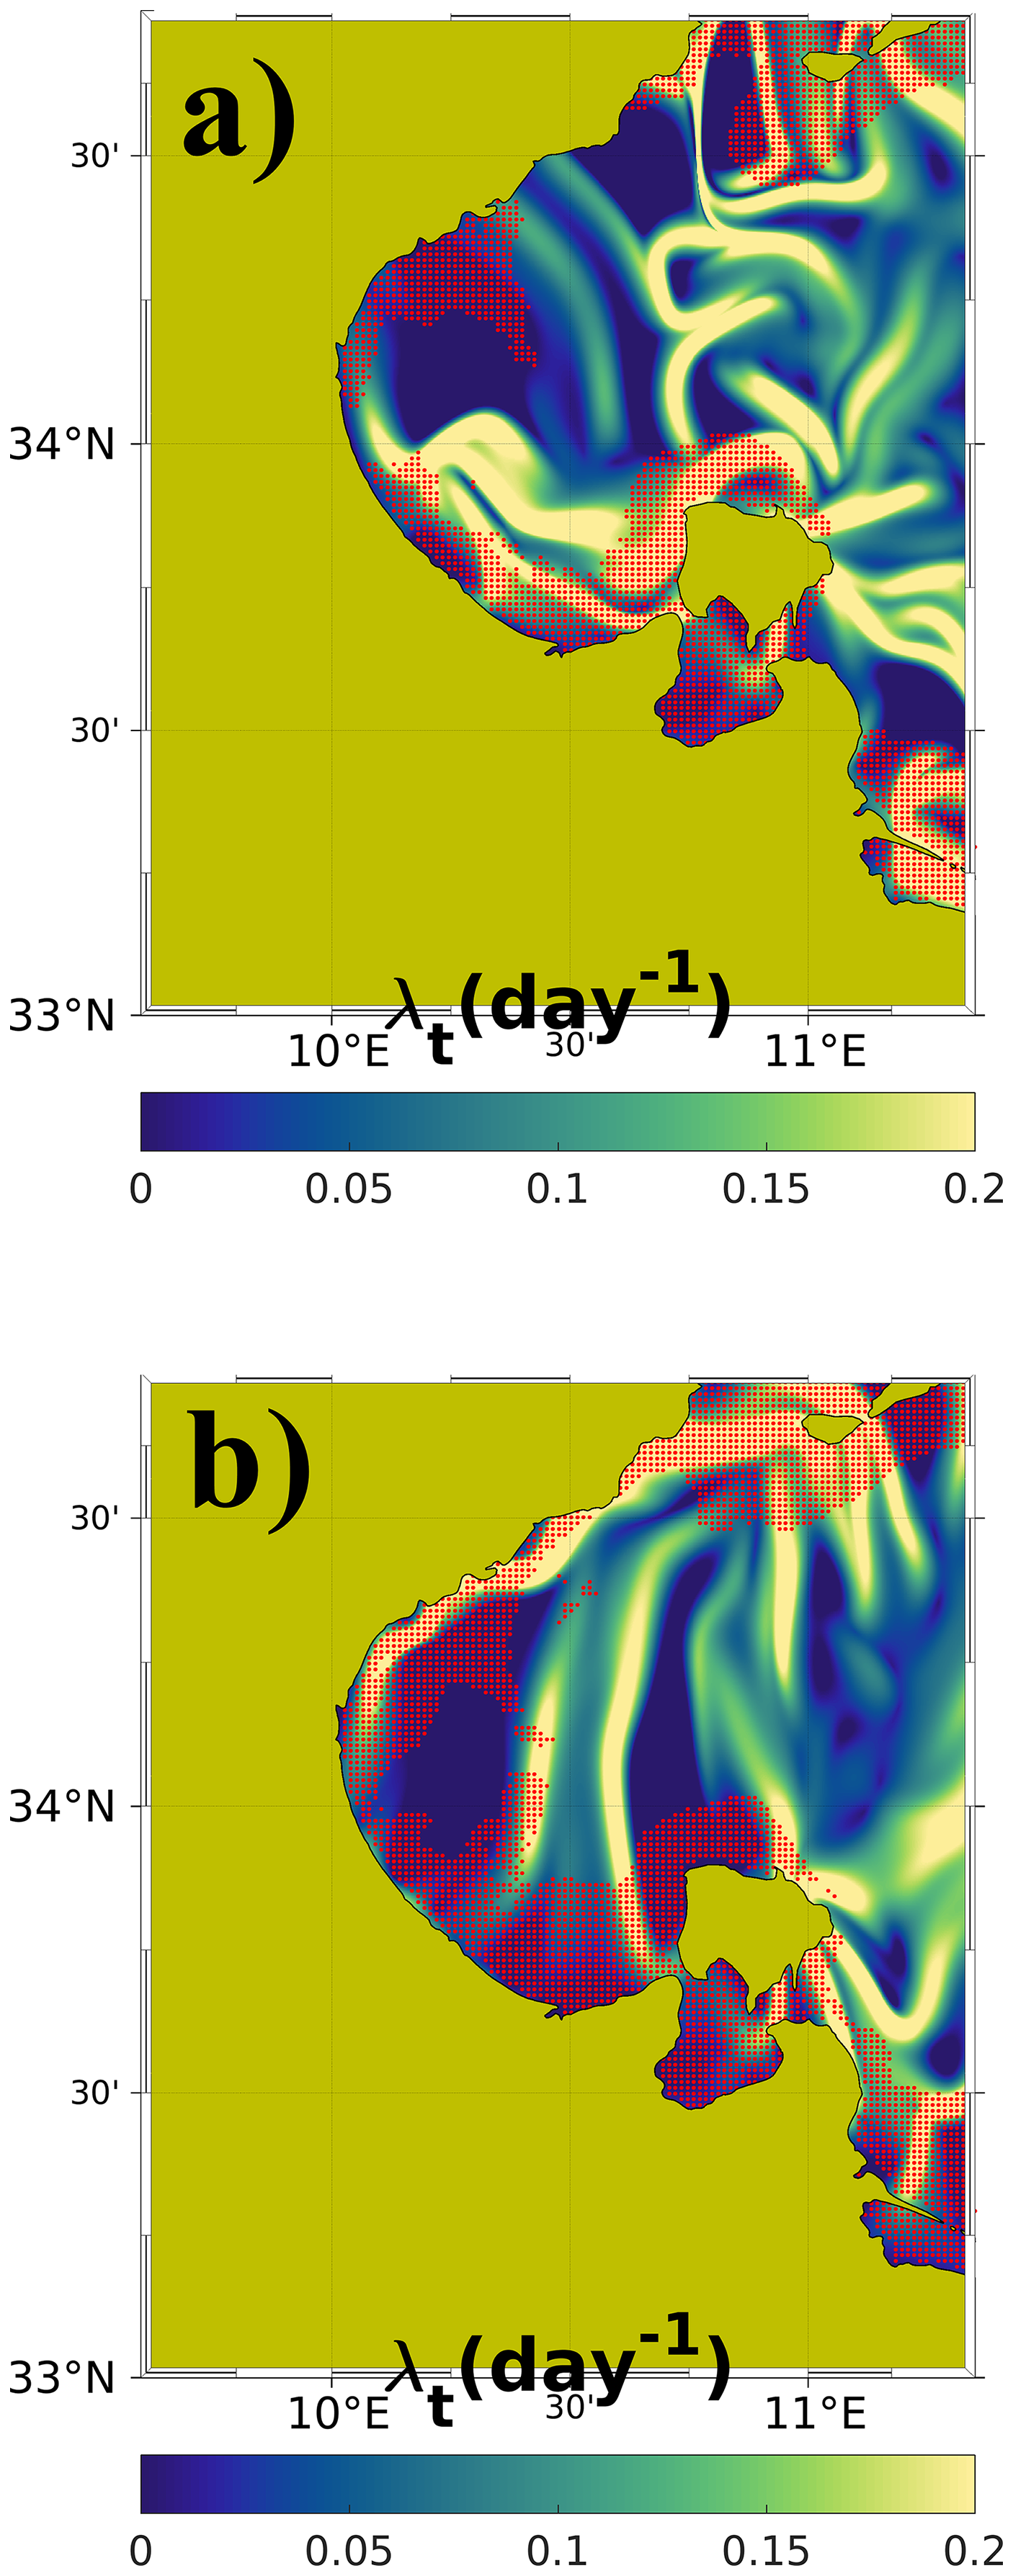
Figure 13(a) Spatial distribution of λt computed from altimetry data (SEALEVEL_EUR_PHY_L4_MY_008_068) for 12–18 March 2013 superimposed with chlorophyll a concentration (Chl a>0.6 mg m−3, dotted red areas), from the CMEMS (2022) for 12 March 2013. (b) Spatial distribution of λt computed from altimetry data (SEALEVEL_EUR_PHY_L4_MY_008_068) for 22–28 March 2017 superimposed with chlorophyll a concentration (Chl a>0.6 mg m−3, dotted red areas) from the CMEMS (2022) for 23 March 2017.
In this work the main hydrodynamic features of the Gulf of Gabès were investigated by means of geostrophic velocities derived from 30 years of satellite altimetry data and 1 year (2022) of hourly SSH fields produced by a high-resolution oceanographic numerical system. Altimetry analysis of the GG is presented in terms of the normalized vorticity (ζ*), normalized divergence (δ*), normalized Okubo–Weiss parameter (Q*), normalized deformation (S*) and FTLE (λt) to have an overview of the main circulation features (and their seasonal variability) of the GG. The mean spatial distribution of λt (1993–2022) confirms the presence of well-known features in the study area, such as ATC, MG, SMG and LSBV. The signature of these features can be found in the intensity of λt (Fig. 2b). The FTLE is a powerful diagnostic tool for ocean turbulence and horizontal mixing/stirring. It often varies inversely with phytoplankton concentration as it can act as a barrier to offshore transport (Hernandez-Garcia et al., 2010). This may explain the poverty in nutrients in regions relatively far from the GG where we detected high values of λt, and it is in agreement with the known high biological production in areas close to the coast, where we found low values of λt. This study investigates sea surface height trends over the GG from 1993 to 2022, where the surface layer shows a speed trend of 0.033 cm s−1 and a KE trend of 0.34 cm2 s−2 as shown in Fig. 3. The evolution of regional dynamics, and the consequent potential impact on biogeochemical aspects, is certainly a highly interesting topic, worthy of further investigation in future studies.
The different statistics show the presence of three different dynamical areas close to the GG coastal zones; North Gulf of Gabès (NGG), Central Gulf of Gabès (CGG) and Southern Gulf of Gabès (SGG).
The CGG subarea can be considered a zone rich in nutrients (since δ* showed some positive values) where the flow tends to spread particles. This scenario is observed for some seasons, with the divergence positive curve indicating the divergence of the CGG flow and explaining the phytoplankton blooms previously observed by Feki-Sahnoun et al. (2018). Furthermore, in the coastal zones located in the NGG, the flow tends to be neutral (), except for some seasons when δ* is larger than zero, maybe due to the presence of upwelling events close to the island of Djerba. In contrast, in the SGG, the flow is convergent, since it is characterized by a negative value of δ*. In this latter case the vorticity is concomitantly negative due to the signature of an anticyclonic vortex. Geostrophic coastal currents and eddies are associated with the presence of hyperbolic regions () in any season, with a crucial role played by stretching/deformation gradients (Figs. 4 and 5).
Satellite observations are limited in the CGG, especially close to the boundaries, not allowing the study of tidal signal impact on geostrophic circulation. We used high-resolution model data to focus on the tidal signal impact on geostrophic pattern and topology (i.e., the distribution of elliptic and hyperbolic regions). To the best of our knowledge, this paper for the first time discusses how tides affect the CGG flow topology. The flow topology has been related to anomalous absolute dispersion regimes in the Mediterranean Sea (Bouzaiene et al., 2018) and the Black Sea (Bouzaiene et al., 2021). Tides amplify hyperbolic regions in the CGG, with more than 90 % of hyperbolic grid cells () captured in any season, while elliptic regions almost disappear due to the outgrowth of hyperbolic ones. We also observed a significant change in the geostrophic circulation pattern through the different seasons, as discussed in Figs. 6 and 7. These different patterns could be related to gulf topography, current instability and horizontal pressure gradients influenced by other atmospheric components. Waves in a coupled hydrodynamic-wave model can be an important factor affecting the geostrophic field, as shown by other studies (Morales-Márquez et al., 2023; Rühs et al., 2025). A lower number of data observations were observed within the GG coastal areas, as mentioned in the QUID model, where the root mean square difference (RMSD) of sea level anomaly (SLA) increases significantly. This discrepancy can be reduced in the model itself since it was combined with data assimilation. In regions or on timescales where geostrophic components become significant, given that the model includes tidal forcing and wave coupling, we might not be in geostrophic balance anymore. In the Mediterranean Sea, given that the high-resolution model includes waves and tides, it offers an accurate geostrophic circulation (Escudier et al., 2021).
Lower MKE values are recorded in summer and fall, while higher values are detected in winter/spring. Since marine species disperse in regions characterized by lower turbulence and less energy intensity, our findings are in good agreement with the results found in Salgado-Hernanz et al. (2019), where enhanced chlorophyll distribution in the CGG starts in June, peaks in September and terminates in February.
Another finding of this study is the way tides contribute to stretching/deformation (S*) to define the signature of the hyperbolic regions. The time series of S* derived from geostrophic currents computed from the full SSH fields shows larger values with respect to the one computed from de-tided SSH fields. This confirms that tides are dynamically responsible for the amplification of deformation gradients. PDFs emphasize the non-homogeneity and anisotropy of the CGG turbulent flow due to the presence of eddies and the intense strain factor.
To conclude, altimetry data available for the period of 1993–2022 were analyzed in the larger gulf domain by comparing the dynamics in three subareas and defining their common characteristics. The central part of the gulf is dominated by an upwelling flow (thus characterized by divergence) where there is an important biological production rate. The other areas located in its northern and southern parts are dominated by anticyclonic structures. The three subareas can be classified as hyperbolic regions (). The geostrophic circulation derived from altimetry data for the three decades within the GG is characterized by strong seasonal and spatial variability. Furthermore the dynamics vary differently in the three subareas. The high spatiotemporal resolution of model outputs allowed the analysis of the CGG over the year 2022. In good accordance with the altimetry analysis, the CGG can be classified as a hyperbolic area with a signal greater than 90 %, whereas the signature of elliptic zones is lower than 10 %. Atmospheric conditions, topography and tidal forcing are very important for the occurrence of hyperbolic regions driven by strain. As well as amplifying hyperbolic regions, tides also affect the isotropy and homogeneity of the theoretical turbulent flow. PDF is applied to quantify the impact of tides on 2D turbulence theory, and the PDF asymmetric distributions reveal the non-homogeneity and anisotropy of the surface flow due to persistent stretched currents and eddies.
This study has been conducted using EU Copernicus Marine Service information. The products used are MEDSEA_ANALYSISFORECAST_PHY_006_013 (Clementi et al., 2023, 10.25423/CMCC/MEDSEA_ANALYSISFOR), SEALEVEL_EUR_PHY_L4_MY_008_068 (CMEMS, 2021, https://doi.org/10.48670/moi-00141) and OCEANCOLOUR_MED_BGC_L4_MY_009_144 (https://doi.org/10.48670/moi-00300, CMEMS, 2022, Mediterranean Sea Ocean Satellite Observations, the Italian National Research Council (CNR – Rome, Italy)), which are made available through the Copernicus Marine Data Store (https://data.marine.copernicus.eu/products, last access: 20 October 2025). The full datasets and files analyzed during the current study can be made available from the corresponding author upon reasonable request.
Formal analysis, conceptualization, methodology, investigation, writing – original draft preparation: MB. Data curation: AG. Funding acquisition: SiS. Writing – review and editing: MB, AG, DD, AFD, SiS and CF. All the authors have read and agreed to the published version of the paper.
The contact author has declared that none of the authors has any competing interests.
Publisher's note: Copernicus Publications remains neutral with regard to jurisdictional claims made in the text, published maps, institutional affiliations, or any other geographical representation in this paper. While Copernicus Publications makes every effort to include appropriate place names, the final responsibility lies with the authors. Views expressed in the text are those of the authors and do not necessarily reflect the views of the publisher.
We thank G. Haller and K. Onu for providing the code used for FTLE computation in this study. From Maher Bouzaiene, special thanks go to my father: I am grateful for the many years you were my guiding star. My best gratitude to you; I will never forget your kindness and support even after your death.
This research was funded by the Italian Ministry of University and Research as part of the NextData project.
This paper was edited by Bernadette Sloyan and reviewed by Louise Rousselet and two anonymous referees.
Abdennadher, J. and Boukthir, M.: Numerical simulation of the barotropic tides in the Tunisian shelf and the Strait of sicily, J. Mar. Syst., 63, 162–182, https://doi.org/10.1016/j.jmarsys.2006.07.001, 2006.
Apel, J. R.: Principles of Ocean Physics, in: International Geophysics Series, Volume 38, Academic Press, London, 631 pp., ISBN 9780120588664, 1987.
Barkan, R., Winters, K. B., and McWilliams, J. C.: Stimulated imbalance and the enhancement of eddy kinetic energy dissipation by internal waves, J. Phys. Oceanogr., 47, 181–198, https://doi.org/10.1175/jpo-d-16-0117.1, 2017.
Barkan, R., Srinivasan, K., Yang, L., McWilliams, J. C., Gula, J., and Vic, C.: Oceanic mesoscale eddy depletion catalyzed by internal waves, Geophys. Res. Lett., 48, e2021GL094376, https://doi.org/10.1029/2021GL094376, 2021.
Bel Hassen, M., Hamza, A., Zouari, A., Drira, Z., Akrout, F., and Messaoudi, S.,: Temporal and seasonal variations of nutrient limitation of phytoplankton biomass in the Gulf of Gabes, Life Environ., 60, 17–26, 2010.
Ben Ismail, S., Sammari, C., Béranger, K., and Lellouche, P.: Atlas des données hydrologiques des côtes Tunisiennes, aquadocs, INSTM – Institut National des Sciences et Technologies de la Mer, Tunis, Tunisia, 169 pp., https://hdl.handle.net/1834/14684 (last access: 20 October 2025), 2010.
Ben Ismail, S., Sammari, C., and Béranger, K.: Surface Circulation Features along the Tunisian Coast: Central Mediterranean Sea, in: 26 the IUGG General Assembly, 22 June–2 July 2015, Prague, Czech Republic, 5769, 2015.
Ben Ismail, S., Costa E., Jaziri, H., Morgana, S., Boukthir, M., Ben Ismail, M.-A., Minetti, R., Montarsolo, A., Narizzano, R., Sammari, C., Faimali, M., and Garaventa, F.: Evolution of the Distribution and Dynamic of Microplastic in Water and Biota: A Study Case From the Gulf of Gabes (Southern Mediterranean Sea), Front. Mar. Sci., 9, 786026, https://doi.org/10.3389/fmars.2022.786026, 2022.
Béjaoui, B., Ben Ismail, S., Othmani, A., Hamida, O. B. A. B. H., Chevalier, C., Feki-Sahnoun, W., Harzallah, A., Ben Hadj Hamida, N., Bouaziz, R., Dahech, S., Diaz, F., Tounsi, K., Sammari, C., Pagano, M., and Bel Hassen, K.: Synthesis review of the Gulf of Gabes (eastern Mediterranean Sea, Tunisia): morphological, climatic, physical oceanographic, biogeochemical and fisheries features, Estuar. Coast. Shelf Sci., 219, 395–408, https://doi.org/10.1016/j.ecss.2019.01.006, 2019.
Blazevski, D. and Haller, G.: Hyperbolic and elliptic transport barriers in three-dimensional unsteady flows, Physica D, 273, 46–62, https://doi.org/10.1016/j.physd.2014.01.007, 2014.
Bouzaiene, M., Menna, M., Poulain, P.-M., and Elhmaidi, D.: Lagrangian dispersion characteristics in the Western Mediterranean, J. Mar. Res., 76, 139–161, https://elischolar.library.yale.edu/journal_of_marine_research/460 (last access: 20 October 2025), 2018.
Bouzaiene, M., Menna, M., Poulain, P.-M., Bussani, A., and Elhmaidi, D.: Analysis of the Surface Dispersion in the Mediterranean Sub-Basins, Front. Mar. Sci., 7, 486, https://doi.org/10.3389/fmars.2020.00486, 2020.
Bouzaiene, M., Menna, M., Elhmaidi, D., Dilmahamod, A.-F., and Poulain, P.-M.: Spreading of Lagrangian Particles in the Black Sea: A Comparison between Drifters and a High-Resolution Ocean Model, Remote. Sens., 13, 2603, https://doi.org/10.3390/rs13132603, 2021.
Bouzaiene, M., Menna, M., Dilmahamod, A. F., Delrosso, D., Simoncelli, S., and Fratianni, C.: Two-particle dispersion in the Gulf of Gabès using a high resolution nested ocean model , EGU General Assembly 2025, Vienna, Austria, 27 Apr–2 May 2025, EGU25-11742, https://doi.org/10.5194/egusphere-egu25-11742, 2025.
Clementi, E., Pistoia, J., Delrosso, D., Mattia, G., Fratianni, C., Storto, A., Ciliberti, S., Lemieux, B., Fenu, E., Simoncelli, S., Drudi, M., Grandi, A., Padeletti, D., Di Pietro, P., and Pinardi, N.: A degree resolution Mediterranean analysis and forecast modelling system for the Copernicus Marine Environment Monitoring Service, in: Eight EuroGOOS International Conference, Operational Oceanography serving Sustainable Marine Development, 3–5 October 2017, Bergen, Norway, 275, https://www.earth-prints.org/handle/2122/12345 (last access: 20 October 2025), 2017.
Clementi, E., Drudi, M., Aydogdu, A., Moulin, A., Grandi, A., Mariani, A., Goglio, A. C., Pistoia, J., Miraglio, P., Lecci, R., Palermo, F., Coppini, G., Masina, S., and Pinardi, N.: Mediterranean Sea Physical Analysis and Forecast (CMEMS MED-Physics, EAS8 system) (Version 1) [Data set], CMS – Copernicus Marine Service [data set], https://doi.org/10.25423/CMCC/MEDSEA_ANALYSISFORE, 2023.
CMEMS: European Seas Gridded L 4 Sea Surface Heights And Derived Variables Reprocessed 1993 Ongoing, CMEMS [data set], https://doi.org/10.48670/moi-00141, 2021.
CMEMS: Mediterranean Sea, Bio-Geo-Chemical, L4, monthly means, daily gapfree and climatology Satellite Observations (1997–ongoing), CMEMS [data set], https://doi.org/10.48670/moi-00300, 2022.
d'Ovidio, F., Fernández, V., Hernández-García, E., and López, C.: Mixing structures in the Mediterranean Sea from finite-size Lyapunov exponents, Geophys. Res. Lett., 31, L17203, https://doi.org/10.1029/2004GL020328, 2004.
d'Ovidio, F., Isern-Fontanet, J., López, C., Hernández-García, E., and García-Ladona, E.: Comparison between Eulerian diagnostics and finite-size Lyapunov exponents computed from altimetry in the Algerian basin, Deep-Sea Res. Pt. I, 56, 15–31, https://doi.org/10.1016/j.dsr.2008.07.014, 2009.
d'Ovidio, F., De Monte, S., Alvain, S., Dandonneau, Y., and Lévy, M.: Fluid dynamical niches of phytoplankton types, P. Natl. Acad. Sci. USA, 107, 18366–18370, https://doi.org/10.1073/pnas.1004620107, 2010.
Du Toit, P. C.: Transport and separatrices in time-dependent flows, PhD thesis, California Institute of Technology, Pasadena, California, USA, http://resolver.caltech.edu/CaltechTHESIS:10072009-165901284 (last access: 20 October 2025), 2010.
Elhmaidi, D., Provenzale, A., and Babiano, A.: Elementary topology of the two-dimensional turbulence from a Lagrangian view-point and single particle dispersion, J. Fluid Mech., 533–558, https://doi.org/10.1017/S0022112093003192, 1993.
Escudier, R., Clementi, E., Cipollone, A., Pistoia, J., Drudi, M., Grandi, A., Lyubartsev, V., Lecci, R., Aydogdu, A., Delrosso, D., Omar, M., Masina, S., Coppini, G., and Pinardi, N.: A High Resolution Reanalysis for the Mediterranean Sea, Front. Earth Sci., 9, 702285, https://doi.org/10.3389/feart.2021.702285, 2021.
Farazmand, M. and Haller, G.: Computing Lagrangian coherent structures from their variational theory, Chaos, 22, 013128, https://doi.org/10.1063/1.3690153, 2012.
Feki-Sahnoun, W., Njah, H., Hamza, A., Barraj, N., Mahfoudi, M., Rebai, A., and Belhassen, M. : Using general linear model, Bayesian Networks and Naive Bayes classifier for prediction of Karenia selliformis occurrences and blooms, Ecol. Inform., 43, 12–23, https://doi.org/10.1016/j.ecoinf.2017.10.017, 2018.
Gomez-Navarro, L., Van Sebille, F., Morales Márquez, V., Hernandez-Carrasco, I., Albert, A., Ubelmann, C., Le Sommer, J., Molines, J.-M., and Brodeau, L.: Impact mpact of Tidal Forcing Tidal Forcing on Surface Particle Transport Properties: Insights from Twin Ocean Simulations Surface Particle Transport1 Properties: Insights from Twin Ocean Simulations, ESS Open Archive [preprint], https://doi.org/10.1002/essoar.10512397.5, 2024.
Guinder, V. A., Tillmann, U., Rivarossa, M., Ferronato, C., Ramírez, F. J., Krock, B., Gu, H., and Saraceno, M.: Extraordinary bloom of toxin-producing phytoplankton enhanced by strong retention on the offshore Patagonian shelf, Biogeosciences, 22, 3397–3428, https://doi.org/10.5194/bg-22-3397-2025, 2025.
Haller, G.: Lagrangian coherent structures from approximate velocity data, Phys. Fluids, 14, 1851–1861, https://doi.org/10.1063/1.1477449, 2002.
Haller, G.: Lagrangian Coherent Structures, Ann. Rev. Fluid Mech., 47, 137–162, https://doi.org/10.1146/annurev-fluid-010313-141322, 2015.
Hernández-García, E., Bettencourt, J. H., Garcon, V., Hernández-Carrasco, I., Lopez, C., Rossi, V., Sudre, J., and Tew Kai, E.: Biological Impact of Ocean Transport: A Finite-Size Lyapunov Characterization, ResearchGate, https://doi.org/10.13140/2.1.4392.7048, 2010.
Hernández-García, E., Bettencourt, J. H., Garcon, V., Hernandez-Carrasco, I., Lopez, C., Rossi, V., Sudre, J., and Tew Kai, E.: Biological Impact of Ocean Transport: A Finite-Size Lyapunov Characterization, in: Proceedings of the 3rd Conference on Nonlinear Science and Complexity, 28–31 July 2010, Ankara, Turkey, http://nsc10.cankaya.edu.tr/proceedings/index.html (last access: 20 October 2025), 2010.
IOC – Intergovernmental Oceanographic Commission: Manuals and Guides, anual on Sea-Level Measurement and Interpretation, in: 14, vol. I. Basic procedures, p. 75, https://www.psmsl.org/train_and_info/training/manuals/ (last access: 20 October 2025), 1985.
Jebri, F., Birol, F., Zakardjian, B., Bouffard, J., and Sammari, C.: Exploiting coastal altimetry to improve the surface circulation scheme over the central Mediterranean Sea, J. Geophys. Res.-Oceans, 121, 4888–4909, https://doi.org/10.1002/2016JC011961, 2016.
Jouini, M., Béranger, K., Arsouze, T. J., Beuvier, S., Thiria, M., Crepon, I., and Taupier-Letage, I.: The Sicily Channel surface circulation revisited using a neural clustering analysis of a high-resolution simulation, J. Geophys. Res.-Oceans, 121, 4545–4567, https://doi.org/10.1002/2015JC011472, 2016.
Kotta, D. and Kitsiou, D.: Chlorophyll in the Eastern Mediterranean Sea: Correlations with Environmental Factors and Trends, Environments, 6, 98, https://doi.org/10.3390/environments6080098, 2019.
Lehahn, Y., d'Ovidio, F., Lévy, M., and Heifetz, E.: Stirring of the northeast Atlantic spring bloom: A Lagrangian analysis based on multisatellite data, J. Geophys. Res., 112, C08005, https://doi.org/10.1029/2006JC003927, 2007.
Lévy, M., Franks, P. J., and Smith, K. S.: The role of submesoscale currents in structuring marine ecosystems, Nat. Commun., 9, 4758, https://doi.org/10.1038/s41467-018-07059-3, 2018.
Liu, Y., Wilson, C., Green, M. A., and Hughes, C. W.: Gulf Stream transport and mixing processes via coherent structure dynamics, J. Geophys. Res.-Oceans, 123, 3014–3037, https://doi.org/10.1002/2017JC013390, 2018.
Macias, D., Garcia-Gorriz, E., and Stips, A.: Major fertilization sources and mechanisms for Mediterranean Sea coastal ecosystems, Limnol. Oceanogr., 63, 897–914, https://doi.org/10.1002/lno.10677, 2018.
Marullo, S., Serva, F., Iacono, R., Napolitano, E., di Sarra, A., and Meloni, D.: Record-breaking persistence of the 2022/23 marine heat wave in the Mediterranean Sea, Environ. Res. Lett., 18, 114041, https://doi.org/10.1088/1748-9326/ad02ae, 2023.
Menna, M., Poulain, P.-M., Ciani, D., Doglioli, A., Notarstefano, G., Gerin, R., Rio, M.-H., Santoleri, R., Gauci, A., and Drago, A.: New Insights of the Sicily Channel and Southern Tyrrhenian Sea Variability, Water, 11, 1355, https://doi.org/10.3390/w11071355, 2019.
Meyerjürgens, J., Ricker, M., Schakau, V., Badewien, T. H., and Stanev, E. V.: Relative dispersion of surface drifters in the North Sea: The effect of tides on mesoscale diffusivity, J. Geophys. Res.-Oceans, 125, 8, https://doi.org/10.1029/2019JC015925, 2020.
Millot, C. and Taupier-Letage, I.: Circulation in the Mediterranean Sea, in: The Mediterranean Sea, Handbook of Environmental Chemistry, vol. 5K, edited by: Saliot, A., Springer, Berlin, Heidelberg, Germany, 29–66, https://doi.org/10.1007/b107143, 2005.
Morales-Márquez, V., Hernández-Carrasco, I., Fox-Kemper, B., and Orfila, A.: Ageostrophic contribution by the wind and waves induced flow to the lateral stirring in the Mediterranean Sea. J. Geophys. Res.-Oceans, 128, e2022JC019135, https://doi.org/10.1029/2022JC019135, 2023.
Okubo, A.: Horizontal dispersion of floatable particles in the vicinity of velocity singularities such as convergences, Deep-Sea Res. Pt. I, 17, 445–454, https://doi.org/10.1016/0011-7471(70)90059-8, 1970.
Onu, K., Huhn, F., and Haller, G.: LCS Tool: A computational platform for Lagrangian coherent structures, J. Comput. Sci., 7, 26–36, https://doi.org/10.1016/j.jocs.2014.12.002, 2015.
Othmani, A., Béjaoui, B., Chevalier, C., Elhmaidi, D., Devenon, J. L., and Aleya, L.: High-resolution numerical modelling of the barotropic tides in the Gulf of Gabes, eastern Mediterranean Sea (Tunisia), J. Afr. Earth Sci., 129, 224–232, https://doi.org/10.1016/j.jafrearsci.2017.01.007, 2017.
Peng, Y., Xu, X., Shao, Q., Weng, H., Niu, H., Li, Z., Zhang, C., Li, P., Zhong, X., and Yang, J.: Applications of Finite-Time Lyapunov Exponent in detecting Lagrangian Coherent Structures for coastal ocean processes: a review, Front. Mar. Sci., 11, 1345260, https://doi.org/10.3389/fmars.2024.1345260, 2024.
Pinardi, N., Zavatarelli, M., Adani, M., Coppini, G., Fratianni, C., Oddo, P., Simoncelli, S., Tonani, M., Lyubartsev, V., Dobricic, S., and Bonaduce, A.: Mediterranean Sea large-scale low-frequency ocean variability and water mass formation rates from 1987 to 2007: A retrospective analysis, Progr. Oceanogr., 132, 318–332, https://doi.org/10.1016/j.pocean.2013.11.003, 2015.
Poulain, P.-M.: Estimates of horizontal divergence and vertical velocity in the equatorial Pacific, J. Phys. Oceanogr., 23, 601–607, https://doi.org/10.1175/1520-0485(1993)023<0601:EOHDAV>2.0.CO;2, 1993.
Poulain, P. M. and Zambianchi, E.: Surface circulation in the central Mediterranean Sea as deduced from Lagrangian drifters in the 1990s, Cont. Shelf Res., 27, 981–1001, https://doi.org/10.1016/j.csr.2007.01.005, 2007.
Poulain, P.-M., Menna, M., and Mauri, E.: Surface geostrophic circulation of the Mediterranean Sea derived from drifter and satellite altimeter data, J. Phys. Oceanogr., 42, 973–990, https://doi.org/10.1175/JPO-D-11-0159.1, 2012.
Poulain, P.-M., Centurioni, L., Brandini, C., Taddei, S., Berta, M., and Menna, M.: Relative dispersion and kinematic properties of the coastal submesoscale circulation in the southeastern Ligurian Sea, Ocean Sci., 19, 1617–1631, https://doi.org/10.5194/os-19-1617-2023, 2023.
Rossi, V., Lopez, C., Sudre, J., Hernández-García, E., and Garçon, V.: Comparative study of mixing and biological activity of the Benguela and Canary upwelling systems, Geophys. Res. Lett., 35, L11602, https://doi.org/10.1029/2008GL033610, 2008.
Rousselet, L., d'Ovidio, F., Izard, L., Della Penna, A., Petrenko, A., Barrillon, S., and Doglioli, A.: A Software Package for an Adaptive Satellite-based Sampling for Oceanographic cruises (SPASSOv2.0): tracking fine scale features for physical and biogeochemical studies, J. Atmos. Ocean. Tech., 42, 979–990, https://doi.org/10.1175/JTECH-D-24-0071.1, 2025.
Rühs, S., van den Bremer, T., Clementi, E., Denes, M. C., Moulin, A., and van Sebille, E.: Non-negligible impact of Stokes drift and wave-driven Eulerian currents on simulated surface particle dispersal in the Mediterranean Sea, Ocean Sci., 21, 217–240, https://doi.org/10.5194/os-21-217-2025, 2025.
Rypina, I., Pratt, L. J., and Lozier, M. S.: Near-surface transport pathways in the North Atlantic Ocean: Looking for through put from the subtropical to the subpolar gyre. J. Phys. Oceanogr., 41, 911–925, https://doi.org/10.1175/2010JPO4498.1, 2011.
Salgado-Hernanz, P. M., Racault, M.-F., Font-Muñoz, J. S., and Basterretxea, G.: Trends in phytoplankton phenology in the Mediterranean Sea based on ocean-colour remote sensing, Remote Sens. Environ., 221, 50–64, https://doi.org/10.1016/j.rse.2018.10.036, 2019.
Sammari, C., Millot, C., Taupier-Letage, I., Stefani, A., and Brahim, M.: Hydrological characteristics in the Tunisian-Sardinia-Sicily area during spring 1995, Deep-Sea Res., 46, 1671–1703, https://doi.org/10.1016/S0967-0637(99)00026-6, 1999.
Sammari, C., Koutitonsky, V., and Moussa, M.: Sea level variability and tidal resonance in the Gulf of Gabes, Tunisia, Cont. Shelf Res., 26, 338–350, https://doi.org/10.1016/j.csr.2005.11.006, 2006.
Shadden, S.-C., Lekien, F., and Marsden, J.-E.: Definition and properties of Lagrangian coherent structures from finite-time Lyapunov exponents in two-dimensional a periodic flows, Physica D, 212, 271–304, https://doi.org/10.1016/j.physd.2005.10.007, 2005.
Siegelman, L.: Energetic Submesoscale Dynamics in the Ocean Interior, J. Phys. Oceanogr., 50, 727–749, https://doi.org/10.1175/JPO-D-19-0253.1, 2020.
Song, D., Wang, X. H., Kiss, A. E., and Bao, X.: The contribution to tidal asymmetry by different combinations of tidal constituents, J. Geophys. Res., 116, C12007, https://doi.org/10.1029/2011JC007270, 2011.
Sorgente, R., Olita, A., Oddo, P., Fazioli, L., and Ribotti, A.: Numerical simulation and decomposition of kinetic energy in the Central Mediterranean: insight on mesoscale circulation and energy conversion, Ocean Sci., 7, 503–519, https://doi.org/10.5194/os-7-503-2011, 2011.
Srinivasan, M. and Tsontos, V.: Satellite Altimetry for Ocean and Coastal Applications: A Review, Remote Sens., 15, 3939, https://doi.org/10.3390/rs15163939, 2023.
Suthers, I. M., Schaeffer, A., Archer, M., Roughan, M., Griffin, D. A., Chapman, C. C., Sloyan, B. M., and Everett, J. D.: Frontal eddies provide an oceanographic triad for favorable larval fish habitat, Limnol. Oceanogr., 68, 1019–1036, https://doi.org/10.1002/lno.12326, 2023.
Vigo, I., Sempere, M., Chao, B., and Trottini, M.: Mediterranean Surface Geostrophic Circulation from Satellite Gravity and Altimetry Observations, Pure Appl. Geophys., 175, https://doi.org/10.1007/s00024-018-1911-0, 2018a.
Vigo, M. I., García-García, D., Sempere, M. D., and Chao, B. F.: 3D Geostrophy and Volume Transport in the Southern Ocean, Remote Sens., 10, 715, https://doi.org/10.3390/rs10050715, 2018b.
Weiss, J.: The dynamics of the enstrophy transfer in two dimensional turbulence, Physica D, 48, 273–294, https://doi.org/10.1016/0167-2789(91)90088-Q, 1991.
Zayen, A., Sayadi, S., Chevalier, C., Boukthir, M., Ben Ismail, S., and Tedetti, M.: Microplastics in surface waters of the Gulf of Gabes, southern Mediterranean Sea: distribution, composition and influence of hydrodynamics, Estuar. Coast. Shelf Sci., 242, 106832, https://doi.org/10.1016/j.ecss.2020.106832, 2020.