the Creative Commons Attribution 4.0 License.
the Creative Commons Attribution 4.0 License.
 | 18 Sep 2025
Physical drivers and parameter sensitivities of pearl river-derived sediment dispersal on the Northern South China Sea Shelf: a modeling study
Guang Zhang
Suan Hu
Xiaolong Yu
Heng Zhang
This study employs the Coupled-Ocean-Atmosphere-Wave-Sediment-Transport (COAWST) modeling system to quantitatively assess the seasonal suspension, transport, and annual fate of Pearl River-derived sediment (riverine slow-settling single fine grains and high-settling flocs) on the northern continental shelf of the South China Sea (SCS). Following careful model validation, a series of sensitivity experiments were conducted to investigate the effects of tides, waves, background circulation, sediment settling velocity, critical shear stress, and sediment spin-up durations. The results reveal strong seasonal variations in sediment dynamics driven by the East Asian monsoon. During the wet summer, weaker hydrodynamic conditions promote the initial deposition of riverine sediment via the surface buoyant plume. In contrast, stronger winds and waves during winter enhance sediment resuspension and southwestward transport, particularly toward the Beibu Gulf. Spatially, approximately two-thirds of the annual Pearl River-derived sediment load is retained near the Pearl River Estuary. About 9 % reaches the continental shelf east of the estuary, while similar proportions accumulate in the Beibu Gulf and south of Hainan Island. Sensitivity experiments highlight the distinct and significant roles of different physical forcings in sediment dispersal. Tidal dynamics strongly enhance sediment mobilization and transport within the estuary by increasing bottom shear stress, which promotes offshore sediment export and limits local deposition. Wave forcing plays a dominant role in sediment resuspension near the river mouth and along the coast, especially during winter, facilitating sediment redistribution across the shelf. The remotely forced (large-scale, non-local forcing) ambient shelf circulation in summer drives eastward sediment transport, enabling sediment to spread widely across the shelf. Model outcomes are also sensitive to sediment parameterization. The natural seasonal increase in critical shear stress for erosion during winter counteracts part of the wave-enhanced resuspension capacity, thereby reducing resuspension and erosion on the continental shelf east of the Leizhou Peninsula. Higher settling velocities decrease suspended sediment concentrations and promote near-source retention, limiting long-distance transport. Spin-up duration experiments indicate that Pearl River–derived sediment, which enters and accumulates in various regions of the model domain during the first year, continues to migrate southwestward in the second year under the influence of the mean annual flow field. In contrast, the spin-up duration of seabed sediment has little impact on the retentions of Pearl River–derived sediment on the shelf. Overall, this study reveals the transport pathway and fate of the Pearl River-derived sediment and provides a model-based assessment of its seasonal behavior and the sensitivity of suspended sediment dispersal to physical drivers and sediment parameters or conditions on the northern SCS shelf. It identifies key physical drivers regulating sediment transport and deposition patterns, offering new insight into sediment fate in a monsoon-dominated shelf system.
- Article
(16509 KB) - Full-text XML
-
Supplement
(2843 KB) - BibTeX
- EndNote


The transport process of suspended sediment from river source to ocean sink is an important link in the global material cycle (Geyer et al., 2004; McKee et al., 2004; Kuehl et al., 2016; Liu et al., 2016; Cao et al., 2019). Much of the riverine sediment is trapped on the shallow shoals in estuaries, while the rest is transported by buoyant plume out of the estuary (Meade, 1969; Burchard et al., 2018; Zhang et al., 2019). The riverine sediment carried by the buoyant plume has a significant impact on the water quality, ecology, and geomorphology of the estuaries and continental shelves (Wright and Coleman, 1973; Turner and Millward, 2002).
The transport and deposition of riverine sediments from river source to estuarine, coastal, and shelf environments are controlled by diverse physical processes, including tidal forces, wave action, and shelf circulation dynamics (Dalyander et al., 2013; Gao and Collins, 2014; Xu et al., 2016; Warner et al., 2017; Zang et al., 2019; Wang et al., 2020). Tides play a critical role in sediment transport dynamics in estuarine and shelf regions, as spring tides typically produce higher bed shear stress, enhanced sediment resuspension, and greater offshore sediment transport flux compared to neap tides (Bever and MacWilliams, 2013; Zhang et al., 2019; Wang et al., 2020). In nearshore regions, wave-induced bed shear stress often exceeds current-induced stress by an order of magnitude (Xue et al., 2012; Dalyander et al., 2013). Furthermore, wave-driven sediment resuspension frequently surpasses, and is often several times greater than, the peak levels achieved by current-induced resuspension (Sanford, 1994; Harris et al., 2008; Brand et al., 2010; Xu et al., 2016). In shelf regions, circulation patterns significantly modulate sediment transport, with the magnitude of along-shelf transport substantially exceeding the cross-shelf component in most areas (Nittrouer and Wright, 1994; Geyer et al., 2004; Gao and Collins, 2014; Wang et al., 2020).
Furthermore, sediment properties, including settling velocity (Xia et al., 2004; Chen et al., 2010; Cheng et al., 2013), critical shear stress for erosion (Dong et al., 2020), and bed grain size distribution (Xue et al., 2012; Bever and MacWilliams, 2013), significantly influence sediment transport dynamics and deposition/resuspension processes. Settling velocity can influence the location of sediment depocenters, with higher settling velocities leading to more proximal entrapment and vice versa (Ralston and Geyer, 2017). Similarly, critical shear stress for erosion can affect the resuspension of deposited sediment, with higher critical shear stress resulting in less resuspension and more deposition especially during neap tides and weak wind wave periods (Dong et al., 2020; Choi et al., 2023).
A comprehensive understanding of sediment transport and deposition from river source to ocean sink requires the integrated consideration of both physical forcing factors and inherent sediment characteristics. Here, we present the transport and deposition of the Pearl River-derived sediments on the continental shelf as a case study. The Pearl River, ranking as China's second-largest river in terms of freshwater discharge (Hu et al., 2011), forms the Pearl River Estuary (PRE) in its lower reaches (Figs. 1 and S1 in the Supplement). Its freshwater and sediment discharge are primarily delivered through eight major outlets (Fig. S1b; Wu et al., 2016; Zhang et al., 2019, 2025a), forming distinct buoyant plumes that extend across the northern South China Sea (SCS) shelf (Zhang et al., 2025a). The present average annual (2001–2022) freshwater and riverine sediment loads are 2.74×10¹¹ m3 and 2.84×10⁷ t, respectively (Ministry of Water Resources of the PRC, 2022). The distribution of these inputs shows significant seasonal variability: approximately 80 % of the freshwater and 95 % of the sediment load are transported during the wet summer season (April to September), while the remaining portion is discharged during the dry winter season (Xia et al., 2004).
The northern SCS, under the influence of the East Asian Monsoon, displays marked seasonal contrasts, featuring winter monsoon winds averaging 7–10 m s−1 and summer winds typically below 6 m s−1 (Su, 2004; Ou et al., 2009). This seasonal shift drives coastal currents: northeastward in summer and southwestward in winter (Gan et al., 2009, 2013). Beyond the coastal zone, the consistent SCS Warm Current flows northeastward along the shelf break and inner continental slope toward the Taiwan Strait, originating near Hainan Island and persisting year-round, even during the winter northeast monsoon, across a remarkable distance of 600–700 km to the southern tip of the Taiwan Strait (Su, 2004; Yang et al., 2008).
The PRE is situated in the central part of the northern South China Sea boundary, positioned between the Taiwan Banks and Hainan Island. The PRE has a micro-tidal and mixed semi-diurnal regime with daily tidal inequality (Mao et al., 2004). The tidal ranges vary from approximately 0.7 m during neap tides to over 2 m during spring tides (Chen et al., 2016; Gong et al., 2018b). Water column stratification is strong during the wet summer but weakens in the dry winter when the PRE becomes partially mixed or vertically well-mixed (Dong et al., 2004). Offshore wave conditions are seasonally variable, being mild in summer and stronger in winter, dominated by larger southeasterly waves (Gong et al., 2018a, b; Zhang et al., 2021).
Previous studies have focused on sediment transport within the PRE (Zhang et al., 2019, 2021; Ma et al., 2024). Most Pearl River-derived sediments are deposited within the estuary, and neglecting tidal effects can lead to higher deposition rates and lower offshore sediment flux when compared to those with tides (Hu et al., 2011). Pearl River-derived sediment behavior is regulated by outlet location, topography, and tidal phase, with neap tides favoring sediment accumulation on shoals and spring tides driving erosion and enhancing erosion and export (Zhang et al., 2019). Waves further intensify both lateral trapping within the PRE and offshore sediment transport (Liu and Cai, 2019; Zhang et al., 2021).
However, numerical studies on the transport of the Pearl River-derived sediments across the continental shelf remain scarce, even amidst the widespread adoption of computer modeling approaches. Previous research has primarily relied on analyses of seismic profiles, gravity cores, and laboratory-based radiometric dating of sediment samples (Ge et al., 2014; Liu et al., 2014; Cao et al., 2019; Lin et al., 2020; Chen et al., 2023). Outside the PRE, such data reveal two Holocene mud depo-centers: an eastward proximal depo-center extending southeastward from the PRE's mouth and a southwestward distal mud belt (Ge et al., 2014; Liu et al., 2014; Chen et al., 2023). However, seismic and drilling data cannot confirm transport of Pearl River sediments to the Beibu Gulf (Ge et al., 2014), and limited sampling makes it difficult to quantify their contribution (Cao et al., 2019). Using radionuclide endmember models, Lin et al. (2020) estimated that ∼ 15 % of nearshore surface sediments in the Beibu Gulf originate from the PRE, but their study did not address transport pathways, fluxes, or annual deposition.
A gap persists in understanding how physical drivers (such as tides, waves, and remotely forced (large-scale, non-local forcing) ambient shelf circulations) and sediment characteristics (such as critical shear stress for erosion, settling velocity) and sediment initial conditions influence the seasonal suspension, transport, and annual deposition of the Pearl River-derived sediment on the shelf. To address this, we utilize numerical modeling calibrated and validated with field observations and seabed grain size data. This is an effective approach for investigating processes and testing hypotheses where observations are limited. This study systematically examines the dispersal dynamics of Pearl River-derived sediment on the northern South China Sea shelf, focusing on the following objectives:
-
Quantify the seasonal dispersal and annual deposition of Pearl River-derived sediment on the continental shelf.
-
Examine the relative roles of physical forcings (tides, waves, and ambient circulations), sediment characteristics (critical shear stress for erosion, settling velocity) and (Pearl River-derived versus Seabed) sediment spin-up durations on its dispersal.
2.1 Model coupling
This study employed the Coupled Ocean Atmosphere Wave Sediment Transport (COAWST, version 3.4) modeling system (Warner et al., 2005, 2008, 2010), which includes a Model Coupling Toolkit (MCT) to facilitate data exchange among different modules (Jacob et al., 2005; Larson et al., 2005). The COAWST system consists of several modeling components, mainly comprises a hydrodynamic module (Regional Ocean Modeling System; ROMS) (Shchepetkin and McWilliams, 2005; Haidvogel et al., 2008), an atmospheric module (Advanced Research Weather Research and Forecasting; WRF) (Skamarock et al., 2005), a wave module (Simulating Waves Nearshore; SWAN) (Booij et al., 1999), and a sediment transport module (Community Sediment Transport Modeling System; CSTM) (Warner et al., 2008).
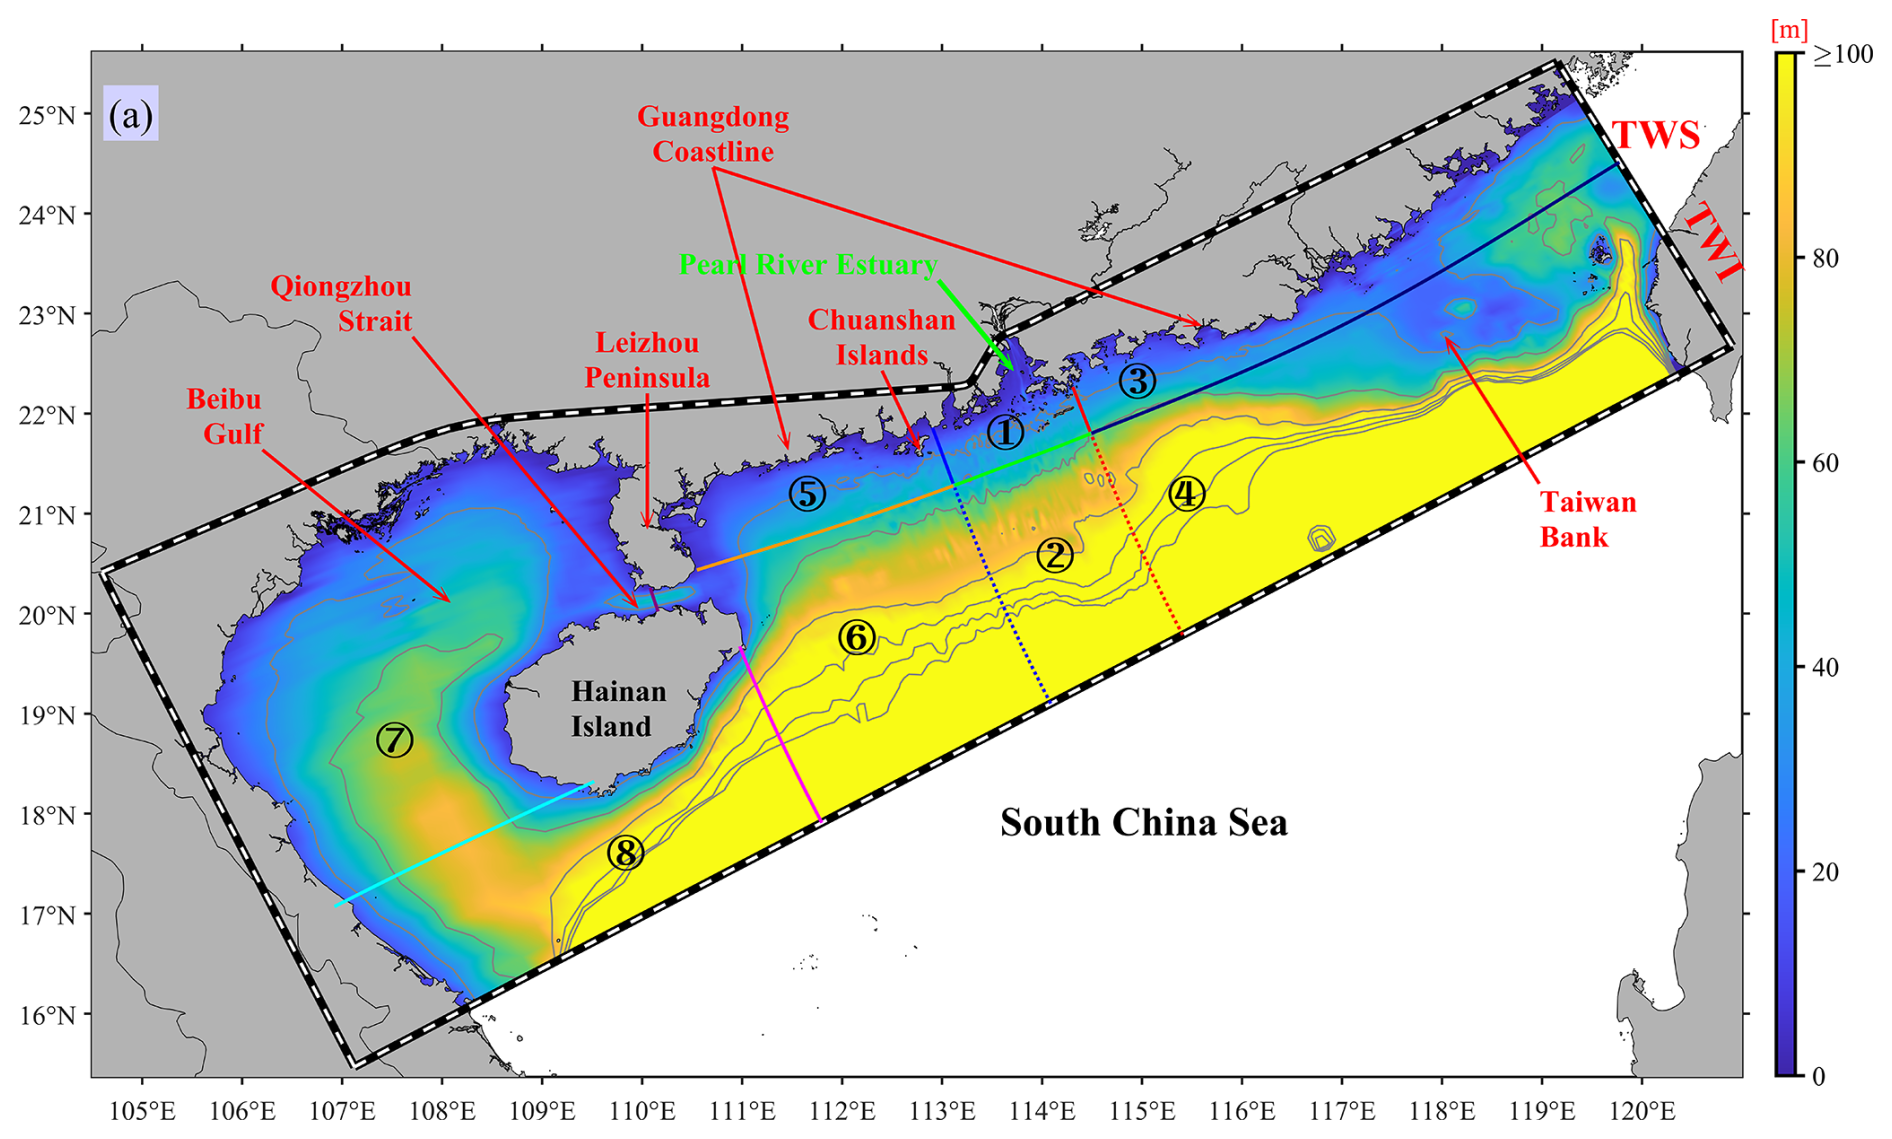
Figure 1Bathymetry (shading) and isobath contours of the study area, with the ROMS/SWAN model grid domain outlined by black-to-white dashed lines. Circled numbers – denote the eight regions: “Proximal”, “Southern”, “Eastern”, “Southeastern”, “Western”, “Southwestern”, “Gulf”, and “Distal” regions, as defined by transects and detailed in Sect. 2.1. The abbreviations TWI and TWS mean Taiwan Island and Taiwan Strait, respectively. The gray contours represent 30–180 m isobaths at 30 m intervals, a consistent feature maintained in all subsequent figures that include these isobath contours.
In this study, we established a coupling between ROMS, SWAN, and CSTM. The model grid covered the northern continental shelf of the South China Sea, including the PRE (Fig. 1). The regional model was configured with 170×482 horizontal grid cells, with horizontal resolution varying from approximately 0.1 km near the PRE to about 10 km at outer open boundaries (Hu et al., 2024; Zhang et al., 2025a). The model grid bathymetry data was obtained from nautical charts compiled by the China Maritime Safety Administration and the General Bathymetric Chart of the Oceans (GEBCO) (Weatherall et al., 2015). The vertical grid used a terrain-following S-coordinate system (Song and Haidvogel, 1994) with 20 layers and a stretching transformation for higher resolution near the surface and bottom. For model validations, please refer to the Supplement (Figs. S1–S10).
To improve the understanding of the spatial-temporal variabilities in the riverine sediment dispersal, and the estimation of the fate of the Pearl River sediment during the wet summer season, dry winter season, and throughout the year, we partitioned the model domain into eight distinct regions delineated by various transects as illustrated in Fig. 1. The division criteria are mainly based on the distance from the estuary and the natural separation by the Leizhou Peninsula and Hainan Island (Fig. 1). These regions include:
- ①
Proximal region: Proximity to the estuary,
- ②
Southern region: Located deeper in the southern part of the estuary,
- ③
Eastern region: Eastern side of the estuary, closer to the shoreline,
- ④
Southeastern region: Further offshore on the eastern side of the estuary,
- ⑤
Western region: Western side of the estuary, closer to the shoreline,
- ⑥
Southwestern region: Offshore on the western side of the estuary,
- ⑦
Gulf region: Mainly the Beibu Gulf,
- ⑧
Distal region: South of the Hainan Island.
By dividing the model domain into these delineated regions, we calculated the riverine sediment flux for each transect, thereby determining the total riverine sediment volume retained in each region.
2.2 ROMS model setup
For the ROMS model, we utilized the Generic Length Scale turbulence closure scheme (Warner et al., 2005) for vertical turbulence parameterization. The method of Smagorinsky (1963) was employed to calculate the horizontal eddy viscosity and diffusivity. The Flather and Chapman boundary conditions were applied to barotropic current and water elevation at open boundaries, respectively (Flather, 1976; Chapman, 1985). Meanwhile, the open-boundary conditions for temperature, salinity, and sediment concentration were imposed by radiation methods (Orlanski, 1976; Raymond and Kuo, 1984). Surface forcing (including wind, net shortwave radiation, air temperature, atmospheric pressure, specific/relative humidity, and rain, etc.) data were sourced from the Climate Forecast System Reanalysis of the National Centers for Environmental Prediction (NCEP) (Saha et al., 2014), with a temporal resolution of 1 h and a spatial resolution of 0.3° × 0.3°. Water level and current velocity open-boundary conditions comprised two components: tidal and subtidal. The tidal component was obtained from the Oregon State University Tidal Prediction Software database (Egbert and Erofeeva, 2002), while the subtidal component was interpolated from the HYbrid Coordinate Ocean Model (HYCOM) outputs (Chassignet et al., 2007).
2.3 Wave model setup
The SWAN model was executed and coupled to the same grid as the ROMS model (Warner et al., 2010). It was driven by surface atmospheric forces, real-time water level, and current fields from the ROMS and boundary reanalysis data. Wave boundary conditions were specified using nonstationary wave parameters from outputs of the NOAA WAVEWATCH III global ocean wave model solutions (Tolman et al., 2016). Information was exchanged at 15 min intervals to introduce wave-current interaction (WCI) between the ROMS and SWAN models (McWilliams et al., 2004; Kumar et al., 2012). This exchange included significant wave height (Hsig), surface peak wave period, mean wave direction and length, wave energy dissipation, and the percentage of breaking waves from SWAN to ROMS, as well as water level and current from ROMS to SWAN.
Additionally, the wave-current bottom boundary module based on Madsen (1994), was activated to simulate the wave-current bottom boundary layer. The vortex force module of wave forces was also activated to compute the wave-induced momentum flux, utilizing the method proposed by McWilliams et al. (2004) and implemented in COAWST by Kumar et al. (2012). The bottom friction was computed based on a logarithmic velocity profile (Warner et al., 2008).
2.4 Specifications of riverine input and sediment model
The freshwater discharge for the Pearl River was specified at the northern boundary using daily measured data from the Pearl River Water Resources Commission, while downstream precipitation within the Pearl River Basin was neglected. The full simulation model was initialized on the first day of January 2016 using temperature, salinity, and current fields interpolated from the HYCOM model, and it concluded on 31 March 2018. This study primarily analyzes the last 12 months, specifically from 1 April 2017 to 31 March 2018. This year was selected because the freshwater discharge and sediment load of the Pearl River closely approximated the average values of the past two decades, with a runoff of 3.35 × 10¹¹ m3 and a sediment load of 3.45 × 10⁷ t, closely resembling the averages from 2001 to 2022.
Since the daily riverine sediment loads were unavailable, we modified the previous research results on sediment rating curves (Zhang et al., 2012) to suit for our study, as expressed by
where Cs is the Pearl River-derived suspended sediment concentration (mg L−1), Q is the Pearl River freshwater discharge rate (m3 s−1). Based on this relationship, the total amount of Pearl River sediment input over our 12-months study period (Fig. 3b) was 34.52×10⁶ t, aligning closely with the annual load reported in 2017 by the Pearl River Water Resources Commission. The riverine sediment input, derived from the river discharge, was allocated across the eight outlets along the north boundary (Fig. S1b) based on the distribution approach of Hu et al. (2011). The subsequent step involved establishing the proportion of seabed sediment particle size components. Sediments are typically categorized into three grain-size classes: clay (0–4 µm), silt (4–63 µm), and sand (63–2000 µm), as outlined by Shepard (1954). Data on sediment particle size composition for the northern continental shelf of the South China Sea and the PRE area were acquired through multiple voyage observations (Zhang et al., 2013, 2019). Furthermore, publicly available data from published literature were compiled (Gao et al., 2007; Kirby et al., 2008; Gao et al., 2010; Huang et al., 2013; Liu et al., 2014; Wang et al., 2014, 2015, 2016; Ge et al., 2017; Lu et al., 2017; Zhong et al., 2017; Yang et al., 2018; Ge et al., 2019). Finally, component distribution data for different particle size classes of seabed sediment were obtained from a total of 1981 measured stations (Fig. 2a–c).
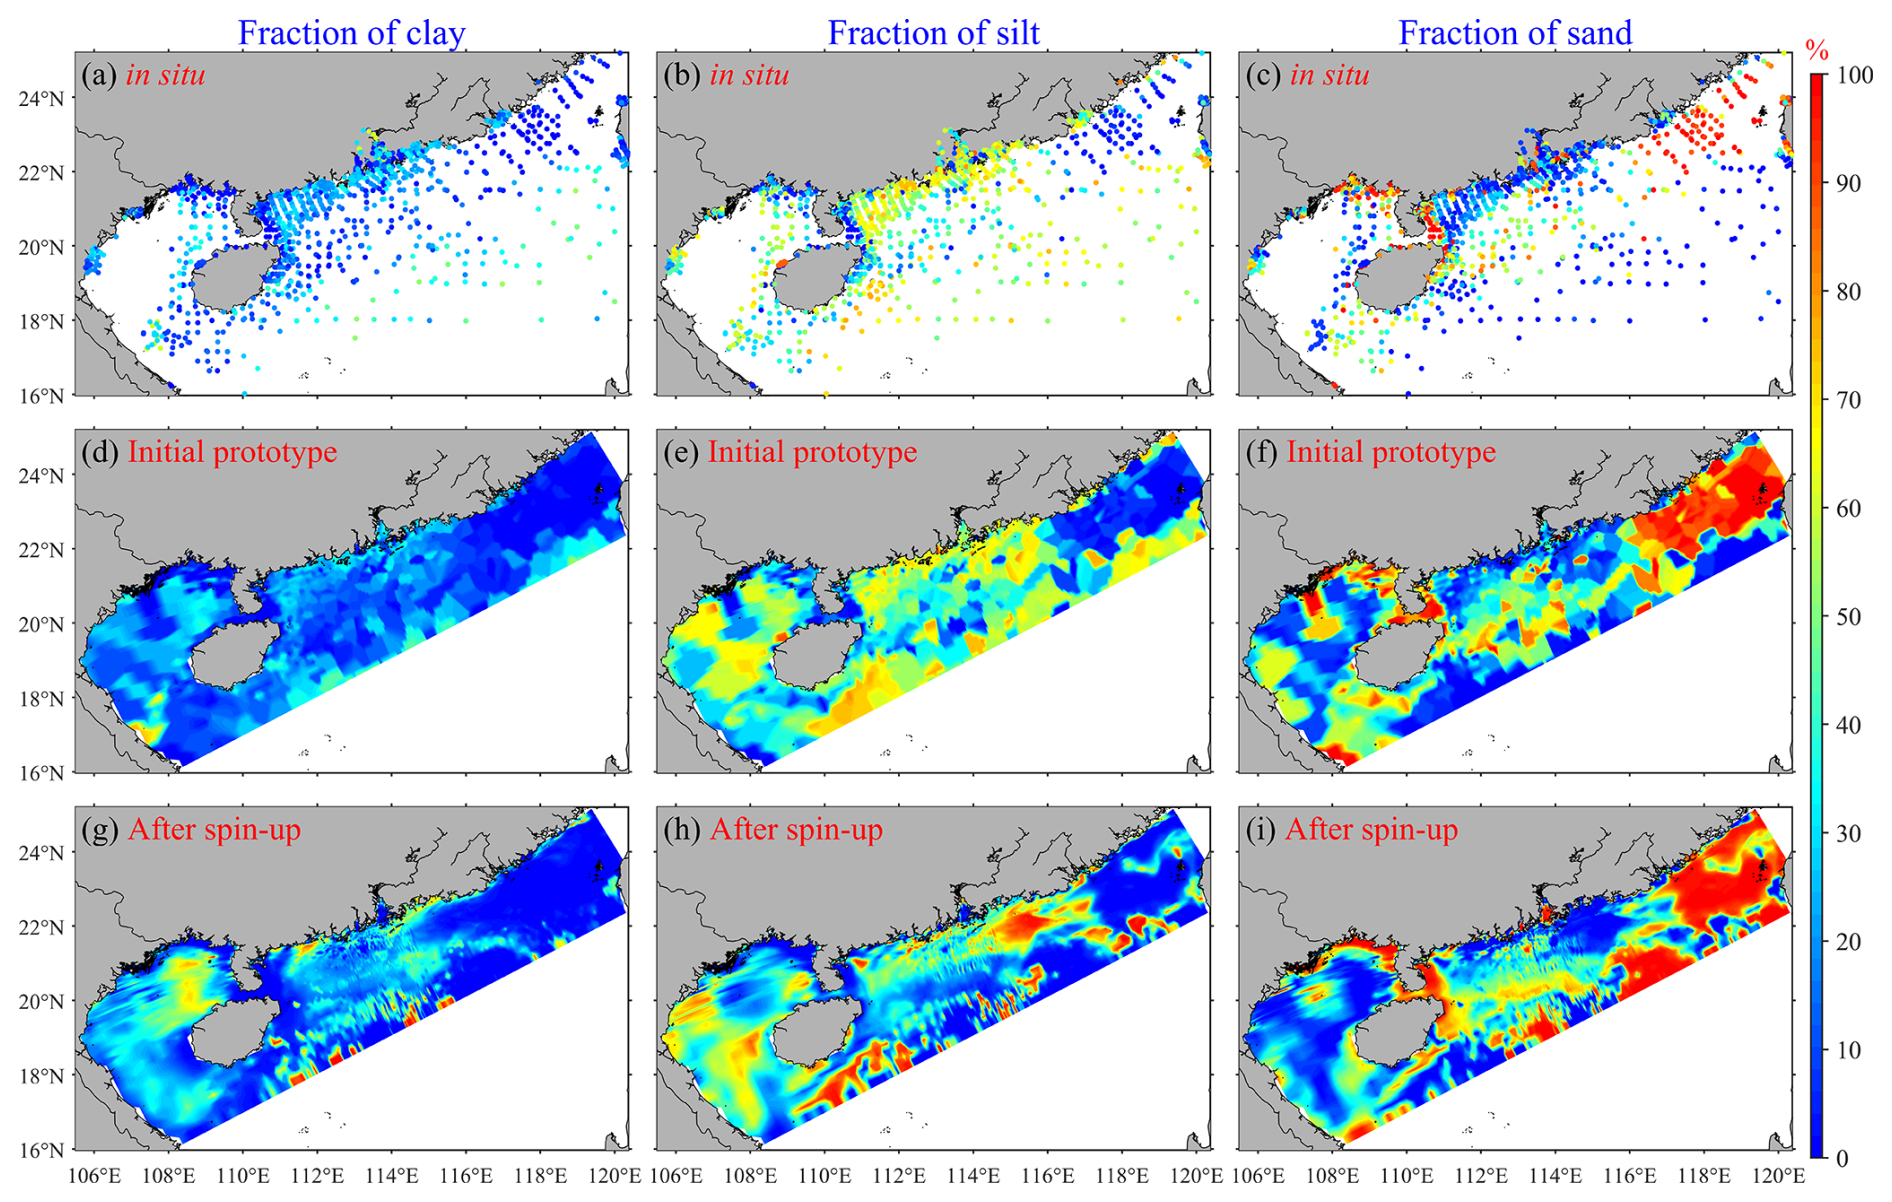
Figure 2Row 1 presents the spatial distribution patterns of seabed sediment fractions derived from 1981 sampling sites, while Row 2 demonstrates the initial spatial distribution prototype of seabed sediment fractions developed based on the observational data presented in Row 1. Row 3 shows the spatial distribution patterns of seabed sediment fractions following the completion of spin-up phase in the Control run case on 1 April 2017, with Columns 1, 2, and 3 representing the fractions of clay, silt, and sand, respectively.
As illustrated in Fig. 2a–c, the measured stations exhibit a widespread distribution, offering comprehensive coverage of the entire northern continental shelf of the South China Sea, including the PRE. Particularly dense distribution is observed in the PRE and the coastal areas of western Guangdong. These regions represent the primary scope of transport and deposition associated with the Pearl River-derived sediment. Hence, the stations utilized in this study well represent the distribution of bed sediment particle size components in these study areas. It is evident that among the stations in the offshore area of the northern continental shelf of the South China Sea, silt dominates, followed by clay, while sand with the largest particle size is the least abundant. This suggests a significant presence of terrestrial sediment or Pearl River sediment in the offshore area of the northern continental shelf of the South China Sea. It should be noted that the lack of in situ grain size distribution data in specific regions of the model domain, especially in the Beibu Gulf area, may lead to uncertainties in sediment transport predictions. We will address these limitations and quantify their potential errors in the discussion part of this study.
To derive the component proportions of the initial prototype field on the model grid, this study employed the Kriging method (Krige, 1951), widely recognized for spatially interpolating various types of observational data. The sediment distribution pattern obtained through interpolation (Fig. 2d–f) closely resembles the original 1981 measured sediment particle size distribution patterns (Fig. 2a–c), suggesting the suitability of this interpolation method for the study area.
The initial prototype field underwent a 15-month spin-up period (from 1 January 2016 to 31 March 2017), during which the bottom sediment composition evolved in response to hydrodynamic forcing through the coupled ROMS, SWAN, and CSTM models. This method has been utilized in numerous previous studies, including those by Bever et al. (2009), van der Wegen et al. (2010), and Zhang et al. (2021). This process allows the initially estimated sediment distribution to evolve under tides, waves, and currents, thereby minimizing unreasonable spatial patterns introduced by the Kriging, sparse or problematic data. Such unreasonable spatial patterns may arise due to limitations in the number, representativeness, and timing of field sediment samples relative to the model start date. As a result, the sediment field after the spin-up period (Fig. 2g–i) is thought to exhibit spatial patterns that are better aligned with the hydrodynamic conditions of the study region. During both the 15-month spin-up period and the subsequent 12-month formal model experiments (see Sect. 2.6 and Table 2), the CSTM utilized five sediment classes (Table 1), representing a range of sediment sizes and characteristics. These included three types of seabed sediments (clay, silt, and sand, corresponding to sediment Classes 1 to 3 in Table 1) and two types of Pearl River-derived sediments (Class 4 and Class 5 in Table 1). The riverine sediments consisted of slow-settling single fine grains (Class 4) and high-settling flocs (Class 5), which were delivered into the model domain during both the 15-month spin-up period and the subsequent 12-month formal model experiments. The riverine flocs correspond to the flocculated fractions of clay and silt, whereas the single fine grains represent the non-flocculated components within the Pearl River-derived sediments, following the setting of Bever and MacWilliams (2013). To clarify, at the start of the 12-month formal model experiments, the retained Pearl River-derived sediments (Classes 4–5 in Table 1) that entered the model during the 15-month spin-up period were added to Class 1 and Class 2, respectively, to avoid contaminating the data analysis of the formal experiments. This approach allows for a better distinction between Pearl River sediment and seabed sediment, enabling separate analysis of the suspension, transport, and deposition of Pearl River-derived sediment (Harris et al., 2008; Zhang et al., 2019). Specifically, the fractions of the two types of Pearl River-derived sediments were set at 40 % and 60 %, respectively, following Zhang et al. (2019, 2021). The parameters for all five sediment classes are summarized in Table 1. Sediment density, porosity, and erosion rate for all sediment classes were set to 2650 kg m−3, 0.672 (Zhang et al., 2019, 2021), and 1 × 10⁻⁴ kg m−2 s−1 (Ralston et al., 2012), respectively. Settling velocities (ws) were guided by the ranges reported by Xia et al. (2004) and Warner et al. (2017), and further refined through extensive sensitivity testing and model calibration to optimally reproduce observed suspended sediment concentration (SSC). Critical shear stresses for erosion (τce), and other parameters were set following previous studies or were based on model calibration (Ralston et al., 2012; Warner et al., 2017; Zhang et al., 2019; Dong et al., 2020; Zhang et al., 2021; Cao et al., 2025).
Our model configuration incorporates seasonal variations in τce, supported by multiple lines of evidence from field observations, laboratory experiments, and numerical analyses (Dong et al., 2020; Cao et al., 2025). Previous studies have established a distinct seasonal pattern in the PRE, with winter τce values significantly exceeding those in summer. Dong et al. (2020)'s laboratory experiments using the UMCES-Gust Erosion Microcosm System (U-GEMS) on 2017-winter sediment samples yielded a τce of 0.26 Pa, which effectively reproduced observed SSC in winter simulations. However, this value proved excessive for summer conditions, when a τce of 0.15 Pa provided better agreement with field observations in summer simulations, indicating a winter-to-summer τce ratio of 1.73. Recent 2020-summer in situ measurements by Cao et al. (2025) using a benthic quadrapod-mounted 3D Profiling Sonar revealed a two-layer erosion threshold system: a surface “fluffy layer” with τce=0.06 Pa overlying a consolidated seabed with τce=0.13 Pa. The latter value aligns with Dong et al. (2020)'s summer calibration, suggesting that Dong et al. (2020)'s laboratory measurements, potentially affected by sediment consolidation during sample transport, might have missed the lower τce of the surface fluffy layer. Based on these consistent findings, we implemented a seasonal τce adjustment factor of 1.73 (winter/summer) in our model configuration (Table 1).
Table 1CSTM model Sediment Properties.
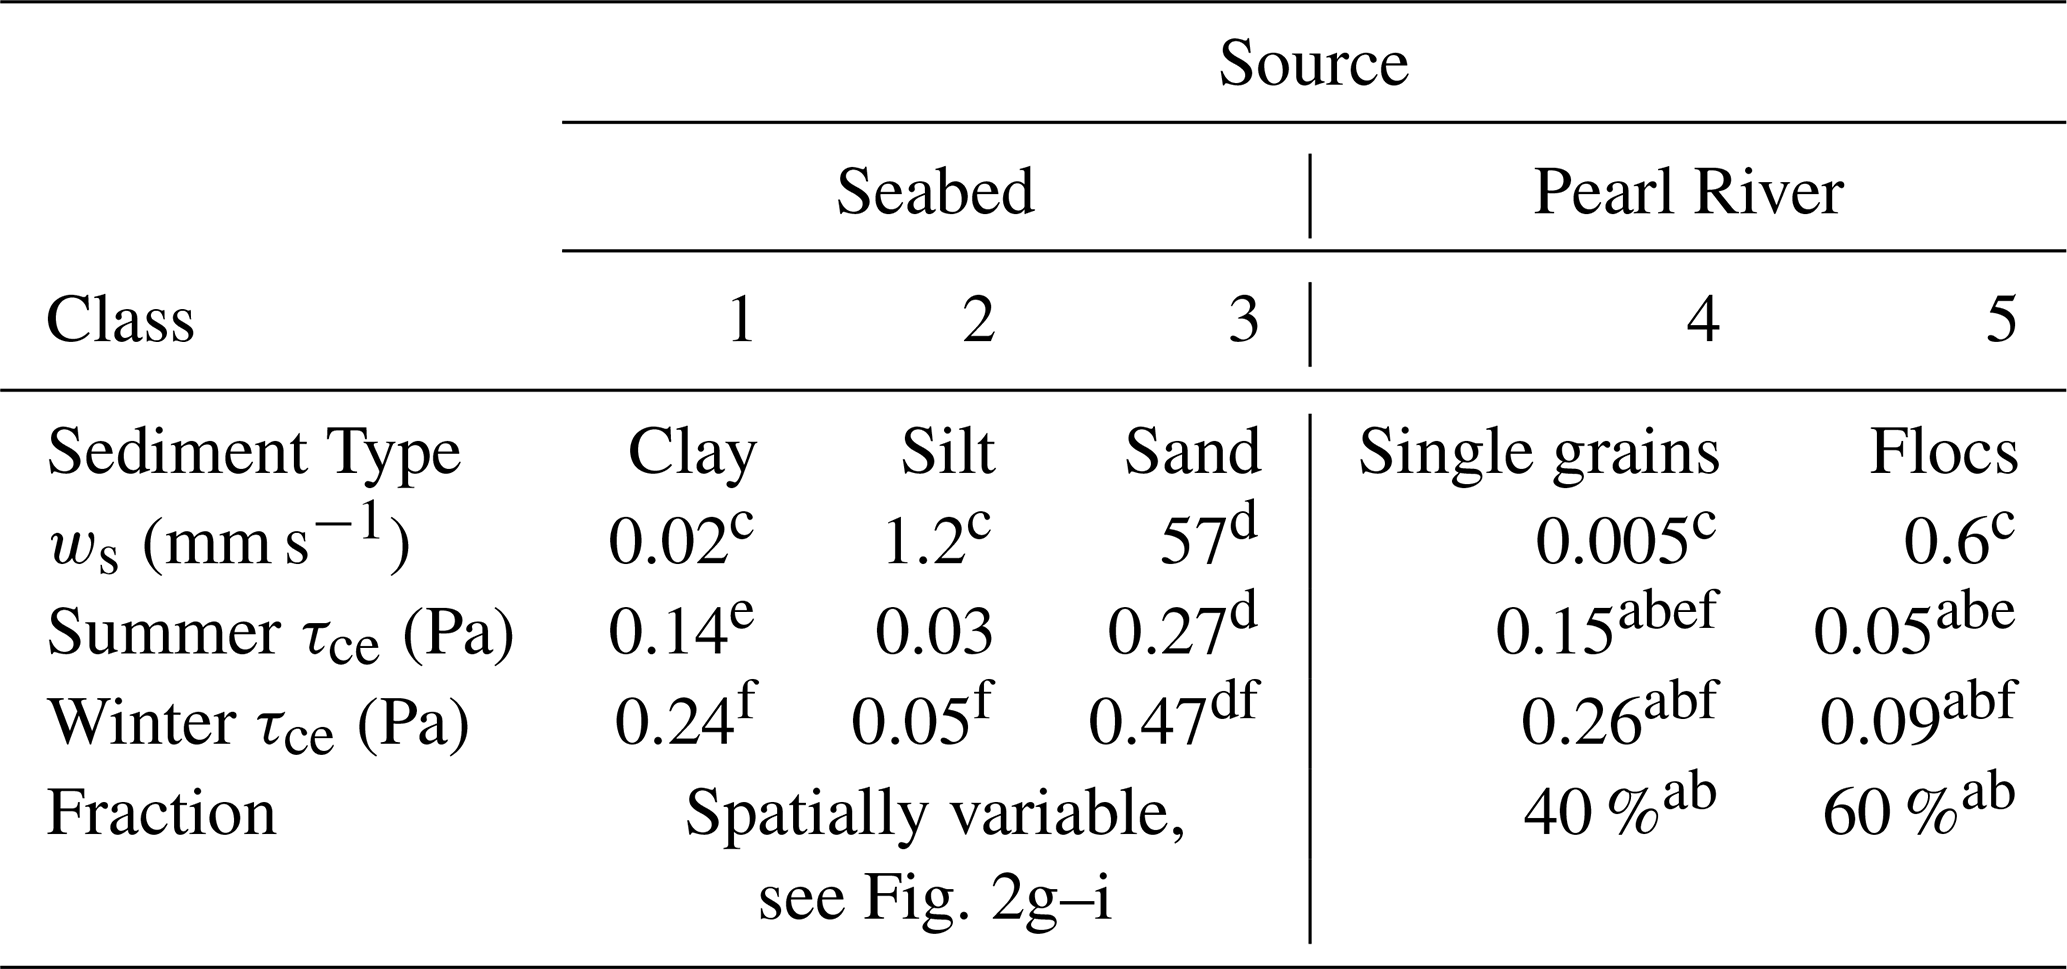
a Zhang et al. (2019), b Zhang et al. (2021), c Calibrated, d Warner et al. (2017), e Cao et al. (2025), and f Dong et al. (2020).
2.5 Wet and dry season regimes
The study area exhibits pronounced seasonal variability, which can be distinctly categorized into two primary seasons (Dong et al., 2004; Su, 2004; Liu et al., 2014; Zhang et al., 2021). This seasonal classification is supported by multiple environmental parameters, including river freshwater discharge (Fig. 3a), riverine sediment load (Fig. 3a), wind patterns (Fig. 3b), air temperature (Fig. 3c), and modeled wave conditions (Fig. 3d–f) at a representative site (21.5° N, 114° E; corresponding to station W1 in Fig. S1a, located immediately south of the PRE). All values presented in Fig. 3 correspond to the period from 1 April 2017 to 31 March 2018, consistent with the 1-year model simulation. The daily measured freshwater discharge for the Pearl River was obtained from the Pearl River Water Resources Commission, while the riverine sediment load was estimated using the method described in Sect. 2.4. The meteorological data for wind and air temperature were obtained from the NCEP reanalysis dataset, while wave parameters were derived from numerical model simulations. These comprehensive indicators collectively characterize the distinct seasonal patterns observed in the study area (Fig. 3). The entire year (from 1 April 2017 to 31 March 2018) is typically divided into two main seasons: wet summer (from 1 April to 30 September 2017) and dry winter (from 1 October 2017 to 31 March 2018).
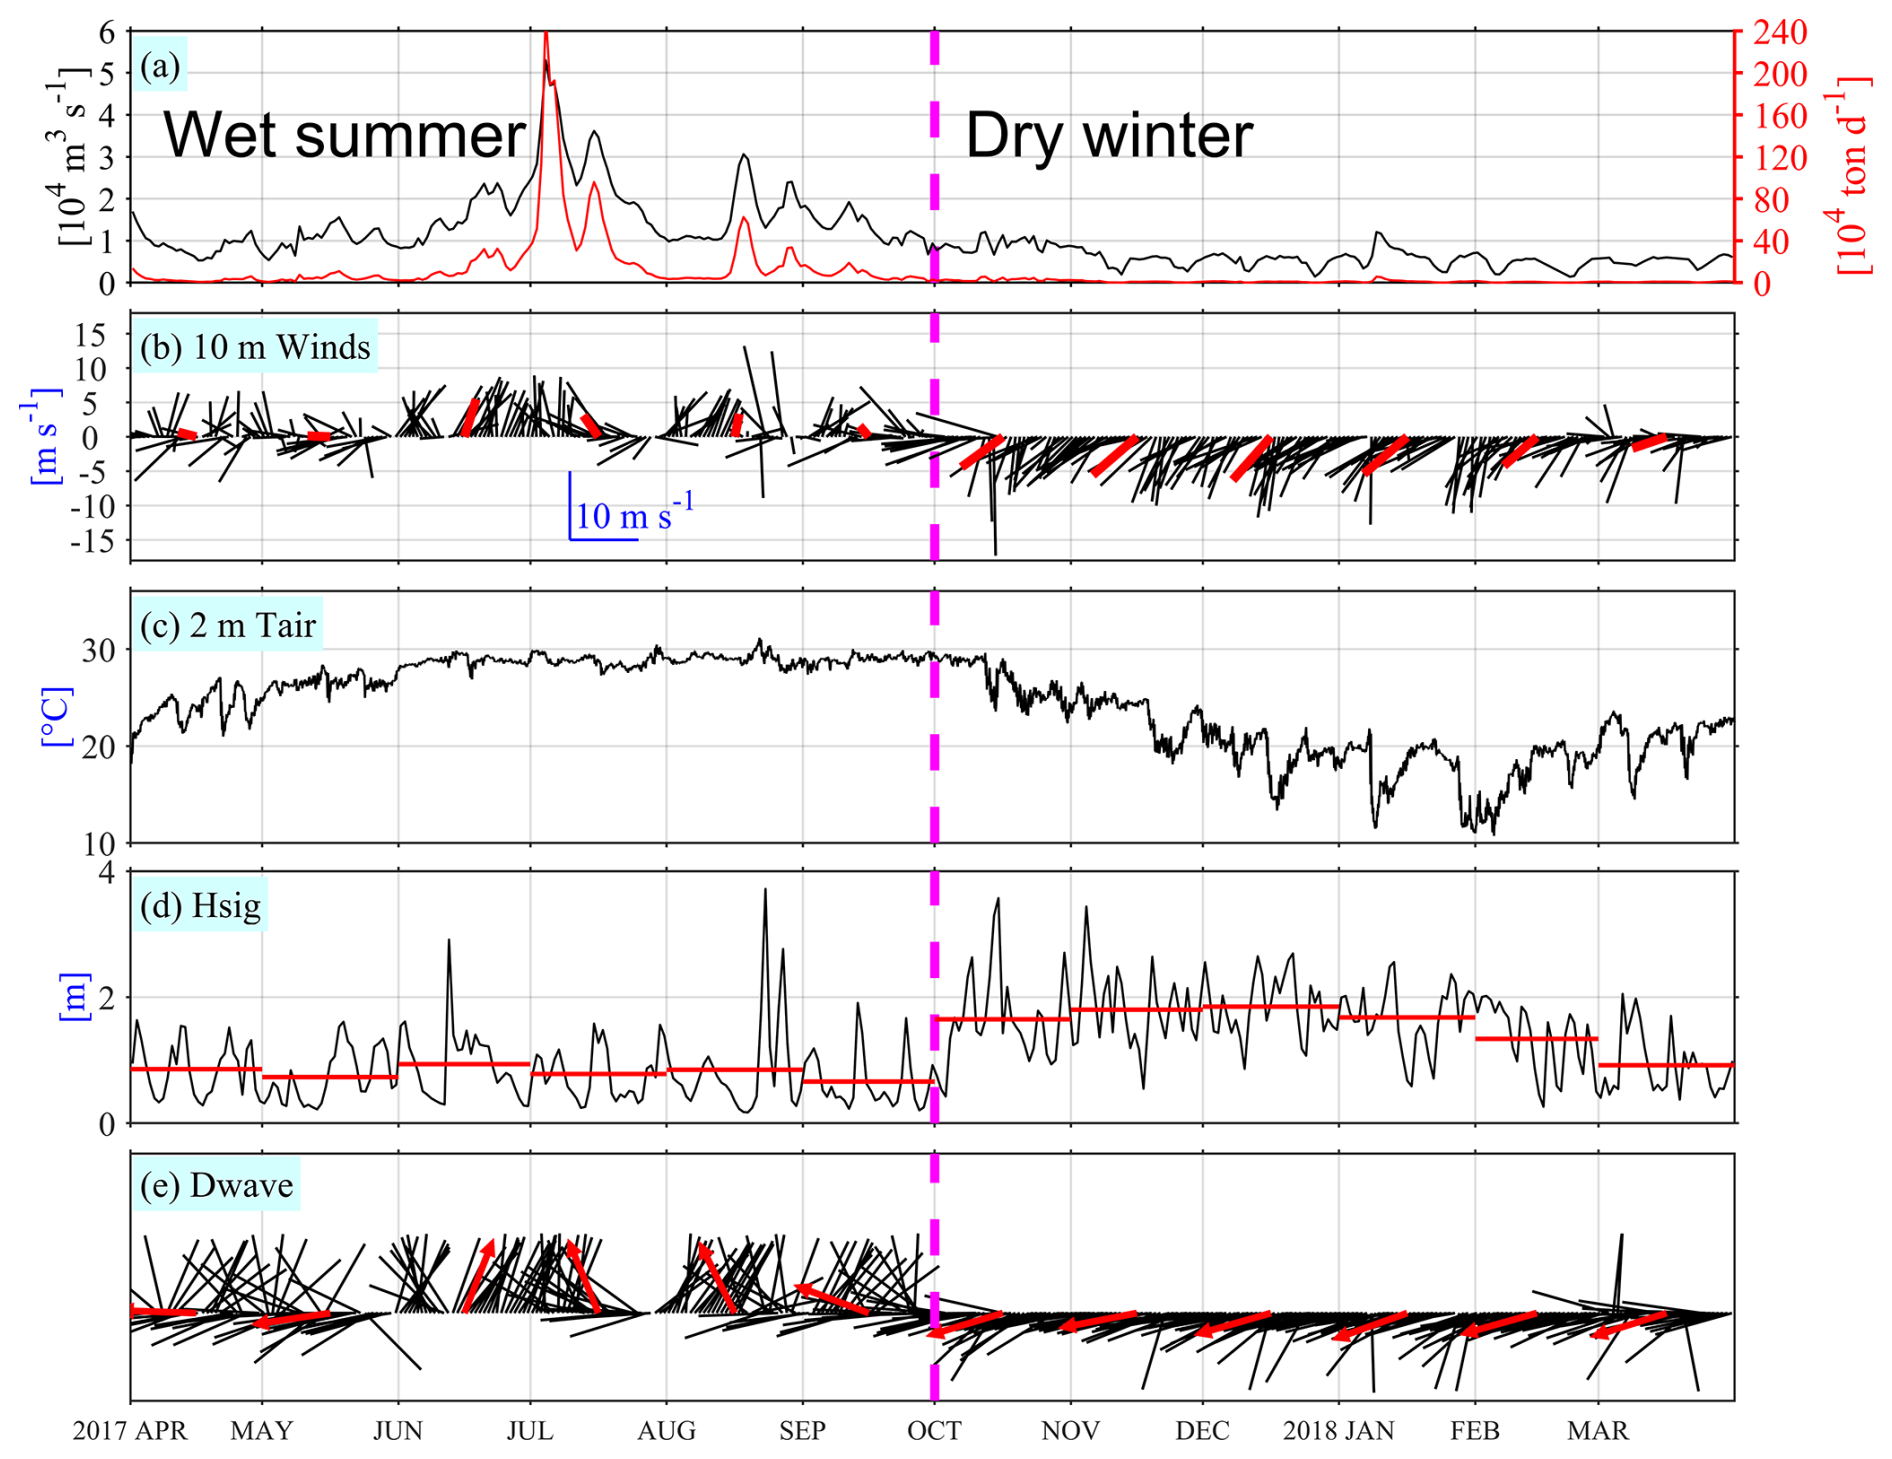
Figure 3Time series of (a) the daily Pearl River freshwater discharge and sediment load, (b) daily (black vectors) and monthly (red vectors) averaged 10 m height winds, (c) hourly 2 m height air temperature, (d) daily (black) and monthly (red) averaged significant wave height (Hsig, lines) and (f) wave propagation direction (vectors) weighted by Hsig2. Two distinct seasons are delineated by the dashed magenta line.
During the wet summer season, freshwater discharge tends to be notably high, often exceeding 10 000 m3 s−1 and reaching a maximum of 53 000 m3 s−1, with an average value of 15 266 m3 s−1. This discharge constitutes a significant portion of the entire year, accounting for 72.06 % of the annual total. During this period, the river carries a substantial sediment load of 32.85 Mt, constituting 95.17 % of the total annual sediment transport. Prevailing winds predominantly blow from the south. For example, Fig. 3b depicts the average monthly wind vector direction during the summer months as northward, with weak southeasterly winds in April, May, and September, and moderate southeasterly winds in July. June and August experience moderate southwesterly winds. The 2 m height air temperatures typically range between 20 and 30°. The daily average Hsig remains relatively low, with the monthly average Hsig less than 1 m. The wave propagation direction is generally consistent with the wind direction, being easterly in April and May, and southerly from June to September.
In stark contrast, the dry winter season demonstrates markedly lower runoff, typically falling below 10 000 m3 s−1, with an average value of 5953 m3 s−1. The sediment load during this period is significantly reduced to merely 1.67 Mt, marking a substantial decrease compared to the wet summer season. Prevailing winds during the dry winter are predominantly northeasterly, with relatively high wind speeds. Except for moderate wind intensity in March, the monthly average wind speed in other months exceeds 5 m s−1. The 2 m height air temperatures typically range between 10 and 25° during this season. The wave propagation direction aligns with the prevailing northeasterly winds of the season, predominantly northeasterly.
2.6 Model experiments
To assess the relative importance of tides, waves, ambient shelf currents and residual water levels, seasonal variation in critical shear stress for erosion, the settling velocity, and the spin-up duration of Pearl River-derived sediment (Classes 4–5 in Table 1) in the transport and dispersal of Pearl River-derived sediments, we conducted seven simulation experiments (Table 2). In all experiments, we implemented the Charnock approach within COAWST's bulk air-sea flux parameterization scheme to calculate surface wind stress using the NCEP 10 m wind product (Charnock, 1955; Fairall et al., 1996), ensuring consistency in wind stress forcing across all simulations.
Exp 1 (the Control run) incorporated all the aforementioned forcing agents (including winds) and accounted for the seasonal variation in critical shear stress for erosion, with the winter critical shear stress for erosion set to be 1.73 times of that in summer. Exp 2 (NTS hereafter) was identical to Exp 1 but excluded tides, while Exp 3 (NWS hereafter) excluded waves. In Exp 4 (NAS hereafter), waves, tides, and the seasonal variation in critical shear stress for erosion were included, but the remotely forced (large-scale, non-local forcing) ambient shelf current and residual (non-tidal) water levels were omitted (i.e., no subtidal circulation forcing at open boundaries) to examine the influence of the South China Sea circulation. Exp 5 (NVS hereafter) replicated the setup of Experiment 1, but with one modification: it used a constant critical shear stress for erosion (τce) across both seasons, specifically adopting the summer τce value from Table 1 throughout the simulation (i.e., no seasonal adjustment between winter and summer). Exp 6 (DSV hereafter) was identical to Exp 1, except that it set a double sediment settling velocity of the Exp 1. Finally, to assess the model's sensitivity to the spin-up duration of Pearl River-derived sediment, particularly regarding the retention of riverine sediments in both the water column and the seabed, we adopted the sediment distributions (Classes 1 to 5) from the final state of the Control run on 31 March 2018, as the alternative initial conditions for the Cycle experiment (designated as Exp 7, Cycle hereafter). This setup carries over the full year's evolution of riverine sediment transport and deposition from the Control run (Exp 1), including changes in all sediment classes, into the start of Exp 7. As a result, Exp 7 mainly evaluates how the presence of previously deposited riverine sediments influences subsequent sediment transport estimates.
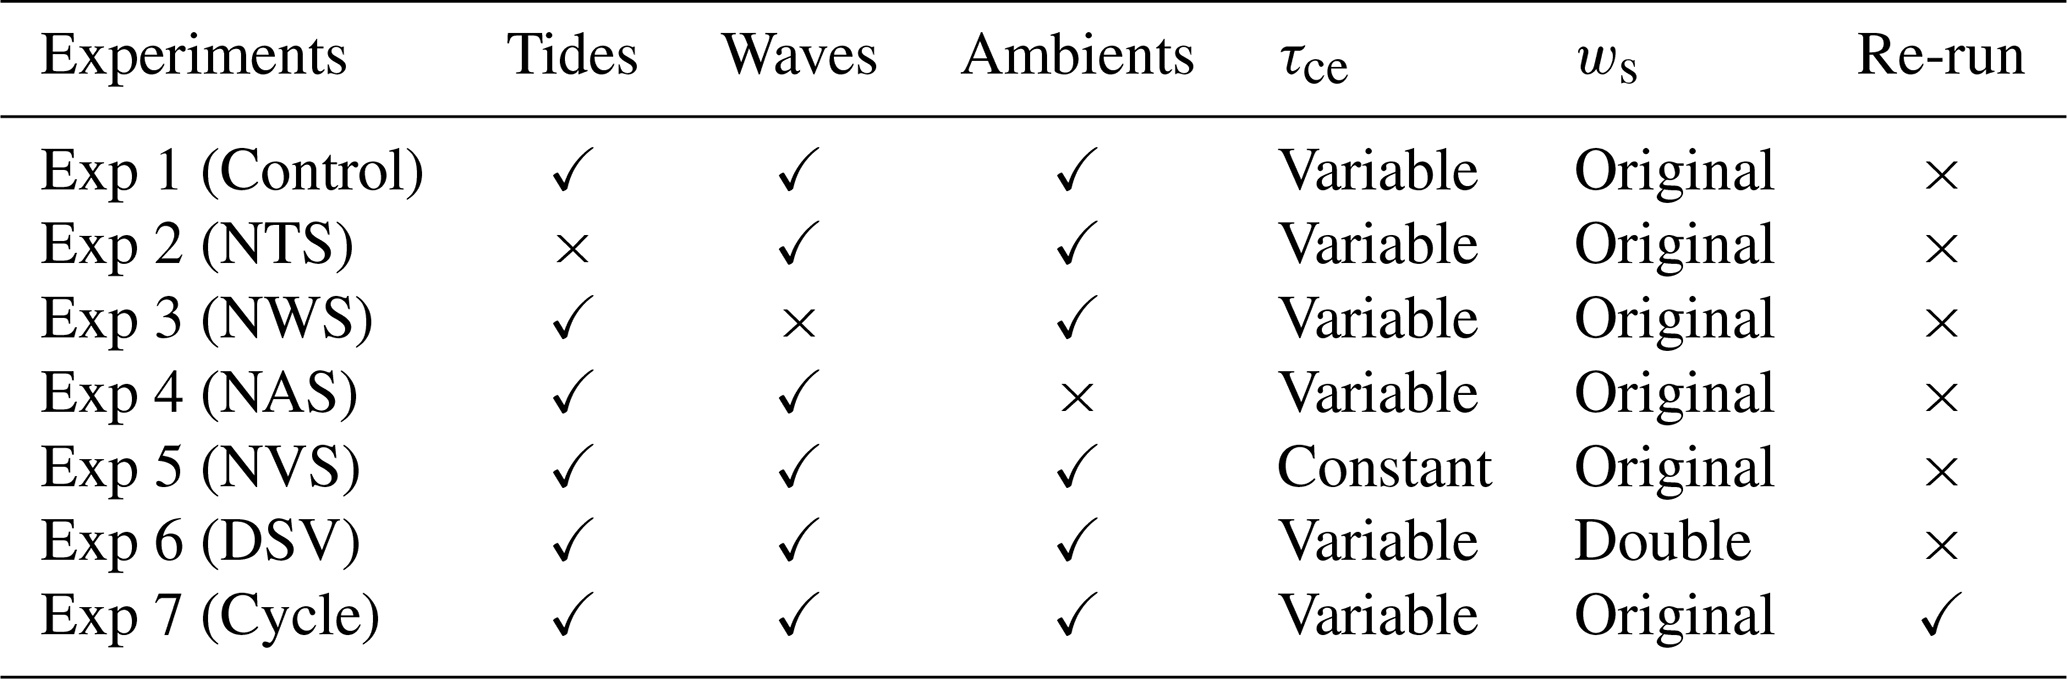
See Sect. 2.6 for full definitions of the abbreviations for Exp1–Exp7 (e.g., Control, NTS, NWS, NAS, etc.). The term “Ambients” denotes remotely forced (large-scale, non-local forcing) ambient shelf currents and residual (non-tidal) water levels. “Variable” indicates simulations employing seasonally varying critical shear stresses for erosion (τce) values (from Table 1), while “Constant” refers to runs using exclusively the summer τce value throughout the entire experiment. “Original” designates experiments utilizing the settling velocities (ws) specified in Table 1, whereas “Double” indicates simulations with these values doubled.
3.1 Seasonal hydrodynamics and transport patterns of the Pearl River-derived sediment
We quantified the spatial distributions of seasonal mean wind stress, Hsig, wave bottom orbital velocity (WBOV), and bottom shear stress for both the wet summer and dry winter periods (as defined in Sect. 2.5). These distributions serve as representative hydrodynamic conditions for typical summer and winter scenarios (Fig. 4).
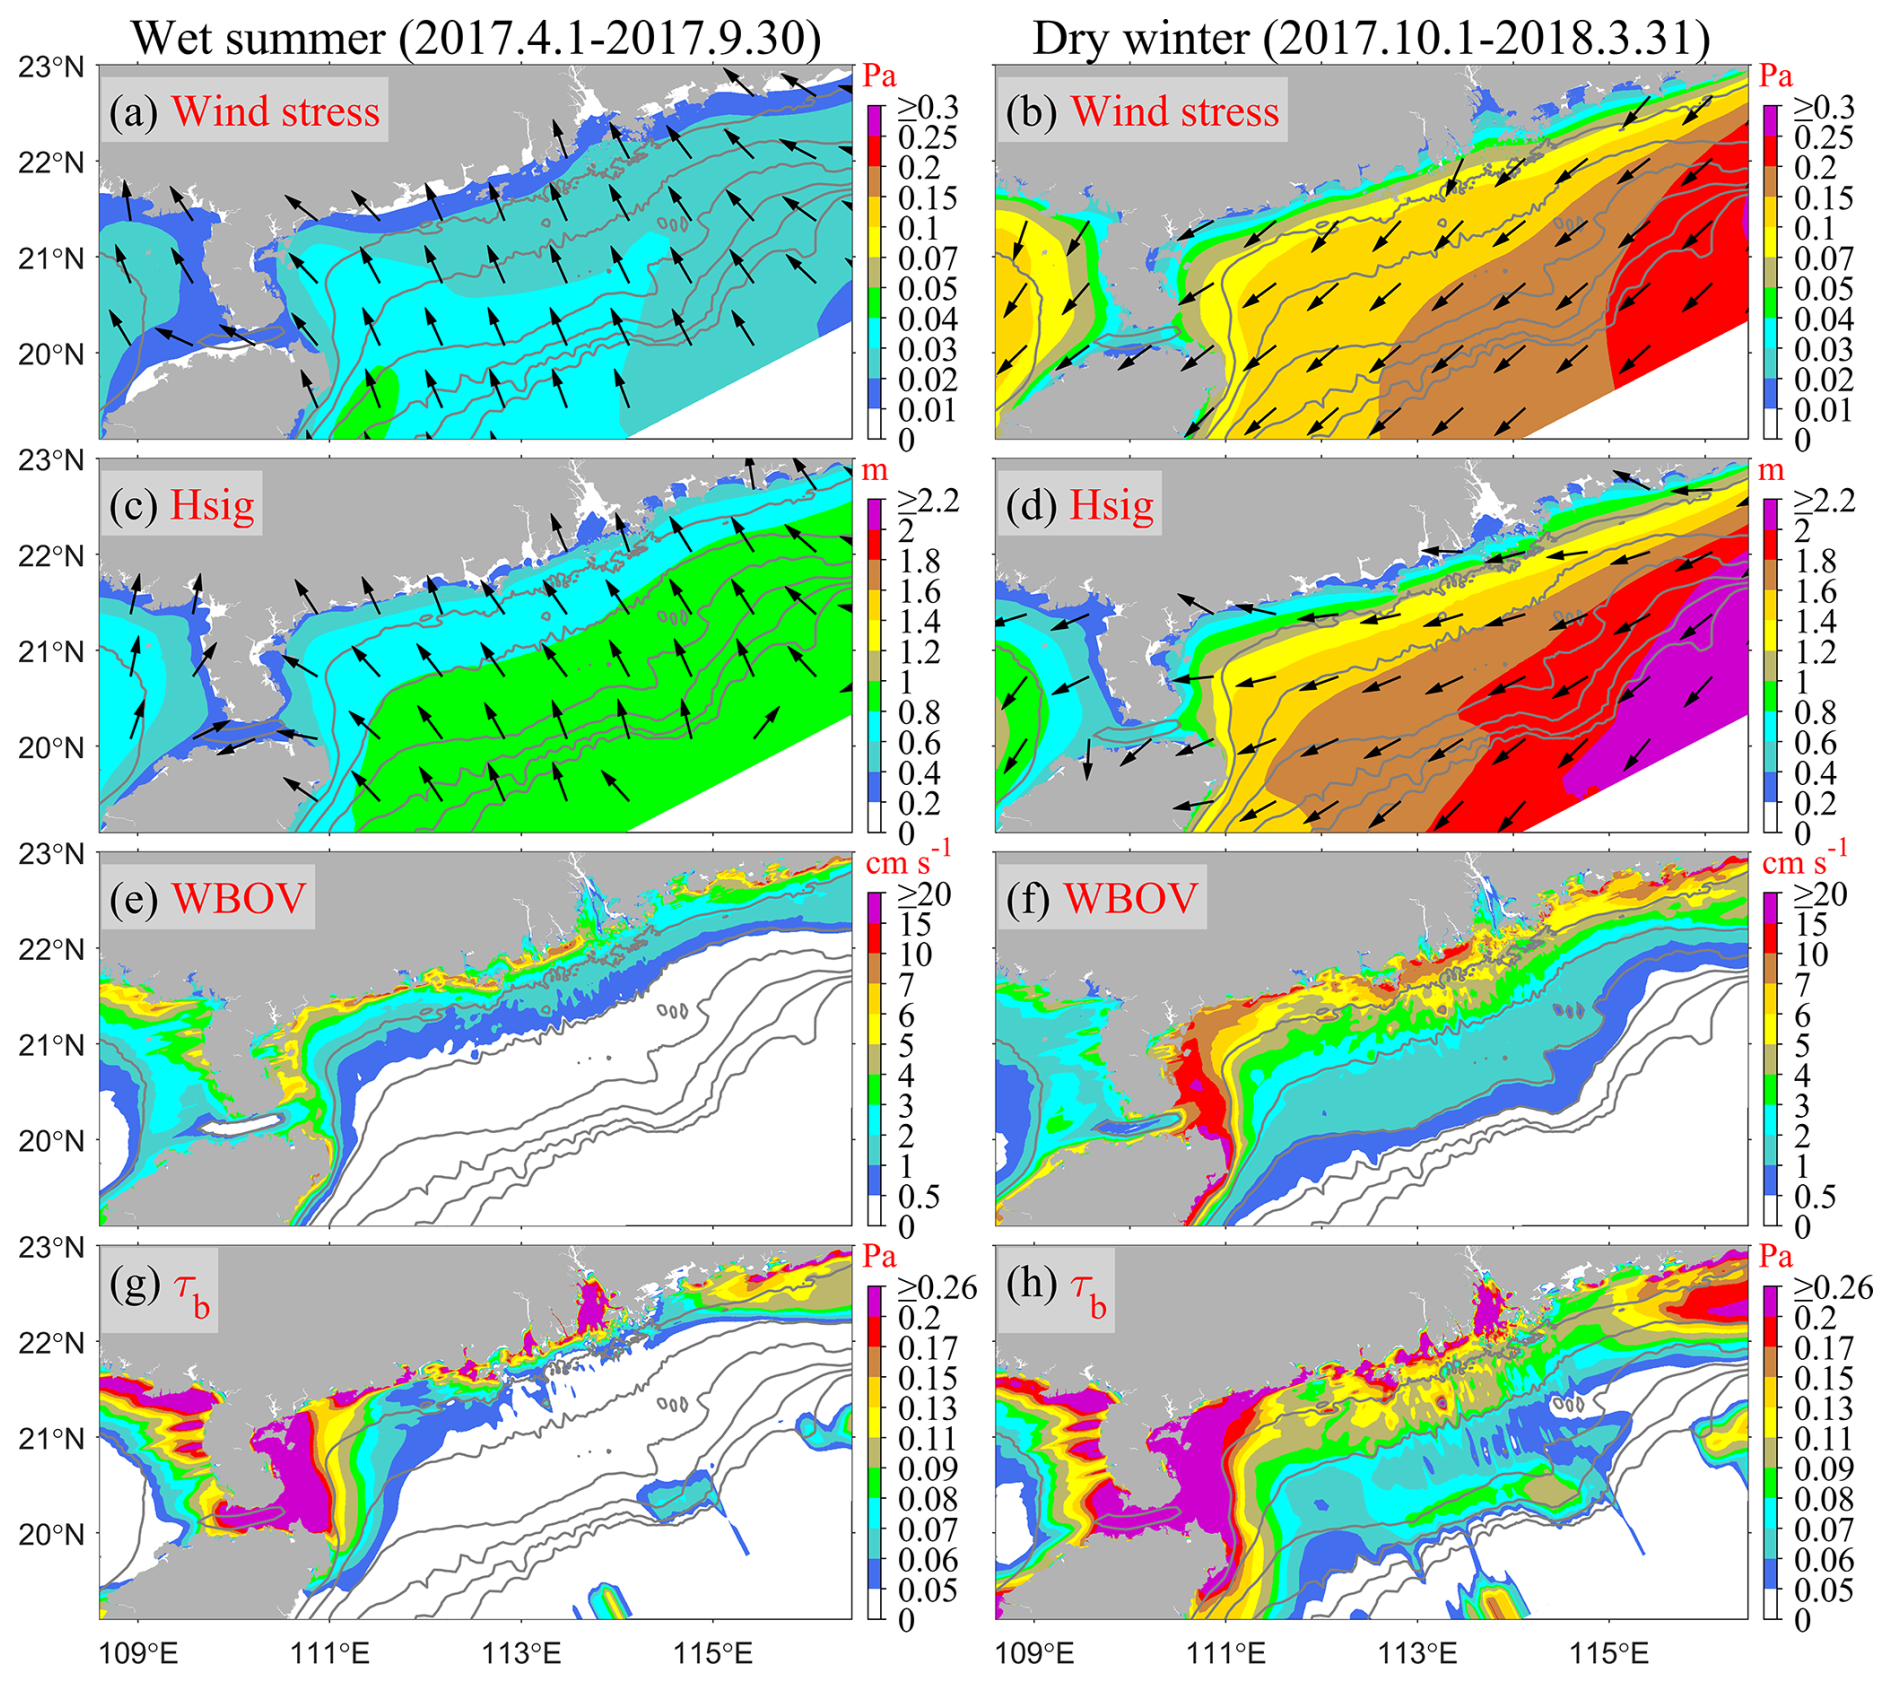
Figure 4The patterns of variables averaged for the wet summer season (from 1 April to 30 September 2017; Column 1) and the dry winter season (from 1 October 2017 to 31 March 2018; Column 2) in the Control case. Row 1 (a–b) depicts wind stress (color) and direction (vectors), Row 2 (c–d) shows Hsig (color) and propagation direction (vectors) weighted by Hsig2, Row 3 (e–f) presents wave bottom orbital velocity (WBOV), and Row 4 (g–h) displays bottom shear stress magnitude.
During summer, the prevailing winds predominantly originate from the south, with the average wind stress generally below 0.03 Pa, except in the eastern coastal waters of Hainan Island, where localized values reach up to 0.05 Pa (Fig. 4a). In contrast, during the dry winter season, the prevailing winds shift to a northeasterly direction, resulting in generally higher average wind stress compared to summer (Fig. 4b), with values typically exceeding 0.1 Pa in areas deeper than 40 m and surpassing 0.2 Pa in the offshore eastern Guangdong Coast near the Taiwan Bank (see Fig. 1).
Corresponding to the seasonal wind stress (Fig. 4a–b), the seasonally averaged wave characteristics in the PRE and the adjacent northern continental shelf of the South China Sea exhibit significant seasonal variations (Fig. 4c–d).
During the wet summer season, the Hsig in the studied area is relatively low, with waves predominantly coming from the southeast (Fig. 4c). The seasonal average Hsig across the entire shelf remains below 1 m, with areas deeper than 60 m showing Hsig values above 0.8 m, while in shallower nearshore regions (water depth < 20 m), Hsig is less than 0.6 m (Fig. 4c). Corresponding to the lower Hsig in the wet summer, the seasonally-averaged WBOV is also relatively small, generally less than 1 cm s−1 in areas deeper than 40 m, except in some nearshore shallow water regions where it reaches up to 10 cm s−1 (Fig. 4e). The seasonally-averaged bottom shear stress during the wet summer is relatively high in the PRE, nearshore regions, and the Taiwan Bank, where tidal dissipation is strong (Fig. 4g).
In the dry winter season, Hsig is notably higher than in the wet summer, with waves primarily coming from the northeast, although refraction in some nearshore regions shifts the wave direction to southeasterly (Fig. 4d). In areas with water depths exceeding 60 m, Hsig exceeds 1.5 m, while in the 20 m depth region, it reaches approximately 1 m (Fig. 4d). Compared to the wet summer, WBOV is also higher in the PRE mouth and many nearshore regions, reaching up to 10–20 cm s−1 (Fig. 4d). The average bottom shear stress on the continental shelf outside the estuary is likewise elevated during the dry winter relative to the wet summer (Fig. 4f).
The patterns of residual sediment dispersal, flux, and deposition over the simulation period provide information on the mechanisms for sediment redistribution on both annual and seasonal timescales. The following section presents a detailed analysis of the seasonally averaged fields of salinity, flow, riverine SSC, depth-integrated riverine sediment flux, and riverine sediment deposition patterns during the wet summer season (Fig. 5) and dry winter season (Fig. 6) on the continental shelf.
During the wet summer season, when freshwater discharge is high and water column stratification is strong, riverine SSC (“riverine” means only Pearl River-derived sediment, classes 4–5 in Table 1, as follows) is primarily influenced by advection from the buoyant river plume (salinity < 33.5; Fig. 3a). This advection mainly occurs in the surface layer (Fig. 5a–b), where high SSC regions closely follow the plume path, as sediment is efficiently transported by the low-salinity, high-momentum freshwater outflow (Fig. 5a–d). The buoyant plume extends both northeastward and southwestward along the coastline (Fig. 5a). Due to the influence of southerly winds (Fig. 4a) and ambient shelf currents, the extent of the buoyant plume extending northeastward is significantly larger than that extending southwestward. In terms of riverine sediment suspension, its estuarine turbidity maxima (ETM) zone (∼ 100 mg L−1) is situated in the shallow water area within the estuary (water depth < 10 m) (Fig. 5c–d). Beyond the estuary, suspended riverine sediment disperses across the shelf through the buoyant plume. Further away from the estuary, its distribution aligns with that of the buoyant plume, with concentrations diminishing as dispersal distance increases. The depth-integrated advective horizontal flux (without including vertical processes such as settling, resuspension, or diffusion, which are handled separately within the model) of riverine sediment offers a clear indication of the primary net transport pathway of the riverine sediment (Fig. 5e). The riverine sediment exhibits both southwestward and northeastward fluxes (Fig. 5e). Southwestward coastal transport can extend as far as the Leizhou Peninsula and Hainan Island. On the eastern side, the northeastward transport extends toward the Taiwan Bank. However, the primary transport pathway there is diverted southward (Fig. 5e) due to the obstruction caused by summer upwelling near the Guangdong east coast (Chen et al., 2017a, b), as evidenced by the cross-shore current in the bottom layer (Fig. 5b). The southwestward transport pathway follows the region where the water depth is shallower than 30 m, with a riverine sediment flux of 10–20 g m−1 s−1. In contrast, the northeastward transport pathway occurs in the 30–60 m depth range, but the riverine sediment flux is below 10 g m−1 s−1. Throughout the wet summer season, substantial amounts of riverine sediment are deposited near the estuary (Fig. 5d), particularly leading to notably high deposition of riverine sediment near the river mouth (>100 mm). Outside the estuary, the thickness of riverine sediment is comparatively lower, but it can reach approximately ∼ 0.5 mm during the wet summer season in certain areas off the western Guangdong coast.
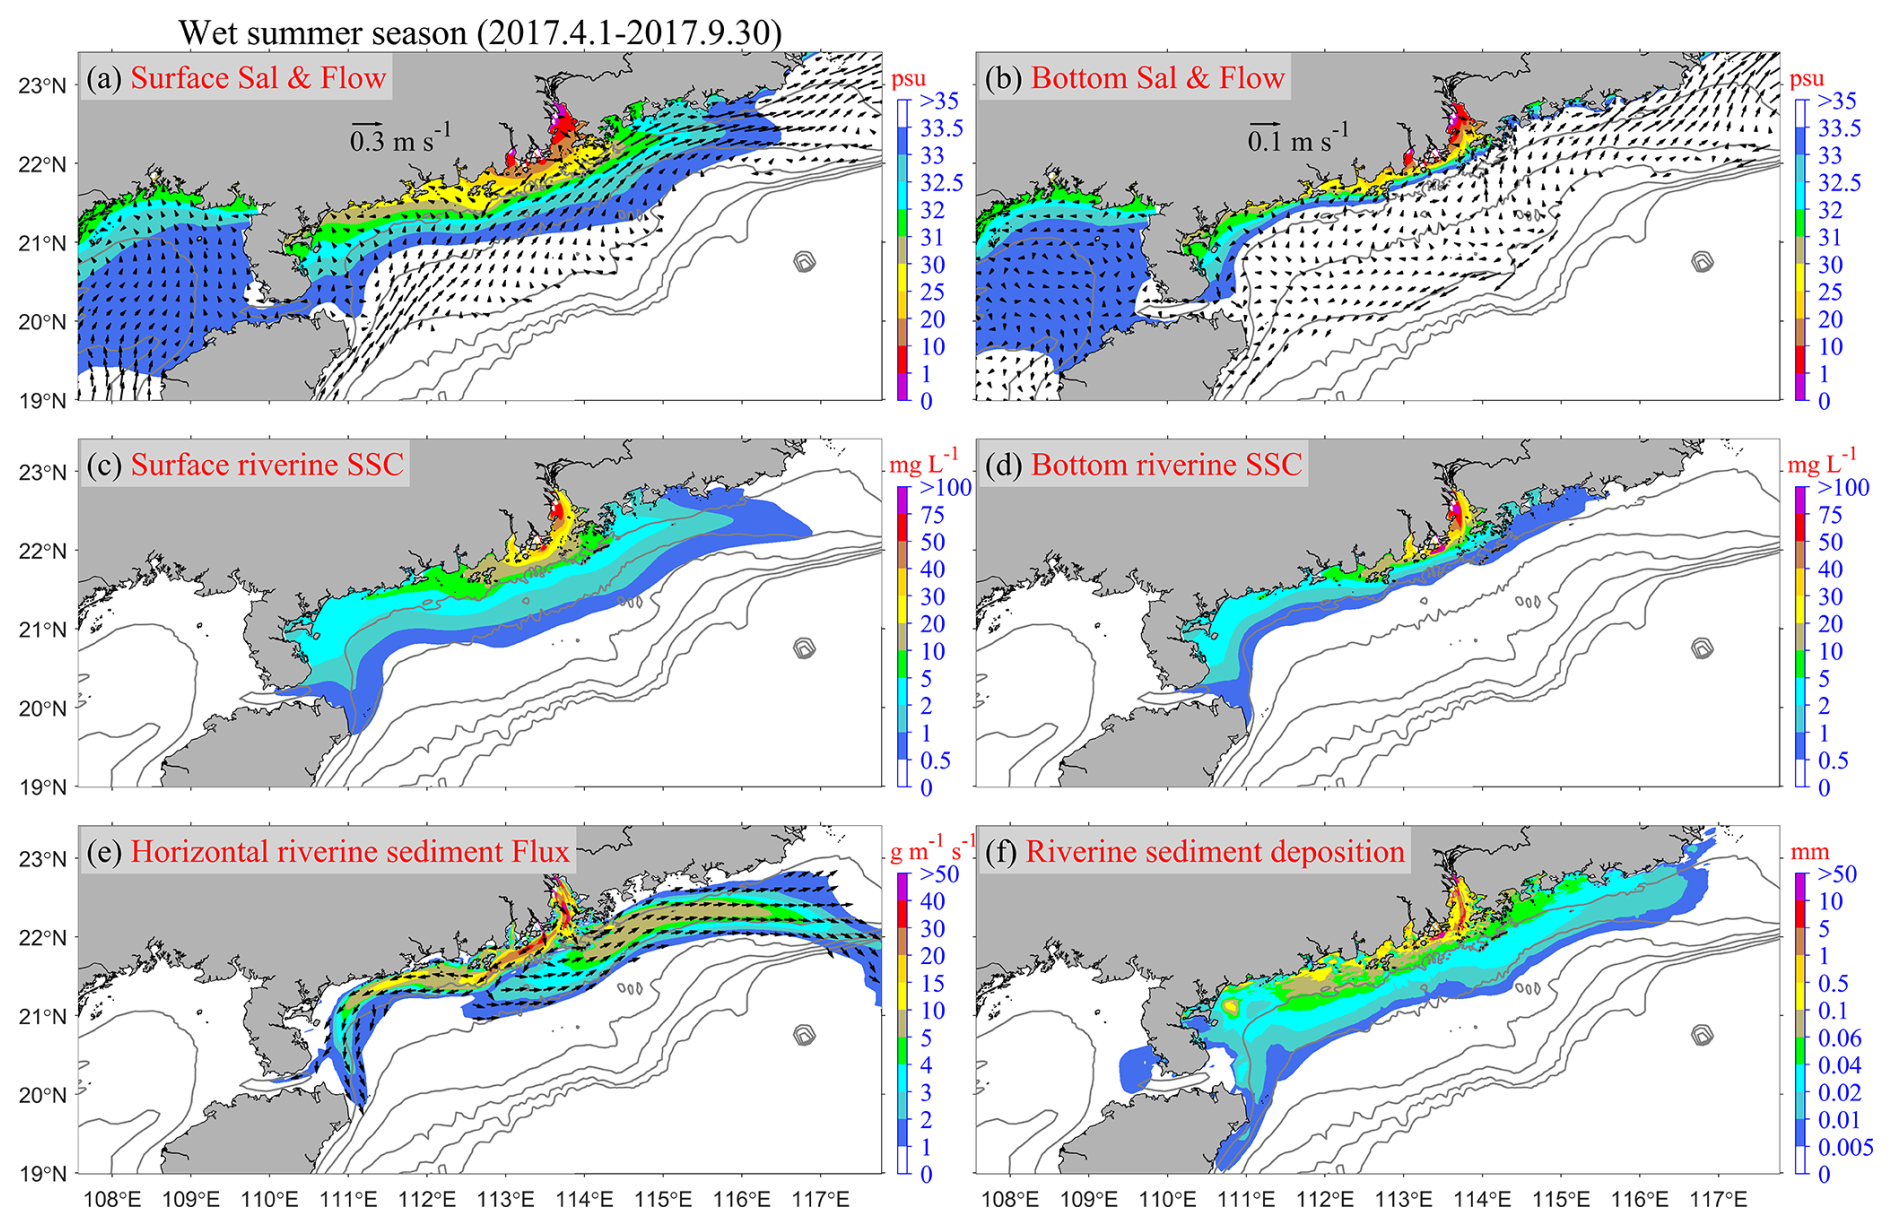
Figure 5Patterns averaged over the entire wet summer season in the Control case: (a) surface and (b) bottom salinity (color, psu) and flow (arrows, m s−1); (c) surface and (d) bottom riverine (classes 4 and 5 in Table 1, as follows) SSC (mg L−1); (e) depth-integrated horizontal riverine sediment transport rate (color, g m−1 s−1) and direction (arrows); and (f) riverine sediment deposition thickness (mm) on the seabed during the wet summer season. Flow vectors in regions with water depths exceeding 100 m are masked for clarity.
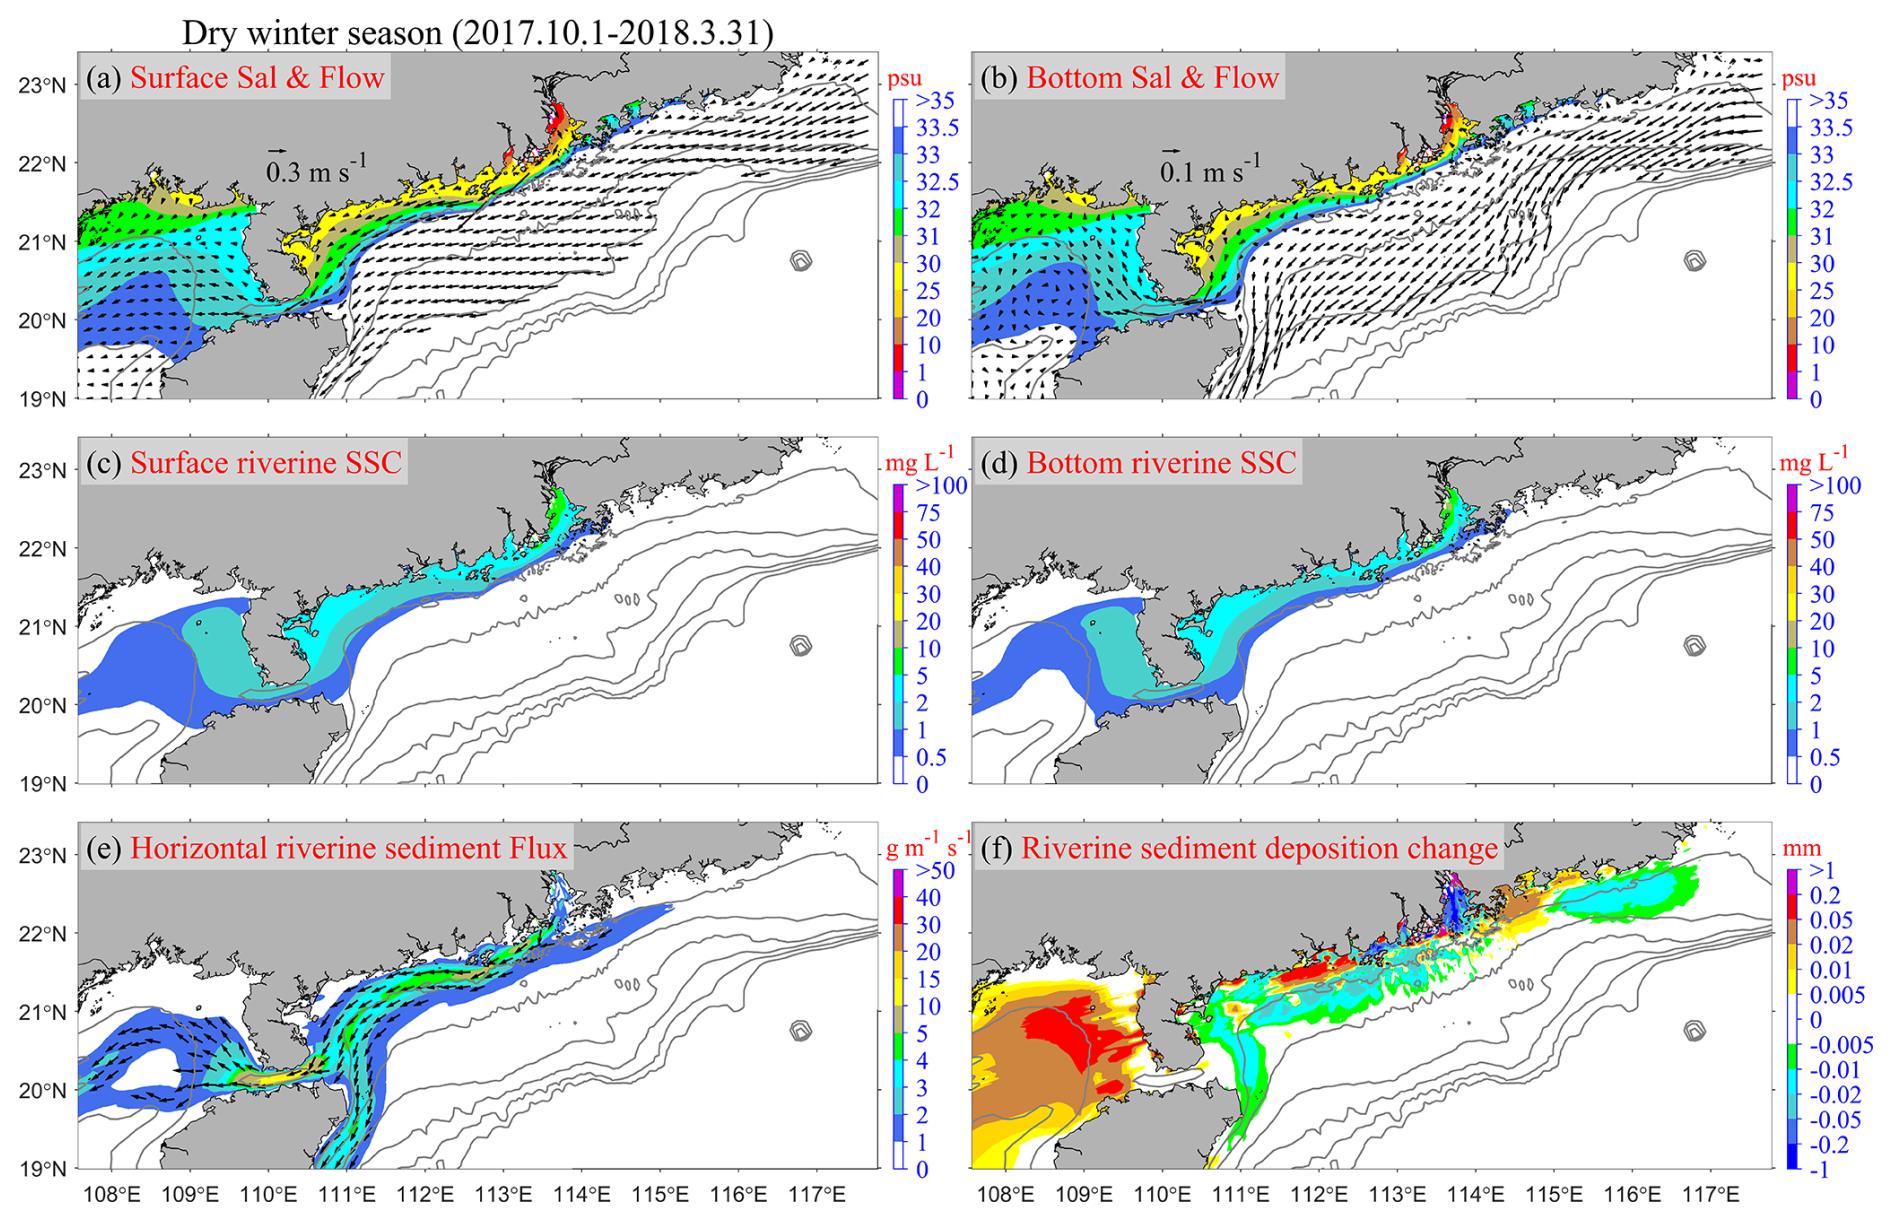
Figure 6Same as Fig. 5, but for the dry winter season in the Control case. Notably, (f) illustrates the changes in riverine sediment (classes 4 and 5 in Table 1) deposition on the seabed at the end of the dry winter season compared to the end of the wet summer season.
In contrast, during winter, when river discharge is low and vertical mixing is more intense, the correlation between the buoyant plume and riverine SSC is much weaker, and the riverine SSC is largely governed by resuspension processes driven by strong northeasterly winds and waves, rather than by freshwater transport. The expansion of the Pearl River buoyant plume is constrained to the southwestward direction by strong northeasterly winds (Fig. 6a), resulting in a narrow cross-shore width of the buoyant plume and the formation of a strong horizontal salinity gradient (i.e., a salinity front, particularly within the 30–33.5 psu range shown in Fig. 6a) outside the estuary (Fig. 6a). Flow velocity increases near this salinity front, facilitating the westward extension of the buoyant plume through the Qiongzhou Strait into the “Gulf” region. The riverine SSC is significantly lower than in the wet summer: in the ETM zone inside the PRE, riverine SSC falls from roughly 100 mg L−1 in summer to about 10 mg L−1, while on the offshore shelf, it decreases from approximately 5 to around 2 mg L−1 (Fig. 6c–d vs. Fig. 5c–d). During the dry winter, following the coastal current, the riverine suspended sediment primarily moves southwestward along the coast, deflecting southward along the topography near the Leizhou Peninsula (Fig. 6c). It then bifurcates near the east entrance of the Qiongzhou Strait, with one branch continuing into the “Gulf” region, and the other one proceeding southward along the east coast of Hainan Island. Stronger winds and waves in the dry winter lead to the resuspension of a considerable amount of riverine sediments, originally deposited in “Proximal”, “Western”, and “Eastern” regions during summer. The resuspended sediments are then transported to coastal bays as well as to the sides and rears of the islands (Fig. 6d). Additionally, a portion of the riverine sediment transported to the “Gulf” region gets deposited on the seabed during the dry winter season.
3.2 Riverine sediment budgets and annual deposition over the shelf
We present the sediment fluxes and retention amounts in different regions. Figure 7a–c illustrates the proportion of riverine sediment retention budget within each region, expressed as a percentage of the total annual river sediment load input (Fig. 3a), for the wet summer season (Fig. 7a), the dry winter season (Fig. 7b), and the entire year (Fig. 7c), based on the Control run, respectively. Meanwhile, Fig. 7d illustrates the annual deposition over the shelf.
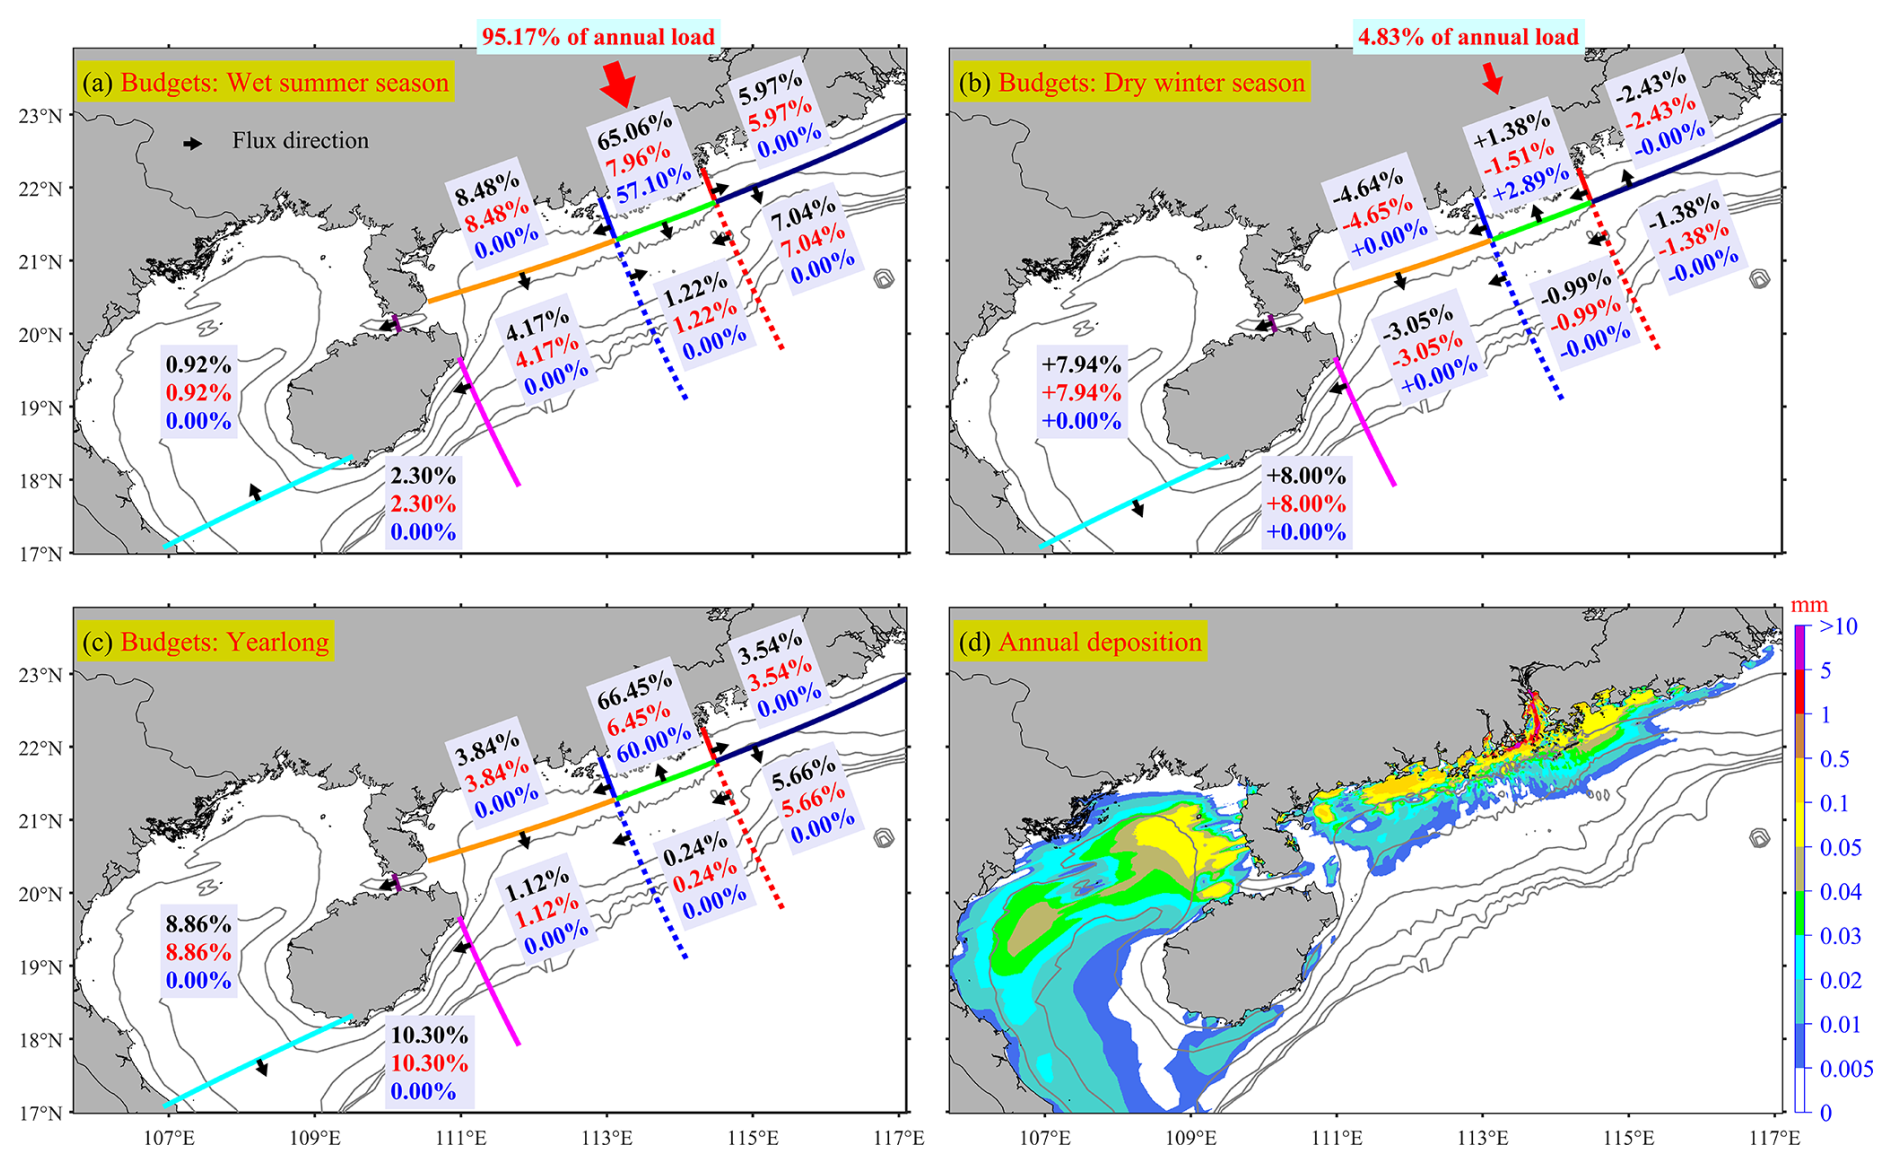
Figure 7Riverine sediment (classes 4 and 5 in Table 1) retention budget percentages at eight regions (see Fig. 1) during (a) the wet summer season, (b) the dry winter season, and (c) the entire year in the Control run case. (d) The annual deposition patterns spanning from 1 April 2017 to 31 March 2018 in the Control Run. All percentages displayed in the figure are relative to the annual riverine sediment load (see Fig. 3a). The black percentage values represent the combined total of riverine sediment Class 4 and Class 5, while the red and blue values denote sediment Class 4 and Class 5, respectively. Arrows indicate the direction of net riverine sediment flux at each transect during the specified period.
The retention of Pearl River sediment on the continental shelf exhibits significant seasonal variations (Fig. 7a–c). During the wet summer (characterized by high discharge and relatively calm wind/waves), the PRE and continental shelf receive 95.17 % of the annual sediment input (Figs. 3a and 7a). Of this, about two-thirds is retained in the “Proximal” region (Fig. 7a). Influenced by the prevailing southerly winds and northeastward shelf currents, 13.01 % of the annual sediment load is retained in the “Eastern” and “Southeastern” regions (Fig. 7a). Meanwhile, the shelf west of the PRE (⑤–⑧ regions) retains 15.87 % of the annual load, with the “Western” region alone accounting for 8.48 % (Fig. 7a). In contrast, only 0.92 % and 2.3 % enter the more remote “Gulf” and “Distal” regions, respectively (Fig. 7a). The “Southern” region retains a mere 1.22 % of the sediment (Fig. 7a).
In the dry winter (characterized by low discharge and energetic winds/waves), the PRE and the continental shelf receive only 4.83 % of the annual sediment load (Figs. 3a and 7b). The sediment distribution during this season primarily reflects reworking of previously retained sediments from summer (Fig. 7b). Retention in the “Proximal” region increases slightly (+1.38 %)in retention, while retention decreases in the ②–⑥ regions. Much of this remobilized sediment is transported farther offshore and retained in the “Gulf” and “Distal” regions (Fig. 7b).
The annual sediment budget reveals that 66.45 % of the Pearl River sediment is retained in the “Proximal” region (Fig. 7c). Additionally, 9.2 % is retained in the “Eastern” and “Southeastern” regions (Fig. 7c), primarily during summer (Fig. 7a vs. Fig. 7c), while 24.12 % is retained on the shelf west of the PRE (⑤–⑧ regions), with most of that occurring in the “Gulf” and “Distal” regions during winter (Fig. 7b vs. Fig. 7c).
The annual deposition thickness of the Pearl River-derived sediments (Fig. 7d) reveals significant deposition within the “Proximal” region, with many areas exceeding 10 mm despite wintertime resuspension and redistribution. In the “Eastern” region, deposition reaches a magnitude of 0.1 mm, while the inner shelf west of the PRE (“Western” and “Gulf” regions) exhibits significantly greater accumulation. For instance, the deposition west of the Chuanshan Islands reached a magnitude of 0.5 mm. In the “Gulf” region, deposition is primarily concentrated in the northeastern part, extending southwestward along the 30–60 m isobaths. Sediments transported southwestward along the east coast of Hainan Island and into the “Distal” regions remain largely suspended in the water column due to the greater water depth, with limited deposition on the seabed.
3.3 Model sensitivity experiments: relative roles of physical drivers, sediment properties, and spin-up durations
Six sensitivity simulations, namely Exp 2–7 (NTS, NWS, NAS, NVS, DSV, and Cycle), were conducted (Table 2). As the latter three experiments do not impact hydrodynamics, we focus on presenting the seasonal mean differences in bottom shear stress between the Control run and the first three cases (NTS-Control, NWS-Control, NAS-Control) for both summer and winter (Fig. 8).
In the NTS (no tides) case, bottom shear stress is reduced relative to the Control run by a similar amount in both summer and winter due to the minimal seasonal variation in tidal intensity. This reduction primarily occurs in the PRE, around the Taiwan Bank, and near the Leizhou Peninsula (Fig. 8a–b). In contrast, in the NWS (no waves) case, the reduction in bottom shear stress is greater in winter than in summer, reflecting the intense seasonal variability of wind and wave activities (Figs. 3b, d–e, and 4a–f). Unlike the NTS case, the NWS-induced decrease occurs mainly in the nearshore areas outside the PRE, although similar declines are also found around the Taiwan Bank and along the eastern side of the Leizhou Peninsula (Fig. 8c–d). For the NAS (no ambient circulations) case, the impact on bottom stress is minimal compared to the NTS and NWS cases. The effect is almost negligible on the inner shelf at depths less than 100 m, with widespread impacts generally below 0.02 Pa. Some pronounced deviations are noted in localized deeper areas near the southern boundary of the domain (Fig. 8e–f). These deviations, likely arising from boundary condition effects, are situated far from the Pearl River-derived sediment distribution areas (Figs. 5–6). Consequently, they do not influence the dynamics of the Pearl River-derived sediment transport over the continental shelf (Fig. 8e–f).
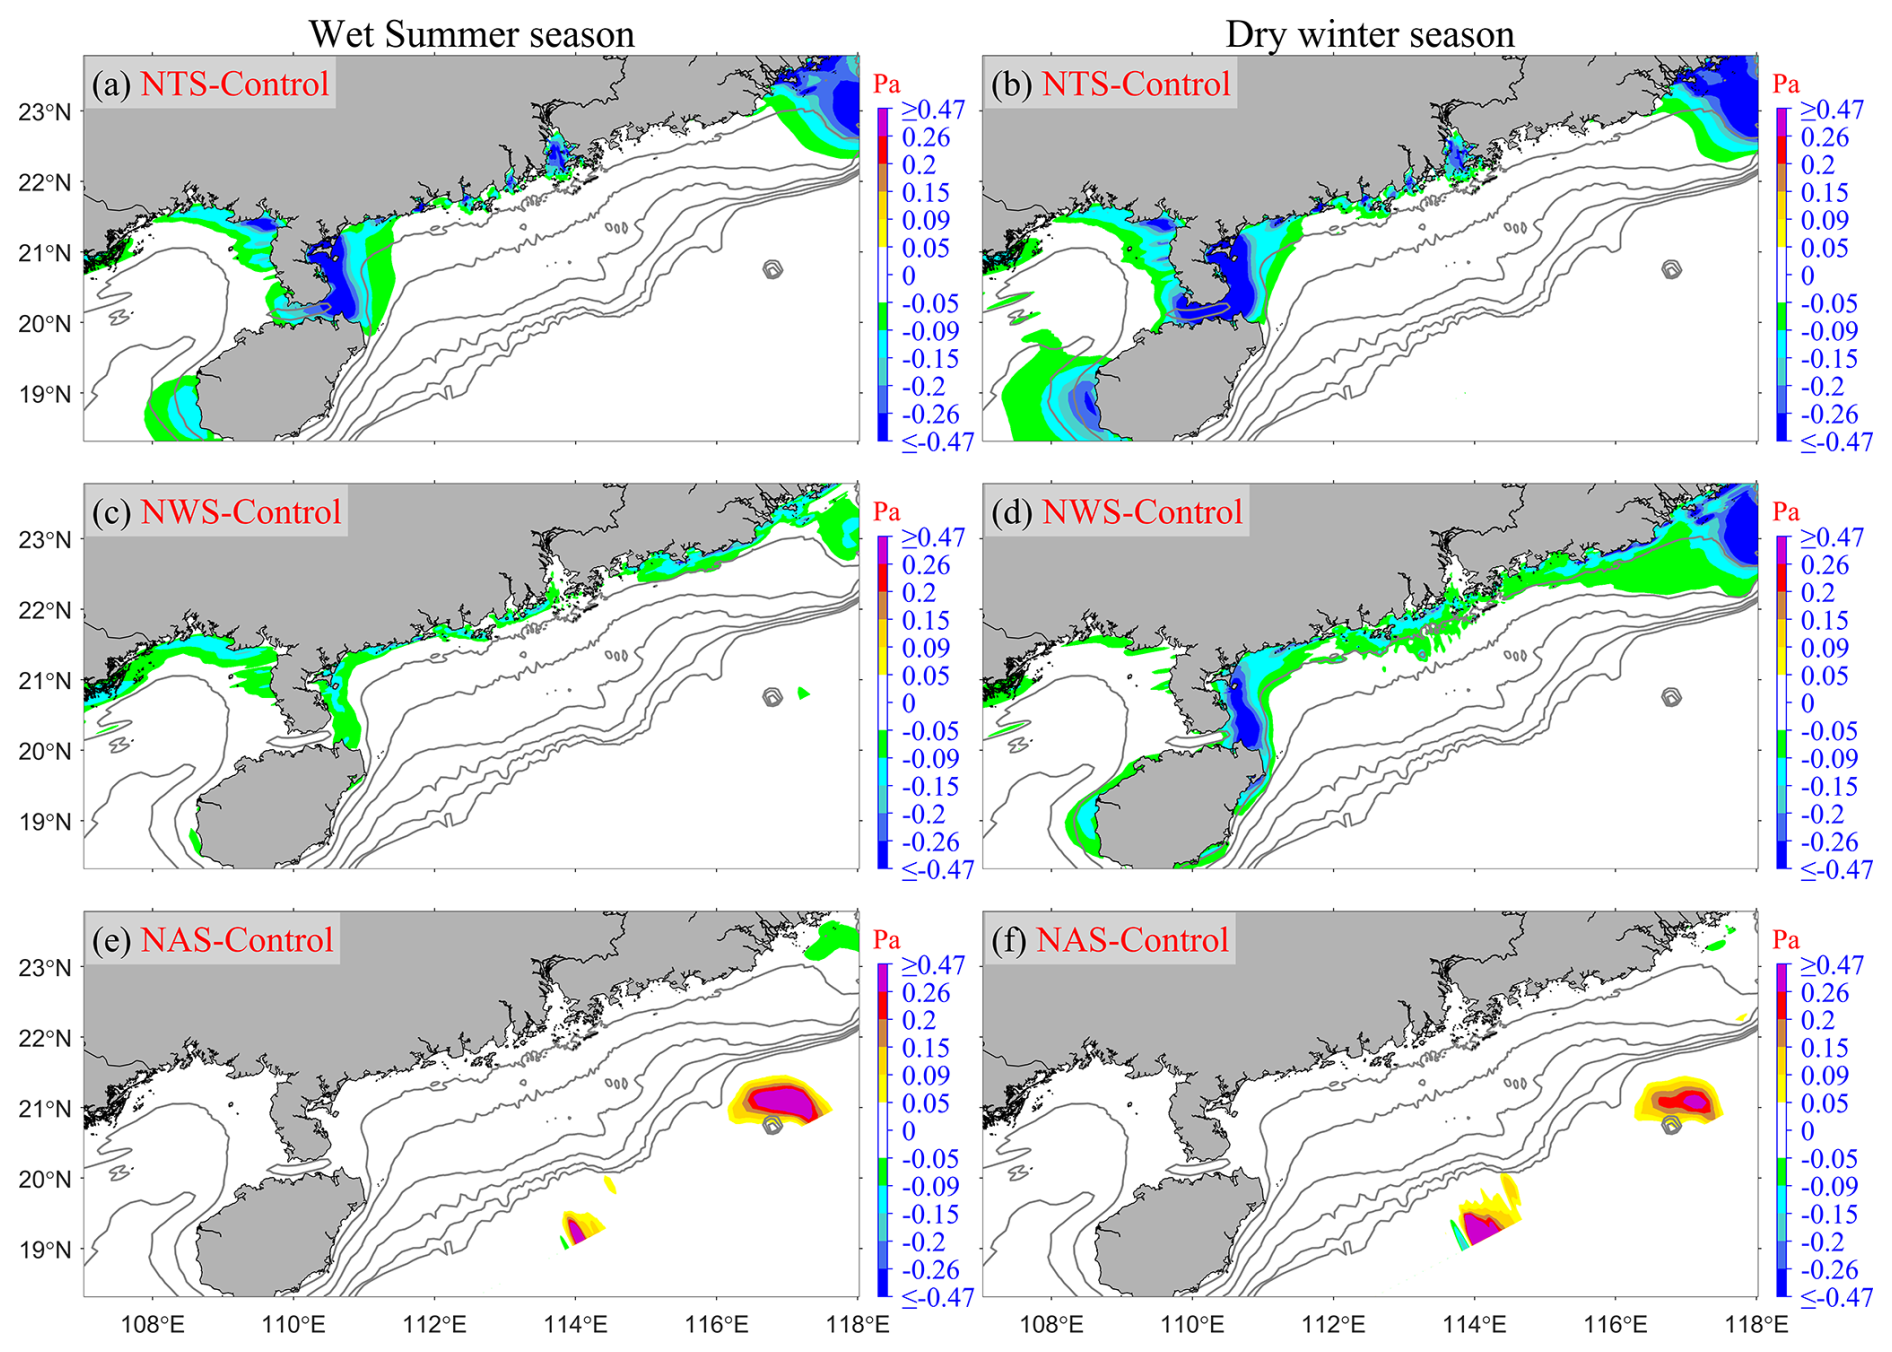
Figure 8The seasonal mean differences in bottom shear stress between the Control run and the following cases: (a–b) NTS (NTS minus Control), (c–d) NWS (NWS minus Control), and (e–f) NAS (NAS minus Control). The first column represents the wet summer season, while the second column corresponds to the dry winter season.
Then, we analyzed seasonal riverine sediment transport and deposition patterns (“riverine” means only the Pearl River-derived sediment, classes 4–5 in Table 1, as follows) by comparing the control run with six sensitivity experiments (NTS-Control, NWS-Control, NAS-Control, NVS-Control, DSV-Control, and Cycle-Control) (Figs. 9–11). The study focuses on the Pearl River-derived sediment dynamics, indicated by surface circulation and riverine SSC distribution patterns (Figs. 5 and 6). Specifically, Figs. 9 and 10 present seasonal surface currents and SSC differences between control and sensitivity runs, complemented by deposition pattern differences in Fig. 11.
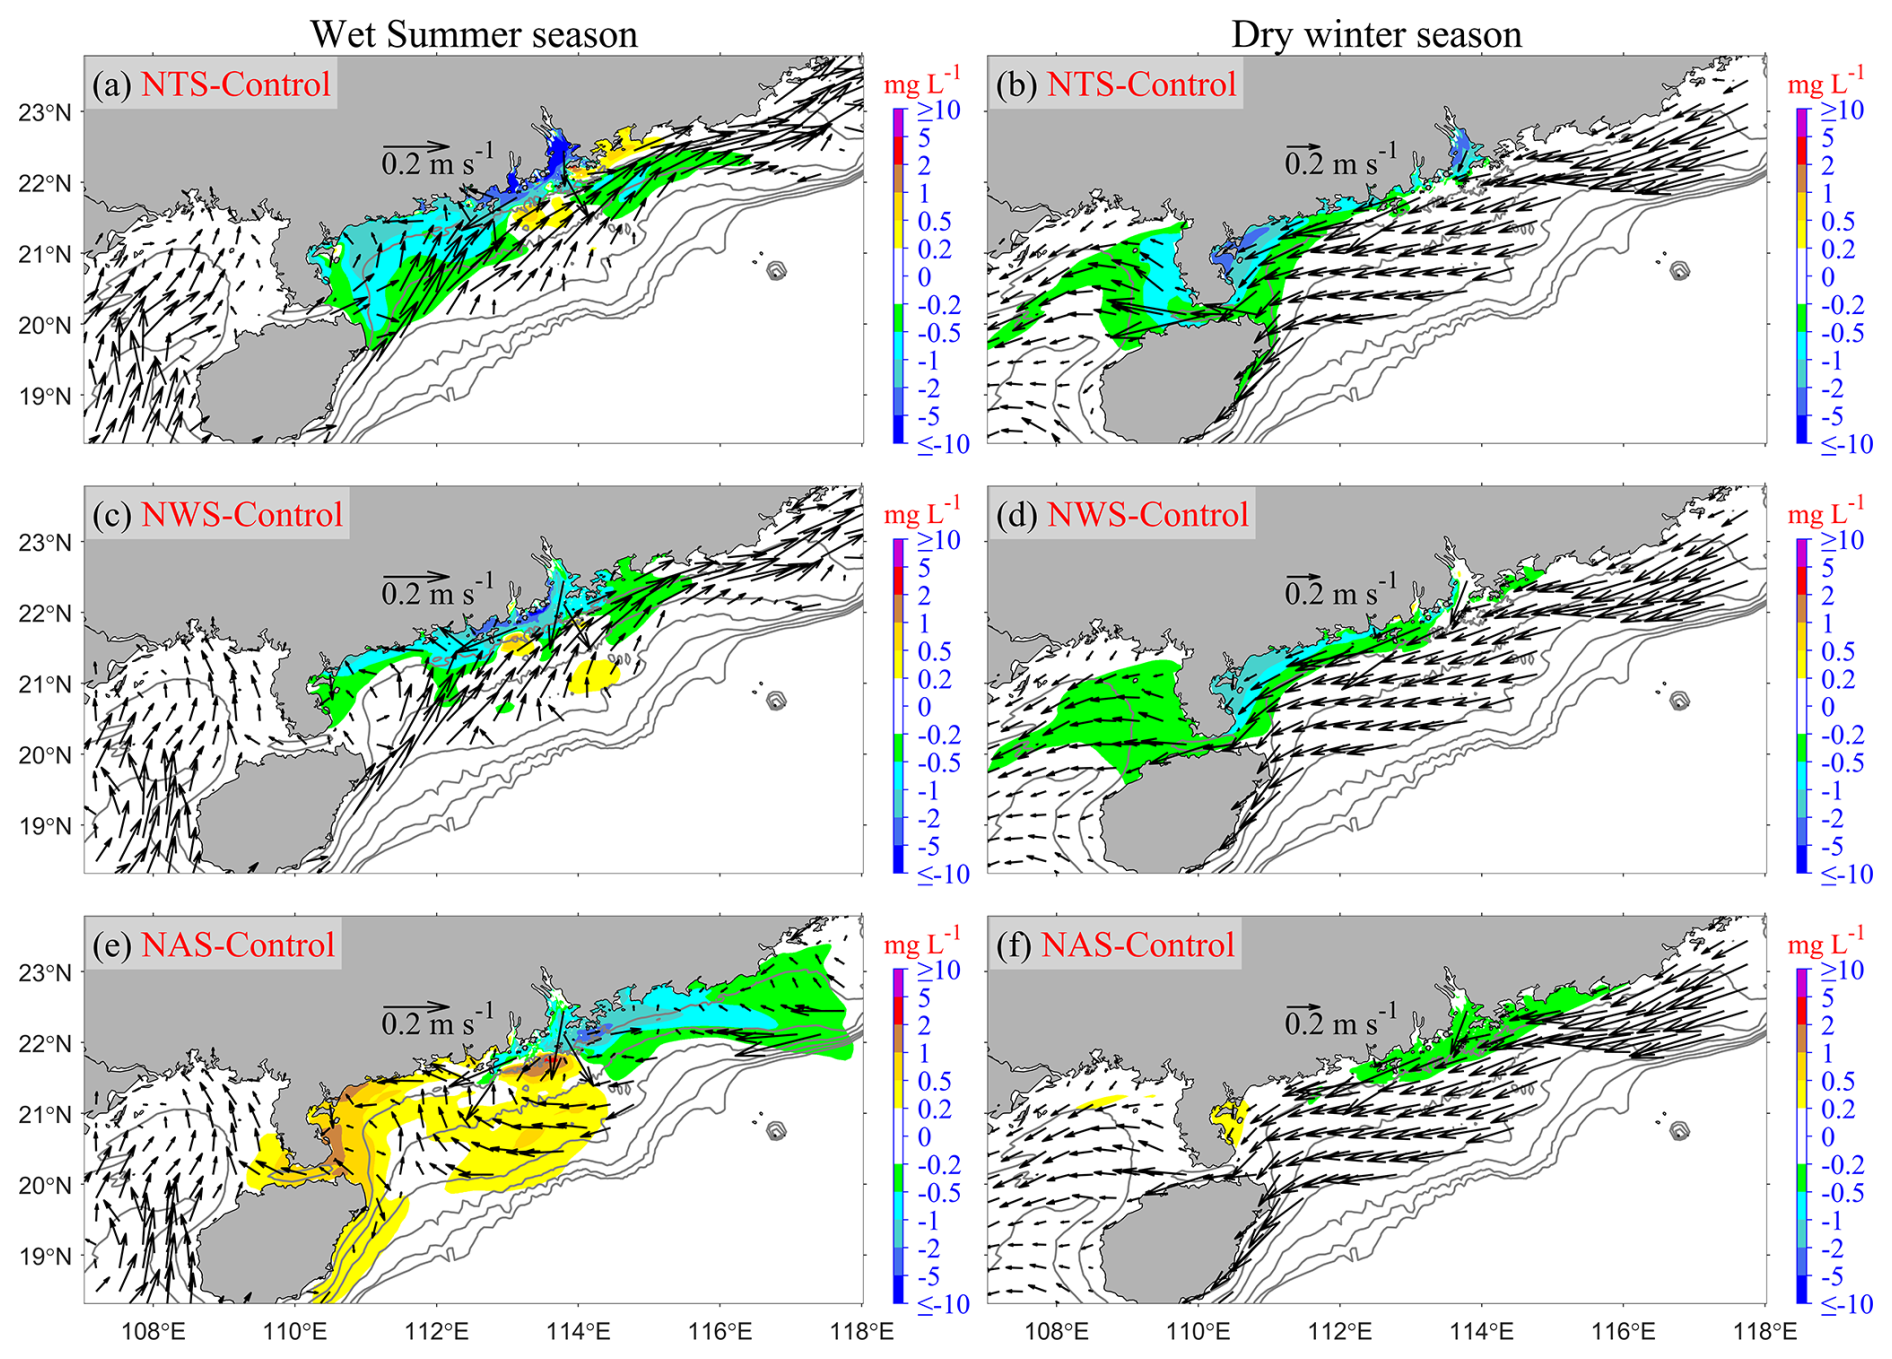
Figure 9Same as Fig. 8, but for seasonal mean differences in surface riverine SSC between the Control run and the following cases: (a–b) NTS-Control, (c–d) NWS-Control, and (e–f) NAS-Control. The first column represents the wet summer season, while the second column corresponds to the dry winter season. Vectors show the seasonal mean surface current fields in each experiment. Note that the riverine SSC values shown in the figure correspond to classes 4 and 5 as defined in Table 1.
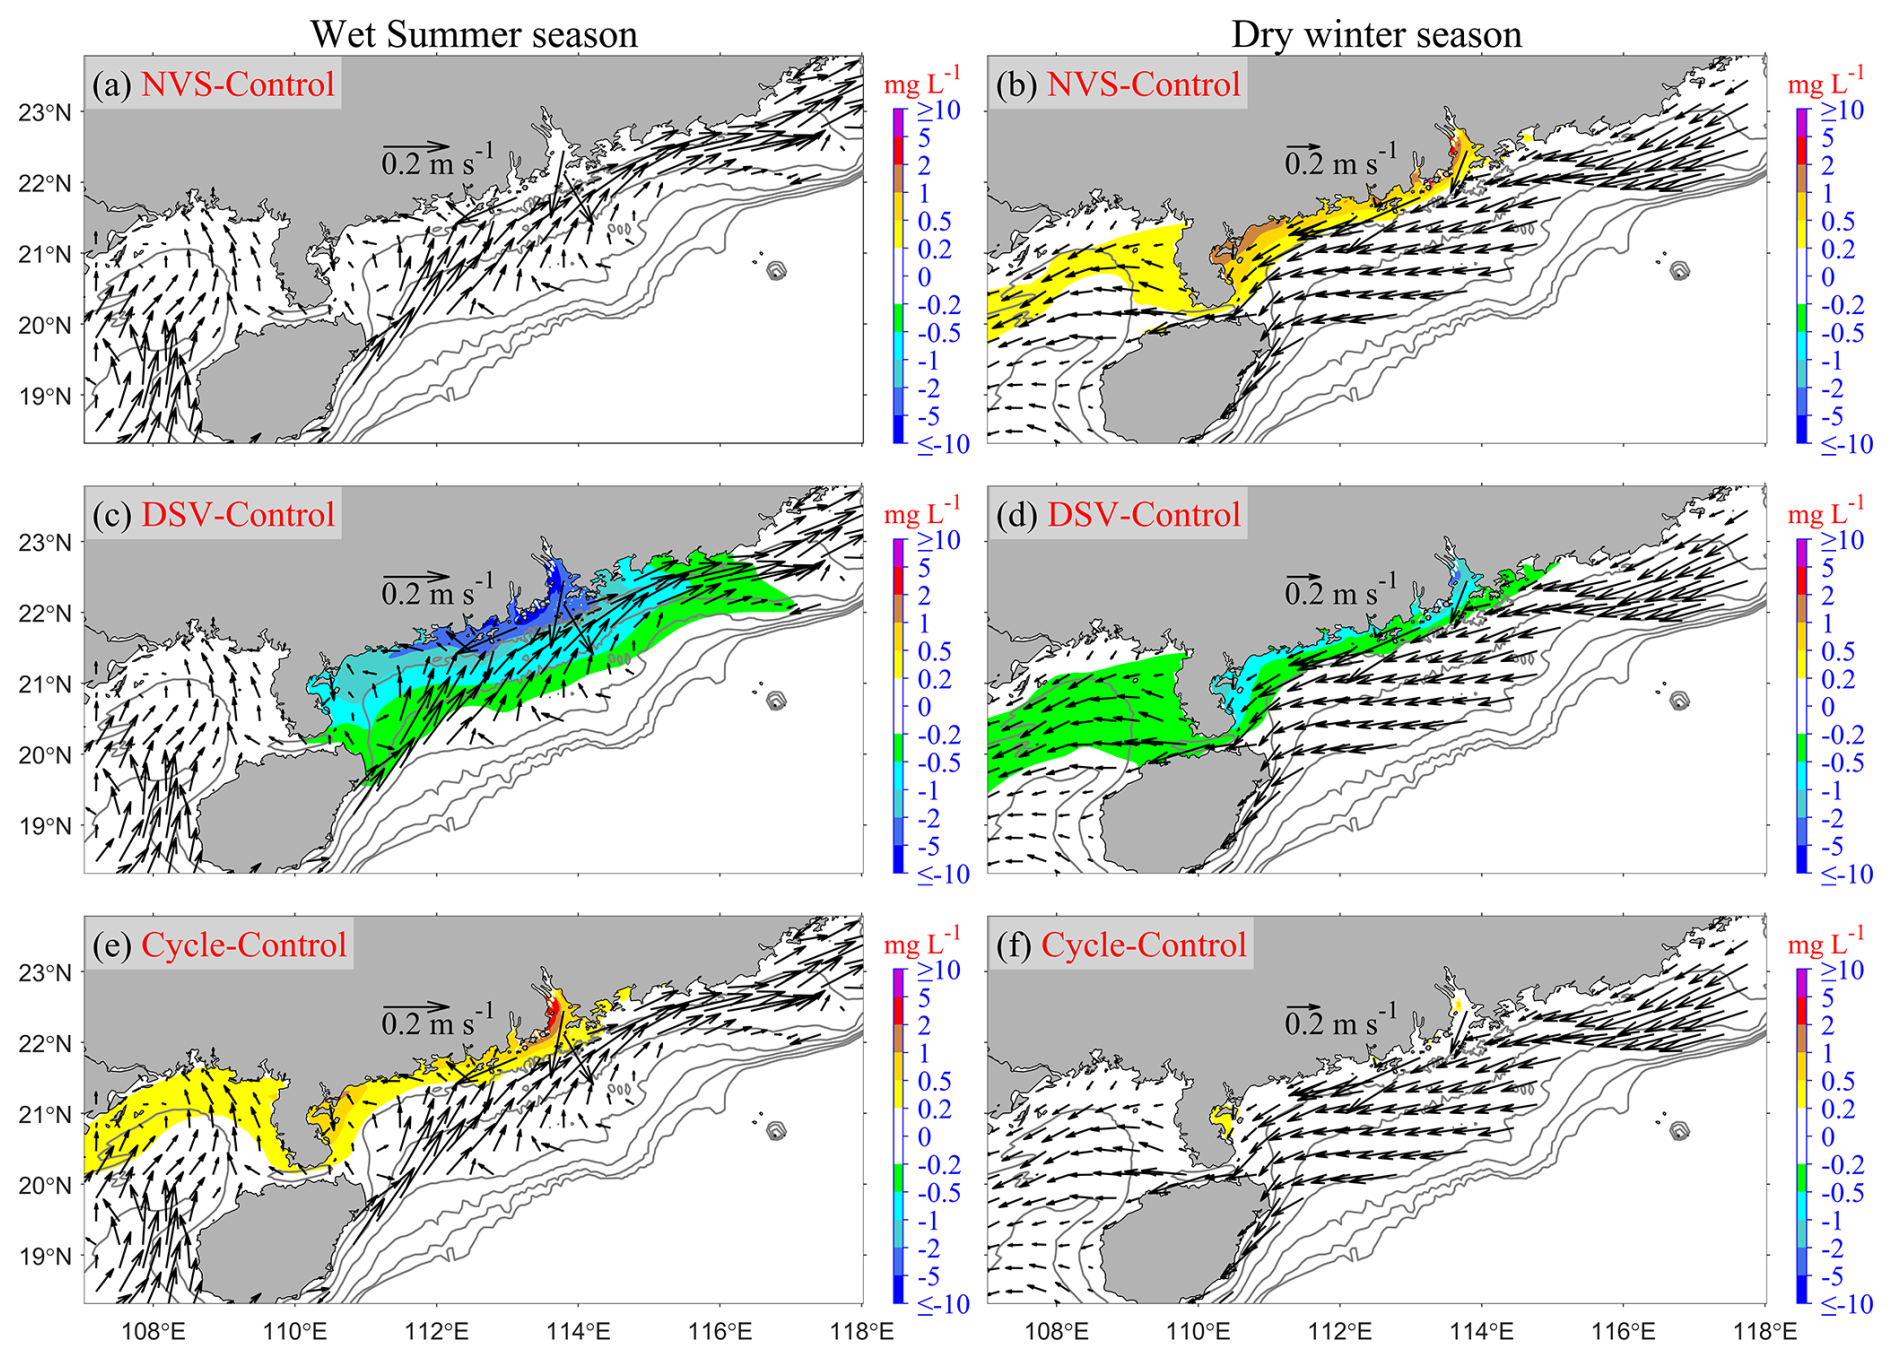
Figure 10Same as Fig. 9, but for the latter three experiments (NVS, DSV, Cycle). (a–b) NVS-Control, (c–d) DSV-Control, and (e–f) Cycle-Control.
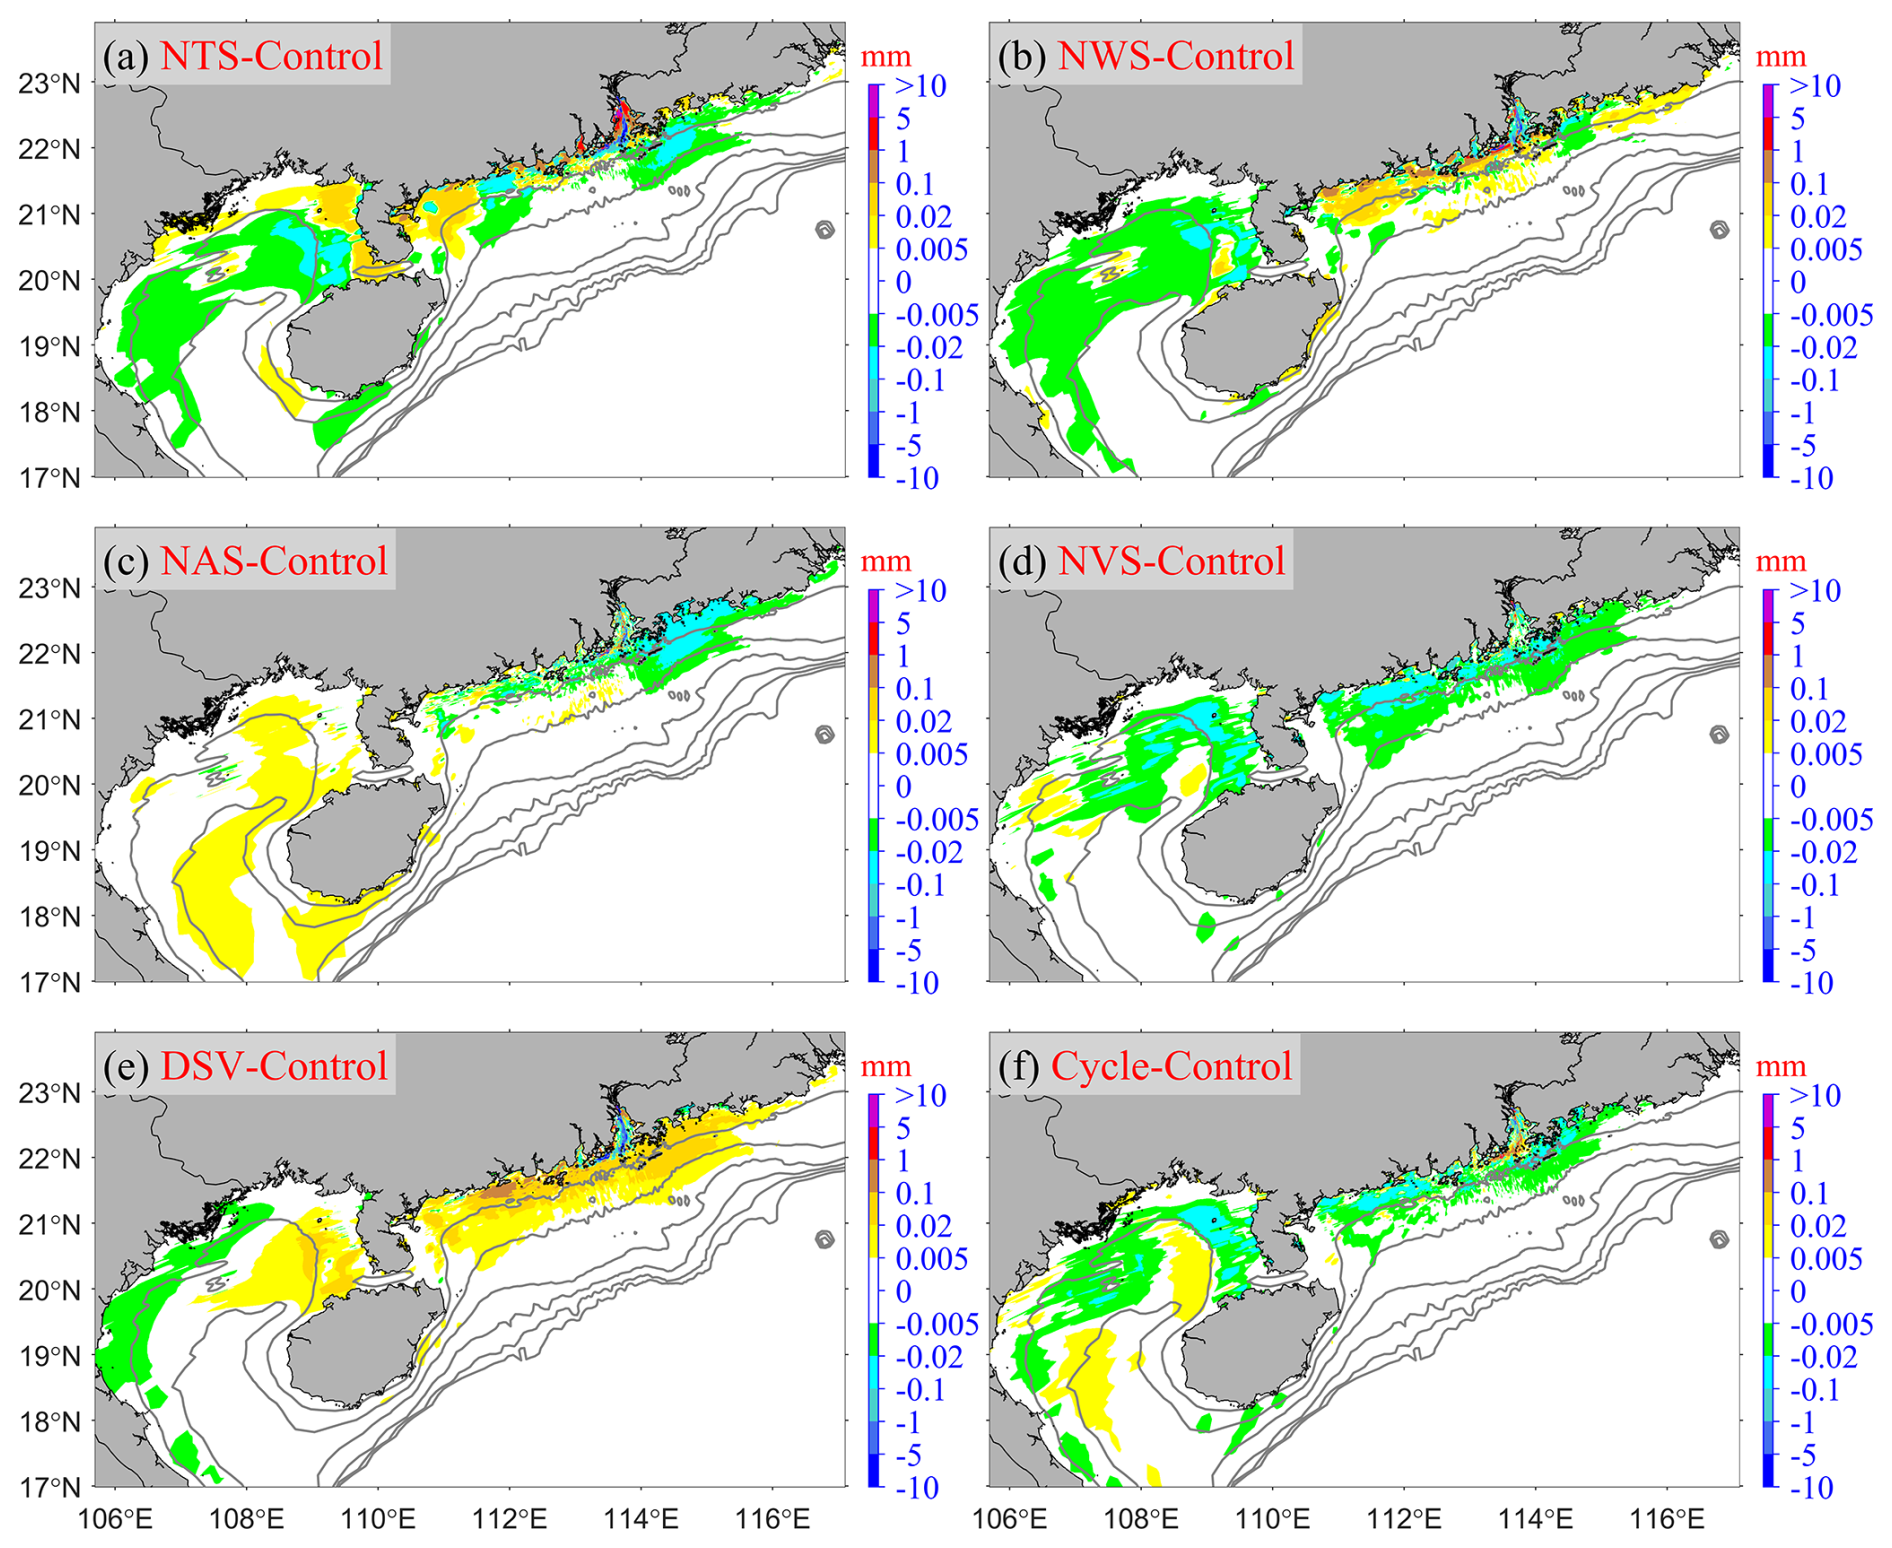
Figure 11The differences in annual deposition patterns of Pearl River-derived sediment (classes 4–5, Table 1) on the seabed between the Control run and the following cases: (a) NTS-Control, (b) NWS-Control, (c) NAS-Control, (d) NVS-Control, (e) DSV-Control, and (f) Cycle-Control.
Compared to the Control case, the NTS (no tides) case demonstrates that tides significantly enhance bottom stress (Fig. 8a–b), while have minimal impact on the mean circulation (Figs. 5a, 6a, and 9a–b), and their exclusion reduces bottom shear stress by over 0.2 Pa in the PRE and near the Leizhou Peninsula. Consequently, increased deposition of the Pearl River-derived sediments occurs inside the PRE, its adjacent areas, and on both sides of the Leizhou Peninsula (Fig. 11a). During summer, riverine SSC notably decreases in the ①–⑥ regions (Fig. 9a). This reduction pattern persists in winter, particularly in the PRE and on both sides of the Leizhou Peninsula (Fig. 9b).
Like the NTS, NWS (no waves) has a relatively minor impact on circulation (Figs. 5a, 6a, and 9c–d). However, NWS leads to more Pearl River-derived sediment being deposited in the nearshores of “Western” and “Eastern” regions (Fig. 11b). Consequently, the riverine SSC in summer is much lower in the downstream of the PRE and in ②–⑥ regions (Fig. 9c). This similar reduction pattern persists in the winter, but is slightly in more western regions (Fig. 9d).
For the NAS (no ambient circulations) case, the impact on bottom stress is minimal compared to the NTS and NWS cases. However, NAS has a relatively large impact on the mean circulation (Figs. 5a, 6a, and 9e–f). It mainly influences the summer circulation. Specifically, ignoring these factors would cause the relatively strong northeastward flow along the Guangdong coast to become very weak (Fig. 9e). When it comes to winter, the influence of NAS on circulation is relatively small. That is, in the absence of the background residual water level and residual circulation, due to the strong northeasterly winds in winter, the overall circulation is still southwestward (Fig. 9f). The decreased northeastward flow in summer leads to the Riverine SSC being scarcely transported to the vicinity of the “Eastern” and “Southeastern” regions. Consequently, the Riverine SSC there is decreased (Fig. 9e) and sediment deposition is significantly reduced (Fig. 11c). Most of the suspended Riverine sediment is transported southwestward, resulting in an increase in the Riverine SSC along the “Western” region. In winter, since most of the suspended Riverine sediment has been transported southwestward in summer, the Riverine SSC decreases compared to the Control run (Fig. 9f). Ultimately, NAS mainly causes a significant reduction in sediment deposition in the “Eastern” region, while sediment deposition increases in the “Gulf” and the “Distal” regions (Fig. 11c).
For the NVS (no variable τce) case, the summer conditions of NVS are precisely the same as those of the Control run (Fig. 10a). Since the critical shear stress for erosion in winter is lower than that in the Control run, this leads to an increase in re-suspension in the “Proximal”, “Western” and the “Gulf” regions, increasing Riverine SSC (Fig. 10b). Eventually, this causes a reduction in the deposition thickness of the Pearl River-derived sediments in these regions (Fig. 11d).
In the DSV (double ws) case, significant reductions occur in the primarily high SSC areas in the Control run in both summer and winter (Figs. 5c, 6c, 10c–d). The enhanced settling velocity results in an increased deposition of Pearl River-derived sediments along the Guangdong coastline (“Western” and “Eastern” regions) and the eastern “Gulf” region, accompanied by a reduced deposition thickness in the western “Gulf” region (Fig. 11e).
In the Cycle (re-run of the Control experiment initialized from its final state) case, the new riverine sediment input and its transport processes during the Cycle experiment are nearly identical to those in the Control run. Therefore, compared to the Control run, the Cycle experiment specifically focuses on examining the impact of the presence of pre-existing Pearl River-derived sediments on estimating the riverine SSC and the annual seabed riverine sediment budget in the second year. Consequently, during the summer period, the Cycle case experiences elevated riverine SSC in the primary depocenters identified in the Control run (Figs. 7d and 10e), while this effect is diminished by winter (Fig. 10f). Figure 11f thus captures the transport trends of pre-existing riverine sediments in the second year, demonstrating that riverine sediments deposited during the first year can be resuspended and transported further southwestward during the second year. This migration is driven by the annually averaged net alongshore coastal current, which remains predominantly directed toward the southwest. The current becomes stronger during the winter monsoon under the influence of prevailing northeasterly winds, whereas the opposing summer southerly winds are comparatively weaker, indicating a persistent southwestward sediment transport trend over multi-year timescales.
3.4 Modeled regional retention budgets in sensitivity experiments
Finally, we analyze the impact of various factors on the annual riverine sediment retention budget across different regions. Specifically, Fig. 12 illustrates the annual riverine sediment retention budget in various regions under six sensitivity simulations, namely Exp 2–7 (including NTS, NWS, NAS, NVS, DSV, and Cycle). It should be noted that the retention percentages budget and their variations discussed hereinafter are all relative to the annual riverine sediment load (Fig. 3a).
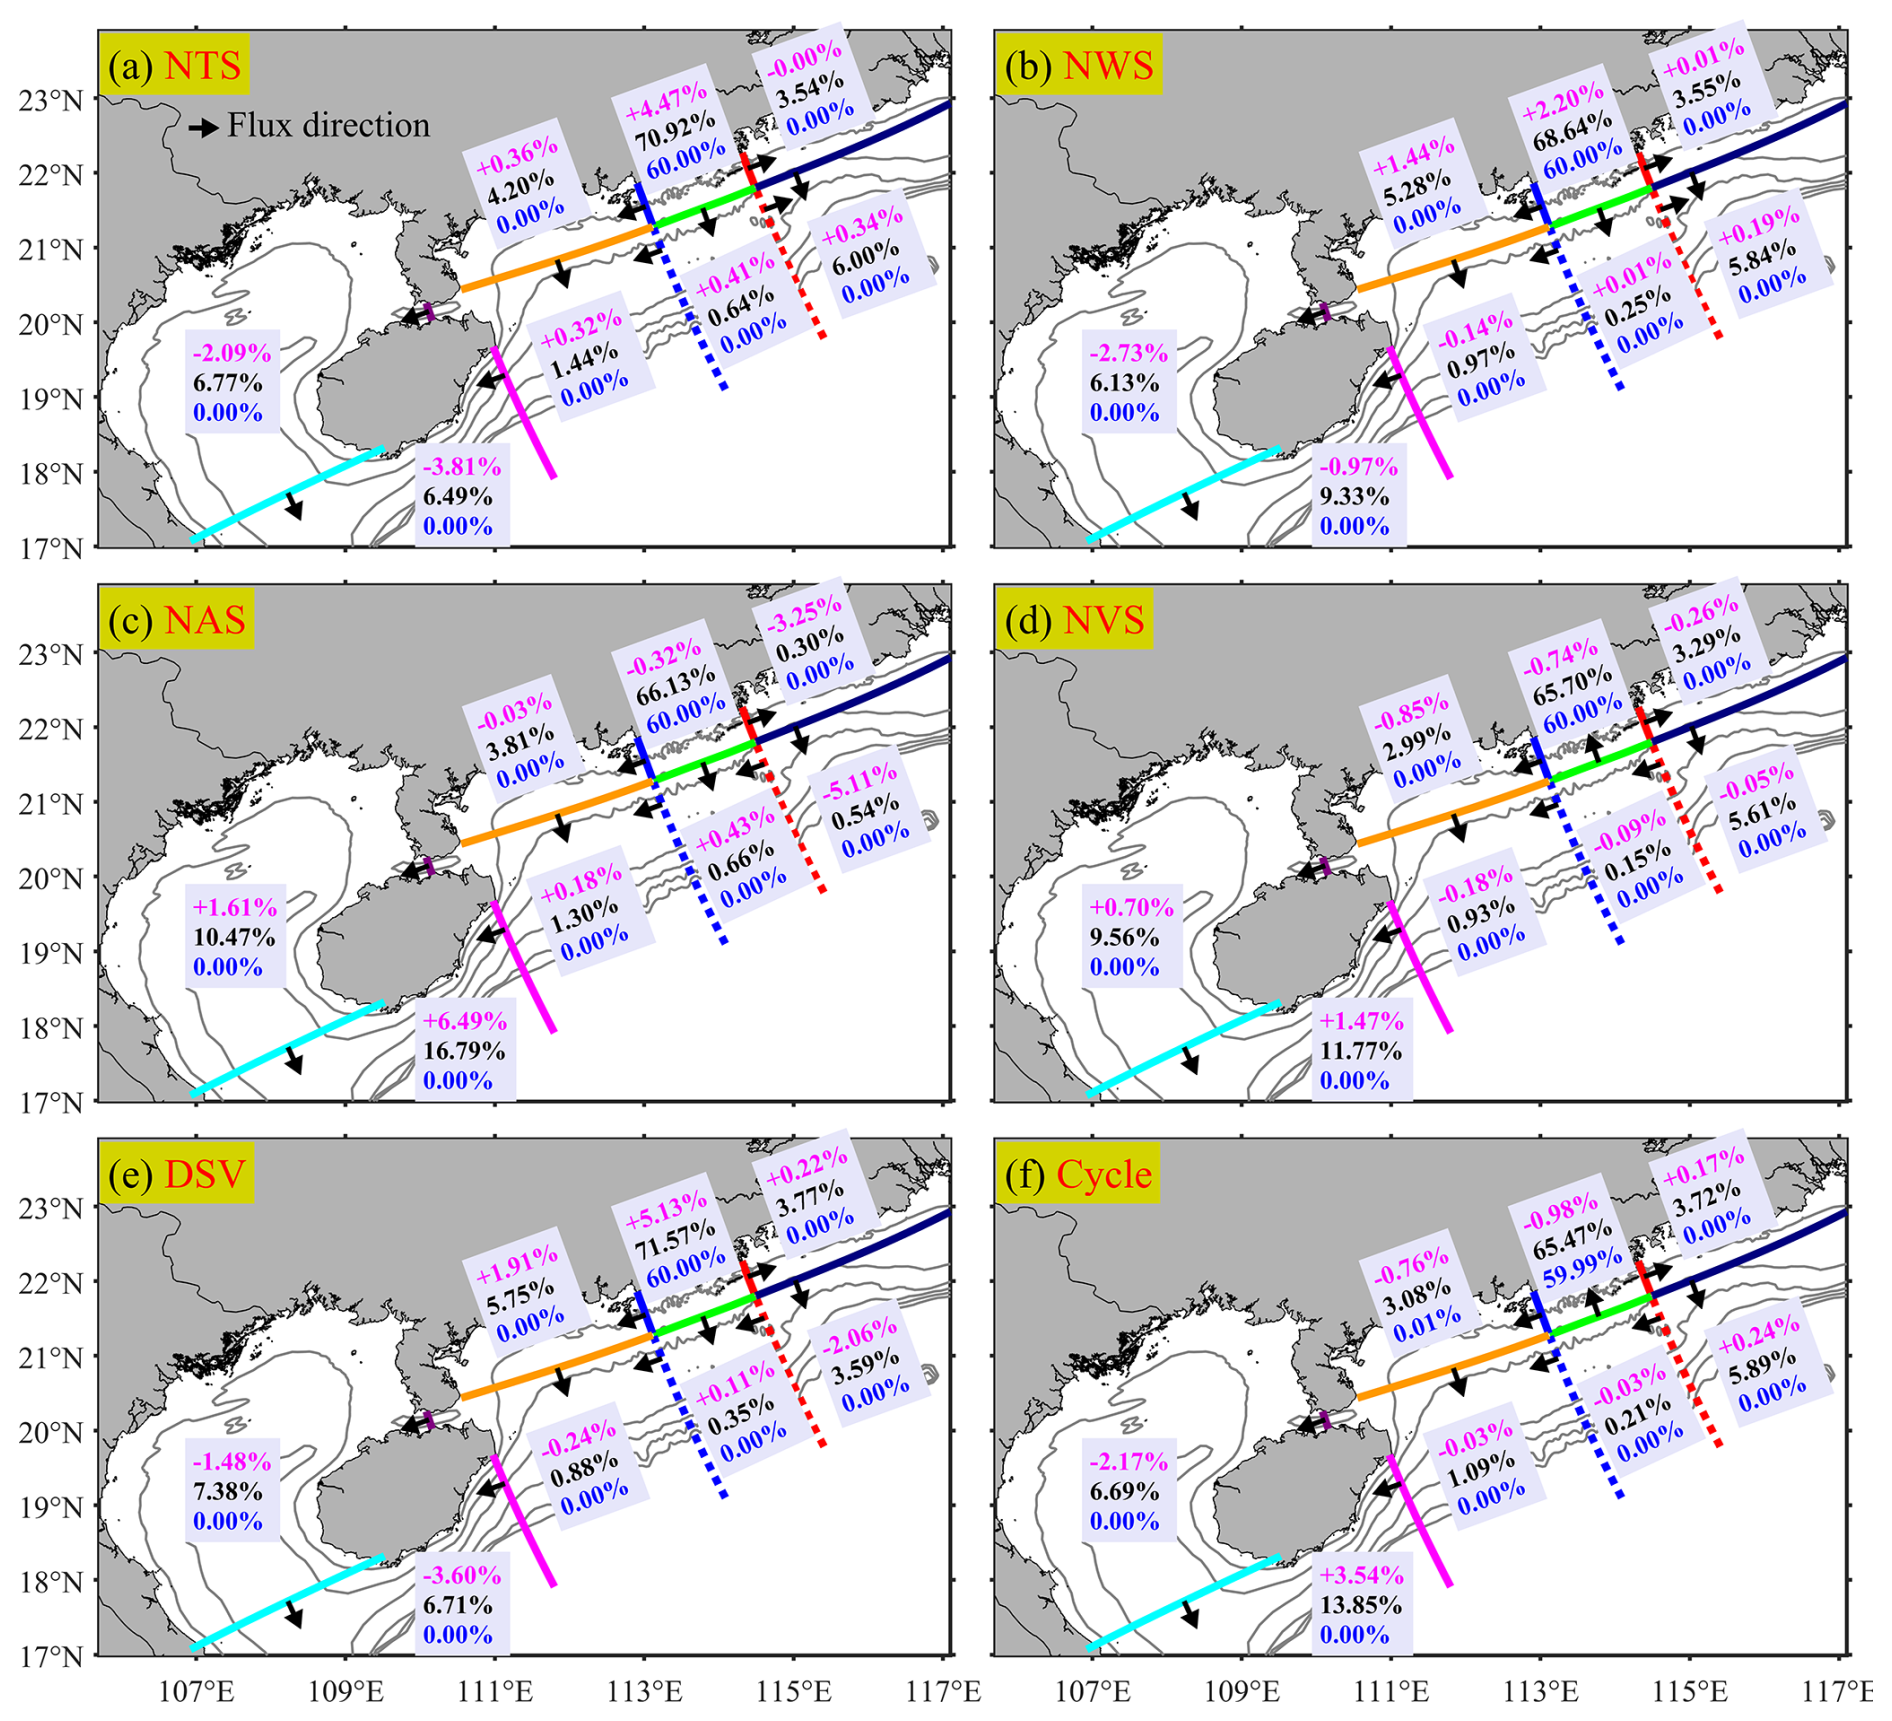
Figure 12Same as Fig. 7c, but for the other six cases: (a) NTS, (b) NWS, (c) NAS, (d) NVS, (e) DSV, and (f) Cycle, respectively. All percentages shown in the figure are expressed relative to the annual riverine sediment load (see Fig. 3a). Magenta values denote the differences in retention percentage of riverine sediments (Classes 4 and 5; Table 1) between the Control run and each sensitivity case. Black values represent the combined retention of Classes 4 + 5, while blue values indicate Class 5 alone. To obtain the retention percentage for Class 4, simply subtract the Class 5 percentage (blue) from the combined Classes 4 + 5 percentage (black)
As shown in Fig. 12, tides and sediment settling velocity have the most significant impact on the retention in the “Proximal” region. In the NTS case and the DSV case, the retention in the “Proximal” region is 70.92 % and 71.57 %, respectively (Fig. 12a and e), which is higher than 66.45 % in the Control run (Fig. 7c). This indicates that ignoring tides will cause the “Proximal” region to capture more riverine sediments, and a larger settling velocity will result in more riverine sediments being retained within the “Proximal” region. In these two cases, compared with the Control run, the retention in the “Gulf” and “Distal” regions decreases. Meanwhile, the DSV case causes the greatest increase in retention in the “Western” region, with an increase of +1.91 %.
Furthermore, the NWS also leads to a 2.2 % increase in retention in the “Proximal” region (Fig. 12b), which is lower than that in the NTS case. This shows that tides dominate resuspension versus deposition in the “Proximal” region more than waves do. However, for the “Western” region, compared with the NTS case, the NWS causes a greater increase in retention, indicating that waves dominate the resuspension of Pearl River-derived sediments in these nearshore areas more than tides do.
For the “Eastern” and “Southeastern” regions, NAS brings about the most dramatic changes, the retention of Pearl River-derived sediments in these regions drops from 9.1 % to 0.84 % compared to the Control run (Fig. 12c). Meanwhile, ignoring these background circulations results in a substantial increase in the retention in the “Distal” region, with an increase of 6.49 %.
The NVS case leads to a decrease in the retention of the Pearl River-derived sediments in ①–⑥ regions compared to the Control run. The reduction ranges from −0.05 % to −0.85 % (Fig. 12d), which in turn causes the retention in the “Gulf” and “Distal” regions to increase by 0.7 % and 1.47 %, respectively. Overall, compared with scenarios that ignore physical drivers and alter sediment settling velocity (NTS, NWS, NAS, and DSV), the NVS scenario has a relatively smaller impact on the retention of the Pearl River-derived sediments.
Finally, in the Cycle case, to isolate the pre-existing Pearl River-derived sediments, the initial retentions (the end conditions of the Control run on 31 March 2018) were subtracted before calculating the retention in the Cycle case (Fig. 12f). The retention of Pearl River-derived sediments in ①–⑥ regions shows little variation, with values ranging from −0.98 % to +0.24 % compared to the Control run (Fig. 12f). The most significant changes are the decreases and increases in retention in the “Gulf” and “Distal” regions, which are −2.17 % and +3.54 %, respectively. This demonstrates the long-term trend of southwestward transport of Pearl River-derived sediments on the shelf (relative to the Control run).
4.1 Fidelity of our model results
We simulated the suspension, transport, and deposition of the Pearl River-derived sediment over the shelf from 1 April 2017 to 31 March 2018. Comparisons with multiple types of observations demonstrated that the model simulation reasonably well captured the regional patterns and temporal variability of water levels (Figs. S2–S4), surface waves (Figs. S5–S6), estuarine and shelf currents (Figs. S8a–b and S9–S10), salinity and temperature (Figs. S7a–b and S8c–d), and SSC (Figs. S7c and S8e–f). Even though we have made substantial efforts to collect observational data and conduct calibration and validation, the large scope of the study area and the fact that the study covers an entire year mean that there are some inherent challenges to achieving a complete analysis. The real-world situation is extremely complex, and these validations may still not be sufficient to address all issues (such as the accurate parameterization of sediment characteristics and their seasonal variations, as well as the proportion of slow-settling fine grains and flocculated flocs in riverine sediments). Therefore, in this section, we discuss the fidelity of our results.
Studies have demonstrated a seasonal dependence of sediment critical shear stress (Xu et al., 2014; Briggs et al., 2015). On the Louisiana shelf, seabed erodibility is controlled by grain size, sediment age, proximity to river sources, bioturbation, and flood deposits, and is higher during the wet season than the dry season (Xu et al., 2014). It is also linked to seasonal hypoxia: sites experiencing hypoxic (hypoxia greater than 75 % of the time, hypoxia defined as <2 mg O2 L−1) conditions exhibit greater erodibility, whereas the normoxic (hypoxia less than 25 % of the time) site shows the lowest erodibility (Briggs et al., 2015). These findings imply that sediment models should incorporate seasonal variations in critical shear stress, parameterized using field observations or seasonal sampling data. Similarly, in the PRE, field observations, laboratory experiments, and numerical sensitivity analyses have shown that the critical shear stress for erosion of sediments in the PRE is higher in winter/dry season than in summer/wet season (Dong et al., 2020; Cao et al., 2025). The summer period in the PRE also coincides with seasonal hypoxia (Cui et al., 2018, 2022), which likely contributes to this seasonal variation in erodibility. Therefore, in most model experiments (except NVS), we accounted for seasonal variation in the critical shear stress for erosion by increasing its value during winter. This adjustment was also implemented throughout the 15-month spin-up period preceding all model runs, with the spin-up using the same forcing conditions and settings as the Control run to ensure consistency.
When the seasonal variation of critical shear stress for erosion is omitted (NVS case), the model results suggest a reduced retention of Pearl River-derived sediments in ①–⑥ regions during winter, alongside an increased retention in the “Gulf” and “Distal” regions. However, these differences are relatively small in magnitude compared to the annual load (Fig. 12d). Thus, accounting for seasonal variations in critical shear stress for erosion has a limited influence on the annual-scale retention patterns. The dispersal distance of fluvial sediments on continental shelves is strongly influenced by settling velocity (Harris et al., 2008). For example, Apennine-derived sediments, characterized by lower settling velocities, travel farther before deposition than Po River sediments, which are predominantly flocculated and settle more rapidly (Fox et al., 2004; Harris et al., 2008). Likewise, our results suggest that selecting an appropriate settling velocity parameter exerts a greater control on sediment dispersal patterns than accounting for seasonal variations in critical shear stress for erosion (Fig. 12d vs. Fig. 12e). The results of the DSV case show that a sediment settling velocity twice that of the Control run leads to the highest retention in the “Proximal” and “Western” regions across all experiments (Fig. 12e), while reducing the retention in the “Distal” region (Fig. 12e). Although the settling velocity we adopted is based on previous studies (Xia et al., 2004) and model calibrations (Figs. S7c and S8e–f), with due consideration given to the presence of slow-settling single fine grains and high-settling flocs in riverine sediments, certain discrepancies might still exist in this setting. These discrepancies are contingent upon the actual magnitude of the low settling velocity of fine grains. In almost all cases, all flocs in the model are retained in the “Proximal” region (Fig. 12a–e), and only in the Cycle case, flocs accounting for 0.01 % of the annual load are retained in the “Western” region west of the “Proximal” region (Fig. 12f, blue values), indicating that high-settling flocs hardly leave the “Proximal” region. This finding shows close alignment with, yet exhibits minor distinctions from, the observed patterns in the Mekong Shelf (Xue et al., 2012). Xue et al. (2012) found that while the preponderance of flocs is deposited on the Mekong delta front precisely at the river mouth, a quantity equivalent to 1.6 % of the annual riverine sediment load of flocs is deposited on the downdrift delta front further downstream from the river mouth. This is mainly because the estuarine bay of the PRE is wider and there are numerous islands near the river mouth. The overwhelming majority of flocs are either deposited within the estuarine bay or captured by the surrounding islands. In conclusion, our results are affected by the settling velocity of fine grains. More field observations and studies on model parameterization regarding the settling velocity of fine grains are urgently needed.
As previously noted, we classified riverine sediments into two categories based on established research: 40 % slow-settling fine grains and 60 % fast-settling flocs. This 40 %/60 % distribution is consistent with the setting from earlier studies (Zhang et al., 2019; Zhang et al., 2021), as summarized in Table 1. While such assumptions are necessary for modeling purposes, the actual composition of riverine sediments in natural environments remains uncertain. To evaluate the sensitivity of our results to this uncertainty, we conducted a conceptual analysis. If all riverine sediments were hypothetically composed entirely of fast-settling flocs, they would be completely retained near the source, with no transport to the “Gulf” region. However, this scenario is inconsistent with the radionuclide measurements obtained from “Gulf” region surface sediment samples (Lin et al., 2020). On the other hand, if all sediments were considered slow-settling fine grains, only 16.13 % would be retained in “Proximal” region under normal conditions (or 28.9 % in the DSV case), a result that diverges significantly from established research.
Chen et al. (2023) analyzed high-resolution seismic data and demonstrated that approximately 35 % of the Pearl River-derived sediment has been transported to offshore shelf areas over the past 6500 years, suggesting that 65 % was deposited proximally. Our findings are in close agreement, indicating that 66.45 % of the Pearl River sediments are retained in the proximal region, while 33.55 % are transported elsewhere. This consistency with Chen et al. (2023) supports the validity of our approach. Taken together, these analyses confirm that the 40 %/60 % fraction assumption is a reasonable approximation for modeling purposes.
Furthermore, our model results demonstrate reasonable reliability in other aspects. Liu et al. (2009) and Ge et al. (2014) using chirp sonar profiles from the inner shelf of the South China Sea combined with Zong et al. (2009)'s onshore borehole data, found that the thickness of Pearl River-derived sediments within the PRE since the Holocene is over 20 m, while the mud thickness in the shallow waters west of the Chuanshan Islands (see Fig. 1) is approximately 5–10 m. Our calculated annual sediment thicknesses for these two regions are approximately 2 and 0.3 mm (Fig. 7d), respectively. Given our model's annual riverine sediment load of 34.52 Mt, which has been significantly reduced due to recent human activities (Dai et al., 2008), compared to the widely accepted Holocene average of around 90 Mt (Liu et al., 2009), we estimate the total sediment thickness over the past 7500 years to be roughly 39 and 6 m for these depositional zones, consistent with previous studies (Liu et al., 2009; Zong et al., 2009).
Furthermore, our results reveal that 8.86 % of the riverine sediment derived from the Pearl River is transported to the “Gulf” region (Fig. 7c), primarily during the winter season (Fig. 7b). This finding is not only consistent with the earlier speculation proposed by Ge et al. (2014) but also supplements the conclusions drawn by Lin et al. (2020). From a hydrodynamic perspective, Shi et al. (2002) found that the net flux of currents in the Qiongzhou Strait is westward throughout the year. Our results for both wet summer (Fig. 5a–b) and dry winter currents (Fig. 6a–b) in the Qiongzhou Strait are consistent with Shi et al. (2002). This westward flow contributes to the westward transport of Pearl River sediment to the “Gulf” region.
4.2 Implications of our model results
The fate of sediment dispersed from the river into the coastal ocean involves at least four processes: supply via buoyant plumes; initial deposition; resuspension and transport by marine processes; and long-term net accumulation (Wright and Nittrouer, 1995). In general, a significant proportion of river sediment tends to deposit in the estuary and its vicinity (Walsh and Nittrouer, 2009; Hanebuth et al., 2015).
Walsh and Nittrouer (2009) present a hierarchical decision tree designed to predict the marine dispersal system at a river mouth based on fundamental oceanographic and morphological characteristics. Within this framework, riverine sediment deposition is characterized using key factors, including riverine sediment discharge (greater or less than 2 Mt), shelf width (greater or less than 12 km), and wave and tidal range conditions (greater or less than 2 m).
We aim to analyze our PRE simulation results using the framework established by Walsh and Nittrouer (2009). Although the Pearl River's annual riverine sediment discharge (Fig. 2a) exceeds the Walsh and Nittrouer (2009)'s 2 Mt yr−1 threshold, most of the sediment still remains deposited near the estuary (Fig. 7c), indicating an estuarine accumulation-dominated (EAD) system. This behavior deviates from the predictions of the hierarchical decision tree proposed by Walsh and Nittrouer (2009). Outside the estuary, the continental shelf, spanning 200–220 km in width (Liu et al., 2014), significantly exceeds Walsh and Nittrouer (2009)'s 12 km threshold. As a result, most escaped riverine sediments tend to accumulate on the shelf rather than being captured by submarine canyons (Fig. 7c–d). This wide, shallow shelf promotes sediment deposition and limits the direct transport of fine sediments into deeper waters (Walsh and Nittrouer, 2009). Subsequently, given that the annual mean tidal range (Chen et al., 2016; Gong et al., 2018b) and Hsig (Fig. 3d) near the PRE are both below the 2 m threshold established by Walsh and Nittrouer (2009), the majority of escaped riverine sediments are predominantly deposited in the proximal depo-center. Our findings demonstrate that most of our outcomes are consistent with the hierarchical decision tree proposed by Walsh and Nittrouer (2009), except for the application of the 2 Mt yr−1 threshold for riverine sediment discharge. This phenomenon can primarily be attributed to the unique geomorphological characteristics of the PRE, including its broad mouth (Figs. 1 and S1), extensive accommodation space encompassing approximately 2385 km2 of water area (Wu et al., 2018), the presence and sheltering effect of numerous adjacent islands (Li et al., 2024b), and the division of fluvial sediment discharge through eight distinct outlets (Hu et al., 2011).
The monsoonal nature of the northern SCS (Fig. 4a–b) induces pronounced seasonal variations in Pearl River-derived sediment transport and deposition (Figs. 5 and 6). During the summer wet season, the Pearl River delivers approximately 95.17 % of its annual sediment load to the PRE and the adjacent shelf (Fig. 7a) under relatively calm wind and wave conditions (first column of Fig. 4), leading to predominant proximal deposition (Fig. 5f). In contrast, the winter dry season is characterized by strong northeasterly monsoon winds that generate high-energy waves (second column of Fig. 4), significantly increasing bottom shear stress (Fig. 4g–h). This process resuspends previously deposited sediments and facilitates their redistribution, particularly toward regions such as the “Gulf” region (Fig. 6f).
The PRE exhibits distinctive geomorphological features, yet dispersal of its fine-grained sediment transport on the continental shelf conforms to general patterns observed offshore of other monsoon-influenced estuarine systems. Similar multiple-stage sediment delivery and dispersal mechanisms have been documented offshore of various major estuaries and their adjacent shelves, including the Yellow River Shelf (Bian et al., 2013; Zeng et al., 2015), Changjiang River Shelf (Zeng et al., 2015), and Mekong River Shelf (Xue et al., 2012; Eidam et al., 2017), demonstrating comparable sedimentary processes under monsoon climatic influences. In these systems, sediment transport is not confined to a single process but rather occurs in stages, influenced by seasonal variations in hydrodynamic conditions. Like the PRE Shelf, the Mekong Shelf experiences distinct phases of sediment deposition, with fine sediments being delivered during periods of high river discharge and then redistributed by waves and tidal forces, particularly during monsoonal shifts (Xue et al., 2012; Eidam et al., 2017). These complex patterns highlight the interplay between riverine inputs, coastal morphology, and oceanographic processes in shaping sediment dynamics.
These sediment delivery patterns have implications beyond sediment fate, particularly for carbon cycling. Sediment deposition in coastal and shelf areas plays a significant role in trapping organic carbon, influencing long-term carbon burial rates (LaRowe et al., 2020). Sediment dynamics directly influence the fate of organic carbon (OC) in marine environments, where sediments function as both a sink and a source of OC, playing a pivotal role in global carbon cycling (Repasch et al., 2021). The multiple-step transport mechanisms can lead to varying carbon storage locations, affecting the sequestration potential of these systems. Additionally, resuspension and redistribution of sediments, especially during high-energy events, may expose previously buried organic material, leading to carbon remineralization and influencing coastal nutrient cycles and ecosystem health (Ståhlberg et al., 2006; Moriarty et al., 2018). Therefore, understanding these patterns is crucial for assessing the broader impacts on carbon cycling and coastal biogeochemical processes.
4.3 Limitations and future work
This study focuses on analyzing simulation results from a typical year, encompassing both wet and dry seasons from 2017 to 2018, to understand the seasonal variations and annual patterns of suspension, transport, and deposition of sediment in the PRE and adjacent shelf. However, it's essential to recognize that the long-term sediment transport and deposition dynamics in the Pearl River are influenced by numerous complex factors. These include changes in sea level and coastal line (Church and White, 2006; Harff et al., 2010; Hong et al., 2020; Lin et al., 2022; Ma et al., 2023), alterations in wind field and precipitation (Ning and Qian, 2009; Young et al., 2011), natural sedimentation within the Pearl River Delta (Wu et al., 2010), modifications in sediment load and underwater volume of the estuary caused by anthropogenic impact (Wu et al., 2014, 2018; Lin et al., 2022), interannual variations of the shelf circulations (Liu et al., 2020; Deng et al., 2022) and Kuroshio intrusions (Caruso et al., 2006; Nan et al., 2015; Sun et al., 2020). Therefore, while this study sheds light on seasonal and annual timescale patterns, it cannot fully represent the short or long-term transport and deposition trends of the Pearl River sediment. Yet for many shelf systems, a lot of sediment transport happens during short-lived events such as hurricanes (Xu et al., 2016; Warner et al., 2017; Georgiou et al., 2024). Consideration of the episodicity of transport would be helpful for future studies (Xu et al., 2016; Warner et al., 2017; Georgiou et al., 2024).
Additionally, it's important to note that this article primarily focuses on the fate of the Pearl River sediment on the inner shelf. However, within the expansion range of the Pearl River buoyant plume, a number of smaller rivers, including the Jiulong River, Han River, Moyang River, Jian River, Nanliu River, Changhua River and Nandu River, also contribute freshwater and sediment to the northern South China Sea (Milliman and Farnsworth, 2011; Zhang et al., 2012; Liu et al., 2016). Although these rivers contribute significantly less freshwater and sediment compared to the Pearl River, they still impact seawater salinity, suspended sediment concentration, and seabed geomorphology (Liu et al., 2016; Wang et al., 2023; Zong et al., 2024). Since the 1950s, South China delivers approximately 102 Mt yr−1 of fluvial sediment to the SCS, with the Pearl River alone accounting for 84.3 Mt yr−1 – about 83 % of the total sediment load (Milliman and Farnsworth, 2011; Zhang et al., 2012; Liu et al., 2016). While the Pearl River plays a dominant role in sediment delivery to the northern South China Sea, a comprehensive understanding of the region's sedimentary processes and impacts also requires a systematic investigation of the contributions from smaller rivers.
Then, while the model used in this study performs well in validation, further progress relies on additional observational data to better constrain key parameters such as settling velocity and critical shear stress for erosion. Direct measurements under varying conditions would help refine these inputs and improve model accuracy. For instance, settling velocity influences the location of sediment depocenters, with higher settling velocities leading to more proximal sediment entrapment and vice versa (Harris et al., 2008). Similarly, critical erosion stress affects sediment resuspension, particularly during neap tides and weak wind wave events (Dong et al., 2020; Choi et al., 2023). Targeted sensitivity analyses, supported by such data, would enhance our understanding of sediment dynamics in estuaries and shelves. Besides, the model does not account for cohesive processes, such as consolidation and flocculation, which can significantly impact sediment behavior (Sherwood et al., 2018). Our model does not incorporate wave and current-supported gravity flows, which are important factors influencing sediment transport in submarine canyon areas (Harris et al., 2005; Ma et al., 2010; Zhang et al., 2020). Since our study area primarily focuses on the continental shelf and the simulated results indicate that sediment transport occurs mainly in the shallow inner shelf, where canyons are relatively rare, this omission has a relatively minor impact on our results.
Lastly, we employ the COAWST model with an S-coordinate vertical system that enhances resolution near the surface and bottom layers (Song and Haidvogel, 1994). This vertical layering allows cell heights to vary, enabling finer resolution in dynamically important regions and improving performance in areas with sloping bathymetry compared to traditional sigma-coordinate systems (Bryan, 1969; Song and Haidvogel, 1994). Horizontal grid refinement in the PRE further enhances the model's ability to resolve estuarine features, successfully capturing estuarine turbidity maxima (ETM) and salinity fronts (Figs. S11 and S12, see Supplement), consistent with the findings of Wang et al. (2018), Zhan et al. (2019), Zhang et al. (2021), and Ma et al. (2022, 2024). Nonetheless, compared with the S-coordinate system, models that employ vertically adaptive layering (e.g., SCHISM, the Semi-implicit Cross-scale Hydroscience Integrated System Model, Zhang et al., 2016) or Cartesian vertical coordinates (e.g., MITgcm, the MIT General Circulation Model, Marshall et al., 1997a, b) generally perform better in regions with steep topographic gradients (Bijvelds, 2001). Future studies could benefit from such approaches combined with finer horizontal resolution and Cartesian vertical coordinates to improve Pearl River-derived sediment dynamics simulations.
This study utilizes the COAWST model to quantitatively analyze the seasonal suspension, transport, and annual fate of Pearl River-derived sediment (classes 4–5 in Table 1) on the continental shelf over a typical year, capturing key marine variables such as water level, wave height, flow velocity, salinity, temperature, and SSC.
The monsoonal nature of the northern SCS (Fig. 4a–b) induces pronounced seasonal variations in Pearl River-derived sediment transport and deposition (Figs. 5 and 6). During the wet summer, calm conditions foster initial Pearl River-derived sediment deposition via the buoyant plume (Figs. 5 and 7a). Conversely, winter's stronger winds and waves resuspend and transport Pearl River-derived sediments into “Gulf” region (Figs. 6 and 7b). Our quantitative assessment reveals distinct spatial patterns in the annual fate of riverine sediments: approximately two-thirds of the Pearl River-derived sediment is retained within the estuarine vicinity (“Proximal” region), while about 9 % reaches the continental shelf east of the PRE (“Eastern” and “Southeastern” regions), while similar proportions are transported to and retained in “Gulf” and “Distal” regions, respectively (Fig. 7c). Furthermore, we evaluated the contributions of different physical drivers by comparing the Control run with the reduced-physics sensitivity experiments. Our analysis reveals distinct roles of tidal forces, wave action, and background circulation in governing the transport and deposition of Pearl River-derived sediments (Figs. 8, 9, 11a–c, and 12a–c).
Tidal dynamics play a primary role in governing sediment behavior within and offshore of the PRE. In the presence of tides, bottom shear stress in the PRE is enhanced (Fig. 8a–b), promoting Pearl River-derived sediment resuspension and reducing excessive sediment deposition in the PRE (Fig. 11a), while facilitating sediment retention patterns in “Gulf” and “Distal” regions (Fig. 12a). Wave activity primarily controls Pearl River-derived sediment resuspension in three critical dimensions: (1) the river mouth, (2) the nearshore of “Eastern” and “Western” regions outside the estuary, and (3) periods characterized by high wave energy during winter (Fig. 9c–d). These wave-driven resuspension processes regulate sediment deposition and accumulation patterns in these areas and seasons (Fig. 11b), contributing to sediment export from the nearshore to offshore regions such as the “Gulf” (Fig. 11b). Background circulation exerts its strongest influence in summer (Fig. 5a vs. Fig. 9e), with a strong northeastward current transporting Pearl River-derived sediments toward regions “Eastern” and “Southeastern”. When this current is weak or absent, sediment delivery to these regions drops significantly, with only 0.84 % of the total reaching them, while deposition increases in the “Gulf” and “Distal” regions (Fig. 12c). The sediment model solutions are also highly sensitive to the parameterization of sediment characteristics and spin-up durations (riverine or seabed sediments) (Figs. 10, 11d–f, and 12d–f). The natural seasonal increase in critical shear stress for erosion during winter counteracts part of the wave-enhanced resuspension capacity, thereby reducing resuspension and erosion on the continental shelf east of the Leizhou Peninsula (Fig. 10b). Increasing the settling velocity reduces the overall riverine SSC (Fig. 10c–d) and results in a spatial redistribution pattern characterized by greater retention mainly in “Proximal” and “Western” regions and reduced riverine sediment presence in “Gulf”, “Distal” and “Southeastern” regions relative to the Control simulation (Fig. 12e). Additionally, the modeled riverine SSC is influenced by pre-existing Pearl River–derived sediments, as shown in the Cycle experiment (Fig. 10e–f). The experiment highlights the effect of riverine sediment spin-up, showing that first-year retained Pearl River–derived sediments are predominantly redistributed from the “Gulf” region toward the more distant “Distal” region during the second year.
The figure data and model configuration files used in this paper can be downloaded from: https://doi.org/10.5281/zenodo.15013448 (Zhang et al., 2025b). The HYbrid Coordinate Ocean Model (HYCOM) outputs are from: http://hycom.org/hycom (last access: 10 September 2024). The NCEP Climate Forecast System Version 2 (CFSv2) reanalysis data can be obtained at the following website: https://rda.ucar.edu/datasets/ds094.1/dataaccess/ (last access: 10 September 2024). The NOAA WAVEWATCH III global ocean wave model output fields can be downloaded from: https://polar.ncep.noaa.gov/waves/ (last access: 10 September 2024). Hourly water-level data observed at Quarry Bay station are provided by the Hong Kong Observatory website: https://www.hko.gov.hk/sc/tide/marine/realtide.htm?s=QUB&t=TABLE (last access: 10 September 2024). Hourly water-level data from Zhapo and Qinglan stations, provided by the Flanders Marine Institute (VLIZ), are part of the UNESCO/IOC Global Sea Level Observing System (GLOSS) and accessible at http://www.ioc-sealevelmonitoring.org (last access: 10 September 2024). The mooring data for the M1 and M2 stations are sourced from Liu et al. (2023) and Li et al. (2024a).
The Supplement includes validation and analysis of the model's water levels, Hsig, flow velocities, salinity, temperature, and SSC. It provides additional text and figures that support the model validation and supplementary analyses, which could not be fully presented in the main article due to space limitations. The supplement related to this article is available online at https://doi.org/10.5194/os-21-2041-2025-supplement.
GZ: Conceptualization, Numerical modeling, Validation, Data visualization, Writing-original draft, and Funding acquisition. SH: Writing-review & editing, Validation. XY: Writing-review & editing. HZ: Writing-review & editing. WG: Writing-review & editing, and Funding acquisition.
The contact author has declared that none of the authors has any competing interests.
Publisher's note: Copernicus Publications remains neutral with regard to jurisdictional claims made in the text, published maps, institutional affiliations, or any other geographical representation in this paper. While Copernicus Publications makes every effort to include appropriate place names, the final responsibility lies with the authors. Also, please note that this paper has not received English language copy-editing.
This research was funded by the National Natural Science Foundation of China (grant numbers 42306015 and 42276169), the China Postdoctoral Science Foundation (grant number 2023M743988). Wenping Gong is supported by the Southern Marine Science and Engineering Guangdong Laboratory (Zhuhai) (SML2023SP238). The authors would like to thank the crew of the R/V Changhe Ocean for their valuable contribution during the collection of the field data. We express our gratitude to Mario Hoppema, and three anonymous reviewers for their valuable suggestions in enhancing and improving this article.
This research has been supported by the National Natural Science Foundation of China (grant nos. 42306015 and 42276169) and the China Postdoctoral Science Foundation (grant no. 2023M743988) and Southern Marine Science and Engineering Guangdong Laboratory (Zhuhai) (grant number SML2023SP238).
This paper was edited by Mario Hoppema and reviewed by three anonymous referees.
Bever, A. J. and MacWilliams, M. L.: Simulating sediment transport processes in San Pablo Bay using coupled hydrodynamic, wave, and sediment transport models, Mar. Geol., 345, 235–253, https://doi.org/10.1016/j.margeo.2013.06.012, 2013.
Bever, A. J., Harris, C. K., Sherwood, C. R., and Signell, R. P.: Deposition and flux of sediment from the Po River, Italy: An idealized and wintertime numerical modeling study, Mar. Geol., 260, 69–80, https://doi.org/10.1016/j.margeo.2009.01.007, 2009.
Bian, C., Jiang, W., and Greatbatch, R. J.: An exploratory model study of sediment transport sources and deposits in the Bohai Sea, Yellow Sea, and East China Sea, J. Geophys. Res.-Oceans, 118, 5908–5923, https://doi.org/10.1002/2013JC009116, 2013.
Bijvelds, M. D. J. P.: Numerical modelling of estuarine flow over steep topography, Doctoral dissertation, Delft University of Technology, https://resolver.tudelft.nl/uuid:39c0c858-579a-47fa-a911-4a4114949a11 (last access: 11 September 2025), 2001.
Booij, N., Ris, R. C., and Holthuijsen, L. H.: A third-generation wave model for coastal regions: 1. Model description and validation, J. Geophys. Res.-Oceans, 104, 7649–7666, https://doi.org/10.1029/98JC02622, 1999.
Brand, A., Lacy, J. R., Hsu, K., Hoover, D., Gladding, S., and Stacey, M. T.: Wind-enhanced resuspension in the shallow waters of South San Francisco Bay: Mechanisms and potential implications for cohesive sediment transport, J. Geophys. Res., 115, https://doi.org/10.1029/2010jc006172, 2010.
Briggs, K. B., Cartwright, G., Friedrichs, C. T., and Shivarudruppa, S.: Biogenic effects on cohesive sediment erodibility resulting from recurring seasonal hypoxia on the Louisiana shelf, Cont. Shelf Res., 93, 17–26, https://doi.org/10.1016/j.csr.2014.11.005, 2015.
Bryan, K.: A numerical method for the study of the circulation of the world ocean, J. Comput. Phys., 4, 347–376, https://doi.org/10.1016/0021-9991(69)90004-7, 1969.
Burchard, H., Schuttelaars, H. M., and Ralston, D. K.: Sediment Trapping in Estuaries, Annu. Rev. Mar. Sci., 10, 371–395, https://doi.org/10.1146/annurev-marine-010816-060535, 2018.
Cao, L., Liu, J., Shi, X., He, W., and Chen, Z.: Source-to-sink processes of fluvial sediments in the northern South China Sea: Constraints from river sediments in the coastal region of South China, J. Asian Earth Sci., 185, 104020, https://doi.org/10.1016/j.jseaes.2019.104020, 2019.
Cao, Z., Ren, J., Deng, Z., Ye, L., and Wu, J.: Small-scale spatial variability in erosion threshold and bedform for cohesive sediment measured by 3D Sonar, J. Hydrol., 650, 132513, https://doi.org/10.1016/j.jhydrol.2024.132513, 2025.
Caruso, M. J., Gawarkiewicz, G. G., and Beardsley, R. C.: Interannual variability of the Kuroshio intrusion in the South China Sea, J. Oceanogr., 62, 559–575, https://doi.org/10.1007/s10872-006-0076-0, 2006.
Chapman, D. C.: Numerical Treatment of Cross-Shelf Open Boundaries in a Barotropic Coastal Ocean Model, J. Phys. Oceanogr., 15, 1060–1075, 1985.
Charnock, H.: Wind stress on a water surface, Q. J. Roy. Meteor. Soc., 81, 639–640, https://doi.org/10.1002/qj.49708135027, 1955.
Chassignet, E. P., Hurlburt, H. E., Smedstad, O. M., Halliwell, G. R., Hogan, P. J., Wallcraft, A. J., Baraille, R., and Bleck, R.: The HYCOM (HYbrid Coordinate Ocean Model) data assimilative system, J. Marine Syst., 65, 60–83, https://doi.org/10.1016/j.jmarsys.2005.09.016, 2007.
Chen, S.-N., Geyer, W. R., Sherwood, C. R., and Ralston, D. K.: Sediment transport and deposition on a river-dominated tidal flat: An idealized model study, J. Geophys. Res., 115, https://doi.org/10.1029/2010jc006248, 2010.
Chen, Y., Deng, B., Saito, Y., Wang, Z., Yang, X., and Wu, J.: Pearl River sediment dispersal over its associated delta–estuary–shelf system during the Holocene, Sedimentology, 70, 2331–2354, https://doi.org/10.1111/sed.13123, 2023.
Chen, Z., Pan, J., and Jiang, Y.: Role of pulsed winds on detachment of low salinity water from the Pearl River Plume Upwelling and mixing processes, J. Geophys. Res.-Oceans, 121, 2769–2788, https://doi.org/10.1002/2015JC011337, 2016.
Chen, Z., Gong, W., Cai, H., Chen, Y., and Zhang, H.: Dispersal of the Pearl River plume over continental shelf in summer, Estuar. Coast. Shelf S., 194, 252–262, https://doi.org/10.1016/j.ecss.2017.06.025, 2017a.
Chen, Z., Pan, J., Jiang, Y., and Lin, H.: Far-reaching transport of Pearl River plume water by upwelling jet in the northeastern South China Sea, J. Marine Syst., 173, 60–69, https://doi.org/10.1016/j.jmarsys.2017.04.008, 2017b.
Cheng, P., Li, M., and Li, Y.: Generation of an estuarine sediment plume by a tropical storm, J. Geophys. Res.-Oceans, 118, 856–868, https://doi.org/10.1002/jgrc.20070, 2013.
Choi, S. M., Seo, J. Y., and Ha, H. K.: Contribution of local erosion enhanced by winds to sediment transport in intertidal flat, Mar. Geol., 465, 107171, https://doi.org/10.1016/j.margeo.2023.107171, 2023.
Church, J. A. and White, N. J.: A 20th century acceleration in global sea-level rise, Geophys. Res. Lett., 33, https://doi.org/10.1029/2005gl024826, 2006.
Cui, Y., Wu, J., Ren, J., and Xu, J.: Physical dynamics structures and oxygen budget of summer hypoxia in the Pearl River Estuary, Limnol. Oceanogr., 64, 131–148, https://doi.org/10.1002/lno.11025, 2018.
Cui, Y., Wu, J., Tan, E., and Kao, S. J.: Role of Particle Resuspension in Maintaining Hypoxic Level in the Pearl River Estuary, J. Geophys. Res.-Oceans, 127, https://doi.org/10.1029/2021jc018166, 2022.
Dai, S. B., Yang, S. L., and Cai, A. M.: Impacts of dams on the sediment flux of the Pearl River, southern China, Catena, 76, 36–43, https://doi.org/10.1016/j.catena.2008.08.004, 2008.
Dalyander, P. S., Butman, B., Sherwood, C. R., Signell, R. P., and Wilkin, J. L.: Characterizing wave- and current- induced bottom shear stress: U.S. middle Atlantic continental shelf, Cont. Shelf Res., 52, 73–86, https://doi.org/10.1016/j.csr.2012.10.012, 2013.
Deng, Y., Liu, Z., Zu, T., Hu, J., Gan, J., Lin, Y., Li, Z., Quan, Q., and Cai, Z.: Climatic Controls on the Interannual Variability of Shelf Circulation in the Northern South China Sea, J. Geophys. Res.-Oceans, 127, e2022JC018419, https://doi.org/10.1029/2022JC018419, 2022.
Dong, H., Jia, L., He, Z., Yu, M., and Shi, Y.: Application of parameters and paradigms of the erosion and deposition for cohesive sediment transport modelling in the Lingdingyang Estuary, China, Appl. Ocean Res., 94, 101999, https://doi.org/10.1016/j.apor.2019.101999, 2020.
Dong, L., Su, J., Wong, L., Cao, Z., and Chen, J.: Seasonal variation and dynamics of the Pearl River plume, Cont. Shelf Res., 24, 1761–1777, https://doi.org/10.1016/j.csr.2004.06.006, 2004.
Egbert, G. D. and Erofeeva, S. Y.: Efficient inverse Modeling of barotropic ocean tides, J. Atmos. Ocean. Tech., 19, 183–204, https://doi.org/10.1175/1520-0426(2002)019<0183:Eimobo>2.0.Co;2, 2002.
Eidam, E. F., Nittrouer, C. A., Ogston, A. S., DeMaster, D. J., Liu, J. P., Nguyen, T. T., and Nguyen, T. N.: Dynamic controls on shallow clinoform geometry: Mekong Delta, Vietnam, Cont. Shelf Res., 147, 165–181, https://doi.org/10.1016/j.csr.2017.06.001, 2017.
Fairall, C. W., Bradley, E. F., Rogers, D. P., Edson, J. B., and Young, G. S.: Bulk parameterization of air-sea fluxes for Tropical Ocean-Global Atmosphere Coupled-Ocean Atmosphere Response Experiment, J. Geophys. Res.-Oceans, 101, 3747–3764, https://doi.org/10.1029/95JC03205, 1996.
Flather, R. A.: A tidal model of the north-west European continental shelf, Memoires Societe Royale des Sciences de Liege, 10, 141–164, 1976.
Fox, J. M., Hill, P. S., Milligan, T. G., Ogston, A. S., and Boldrin, A.: Floc fraction in the waters of the Po River prodelta, Cont. Shelf Res., 24, 1699–1715, https://doi.org/10.1016/j.csr.2004.05.009, 2004.
Gan, J., Cheung, A., Guo, X., and Li, L.: Intensified upwelling over a widened shelf in the northeastern South China Sea, J. Geophys. Res., 114, https://doi.org/10.1029/2007jc004660, 2009.
Gan, J., San Ho, H., and Liang, L.: Dynamics of Intensified Downwelling Circulation over a Widened Shelf in the Northeastern South China Sea, J. Phys. Oceanogr., 43, 80–94, https://doi.org/10.1175/jpo-d-12-02.1, 2013.
Gao, S. and Collins, M. B.: Holocene sedimentary systems on continental shelves, Mar. Geol., 352, 268–294, https://doi.org/10.1016/j.margeo.2014.03.021, 2014.
Gao, X., Chen, S., Xie, X., Long, A., and Ma, F.: Non-aromatic hydrocarbons in surface sediments near the Pearl River estuary in the South China Sea, Environ. Pollut., 148, 40–47, https://doi.org/10.1016/j.envpol.2006.11.001, 2007.
Gao, X., Arthur Chen, C.-T., Wang, G., Xue, Q., Tang, C., and Chen, S.: Environmental status of Daya Bay surface sediments inferred from a sequential extraction technique, Estuar. Coast. Shelf S., 86, 369–378, https://doi.org/10.1016/j.ecss.2009.10.012, 2010.
Ge, Q., Liu, J. P., Xue, Z., and Chu, F.: Dispersal of the Zhujiang River (Pearl River) derived sediment in the Holocene, Acta Oceanol. Sin., 33, 1–9, https://doi.org/10.1007/s13131-014-0407-8, 2014.
Ge, Q., Xue, Z., Yao, Z., Zang, Z., and Chu, F.: Anti-phase relationship between the East Asian winter monsoon and summer monsoon during the Holocene?, J. Ocean U. China, 16, 175–183, https://doi.org/10.1007/s11802-017-3098-x, 2017.
Ge, Q., Xu, D., Ye, L., Yang, K., and Yao, Z.: Linking Monsoon Activity with River-Derived Sediments Deposition in the Northern South China Sea, J. Ocean U. China, 18, 1098–1104, https://doi.org/10.1007/s11802-019-4155-4, 2019.
Georgiou, I. Y., FitzGerald, D. M., Sakib, M. M., Messina, F., Kulp, M. A., and Miner, M. D.: Storm Dynamics Control Sedimentation and Shelf-Bay-Marsh Sediment Exchange Along the Louisiana Coast, Geophys. Res. Lett., 51, e2024GL111344, https://doi.org/10.1029/2024GL111344, 2024.
Geyer, W. R., Hill, P. S., and Kineke, G. C.: The transport, transformation and dispersal of sediment by buoyant coastal flows, Cont. Shelf Res., 24, 927–949, https://doi.org/10.1016/j.csr.2004.02.006, 2004.
Gong, W., Chen, Y., Zhang, H., and Chen, Z.: Effects of Wave–Current Interaction on Salt Intrusion During a Typhoon Event in a Highly Stratified Estuary, Estuar. Coast., 41, 1904–1923, https://doi.org/10.1007/s12237-018-0393-8, 2018a.
Gong, W., Lin, Z., Chen, Y., Chen, Z., Shen, J., and Zhang, H.: Effect of waves on the dispersal of the Pearl River plume in winter, J. Marine Syst., 186, 47–67, https://doi.org/10.1016/j.jmarsys.2018.05.003, 2018b.
Haidvogel, D. B., Arango, H., Budgell, W. P., Cornuelle, B. D., Curchitser, E., Di, L. E., Fennel, K., Geyer, W. R., Hermann, A. J., Lanerolle, L., Levin, J., McWilliams, J. C., Miller, A. J., Moore, A. M., Powell, T. M., Shchepetkin, A. F., Sherwood, C. R., Signell, R. P., Warner, J. C., and Wilkin, J.: Ocean forecasting in terrain-following coordinates: Formulation and skill assessment of the Regional Ocean Modeling System, J. Comput. Phys., 227, 3595–3624, https://doi.org/10.1016/j.jcp.2007.06.016, 2008.
Hanebuth, T. J. J., Lantzsch, H., and Nizou, J.: Mud depocenters on continental shelves – appearance, initiation times, and growth dynamics, Geo-Mar. Lett., 35, 487–503, https://doi.org/10.1007/s00367-015-0422-6, 2015.
Harff, J., Leipe, T., and Zhou, D.: Pearl River Estuary related sediments as response to Holocene climate change and anthropogenic impact (PECAI), J. Marine Syst., 82, S1–S2, https://doi.org/10.1016/j.jmarsys.2010.02.008, 2010.
Harris, C. K., Traykovski, P. A., and Geyer, W. R.: Flood dispersal and deposition by near-bed gravitational sediment flows and oceanographic transport: A numerical modeling study of the Eel River shelf, northern California, J. Geophys. Res.-Oceans, 110, https://doi.org/10.1029/2004jc002727, 2005.
Harris, C. K., Sherwood, C. R., Signell, R. P., Bever, A. J., and Warner, J. C.: Sediment dispersal in the northwestern Adriatic Sea, J. Geophys. Res., 113, https://doi.org/10.1029/2006jc003868, 2008.
Hong, B., Liu, Z., Shen, J., Wu, H., Gong, W., Xu, H., and Wang, D.: Potential physical impacts of sea-level rise on the Pearl River Estuary, China, J. Marine Syst., 201, 103245, https://doi.org/10.1016/j.jmarsys.2019.103245, 2020.
Hu, J., Li, S., and Geng, B.: Modeling the mass flux budgets of water and suspended sediments for the river network and estuary in the Pearl River Delta, China, J. Marine Syst., 88, 252–266, https://doi.org/10.1016/j.jmarsys.2011.05.002, 2011.
Hu, S., Li, Y., Hu, P., Zhang, H., Zhang, G., and Gong, W.: The Impacts of Far-Field Typhoon-Generated Coastal Trapped Waves on the Hydrodynamics in the Northern South China Sea: A Case Study of Typhoon In-Fa, J. Geophys. Res.-Oceans, 129, https://doi.org/10.1029/2024jc021359, 2024.
Huang, D., Du, J., Deng, B., and Zhang, J.: Distribution patterns of particle-reactive radionuclides in sediments off eastern Hainan Island, China: Implications for source and transport pathways, Cont. Shelf Res., 57, 10–17, https://doi.org/10.1016/j.csr.2012.04.019, 2013.
Jacob, R., Larson, J., and Ong, E.: M × N Communication and Parallel Interpolation in Community Climate System Model Version 3 Using the Model Coupling Toolkit, IJHPCA, 19, 293–307, https://doi.org/10.1177/1094342005056116, 2005.
Kirby, M. F., Devoy, B., Law, R. J., Ward, A., and Aldridge, J.: The use of a bioassay based approach to the hazard/risk assessment of cargo derived toxicity during shipping accidents: a case study–the MSC Napoli, Mar. Pollut. Bull., 56, 781–786, https://doi.org/10.1016/j.marpolbul.2008.01.006, 2008.
Krige, D. G.: A statistical approach to some mine valuation and allied problems on the Witwatersrand. University of the Witwatersrand, Johannesburg [thesis], https://hdl.handle.net/10520/AJA0038223X_4792 (last access: 11 September 2025), 1951.
Kuehl, S. A., Alexander, C. R., Blair, N. E., Harris, C. K., Marsaglia, K. M., Ogston, A. S., Orpin, A. R., Roering, J. J., Bever, A. J., Bilderback, E. L., Carter, L., Cerovski-Darriau, C., Childress, L. B., Reide Corbett, D., Hale, R. P., Leithold, E. L., Litchfield, N., Moriarty, J. M., Page, M. J., Pierce, L. E. R., Upton, P., and Walsh, J. P.: A source-to-sink perspective of the Waipaoa River margin, Earth-Sci. Rev., 153, 301–334, https://doi.org/10.1016/j.earscirev.2015.10.001, 2016.
Kumar, N., Voulgaris, G., Warner, J. C., and Olabarrieta, M.: Implementation of the vortex force formalism in the coupled ocean-atmosphere-wave-sediment transport (COAWST) modeling system for inner shelf and surf zone applications, Ocean Model., 47, 65–95, https://doi.org/10.1016/j.ocemod.2012.01.003, 2012.
LaRowe, D. E., Arndt, S., Bradley, J. A., Estes, E. R., Hoarfrost, A., Lang, S. Q., Lloyd, K. G., Mahmoudi, N., Orsi, W. D., Shah Walter, S. R., Steen, A. D., and Zhao, R.: The fate of organic carbon in marine sediments – New insights from recent data and analysis, Earth-Sci. Rev., 204, 103146, https://doi.org/10.1016/j.earscirev.2020.103146, 2020.
Larson, J., Jacob, R., and Ong, E.: The Model Coupling Toolkit: A New Fortran90 Toolkit for Building Multiphysics Parallel Coupled Models, IJHPCA, 19, 277–292, 2005.
Li, J., Li, M., and Xie, L.: Observations of near-inertial oscillations trapped at inclined front on continental shelf of the northwestern South China Sea, EGUsphere [preprint], https://doi.org/10.5194/egusphere-2024-3909, 2024a.
Li, X., Chrysagi, E., Klingbeil, K., and Burchard, H.: Impact of Islands on Tidally Dominated River Plumes: A High-Resolution Modeling Study, J. Geophys. Res.-Oceans, 129, e2023JC020272, https://doi.org/10.1029/2023JC020272, 2024b.
Lin, S., Niu, J., Liu, G., Wei, X., and Cai, S.: Variations of suspended sediment transport caused by changes in shoreline and bathymetry in the Zhujiang (Pearl) River Estuary in the wet season, Acta Oceanol. Sin., 41, 54–73, https://doi.org/10.1007/s13131-022-2017-1, 2022.
Lin, W., Feng, Y., Yu, K., Lan, W., Wang, Y., Mo, Z., Ning, Q., Feng, L., He, X., and Huang, Y.: Long-lived radionuclides in marine sediments from the Beibu Gulf, South China Sea: Spatial distribution, controlling factors, and proxy for transport pathway, Mar. Geol., 424, 106157, https://doi.org/10.1016/j.margeo.2020.106157, 2020.
Liu, G. and Cai, S.: Modeling of suspended sediment by coupled wave-current model in the Zhujiang (Pearl) River Estuary, Acta Oceanol. Sin., 38, 22–35, https://doi.org/10.1007/s13131-019-1455-3, 2019.
Liu, H., Ye, L., Zhou, W., and Wu, J.: Salt-wedge intrusion-retreat cycle induced sediment floc dynamics in bottom boundary layer (BBL) of a micro-tidal estuary, Mar. Geol., 466, 107175, https://doi.org/10.1016/j.margeo.2023.107175, 2023.
Liu, J. P., Xue, Z., Ross, K., Yang, Z., and Gao, S.: Fate of Sediments Delivered to the Sea by Asian Large Rivers: Long-Distance Transport and Formation of Remote Alongshore Clinothems, Sediment. Rec., 7, https://doi.org/10.2110/sedred.2009.4.4, 2009.
Liu, N., Geng, B., Xue, H., Xiu, P., Wang, Q., and Wang, D.: Interannual Variability of Shelf and Slope Circulations in the Northern South China Sea, J. Ocean U. China, 19, 1005–1016, https://doi.org/10.1007/s11802-020-4446-9, 2020.
Liu, Y., Gao, S., Wang, Y. P., Yang, Y., Long, J., Zhang, Y., and Wu, X.: Distal mud deposits associated with the Pearl River over the northwestern continental shelf of the South China Sea, Mar. Geol., 347, 43–57, https://doi.org/10.1016/j.margeo.2013.10.012, 2014.
Liu, Z., Zhao, Y., Colin, C., Stattegger, K., Wiesner, M. G., Huh, C.-A., Zhang, Y., Li, X., Sompongchaiyakul, P., You, C.-F., Huang, C.-Y., Liu, J. T., Siringan, F. P., Le, K. P., Sathiamurthy, E., Hantoro, W. S., Liu, J., Tuo, S., Zhao, S., Zhou, S., He, Z., Wang, Y., Bunsomboonsakul, S., and Li, Y.: Source-to-sink transport processes of fluvial sediments in the South China Sea, Earth-Sci. Rev., 153, 238–273, https://doi.org/10.1016/j.earscirev.2015.08.005, 2016.
Lu, X., Wang, Z., Guo, X., Gu, Y., Liang, W., and Liu, L.: Impacts of metal contamination and eutrophication on dinoflagellate cyst assemblages along the Guangdong coast of southern China, Mar. Pollut. Bull., 120, 239–249, https://doi.org/10.1016/j.marpolbul.2017.05.032, 2017.
Ma, C., Zhao, J., Ai, B., Sun, S., and Yang, Z.: Machine Learning Based Long-Term Water Quality in the Turbid Pearl River Estuary, China, J. Geophys. Res.-Oceans, 127, https://doi.org/10.1029/2021jc018017, 2022.
Ma, M., Zhang, W., Chen, W., Deng, J., and Schrum, C.: Impacts of morphological change and sea-level rise on stratification in the Pearl River Estuary, Frontiers in Marine Science, 10, 1072080, https://doi.org/10.3389/fmars.2023.1072080, 2023.
Ma, M., Porz, L., Schrum, C., and Zhang, W.: Physical mechanisms, dynamics and interconnections of multiple estuarine turbidity maximum in the Pearl River estuary, Frontiers in Marine Science, 11, 1385382, https://doi.org/10.3389/fmars.2024.1385382, 2024.
Ma, Y., Friedrichs, C. T., Harris, C. K., and Wright, L. D.: Deposition by seasonal wave- and current-supported sediment gravity flows interacting with spatially varying bathymetry: Waiapu shelf, New Zealand, Mar. Geol., 275, 199–211, https://doi.org/10.1016/j.margeo.2010.06.001, 2010.
Madsen, O. S.: Spectral Wave-Current Bottom Boundary Layer Flows, Coast. Eng., 1, 384–398, 1994.
Mao, Q., Shi, P., Yin, K., Gan, J., and Qi, Y.: Tides and tidal currents in the Pearl River Estuary, Cont. Shelf Res., 24, 1797–1808, https://doi.org/10.1016/j.csr.2004.06.008, 2004.
Marshall, J., Adcroft, A., Hill, C., Perelman, L., and Heisey, C.: A finite-volume, incompressible Navier Stokes model for studies of the ocean on parallel computers, J. Geophys. Res.-Oceans, 102, 5753–5766, https://doi.org/10.1029/96JC02775, 1997a.
Marshall, J., Hill, C., Perelman, L., and Adcroft, A.: Hydrostatic, quasi-hydrostatic, and nonhydrostatic ocean modeling, J. Geophys. Res.-Oceans, 102, 5733–5752, https://doi.org/10.1029/96JC02776, 1997b.
McKee, B. A., Aller, R. C., Allison, M. A., Bianchi, T. S., and Kineke, G. C.: Transport and transformation of dissolved and particulate materials on continental margins influenced by major rivers: benthic boundary layer and seabed processes, Cont. Shelf Res., 24, 899–926, https://doi.org/10.1016/j.csr.2004.02.009, 2004.
McWilliams, J. C., Restrepo, J. M., and Lane, E. M.: An asymptotic theory for the interaction of waves and currents in coastal waters, J. Fluid Mech., 511, 135–178, https://doi.org/10.1017/s0022112004009358, 2004.
Meade, R. H.: Landward Transport of Bottom Sediments in Estuaries of the Atlantic Coastal Plain, J. Sediment. Petrol., 39, 222–234, 1969.
Milliman, J. and Farnsworth, K. L.: River discharge to the coastal ocean: A global synthesis, Cambridge University Press, UK, ISBN 978-0-521-87987-3, 2011.
Ministry of Water Resources of the PRC: Bulletin of River Sediment in China, http://www.mwr.gov.cn/sj/#tjgb (last access: 10 September 2024), 2022.
Moriarty, J. M., Harris, C. K., Friedrichs, M. A. M., Fennel, K., and Xu, K.: Impact of Seabed Resuspension on Oxygen and Nitrogen Dynamics in the Northern Gulf of Mexico: A Numerical Modeling Study, J. Geophys. Res.-Oceans, 123, 7237–7263, https://doi.org/10.1029/2018JC013950, 2018.
Nan, F., Xue, H., and Yu, F.: Kuroshio intrusion into the South China Sea: A review, Prog. Oceanogr., 137, 314–333, https://doi.org/10.1016/j.pocean.2014.05.012, 2015.
Ning, L. and Qian, Y.: Interdecadal change in extreme precipitation over South China and its mechanism, Adv. Atmos. Sci., 26, 109–118, https://doi.org/10.1007/s00376-009-0109-x, 2009.
Nittrouer, C. A. and Wright, L. D.: Transport of particles across continental shelves, Rev. Geophys., 32, 85–113, https://doi.org/10.1029/93RG02603, 1994.
Orlanski, I.: A simple boundary condition for unbounded hyperbolic flows, J. Comput. Phys., 21, 251–269, https://doi.org/10.1016/0021-9991(76)90023-1, 1976.
Ou, S., Zhang, H., and Wang, D.: Dynamics of the buoyant plume off the Pearl River Estuary in summer, Environ. Fluid Mech., 9, 471–492, https://doi.org/10.1007/s10652-009-9146-3, 2009.
Ralston, D. K. and Geyer, W. R.: Sediment Transport Time Scales and Trapping Efficiency in a Tidal River, J. Geophys. Res.-Earth, 122, 2042–2063, https://doi.org/10.1002/2017jf004337, 2017.
Ralston, D. K., Geyer, W. R., and Warner, J. C.: Bathymetric controls on sediment transport in the Hudson River estuary: Lateral asymmetry and frontal trapping, J. Geophys. Res.-Oceans, 117, https://doi.org/10.1029/2012jc008124, 2012.
Raymond, W. H. and Kuo, H. L.: A radiation boundary condition for multi-dimensional flows, Q. J. Roy. Meteor. Soc., 110, 535–551, 1984.
Repasch, M., Scheingross, J. S., Hovius, N., Lupker, M., Wittmann, H., Haghipour, N., Gröcke, D. R., Orfeo, O., Eglinton, T. I., and Sachse, D.: Fluvial organic carbon cycling regulated by sediment transit time and mineral protection, Nat. Geosci., 14, 842–848, https://doi.org/10.1038/s41561-021-00845-7, 2021.
Saha, S., Moorthi, S., Wu, X., Wang, J., Nadiga, S., Tripp, P., Behringer, D., Hou, Y.-T., Chuang, H.-y., Iredell, M., Ek, M., Meng, J., Yang, R., Mendez, M. P., van den Dool, H., Zhang, Q., Wang, W., Chen, M., and Becker, E.: The NCEP Climate Forecast System Version 2, J. Climate, 27, 2185–2208, https://doi.org/10.1175/JCLI-D-12-00823.1, 2014.
Sanford, L. P.: Wave-forced resuspension of upper Chesapeake Bay muds, Estuaries, 17, 148–165, 1994.
Shchepetkin, A. F. and McWilliams, J. C.: The regional oceanic modeling system (ROMS): a split-explicit, free-surface, topography-following-coordinate oceanic model, Ocean Model., 9, 347–404, https://doi.org/10.1016/j.ocemod.2004.08.002, 2005.
Shepard, F. P.: Nomenclature Based on Sand-silt-clay Ratios, J. Sediment. Res., 24, 151–158, 1954.
Sherwood, C. R., Aretxabaleta, A. L., Harris, C. K., Rinehimer, J. P., Verney, R., and Ferré, B.: Cohesive and mixed sediment in the Regional Ocean Modeling System (ROMS v3.6) implemented in the Coupled Ocean–Atmosphere–Wave–Sediment Transport Modeling System (COAWST r1234), Geosci. Model Dev., 11, 1849–1871, https://doi.org/10.5194/gmd-11-1849-2018, 2018.
Shi, M., Chen, C., Xu, Q., Lin, H., Liu, G., Wang, H., Wang, F., and Yan, J.: The Role of Qiongzhou Strait in the Seasonal Variation of the South China Sea Circulation, J. Phys. Oceanogr., 32, 103–121, 2002.
Skamarock, W. C., Klemp, J. B., Dudhia, J., Gill, D. O., Barker, D. M., Wang, W., and Powers, J. G.: A Description of the Advanced Research WRF Version 2, NCAR Technical Note: NCAR/TN-468+STR, https://homepages.see.leeds.ac.uk/~lecrrb/wrf/arw_v2.pdf (last access: 10 September 2024), 2005.
Smagorinsky, J.: General circulation experiments with the primitive equations, Mon. Weather Rev., 91, 99–164, https://doi.org/10.1175/1520-0493(1963)091<0099:gcewtp>2.3.co;2, 1963.
Song, Y. and Haidvogel, D.: A Semi-implicit Ocean Circulation Model Using a Generalized Topography-Following Coordinate System, J. Comput. Phys., 115, 228–244, https://doi.org/10.1006/jcph.1994.1189, 1994.
Ståhlberg, C., Bastviken, D., Svensson, B. H., and Rahm, L.: Mineralisation of organic matter in coastal sediments at different frequency and duration of resuspension, Estuar. Coast. Shelf S., 70, 317–325, https://doi.org/10.1016/j.ecss.2006.06.022, 2006.
Su, J.: Overview of the South China Sea circulation and its influence on the coastal physical oceanography outside the Pearl River Estuary, Cont. Shelf Res., 24, 1745–1760, https://doi.org/10.1016/j.csr.2004.06.005, 2004.
Sun, Z., Zhang, Z., Qiu, B., Zhang, X., Zhou, C., Huang, X., Zhao, W., and Tian, J.: Three-Dimensional Structure and Interannual Variability of the Kuroshio Loop Current in the Northeastern South China Sea, J. Phys. Oceanogr., 50, 2437–2455, https://doi.org/10.1175/JPO-D-20-0058.1, 2020.
Tolman, H., Accensi, M., Alves, J.-H., Ardhuin, F., Barbariol, F., Benetazzo, A., Bennis, A.-C., Bidlot, J., Booij, N., Boutin, G., Campbell, T., Chalikov, D., Chawla, A., Cheng, S., Collins Iii, C., Filipot, J.-F., Foreman, M., Janssen, P., Leckler, F., and Westhuysen, A.: User manual and system documentation of WAVEWATCH III (R) version 5.16, https://polar.ncep.noaa.gov/waves/wavewatch/manual.v5.16.pdf (last access: 10 September 2024), 2016.
Turner, A. and Millward, G. E.: Suspended Particles: Their Role in Estuarine Biogeochemical Cycles, Estuar. Coast. Shelf S., 55, 857–883, https://doi.org/10.1006/ecss.2002.1033, 2002.
van der Wegen, M., Dastgheib, A., Jaffe, B. E., and Roelvink, D.: Bed composition generation for morphodynamic modeling: case study of San Pablo Bay in California, USA, Ocean Dynam., 61, 173–186, https://doi.org/10.1007/s10236-010-0314-2, 2010.
Walsh, J. P. and Nittrouer, C. A.: Understanding fine-grained river-sediment dispersal on continental margins, Mar. Geol., 263, 34–45, https://doi.org/10.1016/j.margeo.2009.03.016, 2009.
Wang, C., Li, W., Chen, S., Li, D., Wang, D., and Liu, J.: The spatial and temporal variation of total suspended solid concentration in Pearl River Estuary during 1987–2015 based on remote sensing, Sci. Total Environ., 618, 1125–1138, https://doi.org/10.1016/j.scitotenv.2017.09.196, 2018.
Wang, C., Liu, Z., Harris, C. K., Wu, X., Wang, H., Bian, C., Bi, N., Duan, H., and Xu, J.: The Impact of Winter Storms on Sediment Transport Through a Narrow Strait, Bohai, China, J. Geophys. Res.-Oceans, 125, e2020JC016069, https://doi.org/10.1029/2020JC016069, 2020.
Wang, S., Zhang, N., Chen, H., Li, L., and Yan, W.: The surface sediment types and their rare earth element characteristics from the continental shelf of the northern south China sea, Cont. Shelf Res., 88, 185–202, https://doi.org/10.1016/j.csr.2014.08.005, 2014.
Wang, S., Wu, S., Yan, W., Huang, W., Miao, L., Lu, J., Chen, Z., and Liu, F.: Rare metal elements in surface sediment from five bays on the northeastern coast of the South China Sea, Environ. Earth Sci., 74, 4961–4971, https://doi.org/10.1007/s12665-015-4504-6, 2015.
Wang, S., Li, J., Wu, S., Yan, W., Huang, W., Miao, L., and Chen, Z.: The distribution characteristics of rare metal elements in surface sediments from four coastal bays on the northwestern South China Sea, Estuar. Coast. Shelf S., 169, 106–118, https://doi.org/10.1016/j.ecss.2015.12.001, 2016.
Wang, Y., Wang, Y., Wan, X., Huang, C., Wang, R., Liu, X., Yi, J., and Zhang, Y.: Influence of the Hanjiang River's Inlet Sediment Decrease on Modern Sedimentation in the Underwater Delta, Appl. Sci., 13, 8039, https://doi.org/10.3390/app13148039, 2023.
Warner, J. C., Sherwood, C. R., Arango, H. G., and Signell, R. P.: Performance of four turbulence closure models implemented using a generic length scale method, Ocean Model., 8, 81–113, https://doi.org/10.1016/j.ocemod.2003.12.003, 2005.
Warner, J. C., Sherwood, C. R., Signell, R. P., Harris, C. K., and Arango, H. G.: Development of a three-dimensional, regional, coupled wave, current, and sediment-transport model, Comput. Geosci., 34, 1284–1306, https://doi.org/10.1016/j.cageo.2008.02.012, 2008.
Warner, J. C., Armstrong, B., He, R., and Zambon, J. B.: Development of a Coupled Ocean–Atmosphere–Wave–Sediment Transport (COAWST) Modeling System, Ocean Model., 35, 230–244, https://doi.org/10.1016/j.ocemod.2010.07.010, 2010.
Warner, J. C., Schwab, W. C., List, J. H., Safak, I., Liste, M., and Baldwin, W.: Inner-shelf ocean dynamics and seafloor morphologic changes during Hurricane Sandy, Cont. Shelf Res., 138, 1–18, https://doi.org/10.1016/j.csr.2017.02.003, 2017.
Weatherall, P., Marks, K. M., Jakobsson, M., Schmitt, T., Tani, S., Arndt, J. E., Rovere, M., Chayes, D., Ferrini, V., and Wigley, R.: A new digital bathymetric model of the world's oceans, Earth Space Sci., 2, 331–345, https://doi.org/10.1002/2015EA000107, 2015.
Wright, L. D. and Coleman, J. M.: Variations in Morphology of Major River Deltas as Functions of Ocean Wave and River Discharge Regimes, AAPG Bull., 57, 370–398, 1973.
Wright, L. D. and Nittrouer, C. A.: Dispersal of river sediments in coastal seas: Six contrasting cases, Estuaries, 18, 494–508, https://doi.org/10.2307/1352367, 1995.
Wu, C., Xing, W., Jie, R., Yun, B., Zhigang, H., Yiaping, L., Heyin, S., and Wenyan, Z.: Morphodynamics of the rock-bound outlets of the Pearl River estuary, South China – A preliminary study, J. Marine Syst., 82, S17–S27, https://doi.org/10.1016/j.jmarsys.2010.02.002, 2010.
Wu, Z., Milliman, J. D., Zhao, D., Zhou, J., and Yao, C.: Recent geomorphic change in LingDing Bay, China, in response to economic and urban growth on the Pearl River Delta, Southern China, Global Planet. Change, 123, 1–12, https://doi.org/10.1016/j.gloplacha.2014.10.009, 2014.
Wu, Z., Milliman, J. D., Zhao, D., Cao, Z., Zhou, J., and Zhou, C.: Geomorphologic changes in the lower Pearl River Delta, 1850–2015, largely due to human activity, Geomorphology, 314, 42–54, https://doi.org/10.1016/j.geomorph.2018.05.001, 2018.
Wu, Z. Y., Saito, Y., Zhao, D. N., Zhou, J. Q., Cao, Z. Y., Li, S. J., Shang, J. H., and Liang, Y. Y.: Impact of human activities on subaqueous topographic change in Lingding Bay of the Pearl River estuary, China, during 1955–2013, Sci. Rep., 6, 37742, https://doi.org/10.1038/srep37742, 2016.
Xia, X. M., Li, Y., Yang, H., Wu, C. Y., Sing, T. H., and Pong, H. K.: Observations on the size and settling velocity distributions of suspended sediment in the Pearl River Estuary, China, Cont. Shelf Res., 24, 1809–1826, https://doi.org/10.1016/j.csr.2004.06.009, 2004.
Xu, K., Corbett, D. R., Walsh, J. P., Young, D., Briggs, K. B., Cartwright, G. M., Friedrichs, C. T., Harris, C. K., Mickey, R. C., and Mitra, S.: Seabed erodibility variations on the Louisiana continental shelf before and after the 2011 Mississippi River flood, Estuar. Coast. Shelf S., 149, 283–293, https://doi.org/10.1016/j.ecss.2014.09.002, 2014.
Xu, K., Mickey, R. C., Chen, Q., Harris, C. K., Hetland, R. D., Hu, K., and Wang, J.: Shelf sediment transport during hurricanes Katrina and Rita, Comput. Geosci., 90, 24–39, https://doi.org/10.1016/j.cageo.2015.10.009, 2016.
Xue, Z., He, R., Liu, J. P., and Warner, J. C.: Modeling transport and deposition of the Mekong River sediment, Cont. Shelf Res., 37, 66–78, https://doi.org/10.1016/j.csr.2012.02.010, 2012.
Yang, B., Liu, S.-M., and Zhang, G.-L.: Geochemical characteristics of phosphorus in surface sediments from the continental shelf region of the northern South China Sea, Mar. Chem., 198, 44–55, https://doi.org/10.1016/j.marchem.2017.11.001, 2018.
Yang, J., Wu, D., and Lin, X.: On the dynamics of the South China Sea Warm Current, J. Geophys. Res.-Oceans, 113, https://doi.org/10.1029/2007JC004427, 2008.
Young, I. R., Zieger, S., and Babanin, A. V.: Global trends in wind speed and wave height, Science, 332, 451–455, https://doi.org/10.1126/science.1197219, 2011.
Zang, Z., Xue, Z. G., Xu, K., Bentley, S. J., Chen, Q., D'Sa, E. J., and Ge, Q.: A Two Decadal (1993–2012) Numerical Assessment of Sediment Dynamics in the Northern Gulf of Mexico, Water, 11, 938, https://doi.org/10.3390/w11050938, 2019.
Zeng, X., He, R., Xue, Z., Wang, H., Wang, Y., Yao, Z., Guan, W., and Warrillow, J.: River-derived sediment suspension and transport in the Bohai, Yellow, and East China Seas: A preliminary modeling study, Cont. Shelf Res., 111, 112–125, https://doi.org/10.1016/j.csr.2015.08.015, 2015.
Zhan, W., Wu, J., Wei, X., Tang, S., and Zhan, H.: Spatio-temporal variation of the suspended sediment concentration in the Pearl River Estuary observed by MODIS during 2003–2015, Cont. Shelf Res., 172, 22–32, https://doi.org/10.1016/j.csr.2018.11.007, 2019.
Zhang, G., Cheng, W., Chen, L., Zhang, H., and Gong, W.: Transport of riverine sediment from different outlets in the Pearl River Estuary during the wet season, Mar. Geol., 415, 105957, https://doi.org/10.1016/j.margeo.2019.06.002, 2019.
Zhang, G., Chen, Y., Cheng, W., Zhang, H., and Gong, W.: Wave Effects on Sediment Transport and Entrapment in a Channel-Shoal Estuary: The Pearl River Estuary in the Dry Winter Season, J. Geophys. Res.-Oceans, 126, https://doi.org/10.1029/2020jc016905, 2021.
Zhang, G., Hu, P., Hu, S., Zhang, H., and Gong, W.: Tidal effects on the dispersal and water age of the plumes from eight outlets of the Pearl river during the wet summer, Ocean Coast. Manage., 266, 107704, https://doi.org/10.1016/j.ocecoaman.2025.107704, 2025a.
Zhang, G., Hu, S., Yu, X., Zhang, H., and Gong, W.: Data for submitted paper “Modeling dispersal of the Pearl River-derived sediment over the Shelf”, Zenodo [data set], https://doi.org/10.5281/zenodo.15013448, 2025b.
Zhang, J., Jiang, Q., Jeng, D., Zhang, C., Chen, X., and Wang, L.: Experimental Study on Mechanism of Wave-Induced Liquefaction of Sand-Clay Seabed, J. Mar. Sci. Eng., 8, 66, https://doi.org/10.3390/jmse8020066, 2020.
Zhang, W., Wei, X., Zheng, J., Zhu, Y., and Zhang, Y.: Estimating suspended sediment loads in the Pearl River Delta region using sediment rating curves, Cont. Shelf Res., 38, 35–46, https://doi.org/10.1016/j.csr.2012.02.017, 2012.
Zhang, W., Zheng, J., Ji, X., Hoitink, A. J. F., van der Vegt, M., and Zhu, Y.: Surficial sediment distribution and the associated net sediment transport pattern retain–> in the Pearl River Estuary, South China, Cont. Shelf Res., 61–62, 41–51, https://doi.org/10.1016/j.csr.2013.04.011, 2013.
Zhang, Y. J., Ye, F., Stanev, E. V., and Grashorn, S.: Seamless cross-scale modeling with SCHISM, Ocean Model., 102, 64-81, https://doi.org/10.1016/j.ocemod.2016.05.002, 2016.
Zhong, Y., Chen, Z., Li, L., Liu, J., Li, G., Zheng, X., Wang, S., and Mo, A.: Bottom water hydrodynamic provinces and transport patterns of the northern South China Sea: Evidence from grain size of the terrigenous sediments, Cont. Shelf Res., 140, 11–26, https://doi.org/10.1016/j.csr.2017.01.023, 2017.
Zong, X., Cheng, X., Zhang, S., Lian, Q., Deng, F., and Chen, Z.: Tidal effects on dynamics and freshwater transport of a medium-scale river plume with multiple outlets, Ocean Model., 188, 102338, https://doi.org/10.1016/j.ocemod.2024.102338, 2024.
Zong, Y., Huang, K., Switzer, A., yu, F., and Yim, W.: An evolutionary model for the Holocene formation of the Pearl River delta, China, Holocene, 19, 129–142, https://doi.org/10.1177/0959683608098957, 2009.