the Creative Commons Attribution 4.0 License.
the Creative Commons Attribution 4.0 License.
 | 15 Sep 2025
Tracking marine heatwaves in the Balearic Sea: temperature trends and the role of detection methods
Blanca Fernández-Álvarez
Bàrbara Barceló-Llull
Ananda Pascual
Marine heatwaves (MHWs) are defined as discrete periods of anomalous ocean warming. In the most commonly used MHW determination method, the threshold over which a certain temperature is considered to be an MHW is calculated using a fixed baseline constructed from a common climatology (1982–2011). By this definition, these phenomena have been increasing in frequency and intensity due to global warming, and this is expected to ultimately lead to a saturation point. Significant efforts have been directed towards developing new ways of defining marine heatwaves, motivated by the need to differentiate between long-term temperature trends and extreme events. The Mediterranean Sea serves as an ideal backdrop for comparing different MHW detection methods due to its rapid response to climate change, with higher warming trends than the global ocean. In this work, we evaluate sea surface temperature trends in the Balearic Sea, a subregion of the western Mediterranean, and compare the fixed-baseline MHW detection method with two recently developed alternative methodologies. The first alternative employs a moving climatology to adjust the baseline, while the second method involves detrending the temperature data before detecting MHWs with a fixed baseline. For the period between 1982 and 2023, our analysis reveals a statistically significant warming trend of 0.036 ± 0.001 °C per year, which represents an increase of ∼ 10 % compared to previous studies in the same region due to the inclusion of two particularly warm recent years, 2022 and 2023. Regarding MHWs, all three methods identify major events in 2003 and 2022. However, the fixed-baseline method indicates an increase in MHW frequency and duration over time, a tendency not detected by the other methodologies, since we isolate the extreme events from the long-term warming trend. This study underscores the importance of selecting an appropriate MHW detection method that aligns with the intended impact assessments. Studies performed with a moving baseline or detrended data could be more appropriate to analyse species with higher adaptability, while a fixed baseline could be a better option to study species that are less adaptable and more sensitive to exceeding a critical temperature threshold.
- Article
(7458 KB) - Full-text XML
-
Supplement
(688 KB) - BibTeX
- EndNote


Oceans play a critical role in regulating Earth's climate through the transport of heat and carbon across the globe. It is calculated that the ocean uptakes over 90 % of the anthropogenic excess heat (Gleckler et al., 2016) and around 30 % of the anthropogenic carbon (Gruber et al., 2019) produced since the Industrial Revolution. This comes accompanied by an increase in the overall ocean temperature, which, in turn, can modify the sea level and ocean circulation (IPCC, 2022). Understanding how the oceans respond to global change and how they impact the climate system is one of the biggest challenges scientists face nowadays (Pascual and Macías, 2021).
One consequence of ocean warming is the increase in the frequency and intensity of marine heatwaves (MHWs) (Oliver, 2019; Marcos et al., 2025). The study of MHWs is relatively new and has evolved into a rapidly growing field of research (for reviews, see Oliver et al., 2021; Capotondi et al., 2024). The term was introduced by Pearce et al. (2011), and the first widely accepted definition was proposed by Hobday et al. (2016). MHWs are defined as discrete periods of anomalous warming of the sea. In the past half-decade, significant efforts have been devoted to characterizing their main drivers, a challenging task due to their complexity and diversity. The processes influencing their formation are interconnected and operate across a broad range of temporal and spatial scales, from local dynamics affecting the mixed-layer temperature budget to large-scale climate modes that enhance their frequency and persistence (Holbrook et al., 2019; Bian et al., 2024).
The increase in MHW frequency over time has been demonstrated in several studies. For instance, Oliver et al. (2018) reported an increment of up to 54 % in MHW days per year from 1925 to 2016. Projections of future ocean temperatures indicate that this increase will continue under global warming scenarios (Oliver, 2019; Rosselló et al., 2023). Moreover, recent research by Oliver et al. (2021) suggests that MHWs may reach a saturation point in the near future. All the studies previously mentioned apply the standard approach to detect MHWs, which involves calculating sea surface temperature (SST) anomalies over a fixed historical climatology constructed from a common baseline, often based on the 1982–2011 period (Hobday et al., 2016). This method is sensitive to ocean warming because it is based on a historical climatology; as a result, events of recent years appear to be more magnified due to the underlying ocean warming (Oliver, 2019; Amaya et al., 2023). Reaching saturation is not inherent to the fixed-baseline method. By extending the baseline to 30 years or more (e.g. Ibrahim et al., 2021; Juza et al., 2022; Darmaraki et al., 2024), saturation can be avoided. However, as MHW characteristics remain influenced by long-term ocean warming, this induces an apparent upward trend in both duration and intensity (Mohamed et al., 2022, 2023).
To address this limitation, efforts have been made in recent years to develop new methods for defining MHWs that distinguish between long-term temperature trends and extreme events (Capotondi et al., 2024; Smith et al., 2025). Two approaches have been proposed as alternatives to the fixed-baseline method. The first alternative uses a moving baseline, meaning that the climatology is updated annually (Jacox, 2019; Rosselló et al., 2023). With this approach, the baseline shifts to only include data from the 20 years prior to the year under study. This ensures that the climatology reflects conditions characteristic of that specific period, allowing the identification of MHWs relative to recent climate conditions. The second approach involves detrending the SST data prior to applying the MHW detection process (Martínez et al., 2023). By removing the long-term warming trend, this method ensures that MHWs are identified independently of progressive ocean warming.
The Mediterranean Sea is considered to be a region with a rapid response to climate change, with warming trends ∼ 20 % higher than in the global ocean (Lionello and Scarascia, 2018; Juza and Tintoré, 2021). Under a warming-ocean scenario and using the fixed-baseline MHW detection method (Hobday et al., 2016), it is expected that the frequency and intensity of MHWs will undergo a progressive increase (Rosselló et al., 2023). This pattern has already been observed in the Mediterranean Sea, as noted by Juza et al. (2022), showing an increase of 78.4 MHW days per year from 1982 to 2020. In their comprehensive review, Darmaraki et al. (2024) gather the findings about MHWs events and their drivers in the Mediterranean Sea, also commenting on known impacts across diverse marine organisms. The authors argue that, despite many advances in the field, a single, uniform detection framework remains both technically challenging and, despite its benefits for study comparability, potentially inappropriate since it should be adapted to the intrinsic local conditions. MHWs in the Mediterranean Sea are mainly generated due to long periods of anomalously high atmospheric pressure that lead to weakened values of wind speed (Darmaraki et al., 2024; Simon et al., 2023). The wind reduction can alter the local air–sea heat fluxes and produce a decrease in ocean heat loss, resulting in the formation of MHWs. Furthermore, these events can be intensified or modified by local oceanic and weather processes (Darmaraki et al., 2024). Regionally, MHWs in the western Mediterranean basin are generally more intense and frequent, while, in the eastern basin, they are typically longer (Hamdeno and Alvera-Azcaráte, 2023; Simon et al., 2022). In the western basin, the events are usually driven by large positive heat flux anomalies (enhanced shortwave radiation and reduced latent heat loss), whereas, in the east, they often coincide with decreased upward longwave radiation (Hamdeno and Alvera-Azcaráte, 2023; Simon et al., 2023). In the Mediterranean Sea, MHWs can impact the growth, survival, fertility, migration, and phenology of both pelagic and benthic organisms, even leading to mass mortality events (Marbà et al., 2015).This study focuses on the Balearic Sea, a subregion of the western Mediterranean that surrounds the Balearic Islands (Fig. 1). This area is one of the ecoregions with the greatest risk of species loss due to climate change (Chatzimentor et al., 2023), and processes occurring around the Balearic Islands (Aguiar et al., 2022) can impact commercially important fish stocks (Heslop et al., 2012), including the Atlantic blue-fin tuna (Alemany et al., 2010; Reglero et al., 2018). The objective of this study is to evaluate sea surface temperature (SST) trends and MHWs detected using different methods in the Balearic Sea through the analysis of 42 years (1982–2023) of SST satellite observations. To the best of our knowledge, a quantitative comparison of the selected MHW detection methods has never been done before.
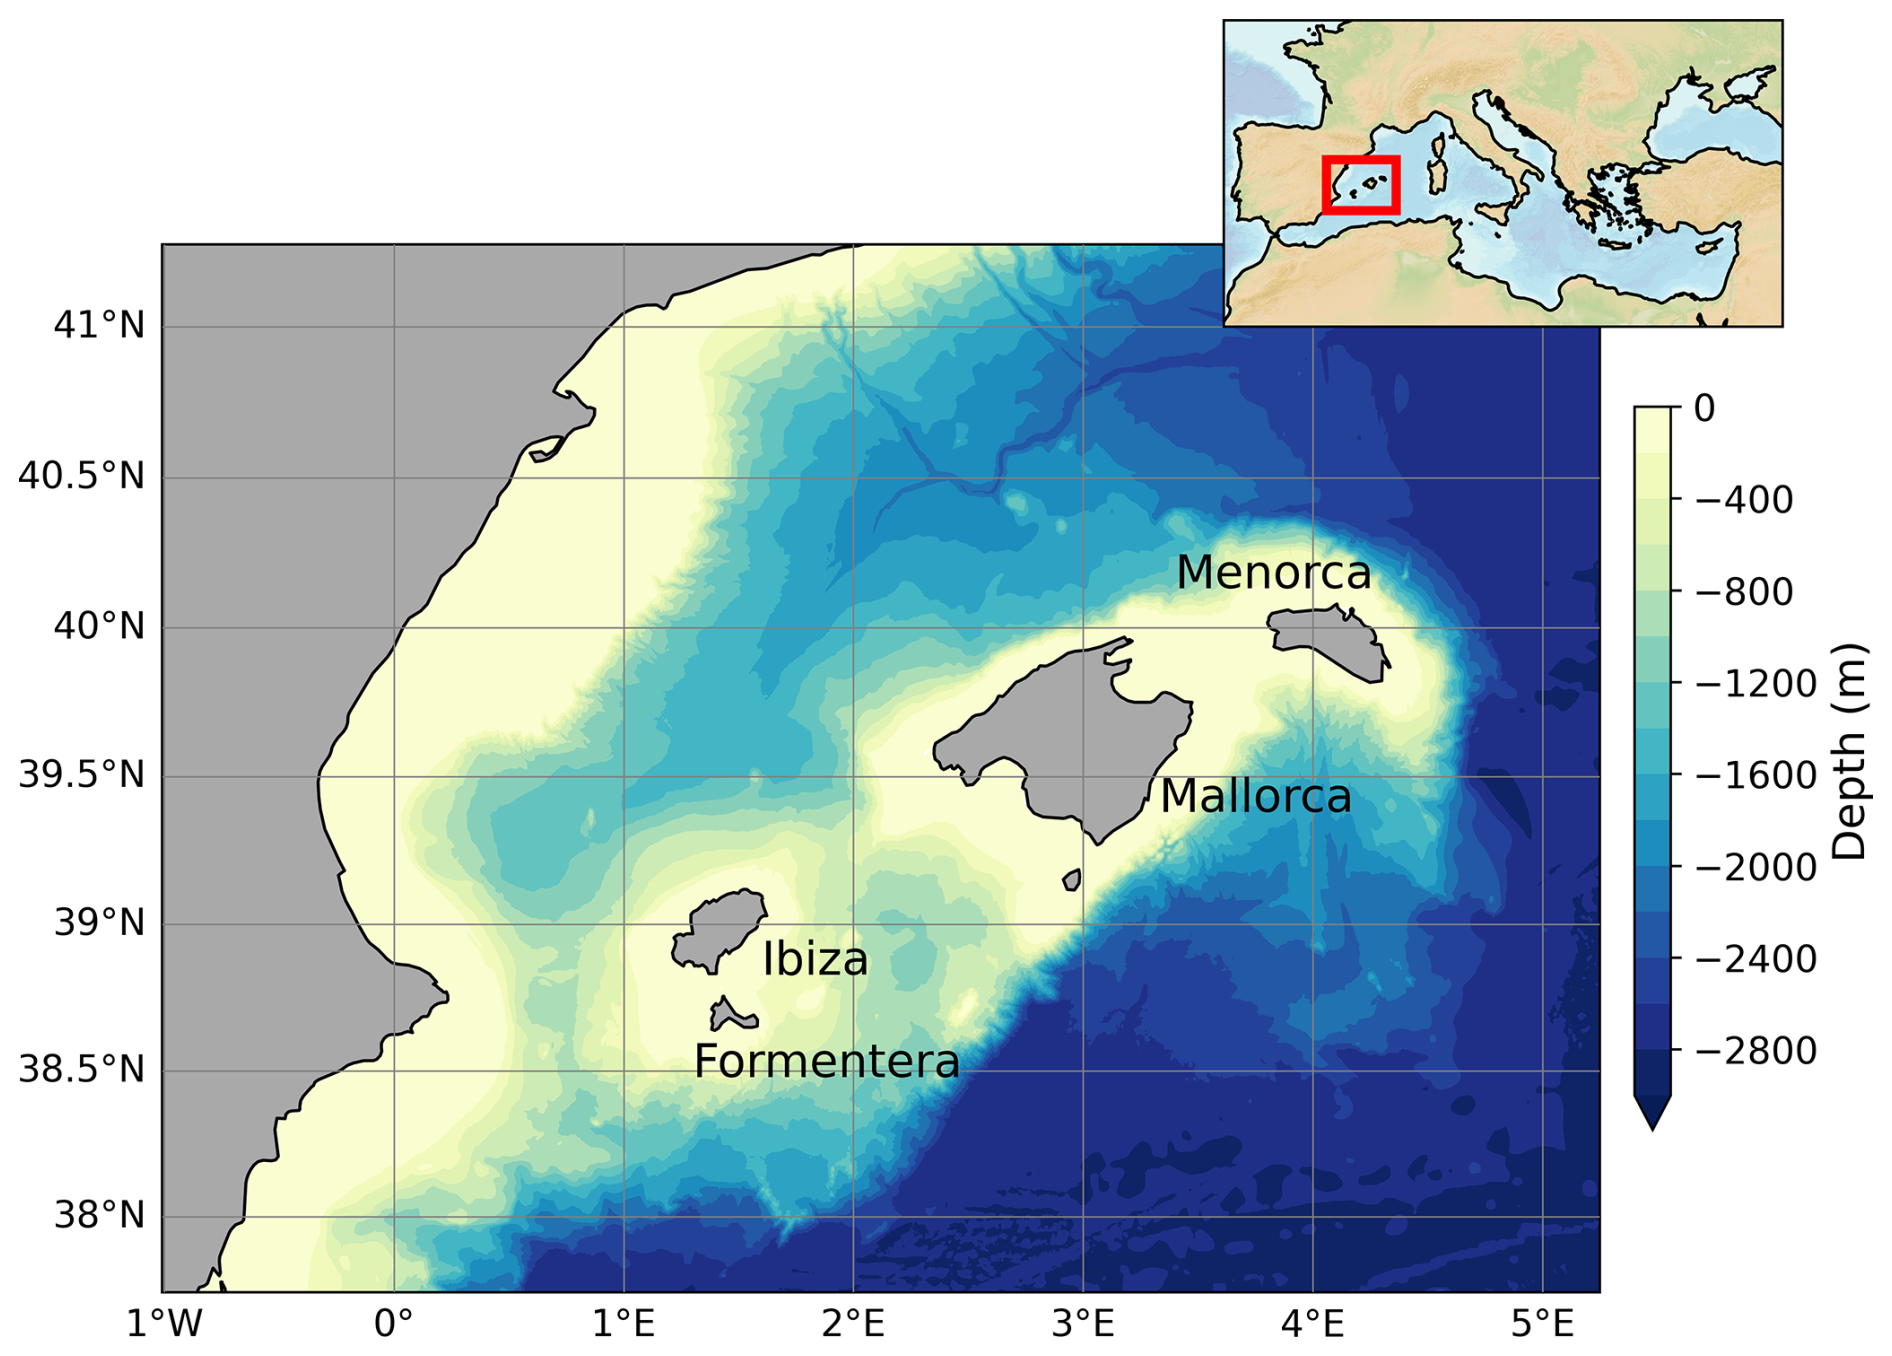
Figure 1Bathymetry of the Balearic Sea. Its position relative to the Mediterranean Sea is indicated with a red box in the inset. The topography was obtained from the GEBCO 15 arcsec 2024 grid (https://doi.org/10.5285/1c44ce99-0a0d-5f4f-e063-7086abc0ea0f).
2.1 Sea surface temperature observations
The SST satellite-based observations analysed in this study are obtained from a level-4 (L4) product and, consequently, produced by the optimal interpolation of different sensors' observations. We use a product distributed by the Copernicus Marine Monitoring Service (CMEMS) (Le Traon et al., 2019), with the identifier SST_MED_SST_ L4_REP_OBSERVATIONS_010_021 (https://doi.org/10.48670/moi-00173). This SST product is a daily nighttime dataset consisting of a regular grid with a resolution of 0.05° over the Mediterranean Sea (Merchant et al., 2019). The temporal extent of this product is from 25 August 1981 to 1 month before the present day. For the purpose of this study, the data used range from 1 January 1982 to 31 December 2023, therefore obtaining 42 complete years of SST data.
2.2 Computation of SST trends
The SST trends were determined with the Theil–Sen slope estimator (Helsel et al., 2020) after removing the seasonal cycle from the original SST data. Their statistical significance (p value < 0.05) was assessed using the modified Mann–Kendall test, which accounts for autocorrelation within the time series (Yue and Wang, 2004). The standard errors of the SST trends were calculated as the residual standard error divided by the square root of the sum of squared differences in the independent variable (James et al., 2023).
2.3 Detection of marine heatwaves
2.3.1 Fixed-baseline method
Following the definition proposed by Hobday et al. (2016), an MHW is described as a high-temperature event where a threshold value is exceeded for a minimum of 5 consecutive days. The threshold is usually set at the 90th percentile of the distribution at each grid point over a specific climatology constructed using at least 30 years of data. The fixed baseline refers to the use of a common climatology in the MHW identification process, computed here using data from the period between 1982 and 2011 (Hobday et al., 2016). Considering the fact that the fixed baseline is the most widespread definition, we will use it as a benchmark to compare with other methodologies.
2.3.2 Alternative methods: moving baseline and detrending
Two alternatives for detecting MHWs are the moving-baseline method (Rosselló et al., 2023) and the detrending approach (Martínez et al., 2023). In the moving-baseline method, the climatology is updated annually, using data from the 20 years preceding the year under study (Rosselló et al., 2023). For instance, the climatology used to detect MHWs in 2002 is computed with data from 1982 to 2001, while, to detect MHWs in 2023, the climatology is computed with data from 2003 to 2022. Following this approach, the threshold is adapted to account for evolving climate conditions. To account for the initial 20 years required to build the climatology, we begin detecting MHWs in 2002 and continue through 2023. The 20-year reference period was chosen to enable a longer analysis period (Rosselló et al., 2023), and, for consistency, this is also used as the length of the reference periods in the other methods. The second approach consists of detrending the SST data prior to applying the MHW detection process (Martínez et al., 2023). The detrending is performed by subtracting the trend computed at each grid point from the original SST data. After the detrending, the MHWs are detected using a fixed baseline (1982–2011).
2.4 Marine heatwave metrics
For each MHW event, we compute its duration and its mean, maximum, and cumulative intensity (Hobday et al., 2016). The mean intensity is defined as the average SST anomaly of an MHW event, the maximum intensity is the highest SST anomaly reached during an MHW episode, and the cumulative intensity is the sum of the daily SST anomalies during an MHW event. We also compute the total number of days per year with MHWs. These metrics are derived at each grid point. When computing spatial averages we use a weighted mean, which allows us to consider the varying areas of the grid cells that change with latitude. Following Hobday et al. (2018), MHWs are classified into four categories according to the extent to which they exceed the 90th percentile threshold: moderate (1–2 times), strong (2–3 times), severe (3–4 times), and extreme (more than 4 times).
Sea surface temperature trends computed in the Balearic Sea reveal a generalized warming between 1982 and 2023 (Fig. 2). These trends have spatial variability, with minimum values of 0.030 ± 0.001 °C yr−1 to the southwest of Ibiza and maximum values of over 0.039 ± 0.001 °C yr−1 in two warming hotspots (Fig. 2a). The first hotspot is located northwest of Mallorca, centred at 40.6° N and 2.25° E, and the other one is located south of Menorca, centred at 39.2° N and 4° E. The hotspot south of Menorca presents the maximum trends, reaching 0.041 ± 0.002 °C yr−1. The spatially averaged SST trend for the Balearic Sea is 0.036 ± 0.001 °C yr−1 (Fig. 2c).
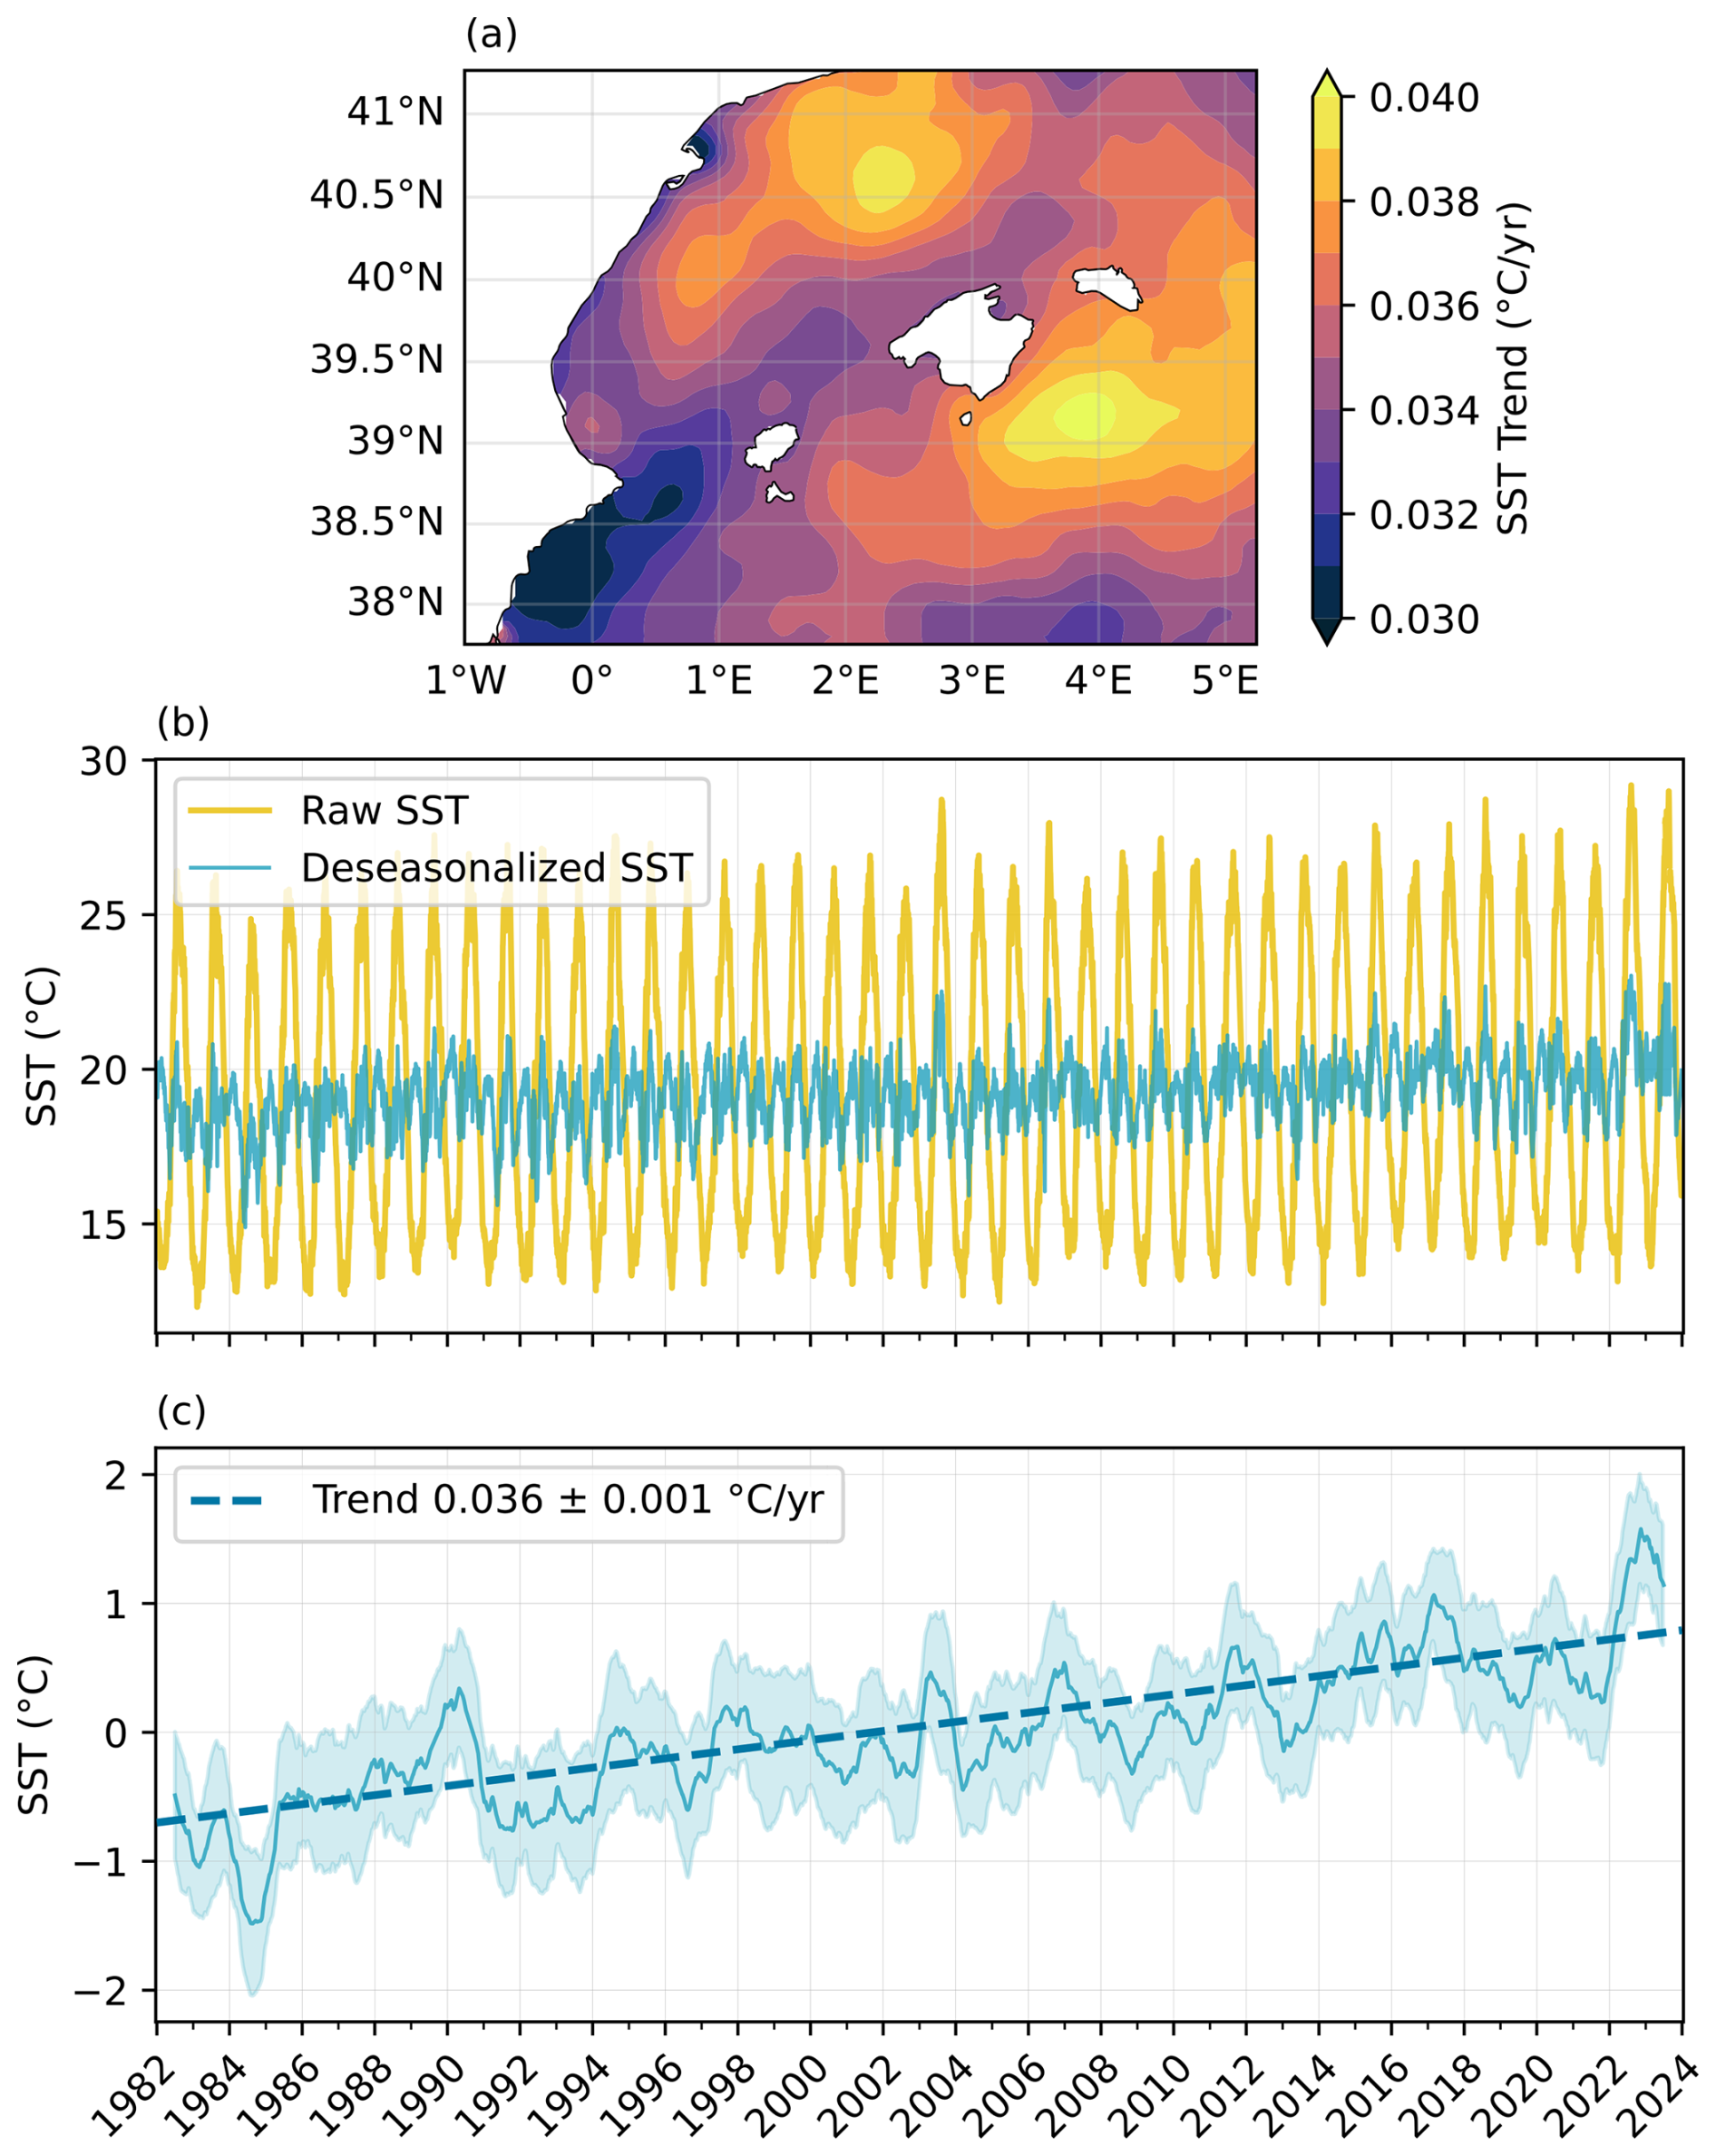
Figure 2(a) SST trends computed from 1982 to 2023 in the Balearic Sea. (b) Spatially averaged time series of SST (yellow) and SST residuals from the harmonic analysis (blue), with the mean value of the seasonal cycle added for readability. (c) Spatially averaged deseasonalized SST. For clarity, a 365 d running mean is applied (thin solid line), and the shaded areas represent the standard deviation of the mean. The SST trend is shown by a thick dashed line (trend ± standard error).
The reported SST trends were calculated at each grid point after removing the seasonal cycle through a harmonic analysis (Sect. 2.2, Fig. 2). To compare the values obtained with this method to those derived from other methods described in the literature, we have performed a sensitivity analysis of the trend. When computing trends with a linear regression and considering complete years, the results indicate that, using either the annual mean or a 365 d running average, the spatially averaged linear regression slope is 0.036–0.037 °C yr−1. However, when using the original (raw) data, the trend increases to 0.042 °C yr−1. This discrepancy is due to the high sensitivity of linear regression to temporal extremes in the data, such as minimum and maximum values. If, instead of using complete years, the slope is calculated from the original SST data but starting and ending the time series at its yearly mean (May 1983 to May 2023), the resulting slope is 0.030 °C yr−1 – a 30 % difference. We opted for using the Theil–Sen (TS) estimator on the residuals to compute the slope. Using the TS estimator allows for a larger sample size compared to annual mean values while accounting for data autocorrelation by incorporating the effective sample size from the modified Mann–Kendall test (Yue and Wang, 2004). This approach provides more realistic statistical significance and standard error than the 365 running averages while producing trends consistent with both annual mean values and 365 d averages.
Previous studies in the broader western Mediterranean basin have reported SST trends consistent with those obtained in this study for the Balearic Sea. From 1982 to 2012, Shaltout and Omstedt (2014) reported a trend of 0.035 ± 0.007 °C yr−1. More recent studies by Pisano et al. (2020) and Pastor et al. (2020) reported trends of 0.036 ± 0.006 °C yr−1 for 1982–2018 and 0.035 °C yr−1 for 1982–2019, respectively. In the Balearic Sea, Juza and Tintoré (2021) identified a warming trend of 0.033 ± 0.003 °C yr−1 for 1982–2020, which is 0.003 °C yr−1 lower than the trend computed in this study (representing an increase of ∼ 10 %). The higher trends detected in our analysis can be attributed to the inclusion of data from 2 particularly warm years, 2022 and 2023, during which SST and ocean heat content reached record levels in the Mediterranean Sea (Cheng et al., 2024). Including SST data from 2020 to 2023 in the analysis increases the trend from 0.033 ± 0.001 to 0.036 ± 0.001 °C yr−1.
4.1 MHW days and mean duration
When using a fixed baseline to detect MHWs, the total number of days per year during which the Balearic Sea undergoes MHWs increases over time (Fig. 3a). The annual number of MHW days is at its maximum in 2022 and 2023. In 2022, over half of the year (194 d) was under an MHW, with a third of these days being classified as strong (category II; Fig. S1 in the Supplement). With a moving baseline, MHW days in the first part of the period (up to 2011) are slightly higher than those obtained using a fixed baseline (Fig. 3a). However, in the latter half, the values do not increase as they do with the fixed baseline. There is no discernible tendency in the number of days experiencing MHWs or in their mean duration (Fig. S1). Years with a high number of days under MHWs include 2003, 2011, 2016, 2022, and 2023, with the highest being 2022, when 39 % of the year was under an MHW. Among these years, the highest proportion of strong (category II) MHWs occurred in 2003 (Fig. S1). Using the detrended method, the number of MHW days is the lowest across all of the years analysed (Fig. 3a). The years with the highest number of MHWs days detected with this method are 2003, 2022, and 2023, with 70, 107, and 65 d, respectively. The largest proportion of strong MHWs is also detected in 2003 (Fig. S1). A comparison of the MHW days detected with the three methods highlights differences in certain years. In 2016, both the fixed- and moving-baseline approaches show a high number of MHW days compared to neighbouring years, whereas the detrended method shows a dip in MHWs days. Similarly, in 2011, the detrended method detects a high number of MHWs, but this is relatively low compared to the importance this year has with the other methods.
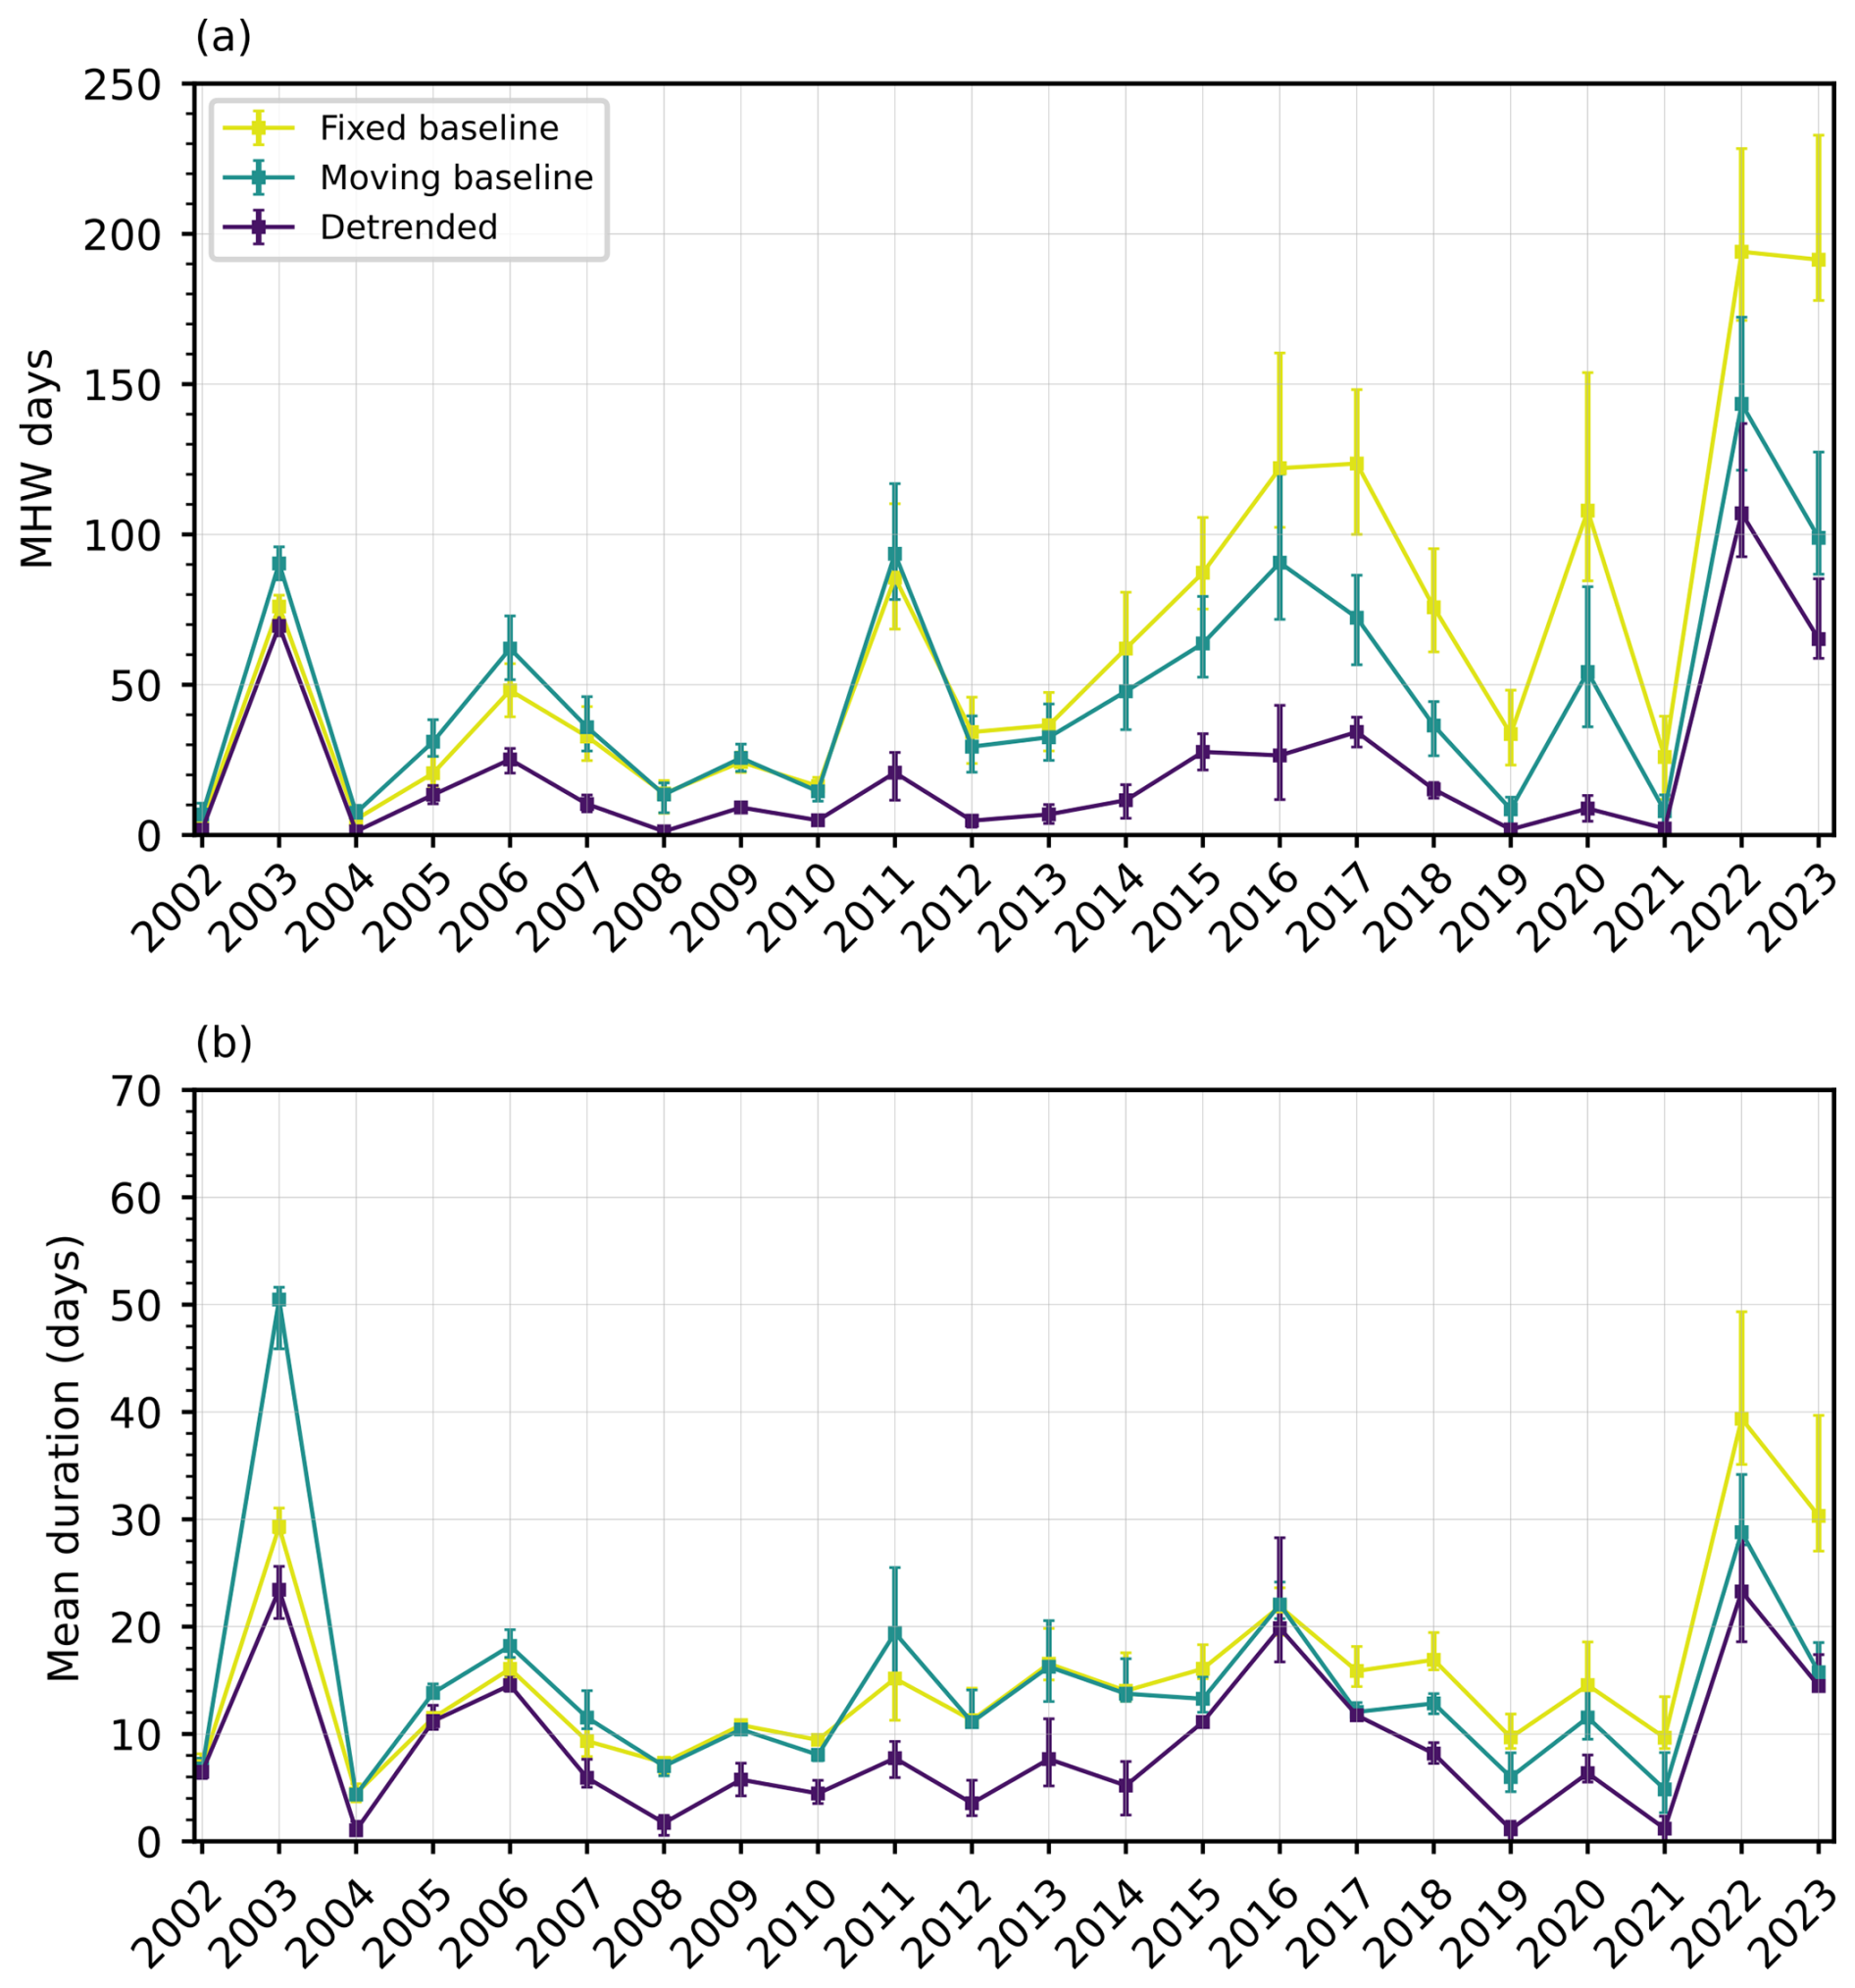
Figure 3Spatially averaged metrics of the MHWs detected in the Balearic Sea from 2002 to 2023 using three detection methods: fixed baseline, moving baseline, and detrended data. (a) Annual number of days under MHWs. (b) Annual mean duration of the MHW events.
The annual mean duration of MHWs also experiences an increase over time when using a fixed baseline (Fig. 3b). Two large peaks in duration are detected in 2003 and 2022, continuing, with a slight decrease, in 2023, with mean durations of 29, 39, and 30 d, respectively. Using a moving baseline, the mean duration in 2022 was 29 d, while in 2003 MHWs had an average duration of 50 d. With the detrended method, the highest mean duration appears in 2003, with values of 23 d, followed by 2022 with 23 d. Consistently with the results for MHW days, the detrended approach generally shows the lowest values for MHW duration when compared to the fixed and moving baselines.
4.2 Intensity of marine heatwaves
The annual averages of the mean, maximum, and cumulative intensity of MHWs averaged over the study region are shown in Fig. 5 (and Table S2). With the fixed baseline, the highest mean intensity appears in 2003, with an average of 2.44 °C, followed by the values obtained in 2022 at 2.41 °C and in 2023 at 2.19 °C (Fig. 4a). Despite this, the maximum intensity in 2003 (3.92 °C) is exceeded in 2017, 2022, and 2023 (4.18, 4.42, and 3.97 °C, respectively) (Fig. 4b). The cumulative intensity in 2003 is exceeded in the previously mentioned years and in 2015 and 2020 (Fig. 4c). This can be attributed to the higher mean intensity of the MHWs that occurred in 2003 compared to other years. The mean intensities of MHWs in 2017 and 2022 were not as high as in 2003; however, these MHWs exhibited larger temperature anomaly peaks, resulting in these years having the highest maximum intensities. With respect to cumulative intensity, it depends not only on the temperature anomalies associated with each MHW but also on the duration of each event. In 2015, 2017, 2020, 2022, and 2023 the mean duration of MHWs was longer than in 2003 (Fig. 3b). As a result, these years had higher cumulative intensities than 2003 (Fig. 4c), even though their mean intensities were lower (Fig. 4a).
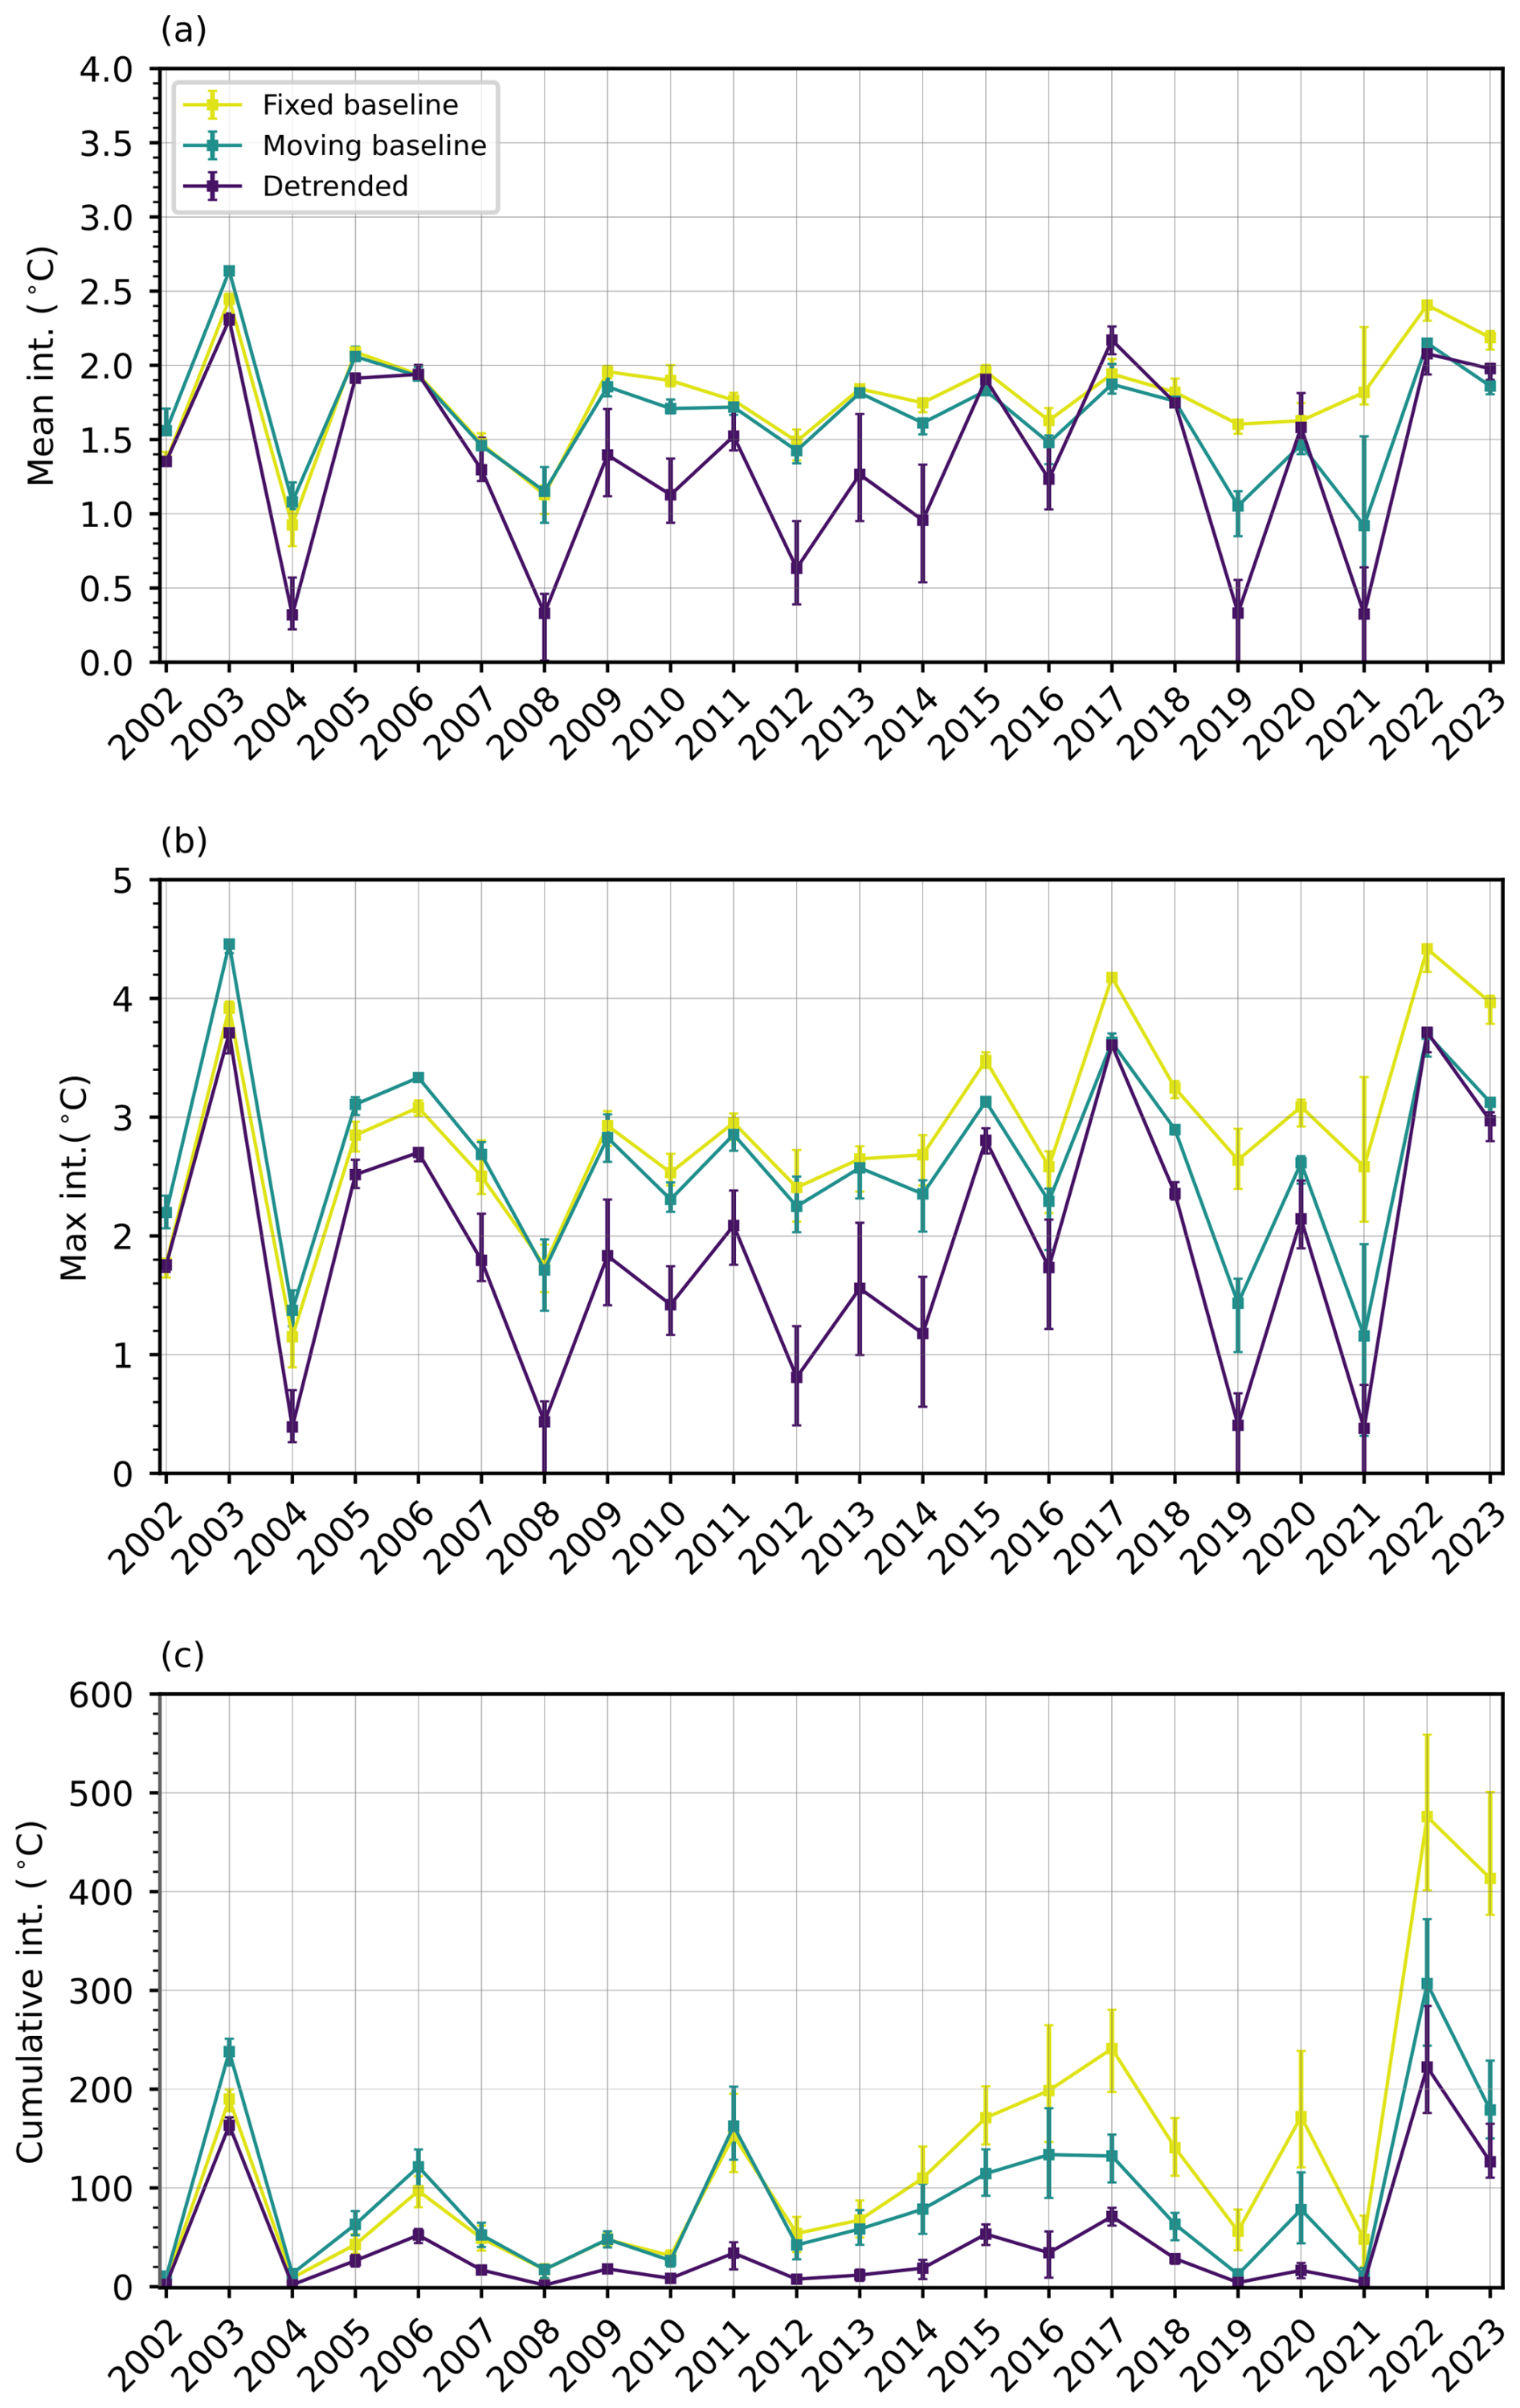
Figure 4Spatially averaged metrics of the MHWs detected in the Balearic Sea from 2002 to 2023 using three detection methods: fixed baseline, moving baseline, and detrended data. (a) Annual average of the mean intensity of MHW events. (b) Annual average of the maximum intensity of MHW events. (c) Annual average of the cumulative intensity of MHW events.
Regarding the MHWs detected with a moving baseline, only 2003, 2005, and 2022 exhibit mean intensities over 2.00 °C, with values of 2.62, 2.06, and 2.15 °C, respectively (Fig. 4a). Notably, with this method, the maximum intensity detected in 2003 (4.46 °C) exceeds that of all other years by at least 0.80 °C (Fig. 4b). Despite this, the cumulative intensity for 2022 surpasses that of any other year, reaching a value of 306.83 °C (Fig. 4c). This indicates that, while the MHWs in 2003 had the largest mean and maximum intensities, the higher mean duration of MHWs in 2022 (Fig. 3) contributes significantly to its cumulative intensity, even though its mean and maximum intensities are lower than those in 2003.
With the detrending method, 2003 and 2017 are identified as the years with the highest mean intensities, with values of 2.31 and 2.17 °C, respectively (Fig. 4a). These years are followed by 2022, with a mean intensity of 2.08 °C. The highest cumulative intensity is detected in 2022 (222.42 °C), followed by 2003 (163.42 °C) and 2023 (126.48 °C) (Fig. 4c). These 3 years showed cumulative intensities at least 55 °C higher than those of the rest of the years.
In terms of mean intensity (Fig. 4a), the detrended approach shows the greatest variability across years, while mean intensities calculated using the moving baseline are consistently lower than those obtained with a fixed baseline from 2009 onwards. Mean intensities in 2006 and 2017 are higher when computed with detrended data than with the other methods, whereas, in 2015, 2020, and 2023, the mean intensity from the detrended approach exceeds only the moving-baseline values. For maximum intensity (Fig. 4b), the moving baseline provides the highest values until 2008. From that year onwards, MHWs detected with the fixed baseline have greater maximum intensity. Detrended intensities are lower and only equal those from the moving baseline in 2017 and 2022. Cumulative intensity (Fig. 4c) shows an increasing trend with the fixed-baseline approach, not present with the other methods (Fig. S1).
4.3 Spatial variability of marine heatwaves
The spatial distribution of the annual number of days with MHWs on average and for 2003, 2022, and 2023 is represented in Figs. 5 (fixed baseline), 6 (moving baseline), and 7 (detrended data). The temporally averaged number of MHW days obtained with a fixed baseline (Fig. 5a) and with a moving baseline (Fig. 6a) shows slightly higher values around the islands and to the northwest of the study region. This is not detected by the detrended method (Fig. 7a), where the higher number of MHW days is located north of Mallorca, around 41° N. With the fixed baseline, 10 %–30 % of the days of the year undergo MHWs; this value is reduced with a moving baseline and detrended data to 9 %–16 % and 3 %–8 %, respectively (note the different colour scales used in Figs. 5–7).
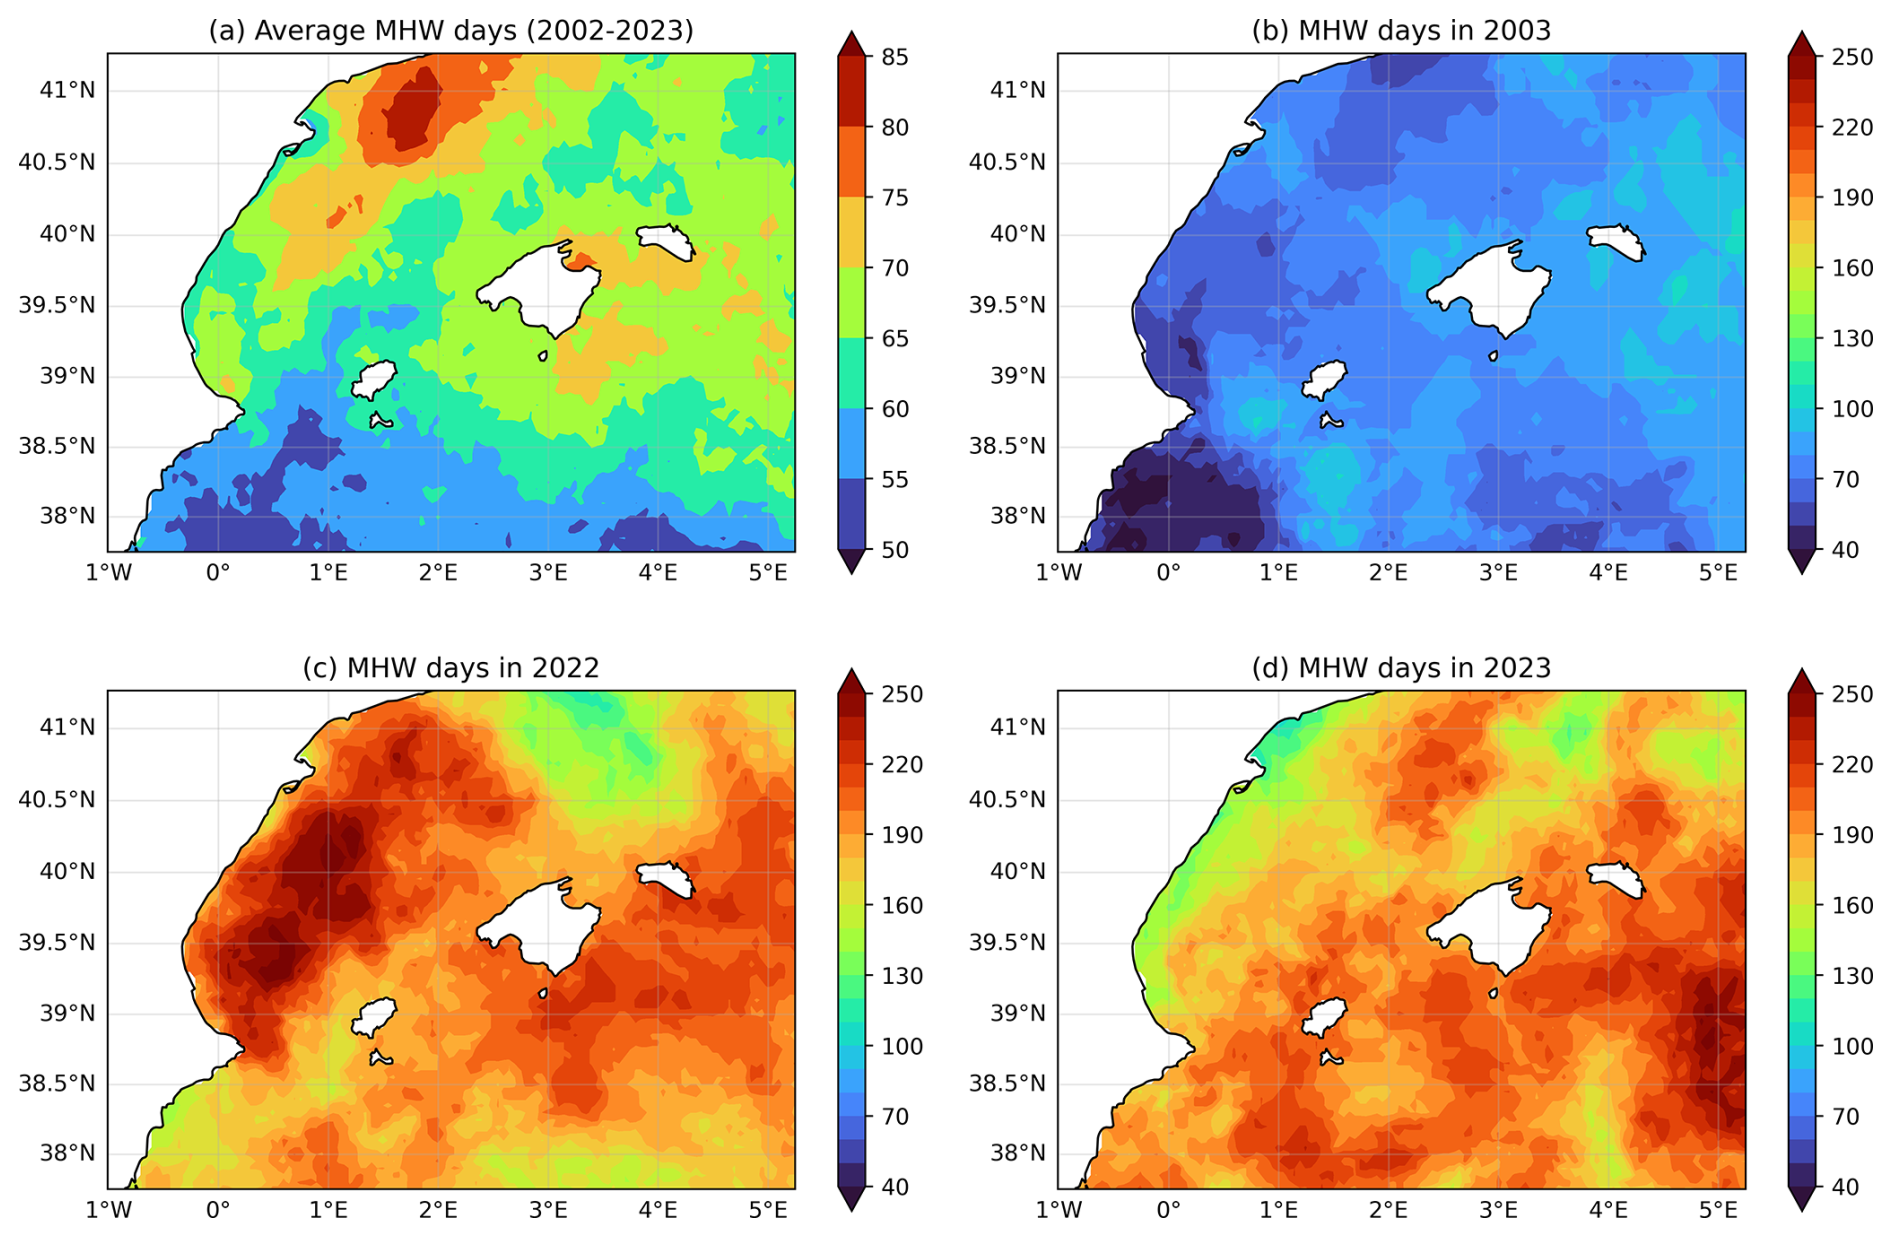
Figure 5Spatial distribution of the annual number of days with MHWs detected using the fixed-baseline method for (a) the temporal average from 2002 to 2023, (b) 2003, (c) 2022, and (d) 2023.
The 2003 MHWs detected with a fixed baseline were more frequent to the south and southwest of Ibiza, with maximum values of 140 d under MHWs (Fig. 5b). The 2022 MHWs were more frequent in the area along the Iberian Peninsula, with a total of 290 d under MHW conditions (Fig. 5c). For this same baseline, the 2023 number of days under MHWs shows similar maximum values to those in 2022, but, in this case, the area with the highest number of days with MHWs is in the eastern part of the study region (Fig. 5d). Both 2022 and 2023 maximum values of MHW days are double the highest values obtained in 2003 (Fig. 5b).
With a moving baseline, in 2022, the number of MHW days is more evenly distributed throughout the region, with minimum values north of Mallorca (Fig. 6c). The years 2003 and 2023 show a similar range of values for the number of MHW days, but their spatial distribution differs significantly. While, in 2003, the distribution is more homogenous, with most areas having a total of between 80 and 100 MHW days, in 2023, we can find greater spatial variability, with a higher number of MHW days in the south and a lower number of MHW days in the north of the study region (Fig. 6b and d).
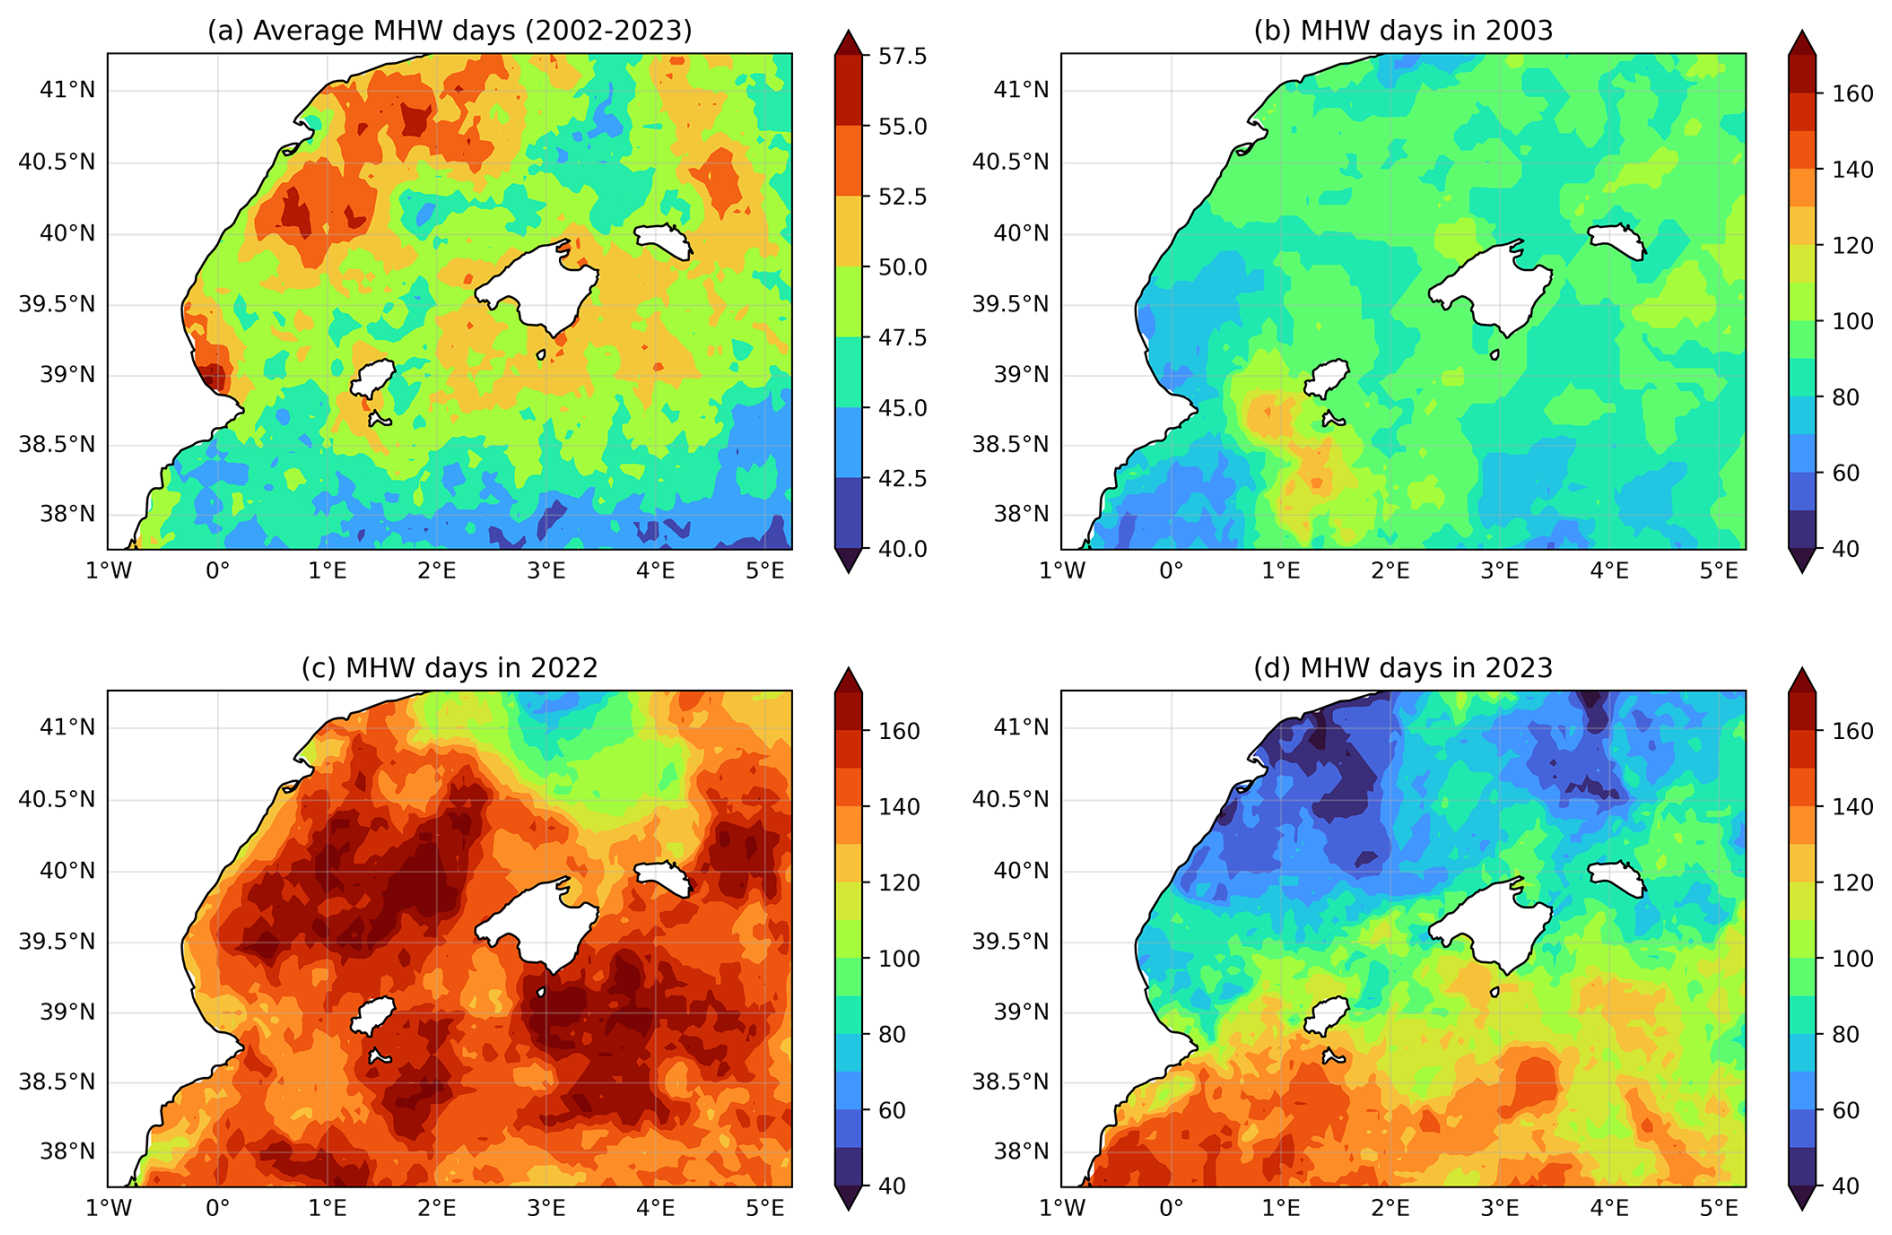
Figure 6Spatial distribution of the annual number of days with MHWs detected using the moving-baseline method for (a) the temporal average from 2002 to 2023, (b) 2003, (c) 2022, and (d) 2023.
With the detrended method, 2003 had a similar number of MHW days in all the Balearic Sea, but with slightly higher values around the islands and to the northeast of the region (Fig. 7b). In 2022, the area northwest of Mallorca shows the highest values, with areas reaching more than 155 d undergoing MHW conditions (Fig. 7c). The MHWs in 2023 exhibit slightly lower values than in 2003; the areas with the highest MHW days are located around the island and to the south of the region, but we also find a patch north of Mallorca (Fig. 7d).
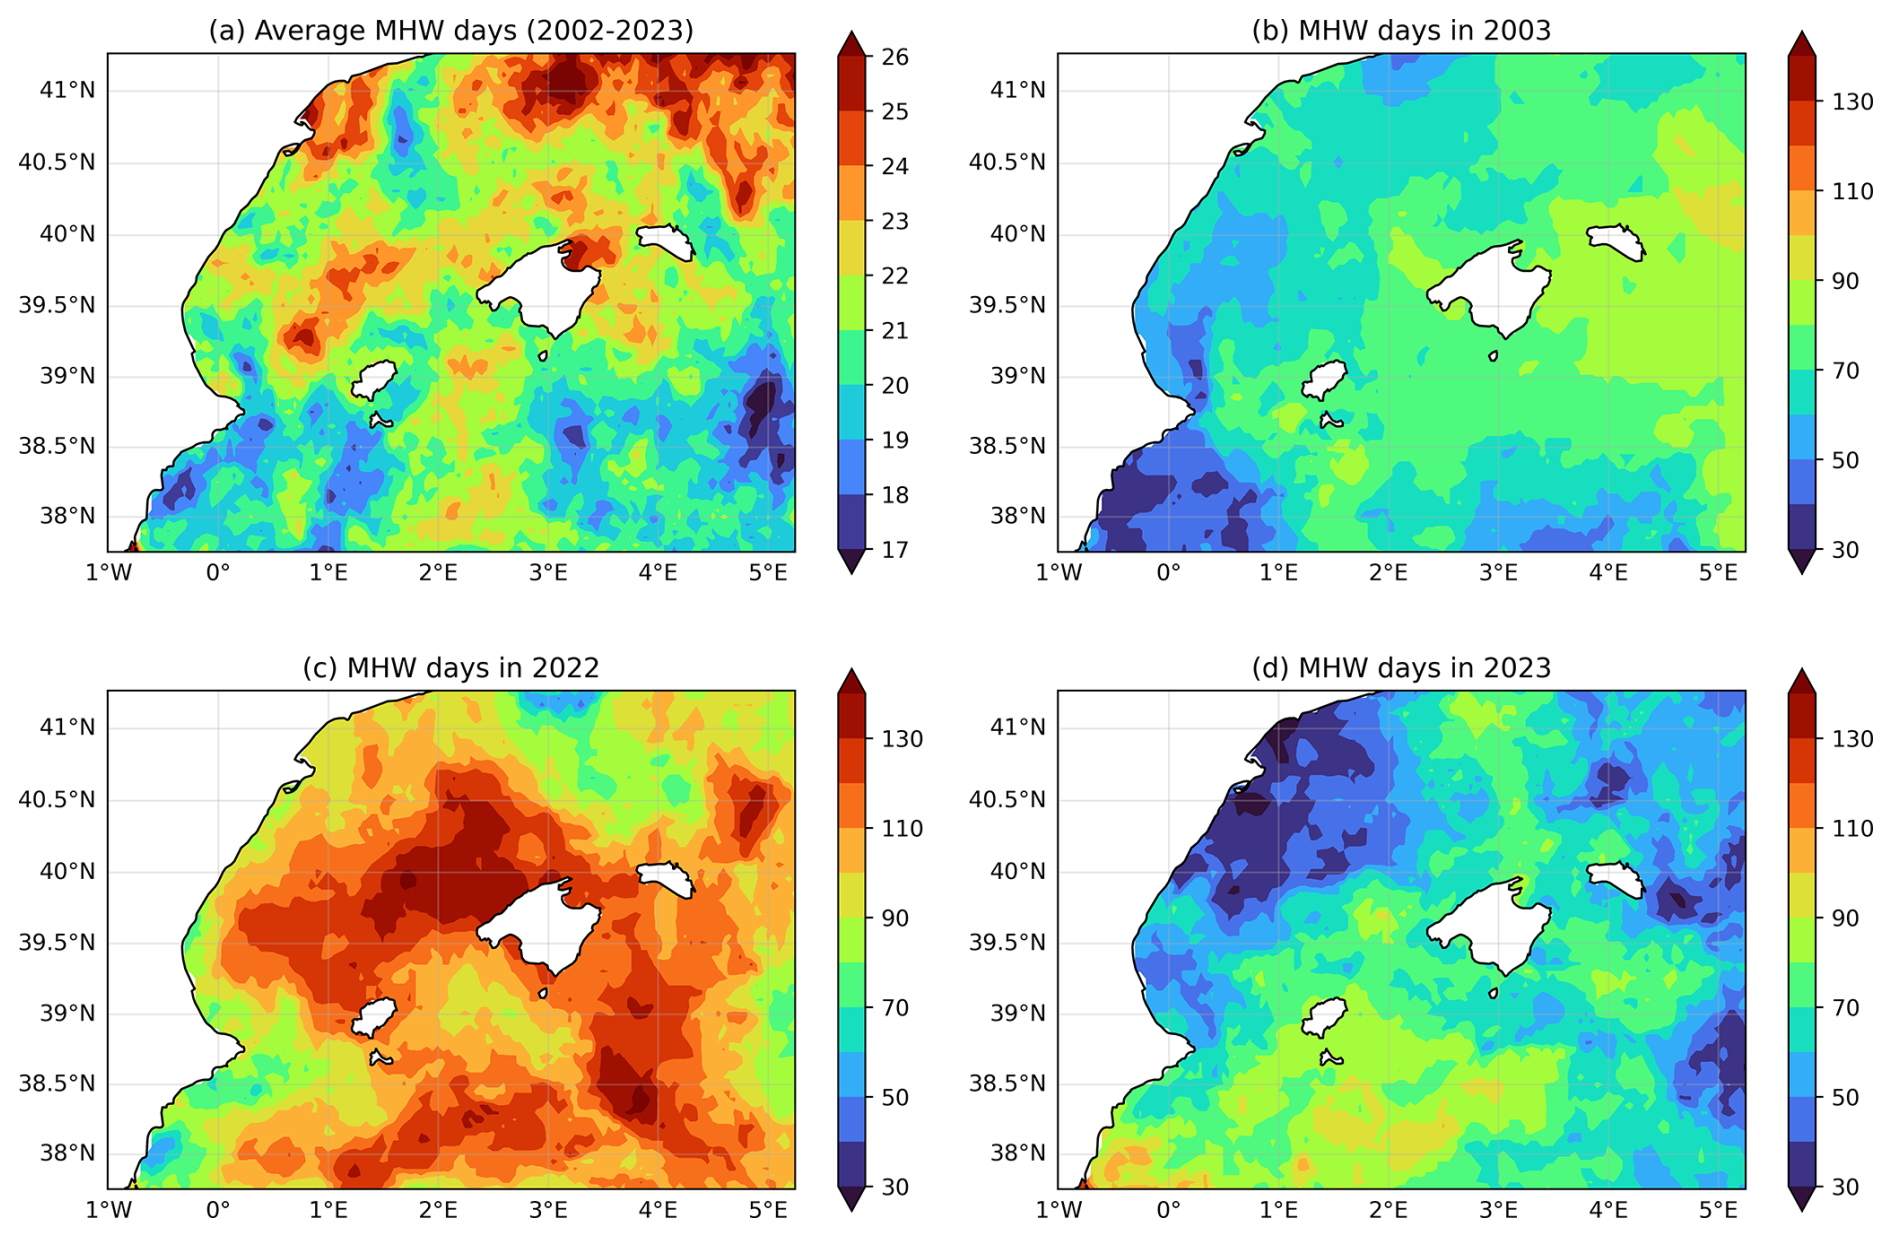
Figure 7Spatial distribution of the annual number of days with MHWs detected using the detrended method for (a) the temporal average from 2002 to 2023, (b) 2003, (c) 2022, and (d) 2023.
The spatial distribution of MHWs days in 2003 remains relatively unchanged with the three detection methods, in opposition to 2022 and 2023. In 2022, when using a moving baseline, MHW days appear in the form of evenly dispersed patches across the region. When using the other two methods, localized areas of higher numbers of MHW days are present. With the fixed baseline, this area is near the coast of the Iberian Peninsula, and with detrended data, this area is northwest of Mallorca. In 2023, the easternmost part of the study region is identified as the area with the highest number of MHW days using the fixed baseline while also displaying one of the lowest numbers of MHW days when using detrended data.
The areas where the warming trend is higher show, on average, more MHW days with a fixed baseline than what we observe with the other two methods (Figs. 5a, 6a, and 7a). This is the case for the warming spot in the eastern part of the study region along the Iberian Peninsula coast.
4.4 Implications of different definitions
When comparing the MHWs detected using three different methods (i.e. fixed baseline (Hobday et al., 2016), moving baseline (Rosselló et al., 2023), and detrending (Martínez et al., 2023)), we find differences amongst them. With the fixed and moving baselines, we obtain similar results for all of the metrics in the first part of the studied period until 2009. This is expected since this period is when the baselines overlap the most. The difference becomes larger after 2009 when the fixed baseline yields higher MHW days, durations, and intensities than the other methods. The 2003 MHWs are widely considered to be one of the greatest extreme temperature events to have occurred in the Mediterranean in the last few decades (Holbrook et al., 2019), causing a mass mortality effect in benthic communities (Crisci et al., 2011; Marbà et al., 2015). Using the year 2003 to compare later MHWs, when a fixed baseline is employed, the annual number of MHW days in 2003 is surpassed eight times (in 2011, 2015, 2016, 2017, 2018, 2020, 2022, and 2023) but only three times when using a moving baseline (in 2011, 2022, and 2023) (Figs. 3 and 4). This discrepancy is a consequence of the impact of the warming trend on the fixed-baseline method. Detrended data highlight 2017 as a year with short and intense MHWs, 2023 as a year with long and frequent events of lower intensity, and 2003 and 2022 as years with both intense and long events. In general, this method shows lower frequency and duration than the other two methods. Regarding intensity, there are changes, but, depending on the year, the mean and maximum intensity values are higher or lower than with the other methods. This is consistent with Oliver (2019), who found that the warming trends mostly affected the frequency and duration of the detected MHWs while having a lesser impact on their intensity. Notably, the 2022 MHW was consistently detected by the fixed-baseline, moving-baseline, and detrending methods, underscoring its strength. The 2022 MHW has been documented previously (Marullo et al., 2023; Juza et al., 2024; Pirro et al., 2024; McAdam et al., 2024; Trigo et al., 2025) and was linked to an exceptional anticyclonic atmospheric blocking over the western Mediterranean; the anticyclonic conditions persisted during the winter months, suppressing wind-driven mixing during autumn and winter (Marullo et al., 2023; Trigo et al., 2025).
These findings highlight the importance of selecting an MHW detection method that aligns with the specific impacts intended for the study (Amaya et al., 2023; Darmaraki et al., 2024). In terms of ecosystems, this will depend on the adaptation ability of certain species or communities. A fixed baseline can highlight when temperatures exceed critical thresholds that historically have not been surpassed. For less adaptable species, which are more sensitive to specific temperature thresholds, a fixed baseline could better indicate when these critical points are reached, signalling potential risks to their survival. Moving baselines and detrended data adjust for the ongoing changes in the climate, and species with higher adaptability might show resilience to gradual shifts in the temperature but still be vulnerable when exposed to extreme temperature rises.
To illustrate the ecological relevance of these methodological choices, in the Mediterranean, Garrabou et al. (2022) reported that mass mortality events from 2015 to 2019 affected a similar number of taxa as in 2003, with Cnidaria and Bryozoa being the most affected groups. A similar impact was also detected in the study regions, where the intense summer MHW of 2017 led to a proliferation of mucilaginous algae, which triggered mass mortality of gorgonian species and affected sponge communities (Bensoussan et al., 2019). This is relevant because both 2015 and 2017 are highlighted as years with high intensity using the detrended method and the fixed baseline, whereas, with a moving baseline, the most prominent MHWs appear in 2016. Such effects had been previously observed following the 2003 MHW, when the same mucilaginous algae caused coral bleaching and necrosis in sponges and coralline algae in the Ligurian Sea, Northwest Mediterranean (Schiaparelli et al., 2007). During 2019, Hamdeno and Alvera-Azcaráte (2023) found that anomalously high temperatures coincided with a decrease in surface chlorophyll in the western Mediterranean. Interestingly, 2019 is not a year where we detect high MHW activity. Future work could compare chlorophyll concentrations from 2019 with those from strong MHW years such as 2017 or 2022.
This study provides an evaluation of sea surface temperature trends and marine heatwaves in the Balearic Sea from 42 years of SST satellite observations. We compare the results obtained by applying three different MHW detection methods (fixed baseline, moving baseline, and detrended data). The analysis reveals a significant warming trend of 0.036 ± 0.001 °C yr−1 in the Balearic Sea, with the highest increases observed south of Menorca and northwest of Mallorca. The comparison of MHW detection methods highlights the impact of methodological choices on MHW characterization. The fixed-baseline method indicates a substantial increase in both the number and duration of MHWs over time, peaking in recent years. In contrast, the moving baseline shows less pronounced increases in MHW parameters over time, suggesting that adjusting the baseline to recent years can mitigate the apparent increase in MHWs detected by the fixed baseline. The detrended-data approach further isolates MHWs from underlying temperature trends, resulting in fewer detected MHW days and shorter event durations. With this method, the mean and maximum intensities of MHWs were highest in 2003, 2017, and 2022. The cumulative intensity, which considers both the duration and magnitude of MHWs, was particularly high in 2022, reflecting prolonged and intense heatwave conditions. But regardless of the method employed, 2003 and 2022 stand out as the most prominent events in the Balearic Sea over the last couple of decades.
Overall, this study reveals the importance of method selection in MHW detection, demonstrating that the choice of baseline can significantly influence the annual number of days under MHWs, as well as their duration and intensities. While a fixed baseline detects an increase in MHWs over time, a moving baseline and the detrending method provide alternative approaches that aim to isolate extreme events from long-term trends.
The sea surface temperature data used in this study are available from the Copernicus Marine Service at https://doi.org/10.48670/moi-00173 (EU Copernicus Marine Service Product, 2024). The processing and analysis scripts used in this study are a modification of those available at https://github.com/canagrisa/MHW_moving_fixed (last access: 13 May 2024) (https://doi.org/10.5281/zenodo.7908932, Rosselló, 2023) and are openly accessible at https://github.com/Blanca-Fdez/Tracking_MHWs_Balearic_Sea (last access: 10 June 2025) (https://doi.org/10.5281/zenodo.15632482, Fernández Álvarez, 2025).
The supplement related to this article is available online at https://doi.org/10.5194/os-21-1987-2025-supplement.
All of the authors conceptualized the study. BFA performed the data analysis and wrote the first draft. All of the authors contributed to the preparation of the final draft.
The contact author has declared that none of the authors has any competing interests.
Publisher’s note: Copernicus Publications remains neutral with regard to jurisdictional claims made in the text, published maps, institutional affiliations, or any other geographical representation in this paper. While Copernicus Publications makes every effort to include appropriate place names, the final responsibility lies with the authors.
This article is part of the special issue “Special issue on ocean extremes (55th International Liège Colloquium)”. It is not associated with a conference.
The present research was carried out within the framework of the activities of the Spanish Government through the “María de Maeztu Centre of Excellence” accreditation to IMEDEA (CSIC-UIB) (grant no. CEX2021-001198). This work represents a contribution to the CSIC Interdisciplinary Thematic Platform (PTI) Teledetección (PTI-TELEDETECT).
This study is contribution number 14 to the project ObsSea4Clim (“Ocean observations and indicators for climate and assessments”) funded by the European Union (grant no. 101136548). Blanca Fernández-Álvarez received support first through a JAE-Intro scholarship granted by the Spanish National Research Council (CSIC) (grant no. JAEINT_23_01447) and later by a FPU grant by the Spanish Ministry of Science, Innovation and Universities (grant no. FPU23/01280). Bàrbara Barceló-Llull is funded by the Balearic Government Vicenç Mut programme (grant no. PD/008/2022) and received support from the METARAOR Project (grant no. PID2022-139349OB-I00) funded by MCIN/AEI/10.13039/501100011033/FEDER, UE. We also acknowledge the support of contract no. C3S2_520_CSIC/SC2 funded by the European Copernicus Climate Change Service (C3S) implemented by the European Centre for Medium-Range Weather Forecasts (ECMWF).
The article processing charges for this open-access publication were covered by the CSIC Open Access Publication Support Initiative through its Unit of Information Resources for Research (URICI).
This paper was edited by Aida Alvera-Azcárate and reviewed by Francisco Pastor and one anonymous referee.
Aguiar, E., Mourre, B., Alvera-Azcárate, A., Pascual, A., Mason, E., and Tintoré, J.: Strong long-lived anticyclonic mesoscale eddies in the Balearic Sea: Formation, intensification, and thermal impact, J. Geophys. Res.-Oceans, 127, e2021JC017589, https://doi.org/10.1029/2021JC017589, 2022.
Alemany, F., Quintanilla, L., Velez-Belchí, P., García, A., Cortés, D., Rodríguez, J. M., Fernández de Puelles, M. L., González-Pola, C., and López-Jurado, J. L.: Characterization of the spawning habitat of Atlantic bluefin tuna and related species in the Balearic Sea (western Mediterranean), Prog. Oceanogr., 86, 21–38, https://doi.org/10.1016/j.pocean.2010.04.014, 2010.
Amaya, D., Jacox, M. G., Fewings, M. R., Saba, V. S., Stuecker, M. F., Rykaczewski, R. R., Ross, A. C., Stock, C. A., Capotondi, A., Petrik, C. M., Bograd, S. J., Alexander, M. A., Cheng, W., Hermann, A. J., Kearney, K. A., and Powell, B. S.: Marine Heatwaves Need Clear Definitions so Coastal Communities Can Adapt, Nature, 616, 29–32, https://doi.org/10.1038/d41586-023-00924-2, 2023.
Bensoussan, N., Chiggiato, J., Buongiorno Nardelli, B., Pisano, A., and Garrabou, J.: Insights on 2017 Marine Heat Waves in the Mediterranean Sea, in: Copernicus Marine Service Ocean State Report, J. Oper. Oceanogr., https://doi.org/10.1080/1755876X.2019.1633075, 2019.
Bian, C., Jing, Z., Wang, H., and Wu, L.: Scale-Dependent Drivers of Marine Heatwaves Globally, Geophys. Res. Lett., 51, e2023GL107306, https://doi.org/10.1029/2023GL107306, 2024.
Capotondi, A., Rodrigues, R. R., Sen Gupta, A., Benthuysen, J. A., Deser, C., Frölicher, T. L., Lovenduski, N. S., Amaya, D. J., Le Grix, N., Xu, T., Hermes, J., Holbrook, N. J., Martinez-Villalobos, C., Masina, S., Roxy, M. K., Schaeffer, A., Schlegel, R. W., Smith, K. E., and Wang, C.: A global overview of marine heatwaves in a changing climate, Commun. Earth Environ., 5, 701, https://doi.org/10.1038/s43247-024-01806-9, 2024.
Chatzimentor, A., Doxa, A., Katsanevakis, S., and Mazaris, A. D.: Are Mediterranean marine threatened species at high risk by climate change?, Glob. Change Biol., 29, 1809–1821, https://doi.org/10.1111/gcb.16577, 2023.
Cheng, L., Abraham, J., Trenberth, K. E., Boyer, T., Mann, M. E., Zhu, J., Wang, F., Yu, F., Locarnini, R., Fasullo, J., Zheng, F., Li, Y., Zhang, B., Wan, L., Chen, X., Wang, D., Feng, L., Song, X., Liu, Y., Reseghetti, F., Simoncelli, S., Gouretski, V., Chen, G., Mishonov, A., Reagan, J., Von Schuckmann, K., Pan, Y., Tan, Z., Zhu, Y., Wei, W., Li, G., Ren, Q., Cao, L., and Lu, Y.: New Record Ocean Temperatures and Related Climate Indicators in 2023, Adv. Atmos. Sci., 41, 1068–1082, https://doi.org/10.1007/S00376-024-3378-5, 2024.
Crisci, C., Bensoussan, N., Romano, J. C., and Garrabou, J.: Temperature Anomalies and Mortality Events in Marine Communities: Insights on Factors behind Differential Mortality Impacts in the NW Mediterranean, PLoS ONE, 6, e23814, https://doi.org/10.1371/journal.pone.0023814, 2011.
Darmaraki, S., Denaxa, D., Theodorou, I., Livanou, E., Rigatou, D., Raitsos E., D., Stavrakidis-zachou, O., Dimarchopoulou, D., Bonino, G., Mcadam, R., Organelli, E., Pitsouni, A., and Parasyris, A.: Marine Heatwaves in the Mediterranean Sea: A Literature Review, Mediterr. Mar. Sci., 25, 586–620, https://doi.org/10.12681/mms.38392, 2024.
EU Copernicus Marine Service Product: Mediterranean Sea – High Resolution L4 Sea Surface Temperature Reprocessed, Mercator Ocean International [data set], https://doi.org/10.48670/moi-00173, last access: 27 April 2024.
Fernández Álvarez, B.: Blanca-Fdez/Tracking_MHWs_Balearic_Sea: v01, Zenodo [code], https://doi.org/10.5281/zenodo.15632482, 2025.
Garrabou, J., Gómez-Gras, D., Medrano, A., Cerrano, C., Ponti, M., Schlegel, R., Bensoussan, N., Turicchia, E., Sini, M., Gerovasileiou, V., Teixido, N., Mirasole, A., Tamburello, L., Cebrian, E., Rilov, G., Ledoux, J., Souissi, J. B., Khamassi, F., Ghanem, R., Benabdi, M., Grimes, S., Ocaña, O., Bazairi, H., Hereu, B., Linares, C., Kersting, D. K., La Rovira, G., Ortega, J., Casals, D., Pagès-Escolà, M., Margarit, N., Capdevila, P., Verdura, J., Ramos, A., Izquierdo, A., Barbera, C., Rubio-Portillo, E., Anton, I., López-Sendino, P., Díaz, D., Vázquez-Luis, M., Duarte, C., Marbá, N., Aspillaga, E., Espinosa, F., Grech, D., Guala, I., Azzurro, E., Farina, S., Cristina Gambi, M., Chimienti, G., Montefalcone, M., Azzola, A., Mantas, T.P., Fraschetti, S., Ceccherelli, G., Kipson, S., Bakran-Petricioli, T., Petricioli, D., Jimenez, C., Katsanevakis, S., Kizilkaya, I.T., Kizilkaya, Z., Sartoretto, S., Elodie, R., Ruitton, S., Comeau, S., Gattuso, J., and Harmelin, J.: Marine heatwaves drive recurrent mass mortalities in the Mediterranean Sea, Glob. Change Biol., 28, 5708–5725, https://doi.org/10.1111/gcb.16301, 2022.
Gleckler, P. J., Durack, P. J., Stouffer, R. J., Johnson, G. C., and Forest, C. E.: Industrial-era global ocean heat uptake doubles in recent decades, Nat. Clim. Change, 6, 394–398, https://doi.org/10.1038/nclimate2915, 2016.
Gruber, N., Clement, D., Carter, B. R., Feely, R. A., van Heuven, S., Hoppema, M., Ishii, M., Key, R. M., Kozyr, A., Lauvset, S. K., Lo Monaco, C., Mathis, J. T., Murata, A., Olsen, A., Perez, F. F., Sabine, C. L., Tanhua, T., and Wanninkhof, R.: The Oceanic Sink for Anthropogenic CO2 from 1994 to 2007, Science, 363, 1193–1199, https://doi.org/10.1126/science.aau5153, 2019.
Hamdeno, M. and Alvera-Azcaráte, A.: Marine heatwaves characteristics in the Mediterranean Sea: Case study the 2019 heatwave events, Front. Mar. Sci., 10, 1093760, https://doi.org/10.3389/fmars.2023.1093760, 2023
Helsel, D. R., Hirsch, R. M., Ryberg, K. R., Archfield, S. A., and Gilroy, E. J.: Statistical methods in water resources: U.S. Geological Survey Techniques and Methods, Chap. 10, 458 pp., https://doi.org/10.3133/tm4a3, 2020.
Heslop, E. E., Ruiz, S., Allen, J., López-Jurado, J. L., Renault, L., and Tintoré, J.: Autonomous Underwater Gliders Monitoring Variability at “Choke Points” in Our Ocean System: A Case Study in the Western Mediterranean Sea, Geophys. Res. Lett., 39, https://doi.org/10.1029/2012gl053717, 2012.
Hobday, A. J., Alexander, L. V., Perkins, S. E., Smale, D. A., Straub, S. C., Oliver, E. C. J., Benthuysen, J. A., Burrows, M. T., Donat, M. G., Feng, M., Holbrook, N. J., Moore, P. J., Scannell, H. A., Sen Gupta, A., and Wernberg, T.: A hierarchical approach to defining marine heatwaves, Prog. Oceanogr., 141, 227–238, https://doi.org/10.1016/j.pocean.2015.12.014, 2016.
Hobday, A. J., Oliver, E. C. J., Sen Gupta, A., Benthuysen, J. A., Burrows, M. T., Donat, M. G., Holbrook, N. J., Moore, P. J., Thomsen, M. S., Wernberg, T., and Smale, D. A.: Categorizing and naming marine heatwaves, Oceanography, 31, 162–173, https://doi.org/10.5670/oceanog.2018.205, 2018.
Holbrook, N. J., Scannell, H. A., Sen Gupta, A., Benthuysen, J. A., Feng, M., Oliver, E. C. J., Alexander, L. v., Burrows, M. T., Donat, M. G., Hobday, A. J., Moore, P. J., Perkins-Kirkpatrick, S. E., Smale, D. A., Straub, S. C., and Wernberg, T.: A global assessment of marine heatwaves and their drivers, Nat. Commun., 10, 2624, https://doi.org/10.1038/s41467-019-10206-z, 2019.
Ibrahim, O., Mohamed, B., and Nagy, H.: Spatial Variability and Trends of Marine Heat Waves in the Eastern Mediterranean Sea over 39 Years, J. Mar. Sci. Eng., 9, 643, https://doi.org/10.3390/jmse9060643, 2021.
IPCC: Changing Ocean, Marine Ecosystems, and Dependent Communities, The Ocean and Cryosphere in a Changing Climate, 447–588, https://doi.org/10.1017/9781009157964.007, 2022
Jacox, M. G.: Marine heatwaves in a changing climate, Nature, 571, 485–487, https://doi.org/10.1038/d41586-019-02196-1, 2019.
James, G., Witten, D., Hastie, T., Tibshirani, R., and Taylor, J.: An Introduction to Statistical Learning: with Applications in Python, Springer, https://www.statlearning.com/ (last access: 10 Novwmber 2024), 2023.
Juza, M., Fernández-Mora, A., and Tintoré, J.: Sub-Regional Marine Heat Waves in the Mediterranean Sea From Observations: Long-Term Surface Changes, Sub-Surface and Coastal Responses, Front. Mar. Sci., 9, 785771, https://doi.org/10.3389/fmars.2022.785771, 2022.
Juza, M., De Alfonso, M., and Fernández-Mora, Á.: Coastal ocean response during the unprecedented marine heatwaves in the western Mediterranean in 2022, State Planet, 4-osr8, 1–11, https://doi.org/10.5194/sp-4-osr8-14-2024, 2024.
Juza, M. and Tintoré, J.: Multivariate Sub-Regional Ocean Indicators in the Mediterranean Sea: From Event Detection to Climate Change Estimations, Front. Mar. Sci., 8, 610589, https://doi.org/10.3389/fmars.2021.610589, 2021.
Le Traon, P. Y., Reppucci, A., Alvarez Fanjul, E., Aouf, L., Behrens, A., Belmonte, M., Bentamy, A., Bertino, L., Brando, V. E., Kreiner, M. B., Benkiran, M., Carval, T., Ciliberti, S. A., Claustre, H., Clementi, E., Coppini, G., Cossarini, G., De Alfonso Alonso-Muñoyerro, M., Delamarche, A., Dibarboure, G., Dinessen, F., Drevillon, M., Drillet, Y., Faugere, Y., Fernández, V., Fleming, A., Garcia-Hermosa, M. I., Sotillo, M. G., Garric, G., Gasparin, F., Giordan, C., Gehlen, M., Gregoire, M. L., Guinehut, S., Hamon, M., Harris, C., Hernandez, F., Hinkler, J. B., Hoyer, J., Karvonen, J., Kay, S., King, R., Lavergne, T., Lemieux-Dudon, B., Lima, L., Mao, C., Martin, M.J., Masina, S., Melet, A., Buongiorno Nardelli, B., Nolan, G., Pascual, A., Pistoia, J., Palazov, A., Piolle, J. F., Pujol, M. I., Pequignet, A. C., Peneva, E., Pérez Gómez, B., Petit de la Villeon, L., Pinardi, N., Pisano, A., Pouliquen, S., Reid, R., Remy, E., Santoleri, R., Siddorn, J., She, J., Staneva, J., Stoffelen, A., Tonani, M., Vandenbulcke, L., von Schuckmann, K., Volpe, G., Wettre, C., and Zacharioudaki, A.: From observation to information and users: The Copernicus Marine Service perspective, Front. Mar. Sci., 6, 234, https://doi.org/10.3389/fmars.2019.00234, 2019.
Lionello, P. and Scarascia, L.: The relation between climate change in the Mediterranean region and global warming, Reg. Environ. Change, 18, 1481–1493, https://doi.org/10.1007/s10113-018-1290-1, 2018.
Marbà, N., Jordà, G., Agustí, S., Girard, C., and Duarte, C. M.: Footprints of climate change on Mediterranean Sea biota, Front. Mar. Sci., 2, 155437, https://doi.org/10.3389/fmars.2015.00056, 2015.
Marcos, M., Amores, A., Agulles, M., Robson, J., and Feng, X.: Global warming drives a threefold increase in persistence and 1 °C rise in intensity of marine heatwaves, P. Natl. Acad. Sci. USA, 122, e2413505122, https://doi.org/10.1073/pnas.2413505122, 2025.
Martínez, J., Leonelli, F. E., García-Ladona, E., Garrabou, J., Kersting, D. K., Bensoussan, N., and Pisano, A.: Evolution of marine heatwaves in warming seas: the Mediterranean Sea case study, Front. Mar. Sci., 10, 1193164, https://doi.org/10.3389/fmars.2023.1193164, 2023.
Marullo, S., Serva, F., Iacono, R., Napolitano, E., di Sarra, A., Meloni, D., Monteleone, F., Sferlazzo, D., de Silvestri, L., de Toma, V., Pisano, A., Bellacicco, M., Landolfi, A., Organelli, E., Yang, C., and Santoleri, R.: Record-breaking persistence of the 2022/23 marine heatwave in the Mediterranean Sea, Environ. Res. Lett., 18, 114041, https://doi.org/10.1088/1748-9326/ad02ae, 2023.
McAdam, R., Bonino, G., Clementi, E., and Masina, S.: Forecasting the Mediterranean Sea marine heatwave of summer 2022, State Planet, 4-osr8, 1–10, https://doi.org/10.5194/sp-4-osr8-13-2024, 2024.
Merchant, C. J., Embury, O., Bulgin, C. E., Block, T., Corlett, G. K., Fiedler, E., Good, S. A., Mittaz, J., Rayner, N. A., Berry, D., Eastwood, S., Taylor, M., Tsushima, Y., Waterfall, A., Wilson, R., and Donlon, C.: Satellite-Based Time-Series of Sea-Surface Temperature since 1981 for Climate Applications, Sci. Data, 6, 223, https://doi.org/10.1038/s41597-019-0236-x, 2019.
Mohamed, B., Ibrahim, O., and Nagy, H.: Sea Surface Temperature Variability and Marine Heatwaves in the Black Sea, Remote Sens., 14, 2383, https://doi.org/10.3390/rs14102383, 2022.
Mohamed, B., Barth, A., and Alvera-Azcárate, A.: Extreme marine heatwaves and cold-spells events in the Southern North Sea: classifications, patterns, and trends, Front. Mar. Sci., 10, https://doi.org/10.3389/fmars.2023.1258117, 2023.
Oliver, E. C. J.: Mean warming not variability drives marine heatwave trends, Clim. Dynam., 53, 1653–1659, https://doi.org/10.1007/s00382-019-04707-2, 2019.
Oliver, E. C. J., Donat, M. G., Burrows, M. T., Moore, P. J., Smale, D. A., Alexander, L. v., Benthuysen, J. A., Feng, M., sen Gupta, A., Hobday, A. J., Holbrook, N. J., Perkins-Kirkpatrick, S. E., Scannell, H. A., Straub, S. C., and Wernberg, T.: Longer and More Frequent Marine Heatwaves over the Past Century, Nat. Commun., 9, 1324, https://doi.org/10.1038/s41467-018-03732-9, 2018.
Oliver, E. C. J., Benthuysen, J. A., Darmaraki, S., Donat, M. G., Hobday, A. J., Holbrook, N. J., Schlegel, R. W., and Sen Gupta, A.: Marine Heatwaves, Annu. Rev. Mar. Sci., 13, 313–342, https://doi.org/10.1146/annurev-marine-032720-095144, 2021.
Pascual, A. and Macías, D.: Ocean Science Challenges for 2030, Vol. 13, Madrid, Consejo Superior de Investigaciones Científicas (Eds.), Editorial CSIC, Madrid, Spain, 201 pp., ISBN 978-84-00-10762-8, 2021.
Pastor, F., Valiente, J. A., and Khodayar, S.: A Warming Mediterranean: 38 Years of Increasing Sea Surface Temperature, Remote Sens., 12, 2687, https://doi.org/10.3390/rs12172687, 2020.
Pearce, A. F., Lenanton, R., Jackson, G., Moore, J., Feng, M., and Gaughan D.: The “marine heat wave” off Western Australia during the summer of 2010/11, Western Australian Fisheries and Marine Research Laboratories, North Beach, Australia, https://fish.gov.au/Archived-Reports/Documents/Pearce_et_al_2011.pdf (last access: 9 September 2025), 2011.
Pirro, A., Martellucci, R., Gallo, A., Kubin, E., Mauri, E., Juza, M., Notarstefano, G., Pacciaroni, M., Bussani, A., and Menna, M.: Subsurface warming derived from Argo floats during the 2022 Mediterranean marine heat wave, State Planet, 4-osr8, 1–12, https://doi.org/10.5194/sp-4-osr8-18-2024, 2024.
Pisano, A., Marullo, S., Artale, V., Falcini, F., Yang, C., Leonelli, F. E., Santoleri, R., and Nardelli, B. B.: New Evidence of Mediterranean Climate Change and Variability from Sea Surface Temperature Observations, Remote Sens., 12, 132, https://doi.org/10.3390/rs12010132, 2020.
Reglero, P., Ortega, A., Balbín, R., Abascal, F. J., Medina, A., Blanco, E., de la Gándara, F., Alvarez-Berastegui, D., Hidalgo, M., Rasmuson, L., Alemany, F., and Fiksen, Ø: Atlantic bluefin tuna spawn at suboptimal temperatures for their offspring, P. Roy. Soc. B-Biol. Sci., 285, 20171405, https://doi.org/10.1098/rspb.2017.1405, 2018.
Rosselló, P.: canagrisa/MHW_moving_fixed: MHW Mediterranean Sea moving-fixed baseline v1.0, Zenodo [code], https://doi.org/10.5281/zenodo.7908932, 2023.
Rosselló, P., Pascual, A., and Combes, V.: Assessing Marine Heat Waves in the Mediterranean Sea: A Comparison of Fixed and Moving Baseline Methods, Front. Mar. Sci., 10, 1168368, https://doi.org/10.3389/fmars.2023.1168368, 2023.
Schiaparelli, S., Castellano, M., Povero, P., Sartoni, G., and Cattaneo-Vietti, R.: A benthic mucilage event in North-Western Mediterranean Sea and its possible relationships with the summer 2003 European heatwave: short term effects on littoral rocky assemblages, Mar. Ecol., 28, 341–353, https://doi.org/10.1111/j.1439-0485.2007.00155.x, 2007.
Shaltout, M. and Omstedt, A.: Recent Sea Surface Temperature Trends and Future Scenarios for the Mediterranean Sea, Oceanologia, 56, 411–443, https://doi.org/10.5697/oc.56-3.411, 2014.
Simon, A., Plecha, S. M., Russo, A., Teles-Machado, A., Donat, M. G., Auger, P.-A., and Trigo, R. M.: Hot and cold marine extreme events in the Mediterranean over the period 1982–2021, Front. Mar. Sci., 9, https://doi.org/10.3389/fmars.2022.892201, 2022.
Simon, A., Pires, C., Frölicher, T. L., and Russo, A.: Long-term warming and interannual variability contributions' to marine heatwaves in the Mediterranean, Weather and Climate Extremes, 42, 100619, https://doi.org/10.1016/j.wace.2023.100619, 2023.
Smith, K. E., Sen Gupta, A., Amaya, D., Benthuysen, J. A., Burrows, M. T., Capotondi, A., Filbee-Dexter, K., Frölicher, T. L., Hobday, A. J., Holbrook, N. J., Malan, N., Moore, P. J., Oliver, E. C. J., Richaud, B., Salcedo-Castro, J., Smale, D. A., Thomsen, M., and Wernberg, T.: Baseline matters: Challenges and implications of different marine heatwave baselines, Prog. Oceanogr., 231, 103404, https://doi.org/10.1016/j.pocean.2024.103404, 2025.
Trigo, R. M., Barriopedro, D., Garrido-Perez, J. M., Simon, A., Plecha, S. M., Teles-Machado, A., Russo, A., and Garcia-Herrera, R.: The outstanding European and Mediterranean heatwave activity during summer 2022, Atmos. Res., 323, 108195, https://doi.org/10.1016/j.atmosres.2025.108195, 2025.
Yue, S. and Wang, C.: The Mann-Kendall Test Modified by Effective Sample Size to Detect Trend in Serially Correlated Hydrological Series, Water. Resour. Manag., 18, 201–218, https://doi.org/10.1023/B:WARM.0000043140.61082.60, 2004.
- Abstract
- Introduction
- Data and methods
- Sea surface temperature trend
- Marine heatwaves: the effect of different detection methods
- Conclusions
- Code and data availability
- Author contributions
- Competing interests
- Disclaimer
- Special issue statement
- Acknowledgements
- Financial support
- Review statement
- References
- Supplement