the Creative Commons Attribution 4.0 License.
the Creative Commons Attribution 4.0 License.
 | 04 Sep 2025
Synoptic observation of a full mesoscale eddy lifetime and its secondary instabilities in the Gulf of Mexico
Charly de Marez
Mesoscale eddies are crucial to ocean circulation, climate, and tracer transport. Yet their life cycle has never been observed synoptically at high resolution. In this study, I use novel SWOT satellite altimetry data to present the first synoptic characterization of a loop current eddy's life cycle in the Gulf of Mexico, during a 6-month period. SWOT allows for the direct observation of key dynamical processes – such as eddy shielding, high-mode instabilities, and dipolar interactions – that were previously only partially resolved in interpolated altimetry products and mainly described in theoretical or numerical studies. These observations challenge the traditional view of eddies as simple, elliptical structures, emphasizing the role of mesoscale interactions in their evolution. Furthermore, SWOT captures intense submesoscale turbulence at the eddy's rim, revealing secondary instabilities likely driving its decay. These findings not only validate decades of vortex theory but also offer new insights into oceanic turbulence dynamics.
- Article
(3514 KB) - Full-text XML
- BibTeX
- EndNote


The study of oceanic vortices, or eddies, has been a cornerstone of oceanography for decades, driven by the critical role these features play in biological activities (Chelton et al., 2011a), tracer transport (Zhang et al., 2014), and properties of the water column (Dong et al., 2014). In particular, the mesoscale (10–100 km) eddy field is at least as energetic as the large-scale circulation (Zhang et al., 2014), essential for the air–sea interactions (Small et al., 2008) and thus for the evolution of climate (Palter, 2015). Early observations of oceanic mesoscale eddies were limited by the resolution of available data, primarily relying on ship-based measurements, which provided isolated snapshots of ocean conditions (Fuglister and Worthington, 1951). With the advent of satellite measurements in the late 20th century – first with sea surface temperature (SST) radiometry (Richardson et al., 1973), then altimetric sea surface height (SSH) (Chelton, 2001) – the tracking of mesoscale eddy surface signatures improved dramatically. This enabled global-scale analyses (Chelton et al., 2007), though at low resolution (typically °). In parallel, the theoretical and numerical understanding of mesoscale eddy dynamics has advanced significantly, offering valuable insights into eddy behavior through fluid mechanics (see the literature of vortex studies since McWilliams and Flierl, 1979). However, the inability to synoptically measure the horizontal structure of eddies at high resolution – particularly dynamic quantities – during their lifetime remains a significant observational gap, hindering the global validation of these theoretical and numerical studies.
In the ocean, mesoscale eddies form a complex “soup” of currents, yet some eddies exhibit distinct patterns – such as a large diameter, recurrence, long lifetimes, and isolation – that make them ideal candidates for studying their specific dynamics in greater detail. The most famous examples lie in the western boundaries of oceanic basins: the Gulf Stream rings (Richardson, 1983), the Agulhas rings (Olson and Evans, 1986), the Kuroshio rings (Li et al., 1998), or the loop current eddies (LCEs; Meunier et al., 2018). The latter are large, recurrent features in the Gulf of Mexico, whose evolution has been extensively studied both numerically and observationally since decades (Hamilton et al., 1999). LCEs form at the boundary of the loop current, stirring the surrounding water masses as they drift, shaping the hydrography of the Gulf of Mexico (Sheinbaum et al., 2024). LCEs have been shown to impact pollutant transport (see, e.g., Goni et al., 2015). They are also key for heat transport, thus creating strong air–sea exchanges, particularly important in this area for hurricane intensification (Shay et al., 2000).
The ability to track the dynamics of eddies such as LCEs has been made possible through gridded altimetry, which allows for the detection of their spatial extent and evolution over time (Mason et al., 2014). Despite its usefulness in recovering some of the eddies' dynamical properties (e.g., radius, velocity, amplitude), this approach has large flaws, mainly due to the fact that the spatiotemporal interpolation often fails to provide full confidence in accurately capturing the horizontal shape of oceanic features (Le Traon et al., 1998) from their birth until their death.
The Surface Water and Ocean Topography (SWOT; Morrow et al., 2019) program, a collaborative effort between CNES and NASA launched in late 2022, marks a pivotal advancement in the measure of mesoscale eddies in the ocean. With its unprecedented spatial resolution and 2D instantaneous coverage, SWOT enables synoptic observation of ocean features with fine-scale precision. In this study, I demonstrate the ability of SWOT to capture the evolution of a mesoscale eddy, focusing on a loop current eddy in the Gulf of Mexico. This highlights the capacity of modern altimetry to bridge the gap between numerical predictions and real-time observations of oceanic vortices.
SWOT's non-interpolated swaths (see full details in Appendix A) provide continuous, high-resolution observations of a particular LCE's horizontal structure during its lifetime (Fig. 1a–r), between its formation in early October 2023 until the end of March 2024.
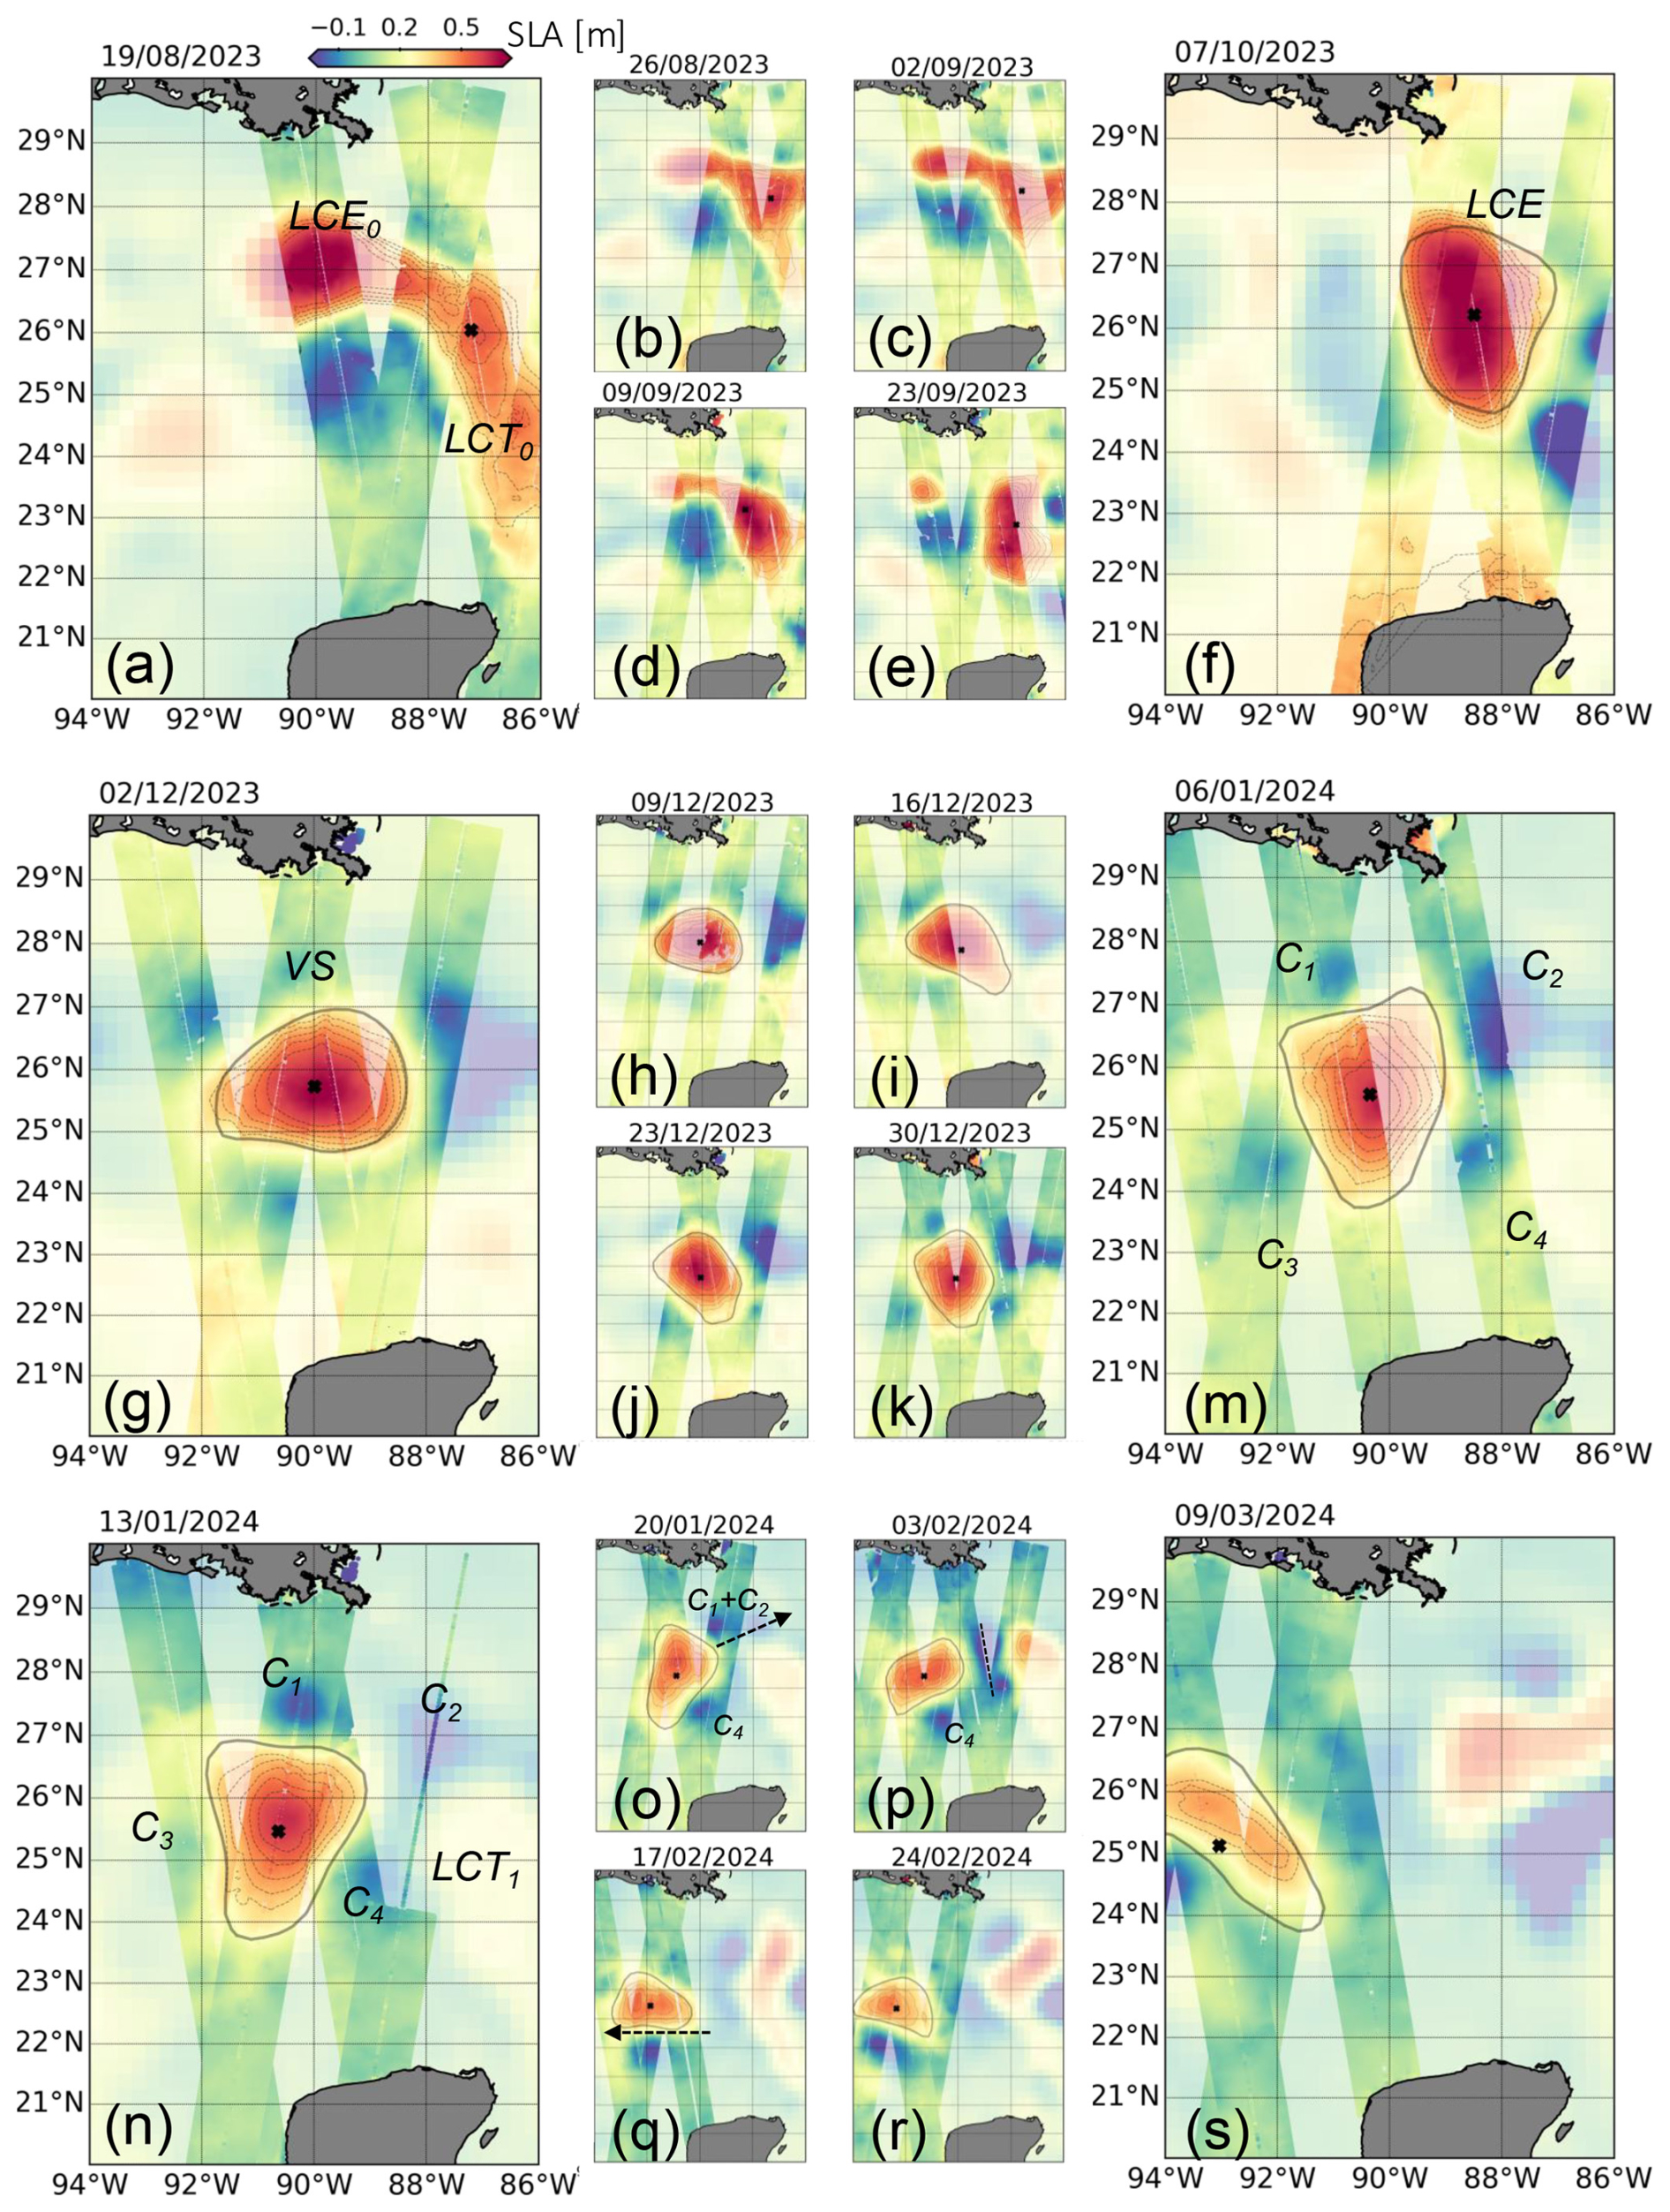
Figure 1Evolution of the loop current eddy (LCE) over its lifetime from 2 km resolution SWOT altimetry. Each panel shows the ° gridded AVISO sea level anomaly (SLA) as the background color for the indicated date; note that the color mapping of AVISO SLA is voluntarily paler for presentation purpose. Superimposed are the 2 km denoised SWOT SLA measurements along passes within ±3.5 d of the given date. The black contour marks the LCE detection from gridded altimetry, while thin gray contours represent iso-SLA lines from SWOT passes at 5 cm intervals. All panels have the same x- and y-axis ranges. The labels LCE0, LCT0, LCE, VS, C1, C2, C3, C4, and LCT1 will be discussed in the main text.
In August 2023, a pre-existing large anticyclone (LCE0) was positioned near 27° N, 90° W. Around the same time, the loop current overshot into the Gulf of Mexico, forming a loop current tongue (LCT0, also referred to in the literature as an “extended mode loop current”). The latter subsequently merged with LCE0 (Fig. 1a–d), absorbing it in what has been referred to as a “reattachment” sequence, a process previously identified in regional numerical modeling studies of the Gulf of Mexico (Oey et al., 2003) and gridded altimetry (Manta et al., 2023). In early October, the loop current detached, generating the LCE that is the focus of this study. This newly formed eddy was then trapped within a train of alternating-polarity eddies, with opposite-signed sea level anomalies (SLAs) emerging to both its west and east (Fig. 1d–f). As it stirred surrounding vortices of opposite polarities – marked by negative SLA patches – it created a strong vorticity shield (VS), i.e., a ring of opposite-sign (cyclonic) vorticity surrounding the eddy (Valcke and Verron, 1997). By early December, the LCE had settled into a nearly circular shape, its VS effectively isolating it from external influences (Fig. 1g).
In December 2023, the LCE undergoes a destabilization sequence. Its VS transitions into a rotating train of four cyclones (C1–4; see Fig. 1h–m). While the companion cyclones may not all be generated de novo by the instability, their coherent configuration and evolution suggest that the LCE instability reinforces a dominant mode-4 structure. This kind of structure has been referred to by various names in past studies, including “squared vortex”, “pentapole”, and “mode-4 vortex”. It has long been predicted by numerical simulations and theoretical studies (see, e.g., Morel and Carton, 1994; Chérubin et al., 2006, and our own simulations in Appendix B) and stands as a textbook example of eddy destabilization. Such vortical structures with intense satellite vortices are typically self-destructive (Carton, 2009), and the mode-4 structure often leads to rapid eddy decay. Here, the LCE remains coherent, suggesting that external interactions, likely with surrounding mesoscale structures, modulate the instability and prevent the eddy’s destruction.
In January 2024, a new loop current tongue (LCT1) forms as the loop current undergoes another detachment (Fig. 1n). Unlike in August 2023, when LCT0 merged with a pre-existing eddy (LCE0), this time, satellite cyclones C2,4 act as a barrier: the presence of these vortices prevents the merging of LCT1 with the LCE (Fig. 1p). This directly confirms previous model- and altimetry-based predictions (Le Hénaff et al., 2014) of LCE shedding being blocked by cyclonic activity in the eastern Gulf of Mexico. Here, I further show that these cyclonic structures are generated by the LCE's own instabilities and play a major role in determining its fate. As the system evolves, two of the cyclonic satellites, C1 and C2, are expelled eastward by LCT1 (see black arrow in Fig. 1o), leaving the LCE with only two remaining companions (Fig. 1o–q). While SWOT does not provide full coverage of their trajectory, it is likely that C1 and C2 eventually merge. This sequence alters the symmetry of the system, leaving the LCE coupled with a single cyclone (C4). The result is the formation of a dipole (Fig. 1q).
In mid-February, the dipole begins to drift steadily westward (Fig. 1q–s; the dipolar movement is schematized by the black arrow in Fig. 1q), guiding the LCE toward the well-known eddy graveyard at the western boundary of the Gulf of Mexico (Biggs, 1992; Tenreiro et al., 2018). The dipole slightly deviates northward due to the asymmetry of the dipolar structure. As it moves, the LCE gradually loses energy and weakens, as seen by its loss in SLA amplitude and as previously demonstrated in Meunier et al. (2020). This westward drift is not primarily driven by planetary Rossby wave propagation, as traditionally assumed in the literature (see, e.g., Chelton et al., 2011b; de Marez et al., 2020b). In this particular case, the drift results from a dipolar interaction between the LCE and its remaining cyclone companion, which emerges during the instability phase. This highlights that, at least for the event studied here, mesoscale interactions can play a dominant role in shaping the trajectory of loop current eddies and suggests that stability properties and eddy–eddy interactions should be considered alongside large-scale wave dynamics.
I was able to analyze the complete life cycle of a loop current eddy with unprecedented spatial detail. Previous studies relied on low-resolution, gridded altimetry products that required spatiotemporal interpolation and strong assumptions to reconstruct eddy evolution (see, e.g., Hamilton et al., 1999), while high-resolution observations, such as sea surface temperature, provided only partial insights without direct velocity estimates (Hall and Leben, 2016). This observational gap limited the ability to clearly identify key dynamical features – such the emergence of high-mode instabilities – which, in interpolated altimetric fields, can be smoothed or distorted and occasionally misrepresented (Le Traon et al., 1998).
More broadly, in the global ocean, classical altimetry studies primarily characterized eddy self-evolution through their ellipticity, a proxy for mode-2 deformations affecting velocity estimates (Ioannou et al., 2019). However, they could not resolve more complex structures. With SWOT's high-resolution altimetry, as demonstrated here, I now observe higher-order modes, revealing that eddies are not merely elliptical but can exhibit much sharper gradients than previously thought. This challenges the long-standing view of eddies as circular structures and suggests that velocity estimates commonly used in global studies (Zhang et al., 2014) may require revision using SWOT's high-resolution data.
The present observation confirms that the mechanisms governing oceanic mesoscale eddy evolution – instability growth, eddy shielding, and dipolar interactions – are fully consistent with theoretical and numerical “vortex studies” dating back to the 1980s (e.g., Ikeda, 1981; Gent and McWilliams, 1986). However, unlike past descriptions that often treated these processes separately, I now see that these textbook mechanisms are not isolated processes; rather, they are deeply entangled, continuously interacting and shaping the oceanic mesoscale eddies evolution in complex ways.
Being able to observe the horizontal shape of long-living eddies with such accuracy is particularly significant for the vortex dynamics community, which has long relied on numerical and theoretical predictions to study mesoscale eddies in the ocean. The lack of direct, high-resolution observations has remained a major limitation, leaving key aspects of vortex evolution unverified in real-ocean conditions. The present observations show evidence that the textbook mechanisms of vortex instability and decay are consistent with 4 decades of theoretical and numerical work. These results mark a turning point, opening new perspectives for both theoretical and modeling studies of oceanic eddies and their role in large-scale ocean circulation, as well as in helping the near-real-time monitoring and interpretation of the vertical structure of those eddies through, e.g., autonomous glider deployment (Meunier et al., 2018).
Beyond the mesoscale dynamics governing the LCE's evolution, a closer look at its periphery reveals the presence of intense submesoscale instabilities.
Until now, the sharpness of eddy rims has been largely masked by low-resolution altimetric products. Here, the highest-resolution SWOT product (with a 250 m spacing grid) resolves the steep SLA gradients at the edge of the LCE. I present two particular times, where four distinct SWOT passes sampled the quasi-totality of the LCE's northern edge, one before its destabilization sequence early December (Fig. 2a, c, and e), and another one after the mode-4 structure emerged (Fig. 2b, d, and f). The latest SWOT data processing now provides direct velocity estimates at the eddy's edge, revealing remarkably fine-scale dynamics. Current magnitudes reach up to 𝒪(1) m s−1, with velocity variations over very short distances, resulting in sharp velocity gradients. These gradients are particularly enhanced between the satellite cyclone and the LCE core in January (Fig. 2d), reinforcing the idea that the primary instability of the LCE further steepened these gradients. This confirms previous studies using numerical modeling discussing the velocity gradient sharpness at LCEs' edges (Hiron et al., 2021).
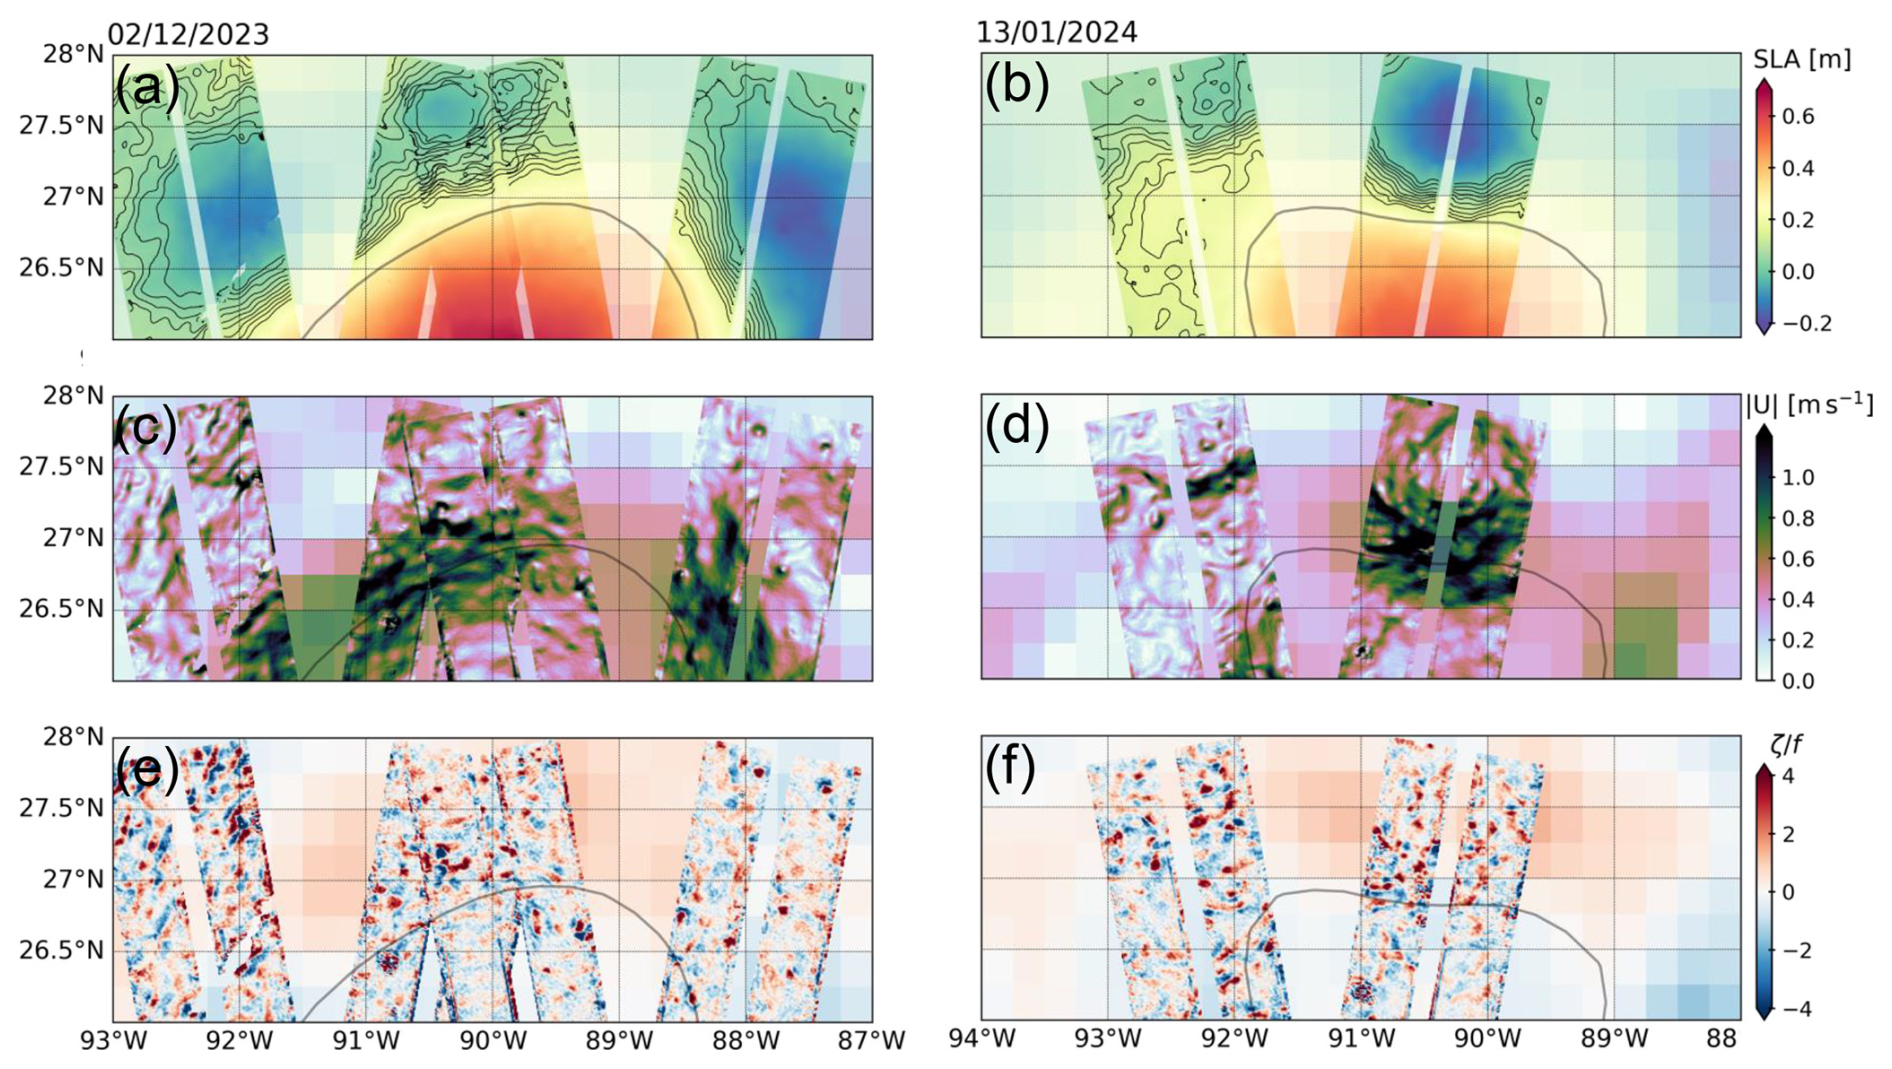
Figure 2Observation of secondary instabilities at the rim of the loop current eddy from 250 m resolution SWOT altimetry. (a, b) Same as Fig. 1g and m but zoomed in and using the 250 m denoised SWOT SLA product. Black contour shown in all panels marks the LCE detection from gridded altimetry, while additional black contours in panels (a, b) indicate iso-SLA lines from SWOT passes at 2 cm intervals in the range m; note that the color map is the same as in Fig. 1. (c, d) Geostrophic current magnitude derived from the denoised SWOT SLA. (e, f) Normalized relative vorticity computed from the geostrophic currents shown in (c, d). In panels (c)–(f), the same quantity derived from AVISO SLA is shown in the background, with a paler color mapping for presentation purposes.
These conditions are well known to generate submesoscale features through various dynamical instabilities, including barotropic, baroclinic, and centrifugal instabilities (McWilliams, 2019). Additionally, in the case of the LCE described here, a surface mixed layer is present (about 100 m deep, as seen in in situ data not shown here), favoring surface quasi-geostrophic (SQG) dynamics. This enhances the development of submesoscale structures (see our SQG simulation reproducing the LCE conditions in Appendix B and, e.g., Capet et al., 2008). Here, I observe that the strong frontal gradients at the eddy’s rim trigger secondary instabilities, a process extensively described by de Marez et al. (2020a). This leads to the formation of intense submesoscale coherent vortices (SCVs) and filaments with high vorticity values (), as clearly visible in Fig. 2e and f.
Numerical models have long predicted the formation of such fronts, filaments, and submesoscale coherent vortices at the edges of mesoscale eddies (see for example Fig. 2 of Brannigan et al., 2017). However, observational evidence of such structures has remained scarce. On the one hand, snapshots from high-resolution satellite imagery, such as chlorophyll-a concentration, have only hinted at their presence (Lévy et al., 2018). On the other hand, occasional in situ measurements have reported isolated snapshots of submesoscale processes at eddy peripheries (in particular in LCE cases using ocean gliders; see Meunier et al., 2019; Pérez et al., 2022). Thus, without synoptic velocity fields, direct observations of these intense vorticity structures were lacking. This raised a fundamental question in numerical oceanography: were these submesoscale features real or merely numerical artifacts arising from ad hoc parameterizations? For the case of this LCE, SWOT provides an unambiguous observational answer. Applied to the global ocean, it will therefore likely reveal the ubiquity of intense submesoscale turbulence around eddies.
Submesoscale secondary instabilities play a crucial role in the long-term decay of eddies, including the LCE observed in this study. These instabilities drive the gradual loss of energy and mass of eddies, as momentum and tracers are redistributed over shorter timescales than those associated with mesoscale processes alone. This mechanism provides a pathway for energy dissipation. Our observations align with previous in situ studies showing that LCEs steadily lose amplitude as they drift westward (Meunier et al., 2024). This has important implications for heat transport and air–sea interactions. Eddies like the LCE store and redistribute large amounts of heat during their lifetime (Meunier et al., 2020), but the mechanisms controlling their heat loss remain uncertain. Submesoscale processes likely enhance lateral heat release by increasing diffusivity at the eddy periphery (Gentil et al., 2024). Along with recent studies, this suggests that existing parameterizations of eddy-driven heat fluxes may need revision and update to account for submesoscale processes.
This study marks a significant advance in satellite oceanography by providing the first synoptic, high-resolution observation of the full development and mature evolution of a mesoscale eddy, captured continuously over several months. It also illustrates that high-resolution satellite altimetry can resolve submesoscale instabilities at the edge of an eddy, providing new insights into the small-scale processes that contribute to eddy decay.
While this represents a single case study, the implications are far-reaching. With SWOT's unprecedented resolution, the oceanographic community can now extend this approach globally, enabling a systematic characterization of mesoscale eddy life and submesoscale turbulence across all ocean basins. This is a crucial step toward closing the oceanic energy budget, bridging the gap between mesoscale eddy dynamics and smaller-scale dissipative processes. Unlike machine learning approaches, which often provide parameterizations without physical interpretability, SWOT will likely allow us to observe, analyze, and ultimately derive physics-based parameterizations of small-scale turbulence. This ensures a deeper understanding of ocean dynamics and paves the way for improved modeling of the Earth's complex systems.
I leverage newly released SWOT satellite data (see some background in, e.g., Morrow et al., 2019), and in particular, I use the latest release (v2.0.1) of Level-3 SWOT data, namely SWOT_L3_SSH “Basic” (2 km resolution) and “Unsmoothed” (250 m resolution) products, derived from the L3 SWOT KaRIn Low rate ocean data products provided by NASA/JPL and CNES. The Level-3 processing removes SWOT's systematic errors and has been extensively validated using other altimeters, numerical models, and in situ data in the global ocean (Dibarboure et al., 2025). These datasets are produced and freely distributed by the AVISO and DUACS teams as part of the DESMOS Science Team project (AVISO/DUACS, 2023a, b). I use the “denoised” SLA for our analysis (see Dibarboure et al., 2023, for details on the method), as well as the geostrophic velocity derived from it. Note that this process tends to reduce the overall energy, which complicates the interpretation in lower-energy regions due to the noise levels (see, e.g., Callies and Wu, 2019). This has no implication in our case, given the very high energy level of the LCE and its surroundings. However, note that this procedure may lead to spurious velocity patterns at the edge of swaths, thus leading to vorticity artifacts that should not be taken into account for the analysis. Recent studies (Zhang et al., 2025b, 2024; Verger-Miralles et al., 2024; Du and Jing, 2024; Damerell et al., 2025; Wang et al., 2025a; Tchilibou et al., 2025; Carli et al., 2025; Dibarboure et al., 2025; Zhang et al., 2025a) and ongoing personal work show the SWOT's ability to resolve small mesoscale structures previously undetected in gridded products. Also, other recent studies have demonstrated that SWOT’s resolution and noise level are sufficient to resolve features at the submesoscale, particularly in regions of strong mesoscale activity. In particular, Tranchant et al. (2025), Coadou-Chaventon et al. (2025), and Wang et al. (2025b) provide detailed analyses of SWOT’s capability to capture fine-scale dynamics, including assessments of geostrophic vorticity derived from SLA fields. These works support the interpretation of small-scale structures such as those shown in Fig. 2, even in high-Rossby-number regimes. I refer the reader to these studies for an in-depth evaluation of SWOT's performance in such contexts. Therefore, although a complete in situ validation is not yet available in our study area, I have no doubt that SWOT's resolution is able to capture the dynamics of the LCE and its surroundings.
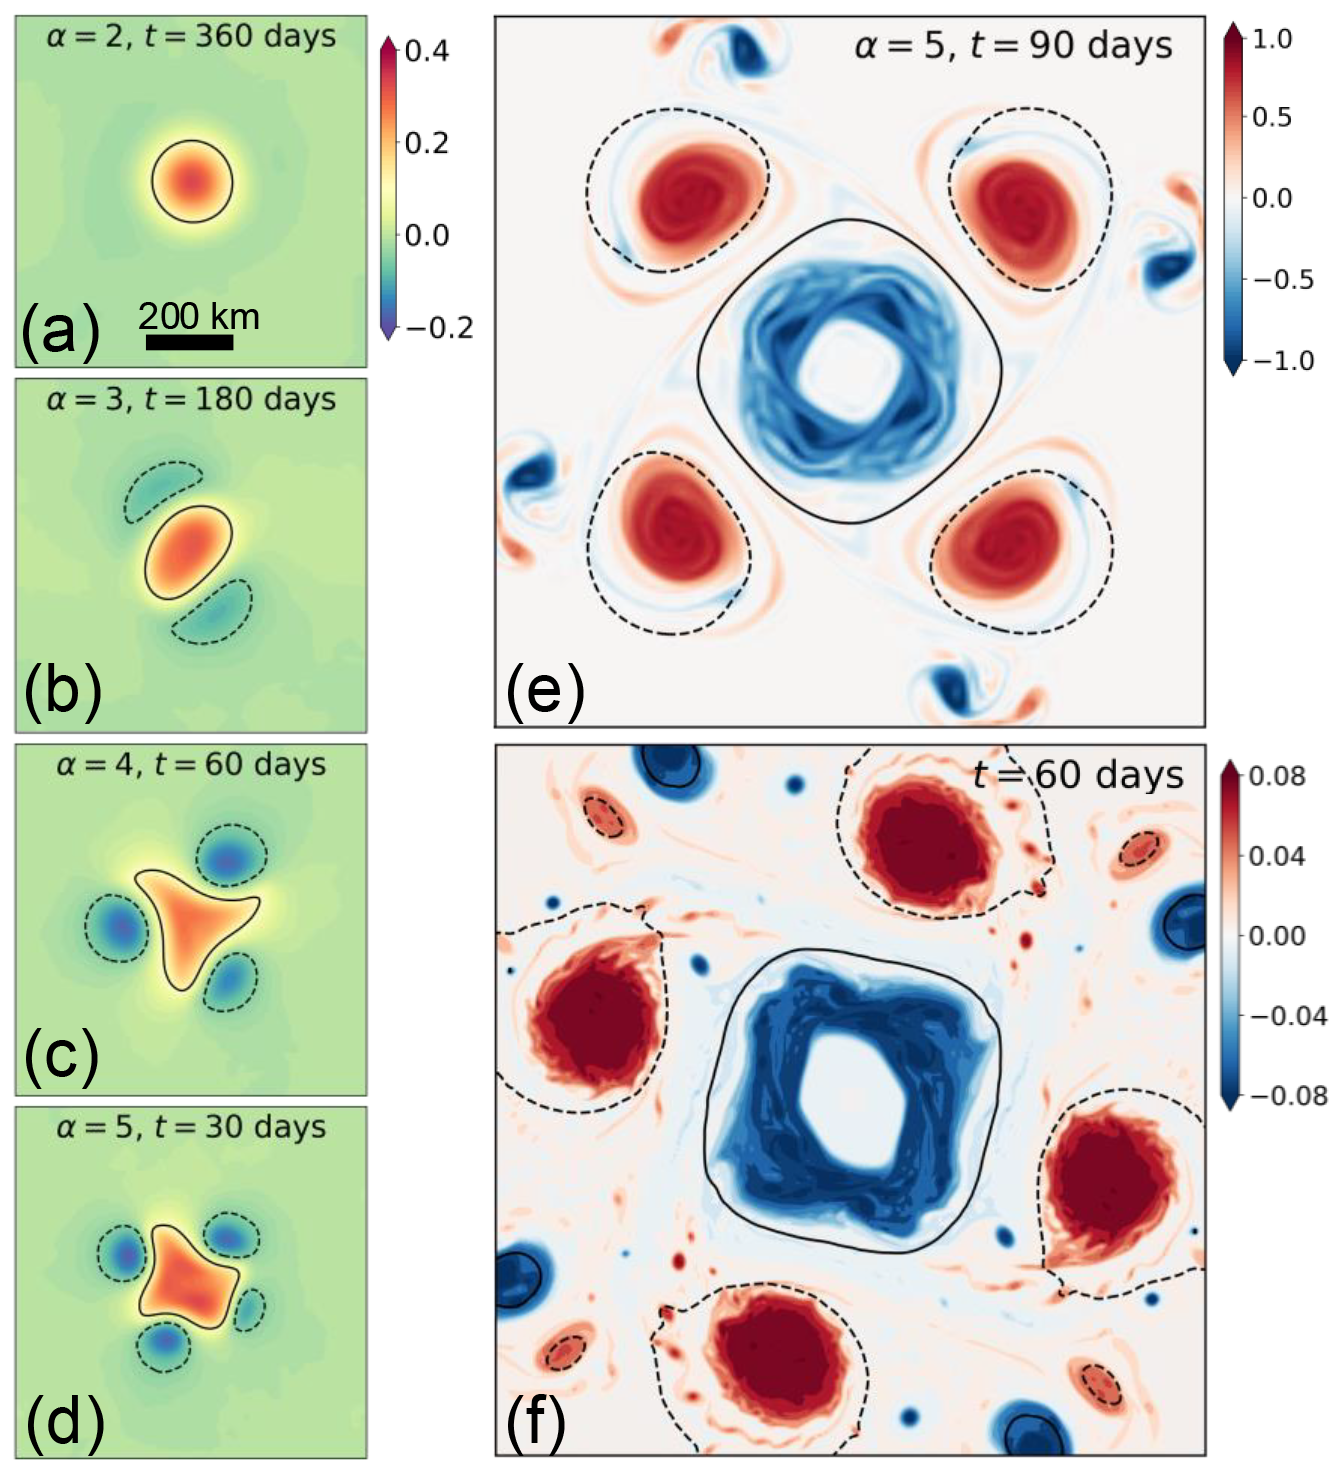
Figure A1Eddy stability numerical simulations. (a–d) Snapshots of the upper-layer streamfunction from low-resolution two-layer quasi-geostrophic (QG) simulations, initialized with . (e) Upper-layer vorticity snapshot from a high-resolution two-layer QG simulation, using the same parameters as in (d); dashed and solid contours show −0.05 and 0.1 streamfunction contours, respectively. (f) Surface vorticity snapshot from a high-resolution surface quasi-geostrophic (SQG) simulation, also using the same parameters as in (d).
To track the eddy's lifetime, I identified its center position each week using a gridded altimetric product (° AVISO SLA). Around this position, I selected the closest SWOT tracks sampled within ±3.5 d of the detected eddy center date. For example, SWOT's passes in Fig. 1g are from passes 175, 203, 244, and 272 of SWOT cycle 7, respectively sampled on 29, 30 November, and 2 and 3 December 2023. Since SWOT measurements are near-instantaneous compared to timescales of interest (e.g., weeks to months for eddy destabilization; see Fig. A1), this approach ensures spatiotemporal continuity. It also guarantees that, in each panel of Fig. 1, time gaps between passes remain too small to affect our conclusions. This approach ensures, for example, (1) a full spatiotemporal coverage of the LCT0 during the LCE formation (Fig. 1a–d); (2) the fact that the small cyclones C1–4 are LCE satellites and not part of another larger cyclones (Fig. 1l); and (3) that the dipole in Fig. 1o–r remains coherent over time, driving the westward drift of the LCE.
Using a simple numerical setup I reproduce some of the classical results found in earlier “vortex studies” that mirror our observations.
First, I integrate a two-layer quasi-geostrophic (QG) model in order to observe the emergence of azimuthal modal structures from the destabilization of a LCE-like eddy. Following the formulation of de Marez and Callies (2025), the problem is non-dimensionalized in space as x, y∼RD and in time , where RD and U are the baroclinic deformation radius and a current magnitude scale, respectively. Also, the aspect ratio between the upper and bottom layers thicknesses, h1 and h2, is . In this framework, the only parameters that vary are U, RD, and δ and are chosen to be representative of the LCE described here: U=0.8 m s−1, RD=50 km, and δ=0.25. Note that the results presented here were not sensitive to these parameters (not shown). The domain size is chosen to be a 800 km wide square, and simulations are run over a year. Simulations are integrated in either 128×128 or 512×512 point grids and are denominated as “low-resolution” or “high-resolution” runs, respectively. Time steps are adjusted to satisfy the Courant–Friedrichs–Lewy (CFL) stability criterion, which ensures numerical stability (the propagation speed of information does not exceed the grid cell size per time step; Courant et al., 1928). Small scales are damped through hyperviscosity of the order n=10 coefficient ν and chosen to be as small as possible (Callies et al., 2016). I chose a doubly periodic domain to eliminate spurious boundary effects, as in classical numerical vortex studies (see all the literature since McWilliams and Flierl, 1979).
In vortex stability studies, the key aspect is the initialization of the vortex. Numerous analytical models exist, with the simplest being a Gaussian. However, the choice of which quantity follows a Gaussian distribution significantly impacts the results. A Gaussian vorticity profile leads to a very stable vortex, which is not representative of realistic oceanic conditions. In contrast, a Gaussian streamfunction or velocity profile better reflects oceanic vortices, as it naturally generates a vorticity shield. This shield is crucial for the vortex's evolution and closely represents the conditions observed in our study, as seen in, e.g., Fig. 1g. Here, I adopt this approach and initialize the upper-layer streamfunction (equivalent to the SLA) of the model as a Gaussian-like function:
with r the radial coordinate, A the amplitude of the eddy, R its radius, and α the steepness of the eddy edges. Note that I also tested a “Mexican hat” function for ψ1 initialization – designed to provide both an SSH and a vorticity shield – and found similar results (not shown). I chose R=100 km to match the size of the LCE studied here; variations in this parameter do not affect our conclusions. Mainly, the simulations show that the presence of the shield leads to the formation of multiple satellite vortices, with their number increasing as the steepness parameter α increases, with no impact on the number of “coherent structures” from the resolution of the model (Fig. A1a–e). In particular, the case with α=5 shows that eddy can naturally become mode-4 structures, similarly as observed in SWOT data (Fig. 1l).
Second, I integrate a surface quasi-geostrophic (SQG) model, part of the same code as the QG model discussed earlier, following Callies et al. (2016). The SQG model is expressed in physical units, with parameters representative of typical open ocean conditions: Coriolis parameter s−1 and Brunt–Väisälä frequency s−2. I use the same numerical setup as in the QG model (resolution, viscosity, time step) and initialize it identically to Fig. A1d and e (α=5, R=100 km). In the simulation, a mode-4 structure emerges, indicating that its formation is intrinsic to the eddy's initial shape rather than the physical model. However, I also observe numerous submesoscale structures around it (Fig. A1f), a hallmark of SQG dynamics. This closely resembles the edges of the observed LCE, where many fronts and SCVs are detected.
I emphasize that the simulations presented here are intended to illustrate the dominant instability mechanism qualitatively. The subsequent evolution and timescales observed in the real ocean are highly influenced by external interactions absent from the idealized model, making direct comparisons hazardous.
SWOT data can be downloaded on the AVISO website: https://www.aviso.altimetry.fr/en/my-aviso-plus.html (last accss: 2 September 2025). The numerical model is inspired by Callies et al. (2016) code available on Github: https://github.com/joernc/QGModel (last accss: 2 September 2025).
The author has declared that there are no competing interests.
Publisher's note: Copernicus Publications remains neutral with regard to jurisdictional claims made in the text, published maps, institutional affiliations, or any other geographical representation in this paper. While Copernicus Publications makes every effort to include appropriate place names, the final responsibility lies with the authors.
Charly de Marez was supported by a Queen Margrethe II's and Vigdís Finnbogadóttir's Interdisciplinary Research Centre on Ocean, Climate and Society (ROCS) postdoctoral fellowship. I thoroughly thank Xavier Carton, Angel Ruiz-Angulo, and Thomas Meunier for their valuable feedback and insightful comments on the manuscript. The author acknowledges the many scientists who have contributed to the long history of research in the Gulf of Mexico. Special recognition is also given to the Gulf of Mexico itself – not only for its rich and complex dynamics but also for the significance of its name, which serves as a crucial reminder of its true identity and must be protected whatever the cost.
This research was supported by a Queen Margrethe II's and Vigdís Finnbogadóttir's Interdisciplinary Research Centre on Ocean, Climate and Society (ROCS) postdoctoral fellowship.
This paper was edited by Karen J. Heywood and reviewed by two anonymous referees.
AVISO/DUACS: SWOT Level-3 SSH Basic (v2.0.1) [Data set], AVISO/DUACS [data set], https://doi.org/10.24400/527896/A01-2023.017, 2023a. a
AVISO/DUACS: SWOT Level-3 SSH Unsmoothed (v2.0.1) [Data set], AVISO/DUACS [data set], https://doi.org/10.24400/527896/A01-2024.003, 2023b. a
Biggs, D. C.: Nutrients, plankton, and productivity in a warm-core ring in the western Gulf of Mexico, J. Geophys. Res.-Oceans, 97, 2143–2154, 1992. a
Brannigan, L., Marshall, D. P., Naveira Garabato, A. C., Nurser, A. G., and Kaiser, J.: Submesoscale instabilities in mesoscale eddies, J. Phys. Oceanogr., 47, 3061–3085, 2017. a
Callies, J. and Wu, W.: Some Expectations for Submesoscale Sea Surface Height Variance Spectra, J. Phys. Oceanogr., 49, 2271–2289, 2019. a
Callies, J., Flierl, G., Ferrari, R., and Fox-Kemper, B.: The role of mixed-layer instabilities in submesoscale turbulence, J. Fluid Mech., 788, 5–41, https://doi.org/10.1017/jfm.2015.700, 2016. a, b
Capet, X., Klein, P., Hua, B. L., Lapeyre, G., and Mcwilliams, J. C.: Surface kinetic energy transfer in surface quasi-geostrophic flows, J. Fluid Mech., 604, 165–174, 2008. a
Carli, E., Tranchant, Y., Siegelman, L., Le Guillou, F., Morrow, R. A., Ballarotta, M., and Vergara, O.: Small-scale eddy diagnostics around the Southern Ocean Polar Front with SWOT, Authorea Preprints, in preparation, 2025. a
Carton, X.: Instability of surface quasigeostrophic vortices, J. Atmos. Sci., 66, 1051–1062, 2009. a
Chelton, D.: Report of the high-resolution ocean topography science working group meeting, Oregon State University, College of Oceanic and Atmospheric Sciences, https://citeseerx.ist.psu.edu/document?repid=rep1&type=pdf&doi=4128e5b1c8e50bfc824dac3705a54dea4ac3b4bd (last access: 2 September 2025), 2001. a
Chelton, D. B., Schlax, M. G., Samelson, R. M., and de Szoeke, R. A.: Global observations of large oceanic eddies, Geophys. Res. Lett., 34, L15606, https://doi.org/10.1029/2007GL030812, 2007. a
Chelton, D. B., Gaube, P., Schlax, M. G., Early, J. J., and Samelson, R. M.: The Influence of Nonlinear Mesoscale Eddies on Near-Surface Oceanic Chlorophyll, Science, 334, 328–332, https://doi.org/10.1126/science.1208897, 2011a. a
Chelton, D. B., Schlax, M. G., and Samelson, R. M.: Global observations of nonlinear mesoscale eddies, Prog. Oceanogr., 91, 167–216, 2011b. a
Chérubin, L. M., Morel, Y., and Chassignet, E. P.: Loop Current ring shedding: The formation of cyclones and the effect of topography, J. Phys. Oceanogr., 36, 569–591, 2006. a
Coadou-Chaventon, S., Swart, S., Novelli, G., and Speich, S.: Resolving sharper fronts of the Agulhas Current Retroflection using SWOT altimetry, Geophys. Res. Let., 52, e2025GL115203, https://doi.org/10.1029/2025GL115203, 2025. a
Courant, R., Friedrichs, K., and Lewy, H.: Über die partiellen Differenzengleichungen der mathematischen Physik, Math. Annal., 100, 32–74, 1928. a
Damerell, G. M., Bosse, A., and Fer, I.: Merging of a mesoscale eddy into the Lofoten Vortex in the Norwegian Sea captured by an ocean glider and SWOT observations, EGUsphere [preprint], https://doi.org/10.5194/egusphere-2025-433, 2025. a
de Marez, C. and Callies, J.: The information contained in altimetric Sea Surface Height frequency spectra, J. Phys. Oceanogr., 55, 119–129, 2025. a
de Marez, C., Meunier, T., Morvan, M., L'hégaret, P., and Carton, X.: Study of the stability of a large realistic cyclonic eddy, Ocean Model., 146, 101540, https://doi.org/10.1016/j.ocemod.2019.101540, 2020a. a
de Marez, C., Meunier, T., Tedesco, P., L'Hégaret, P., and Carton, X.: Vortex–wall interaction on the β-plane and the generation of deep submesoscale cyclones by internal Kelvin Waves–current interactions, Geophys. Astrophys. Fluid Dynam., 114, 588–606, 2020b. a
Dibarboure, G., Anadon, C., Briol, F., Cadier, E., Chevrier, R., Delepoulle, A., Faugère, Y., Laloue, A., Morrow, R., Picot, N., Prandi, P., Pujol, M.-I., Raynal, M., Tréboutte, A., and Ubelmann, C.: Blending 2D topography images from the Surface Water and Ocean Topography (SWOT) mission into the altimeter constellation with the Level-3 multi-mission Data Unification and Altimeter Combination System (DUACS), Ocean Sci., 21, 283–323, https://doi.org/10.5194/os-21-283-2025, 2025. a, b
Dibarboure, G., Faugere, Y., Delepoulle, A., Briol, F., Raynal, M., Ubelmann, C., Chevrier, R., Busche, C., Treboutte, A., and Prandi, P.: SWOT Level-3 Overview algorithms and examples, poster at SWOT Science Team 2023, https://swotst.aviso.altimetry.fr/fileadmin/user_upload/SWOTST2023/postersPI/faugere_ocean_l3_PIproject.pdf (last access: 2 September 2025), 2023. a
Dong, C., McWilliams, J. C., Liu, Y., and Chen, D.: Global heat and salt transports by eddy movement, Nat. Commun., 5, 3294, https://doi.org/10.1038/ncomms4294, 2014. a
Du, T. and Jing, Z.: Fine-Scale Eddies Detected by SWOT in the Kuroshio Extension, Remote Sens., 16, 3488, https://doi.org/10.3390/rs16183488, 2024. a
Fuglister, F. C. and Worthington, L. V.: Some Results of a Multiple Ship Survey of the Gulf Stream, Tellus, 3, 1–14, https://doi.org/10.3402/tellusa.v3i1.8614, 1951. a
Gent, P. R. and McWilliams, J. C.: The instability of barotropic circular vortices, Geophys. Astrophys. Fluid Dynam., 35, 209–233, 1986. a
Gentil, M., Pallàs-Sanz, E., Middleton, L., Ruiz-Angulo, A., Meunier, T., Durante, G., Tenreiro, M., Allis Estrada, S. N., and Sheinbaum, J.: Distribution, mixing, and transformation of a Loop Current Ring waters: The case of Gulf of Mexico, Geophys. Res. Lett., 51, e2024GL110845, https://doi.org/10.1029/2024GL110845, 2024. a
Goni, G. J., Trinanes, J. A., MacFadyen, A., Streett, D., Olascoaga, M. J., Imhoff, M. L., Muller-Karger, F., and Roffer, M. A.: Variability of the Deepwater Horizon surface oil spill extent and its relationship to varying ocean currents and extreme weather conditions, in: Mathematical modelling and numerical simulation of oil pollution problems, Springer, 1–22, https://doi.org/10.1007/978-3-319-16459-5_1, 2015. a
Hall, C. A. and Leben, R. R.: Observational evidence of seasonality in the timing of loop current eddy separation, Dynam. Atmos. Oceans, 76, 240–267, 2016. a
Hamilton, P., Fargion, G., and Biggs, D.: Loop Current eddy paths in the western Gulf of Mexico, J. Phys. Oceanogr., 29, 1180–1207, 1999. a, b
Hiron, L., Nolan, D. S., and Shay, L. K.: Study of ageostrophy during strong, nonlinear eddy-front interaction in the Gulf of Mexico, J. Phys. Oceanogr., 51, 745–755, 2021. a
Ikeda, M.: Instability and splitting of mesoscale rings using a two-layer quasi-geostrophic model on an f-plane, J. Phys. Oceanogr., 11, 987–998, 1981. a
Ioannou, A., Stegner, A., Tuel, A., Le Vu, B., Dumas, F., and Speich, S.: Cyclostrophic corrections of AVISO/DUACS surface velocities and its application to mesoscale eddies in the Mediterranean Sea, J. Geophys. Res.-Oceans, 124, 8913–8932, 2019. a
Le Hénaff, M., Kourafalou, V. H., Dussurget, R., and Lumpkin, R.: Cyclonic activity in the eastern Gulf of Mexico: Characterization from along-track altimetry and in situ drifter trajectories, Prog. Oceanogr., 120, 120–138, 2014. a
Le Traon, P., Nadal, F., and Ducet, N.: An improved mapping method of multisatellite altimeter data, J. Atmos. Ocean. Tech., 15, 522–534, 1998. a, b
Lévy, M., Franks, P. J., and Smith, K. S.: The role of submesoscale currents in structuring marine ecosystems, Nat. Commun., 9, 4758, https://doi.org/10.1038/s41467-018-07059-3, 2018. a
Li, L., Nowlin, W. D., and Jilan, S.: Anticyclonic rings from the Kuroshio in the South China Sea, Deep-Sea Res. Pt. I, 45, 1469–1482, https://doi.org/10.1016/S0967-0637(98)00026-0, 1998. a
Manta, G., Durante, G., Candela, J., Send, U., Sheinbaum, J., Lankhorst, M., and Laxenaire, R.: Predicting the Loop Current dynamics combining altimetry and deep flow measurements through the Yucatan Channel, Front. Mar. Sci., 10, 1156159, https://doi.org/10.3389/fmars.2023.1156159, 2023. a
Mason, E., Pascual, A., and McWilliams, J. C.: A new sea surface height–based code for oceanic mesoscale eddy tracking, J. Atmos. Ocean. Tech., 31, 1181–1188, 2014. a
McWilliams, J. C.: A survey of submesoscale currents, Geosci. Lett., 6, 3, https://doi.org/10.1186/s40562-019-0133-3, 2019. a
McWilliams, J. C. and Flierl, G. R.: On the evolution of isolated, nonlinear vortices, J. Phys. Oceanogr., 9, 1155–1182, 1979. a, b
Meunier, T., Pallas-Sanz, E., Tenreiro, M., Portela, E., Ochoa, J., Ruiz-Angulo, A., and Cusí, S.: The vertical structure of a Loop Current Eddy, J. Geophys. Res.-Oceans, 123, 6070–6090, https://doi.org/10.1029/2018JC013801, 2018. a, b
Meunier, T., Sanz, E. P., Tenreiro, M., Ochoa, J., Angulo, A. R., and Buckingham, C.: Observations of layering under a warm-core ring in the Gulf of Mexico, J. Phys. Oceanogr., 49, 3145–3162, 2019. a
Meunier, T., Sheinbaum, J., Pallàs-Sanz, E., Tenreiro, M., Ochoa, J., Ruiz-Angulo, A., Carton, X., and de Marez, C.: Heat content anomaly and decay of warm-core rings: The case of the Gulf of Mexico, Geophys. Res. Lett., 47, e2019GL085600, https://doi.org/10.1029/2019GL085600, 2020. a, b
Meunier, T., Bower, A., Pérez-Brunius, P., Graef, F., and Mahadevan, A.: The energy decay of warm-core eddies in the gulf of Mexico, Geophys. Res. Lett., 51, e2023GL106246, https://doi.org/10.1029/2023GL106246, 2024. a
Morel, Y. G. and Carton, X. J.: Multipolar vortices in two-dimensional incompressible flows, J. Fluid Mech., 267, 23–51, 1994. a
Morrow, R., Fu, L. L., Ardhuin, F., Benkiran, M., Chapron, B., Cosme, E., d'Ovidio, F., Farrar, J. T., Gille, S. T., Lapeyre, G., and Le Traon, P. Y.: Global observations of fine-scale ocean surface topography with the Surface Water and Ocean Topography (SWOT) mission, Front. Mar. Sci., 6, 232, https://doi.org/10.3389/fmars.2019.00232, 2019. a, b
Oey, L.-Y., Lee, H.-C., and Schmitz Jr, W. J.: Effects of winds and Caribbean eddies on the frequency of Loop Current eddy shedding: A numerical model study, J. Geophys. Res.-Oceans, 108, https://doi.org/10.1029/2002JC001698, 2003. a
Olson, D. B. and Evans, R. H.: Rings of the Agulhas current, Deep-Sea Res. Pt. A, 33, 27–42, https://doi.org/10.1016/0198-0149(86)90106-8, 1986. a
Palter, J. B.: The Role of the Gulf Stream in European Climate, Annu. Rev. Mar. Sci., 7, 113–137, https://doi.org/10.1146/annurev-marine-010814-015656, 2015. a
Pérez, J., Pallàs-Sanz, E., Tenreiro, M., Meunier, T., Jouanno, J., and Ruiz-Angulo, A.: Overturning instabilities across a warm core ring from glider observations, J. Geophys. Res.-Oceans, 127, e2021JC017527, https://doi.org/10.1029/2021JC017527, 2022. a
Richardson, P. L.: Gulf Stream Rings, in: Eddies in Marine Science, edited by: Robinson, A. R., Springer, Berlin, 19–45, ISBN 978-3-642-69005-1, https://doi.org/10.1007/978-3-642-69003-7_2, 1983. a
Richardson, P. L., Strong, A. E., and Knauss, J. A.: Gulf Stream Eddies: Recent Observations in the Western Sargasso Sea, J. Phys. Oceanogr., 3, 297–301, https://doi.org/10.1175/1520-0485(1973)003<0297:GSEROI>2.0.CO;2, 1973. a
Shay, L. K., Goni, G. J., and Black, P. G.: Effects of a warm oceanic feature on Hurricane Opal, Mon. Weather Rev., 128, 1366–1383, 2000. a
Sheinbaum, J., Chassignet, E., Morey, S. L., and He, R.: Understanding and Predicting the Gulf of Mexico Ocean Dynamics, Frontiers Media SA, https://www.frontiersin.org/research-topics/38158/understanding-and-predicting-the-gulf-of-mexico-ocean-dynamics/magazine?utm_source=copy_link&utm_medium=social&utm_campaign=rt_magazine_share&utm_content=rt38158 (last access: 2 September 2025), 2024. a
Small, R., deSzoeke, S., Xie, S., O'Neill, L., Seo, H., Song, Q., Cornillon, P., Spall, M., and Minobe, S.: Air–sea interaction over ocean fronts and eddies, Dynam. Atmos. Oceans, 45, 274–319, https://doi.org/10.1016/j.dynatmoce.2008.01.001, 2008. a
Tchilibou, M., Carrere, L., Lyard, F., Ubelmann, C., Dibarboure, G., Zaron, E. D., and Arbic, B. K.: Internal tides off the Amazon shelf in the western tropical Atlantic: analysis of SWOT Cal/Val mission data, Ocean Sci., 21, 325–342, https://doi.org/10.5194/os-21-325-2025, 2025. a
Tenreiro, M., Candela, J., Sanz, E. P., Sheinbaum, J., and Ochoa, J.: Near-surface and deep circulation coupling in the western Gulf of Mexico, J. Phys. Oceanogr., 48, 145–161, 2018. a
Tranchant, Y.-T., Legresy, B., Foppert, A., Pena-Molino, B., and Phillips, H. E.: SWOT reveals fine-scale balanced motions and dispersion properties in the Antarctic Circumpolar Current, Authorea Preprints, in preparation, https://doi.org/10.1029/2025EA004248, 2025. a
Valcke, S. and Verron, J.: Interactions of baroclinic isolated vortices: The dominant effect of shielding, J. Phys. Oceanogr., 27, 524–541, 1997. a
Verger-Miralles, E., Mourre, B., Gómez-Navarro, L., Barceló-Llull, B., Casas, B., Cutolo, E., Díaz-Barroso, L., d'Ovidio, F., Tarry, D. R., Zarokanellos, N. D., and Pascual, A.: SWOT enhances small-scale intrathermocline eddy detection, Authorea Preprints, in preparation, https://doi.org/10.22541/essoar.173315547.75973902/v2, 2024. a
Wang, J., Archer, M., Klein, P., and Fu, L.-L.: Global Submesoscale Ocean Dynamics Unveiled by Wide-Swath Satellite Altimetry, https://doi.org/10.1038/s41586-025-08722-8, 2025a. a
Wang, J., Lucas, A., Stalin, S., Lankhorst, M., Send, U., Schofield, O., Kachelein, L., Haines, B., Meinig, C., Pinkel, R., Farrar, J., and Fu, L.: SWOT Mission Validation of Sea Surface Height Measurements at Sub‐100 km Scales, Geophys. Res. Lett., 52, e2025GL114936, https://doi.org/10.1029/2025GL114936, 2025b. a
Zhang, L., Hwang, C., Liu, H.-Y., Chang, E. T., and Yu, D.: Automated Eddy Identification and Tracking in the Northwest Pacific Based on Conventional Altimeter and SWOT Data, Remote Sens., 17, 1665, https://doi.org/10.3390/rs17101665, 2025a. a
Zhang, X., Liu, L., Fei, J., Li, Z., Wei, Z., Zhang, Z., Jiang, X., Dong, Z., and Xu, F.: Advances in surface water and ocean topography for fine-scale eddy identification from altimeter sea surface height merging maps in the South China Sea, Ocean Sci., 21, 1033–1045, https://doi.org/10.5194/os-21-1033-2025, 2025b. a
Zhang, Z., Wang, W., and Qiu, B.: Oceanic mass transport by mesoscale eddies, Science, 345, 322–324, 2014. a, b, c
Zhang, Z., Miao, M., Qiu, B., Tian, J., Jing, Z., Chen, G., Chen, Z., and Zhao, W.: Submesoscale eddies detected by SWOT and moored observations in the Northwestern Pacific, Geophys. Res. Lett., 51, e2024GL110000, https://doi.org/10.1029/2024GL110000, 2024. a
- Abstract
- Introduction
- Synoptical description of the full loop current eddy life cycle
- Observation of secondary instabilities at the rim of the eddy
- Conclusions
- Appendix A: SWOT altimetry
- Appendix B: Numerical modeling
- Code and data availability
- Competing interests
- Disclaimer
- Acknowledgements
- Financial support
- Review statement
- References