the Creative Commons Attribution 4.0 License.
the Creative Commons Attribution 4.0 License.
 | 28 Mar 2024
Tipping of the double-diffusive regime in the southern Adriatic Pit in 2017 in connection with record high-salinity values
Felipe L. L. Amorim
Julien Le Meur
Achim Wirth
In double-diffusive mixing, whenever salinity and temperature decrease with depth, the water column is either unstable or predisposed to a state called salt fingering (SF), which exhibits increased vertical mixing. Analysis of a high-frequency time series of thermohaline data measured at the EMSO-E2M3A regional facility in the southern Adriatic Pit (SAP) from 2014 to 2019 reveals that in the south Adriatic, SF is the dominant regime. The same time series shows the presence of a very saline core of the Levantine Intermediate Water that penetrated with unprecedented strength during the winter of 2016/17 at around 550 dbar and even higher-salinity water above. The effect of strong heat loss at the surface during that winter allowed deep convection to transport this high-salinity water from the intermediate to the deep layers within the pit. This resulted in an increased predisposition to SF throughout the water column. In the subsurface layer (350 to 550 dbar) the increase is from 27 % to 72 % of observations. We observe an alteration of vertical stratification throughout the water column during the winter of 2016/17 from a stratified water column to an almost homogeneous water column down to 700 dbar, with no return in the following years.
- Article
(6055 KB) - Full-text XML
-
Supplement
(1320 KB) - BibTeX
- EndNote


The southern Adriatic Pit (SAP) is an important deep-water formation region. The formed dense waters in the area enter the eastern Mediterranean bringing oxygenated cold water to deeper layers. The stratification is altered by convection, gravity currents, lateral intrusions from neighboring basins and double-diffusive mixing. The first two are intermittent strong events, while the last one is continuous with varying magnitude. During winter, vertical convection can occur, destroying density barriers throughout the water column. These combined processes allow efficient mixing and exchange of properties between the upper, intermediate and sometimes also the deep layers, resulting in changes in the properties and stability of water characteristics (Leaman and Schott, 1991; Leaman, 1994; Mertens and Schott, 1998; Vilibić and Orlić, 2002; Cardin and Gačić, 2003; Cardin et al., 2011). Intermittent gravity currents bring cold water masses from the northern Adriatic to the deep parts of the SAP, a process that is affected by topographic canyons and which restores the bottom-to-surface density difference (Chiggiato et al., 2016).
The water mass characteristics in the southern Adriatic lead to a predisposition to the double-diffusive salt finger process (SF; the temperature stratification is stable, while the haline stratification is unstable) because of the warm and salty Levantine Intermediate Water (LIW) overlying the colder and fresher deep Adriatic water (AdDW). Indeed, double-diffusive convection occurs in the ocean when either the temperature or salinity-induced stratification is statically unstable, while the overall density stratification is statically stable (Stern, 1960). The potential energy bound in the unstable component is released by molecular diffusion, which is 100 times faster for heat than for salt (Stern, 1960; Schmitt, 1994). McDougall et al. (1988) describe the vertical stratification in terms of the following stability regimes: SF, diffusive convective (the temperature stratification is unstable, while the haline stratification is stable), doubly stable and statically unstable. According to You (2002), large areas of the world's oceans are favorable to double diffusion, including the Mediterranean and the Adriatic seas. Specifically, SFs have been observed in the Mediterranean Sea (Schmitt, 1994; Meccia et al., 2016; Menna et al., 2021), the Tyrrhenian Sea (Tait and Howe, 1968; Durante et al., 2019) and the Adriatic Sea (Carniel et al., 2008). Double-diffusion studies in the oceans typically use CTD profile transects acquired at high frequency (hours) but over a short period (days to weeks). They also provide a fine vertical resolution but are not able to depict a continuous evolution of double diffusion over several years. Durante et al. (2019) used a longer time series of CTD casts, and Menna et al. (2021) analyzed years of Argo data profiles in the Tyrrhenian and Ionian/Levantine seas, respectively, with the temporal resolution of the analyzed data ranging from weeks to months. Taillandier et al. (2020) used a combination of about 700 CTD and Argo float profiles collected from 2013 to 2017 to study thermohaline staircases related to double diffusion in the western Mediterranean Sea. In this work, we examine high-frequency, long-time data from the EMSO-E2M3A regional facility (http://emso.eu/observatories-node/south-adriatic-sea/, last access: 18 March 2024) that allow us to assess the temporal evolution of double diffusion over long timescales at high frequency (hours) but only at a coarse vertical resolution at a fixed horizontal location. Fine-scale double-diffusive staircases typically extending O(10 m) vertically cannot be directly observed with our data, but vertical temperature and salt stratification leading to double diffusion can be observed.
In the SAP, the saltier Levantine Intermediate Water (LIW) forms intrusive features (Vilibić and Orlić, 2001; Vilibić and Supić, 2005; Gačić et al., 2010). Double-diffusive mixing processes acting at the interfaces of these intrusions alter heat and salt transport, but turbulence levels must be sufficiently low for double diffusion to act (Lee et al., 2014). Cardin et al. (2020a) estimated a high vertical bulk diffusivity coefficient in the deep SAP (below the sill depth of 780 m) of m2 s−1 based on two types of data, i.e., 13-year time series of observational data (2006–2019) of temperature from the EMSO-E2M3A observatory and available vertical profiles (1985–2019) in the area. The differences in the molecular diffusivity of temperature and salinity can enhance vertical mixing through double diffusion, resulting in effective large-scale (bulk) diffusivities on the order of 10−4 m2 s−1 (Radko, 2013; Bryden et al., 2014). Even though this process happens on molecular scales, it can affect larger spatial extents by mixing water mass properties. Double diffusion is particularly widespread in the main thermocline (Radko, 2013) and contributes to the vertical transport of heat, affecting the global climate due to the air–sea fluxes occurring in the sea surface. The prevalence of double diffusion in the upper ocean can enhance the mixing of nutrients, which directly controls biological productivity (Radko, 2013; Meccia et al., 2016). Despite their potentially important contribution to vertical mixing, there is no quantitative work that has investigated the evolution of double-diffusion regimes using continuous long-term datasets (multi-year) with a high frequency (hours to days). In this study, we describe the changes in double-diffusion regimes using time series data obtained from the EMSO-E2M3A in the SAP. A description of the observational data and applied methodology is provided in the following section while the analysis and discussion are presented in Sect. 3. Conclusions are given in Sect. 4.
The data used in this study were obtained from the EMSO south Adriatic deep observatory that is one of the regional infrastructures established at “key environmental sites” in European seas within the framework of the EMSO ERIC (European Multidisciplinary Seafloor and water column Observatory – European Research Infrastructure Consortium) network. The observatory consists of two sites: the first located in the center of the south Adriatic Pit, at depths of around 1200 dbar (E2M3A, Fig. 1), and the second on the western side of the escarpment (BB and FF). The data collected at the E2M3A site enable the monitoring of changes that can be linked to variations in the sub-mesoscale, mesoscale and general circulation of the eastern Mediterranean Sea or, on a larger timescale, to the climate variability in the area, demonstrating the importance of high-frequency measurements to resolving events and rapid processes (Cardin et al., 2020a) as well as their long-term occurrence and modulation.
In recent years, the observatory has allowed monitoring of convective processes and the formation and arrival of dense water (crucial for oxygenation in the deep sea). The EMSO-E2M3A site (position 41.53° N, 18.06° E) has operated almost continuously since 2006 (Bensi et al., 2014; Cardin et al., 2015, 2018, 2020b; http://emso.eu/observatories-node/south-adriatic-sea/, last access: 18 March 2020a). The EMSO-E2M3A dataset used in this study consists of potential temperature (θ) and salinity (S) data collected hourly at seven vertical levels (150, 350, 550, 750, 900, 1000 and 1200 dbar) ranging from November 2014 to October 2019; these dates were chosen to consider the longest period available between two maintenance cruises with calibration of instruments.
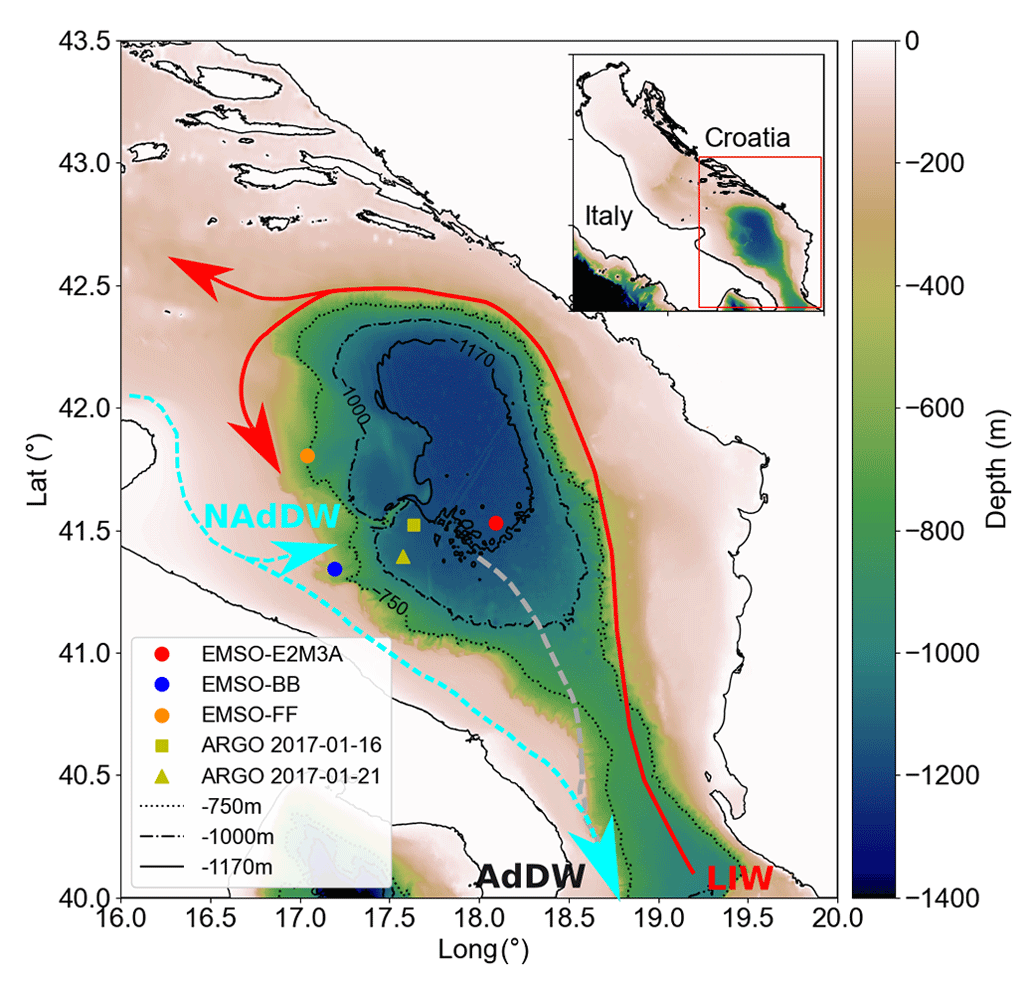
Figure 1EMSO-E2M3A mooring location (red dot) in the South Adriatic Pit (SAP) at a depth of about 1200 dbar and Argo floats positions (yellow square and triangle), with the main water mass routes: Adriatic Deep Water (AdDW), Levantine Intermediate Water (LIW) and North Adriatic Dense Water (NAdDW). Other components of the EMSO ERIC South Adriatic Facility: moorings BB (blue dot) and FF (orange dot).
Derived parameters such as θ, Turner angle and squared buoyancy frequency (hereafter referred as Tu and N2, respectively) were calculated using the Gibbs Seawater (GSW) Oceanographic Toolbox containing the TEOS-10 routines (McDougall and Barker, 2011). Calculations were achieved using the NumPy module (Harris et al., 2020), the pandas module (McKinney, 2010) and the SciPy module (Virtanen et al., 2020) from Python. The different figures presented here were obtained thanks to the Matplotlib module (Hunter, 2007), again from Python. The squared buoyancy frequency (N2) values are calculated considering 33 h filtered conservative temperature (CT) and 33 h filtered absolute salinity (SA) (McDougall and Barker, 2014) and are centered at the mean pressure between two of the mooring time series, i.e., at 450, 650, 825, 950 and 1100 dbar (we removed the 150 dbar layer as important gaps in this time series are present). Interpolation is then performed to obtain a visualization of N2 on the whole water column. In order to explore if the water column was favorable to double-diffusive regimes and its related possible local stability condition we estimated the Turner angle (Tu) defined following Eq. (1):
where tan−1 is the arctangent of the fourth quadrant; α is the coefficient of thermal expansion; β is the equivalent coefficient for the addition of salinity, sometimes called the “coefficient of salt contraction”; θ is the potential temperature; and S is the salinity. The Turner angle, Tu, compares the density stratification due to the temperature gradient with that due to the salinity gradient (van der Boog et al., 2021). The types of instability are determined by the signs of the potential density and salinity gradients rather than by their absolute values (Meccia et al., 2016).
When Tu is between −45 and −90°, diffusive–convective double diffusion is possible; for Tu between −45 and 45°, the water column is doubly stable, meaning that the water column is stably stratified with respect to both temperature and salinity, and for Tu between 45 and 90°, SF double diffusion is expected (You, 2002). To calculate Tu, only data periods that covered all available vertical levels were used to achieve the best discretization of the vertical gradient by using the values of two consecutive levels. Therefore, we considered for this purpose the time series at the seven levels ranging from November 2014 to October 2019. To evaluate further the water mass properties in the vertical, we calculated the vector length (VL) defined following Eq. (2):
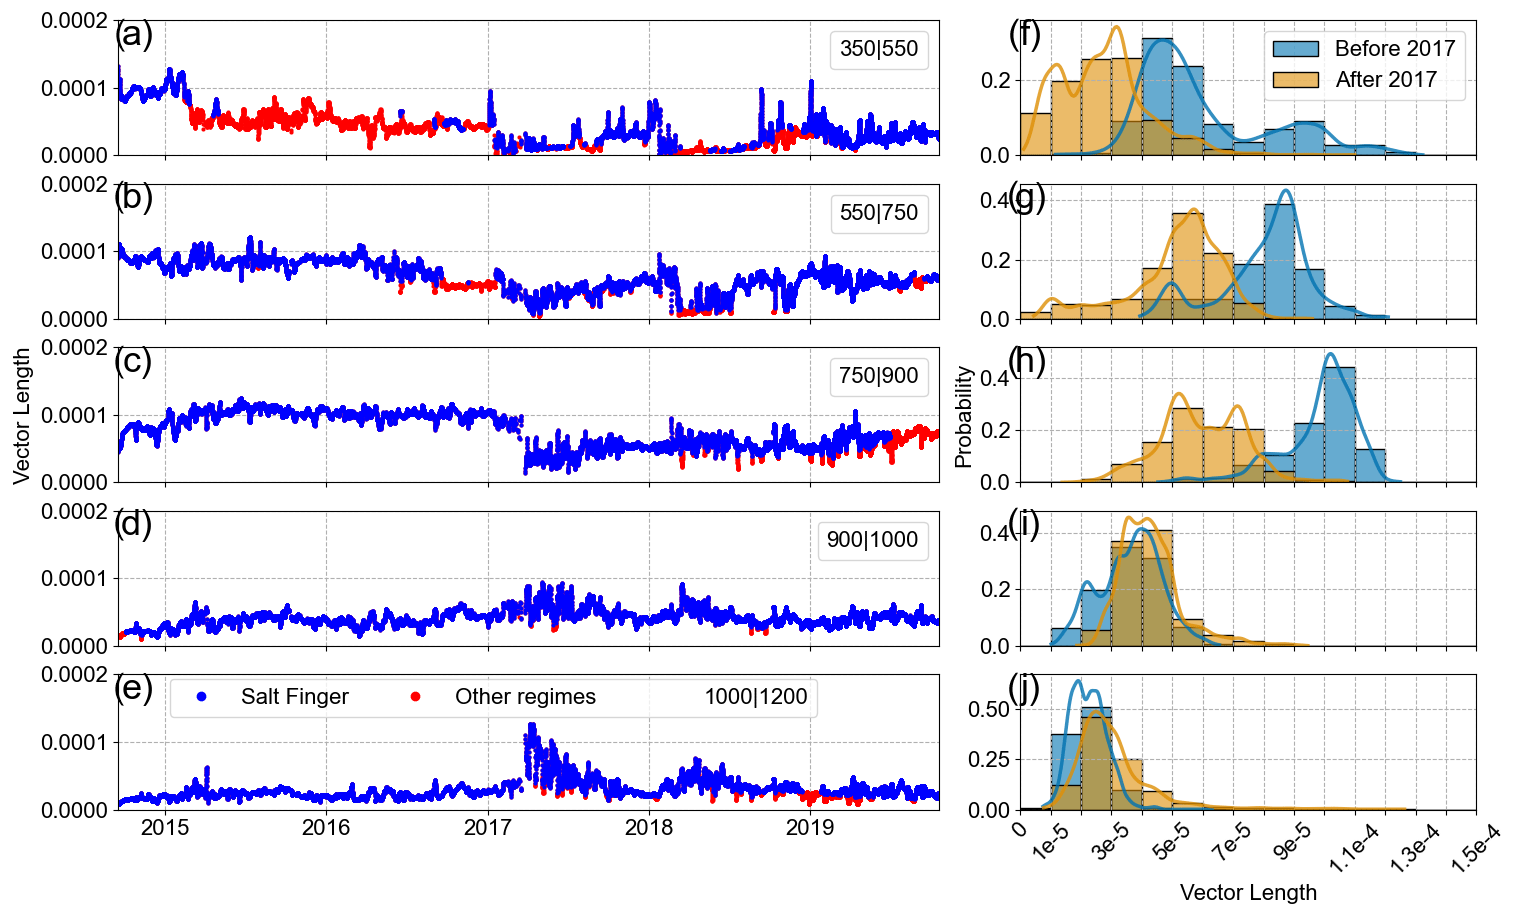
To the best of our knowledge, the VL has not been discussed in connection with stratification and the Tu. A higher VL indicates an increased change in water mass properties and therefore emphasizes the importance of Tu. On the other hand, when the VL is small the water column is essentially unstratified and changes in the Tu are insignificant. A water mass is characterized by θ and S, its potential temperature and salinity. The variables Tu and VL are simply the polar coordinates in (θ, S) space. It is Tu that determines the stability regime and VL the significance.
Complementing the time series data of T and S, we used the two Argo float number 6903197 profiles (https://www.euro-argo.eu/Argo-Data-access, last access: 19 February 2024), daily ERA5 net surface heat fluxes (Qtot; Hersbach et al., 2018, 2020) from the European Centre for Medium-Range Weather Forecasts (ECMWF) and mixed layer depth (MLD), provided by the Copernicus Marine Service at the nearest grid point to EMSO-E2M3A. The winter period is considered to run from December to February. Heat flux variations were determined by averaging Qtot over an area containing points 0.3° from E2M3A; this yields an average of four points. The MLD was calculated using its maximum in an area closer than 0.1° from the mooring location.
Surface relative vorticity is defined following Eq. (3):
where u and v are surface geostrophic velocities (SEALEVEL_EUR_PHY_L4_MY_008_068 product; Copernicus Marine Service) in an area limited by the isobath of 1150 dbar. The RV is the average of 18 grid points around the mooring position with 0.125° spatial resolution. It is important to note that the EMSO-E2M3A deep mooring is very close to the center of the SAP, where the relative vorticity has a smaller variance than at the edges on the 1000 m isobath.
The two Argo float (no. 6903197) profiles used here are profile 81 (16 January 2017) and profile 82 (21 January 2017), which are located about 38 and 46 km (at 41.52° N, 17.64° E and 41.40° N, 17.57° E, respectively) from the mooring (Fig. 1). The Argo profiles of potential temperature and salinity were first linearly interpolated to 1 dbar vertical resolution, and the Turner angle was calculated using the 20-point moving-average profiles to avoid excessive noise in the results.
3.1 Thermohaline variability in the area
The Hovmöller diagrams, based on time series of potential temperature and salinity measured at SAP (Fig. 2), show a clear change in the characteristics before and after 2017. Looking at the 5-year dataset used for this work (November 2014–October 2019), the water column from the end of 2014 to the end of 2016 shows a clear signature of LIW occurrence restricted to the layer between 400 and 600 m, with a core value of 38.84. Unfortunately, the lack of data from the 150 dbar time series prevents defining the characteristics of the upper layer between November 2014 and November 2015. However, there is an indication of an intrusion of less saline water into the LIW horizon, which seems to be the cause of the deepening of the LIW core to around 550 m by mid-2015, also reducing its thickness. In October 2016, exceptionally, the surface layer was filled to about 300 dbar by very salty and warm waters, presumably an intrusion of LSW (Levantine Surface Water), with values above 38.90 (since no data were available above 150 m, the value could not be accurately determined). These two cores with high salinity were also observed by Mihanović et al. (2021) based on Argo float data in the same area. By December 2016, the deep salinity maxima mixed with surrounding waters and deepened to about 800 dbar with a reduced value of around 38.82.
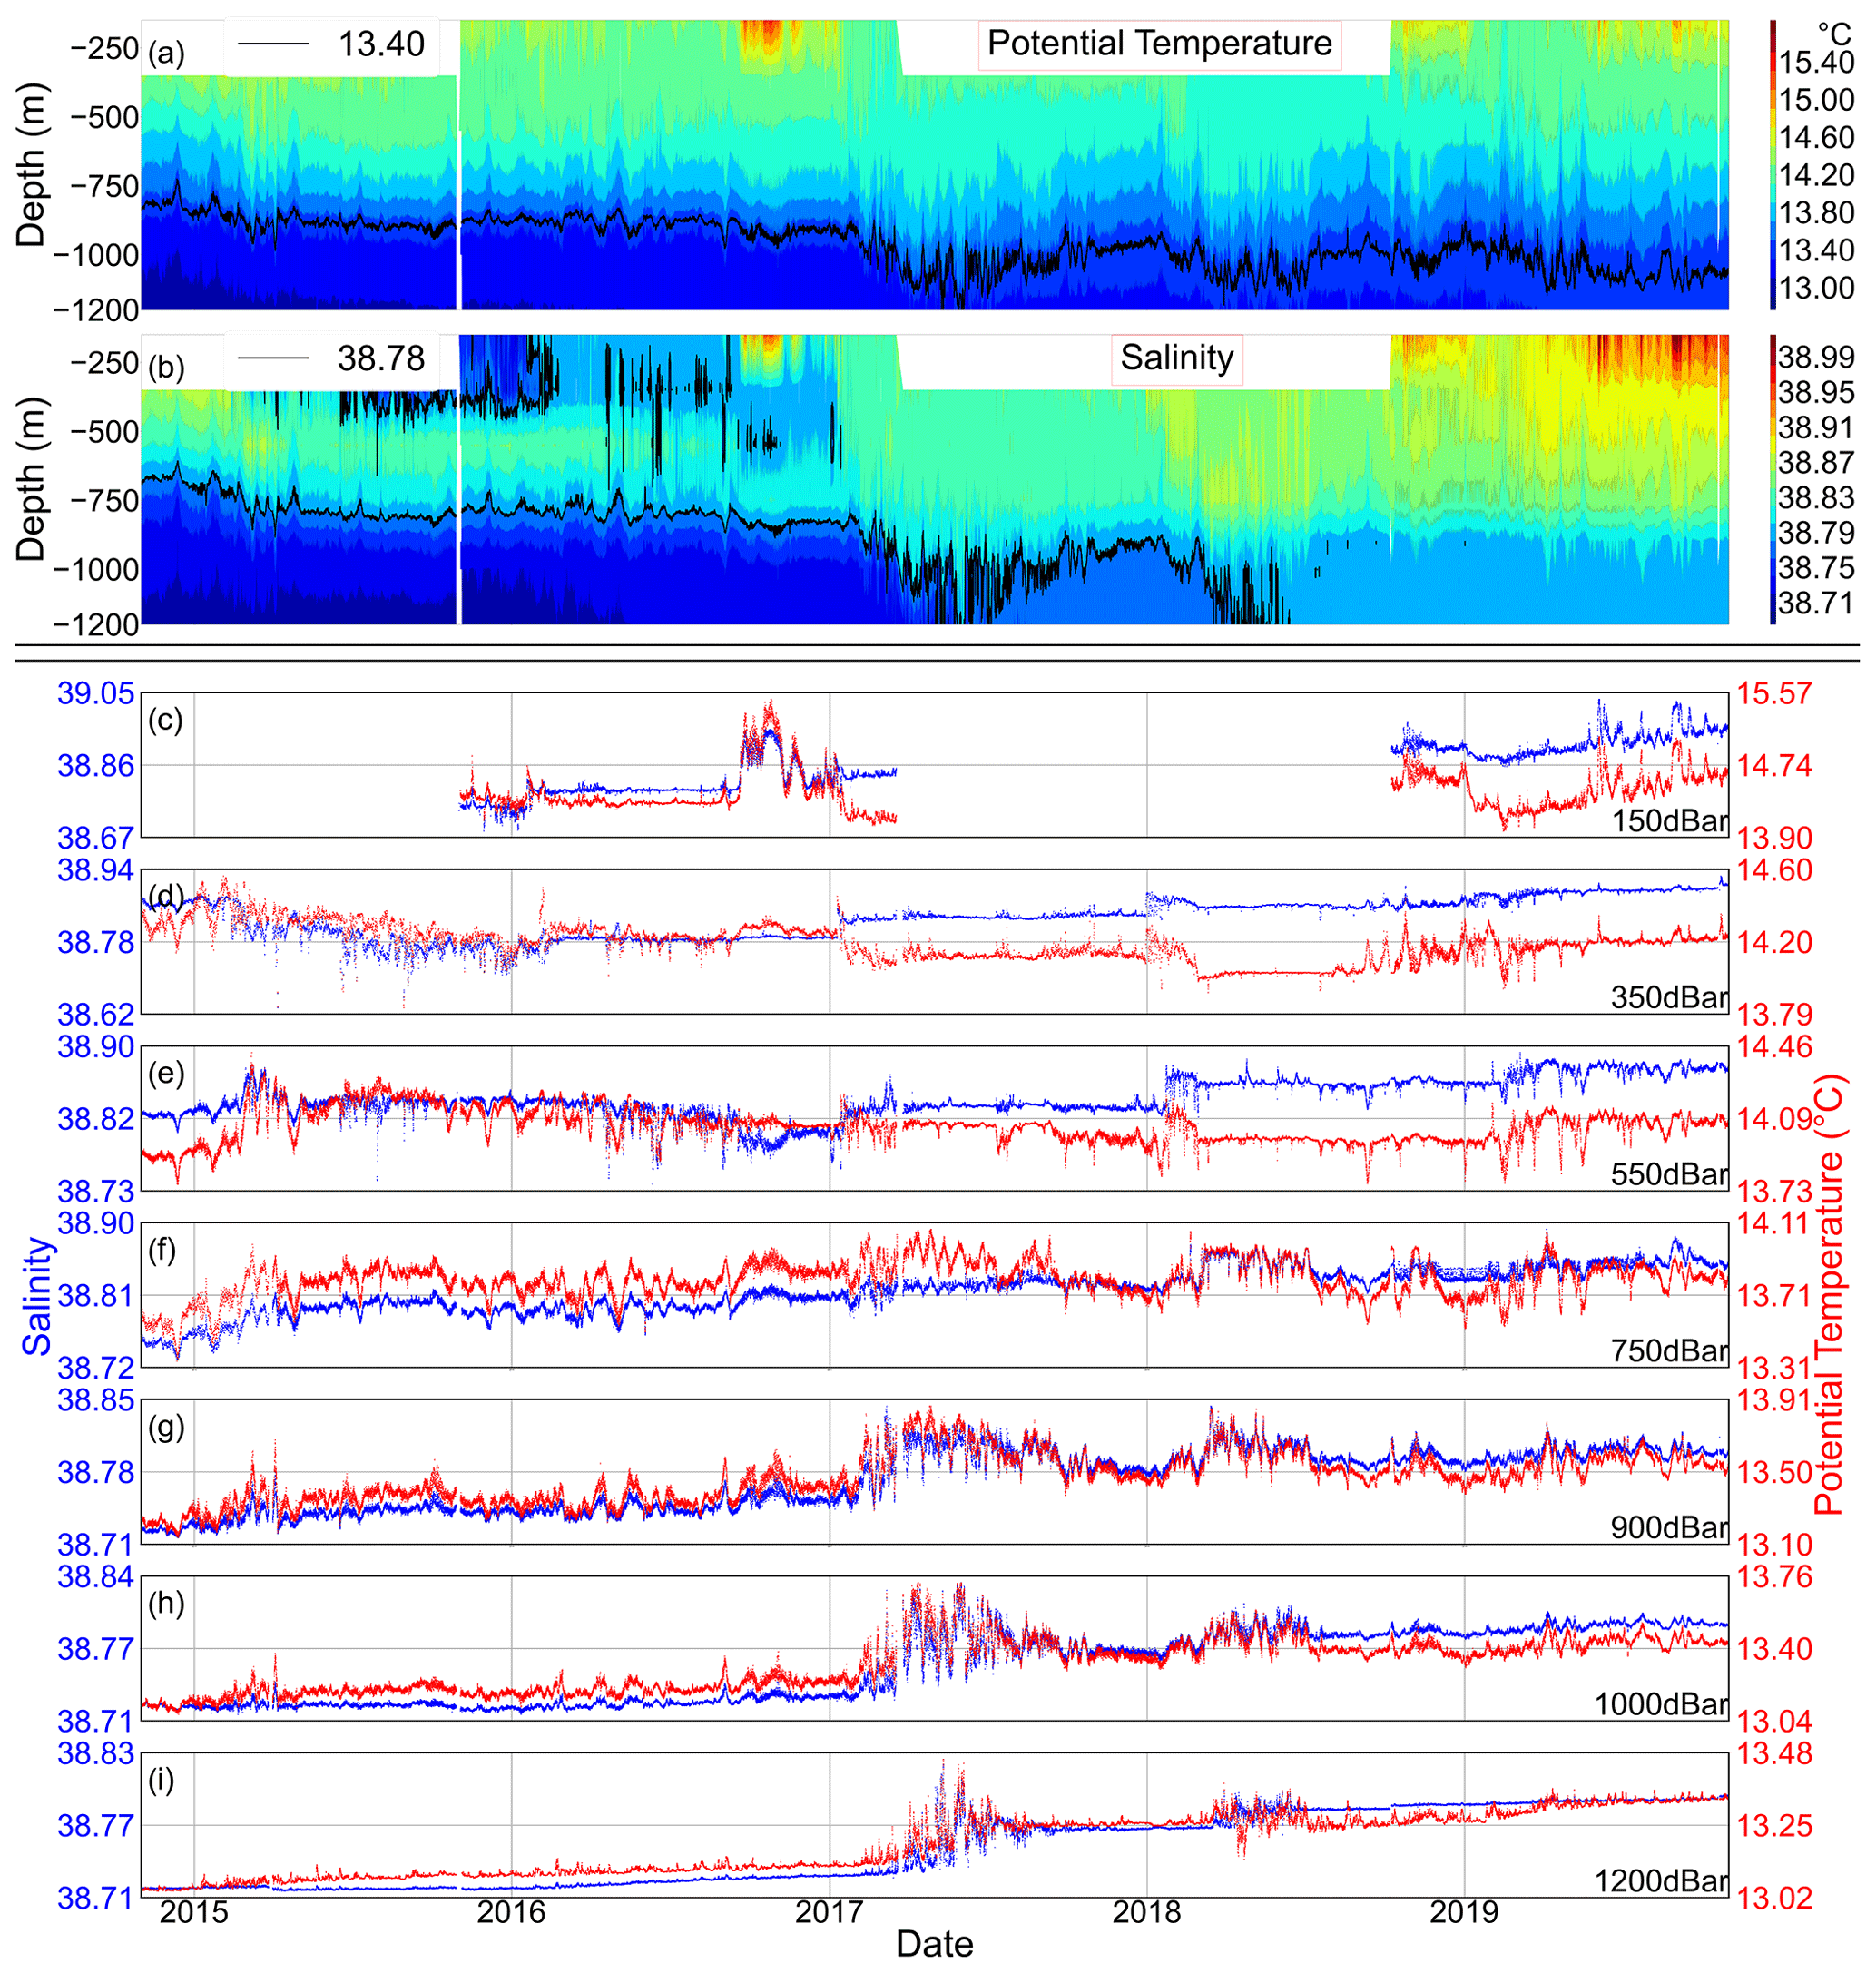
Figure 2Hovmöller diagrams (a, b) and time series (c–i) of potential temperature θ (°C; red) and salinity (blue) from the E2M3A mooring in the SAP. The isotherm of 13.4 °C and the isohaline of 38.78 (black solid line) show the mentioned strong oscillations after the winter of 2016/17 in the Hovmöller diagrams of θ and S, respectively.
In early 2017, the salinity at the surface and in the intermediate layer changed radically. The most important feature is the intrusion of high salinity into the intermediate layers contributing to a strong convection event in early winter, which is confirmed by the pool of homogenized water to a depth of about 700 dbar in the pit (Fig. 3b). Indeed, strong heat losses occurred in January (≈620 W m−2; Table 1) (Fig. 3a), which, together with the contribution of salt in the water column, facilitated the erosion of the stratification (Fig. 3b, Table 1). Mihanović et al. (2021) reported very high-salinity values (above 38.9) in the upper 100 dbar in the southern Adriatic as early as mid-March from Argo data, which increased to an exceptional salinity and temperature maximum at and near the surface by summer. Throughout the year, salinity in the water column remained exceptionally high, confirming the same trend observed by Mihanović et al. (2021) along the Palagruža transect during summer and autumn. Moreover, temperature and salinity observations are higher than the values/data reported in previous climatologies for the Adriatic and in the literature (Buljan and Zore-Armanda, 1976; Artegiani et al., 1997; Lipizer et al., 2014). In 2017 the water column showed a two-layer structure divided by the isohaline value of 38.83, with high-salinity waters occupying the surface and intermediate layers (down to about 800–850 dbar) and less saline waters (about 38.78) filling the deeper part of the pit. Water temperature in the latter, usually lower than 13 °C, increased to ≈13.2 °C. The strong oscillations (Fig. 2) occurring during this period below 750 dbar are not directly related to salt fingering predisposition and will be discussed in an upcoming publication (Le Meur et al., 2024).
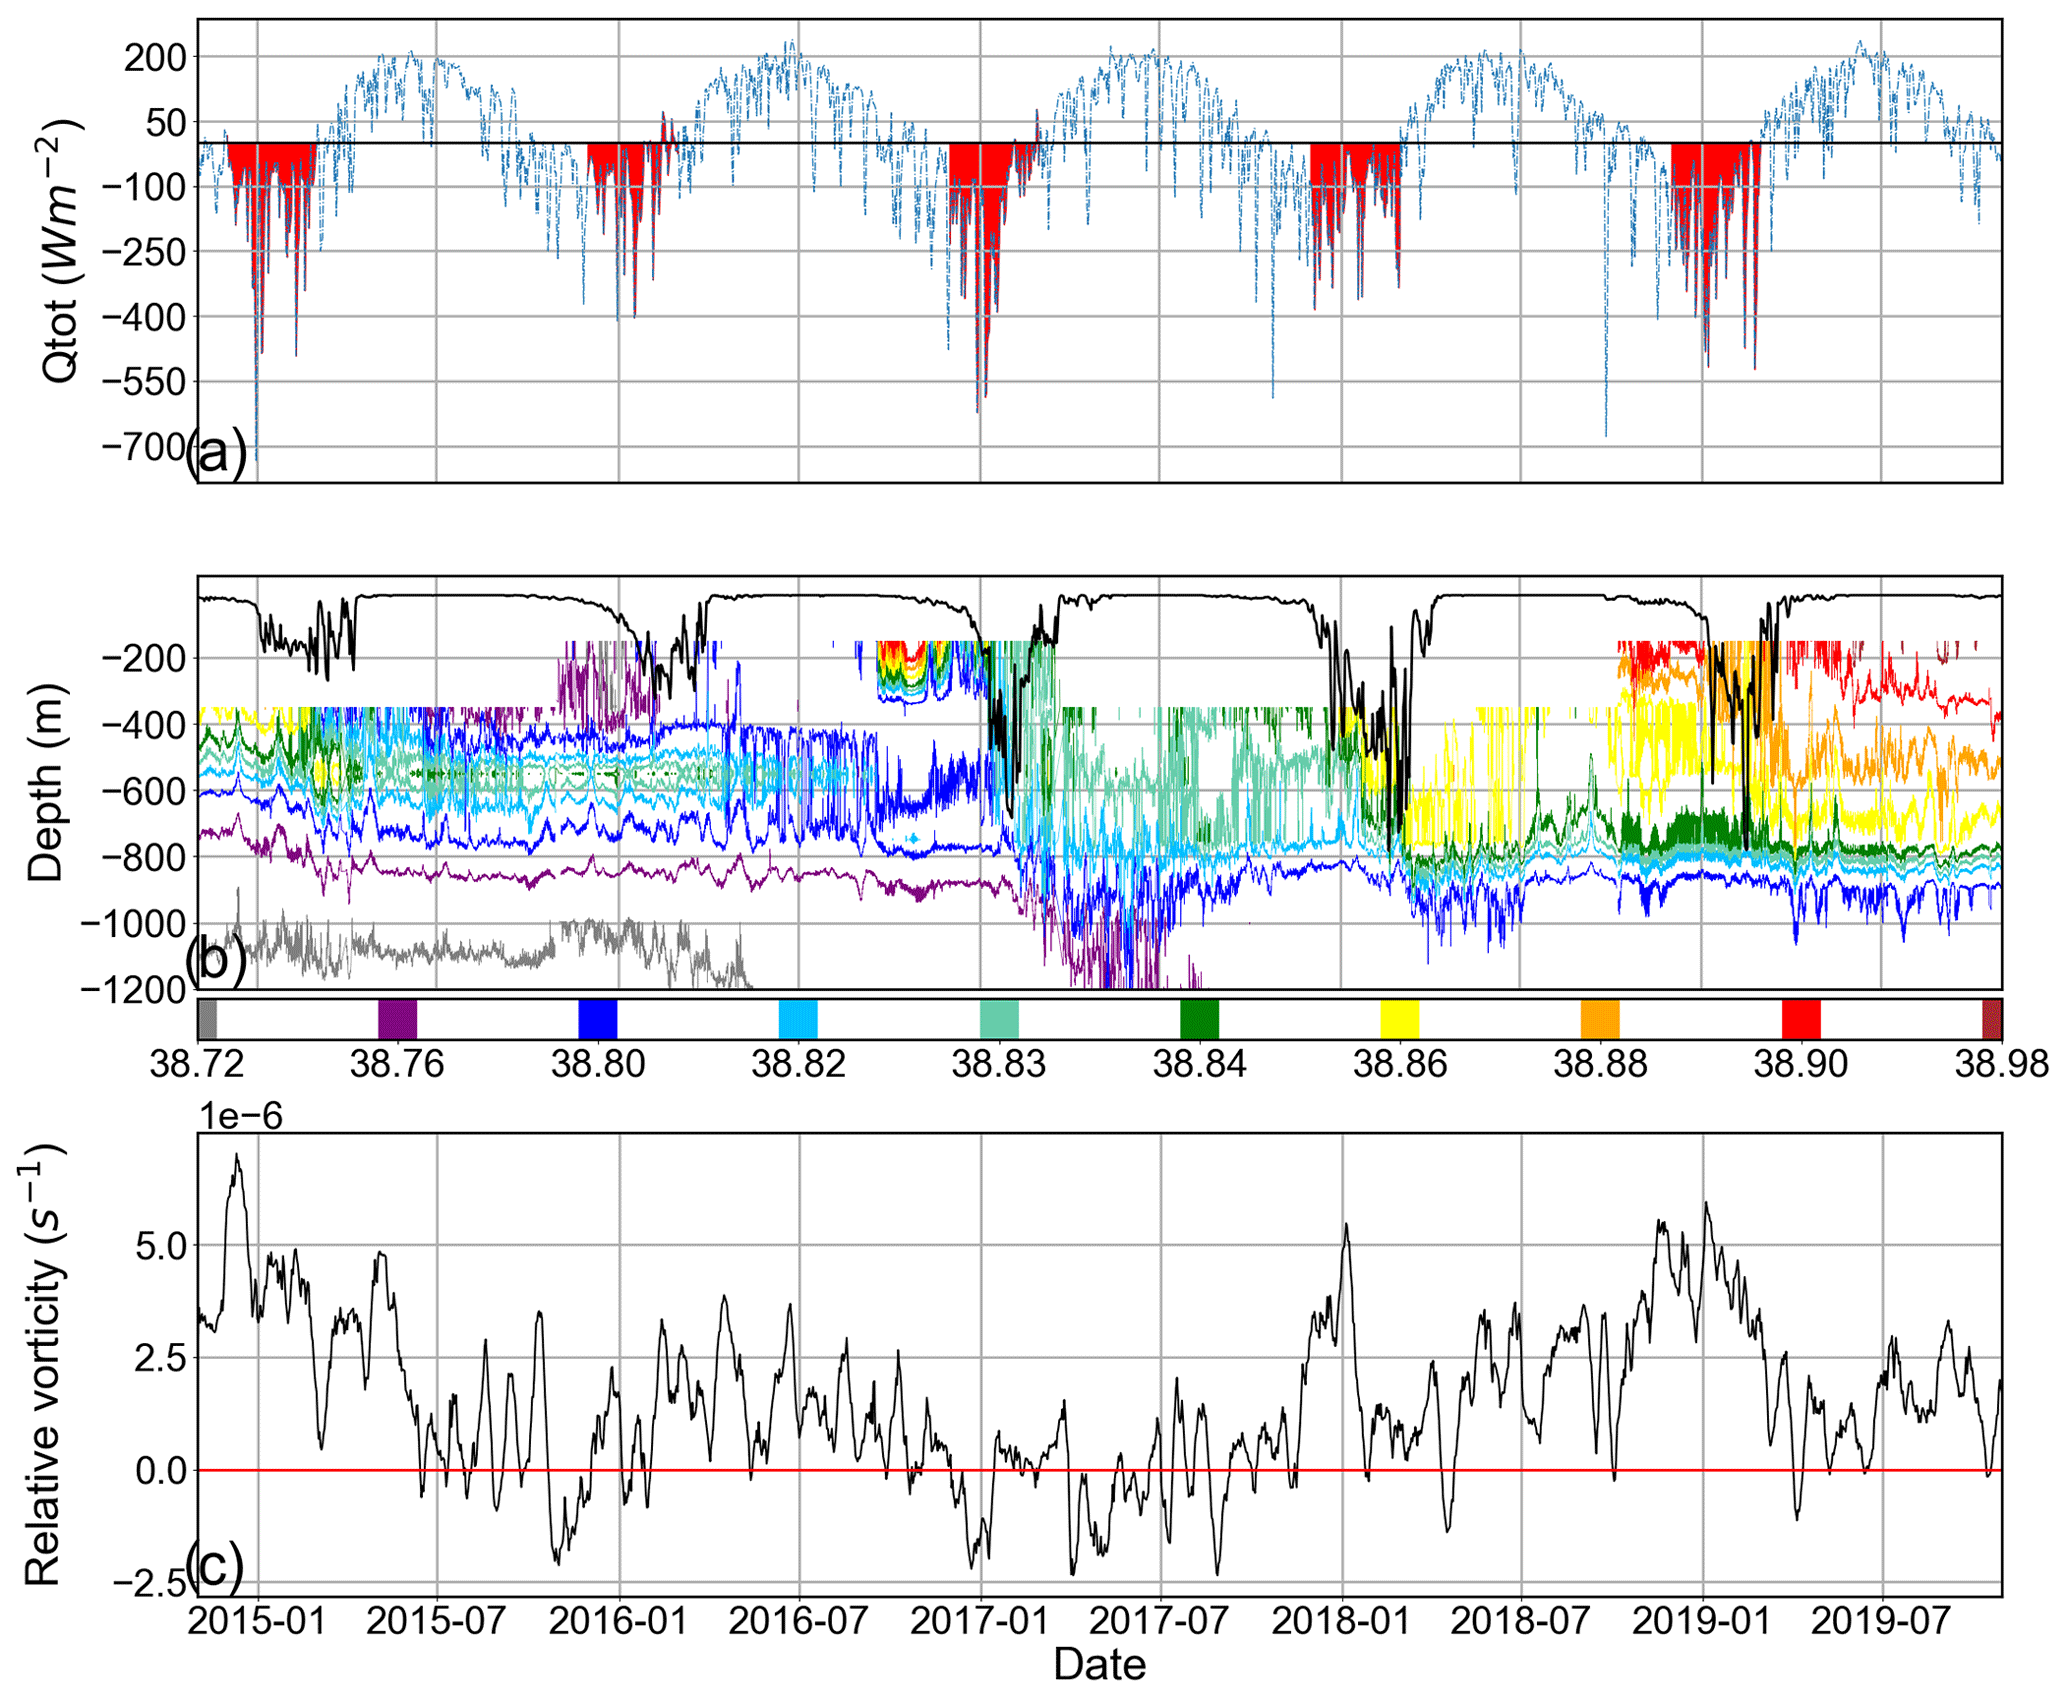
Figure 3The evolution of the three forcings connected to the changes in buoyancy. (a) Net surface heat flux (Qtot (W m−2); blue line) emphasizing the periods of winter negative surface heat flux (areas in red), (b) Salinity with mixed layer depth (MLD (m); solid black line) and (c) Relative vorticity (RV (s−1); solid black line). Surface salinity in the southern Adriatic peaked between August and October 2017, as indicated by data from two floats in the southern Adriatic (not shown). In early 2018, another sharp increase in salinity and temperature was observed in the surface and intermediate layers, reaching values of 38.89 and 14.25 °C, respectively, predisposing the water column to convection. Integrated surface heat loss for the winter period (Table 1) showed that despite less severe heat losses in the winter of 2018/19 (but very frequent weak losses in February and March), the new contribution of salt triggered again the convective mixing of the water column to about 850 dbar (Fig. 3b).
Table 1Integrated heat fluxes for the winter period (December–February; area in red, Fig. 3a), maximum heat loss and the depth reached by the mixed layer during the convection.
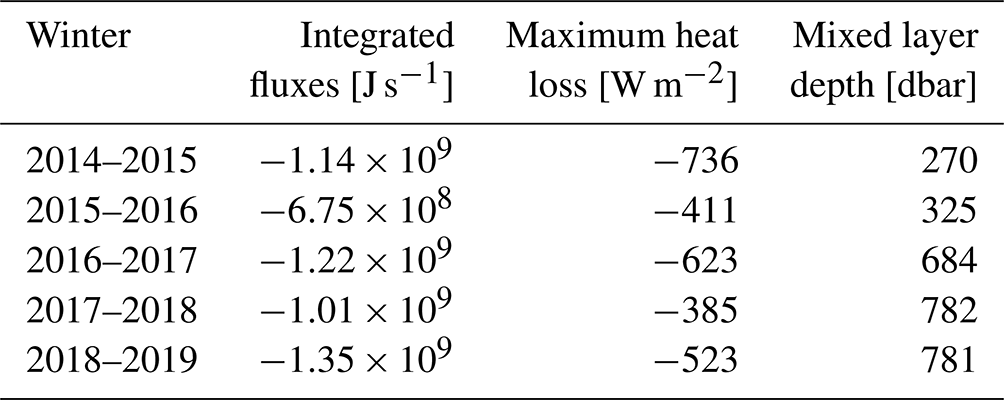
The water column maintained its “two-layer structure” in terms of salinity, with a halocline with values between 38.82 and 38.80 separating the surface layer from the deep layer. The deep layer (1000|1200 dbar) also experienced a sharp increase in salinity with values between 38.76 and 38.78 (Figs. 2 and 3b), which had never been observed in the last decade. The oscillations observed in the deepest layers in the previous year were present also after March 2018. Inflow of high-salinity and warm waters into the pit was registered closer to the surface in summer, which slowly deepened its horizon in the winter of 2018/19 and completely filled the surface and intermediate layers with values of around 38.88 during the winter period (end of February – beginning of March 2019). As a result, the amount of salt present in the water column triggered a convective mixing similar to that observed in the winter of 2017/18. No substantial changes were observed in the deep layer, which maintained the same characteristics as in late 2018 throughout 2019 and until the end of the study period. The above discussion indicates that saltier waters overlying less salty waters are a recurrent feature over the whole water column in the SAP. This leads to a predisposition to SF or convection.
3.2 Abrupt squared buoyancy frequency changes
The Hovmöller plot of Brunt–Väisälä frequency N2 (Fig. 4) shows a change in the stability structure of the water column in the SAP before and after the beginning of 2017. In winter 2015/16, the water column had high stability at about 450 and 800 dbar, which prevented convection despite high integrated heat losses. The barrier of high stability at about 450 dbar was eroded in 2016 due to saline intrusions in the upper layer. During winter 2016/17, the water column stability weakened further due to strong surface cooling, also pushing the core of the stable middle layer, which was around 800 dbar, down to about 950 dbar. After the winter of 2016/17, the N2 structure did not return to the state of previous years. Three forcings favored the change in the N2 structure in 2017 (as shown in Fig. 3a–c): first, strong heat loss at the surface during the winter of 2016/17, with the high salinity below the surface (150 to 350 dbar) pushing the intrusion of the LIW core downward; second, the departure of the less saline water above the LIW (Fig. 2); and third, the change in relative vorticity. The last one shifted from cyclonic ( s−1), favoring preconditioning, to anticyclonic ( s−1), possibly leading to upward Ekman pumping that brought more saline water to the surface, followed by a sharp jump back to cyclonic due to sinking of the dense waters. These three factors contributed to the observed low Brunt–Väisälä frequency N2 (Fig. 4) and the SF-favorable scenario.
3.3 Double diffusion and its evolution
Ocean stratification is subject to abrupt changes due to intermittent events such as gravity currents, horizontal intrusions and convection, as discussed in the previous subsection. These events not only overlap the continuous double-diffusive mixing but also interact with each other. In this section, we emphasize the effect of changes due to the convective process on the double-diffusive regime. We characterize the double diffusion by the Turner angle, Tu, and vector length, VL, introduced in Sect. 2. During the 5-year period, the Tu time series (Fig. 5a–e) showed variability ranging mainly from SF to doubly stable regimes, with the SF regime (blue line in Fig. 5a–e) dominating below a depth of 550 dbar.
The uppermost layer (350|550 dbar) is favorable to SF at the end of 2014 due to low salinity at 550 dbar. With the decrease in salinity at 350 dbar and an increase at 550 dbar (Fig. 2d, e), the uppermost layer turns to doubly stable conditions from late winter 2014/15 throughout 2016. At the same time, the potential temperature at 550 dbar increases and the stratification in both variables decreases, as can also be seen in VL in Fig. 6a. The stable stratification leads to low values of double-diffusion vertical mixing in the upper layer (350|550 dbar), and the underlying layers evolve more independently. Due to an increase in salinity at 350 dbar in early 2017, the uppermost layer showed peaks of strong conditions of SF and high VL. Subsequently, convection occurred causing the sharp decrease in VL and the occurrence of an unstable regime described by the Turner angle. The upper layer is homogenizing. This scenario of increased salinity in the upper part of the layer, leading to a favorable SF regime, convection and consequently a decrease in VL, also occurs with a time lag in the adjacent lower layer (550|750 dbar) and is repeated in 2018 in the same period. A further increase in salinity in 2018 and 2019 leads to a strong SF condition but at low VL values, which is only sporadically interrupted by an increase in temperature at 350 dbar.
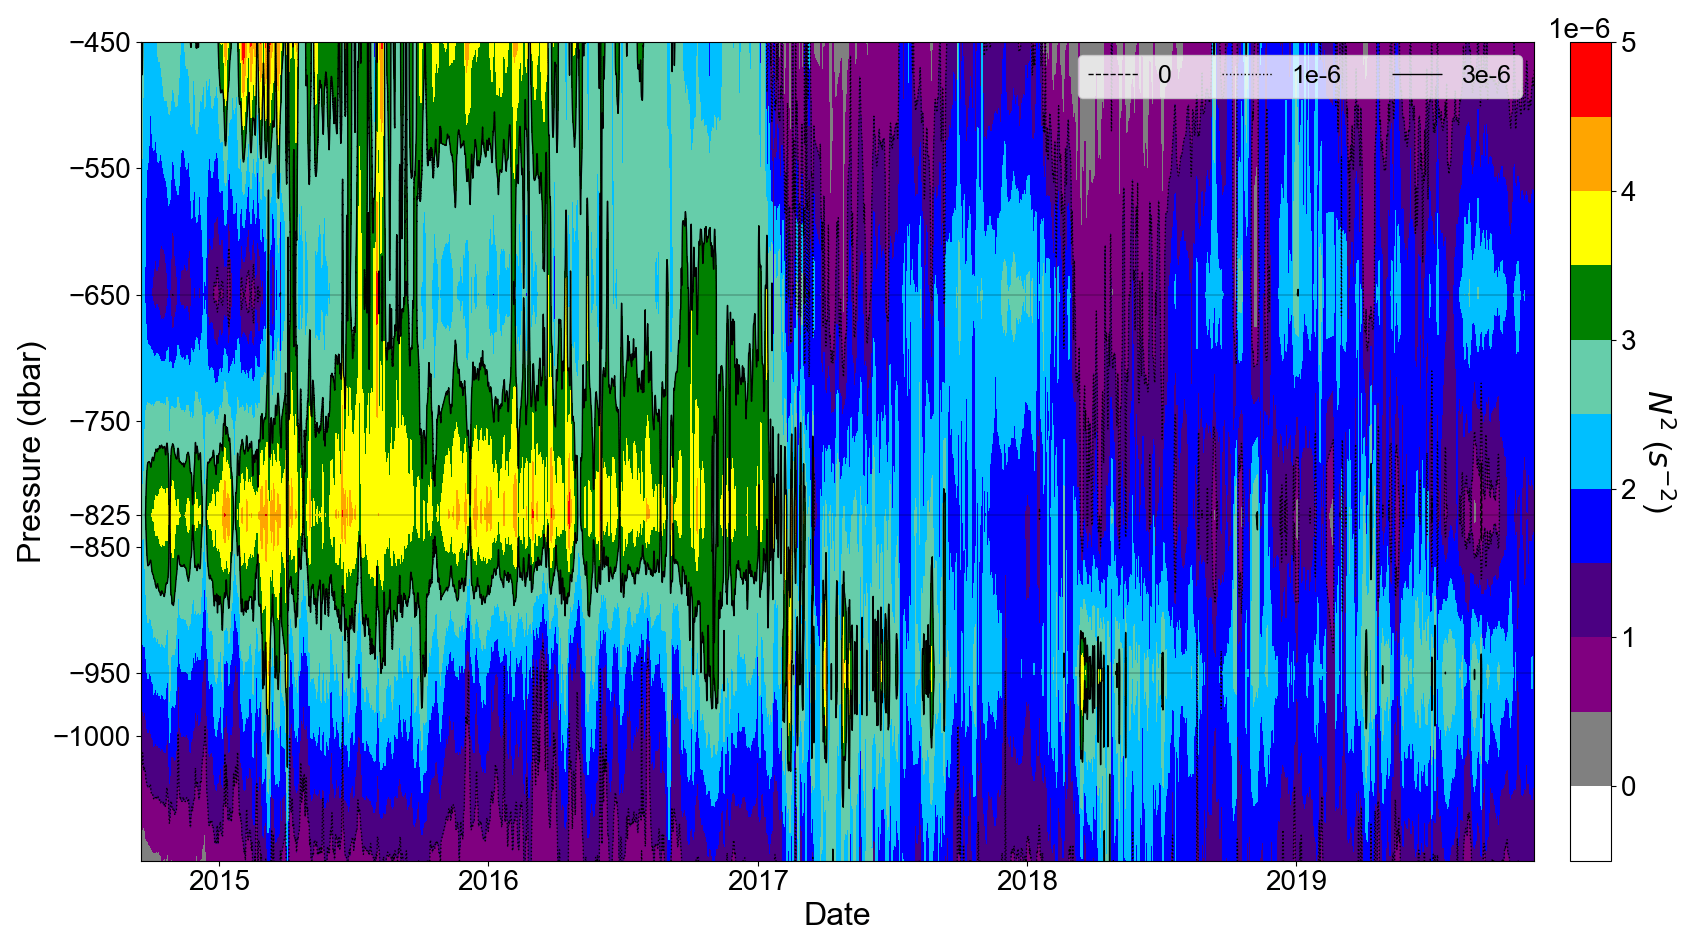
Figure 4Hovmöller diagram of squared buoyancy frequency (N2; s−2). The layers with data (at mid-pressure between two observation depths) are marked with thin solid lines (450, 650, 825, 950 and 1100 dbar). A clear change in N2 after the winter of 2016/17 is noticed.
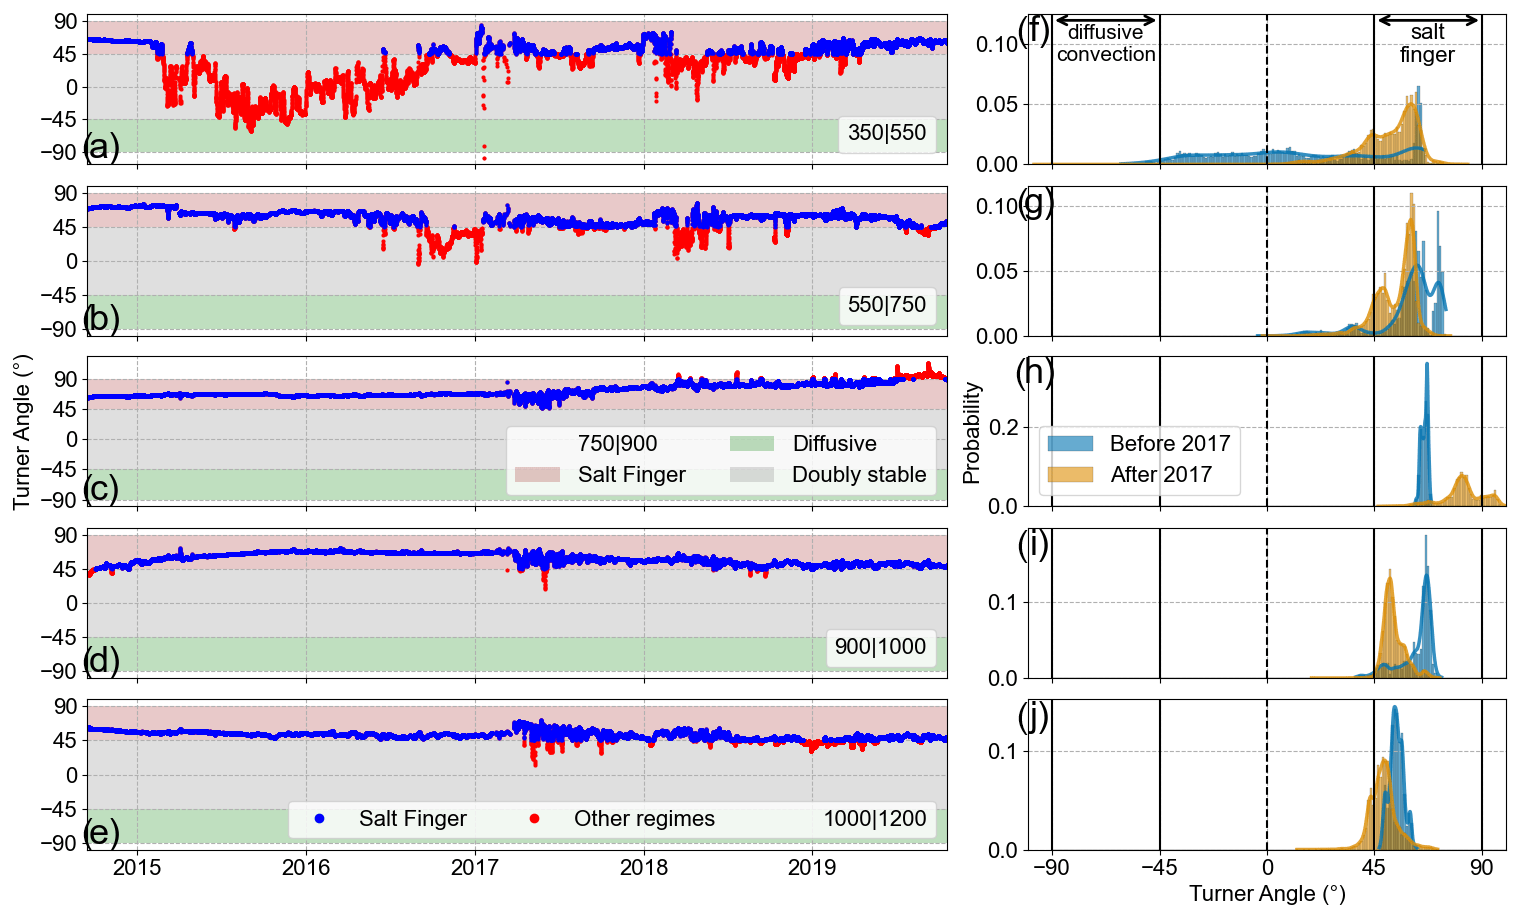
Figure 5(a–e) Turner angle time series using vertical potential temperature and salinity gradients and (f–j) the related PDFs calculated before (blue) and after (orange) 2017. The numbers in the legend represent the pressure levels that define the layer, and blue markers are periods of SF regime (pink background).
The second layer (550|750 dbar, Figs. 5b and 6b) is in a SF regime, interrupted only in late 2016 and spring 2018. In the first period, a reduction in salinity at 550 dbar leads to stabilization. This reduction is not observed in the adjacent layers and results from the deepening of the LIW layer, which also reduces the stability of the upper layer. In the second period, the stabilization is due to a sudden increase in salinity at 750 dbar, which is observed to varying magnitude throughout the water column. Since the stabilization strongly reduces the VL down to 900 dbar, it is due to convective (winter convection) mixing.
The third layer (750–900 dbar, Figs. 5c and 6c) shows a continuous increase in Tu from SF to unstable by the end of 2019 due to a continuous increase in salinity at 750 dbar. There is a sudden decrease in VL due to the 2017 event, caused by an increase in salinity at 900 dbar.
In the two deepest layers (900–1000 and 1000–1200 dbar, Figs. 5d, e and 6d, e), there is a shift towards reduced predisposition of SF strength after the 2017 event, which is also seen by increased variability in VL. Analysis of VL shows an eradication of stratification in early 2017 from 350 dbar down to 900 dbar, which persists until the end of the data record. The prominent peaks in Tu and VL in the first layer (350|550 dbar) in early 2017 are due to the arrival of warm, salty water at 350 dbar that possibly triggered strong SF (see also Fig. 7 and the discussion of the Argo data below). The stabilization of the water column in early spring 2017 in the two lower layers, seen by a jump and oscillations in the VL, is due to gravity currents (Le Meur et al., 2024)
We also plotted the probability density functions (PDFs) of Tu and VL through the end of 2016 and from 2017 through the end of the observation period (Figs. 5f–j and 6f–j). All PDFs from Tu show dominance of the SF regime except in the uppermost layer due to the period from early 2015 to the end of 2016. The regime change in 2017 is indicated by an increase in Tu in the 750|900 dbar layer and a decrease in the 900|1000 dbar layer. In these two layers, the peaks of the PDFs are well separated, indicating a regime change. In the deepest layer (1000|1200 dbar), an oscillatory pattern from 2017 is observed, moving from SF to a doubly stable regime, spreading the PDF in the second period but keeping the peaks close. The Tu shows a notable tendency in SF in the 750|900 dbar layer after 2017 and a stabilizing trend in the layer below due to the convective event in 2017.
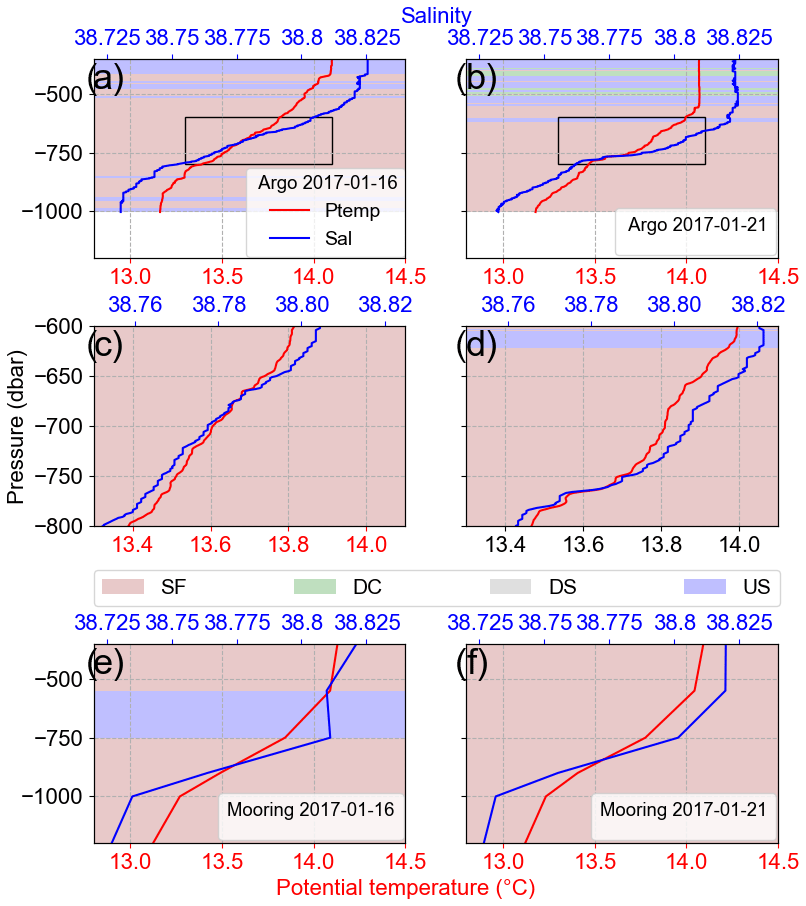
Figure 7(a–b) Argo float θ and S profiles on 16 and 21 January 2017, with rectangles defining the area to be zoomed. (c–d) Zoom of Argo profiles between 600 and 800 dbar showing staircase features below convection depth in the SF regime. (e–f) Mooring data collected on 16 and 21 January 2017 showing good coherence with Argo data. Potential temperature (Ptemp; red lines) and salinity (Sal; blue lines). The background colors represent the Turner angle regimes: SF – salt finger; DC – diffusive convection; DS – doubly stable; US – unstable.
The PDFs of VL show a significant decrease above 900 dbar, indicating the eradication of stratification, decreasing salinity gradients; the PDFs are well separated for the two layers between 550 and 900 dbar. Interestingly, the 750|900 dbar layer is characterized by a clear positive trend in SF regime after 2017, but the VL decreased notably. As already mentioned, we assume that the conditions are still favorable to SF, but with the decreased vertical gradients in salinity, the favorable associated vertical mixing is weaker.
The SF occurrence was 83 % of all measurements. The most relevant change in SF occurrence is for the uppermost layer (350|550 dbar), changing from 27 % to 72 % for measurements before and after 2017, respectively, indicating the significant increase in SFs (Fig. 5a, blue dots). Our observational data show a shift in the vertical double-diffusion regimes in the SAP during the winter of 2016/17 in all layers (Fig. 5) in the Tu and VL variables. During this period our data from EMSO-E2M3A show the dominance of SF conditions from 350 dbar to the bottom (Fig. 7e and f) at a VL which is significantly non-vanishing (Fig. 6a–e). These results are confirmed by the Argo float section (Fig. 7a–d). The Argo floats have a fine vertical resolution and clearly show the existence of staircases (Fig. 7c and d) (van der Boog et al., 2022). The staircase structure of SF has thin interfaces separating thicker, well-mixed layers. Salt flux from the upper high-salinity layer to the low-salinity layer below continuously mixes the water, and the convective turbulence of the layers limits the length of the fingers (Schmitt, 1988, 2003; Carniel et al., 2008; Durante et al., 2021).
The increase in near-surface salinity by horizontal advection through the Strait of Otranto (Kokkini et al., 2020; Mihanović et al., 2021) favors SF, followed by convection down to 500 dbar on 21 January 2017. We go further and hypothesize that the high salinity at the surface of the SAP could influence the observed change in relative vorticity through a salt lens of warm waters, explaining the anticyclonic tendency (see, i.e., Tokos and Rossby, 1991, for subsurface salt-lens dynamics) during the preconditioning phase in the winter of 2016/17. The strong wintertime cooling then leads to convection and the sinking of the salt lens, which increases the relative vorticity. Below the convection depth the SF strength persists. In contrast with the results of Meccia et al. (2016), we observed an increased predisposition of SF occurrence in the SAP due to the increase in salinity, and this could enhance salt finger double diffusion in the subsurface layer of 350|550 dbar. The results of Carniel et al. (2008) showed that the northern part of the Adriatic works differently than the SAP because of the Po River plume influence, which brings fresh water to the surface and allows the presence of diffusive–convective double diffusion, not significantly observed in the SAP in the analyzed data. Still, the same order of magnitude for the diffusivity coefficient was estimated (O(10−4 m2 s−1)).
SF is the dominant regime at the EMSO-E2M3A facility. From 2014 to the end of 2016 strong stratification above 400 dbar and at 800 dbar reduced the double-diffusive favorable mixing between the upper ocean and the deep SAP. After the winter of 2014/15, the upper layer passes from SF to doubly stably stratified, further reducing the possibility of having active salt fingering and consequently double-diffusion vertical mixing. A shift in the SF characteristics is observed in the winter of 2016/17 throughout the water column due to the arrival of high-salinity waters that favored a convective event penetrating to about 750 dbar. This extreme event increases the conditions for SF above 900 dbar and homogenizes the water column above. No return to the previous state is seen in the observation period. This might possibly happen on a decadal timescale, as it was determined in Cardin et al. (2020a) that the characteristic timescale of the deep SAP is around 7 years. Continued observations are necessary to draw conclusions on a return to the previous state. Salt fingering is shown to be a consequence and a possible driver of the density structure in the SAP: it is governed by salt intrusions through the Strait of Otranto and increases the vertical mixing. Salt intrusions from the Ionian Sea favor SF and convection and homogenize the water column in the SAP. Dense gravity currents originating from the northern Adriatic have the potential to enhance the stratification by increasing the density in the SAP. The vertical exchange is performed by enhanced mixing due to SF and convection. How the competition between sporadically extreme and continuous processes changes the structure of the water column and how it acts on the thermohaline circulation of the Mediterranean will be a subject of future studies.
To the best of our knowledge, it is the first time that a high-frequency multi-year time series from different water depths is used to determine the Turner angle and the double-diffusive regimes. The supplementary analysis of vector length to verify the significance of Turner angle results was a novelty introduced in this study and, analyzed together with the squared buoyancy frequency, allowed us to discuss the stability structure changes. The increase in SF observations after the winter of 2016/17 cannot be ignored because it can modify the thermohaline circulation in the region (Zhang and Schmitt, 2000), affecting the water exchange between the Adriatic and Mediterranean.
The high vertical diffusivity coefficient of m2 s−1 found in Cardin et al. (2020a) is here explained by the dominant SF double-diffusion regime below 750 dbar, and the probability of SF occurring in the whole water column increased after the winter of 2016/17.
All documented events occurred during a period of unprecedented high-salinity transport from the Ionian to Adriatic seas. The North Ionian Gyre (NIG) vorticity (not shown) decreased in the period from 2015 to 2018, and the system turned anticyclonic in 2017 (Mihanović et al., 2021; Civitarese et al., 2023). After 2018, the vorticity started to increase again and turned cyclonic in 2019. The eastward extension of the NIG between 2015 and 2019 was not enough to prevent the flow toward the Adriatic along the eastern Ionian seaboard, conveying a large input of salt into the SAP (Fig. 2).
Measurements at the EMSO-E2M3A facility have demonstrated the Eulerian or fixed-point observatories' importance as an essential component of the global ocean observing system. They allow the detection of extreme events that occur rarely during the multi-year observation period, such as the strong convection events that homogenize the water column leading to long-term alterations of the density structure. They also offer several unique features not found in other systems and therefore complement them (Cristini et al., 2016), and they provide a unique opportunity for multidisciplinary and interdisciplinary work combining a variety of observations on a large range of timescales.
Code is available at https://doi.org/10.5281/zenodo.10863275 (Amorim, 2024).
The original contributions presented in the study are included in the article and Supplement, and further inquiries can be directed to the corresponding author/s. Data are available at the National Oceanographic Data Center – NODC (https://doi.org/10.6092/F8E6D18E-F877-4AA5-A983-A03B06CCB987, Cardin et al., 2015; https://doi.org/10.6092/238B5903-A173-4FC3-AC5F-5FEDF1064A39, Cardin et al., 2018; https://doi.org/10.6092/d0d50095-bd30-4ff7-8d0a-a12121e72f78, Cardin et al., 2020b), the Copernicus Marine Service (mixed layer depth, https://doi.org/10.48670/moi-00141, CMEMS, 2022a; surface geostrophic velocities, https://doi.org/10.25423/CMCC/MEDSEA_MULTIYEAR_PHY_006_004_E3R1, CMEMS, 2022b) and the Copernicus Data Climate Store (surface heat flux, https://doi.org/10.24381/cds.adbb2d47, Hersbach et al., 2018).
The supplement related to this article is available online at: https://doi.org/10.5194/os-20-463-2024-supplement.
All the authors contributed to the conceptualization, writing the original draft, and review and editing. VC provided the funding acquisition.
The contact author has declared that none of the authors has any competing interests.
Publisher’s note: Copernicus Publications remains neutral with regard to jurisdictional claims made in the text, published maps, institutional affiliations, or any other geographical representation in this paper. While Copernicus Publications makes every effort to include appropriate place names, the final responsibility lies with the authors.
This article is part of the special issue “Extremes in the marine environment: analysis of multi-temporal and multi-scale dynamics using observations, models, and machine learning techniques”. It is not associated with a conference.
The authors thank the reviewers for the helpful comments that substantially improved the final version of this work. We are also grateful to the OGS PHYS and TECDEV groups and the captain and crew of the RV OGS Explora and RV Laura Bassi for the valuable support and work during the maintenance of the EMSO-E2M3A regional facility. The Argo data used in this work were collected and made freely available by the International Argo Program and the national programs that contribute to it (https://argo.ucsd.edu, last access: 18 March 2024; https://www.ocean-ops.org, last access: 18 March 2024). The results contain modified Copernicus Climate Change Service information 2020. Neither the European Commission nor ECMWF is responsible for any use that may be made of the Copernicus information or data it contains. This study has been conducted using EU Copernicus Marine Service Information and DOI links to data used in this study.
This study has been developed in the framework of the project “CIR01_00030 – InSEA – Iniziative in Supporto al consolidamento e potenziamento dell'infrastruttura EMSO e delle sue attività – Rafforzamento del capitale umano”, financed by the Ministry of University and Research – Development and Cohesion Fund (FSC) under the “PNIR – Programma Nazionale Infrastrutture di Ricerca” – DD 2595 24/12/2019 – Rafforzamento del capitale umano delle Infrastrutture di Ricerca.
This paper was edited by Matjaz Licer and reviewed by Ivica Vilibić and two anonymous referees.
Amorim, F. L. L.: fllamorim/Amorim_et_al_2024a: v1 (Amorim_et_al_2024a), Zenodo [code], https://doi.org/10.5281/zenodo.10863275, 2024.
Artegiani, A., Paschini, E., Russo, A., Bregant, D., Raicich, F., and Pinardi, N.: The Adriatic Sea General Circulation, Part I: Air–Sea Interactions and Water Mass Structure, J. Phys. Oceanogr., 27, 1492–1514, https://doi.org/10.1175/1520-0485(1997)027<1492:TASGCP>2.0.CO;2, 1997.
Bensi, M., Cardin, V., and Rubino, A.: Thermohaline Variability and Mesoscale Dynamics Observed at the Deep-Ocean Observatory E2M3A in the Southern Adriatic Sea, in: The Mediterranean Sea, edited by: Borzelli, G. L. E., Gačić, M., Lionello, P., Malanotte-Rizzoli, P., John Wiley & Sons, Inc., https://doi.org/10.1002/9781118847572.ch9, 2014.
Buljan, M. and Zore-Armanda, M.: Oceanographical properties of the Adriatic Sea, Oceanogr. Mar. Biol. Ann. Rev., 14, 11–98, 1976.
Bryden, H. L., Schroeder, K., Sparnocchia, S., Borghini, M., and Vetrano, A.: Thermohaline staircases in the western Mediterranean Sea, J. Mar. Res., 72, 1–18, https://doi.org/10.1357/002224014812655198, 2014.
Cardin, V. and Gačić, M.: Long-term heat flux variability and winter convection in the Adriatic Sea, J. Geophys. Res.-Oceans, 108, 8103, https://doi.org/10.1029/2002jc001645, 2003.
Cardin, V., Bensi, M., and Pacciaroni, M.: Variability of water mass properties in the last two decades in the South Adriatic Sea with emphasis on the period 2006–2009, Cont. Shelf Res., 31, 951–965, https://doi.org/10.1016/j.csr.2011.03.002, 2011.
Cardin, V., Bensi, M., Ursella, L., and Siena, G.: E2m3a-2013-2015-Time-Series South adriatic, OGS (Istituto Nazionale di Oceanografia e di Geofisica Sperimentale), Division of Oceanography [data set], https://doi.org/10.6092/F8E6D18E-F877-4AA5-A983-A03B06CCB987, 2015.
Cardin, V., Bensi, M., Ursella, L., and Siena, G.: E2m3a-2015-2017-Time Series-South Adriatic, OGS (Istituto Nazionale di Oceanografia e di Geofisica Sperimentale), Division of Oceanography [data set], https://doi.org/10.6092/238B5903-A173-4FC3-AC5F-5FEDF1064A39, 2018.
Cardin, V., Wirth, A., Khosravi, M., and Gačić, M.: South Adriatic Recipes: Estimating the Vertical Mixing in the Deep Pit, Front. Mar. Sci., 7, 565982, https://doi.org/10.3389/fmars.2020.565982, 2020a.
Cardin, V., Siena, G., Brunetti, F., and Kuchler, S.: E2M3A-2017-2019-CTD-time-series SouthAdriatic, OGS (Istituto Nazionale di Oceanografia e di Geofisica Sperimentale), Division of Oceanography [data set], https://doi.org/10.6092/d0d50095-bd30-4ff7-8d0a-a12121e72f78, 2020b.
Carniel, S., Sclavo, M., Kantha, L., and Prandke, H.: Double-diffusive layers in the Adriatic Sea, Geophys. Res. Lett., 35, 1–6, https://doi.org/10.1029/2007GL032389, 2008.
Chiggiato, J., Bergamasco, A., Borghini, M., Falcieri, F. M., Falco, P., Langone, L., Miserocchi, S., Russo, A., and Schroeder, K.: Dense-water bottom currents in the Southern Adriatic Sea in spring 2012, Mar. Geol., 375, 134–145, https://doi.org/10.1016/j.margeo.2015.09.005, 2016.
Civitarese, G., Gačić, M., Batistić, M., Bensi, M., Cardin, V., Dulčić, J., Garić, R., and Menna, M.: The BiOS mechanism: History, theory, implications, Prog. Oceanogr., 216, 103056, https://doi.org/10.1016/j.pocean.2023.103056, 2023.
CMEMS: European Seas Gridded L 4 Sea Surface Heights And Derived Variables Reprocessed 1993 Ongoing, E.U. Copernicus Marine Service Information (CMEMS), Marine Data Store (MDS) [data set], https://doi.org/10.48670/moi-00141, 2022a.
CMEMS: Mediterranean Sea Physics Reanalysis, Copernicus Marine Service Information (CMEMS), Marine Data Store (MDS) [data set], https://doi.org/10.25423/CMCC/MEDSEA_MULTIYEAR_PHY_006_004_E3R1, 2022b.
Cristini, L., Lampitt, R. S., Cardin, V., Delory, E., Haugan, P., O'Neill, N., Petihakis, G., and Ruhl, H. A.: Cost and value of multidisciplinary fixed-point ocean observatories, Mar. Pol., 71, 138–146, https://doi.org/10.1016/j.marpol.2016.05.029, 2016.
Durante, S., Schroeder, K., Mazzei, L., Pierini, S., Borghini, M., and Sparnocchia, S.: Permanent Thermohaline Staircases in the Tyrrhenian Sea, Geophys. Res. Lett., 46, 1562–1570, https://doi.org/10.1029/2018GL081747, 2019.
Durante, S., Oliveri, P., Nair, R., and Sparnocchia, S.: Mixing in the Tyrrhenian Interior Due to Thermohaline Staircases, Front. Mar. Sci., 8, 672437, https://doi.org/10.3389/fmars.2021.672437, 2021.
Gačić, M., Eusebi Borzelli, G. L., Civitarese, G., Cardin, V., and Yari, S.: Can internal processes sustain reversals of the ocean upper circulation? The Ionian Sea example, Geophys. Res. Lett., 37, 1–5, https://doi.org/10.1029/2010GL043216, 2010.
Harris, C. R., Millman, K. J., van der Walt, S. J., Gommers, R., Virtanen, P., Cournapeau, D., Wieser, E., Taylor, J., Berg, S., Smith, N. J., Kern, R., Picus, M., Hoyer, S., van Kerkwijk, M. H., Brett, M., Haldane, A., Fernández del Río, J., Wiebe, M., Peterson, P., Gérard-Marchant, P., Sheppard, K., Reddy, T., Weckesser, W., Abbasi, H., Gohlke, C., and Oliphant, T. E.: Array programming with NumPy. Nature, 585, 357–362, https://doi.org/10.1038/s41586-020-2649-2, 2020.
Hersbach, H., Bell, B., Berrisford, P., Biavati, G., Horányi, A., Muñoz Sabater, J., Nicolas, J., Peubey, C., Radu, R., Rozum, I., Schepers, D., Simmons, A., Soci, C., Dee, D., and Thépaut, J.-N.: ERA5 hourly data on single levels from 1940 to present, Copernicus Climate Change Service (C3S) Climate Data Store (CDS), https://doi.org/10.24381/cds.adbb2d47 (last access: 4 February 2024), 2018.
Hersbach, H., Bell, B., Berrisford, P., Hirahara, S., Horányi, A., Muñoz-Sabater, J., Nicolas, J., Peubey, C., Radu, R., Schepers, D., Simmons, A., Soci, C., Abdalla, S., Abellan, X., Balsamo, G., Bechtold, P., Biavati, G., Bidlot, J., Bonavita, M., De Chiara, G., Dahlgren, P., Dee, D., Diamantakis, M., Dragani, R., Flemming, J., Forbes, R., Fuentes, M., Geer, A., Haimberger, L., Healy, S., Hogan, R. J., Hólm, E., Janisková, M., Keeley, S., Laloyaux, P., Lopez, P., Lupu, C., Radnoti, G., de Rosnay, P., Rozum, I., Vamborg, F., Villaume, S., and Thépaut, J.: The ERA5 global reanalysis, Q. J. Roy. Meteor. Soc., 146, 1999–2049, https://doi.org/10.1002/qj.3803, 2020.
Hunter, J. D.: Matplotlib: A 2D Graphics Environment, Comput. Sci. Eng., 9, 90–95, 2007.
Kokkini, Z., Mauri, E., Gerin, R., Poulain, P. M., Simoncelli, S., and Notarstefano, G.: On the salinity structure in the South Adriatic as derived from float and glider observations in 2013–2016, Deep-Sea Res. Pt. II, 171, 104625, https://doi.org/10.1016/j.dsr2.2019.07.013, 2020.
Leaman, K.: The formation of Western Mediterranean deep water, in: The Seasonal and Interannual Variability of the Western Mediterranean Sea, Coastal and Estuarine Studies, Vol. 46, edited by: La Violette, P. E., American Geophysical Union, Washington, DC, 227–248, 1994.
Leaman, K. D. and Schott, F. A.: Hydrographic Structure of the Convection Regime in the Gulf of Lions: Winter 1987, J. Phys. Oceanogr., 21, 575–598, 1991.
Lee, C., Chang, K., Lee, J. H., and Richards, K. J.: Vertical mixing due to double diffusion in the tropical western Pacific, Geophys. Res. Lett., 41, 7964–7970, https://doi.org/10.1002/2014GL061698, 2014.
Le Meur, J., Wirth, A., Paladini de Mendoza, F., Miserocchi, S., and Cardin, V.: Intermittent supply of dense water to the deep South Adriatic Pit: an observational study, in preparation, 2024.
Lipizer, M., Partescano, E., Rabitti, A., Giorgetti, A., and Crise, A.: Qualified temperature, salinity and dissolved oxygen climatologies in a changing Adriatic Sea, Ocean Sci., 10, 771–797, https://doi.org/10.5194/os-10-771-2014, 2014.
Marshall, J. and Schott, F.: Open-ocean convection: Observations, theory, and models, Rev. Geophys., 37, 1–64, https://doi.org/10.1029/98RG02739, 1999.
McDougall, T. J. and Barker, P. M.: Getting started with TEOS-10 and TS26 the Gibbs Seawater (GSW) Oceanographic Toolbox, 28 pp., SCOR/IAPSO WG127, ISBN 978-0-646-55621-5, 2011.
McDougall, T. J. and Barker, P. M.: Comment on “Buoyancy frequency profiles and internal semidiurnal tide turning depths in the oceans” by B. King et al., J. Geophys. Res.-Oceans, 119, 9026–9032, https://doi.org/10.1002/2014JC010066, 2014.
McDougall, T. J., Thorpe, S. A., and Gibson, C. H.: Small-scale turbulence and mixing in the ocean: A glossary, in: Small-scale turbulence and mixing in the ocean, edited by: Nihoul, J. C. J. and Jamart, B. M., Elsevier, 3–9, 1988.
McKinney, W.: Data Structures for Statistical Computing in Python, Proceedings of the 9th Python in Science Conference, 445, 56–61, https://doi.org/10.25080/Majora-92bf1922-00a, 2010.
Meccia, V. L., Simoncelli, S., and Spannocchia, S.: Decadal variability of the Turner Angle in the Mediterranean Sea and its implications for double diffusion, Deep-Sea Res. Pt. I, 114, 64–77, https://doi.org/10.1016/j.dsr.2016.04.001, 2016.
Menna, M., Gerin, R., Notarstefano, G., Mauri, E., Bussani, A., Pacciaroni, M., and Poulain, P.-M.: On the Circulation and Thermohaline Properties of the Eastern Mediterranean Sea, Front. Mar. Sci., 8, 671469, https://doi.org/10.3389/fmars.2021.671469, 2021.
Mertens, C. and Schott, F.: Interannual Variability of Deep-Water Formation in the Northwestern Mediterranean, J. Phys. Oceanogr., 28, 1410–1424, https://doi.org/10.1175/1520-0485(1998)028<1410:IVODWF>2.0.CO;2, 1998.
Mihanović, H., Vilibić, I., Šepić, J., Matić, F., Ljubešić, Z., Mauri, E., Gerin, R., Notarstefano, G., and Poulain, P.-M.: Observation, Preconditioning and Recurrence of Exceptionally High Salinities in the Adriatic Sea, Front. Mar. Sci., 8, 672210, https://doi.org/10.3389/fmars.2021.672210, 2021.
Radko, T.: Double-diffusive convection, Cambridge University Press, https://doi.org/10.1017/CBO9781139034173, 2013.
Ruddick, B.: A practical indicator of the stability of the water column to double-diffusive activity, Deep-Sea Res., 30, 1105–1107, https://doi.org/10.1016/0198-0149(83)90063-8, 1983.
Schmitt, R. W.: Form of the Temperature-Salinity Relationship in the Central Water: Evidence for Double-Diffusive Mixing, J. Phys. Oceanogr., 11, 1015–1026, 1981.
Schmitt, R. W.: Mixing in a Thermohaline Staircase, edited by: Nihoul, J. C. J. and Jamart, B. M., Elsevier Oceanography Series, Elsevier, Vol. 46, 435–452, https://doi.org/10.1016/S0422-9894(08)70563-4, 1988
Schmitt, R. W.: Double Diffusion in Oceanography, Annu. Rev. Fluid Mech., 26, 255–285, https://doi.org/10.1146/annurev.fl.26.010194.001351, 1994.
Schmitt, R. W.: Observational and laboratory insights into salt finger convection, Prog. Oceanogr., 56, 419–433, https://doi.org/10.1016/S0079-6611(03)00033-8, 2003.
Stern, M. E.: The “Salt-Fountain” and Thermohaline Convection, Tellus, 12, 172–175, https://doi.org/10.3402/tellusa.v12i2.9378, 1960.
Taillandier, V., Prieur, L., D'Ortenzio, F., Ribera d'Alcalà, M., and Pulido-Villena, E.: Profiling float observation of thermohaline staircases in the western Mediterranean Sea and impact on nutrient fluxes, Biogeosciences, 17, 3343–3366, https://doi.org/10.5194/bg-17-3343-2020, 2020.
Tait, R. I. and Howe, M. R.: Some observations of thermo-haline stratification in the deep ocean, Deep-Sea Res., 15, 275–280, https://doi.org/10.1016/0011-7471(68)90005-3, 1968.
Tokos, K. S. and Rossby, T.: Kinematics and Dynamics of a Mediterranean Salt Lens, J. Phys. Oceanogr., 21, 879–892, https://doi.org/10.1175/1520-0485(1991)021<0879:KADOAM>2.0.CO;2, 1991.
van der Boog, C. G., Dijkstra, H. A., Pietrzak, J. D., and Katsman, C. A.: Spatial Variations of Antarctic Intermediate Water in the Caribbean Sea Due To Vertical Mixing Along Its Path, Geophys. Res. Lett., 49, e2021GL095977, https://doi.org/10.1029/2021GL095977, 2022.
Vilibić, I. and Orlić, M.: Least-squares tracer analysis of water masses in the South Adriatic (1967–1990), Deep-Sea Res. Pt. I, 48, 2297–2330, https://doi.org/10.1016/S0967-0637(01)00014-0, 2001.
Vilibić, I. and Orlić, M.: Adriatic water masses, their rates of formation and transport through the Otranto Strait, Deep-Sea Res. Pt. I, 49, 1321–1340, https://doi.org/10.1016/S0967-0637(02)00028-6, 2002.
Vilibić, I. and Supić, N.: Dense water generation on a shelf: the case of the Adriatic Sea, Ocean Dynam., 55, 403–415, https://doi.org/10.1007/s10236-005-0030-5, 2005.
Virtanen, P., Gommers, R., Oliphant, T. E., Haberland, M., Reddy, T., Cournapeau, D., Burovski, E., Peterson, P., Weckesser, W., Bright, J., van der Walt, S. J., Brett, M., Wilson, J., Millman, K. J., Mayorov, N., Nelson, A. R. J., Jones, E., Kern, R., Larson, E., Carey, C. J., Polat, I., Feng, Y., Moore, VanderPlas, J., Laxalde, D., Perktold, J., Cimrman, R., Henriksen, I., Quintero, E. A., Harris, C. R., Archibald, A. M., Ribeiro, A. H., Pedregosa, F., van Mulbregt, P., and SciPy 1.0 Contributors: SciPy 1.0: Fundamental Algorithms for Scientific Computing in Python, Nat. Meth., 17, 261–272, 2020.
You, Y.: A global ocean climatological atlas of the Turner angle: implications for double-diffusion and water-mass structure, Deep-Sea Res. Pt. I, 49, 2075–2093, https://doi.org/10.1016/S0967-0637(02)00099-7, 2002.
Zhang, J. and Schmitt, R. W.: The Impact of Salt Fingering on the Thermohaline Circulation under Mixed Boundary Conditions, J. Phys. Ocean., 30, 1223–1231, https://doi.org/10.1175/1520-0485(2000)030<1223:TIOSFO>2.0.CO;2, 2000.