the Creative Commons Attribution 4.0 License.
the Creative Commons Attribution 4.0 License.
 | 18 Oct 2024
Subsurface floats in the Filchner Trough provide the first direct under-ice tracks of the circulation on shelf
Jean-Baptiste Sallée
Lucie Vignes
Audrey Minière
Nadine Steiger
Etienne Pauthenet
Antonio Lourenco
Kevin Speer
Peter Lazarevich
Keith W. Nicholls
Bottom water formation in the Weddell Sea and mass loss from the Filchner–Ronne Ice Shelf are tightly linked by the supply of Warm Deep Water to the continental shelf. Heavy sea ice cover and icebergs restrict ship access and upper-ocean measurements by moorings, compelling us to try new sampling methods. We present results from the first dedicated under-sea-ice float experiment tracking circulation on the continental shelf of the eastern Weddell Sea. Seven Apex profiling floats were deployed in 2017 at three different locations on the eastern Weddell Sea continental shelf, targeting the inflowing modified Warm Deep Water (mWDW), as well as the outflowing Ice Shelf Water (ISW). The floats capture a warm mWDW regime with southward inflow over the eastern continental shelf and a cold ISW regime with a recirculation of ISW in the Filchner Trough throughout the 4 years of observations. We provide the first Lagrangian in situ confirmation that the mWDW flowing onto the continental shelf follows two pathways: the eastern flank of the Filchner Trough and a small trough on the shallow shelf farther east. In the present circulation regime, this warm water is blocked from reaching the ice shelf cavity due to the presence of the thick ISW layer inside the Filchner Trough. The floats' trajectories and hydrography reveal the dynamically active front, flow reversal, and eddying motion between these two water masses along the eastern flank of the Filchner Trough.
- Article
(6651 KB) - Full-text XML
- BibTeX
- EndNote


The ocean circulation at the Antarctic margin controls the amount of heat that can be transported toward ice shelves surrounding Antarctica (Thompson et al., 2018). Ice shelves are the floating extensions of the Antarctic Ice Sheet and help stabilize the ice sheet's flow toward the ocean (Dupont and Alley, 2005; Reese et al., 2018). By modulating ocean heat reaching ice shelf cavities, the ocean circulation over the Antarctic continental shelves has a direct impact on the Antarctic Ice Sheet's mass balance and, therefore, on global sea-level rise (Joughin et al., 2012; DeConto and Pollard, 2016). In turn, modulation in the freshwater input to the ocean through ocean-driven basal melting of the ice shelves affects water mass formation and ocean circulation, as well as, in particular, dense water production feeding the global overturning circulation (Lago and England, 2019; Moorman et al., 2020). Understanding the ocean circulation over the Antarctic continental shelf and how it varies therefore represents a key endeavor in our understanding of global climate.
On the Antarctic continent, the southern Weddell Sea is a key region for the formation of the Antarctic Bottom Water that fills the bottom of the world oceans (Foldvik and Gammelsrød, 1988; Meredith et al., 2013). This region hosts the Filchner–Ronne Ice Shelf (FRIS), Antarctica's largest ice shelf in terms of volume (Fox et al., 1994). Its underlying cavity is categorized as a “cold and dense” cavity, associated with relatively low basal melt rates and dense water masses (Nicholls et al., 2009). This ice shelf regime is distinguished from “warm cavities” characterized by relatively large basal melt rates (Paolo et al., 2015; Rignot et al., 2019) and “cold and fresh cavities” associated with relatively low basal melt and light water masses (Hattermann et al., 2014; Silvano et al., 2016). These different regimes are maintained by ocean–cryosphere feedback involving the ice shelves, sea ice, and ocean circulation (Jacobs et al., 1992; Thompson et al., 2018).
The FRIS in the Weddell Sea has had a relatively stable mass balance over the past decades compared to warm-cavity ice shelves west of the Antarctic Peninsula (Rignot et al., 2019); it is thought to be relatively protected from the warming influence of the Circumpolar Deep Water (CDW) of the Southern Ocean (Schmidtko et al., 2014) as a result of the presence of the Weddell Gyre system (Vernet et al., 2019) but also because of the local frontal dynamics on the continental slope associated with the cold and dense water over the shelf (Thompson et al., 2018). The circulation and hydrography on the shelf are dominated by the production of high-salinity shelf water (HSSW, with temperatures reaching the surface freezing point of °C) that is formed by sea ice formation on the shelf, specifically within coastal polynyas (Haid and Timmermann, 2013). This dense water mass enters the ice shelf cavity at its western entrance and transforms to a slightly colder and fresher Ice Shelf Water (ISW; temperatures °C) through interaction with the ice shelf while it circulates inside the cavity. The ISW exits the cavity through the Filchner Trough, which forms a relatively shallow channel across the eastern continental shelf from the shelf break towards the ice shelf (Nicholls et al., 2009). Below about 500 m, the trough is a semi-closed basin retaining ISW behind its sill. While observations have shown that the ISW flows northward along the eastern flank of the Filchner Trough (Darelius et al., 2014; Ryan et al., 2017), there is also evidence that the ISW seasonally exits the cavity over the western flank (Darelius and Sallée, 2018). Once the ISW overflows the continental shelf across the sill of the Filchner Trough (Darelius et al., 2009; Foldvik et al., 2004), it contributes to the formation of Weddell Sea Deep Water and Weddell Sea Bottom Water, the precursors of Antarctic Bottom Water. Recent studies have shown a reduction in the volume of the Weddell Sea Bottom Water linked to changes in dense water production on the continental shelf (Zhou et al., 2023). While past work has revealed the processes involved in the formation and modification of ISW, detailed information about its pathways and residence times is still lacking.
The existence of a pool of dense water over the southern Weddell Sea continental shelf is thought to create a barrier for the advection of relatively warm water off the continental shelf toward the FRIS cavity. The warm water originates from the CDW that upwells in the Southern Ocean; in the Weddell Sea, it is entrained into the Weddell Gyre system and is transformed into Warm Deep Water (WDW), a fresher and cooler version of CDW (Ryan et al., 2016). Conductivity–temperature–depth (CTD) sections and mooring time series have been only sporadically obtained in the area. These observations have suggested that there are two main pathways for WDW to enter the continental shelf and subsequently flow onto the continental shelf and proceed southward toward the ice shelf as a yet cooler and fresher version of the WDW, referred to as modified WDW (mWDW): an eastern pathway, along the eastern flank of the Filchner Trough, and a western pathway, in the Central Trough west of the Berkner Bank (Fig. 1; Nicholls et al., 2009, 2008; Ryan et al., 2017). The western pathway is associated with the largest heat content (Nicholls et al., 2008) and about half of the heat that actually reaches the FRIS edge (Davis et al., 2022). CTD observations have also indirectly suggested that mWDW could enter the continental shelf by a third pathway flowing through the “Small Trough” (see Fig. 1), directly east of the Filchner Trough, but this pathway has never been directly measured (Janout et al., 2021). Most of the heat advected southward onto the continental shelf through the Filchner Trough is thought to recirculate northward or to be mixed away before reaching the FRIS cavity (Dinniman et al., 2011; Darelius et al., 2016). The flow of mWDW into the Filchner Trough occurs seasonally during austral summer and is linked to the wind variability (Årthun et al., 2012; Daae et al., 2017; Ryan et al., 2017). In 2017, the mWDW layer over the eastern flank of the Filchner Trough was warmer than in previous years and persisted for a longer time period (Ryan et al., 2020), but it is unclear how far south the warm water reached.
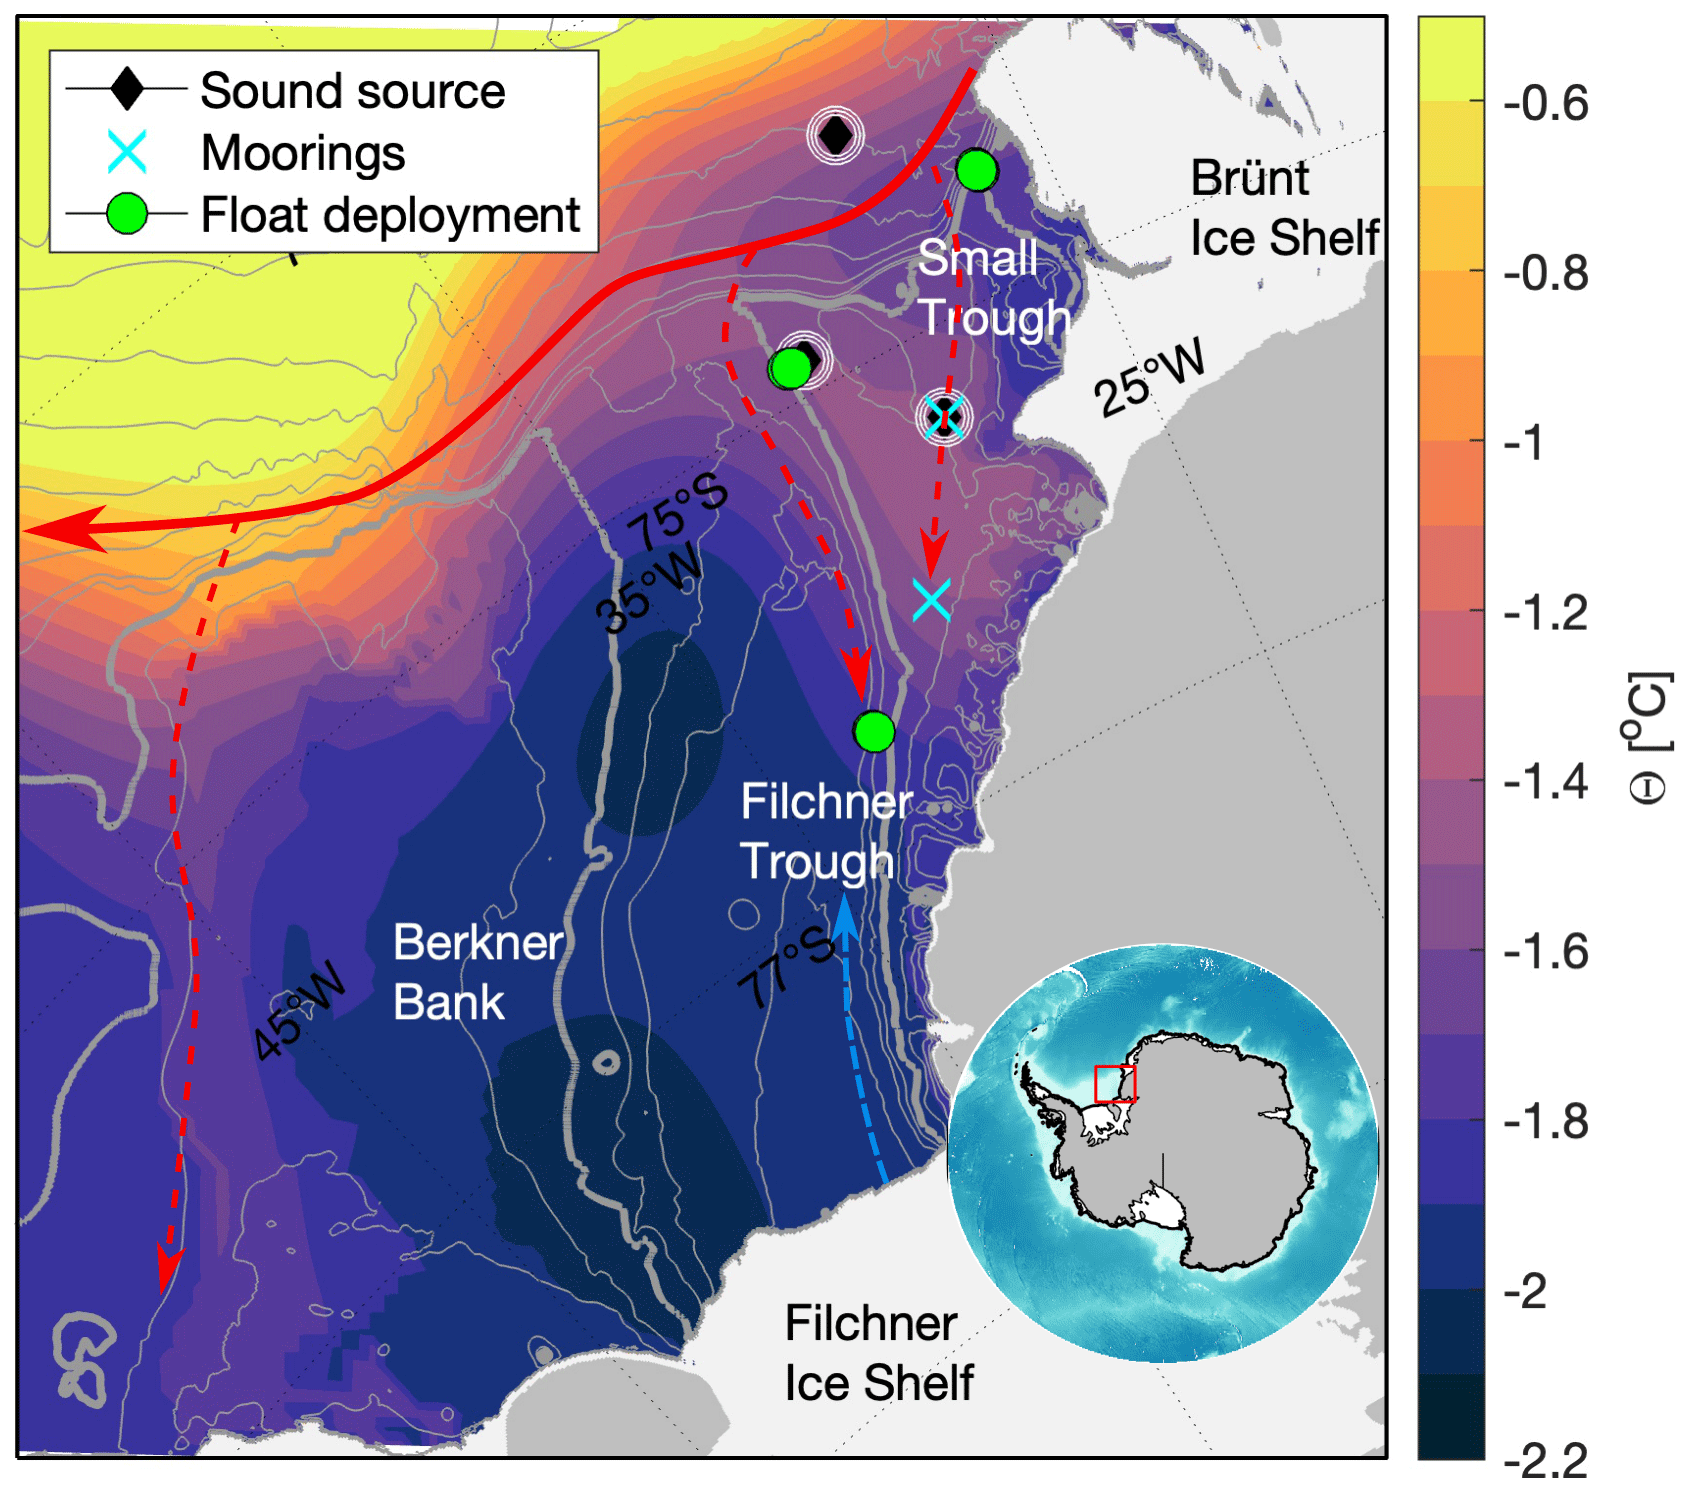
Figure 1(a) Map of the eastern Weddell Sea continental shelf with a schematic of the circulation. The arrows show the characteristic pathways of WDW (red), mWDW (dashed red), and ISW (blue). The colored background is the mean conservative temperature (Θ) between 360 and 420 m, taken from Jourdain et al. (2020). Bathymetric contours from IBSCO (Arndt et al., 2013) are drawn every 100 m above 1000 m depth and every 1000 m in regions deeper than 1000 m. The 500 m isobath is shown in bold as a reference. Grounded ice is shown as gray areas, and ice shelves are shown as white areas. The black diamonds represent the positions of the sound source moorings, the cyan crosses represent the positions of the two moorings used in the study, and the green dots represent the launching sites of the floats. The map is presented in the Lambert projection. In this area, 1° longitude corresponds to about 30 km. The inset in the lower right shows the location within Antarctica.
Thus far, mWDW has been observed at the ice front near 79° S only once, namely in 2013 (Darelius et al., 2016). However, the region has been suggested to be prone to a potential self-reinforcing change in the ocean circulation that could abruptly shift its cavity regime, turning it from a cold and dense cavity into a warm cavity, with important global consequences for deep-water formation and sea-level rise (Hellmer et al., 2012, 2017; Hazel and Stewart, 2020). As a result, efforts to understand the controls on the flux of warm water and the heat transport rate to the FRIS cavity have received much attention in recent years (Årthun et al., 2012; Darelius et al., 2016; Ryan et al., 2017, 2020; Daae et al., 2017, 2020).
Over recent decades, the flow of warm water onto the continental shelf has been sampled using ship-based observations (conductivity–temperature–depth (CTD) casts), CTD-instrumented marine mammals, and mooring observations. Ship-based observations are only possible during summer and are mostly concentrated in regions lightly covered by sea ice during this period. Marine mammal observations depend on seal behavior (Labrousse et al., 2021) and so cannot be targeted toward specific currents or water masses; also, they do not usually cover the entire water column and have larger measurement and positioning uncertainties than ship-based observations (Siegelman et al., 2019). Mooring observations over the continental shelf (e.g., Ryan et al., 2017; Darelius et al., 2014) sample at fixed points throughout the year, but possible damage by drifting icebergs leaves instruments in the upper part of the water column vulnerable and rarely instrumented. Autonomous instruments such as Argo floats have not been deployed on the southern Weddell Sea continental shelf. The various strategies used to observe the ocean over the continental shelf complement each other, but important gaps can be identified in the present observational system in this challenging ice-covered part of the ocean: a dearth of wintertime observations, a lack of observations of water mass mixing, and the lack of reliable information on circulation routes and timescales.
In this study, we employ an innovative approach for sampling water mass characteristics and circulation on the Weddell Sea continental shelf with the aim of partly addressing this observational gap. We present and use, for the first time in this region, observations from Lagrangian profiling floats. Seven Lagrangian floats were deployed on the continental shelf in February 2017. Three RAFOS sound sources were deployed specifically for this experiment, with RAFOS hydrophones on the floats being used to infer their locations every 6 h. Although the ocean environmental conditions of the Weddell Sea continental shelf make float deployments very risky for the instruments, due to the large area covered by multi-year ice and the presence of ice shelf cavities where instruments can get lost, all of the floats survived for at least 1 year and up to 4 years, providing a unique set of observations. The approach taken in the present study is similar to that taken in a recent study in a different region, the Dotson Ice Shelf in the Amundsen Sea (Girton et al., 2019).
Our observations on the eastern Weddell Sea shelf allow us to describe the circulation in the Filchner Trough region and the water mass pathways based on the float trajectories and the hydrography profiles, some of which are taken from previously unexplored areas that are typically covered with sea ice. We are able to examine the Lagrangian pathways of the mWDW toward the ice shelf, the mWDW interaction with the ISW, and the residence time of the ISW within the Filchner Trough. Selected mooring observations and ship-based measurements from the same time period complementing the float data are presented. This combined dataset allows us to present the first direct measurements of pathway and transit times for outflowing ISW and inflowing mWDW. In particular, we demonstrate the existence of an mWDW pathway through the Small Trough, which was previously suggested but never directly measured. We also present the first direct observations of a pool of ISW with very long residence times of several years in the deeper part of the Filchner Trough.
2.1 Autonomous RAFOS-enabled profiling floats
In February 2017, seven autonomous profiling Apex floats were deployed from the RV James Clark Ross (cruise no. JR16004; Sallée, 2018) at three different locations on the Weddell Sea continental shelf (Fig. 1): three floats on the continental slope upstream of the Filchner Trough (74.05° S, ∼ 26.02° W), two on the eastern part of the Filchner Trough sill (74.08° S, ∼ 30.07° W), and two farther south in the deeper part of the Filchner Trough (76.05° S, ∼ 32.07° W). The floats were deployed in open waters, before the seasonal advance of sea ice. Each of the floats carried a Sea-Bird SBE41 sensor to measure conductivity (C), temperature (T), and pressure (P), as well as a hydrophone to record the timed sound source signals (Table 1). The RAFOS protocol (Rossby et al., 1986) uses the timed arrivals of signals from the sound sources to determine the position. All floats together provided, in total, 1106 CTD profiles over a time span of up to 4 years across several hundreds of kilometers between the Filchner and Brünt ice shelves. Six of these seven floats sampled a total of 244 profiles located over the continental shelf between February 2017 and April 2018; one of the floats (P12681; Fig. 3) circulated northward after being deployed and did not sample the shelf regime and is not discussed further.
Table 1List and characteristics of all floats deployed in 2017.
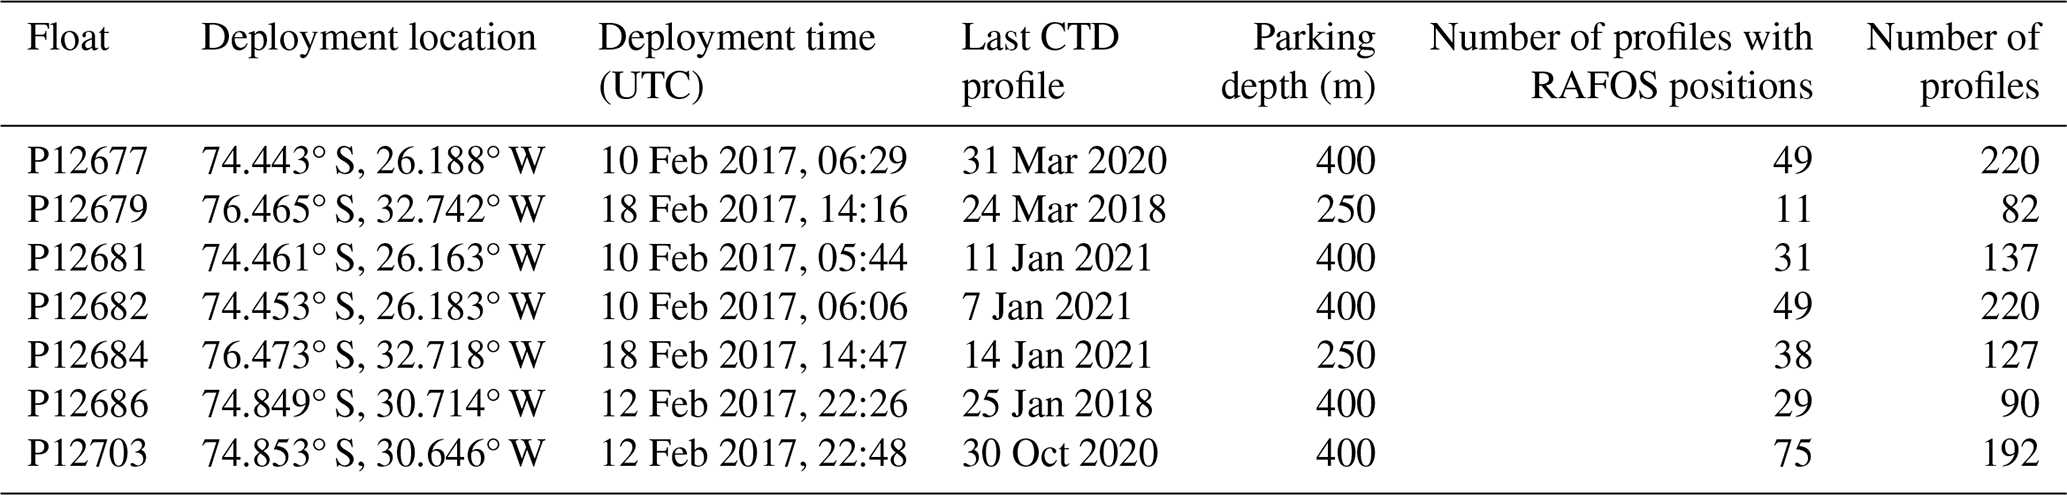
Profiles of absolute salinity (SA), conservative temperature (Θ), potential density referenced to the surface (σ0), and pressure (P) were derived from the observed profiles using the revised seawater equation of state (McDougall and Barker, 2011). The profiling frequency was adjusted between summer and winter months: the floats profiled once per day in summer and then once every 5 d during the rest of the year. The floats are programmed to start their (ascending) profile from 1800 dbar, which is generally deeper than the continental shelf. This means that, in most cases, they descended to the seafloor before starting the profile. Between profiles, the floats drifted at a programmed parking depth and took CTD measurements at this depth every 6 h. The parking depth chosen depended on the deployment positions of the floats: the two southernmost floats, deployed inside the Filchner Trough, were programmed to drift at 250 dbar to reduce the risk of drifting inside ice shelf cavities; the other floats were programmed to drift at 400 dbar to target typical depths at which mWDW is found on the Weddell Sea continental shelf (Årthun et al., 2012; Nicholls et al., 2009; Foldvik et al., 1985).
When a float surfaced, its positioning data and other recorded measurements were telemetered via the Iridium satellite network. If a float were to get to the surface when sea ice was present, its sensors and antennas would likely be damaged. To reduce this risk, each float implemented a “sea ice avoidance” logic to predict the presence of sea ice from the observed ocean characteristics measured during ascent (Klatt et al., 2007; Wong and Riser, 2011; Porter et al., 2019; Silvano et al., 2019). If the measured in situ temperature, averaged between 20–40 m, was less than −1.69 °C, the float halted its ascent, descended to its parking depth, and stored its data to transmit them at the next successful surfacing.
2.2 Positioning of the floats
The Filchner Trough is a region covered by sea ice during most of the year and by multi-year ice in some parts, preventing floats from surfacing and acquiring GPS positions for their profiles. In order to locate the hydrographic profiles under ice and to obtain high-resolution Lagrangian trajectories of the floats, three sound sources were moored in the eastern continental shelf (74.02° S, 28.07° W; 74.85° S, 30.38° W; 75.39° S, 28.64° W; Fig. 1). Each source transmitted a frequency-modulated signal four times a day with a carrier of about 260 Hz and with the frequency increasing linearly by 2.5 Hz over 80 s (Rossby et al., 1986). The floats were programmed with listening windows consistent with the sound source transmission times and saved the six highest correlations between the transmitted and expected sound source signal, as well as the six times of arrival (TOAs) of the sound signal corresponding to each of the six correlations. The stored set of six TOAs and the maximum correlations were then transmitted via the Iridium satellite network when the float eventually surfaced and were used to triangulate the position of the floats during their drift.
The TOAs are corrected for three main biases. First, the offset between the start of the float listening window and the time of sound transmission for each source is removed from the received TOAs; for each listening window, the float started listening 1 min before the first source transmission, 21 min before the second source transmission, and 41 min before the third source transmission. Second, the TOAs were corrected for the linear drift of the float internal clock. Third, TOAs were adjusted to account for the delay in activating the memory card that records them. The card's activation is delayed by a margin of 10 to 24 s after the initiation of the float's listening window, introducing a temporal offset within the TOA measurements. Each TOA was then quality-checked using the corresponding maximum correlation, re-confirmed by eye, and outliers and unrealistic records were removed to eventually form a clean and validated time series of TOAs for each float. The time series of TOAs was then smoothed with a loess filter (with a tri-cube weight function), removing frequencies higher than once per day to produce a better estimate of the daily mean position used here.
The corrected TOAs were converted into distances between the float and the sound source using a fixed sound speed in water of 1455 m s−1, derived from CTD measurements. Given that the float's hydrophones sampled every 0.3075 s during their listening window, the minimum achievable spatial resolution of the triangulation was 477 m. Distances from the three sources were then converted into geographical position by minimizing the error of the triangulation procedure. The geographical position was inferred for all time steps in which three sound source signals passing all quality controls were received. When only two sound source signals passed the quality control, computation of geographical position was attempted, but this was used only if the calculated position was consistent with the position before and after.
The computed positions were then compared with the GPS positions for all periods when both were available. The differences between the GPS and the TOA-derived positions ranged between 7 and 17 km, and, here, this difference is considered to be a rough estimate of the absolute error in positioning. The seven trajectories are displayed in Fig. 3.
2.3 Mooring and ship-based CTD data
In addition to the Lagrangian floats, in the present study, we use the Eulerian time series acquired at two mooring sites. One of the two moorings (M30.5W) was located at 76.09° S, 30.47° W (Fig. 1) from 22 January 2016 to 4 February 2018 (Ryan et al., 2020) at 445 m depth. It was deployed during the Polarstern cruise PS96 (Schröder, 2016) and was recovered during the Polarstern cruise PS111 (Janout et al., 2019; Schröder, 2018). Temperature was recorded at 111, 97, 73, 48, and 33 m above sea bottom, with additional salinity and pressure measurements at the shallowest and the deepest depths and with velocity measurements at 18 m above sea bottom. The other mooring (P5) was located farther north at 75.39° S, 28.64° W at 437 m depth (Fig. 1). It was deployed on 9 February 2017 during the cruise of the float deployment and was recovered on 9 March 2021 during the Polarstern cruise PS124 (Hellmer and Holtappels, 2021). Temperature was recorded at six different depths (7, 30, 55, 75, 104, and 114 m above sea bottom), and velocity was recorded at three depths (6, 53, and 102 m above sea bottom). Here, we use the temperature and velocity measurements at 382 and 384 m depth, respectively, which are the closest measurements to the float drift depth.
We also use the hydrographic data from the ship-based CTD casts of the float deployment cruise to calculate the thickness of the ISW layer. We calculate the ISW thickness for each profile (both from the ship-based CTD casts and the float profiles) as the total thickness of all points where °C. We only include layers that are located in the bottom layer (i.e., with the lowermost measurement of °C at <50 dbar from the bottom) to exclude measurements of Winter Water that may also be colder than the surface freezing point but located higher up in the water column.
3.1 Float trajectories
The profiling floats deployed on the Weddell Sea continental shelf drifted and profiled for a time period of 3 months to 4 years, providing hydrography and drift data over the eastern portion of the sea-ice-covered continental shelf. With the use of three sound sources, we were able to recover the float locations with a sampling interval of 6 h and of up to 1-year duration. The maximum distance from the sound sources at which good-quality TOAs were obtained was ∼350 km (Fig. 2). This is a significantly shorter range than in open-ocean experiments with sources transmitting in the SOFAR channel (typically 800–1000 m depth; Rossby and Webb, 1970; Wong and Riser, 2011; Rossby et al., 1993), likely because of acoustic refraction coupled with rough reflecting interfaces that attenuate the signal. Our experiment deliberately avoided targeting flow under the ice shelf to focus on the dynamics of the ISW and mWDW, as well as their interactions, on the continental shelf.
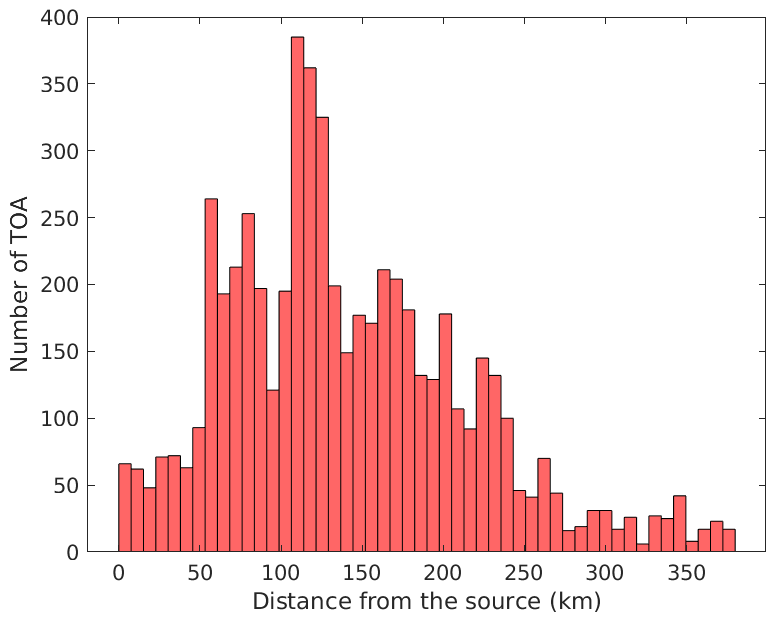
Figure 2Histogram of the distance between the floats and the sound sources. Distances of the floats to the sound source are used for all the positions recovered with two or more time of arrival (TOA) records.
Two floats deployed in February 2017 on the continental slope (P12682 and P12677; Fig. 3) followed the isobaths westward and then turned south onto the continental shelf at the opening to a small canyon cutting across the continental shelf between the Filchner Trough and the Brünt Ice Shelf. Here, we will refer to this small canyon as the Small Trough (Fig. 1). One of the two floats (P12682) moved southward through the Small Trough over the shallow eastern plateau until it reached the Filchner Trough at ∼76.5° S in early May. On 23 May, its trajectory then sharply veered from a southward direction to a northward flow along the lower eastern flank of the Filchner Trough. It continued profiling within the Filchner Trough but without information on its position (Fig. 4c). The other float (P12677) started off in a similar direction, but it stopped recording on 20 May, when it was still located within the Small Trough on its way towards the Filchner Trough.
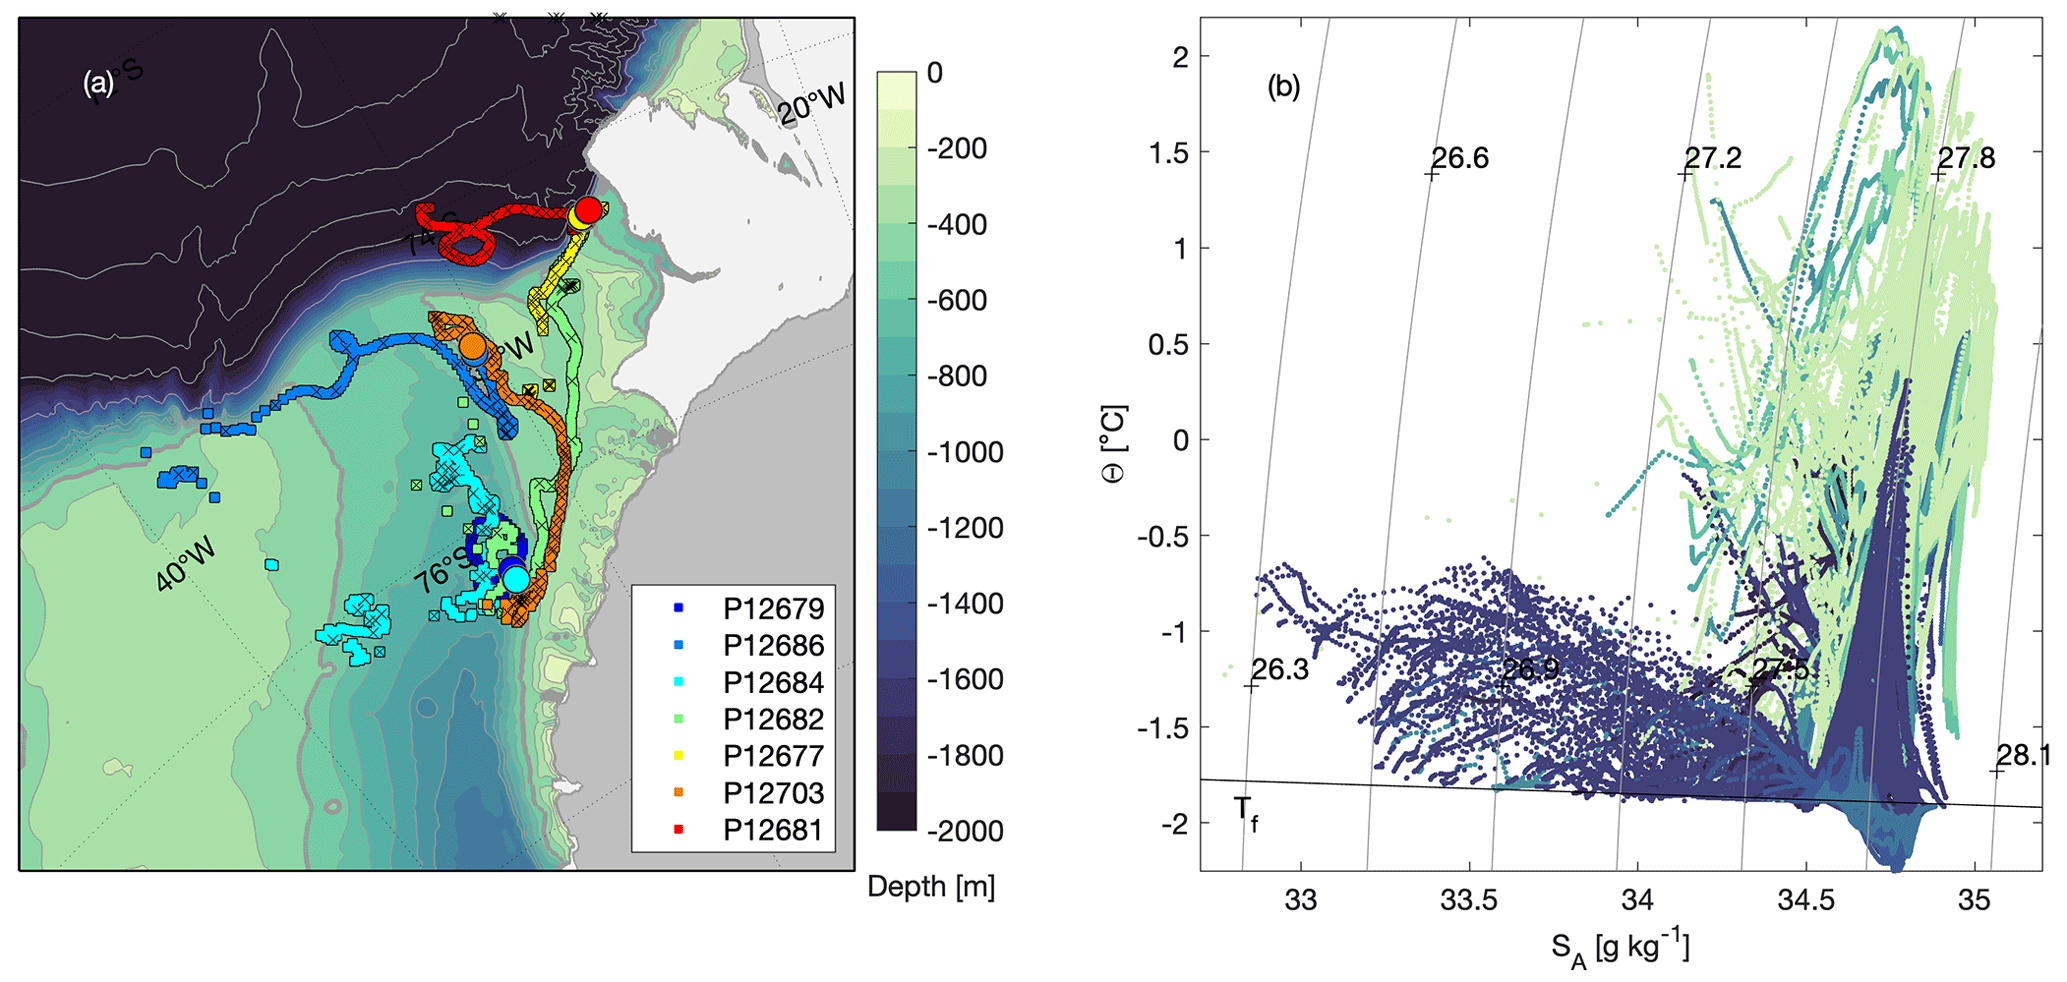
Figure 3(a) Drifting positions of the seven floats deployed in 2017. The smoothed positions computed from the RAFOS system are shown in color (squares), with the deployment location highlighted with a large circle of corresponding color. Note that P12682 is deployed at the same location as P12677. The crosses along the trajectories represent the locations of vertical profiles used in (b). The colored background represents the bathymetry according to the color bar, with contours as in Fig. 1. (b) Θ–SA diagram of all profiles taken by the floats, color coded according to the water depth at the location of the profile (estimated as the maximum profile depth). Contours show the density anomaly, and the black lines represent the surface freezing point (Tf).
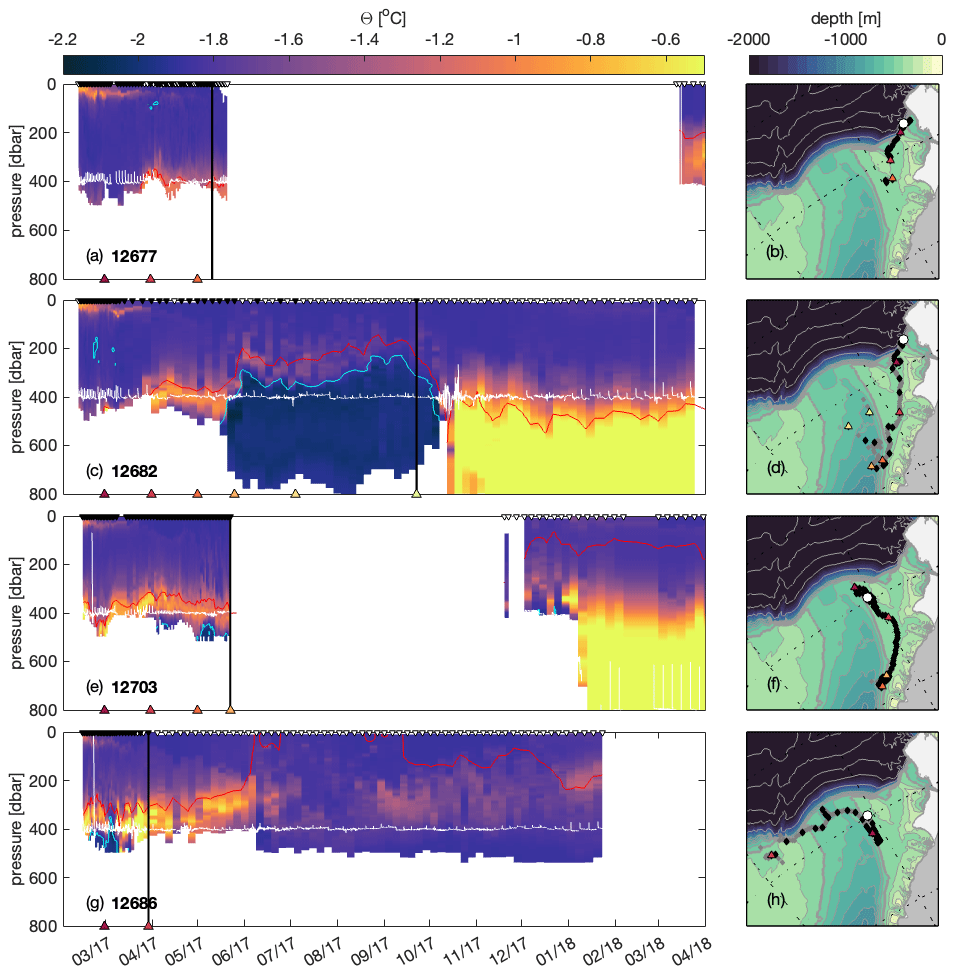
Figure 4(a, c, e, g) Depth–time plot of conservative temperature for the floats that sampled mWDW on the shelf, namely floats 12677, 12682, 12703, and 12686. The white contours represent the drift depth of the floats between the profiles. The cyan contours are the −1.9 °C isotherm, corresponding to the definition of ISW, and the red contours are the 27.75 kg m−3 isopycnal, corresponding to the definition of mWDW. The triangles along the upper x axis show the timing of the profiles, where those with an existent RAFOS position are colored black. The last available position is marked with a vertical black line. Panels (b), (d), (f), and (h) show the RAFOS trajectories of the floats on top of the bathymetry (as in Fig. 1), with the drift positions in gray and the profile positions in black, corresponding to the black triangles in (a), (c), (e), and (g). The deployment location is marked with a while circle. The colored circles are the existing positions closest to the first day of each month, corresponding to the colored triangles along the lower x axis in (a), (c), (e), and (g). Although the CTD time series are up to 4 years, we only show the first year in which we have RAFOS positions and when the floats are still over the continental shelf.
The two floats deployed February 2017 on the Filchner Trough sill (P12686 and P12703, Fig. 3) were deployed only 6 km and 7 h apart but followed very distinct routes. One of the two (P12703) started off northward towards the continental slope but turned southward on 28 February and continued above the eastern plateau towards the Filchner Trough. It reached ∼76.7° S on 1 May, where it abruptly turned northward again at a similar location to where P12682 changed direction. In contrast, the second float (P12686) started off on a southward track close to the upper eastern flank of the Filchner Trough but changed its direction abruptly at ∼75.5° S, where it drifted back northward along the lower eastern flank of the Filchner Trough. It continued westward along the Filchner Trough sill, leaving the Filchner Trough to follow isobaths over the continental slope.
All four of these floats (P12682, P12677, P12686, and P12703) had southward and relatively straight trajectories at different locations so long as they remained over the eastern shallow plateau or the upper eastern flank, above 400–500 m bathymetry depth. As soon as the floats reached deeper bathymetry in the Filchner Trough, their directions changed, and they ultimately drifted back northward.
To capture the flow of the ISW within the Filchner Trough, two additional floats were deployed directly inside the Filchner Trough at ∼76.5° S (P12679 and P12684; Fig. 3). One of these two floats (P12679) could only be positioned for 1 month, during which it followed an eddying pattern close to its deployment position; however, it was able to profile the water column for more than 1 year, which it spent entirely within the Filchner Trough, as indicated by the sampled ISW layer (Fig. 5c and d). The second float (P12684) went northward toward 75.4° S following the eastern slope of the Filchner Trough before flowing back southward to 76.5° S. After several months of missing RAFOS positions, it reappeared at the western side of the Filchner Trough up to the Berkner Bank (39° W), providing Lagrangian positions for more than 1 year after its deployment. Compared to the persistent southward trajectories on the eastern plateau, the trajectories of these two floats that are parked at 200 m (shallower than the eastern-plateau floats) within the Filchner Trough show a strong eddying pattern and a recirculation within the Filchner Trough.
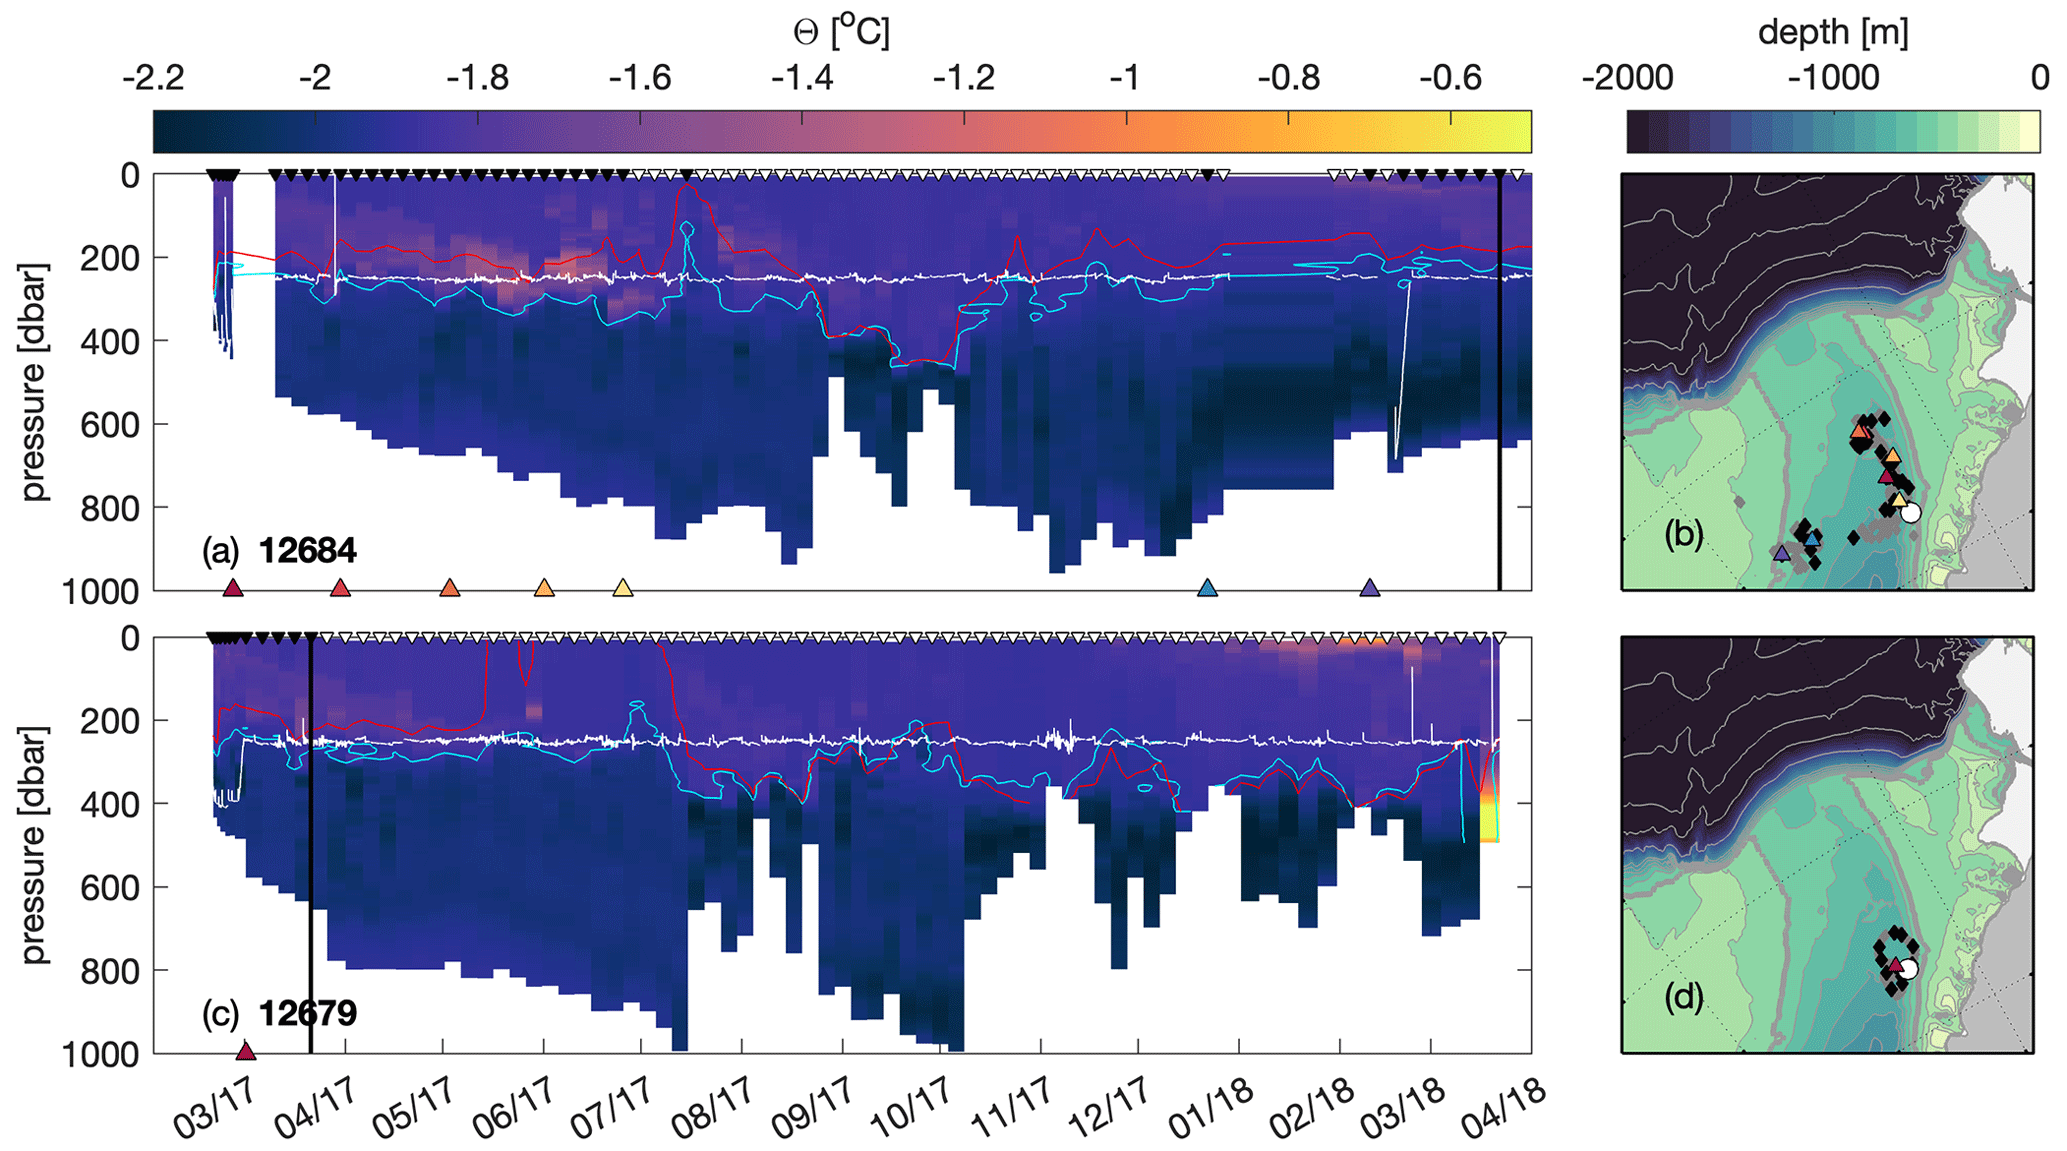
Figure 5Same as Fig. 4 but for the floats that sampled ISW within the Filchner Trough, namely floats 12684 (a, b) and 12679 (c, d).
3.2 Modified Warm Deep Water and Ice Shelf Water regimes
The two groups of floats identified above appear to document two distinct regimes associated with two different water masses characterizing the eastern Weddell Sea continental shelf (Fig. 3b). While the first group of four floats (12677, 12682, 12686, and 12703) is associated with a regime of the circulation of mWDW on the eastern shallow continental shelf, the second group of two floats (12679 and 12684) is associated with a Filchner Trough regime of ISW circulation.
To further highlight these two regimes, we investigate the temperature of the water column in the layers that host mWDW and ISW (Fig. 6). The mWDW is defined as the water mass of temperature greater than −1.7 °C in the layer of potential density σ0=27.75 ± 0.05 kg m−3, and the ISW is defined as the water mass of temperature lower than the surface freezing point ( °C) in the bottom ocean layer (Nicholls et al., 2009). Based on these definitions, we describe below (i) the circulation and timescale of the advection of mWDW on the eastern plateau, (ii) the interplay between mWDW and ISW on the eastern plateau, and (iii) the residence time of ISW in the Filchner Trough.
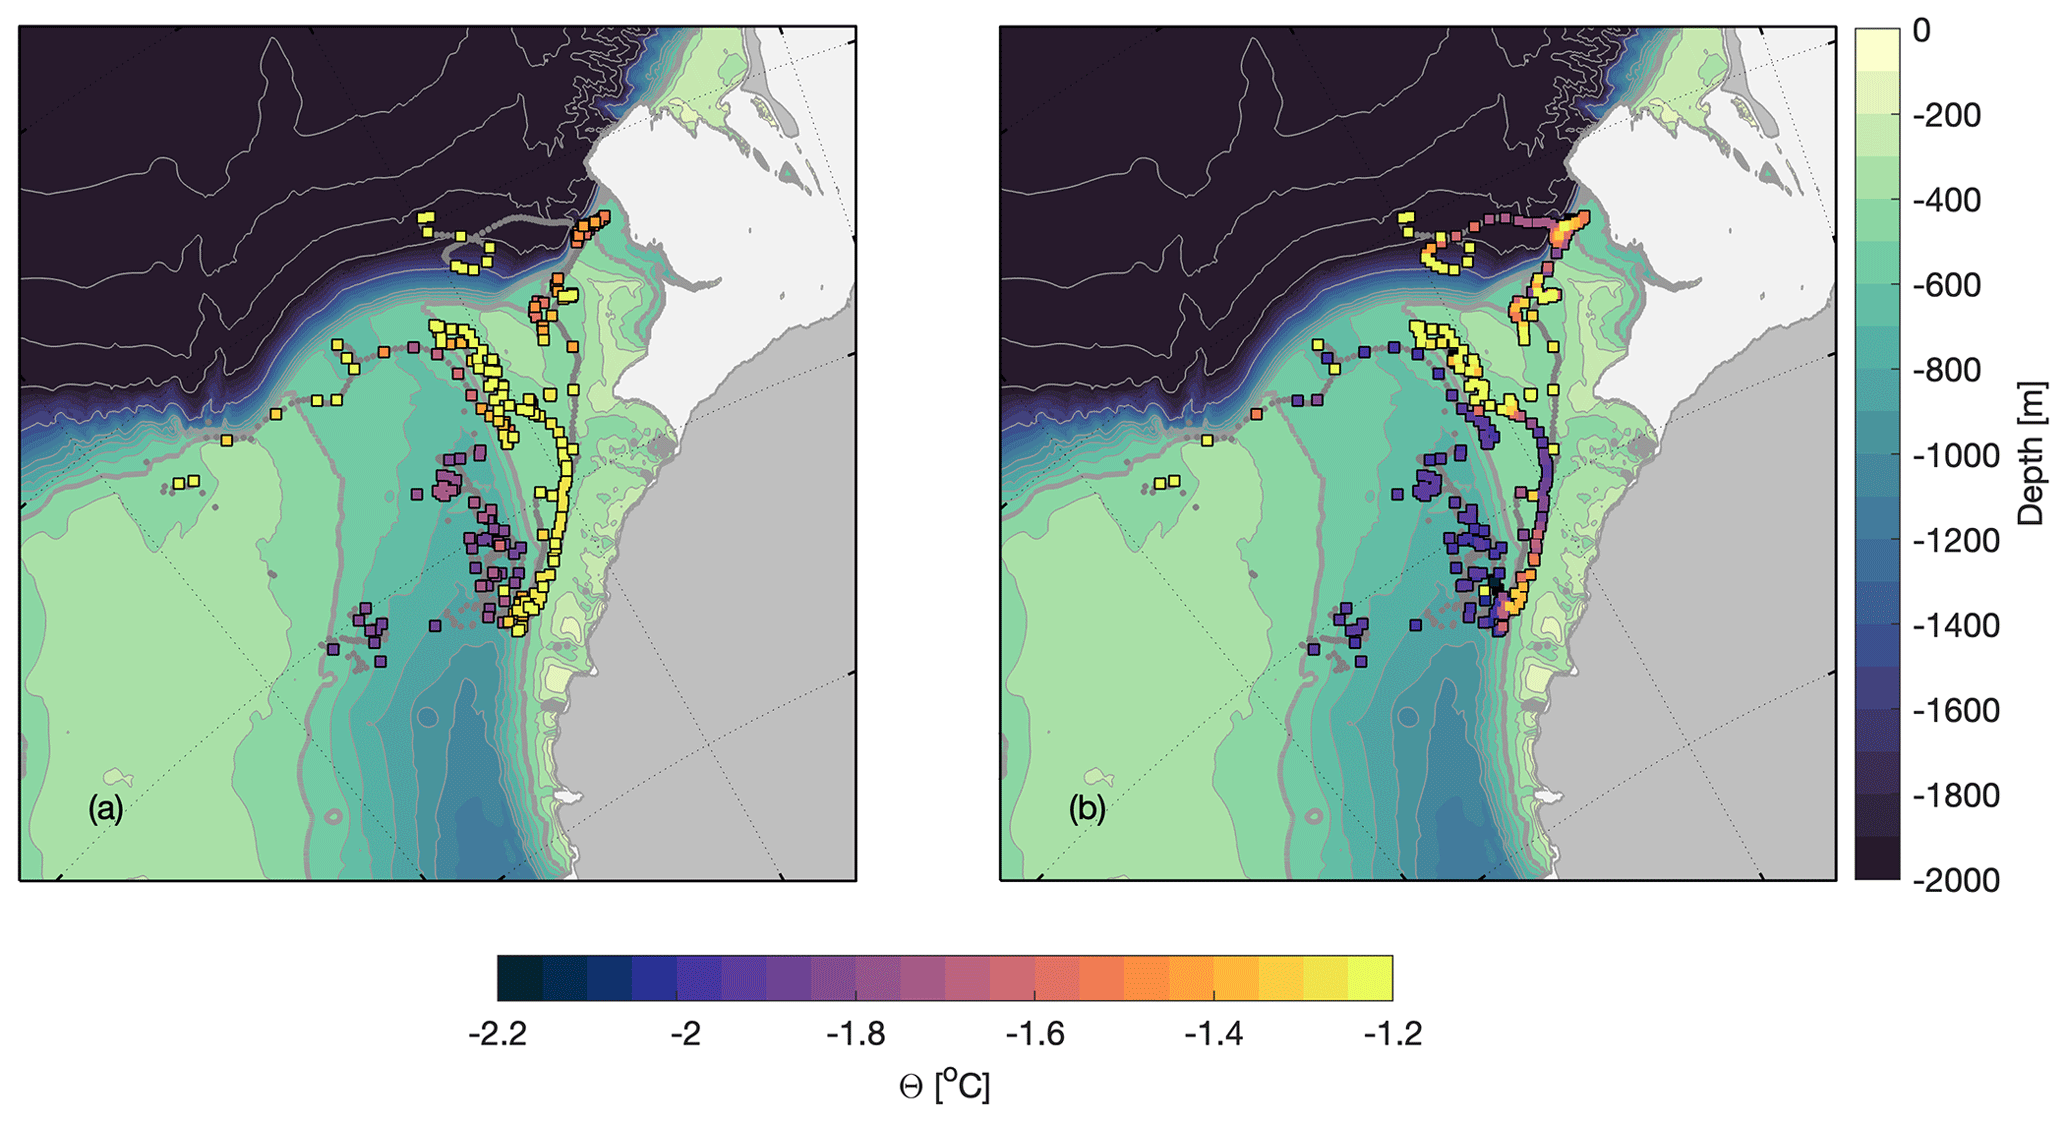
Figure 6(a) Conservative temperature (Θ; colored squares) of the float profiles at 27.75 ± 0.05 kg m−3 density, showing the Θ in the mWDW density range. (b) Bottom Θ of the float profiles (colored squares). The gray lines in (a) and (b) are the RAFOS drifting positions of the floats. The colored background represents the bathymetry, with contours as in Fig. 1.
The four floats drifting southward on the eastern shallow plateau are associated with temperatures greater than −1.6 °C (Fig. 6a), suggesting that the region is flooded with southward-flowing mWDW. Based on the float trajectories, the southward mWDW transport appears to be more efficient on the shallow eastern plateau compared to a pathway closer to the Filchner Trough. Indeed, float P12686, which has the southward trajectory closest to the Filchner Trough, does not reach far south but gets quickly entrained into a northward flow that advects the float out of the Filchner Trough and then westward along the continental slope. In contrast, the two floats (P12682 and P12703) that were drifting farther east closer to the coastline were transported much farther south (100–200 km). Their trajectories also indicate that at least two main pathways occurred in 2017 for the advection of mWDW from the continental slope onto the continental shelf (Fig. 1): the Small Trough (P12682) and the northeastern corner of the Filchner Trough (P12703). It takes the floats about 2 months through each pathway to reach the interior Filchner Trough from the shelf break: 64 d through the Small Trough and 54 d along the eastern flank of the Filchner Trough from the shelf break at 74.6° S (the two floats' northernmost common latitude) to reach 76.5° S (the two floats' southernmost common latitude). The notion that the Small Through provides a conduit for mWDW from the continental slope to the Filchner Trough is further supported by the velocity and temperature time series taken at the sound source mooring P5 positioned there (Fig. 8). The float passed within 8 km of this mooring, and the trajectory derived from the mooring velocities at the approximate float drift depth agrees well with the float trajectory. These mooring observations show a south–southwestward flow throughout the whole year, with temperatures in the mWDW range from February to June.
Interestingly, neither of these two floats went farther south than ∼76.7° S, where the eastern shallow plateau narrows. Instead, they became entrained in a northward flow. This turning point of the floats also coincides with the southernmost extent of the warm water in the climatology of the temperature at about 400 m depth, as shown in Fig. 1. We suggest that, in this region, there is a bathymetric constraint on the southward flow: the narrowing shelf forces the flow off the relatively flat, shallow isobaths of the plateau and onto the eastern flank of the Filchner Trough that is dominated by a northward flow and colder water masses. At this point, the floats' abrupt turn is accompanied by eddying motions suggestive of mixing with ISW along the eastern flank (Fig. 6a). One of the floats (P12682) crossed a clear front between the mWDW and the ISW in the beginning of June when entering the Filchner Trough (Fig. 4c), which coincides with the abrupt switch from a southward flow within the mWDW layer to a northward flow within the ISW layer (Fig. 4d).
The strong horizontal shear on the eastern side of the Filchner Trough, inferred from the opposing float directions, is likely to be associated with instabilities and the resulting mixing of water masses. Unfortunately, the set of Lagrangian trajectories does not provide enough spatial and temporal sampling to address mixing or instability questions fully here. The trajectories of the floats show, however, some eddying motion along the eastern flank of the Filchner Trough, which might be an indication of instabilities and eddy activity and, hence, of turbulent mixing between the mWDW and ISW.
The temperature of the water lying at the bottom of the continental shelf indicates the presence of an ISW layer (Fig. 6b) that is observed for all profiles within the Filchner Trough but also at the bottom of the eastern shallow plateau at around 76° S. The ISW layer reaches to a depth of about 250 m within the area sampled by the floats inside the Filchner Trough (Fig. 5; see Sect. 2.3 for details on how ISW thickness is computed). While, here, the ISW layer is up to 1000 m thick in the deepest part of the trough close to the ice front, the ISW layer on the shallower shelf is much thinner (Fig. 7a). The float profiles inside the Filchner Trough also show that the ISW layer persists all year round, with only small variations in depth and temperature (Fig. 5). The ISW layer on the eastern plateau was sampled by float P12703 during a short period in early April (Fig. 4e), shortly before it passed the mooring M30.5W, which provides information on the time variability of the ISW layer in this shallower region (Fig. 7b). The mooring temperature records show that the presence of an ISW layer is seasonally variable: ISW was present at the bottom of the mooring site during austral summer (December to March; Fig. 7b) before the continental shelf got flooded by mWDW during autumn and winter (March to October). After the ISW was replaced by mWDW, there were still several intrusions of ISW onto the continental shelf, during which the float passed the mooring site. The seasonal interplay between the ISW and the mWDW on the shallow eastern plateau has previously been described in more detail in Ryan et al. (2017). Our floats show that the mWDW is advected from the continental slope through the Small Trough and along the eastern flank of the Filchner Trough, with a timescale of about 2 months.
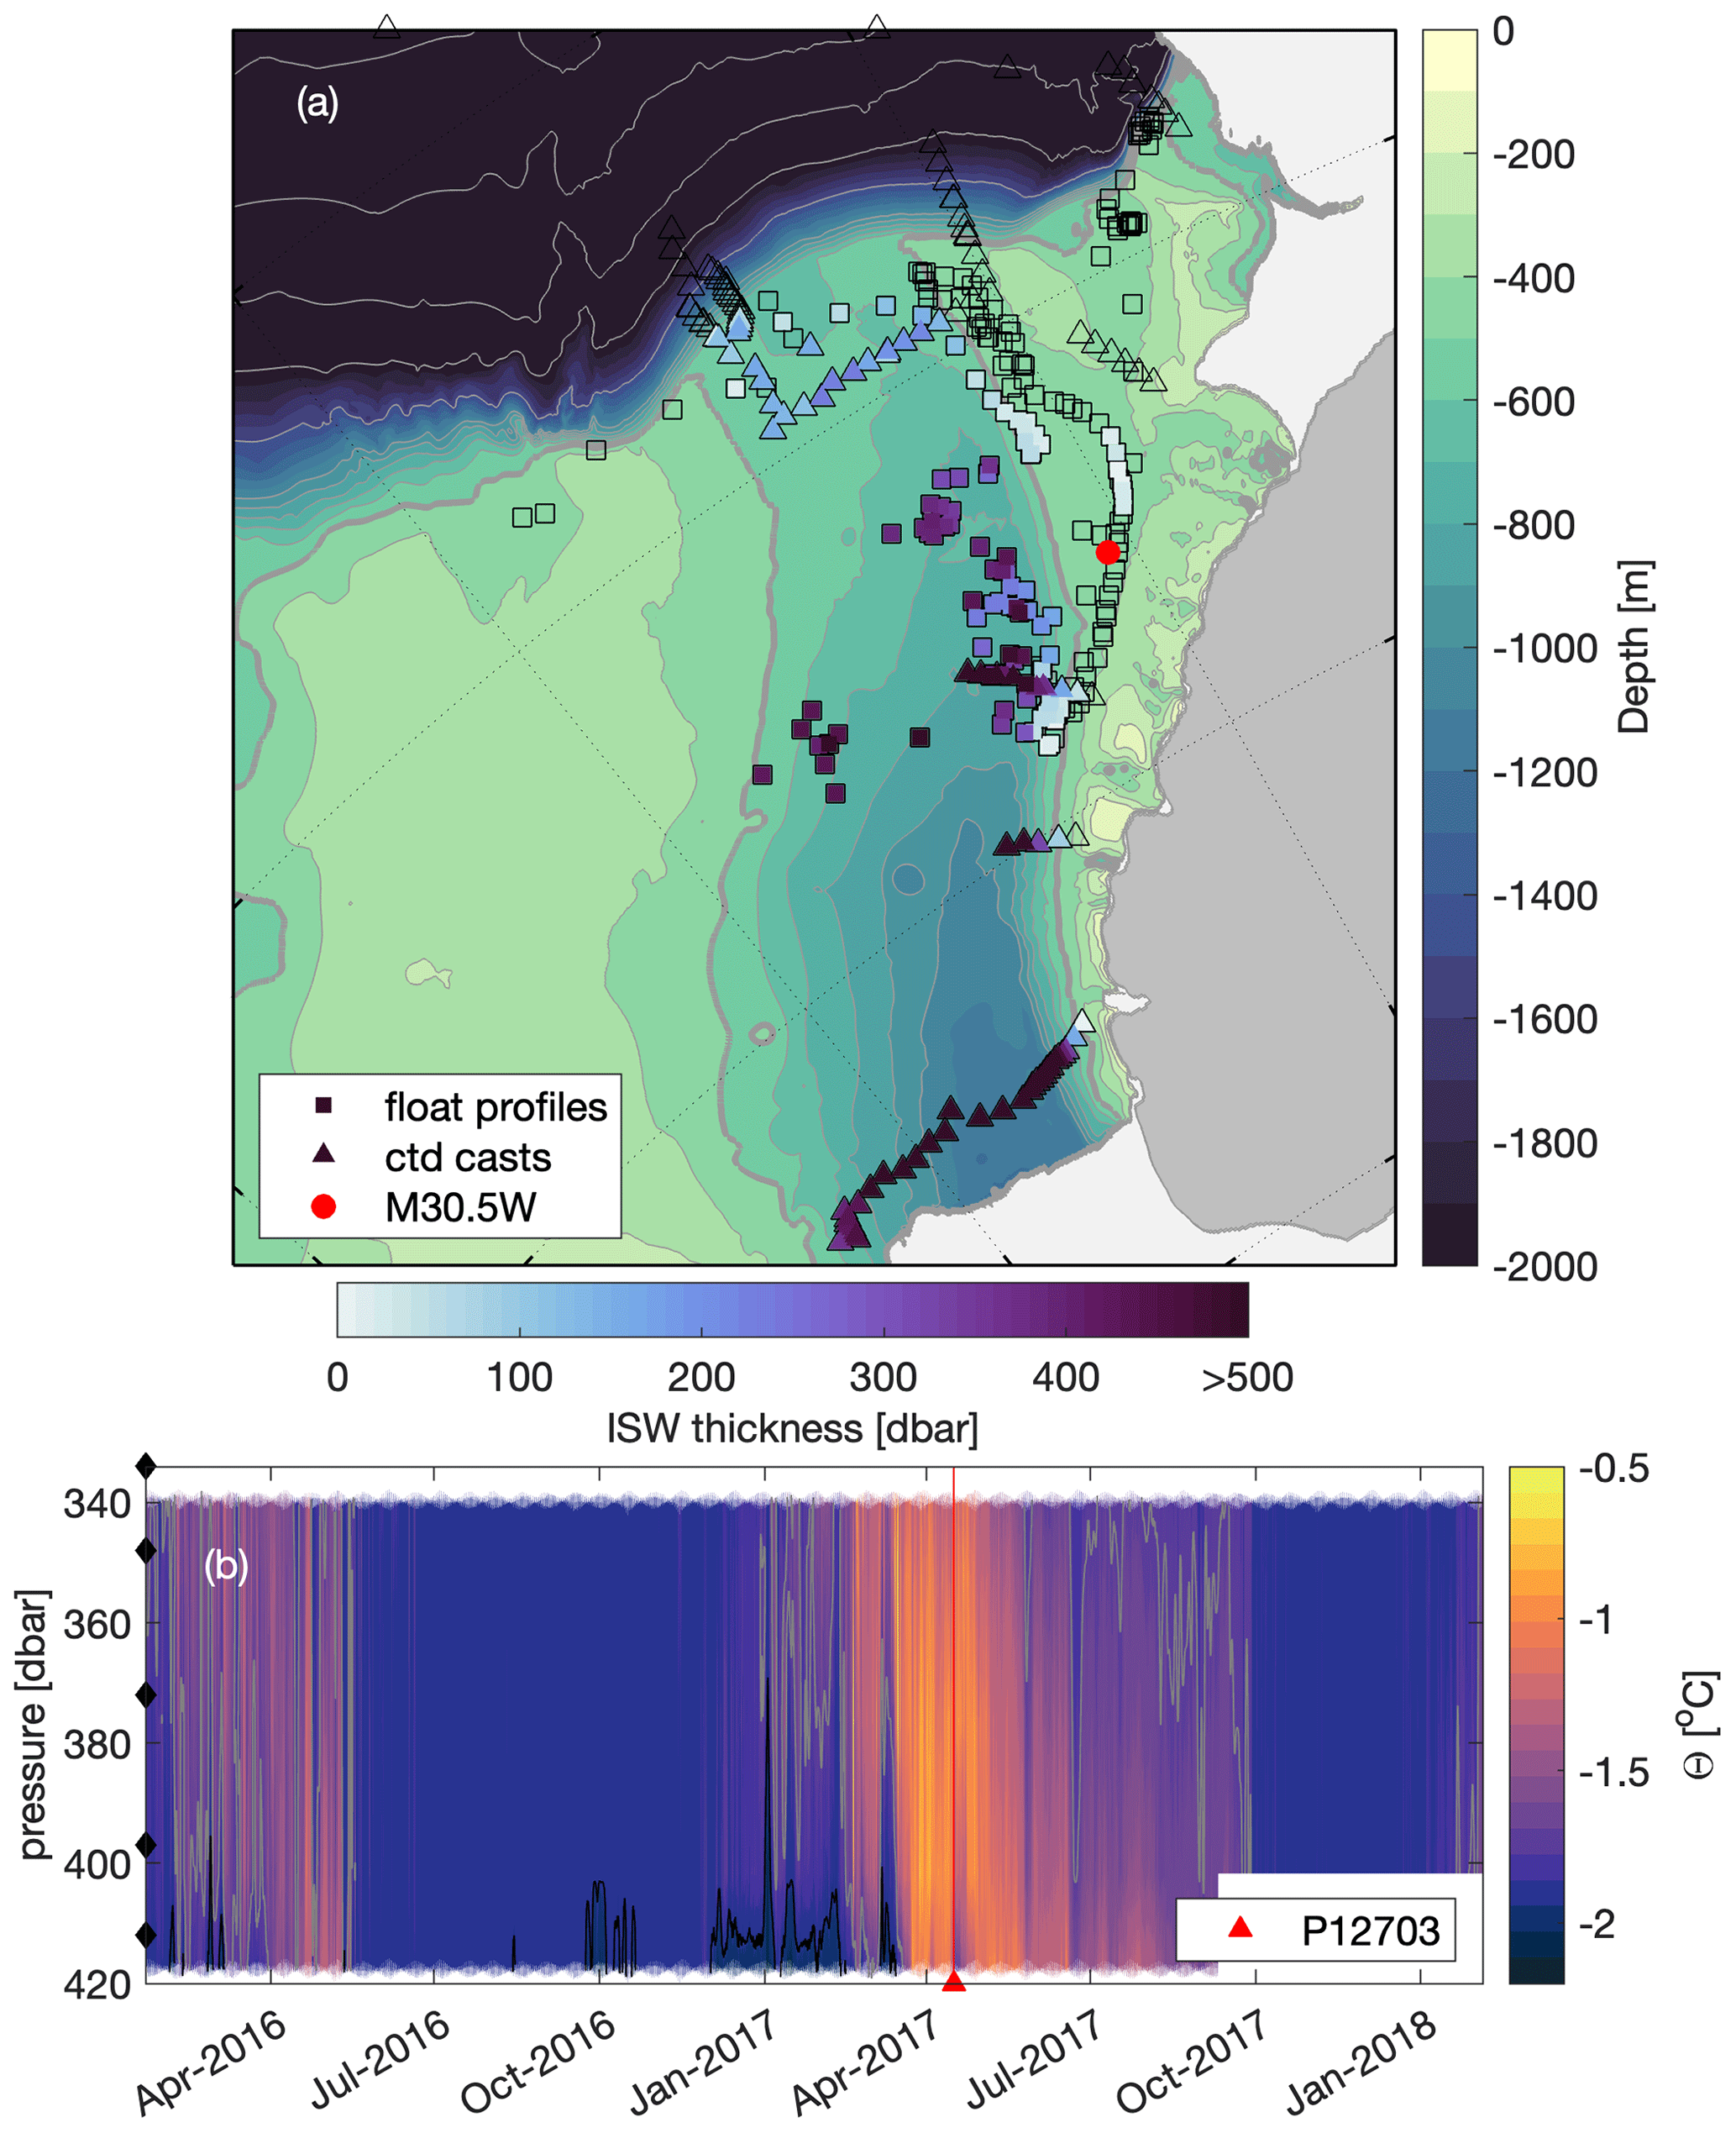
Figure 7(a) ISW layer thickness from the float profiles (squares) and the ship-based CTD casts during the deployment cruise in 2017 (triangles) over the Weddell Sea continental shelf. The colored fill of the symbols shows the thickness of the ISW layer (only if any ISW is present), taken as the bottom water mass below the surface freezing point (−1.9 °C). The colored background represents the bathymetry, with contours as in Fig. 1. (b) Hovmöller of the conservative temperature (Θ) of the mooring M30.5W (see its position in (a)). The black contour represents the −1.9 °C contour for ISW, and the gray contour is the −1.7 °C contour for mWDW. The red triangle shows the timing when the float P12703 passes closest to the mooring location. The black diamonds show the depths of the temperature sensors.
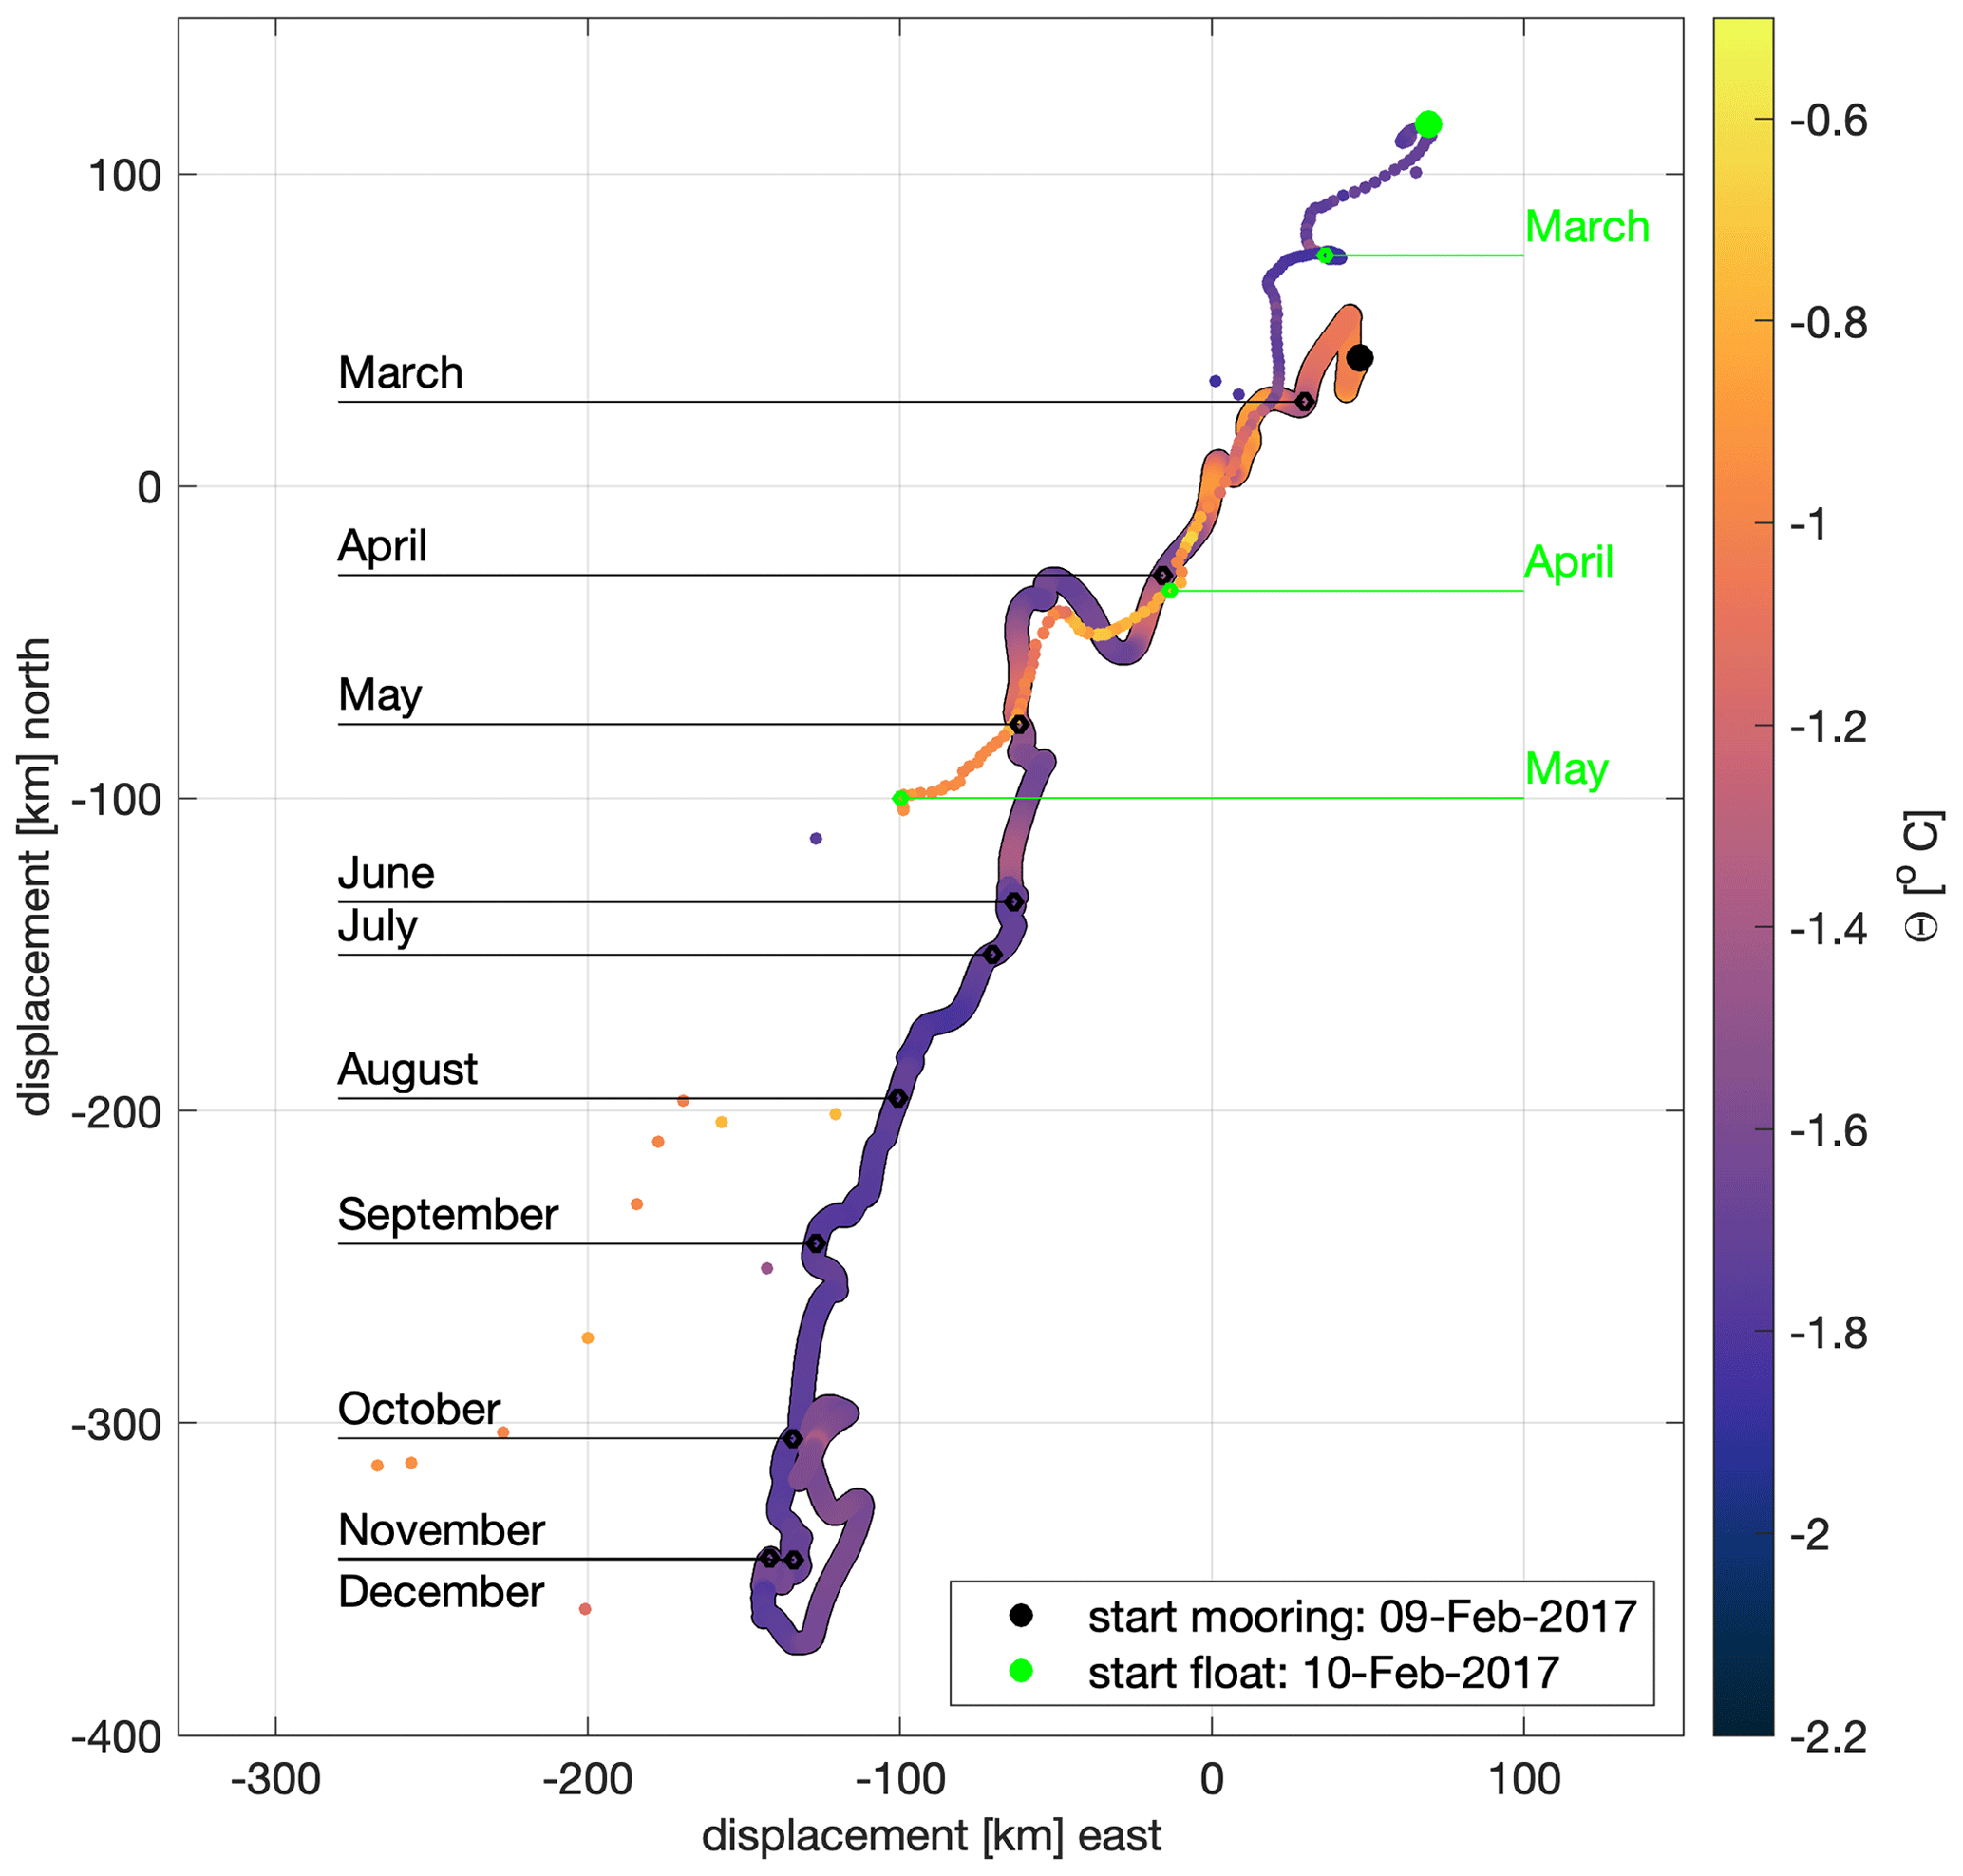
Figure 8Progressive vector diagram of the current at 430 m depth, measured at the sound source mooring P5 located in the Small Trough (thick line; see mooring location in Fig. 1), and of the trajectory of float P12682, which passes the mooring location (thin line). The displacements are centered around the time when the float passed the mooring for better comparison. The color shading denotes conservative temperature (Θ). The black circles along the mooring trajectories mark the first day of each month according to the labels on the side in corresponding colors. Similarly, the first day of each month along the float trajectory is shown as a green circle. The first measurement dates are marked with big circles according to the legend. The black circles (mooring) and green circles (float) along the trajectories mark the first day of each month according to the labels on the side in corresponding colors, and the first measurement dates are marked with big circles according to the legend.
The two floats deployed on the eastern flank of the Filchner Trough (P12679 and 12684) drifted at the upper limit of the thick ISW layer (drift depth of about 250 dbar) that fills the Filchner Trough (Fig. 5). The two floats circulated inside the Filchner Trough for 1 and 4 years, respectively. Based on the available positions, they circulated as far south as 76.64° S, and the northernmost position is the last GPS position sent out by 12684 in January 2021 at 75.18° S. Despite the missing locations during large parts of the sampling period, the temperature measurements show the presence of a thick ISW throughout the whole measurement period. The depths of the profiles suggest that both floats moved from the shallow eastern flank of the Filchner Trough to the central or even western part of the trough, collecting profiles up to 984 m depth. For both floats, the temperatures within the ISW layer show a transition towards colder temperatures during austral summer 2017–2018 compared to the previous summer.
This result is in agreement with the change from the Berkner Mode towards the Ronne Mode described in Janout et al. (2021) and Hattermann et al. (2021), in which the ISW temperature changes based on the formation site of high-salinity shelf water. It is striking that neither of the two floats was advected northward out of the Filchner Trough in 1 year (for float P12679) or even 4 years (for float P12684); instead, they were recirculated within the Trough. This is indicated by both the position of the floats and, when not available, the hydrography and depth of the water column sampled by the floats (Fig. 5). However, the other floats, which were advected northward along the eastern flank of the Filchner Trough, seem to have left the continental shelf eventually, as indicated by the trajectory of float P12686, which continued westward along the continental shelf west of the Filchner Trough, and by the hydrography of the two floats P12682 and P12703, which were entrained in the northward flow of ISW at about ∼76.7° S. The latter two floats started sampling a deep layer of warm water in austral summer 2017–2018, with a profile depth of more than 1600 m, which can only be located over the deep ocean off the continental shelf. We conclude that the flow within the deeper part of the Filchner Trough recirculates within the trough, keeping the ISW layer trapped for several years, while the ISW closer to the eastern flank of the Filchner Trough is advected northward and across the sill relatively quickly (within 1 year).
We deployed seven autonomous floats to document the circulation of two key water masses on the southern Weddell Sea continental shelf. The year-long Lagrangian trajectories within this sea-ice-covered region, as well as the full-depth CTD profiles of up to 4 years long along the floats' trajectories, shed new light on the pathways and timescales associated with mWDW inflow into the continental shelf, on the circulation of ISW within the Filchner Trough, and on the mixing between the two water masses.
The floats sampled the main inflow pathways of mWDW from the continental slope toward the continental shelf. Consistently with previous work (Darelius et al., 2016; Årthun et al., 2012), our observations describe a southward flow of mWDW into the Filchner Trough across its sill at ∼30° W. In addition, we demonstrate that mWDW is also advected southward through the Small Trough on the shallower eastern continental shelf at ∼28° W (Fig. 1). This alternative passage onto the continental shelf was previously hypothesized but never directly observed to be a possible gateway for mWDW (e.g., Ryan et al., 2020). Other evidence supporting this notion of an inflow pathway through the Small Trough is provided by current and temperature measurements taken over 1 year by the mooring P5 located in the Small Trough. Also, consistently with this flow, Labrousse et al. (2021) described the presence of a large pool of mWDW in 2017 over the entire continental shelf east of the Filchner Trough (found as far east as 28° W), although their observations were slightly later in the year, in June and July. This collection of observations thus suggests that both the northeastern corner of the Filchner Trough and the Small Trough support a southward mWDW pathway in summer. Limitations regarding our observational period do not permit us to infer interannual variability, but we note that 2017, the year in which we acquired most of our float observations, was described by Ryan et al. (2020) as a year of particularly warm inflow of mWDW. They proposed that the heaving of the Antarctic Slope Front was stronger in 2017 than in other years, allowing for warmer, saltier mWDW to intrude onto the continental shelf and for the mWDW inflow to last longer.
All of the floats presented here that capture the southward flow of mWDW consistently depict the eventual entrainment of southward-flowing mWDW into a northward flow along the eastern side of the Filchner Trough. Such a turning point in the trajectories was also found in idealized modeling results from the Filchner Trough region by Daae et al. (2017), where, in several experiments, the southward-flowing current along the eastern flank of the trough only reached about 50 km into the trough before it got drawn out of the trough again by the northward flow of ISW. This blocking of the mWDW inflow by the presence of ISW is consistent with the absence of mWDW close to the FRIS that was described earlier based on in situ observations (Darelius et al., 2016). Here, we provide a novel view regarding the southward extent of the mWDW pathway: mWDW entering the continental shelf farther east from the Filchner Trough is able to penetrate a greater distance to the south toward the ice shelf. Hence, the Small Trough may be of particular importance for the impact of warm water on the shelf. At the same time, our observations underline the importance of the ISW presence and its northward advection in blocking mWDW access to the FRIS cavity. Any change in ISW production, which directly relates to the sea-ice-driven production of HSSW (Hattermann et al., 2021; Janout et al., 2021), would therefore provide feedback on changes in mWDW access to the FRIS cavity and, therefore, on the heat flux to the base of the ice shelf.
While our observations indicate that the northward ISW pathway on the eastern side of the Filchner Trough blocks mWDW access to the FRIS cavity, the two floats that sampled ISW in the deeper part of the trough showed recirculating trajectories and long residence timescales of 1 year (P12679) and up to – possibly more than – 4 years (P12684). Such a long residence time was, until now, unknown and could only be revealed with under-ice float data. Although the reconstitution of trajectories was relatively poor for those two floats, their hydrography observations and irregular available positions (found either through RAFOS or GPS) indicate that ISW in the deeper part of the depression stays in the region. The outflow of ISW is therefore likely to be confined to specific pathways, topographically linked to the flanks of the Filchner Trough. The pathway of ISW outflow along the eastern flank of the Filchner Trough is clearly demonstrated by the four floats that first sampled the southward flow of mWDW before getting entrained in a northward flow of ISW as soon as they reached deeper isobaths within the Filchner Trough. A northward pathway of ISW along the western flank is not observed by the floats despite their presence on the western flank. However, we cannot exclude an outflow of ISW on the western side of the trough, along which ISW has been observed to exit the FRIS cavity seasonally (Darelius and Sallée, 2018).
The strong horizontal shear on the eastern side of the Filchner Trough, inferred from the opposing float directions over the eastern flank of the Filchner Trough, is likely to be associated with instabilities and the resulting mixing of water masses. Unfortunately, the set of Lagrangian trajectories does not provide enough spatial and temporal sampling to address mixing or instability questions fully here. The trajectories of the floats show, however, some eddying motion along the eastern flank of the Filchner Trough, which might be an indication of instabilities and eddy activity and, hence, of turbulent mixing between the mWDW and ISW.
The first Lagrangian observations over the Filchner–Ronne continental shelf were acquired from 2017 onward. This dataset provides year-round observations, combining full depth profiles and high-resolution (6-hourly) Lagrangian trajectories under sea ice by means of acoustic positioning. Two mWDW inflow gateways are documented: an eastern passage, the Small Trough, at ∼28° W, which was previously hypothesized to be a pathway but has never before been observed as an mWDW passage, and a western passage in the northeastern corner of the Filchner Trough, at ∼30° W. Both gateways are important for the seasonal mWDW flooding of the shallow continental shelf east of the Filchner Trough.
Our observations corroborate the importance of the exchanges between ISW and mWDW on the continental shelf, with the presence of a thick ISW layer within the Filchner Trough blocking mWDW access to the FRIS cavity by consistently entraining and mixing mWDW within an efficient ISW northward flow over the eastern slope of the Filchner Trough. Within the trough itself, the circulation of ISW appears to be more convoluted and is associated with significant recirculation, with a recirculation timescale of up to 4 years, as indicated by one of our floats. The results from the deployment of a set of autonomous floats on the ice-covered Filchner–Ronne sector of the Antarctic continental shelf are demonstrated here to be a promising tool, in combination with other observational strategies, for the observation of the year-round hydrography and circulation of the Antarctic continental shelves.
All float observations used in this paper are available here: https://doi.org/10.5281/zenodo.10353500 (Sallée, 2023).
JBS and LV conceived and designed the analysis. AM developed the algorithm for float positioning under the supervision of JBS and AL. NS and EP contributed to the visualization of data in all the figures. AL and PL were instrumental in acquiring high-quality observations, especially around the deployment and programming of sound sources and floats. All the authors contributed to the writing of the paper.
The contact author has declared that none of the authors has any competing interests.
Publisher's note: Copernicus Publications remains neutral with regard to jurisdictional claims made in the text, published maps, institutional affiliations, or any other geographical representation in this paper. While Copernicus Publications makes every effort to include appropriate place names, the final responsibility lies with the authors.
This study receives funding from the European Union's Horizon 2020 research and innovation program under grant agreement no. 821001 (SO-CHIC) and from the European Research Council (ERC) under the European Union's Horizon 2020 research and innovation program (grant agreement no. 637770). Kevin Speer acknowledges support from the National Science Foundation (grant nos. OPP-1643679 and OCE-1658479). The authors would like to express their gratitude to the officers and crews of RV Polarstern (cruise PS129) and the James Clark Ross (cruise JR16004) for their efficient assistance. Thanks to Svenja Ryan for the fruitful discussions. Thanks to Théophile Lebrun for his work on the float data and to Markus Janout, Mathias Monsees, and Hervé Le Goff for the mooring work.
This research has been supported by the EU Horizon 2020 Framework Programme, H2020 Excellent Science (grant no. 821001), the H2020 European Research Council (grant no. 637770), and the National Science Foundation (grant nos. OPP-1643679 and OCE-1658479).
This paper was edited by Ilker Fer and reviewed by two anonymous referees.
Arndt, J. E., Schenke, H. W., Jakobsson, M., Nitsche, F. O., Buys, G., Goleby, B., Rebesco, M., Bohoyo, F., Hong, J., Black, J., Greku, R., Udintsev, G., Barrios, F., Reynoso-Peralta, W., Taisei, M., and Wigley, R.: The international bathymetric chart of the Southern Ocean (IBCSO) version 1.0 – A new bathymetric compilation covering circum-Antarctic waters, Geophys. Res. Lett., 40, 3111–3117, https://doi.org/10.1002/grl.50413, 2013. a
Årthun, M., Nicholls, K. W., Makinson, K., Fedak, M. A., and Boehme, L.: Seasonal inflow of warm water onto the southern Weddell Sea continental shelf, Antarctica, Geophys. Res. Lett., 39, L17601, https://doi.org/10.1029/2012GL052856, 2012. a, b, c, d
Daae, K., Hattermann, T., Darelius, E., and Fer, I.: On the effect of topography and wind on warm water inflow – An idealized study of the southern Weddell Sea continental shelf system, J. Geophys. Res.-Oceans, 122, 2622–2641, 2017. a, b, c
Daae, K., Hattermann, T., Darelius, E., Mueller, R., Naughten, K., Timmermann, R., and Hellmer, H.: Necessary conditions for warm inflow toward the Filchner Ice Shelf, Weddell Sea, Geophys. Res. Lett., 47, 1–11, 2020. a
Darelius, E. and Sallée, J.-B.: Seasonal outflow of ice shelf water across the front of the Filchner ice shelf, Weddell Sea, Antarctica, Geophys. Res. Lett., 45, 3577–3585, 2018. a, b
Darelius, E., Smedsrud, L. H., Østerhus, S., Foldvik, A., and Gammelsrød, T.: Structure and variability of the Filchner overflow plume, Tellus A, 61, 446–464, https://doi.org/10.1111/j.1600-0870.2009.00391.x, 2009. a
Darelius, E., Makinson, K., Daae, K., Fer, I., Holland, P. R., and Nicholls, K. W.: Hydrography and circulation in the Filchner depression, Weddell Sea, Antarctica, J. Geophys. Res.-Oceans, 119, 5797–5814, 2014. a, b
Darelius, E., Fer, I., and Nicholls, K. W.: Observed vulnerability of Filchner-Ronne Ice Shelf to wind-driven inflow of warm deep water, Nat. Commun., 7, 1–7, 2016. a, b, c, d, e
Davis, P. E. D., Jenkins, A., Nicholls, K. W., Dutrieux, P., Schröder, M., Janout, M. A., Hellmer, H. H., Templeton, R., and McPhail, S.: Observations of modified warm deep water beneath Ronne Ice Shelf, Antarctica, from an autonomous underwater vehicle, J. Geophys. Res.-Oceans, 127, e2022JC019103, https://doi.org/10.1029/2022JC019103, 2022. a
DeConto, R. M. and Pollard, D.: Contribution of Antarctica to past and future sea-level rise, Nature, 531, 591–597, 2016. a
Dinniman, M. S., Klinck, J. M., and Smith Jr., W. O.: A model study of Circumpolar Deep Water on the West Antarctic Peninsula and Ross Sea continental shelves, Deep-Sea Res. Pt. II, 58, 1508–1523, 2011. a
Dupont, T. and Alley, R. B.: Assessment of the importance of ice-shelf buttressing to ice-sheet flow, Geophys. Res. Lett., 32, L04503, https://doi.org/10.1029/2004GL022024, 2005. a
Foldvik, A. and Gammelsrød, T.: Notes on Southern Ocean hydrography, sea-ice and bottom water formation, Palaeogeogr. Palaeocl., 67, 3–17, https://doi.org/10.1016/0031-0182(88)90119-8, 1988. a
Foldvik, A., Gammelsrød, T., and Tørresen, T.: Circulation and water masses on the southern Weddell Sea shelf, Oceanology of the Antarctic Continental Shelf, 43, 5–20, 1985. a
Foldvik, A., Gammelsrød, T., Østerhus, S., Fahrbach, E., Rohardt, G., Schröder, M., Nicholls, K. W., Padman, L., and Woodgate, R.: Ice shelf water overflow and bottom water formation in the southern Weddell Sea, J. Geophys. Res.-Oceans, 109, C02015, https://doi.org/10.1029/2003JC002008, 2004. a
Fox, A. J., Paul, A., and Cooper, R.: Measured properties of the Antarctic ice sheet derived from the SCAR Antarctic digital database, Polar Rec., 30, 201–206, 1994. a
Girton, J. B., Christianson, K., Dunlap, J., Dutrieux, P., Gobat, J., Lee, C., and Rainville, L.: Buoyancy-adjusting profiling floats for exploration of heat transport, melt rates, and mixing in the ocean cavities under floating ice shelves, in: OCEANS 2019 MTS/IEEE SEATTLE, Seattle, WA, USA, 1–6, https://doi.org/10.23919/OCEANS40490.2019.8962744, 2019. a
Haid, V. and Timmermann, R.: Simulated heat flux and sea ice production at coastal polynyas in the southwestern Weddell Sea, J. Geophys. Res.-Oceans, 118, 2640–2652, 2013. a
Hattermann, T., Smedsrud, L. H., Nøst, O. A., Lilly, J. M., and Galton-Fenzi, B. K.: Eddy-resolving simulations of the Fimbul Ice Shelf cavity circulation: Basal melting and exchange with open ocean, Ocean Model., 82, 28–44, 2014. a
Hattermann, T., Nicholls, K. W., Hellmer, H. H., Davis, P. E., Janout, M. A., Østerhus, S., Schlosser, E., Rohardt, G., and Kanzow, T.: Observed interannual changes beneath Filchner-Ronne Ice Shelf linked to large-scale atmospheric circulation, Nat. Commun., 12, 2961, https://doi.org/10.1038/s41467-021-23131-x, 2021. a, b
Hazel, J. E. and Stewart, A. L.: Bistability of the Filchner-Ronne Ice Shelf cavity circulation and basal melt, J. Geophys. Res.-Oceans, 125, e2019JC015848, https://doi.org/10.1029/2019JC015848, 2020. a
Hellmer, H. H. and Holtappels, M.: The Expedition PS124 of the Research Vessel POLARSTERN to the southern Weddell Sea in 2021, Reports on polar and marine research, Bremerhaven, Alfred Wegener Institute for Polar and Marine Research, 755, 237 pp., https://doi.org/10.48433/BzPM_0755_2021, 2021. a
Hellmer, H. H., Kauker, F., Timmermann, R., Determann, J., and Rae, J.: Twenty-first-century warming of a large Antarctic ice-shelf cavity by a redirected coastal current, Nature, 485, 225–228, 2012. a
Hellmer, H. H., Kauker, F., Timmermann, R., and Hattermann, T.: The fate of the southern Weddell Sea continental shelf in a warming climate, J. Climate, 30, 4337–4350, 2017. a
Jacobs, S., Hellmer, H., Doake, C., Jenkins, A., and Frolich, R.: Melting of ice shelves and the mass balance of Antarctica, J. Glaciol., 38, 375–387, 1992. a
Janout, M. A., Hellmer, H. H., Schröder, M., and Wisotzki, A.: Physical oceanography during POLARSTERN cruise PS111 (ANT-XXXIII/2), PANGAEA, https://doi.org/10.1594/PANGAEA.897280, 2019. a
Janout, M. A., Hellmer, H. H., Hattermann, T., Huhn, O., Sültenfuss, J., Østerhus, S., Stulic, L., Ryan, S., Schröder, M., and Kanzow, T.: FRIS Revisited in 2018: On the Circulation and Water Masses at the Filchner and Ronne Ice Shelves in the Southern Weddell Sea, J. Geophys. Res.-Oceans, 126, e2021JC017269, https://doi.org/10.1029/2021JC017269, 2021. a, b, c
Joughin, I., Alley, R. B., and Holland, D. M.: Ice-sheet response to oceanic forcing, Science, 338, 1172–1176, https://doi.org/10.1126/science.1226481, 2012. a
Jourdain, N. C., Asay-Davis, X., Hattermann, T., Straneo, F., Seroussi, H., Little, C. M., and Nowicki, S.: A protocol for calculating basal melt rates in the ISMIP6 Antarctic ice sheet projections, The Cryosphere, 14, 3111–3134, https://doi.org/10.5194/tc-14-3111-2020, 2020. a
Klatt, O., Boebel, O., and Fahrbach, E.: A profiling float's sense of ice, J. Atmos. Ocean. Tech., 24, 1301–1308, 2007. a
Labrousse, S., Ryan, S., Roquet, F., Picard, B., McMahon, C., Harcourt, R., Hindell, M., Le Goff, H., Lourenço, A., David, Y., Sallée, J. B., and Charrassin, J.-B.: Weddell seal behaviour during an exceptional oceanographic event in the Filchner-Ronne Ice Shelf in 2017, Antarct. Sci., 33, 252–264, https://doi.org/10.1017/S0954102021000092, 2021. a, b
Lago, V. and England, M. H.: Projected slowdown of Antarctic Bottom Water formation in response to amplified meltwater contributions, J. Climate, 32, 6319–6335, 2019. a
McDougall, T. J. and Barker, P. M.: Getting started with TEOS-10 and the Gibbs Seawater (GSW) oceanographic toolbox, SCOR/IAPSO WG, 127, 1–28, 2011. a
Meredith, M. P., Schofield, O., Newman, L., Urban, E., and Sparrow, M.: The vision for a southern ocean observing system, Curr. Opin. Env. Sust., 5, 306–313, 2013. a
Moorman, R., Morrison, A. K., and Hogg, A. M.: Thermal responses to Antarctic ice shelf melt in an eddy rich global ocean–sea-ice model, J. Climate, 33, 6599–6620, https://doi.org/10.1175/JCLI-D-19-0846.1, 2020. a
Nicholls, K., Boehme, L., Biuw, M., and Fedak, M. A.: Wintertime ocean conditions over the southern Weddell Sea continental shelf, Antarctica, Geophys. Res. Lett., 35, L21605, https://doi.org/10.1029/2008GL035742, 2008. a, b
Nicholls, K., Østerhus, S., Makinson, K., Gammelsrød, T., and Fahrbach, E.: Ice-ocean processes over the continental shelf of the southern Weddell Sea, Antarctica: A review, Rev. Geophys., 47, RG3003, https://doi.org/10.1029/2007RG000250, 2009. a, b, c, d, e
Paolo, F. S., Fricker, H. A., and Padman, L.: Volume loss from Antarctic ice shelves is accelerating, Science, 348, 327–331, 2015. a
Porter, D. F., Springer, S. R., Padman, L., Fricker, H. A., Tinto, K. J., Riser, S. C., Bell, R. E., and the ROSETTA-Ice Team: Evolution of the seasonal surface mixed layer of the Ross Sea, Antarctica, observed with autonomous profiling floats, J. Geophys. Res.-Oceans, 124, 4934–4953, 2019. a
Reese, R., Gudmundsson, G. H., Levermann, A., and Winkelmann, R.: The far reach of ice-shelf thinning in Antarctica, Nat. Clim. Change, 8, 53–57, https://doi.org/10.1038/s41558-017-0020-x, 2018. a
Rignot, E., Mouginot, J., Scheuchl, B., van den Broeke, M., van Wessem, M. J., and Morlighem, M.: Four decades of Antarctic Ice Sheet mass balance from 1979–2017, P. Natl. Acad. Sci. USA, 116, 1095–1103, 2019. a, b
Rossby, T. and Webb, D.: Observing abyssal motions by tracking Swallow floats in the SOFAR channel, Deep-Sea Res., 17, 359–365, https://doi.org/10.1016/0011-7471(70)90027-6, 1970. a
Rossby, T., Dorson, D., and Fontaine, J.: The RAFOS system, J. Atmos. Ocean. Tech., 3, 672–679, 1986. a, b
Rossby, T., Ellis, J., and Webb, D.: An efficient sound source for wide-area RAFOS navigation, J. Atmos. Ocean. Tech., 10, 397–403, 1993. a
Ryan, S., Schröder, M., Huhn, O., and Timmermann, R.: On the warm inflow at the eastern boundary of the Weddell Gyre, Deep-Sea Res. Pt. I, 107, 70–81, 2016. a
Ryan, S., Hattermann, T., Darelius, E., and Schröder, M.: Seasonal cycle of hydrography on the eastern shelf of the Filchner Trough, Weddell Sea, Antarctica, J. Geophys. Res.-Oceans, 122, 6437–6453, 2017. a, b, c, d, e, f
Ryan, S., Hellmer, H. H., Janout, M., Darelius, E., Vignes, L., and Schröder, M.: Exceptionally warm and prolonged flow of warm deep water toward the Filchner-Ronne Ice Shelf in 2017, Geophys. Res. Lett., 47, e2020GL088119, https://doi.org/10.1029/2020GL088119, 2020. a, b, c, d, e
Sallée, J.-B.: Hydrological and current data for the Southern Weddell Sea, collected as part of the WAPITI oceanographic survey (JR16004), Seanoe, https://doi.org/10.17882/54012, 2018. a
Sallée, J.-B.: Dataset of the paper: “Subsurface floats in the Filchner Trough provide first direct under-ice tracks of eddies and circulation on shelf”, Zenodo [data set], https://doi.org/10.5281/zenodo.10353500, 2023. a
Schmidtko, S., Heywood, K. J., Thompson, A. F., and Aoki, S.: Multidecadal warming of Antarctic waters, Science, 346, 1227–1231, 2014. a
Schröder, M.: The Expedition PS111 of the Research Vessel POLARSTERN to the southern Weddell Sea in 2018, Berichte zur Polar- und Meeresforschung: Reports on Polar and Marine Research, 718, 161 pp., https://doi.org/10.2312/BzPM_0718_2018, 2018. a
Schröder, M. and Ryan, S. W. A.: Physical oceanography during POLARSTERN cruise PS96 (ANT-XXXI/2 FROSN), PANGAEA, https://doi.org/10.1594/PANGAEA.859040, 2016. a
Siegelman, L., Roquet, F., Mensah, V., Rivière, P., Pauthenet, É., Picard, B., and Guinet, C.: Correction and accuracy of high-and low-resolution CTD data from animal-borne instruments, J. Atmos. Ocean. Tech., 36, 745–760, 2019. a
Silvano, A., Rintoul, S., and Herraiz-Borreguero, L.: Ocean-Ice Shelf Interaction in East Antarctica, Oceanography, 29, 130–143, https://doi.org/10.1017/S1356186300003667, 2016. a
Silvano, A., Rintoul, S. R., Kusahara, K., Peña-Molino, B., van Wijk, E., Gwyther, D. E., and Williams, G. D.: Seasonality of warm water intrusions onto the continental shelf near the Totten Glacier, J. Geophys. Res.-Oceans, 124, 4272–4289, 2019. a
Thompson, A. F., Stewart, A. L., Spence, P., and Heywood, K. J.: The Antarctic Slope Current in a changing climate, Rev. Geophys., 56, 741–770, 2018. a, b, c
Vernet, M., Geibert, W., Hoppema, M., Brown, P. J., Haas, C., Hellmer, H. H., Jokat, W., Jullion, L., Mazloff, M., Bakker, D. C. E., Brearley, J. A., Croot, P., Hattermann, T., Hauck, J., Hillenbrand, C.-D., Hoppe, C. J. M., Huhn, O., Koch, B. P., Lechtenfeld, O. J., Meredith, M. P., Naveira Garabato, A. C., Nöthig, E.-M., Peeken, I., Rutgers van der Loeff, M. M., Schmidtko, S., Schröder, M., Strass, V. H., Torres-Valdés, S., and Verdy, A.: The Weddell Gyre, Southern Ocean: present knowledge and future challenges, Rev. Geophys., 57, 623–708, 2019. a
Wong, A. P. and Riser, S. C.: Profiling float observations of the upper ocean under sea ice off the Wilkes Land coast of Antarctica, J. Phys. Oceanogr., 41, 1102–1115, 2011. a, b
Zhou, S., Meijers, A. J. S., Meredith, M. P., Abrahamsen, E. P., Holland, P. R., Silvano, A., Sallée, J.-B., and Østerhus, S.: Slowdown of Antarctic Bottom Water export driven by climatic wind and sea-ice changes, Nat. Clim. Change, 13, 701–709, https://doi.org/10.1038/s41558-023-01695-4, 2023. a