the Creative Commons Attribution 4.0 License.
the Creative Commons Attribution 4.0 License.
 | 15 Jun 2023
High interannual surface pCO2 variability in the southern Canadian Arctic Archipelago's Kitikmeot Sea
Richard P. Sims
Mohamed M. M. Ahmed
Brian J. Butterworth
Patrick J. Duke
Stephen F. Gonski
Samantha F. Jones
Kristina A. Brown
Christopher J. Mundy
William J. Williams
Brent G. T. Else
Warming of the Arctic due to climate change means the Arctic Ocean is now free from ice for longer, as sea ice melts earlier and refreezes later. Yet, it remains unclear how this extended ice-free period will impact carbon dioxide (CO2) fluxes due to scarcity of surface ocean CO2 measurements. Baseline measurements are urgently needed to understand spatial and temporal air–sea CO2 flux variability in the changing Arctic Ocean. There is also uncertainty as to whether the previous basin-wide surveys are representative of the many smaller bays and inlets that make up the Canadian Arctic Archipelago (CAA). By using a research vessel that is based in the remote Inuit community of Ikaluqtuutiak (Cambridge Bay, Nunavut), we have been able to reliably survey pCO2 shortly after ice melt and access previously unsampled bays and inlets in the nearby region. Here we present 4 years of consecutive summertime pCO2 measurements collected in the Kitikmeot Sea in the southern CAA. Overall, we found that this region is a sink for atmospheric CO2 in August (average of all calculated fluxes over the four cruises was −4.64 mmol m−2 d−1), but the magnitude of this sink varies substantially between years and locations (average calculated fluxes of +3.58, −2.96, −16.79 and −0.57 mmol m−2 d−1 during the 2016, 2017, 2018 and 2019 cruises, respectively). Surface ocean pCO2 varied by up to 156 µatm between years, highlighting the importance of repeat observations in this region, as this high interannual variability would not have been captured by sparse and infrequent measurements. We find that the surface ocean pCO2 value at the time of ice melt is extremely important in constraining the magnitude of the air–sea CO2 flux throughout the ice-free season. However, further constraining the air–sea CO2 flux in the Kitikmeot Sea will require a better understanding of how pCO2 changes outside of the summer season. Surface ocean pCO2 measurements made in small bays and inlets of the Kitikmeot Sea were ∼ 20–40 µatm lower than in the main channels. Surface ocean pCO2 measurements made close in time to ice breakup (i.e. within 2 weeks) were ∼ 50 µatm lower than measurements made > 4 weeks after breakup. As previous basin-wide surveys of the CAA have focused on the deep shipping channels and rarely measure close to the ice breakup date, we hypothesize that there may be an observational bias in previous studies, leading to an underestimate of the CO2 sink in the CAA. These high-resolution measurements constitute an important new baseline for gaining a better understanding of the role this region plays in the uptake of atmospheric CO2.
- Article
(4385 KB) - Full-text XML
-
Supplement
(16045 KB) - BibTeX
- EndNote


The Arctic Ocean plays an important role in the global carbon cycle as a sink for atmospheric carbon dioxide (CO2) (Bates and Mathis, 2009). Gas exchange and CO2 drawdown is enhanced in cold polar surface waters because the solubility of CO2 increases at low temperatures; this is known as the ocean solubility pump (Parmentier et al., 2013). Despite its role as a sink for CO2, the magnitude of CO2 uptake by the Arctic Ocean is poorly constrained, as the region remains spatially and temporally under-sampled due to difficult seasonal access heavily skewing measurements to the ice-free summer period (DeGrandpre et al., 2020). Additionally, logistical constraints in poorly charted nearshore waters also tend to bias underway CO2 measurements to established shipping routes and the deep ocean basins, leaving much of the Arctic coastal zone under-sampled in the Surface Ocean CO2 Atlas (SOCAT v2022; Bakker, 2016). This is not a trivial oversight, given that the Arctic Ocean is encircled by coasts and their associated shelf seas, 53 % of the ∼ 10.7 × 10⁶ km2 of Arctic Ocean surface area is < 200 m deep (Jakobsson, 2002).
The Arctic is already being heavily impacted by climate change (Landrum and Holland, 2020), with potentially devastating impacts on the Inuit and other Indigenous communities who live there (Ford et al., 2008). It is not certain how the Arctic carbon system will respond to climate change and how the effects of processes like ocean acidification will manifest and impact Inuit communities. Projecting long-term change in regions with complex biogeochemistry (i.e. the coastal domain) is particularly difficult. To better predict how the Arctic carbon system will change in the future requires baseline measurements, including detailed surveys and regular monitoring of oceanic pCO2, that reflect the diverse nature of Arctic marine environments.
The Canadian Arctic Archipelago (CAA) is made up of numerous islands that cover 13 % of the Arctic Ocean (Macdonald et al., 2010) and account for the bulk of Canada's 162 000 km of Arctic coastline (Wynja et al., 2015). The islands of the CAA form a complex bathymetry which is important in determining the circulation in the CAA (Wang et al., 2012). The majority of existing pCO2 measurements made in the CAA were collected along the southern route through the Northwest Passage on the research icebreaker CCGS Amundsen (Ahmed et al., 2019). This large pCO2 dataset was used to estimate a −7.7 ± 4 Tg C yr−1 sink for the CAA during the open water season (Ahmed and Else, 2019). The CCGS Amundsen pCO2 dataset provides excellent broad spatial coverage of the CAA, but the vast area surveyed was limited in temporal coverage and fine spatial detail. The CCGS Amundsen typically only transited through the central straits, channels, gulfs, and seas of the southern Northwest Passage once each summer. The numerous bays and inlets that are off the main channel were not sampled, meaning that local-scale pCO2 variability was potentially unaccounted for during the synoptic-scale sampling. This small-scale pCO2 variability is difficult to predict empirically and may be better observed via regional studies. For example, the model of Ahmed et al. (2019) was shown to underestimate pCO2 by an average of ∼ 26 µatm in Coronation Gulf and Dease Strait regions of the Kitikmeot Sea. Ahmed et al. (2019) postulated that large river inflow in the region may account for divergences from their model, understanding whether this is the case warrants further investigation and makes the Kitikmeot Sea a prime location for focused study.
Our understanding of the inorganic carbon system in the Kitikmeot Sea region primarily comes from three distinct sources of measurements. Firstly, the 2010–2016 summertime ship measurements of pCO2 in the central channel of the Kitikmeot presented by Ahmed et al. (2019). Their measurements show the region to be slightly undersaturated at the beginning of August, becoming slightly supersaturated in the middle of August through to the middle of September and then becoming undersaturated again in early October. Coronation Gulf is one of the few areas of the CAA that was consistently observed to be supersaturated with CO2 in summer. Supersaturation of pCO2 in Coronation Gulf is likely a result of high summer surface seawater temperatures (CO2 thermodynamics mean that a 1 ∘C temperature increase increases pCO2 by 4.23 %, Takahashi et al., 1993) and high river discharge, particularly to the southwest (Geilfus et al., 2018). The second source of carbonate system measurements in the region are CO2 flux observations at the Qikirtaarjuk Island observatory on the Finlayson Islands in Dease Strait (Butterworth and Else, 2018). Their measurements from the 2017 ice breakup season through to the summer indicate that there is CO2 drawdown and thus undersaturation at breakup and for the first 2 weeks of open water. Near the end of July, the region transitions into a CO2 source through to the end of August (Butterworth and Else, 2018). The region reverts to a sink in late August as the sea cools and surface pCO2 declines; the region remains a sink until there is almost full ice cover in November (Butterworth et al., 2023, in preparation). A similar pattern was observed in the summer of 2018, except when pCO2 began to fall in late August the region notably did not revert all the way back into a sink (Butterworth et al., 2023, in preparation). The third source of carbonate system measurements is provided by Duke et al. (2021), who report autonomous pCO2 measurements at a depth of 7 m from an instrument installed on the Ocean Networks Canada (ONC) underwater sensor mooring in Cambridge Bay between August 2015 and August 2018. The sensor measurements from Cambridge Bay indicate that pCO2 is supersaturated in winter and undersaturated by the start of June at the onset of sea ice melt (Duke et al., 2021). Their measurements show that there is a short period of supersaturation in the middle of August coinciding with increased sea water temperature, the ocean then quickly returns to a CO2 sink and remains undersaturated up until freeze-up (Duke et al., 2021). Duke et al. (2021) confirmed that the biogeochemical measurements at the ONC site were representative of the offshore area during most seasons by comparing discrete dissolved inorganic carbon (DIC) and total alkalinity (TA) samples collected at both 2 and 7 m at the ONC platform and an offshore station (B1). The surface stratification at ONC breaks down after the 2-week sea ice melt and river runoff period in early July. After the sea ice melt and river runoff period, DIC, TA, salinity, and temperature values recorded by the ONC mooring are then once again representative of the surface mixed layer.
All three sources of measurements indicate that there is notable interannual variability in surface pCO2 in the Kitikmeot Sea. The ship-based measurements provide a snapshot of spatial variability across the wider region during the open-water season, whereas the time series from Qikirtaarjuk Island observatory and the ONC mooring provide insights into seasonal and interannual variability at specific locations. There are obvious shortcomings to both approaches. Icebreaker-based studies may under-represent small-scale variability that exists in nearshore regions that are inaccessible due to the vessel's large draft. However, the fixed observatories may over-represent temporal variability that is location-specific; for example, the ONC mooring is in an enclosed bay close to the outlet of a river (Manning et al., 2020), and the flux footprint of the island observatory spans a hotspot for mixing and productivity (Dalman et al., 2019). Given the limitations of each of these data sources, there is a need to understand how representative they are of the wider Kitikmeot Sea region.
In this paper, we present surface pCO2 measurements made during annual summertime surveys of the Kitikmeot Sea between 2016 and 2019. We use these new pCO2 measurements to determine the magnitude of CO2 uptake in the Kitikmeot Sea shortly after ice breakup. These new pCO2 measurements allow us to bridge the gap between previous measurements, which were made at contrasting spatial scales (e.g. the low-spatial-variability point-scale observation from the local carbon observatories and the large-scale CAA-wide pCO2 measurements). We use our new measurements to explore whether there are small-scale regional pCO2 differences in the inlets and bays of the CAA that are not adequately represented by CAA-wide sampling. We also use our new measurements to explore pCO2 variability in the proximity of these observatories to determine whether they are representative of the wider region. In attempting to unify existing measurements, we aim to unravel the seasonal and interannual variability of pCO2 in the region.
2.1 Oceanographic setting
The Kitikmeot Sea (Fig. 1) is a shallow shelf sea within the CAA that encompasses Coronation Gulf to the west and that is linked via Dease Strait to Queen Maud Gulf in the east, Bathurst Inlet to the south, and Chantrey Inlet to the southeast (Williams et al., 2018). The communities of Cambridge Bay, Kugluktuk, and Gjoa Haven, Nunavut, are the main year-round settlements in the Kitikmeot Sea region. River inputs from mainland Canada and snow and ice melt provide a considerable source of freshwater in the region (Williams et al., 2018), resulting in some of the lowest-salinity surface waters in the CAA (Ahmed et al., 2019). The Kitikmeot Sea is strongly nitrogen limited (Back et al., 2021), with surface nitrate concentrations of 1.3 µmol L−1 (Dalman et al., 2019), and as a result chlorophyll concentrations are also low in the region (Kim et al., 2020). Observations and modelling of the physical oceanography of the region demonstrates that the stratification regime in Dease Strait and Queen Maud Gulf is characterized by a ∼ 40 m warm fresh surface layer and a cold salty bottom layer that extends down to around 100 m (Xu et al., 2021). Coronation Gulf has a three-layer regime composed of a 40 m warm fresh surface layer, a colder salty layer down to 100 m and a stable deep layer down to 350 m (Xu et al., 2021). Vertical mixing in the Kitikmeot Sea is prohibited by strong stratification throughout most of the year; however, after sea ice breakup wind-driven mixing gradually deepens the surface mixed layer, resulting in an almost fully mixed water column in Dease Strait (Xu et al., 2021).
The oceanographic boundary for the Kitikmeot Sea has been designated as where the shelf shoals to < 30 m in the west (Dolphin and Union Strait) and northeast (Victoria Strait) (Williams et al., 2018). At the Dolphin and Union Strait, warm fresh surface seawater flows out across the sills and subsurface flows of more saline nutrient-rich Pacific waters enter the sea. Another feature of the Kitikmeot Sea is that strong tidal currents in narrow channels can keep certain areas ice-free in winter (Williams et al., 2018). Strong tidal currents beneath sea ice such as around the Finlayson Islands in Dease Strait act to slow winter sea ice growth and enhance primary production by introducing nutrients (Dalman et al., 2019). First-year sea ice dominates the Kitikmeot Sea although some multiyear ice may be blown into Queen Maud Gulf from the northern part of the CAA (Xu et al., 2021). Seawater temperatures across the Kitikmeot Sea vary considerably throughout the year; they are around −2 ∘C in winter and reach upwards of 10 ∘C in summer (Xu et al., 2021). The bounding sills, large freshwater inputs and low nutrient loads make the Kitikmeot Sea unique within the CAA.
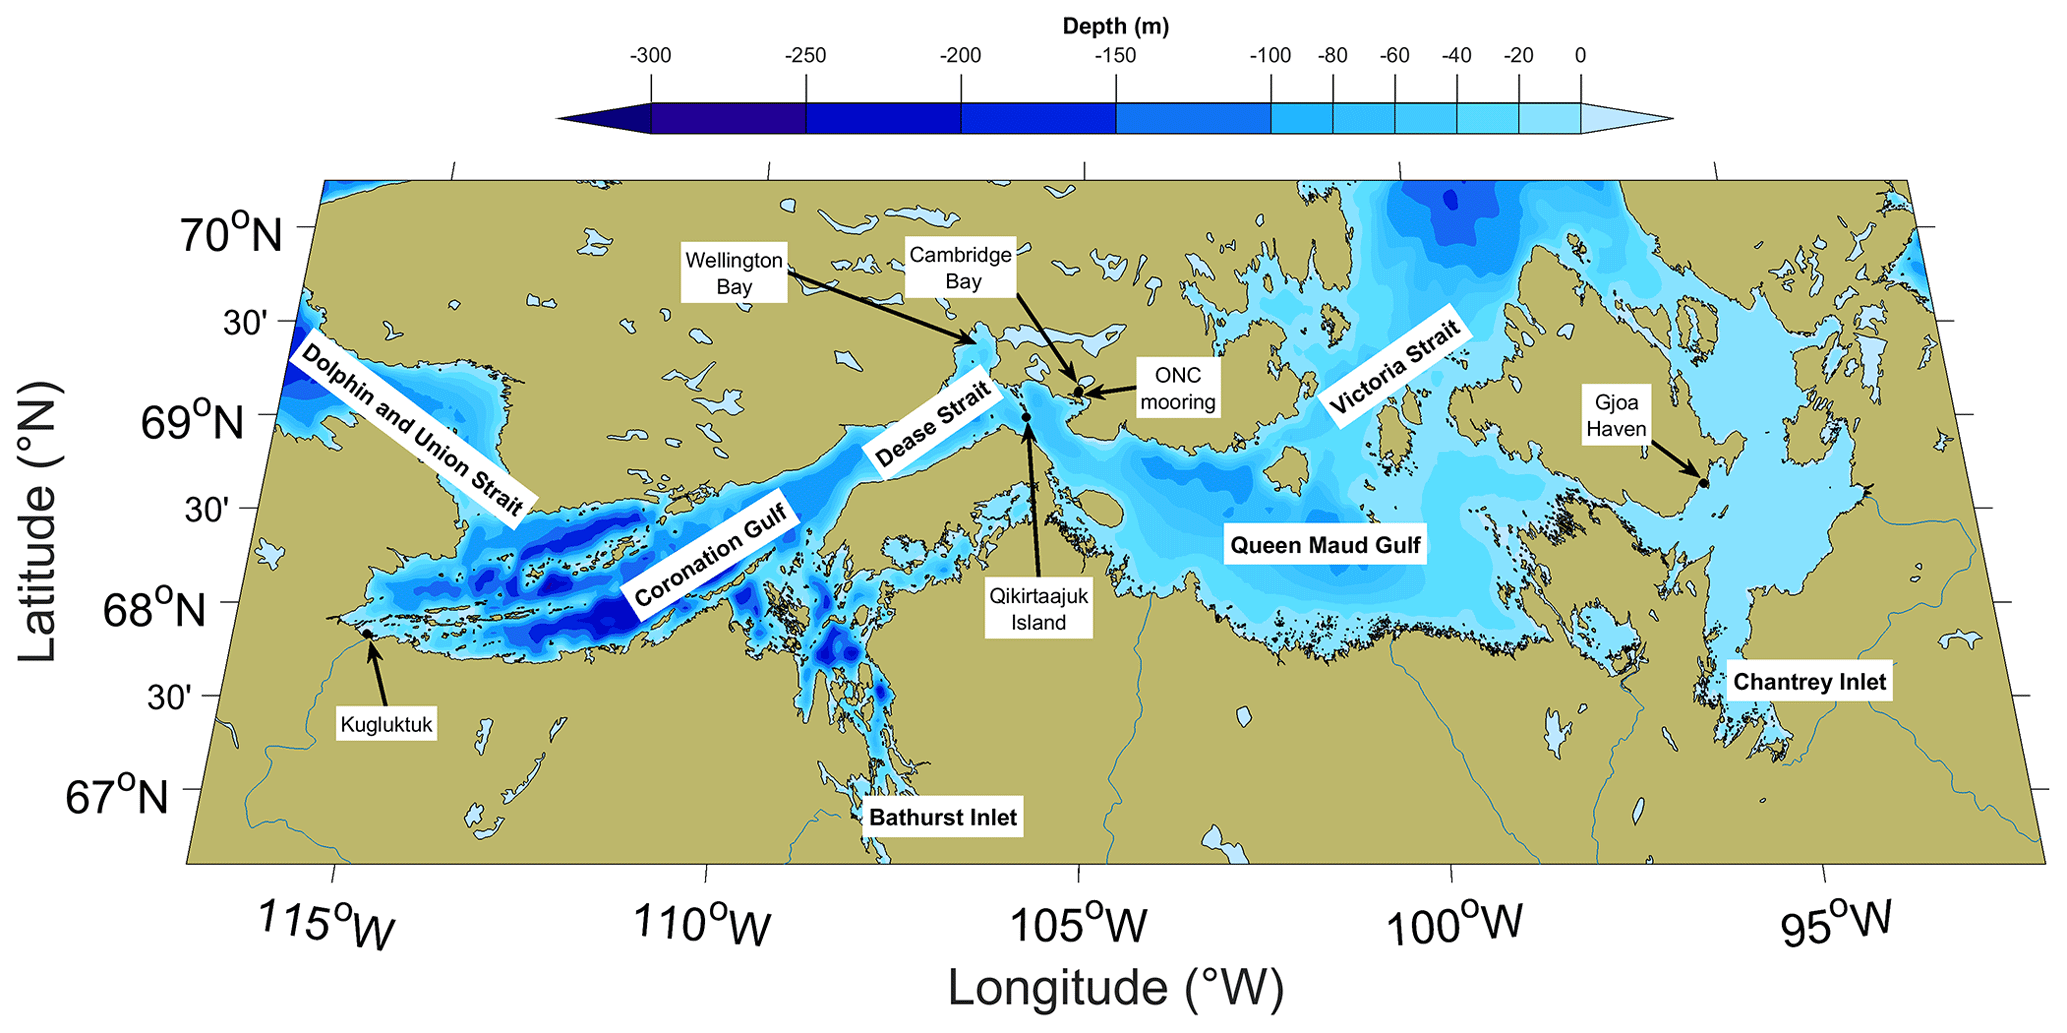
Figure 1A map of the Kitikmeot Sea. The main settlements in the region (Cambridge Bay, Kugluktuk and Gjoa Haven) are labelled, as are the Ocean Networks Canada mooring and the Finlayson Islands (where the Qikirtaarjuk Island observatory is located). Shoreline data were taken from the World Vector Shoreline database, and river data were taken from the CIA World Data Bank II (WDBII), both of which were accessed via the Global Self-consistent, Hierarchical, High-resolution Geography Database (GSHHG) (Wessel and Smith, 1996). Bathymetry data were taken from the 2 min Gridded Global Relief Data (ETOPO2) v2 database (NGDC, 2006). This map was made using tools from the M_Map MATLAB plotting package (Pawlowicz, 2020).
2.2 Field campaign description
Annual oceanographic surveys of the summertime surface seawater partial pressure of carbon dioxide (pCO2 (sw)) were conducted between 2016 and 2019 in the Kitikmeot Sea (Fig. 1) aboard the RV Martin Bergmann as part of the Marine Environmental Observation, Prediction and Response Network (MEOPAR) and Kitikmeot Sea Science Study (K3S) programmes (cruise details in Table S1). In each of the 4 years, an underway pCO2 system was deployed on cruises conducted under ice-free conditions between early August and mid-September. The Canadian High Arctic Research Station (CHARS) in Cambridge Bay, Nunavut, acted as a staging ground for this work as Cambridge Bay is the home port for the RV Martin Bergmann.
Between 2016 and 2019, the cruise track varied from year to year depending on the objectives of the research conducted (Fig. 2). The first week of each summer field season was typically used to complete work for the MEOPAR programme, the majority of the ship time for the MEOPAR work was spent in the proximity of Cambridge Bay, the Finlayson Islands, Wellington Bay and the western region of Queen Maud Gulf. Cruises in mid to late August were used to conduct work for the K3S programme; for the K3S work the ship typically travelled further from Cambridge Bay heading into Bathurst Inlet, the central region of Queen Maud Gulf and Chantrey Inlet. The opportunistic nature of the data collection meant that data density varied between regions, as not every region was surveyed each year.
Sea ice concentrations in the months preceding each annual survey were taken from the daily gridded 3.125 km AMSR2 satellite radiometer product (Spreen et al., 2008). To determine weeks since open water, the nearest point on the AMSR2 grid was determined for each pCO2 (sw) measurement. The time between the measurement and when sea ice concentration fell constantly below the threshold value for the marginal ice zone (85 %) (Cruz-García et al., 2021) was then calculated.
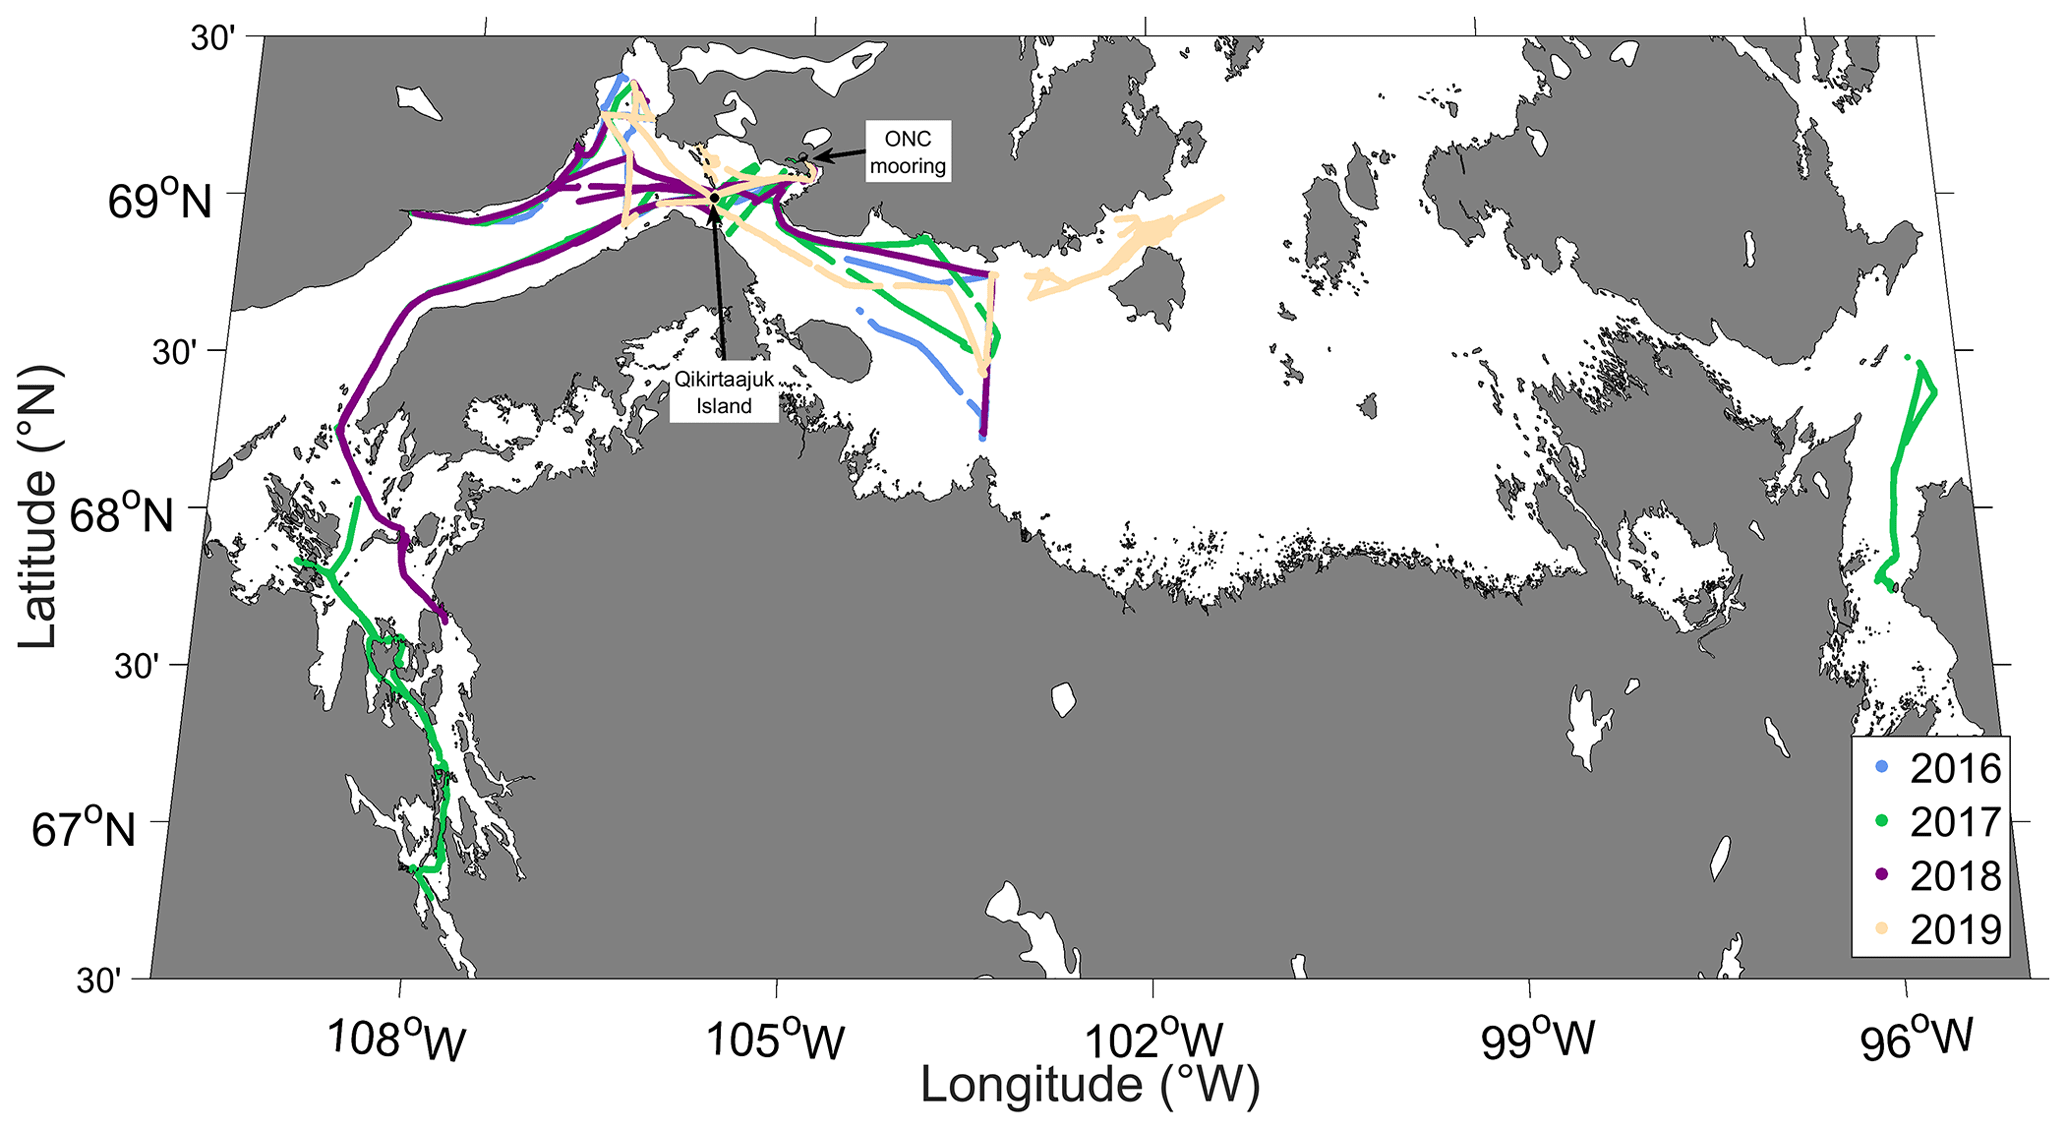
Figure 2Ship cruise tracks for each of the 4 surveyed years. The Ocean Networks Canada mooring and the Qikirtaarjuk Island Observatory where the eddy covariance tower is located are shown by black dots.
2.3 Underway system
The RV Martin Bergmann is a 20 m re-purposed commercial fishing trawler from Newfoundland with a draft of 3.4 m (Fig. 3a and b). The ship does not have its own dedicated integrated underway system; instead surface seawater was sampled from an inlet at a depth of ∼ 1 m through ∼ 2 m of 0.5 in. ID PVC tubing securely draped over the bulwark of the vessel through an external hatch (Fig. 3c and d). A Waterra Tempest WSP-12V-3 submersible pump was used to pump surface seawater through this inlet tubing at a rate of 10 L min−1. In situ surface seawater temperature (SST(1 m)) was measured by a Campbell Scientific 107 temperature sensor (error of <± 0.01 ∘C over the measurement range) attached to the tubing inlet.
Upon entering the ship, the flow of seawater passed through a SoMAS MSRC VDB-1 vortex debubbler and was split between several instruments via Tygon tubing (Fig. 3). An Idronaut Ocean Seven 315 On-line module thermosalinograph measured seawater temperature (SST(tsg)) with an accuracy of 0.003 ∘C and conductivity with an accuracy of 0.003 mS cm−1 at a seawater flow rate of 0.5 L min−1. A Wetlabs ECO BBFL2B Triplet measured fluorescence with a sensitivity of 0.025 µg L−1 at a flow rate of 2.5 L min−1. The output of the ECO fluorescence sensor was post-processed to remove spikes from bubbles and particles but was not calibrated against in situ measurements. A flow of 2 L min−1 was directed to the seawater equilibrator. Instrument flow rates were set with manual flowmeters so that the internal instrument volumes and associated tubing of the Idronaut, ECO and equilibrator were flushed at the same rate; this meant that approximately half of the 10 L min−1 flow from the pump was not analysed and was discarded overboard.
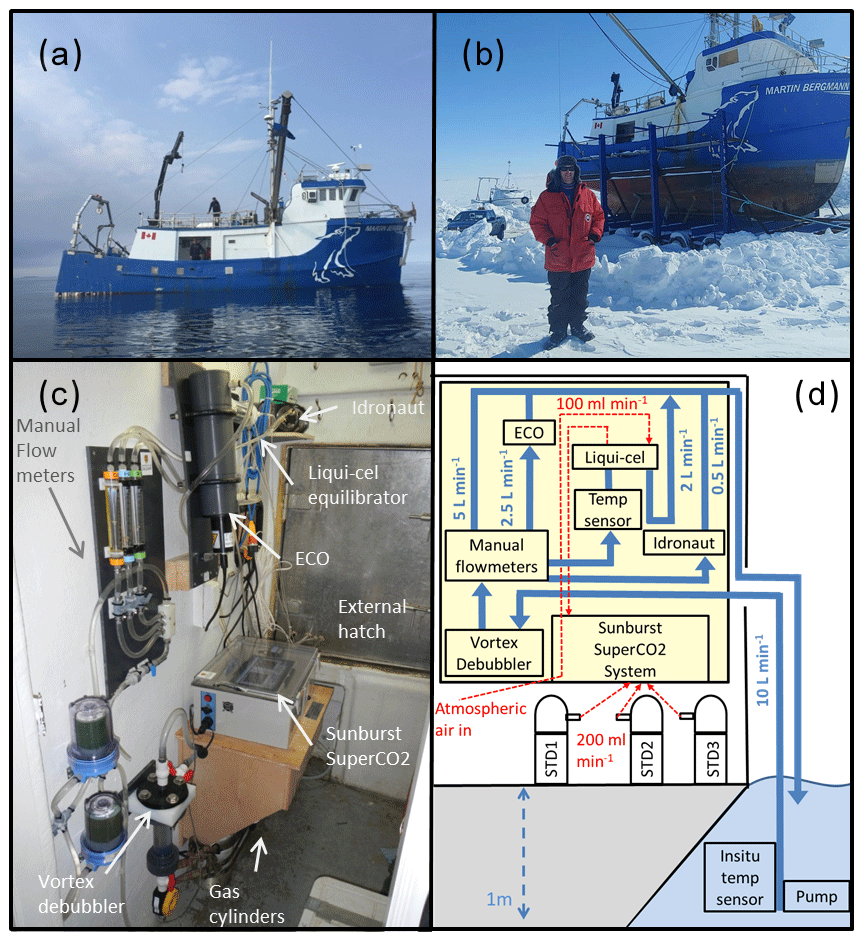
Figure 3(a) Image of the RV Martin Bergmann at sea taken in August 2017. (b) Image of RV Martin Bergmann stored on its trailer taken on a mild day in May 2019. (c) Labelled photograph of the underway system installed in the ship's lab space. (d) Detailed cross-sectional schematic of the underway system with labelled instruments and flow rates. Instruments mounted to the wall are shown with a yellow background, water circulation is shown in blue and air circulation is shown in red.
A commercially available Sunburst Sensors underway SuperCO2 system measured surface seawater CO2; an identical system was previously described by Evans et al. (2019). The SuperCO2 system follows the general recommendations of Dickson et al. (2007) SOP5. A Permapure Liqui-Cel 2.5X8 series membrane contactor was used as the equilibrator for the pCO2 system, and the waterside seawater flow rate for the equilibrator was approximately 2 L min−1. Seawater temperature was measured at the equilibrator seawater inlet using a thermistor (T(equ)). The gas counter flow into the equilibrator was supplied by an air pump at a flow rate of 100 mL min−1. CO2 has been shown to fully equilibrate in this model Liqui-Cel when set up in a single-pass setup at these water and gas flow rates (Sims et al., 2017). The system does not utilize a dryer and thus does not require a water vapour correction in post-processing as the equilibrator is assumed to be at 100 % humidity. For additional accuracy, the inbuilt H2O sensor was calibrated with a LI-610 Portable Dew Point Generator on-site before each deployment, the dew point generator has an accuracy of ± 0.2 ∘C. The SuperCO2 system has a standard multi-position valve and alternates between equilibrator air, atmospheric samples, and three gas standards. The timing of the valve switching was set so that each of the three CO2 standards (CO2 mixing ratios (xCO2) of 255.1, 409.9 and 566.4) were flushed through the system at 200 mL min−1 for 5 min every 6 h. Standard gases were certified at the University of Manitoba against standards obtained from Environment and Climate Change Canada and are thus traceable to World Meteorological Organization standards. The SuperCO2 system has an integrated air pump configured to make atmospheric measurements; these measurements were not used due to contamination from the ship's exhaust. The SuperCO2 system also measured atmospheric pressure P(atm).
Measurements from the underway system were logged every minute. The xCO2 values and related variables were logged to the computer of the SuperCO2 system, the data recorded by the ECO were logged to a separate data file, and the latitude and longitude, recorded with a Garmin GPS16X-HVS GPS unit, were logged to a Campbell Scientific CR300 data logger. The CO2 measured by the system were processed following SOP 5 (Dickson et al., 2007). The xCO2 value is the output provided by the Licor 850 in the SuperCO2 system; xCO2 is calibrated using a piecewise linear interpolation in time with the three standards. As there was no dryer the equilibrator is assumed to be at full humidity; the partial pressure in the equilibrator (pCO2 (equ)) was therefore calculated by multiplying by atmospheric pressure P (atm). The pCO2 (equ) value was converted to pCO2 (1 m) using T(equ), SST(1 m) and the fractional temperature change constant of Takahashi et al. (1993). The depth of the seawater inlet was validated each year by comparing the thermosalinograph salinity and the in situ temperature sensor with surface temperature and salinity from conductivity–temperature–depth (CTD) rosette measurements at the surface. As there was no in situ temperature sensor during the 2017 and 2018 field seasons, the warming was characterized from T(equ) and CTD rosette measurements following Ahmed et al. (2019); details of this can be found in the Supplement. Additionally, median observational values of −0.17 ∘C and +0.1 were added to the in situ temperature and salinity to account for ubiquitous skin effects when calculating interfacial seawater pCO2 (Woolf et al., 2019).
Using an identical setup, DeGrandpre et al. (2020) estimate the pCO2 uncertainty as ± 5 µatm, this is the uncertainty for our 2016 and 2019 measurements. In 2017 and 2018, there is an additional uncertainty component associated with using an empirical relationship to obtain SST(1m). This additional uncertainty was calculated by taking the root-mean-square deviation (RMSD) values from those empirical relationships (2017 = 0.49, 2018 = 0.64 ∘C) and propagating them through the temperature equation for pCO2 (1 m) (Takahashi et al., 1993). This resulted in an additional 2.09 % and 2.74 % uncertainty in pCO2 (1 m); these values are similar to the 2 % uncertainty reported by Ahmed et al. (2019) following the same method. For a pCO2 (equ) value of 300 µatm this equates to an additional 6.3 and 8.2 µatm uncertainty for each year, respectively. Propagating uncertainties gives average uncertainties of 8.04 and 9.60 µatm for 2017 and 2018, respectively. The calculation of the 2017 and 2018 uncertainties is consistent with the International Bureau of Weights and Measures (BIPM) guide to the expression of uncertainty in measurement (GUM) methodology (JCGM, 2008).
The standard system configuration during the four cruises is detailed above; changes from this configuration during specific cruises are detailed in the Supplement (Table S2). There are several logistical aspects associated with deploying, operating, and maintaining an underway pCO2 system in a remote Arctic location on a small vessel like the RV Martin Bergmann; this is discussed further in the Supplement.
2.4 Calculations: air–sea CO2 fluxes
In the absence of a reliable ship-based atmospheric CO2 record, hourly measurements were taken from the atmospheric observatory in Utqiaġvik, Alaska (71.32∘ N, 156.61∘ W) (Thoning, 2020; Peterson et al., 1987). Despite the long distance between Utqiaġvik and the Kitikmeot Sea (around 1800 km), atmospheric CO2 are very similar at both locations as the atmosphere is well mixed for a gas with a long residence time like CO2, and both locations are remote northern sites away from biogenic and industrial emissions. To validate this assumption, a long-term (1985–2019) mean difference of 0.246 µatm was calculated between the hourly measurements at Utqiaġvik and weekly atmospheric samples from Alert, Nunavut (Lan et al., 2022). Wind speed adjusted to a reference height of 10 m (U10) was taken from the Qikirtaarjuk Island observatory (Butterworth and Else, 2018) for the 2017 and 2018 field seasons, whereas a four times daily record of U10 from the NCEP-DOE v2 reanalysis product (Kalnay et al., 1996) was used for the 2016 and 2019 field seasons.
The air–sea fluxes of CO2 (F, mmol m−2 d−1) were calculated as follows:
The water-phase gas transfer velocity (kw, cm h−1) was calculated using U10 and the parameterization of Nightingale et al. (2000), and a unitless Schmidt number (Sc) normalized to a Sc of 660 (Wanninkhof, 2014) was used to scale kw.
ΔpCO2 (µatm) is the partial pressure difference between the seawater interface and air ΔpCO2=pCO2 (sw) – pCO2 (air). The solubility of CO2 in seawater (k0, mol L−1 atm−1) was taken from Weiss (1974). The Schmidt number and solubility were calculated using the in situ temperature and salinity values adjusted for skin effects (Woolf et al., 2019).
Direct measurements of the air–sea CO2 fluxes (F(sea-air)) made using the micrometeorological eddy covariance technique (Butterworth and Else, 2018) were used to infer pCO2 (sw) by rearranging the flux equation. That was achieved using pCO2 (air) from the Licor 7200 at the Qikirtaarjuk Island observatory and SST and SSS (sea surface salinity) from a mooring at a depth of 13 m which was 1 km from the eddy covariance tower (Butterworth et al., 2023 in preparation). An eddy covariance flux footprint is the area over which the eddy covariance measurements correspond to and varies depending on atmospheric conditions. Using the Kljun et al. (2015) footprint model, Butterworth and Else (2018) showed that the footprint of the Qikirtaarjuk Island observatory during spring and summer can be modelled as an ellipse with an upwind axis that varies between approximately 0.75 and 2.0 km and a cross-wind axis that varies between 0.1 and 0.2 km. The effective flux footprint is, however, much smaller, as over 90 % of the flux signal comes from within 100 m of the eddy covariance tower. Uncertainty in the pCO2 (sw) values derived using eddy covariance arises from uncertainty in the flux measurements (hourly uncertainty of ∼ 20 % in the Arctic) (Dong et al., 2021a), uncertainty in the gas transfer parameterization (∼ 5 %–10 %) (Woolf et al., 2019), the small uncertainty in the atmospheric pCO2 value, and uncertainties in k0 and the Schmidt number (including uncertainties in SST and salinity inputs from the 13 m mooring).
To facilitate comparisons between the four summertime cruises, observations have been partitioned into separate oceanographic zones based on the local geography, observational data density, previous pCO2 (sw) measurements, and proximity to the local carbon observatories (Fig. 4a). Bathurst Inlet and Chantrey Inlet were designated zones based on their large freshwater inputs. The Finlayson Islands and Cambridge Bay are where the Qikirtaarjuk Island observatory and ONC mooring are located, respectively; these regions were also heavily surveyed because the RV Martin Bergmann often returned to port in Cambridge Bay and passed the islands to access Wellington Bay and Bathurst Inlet. Wellington Bay (Fig. 1) is a shallow, partially enclosed basin for which a relatively large amount of data were collected due to annual fish-tagging surveys associated with the local subsistence char fishery (Harris et al., 2020). All the measurements in the Dease Strait west zone were made in the central channel and are in the same approximate geographical region to those collected by Ahmed et al. (2019). Most of the measurements in the Queen Maud Gulf zone were made in the west; the box is large enough to include sparse measurements in the central and northern regions, which do not warrant being considered separately.
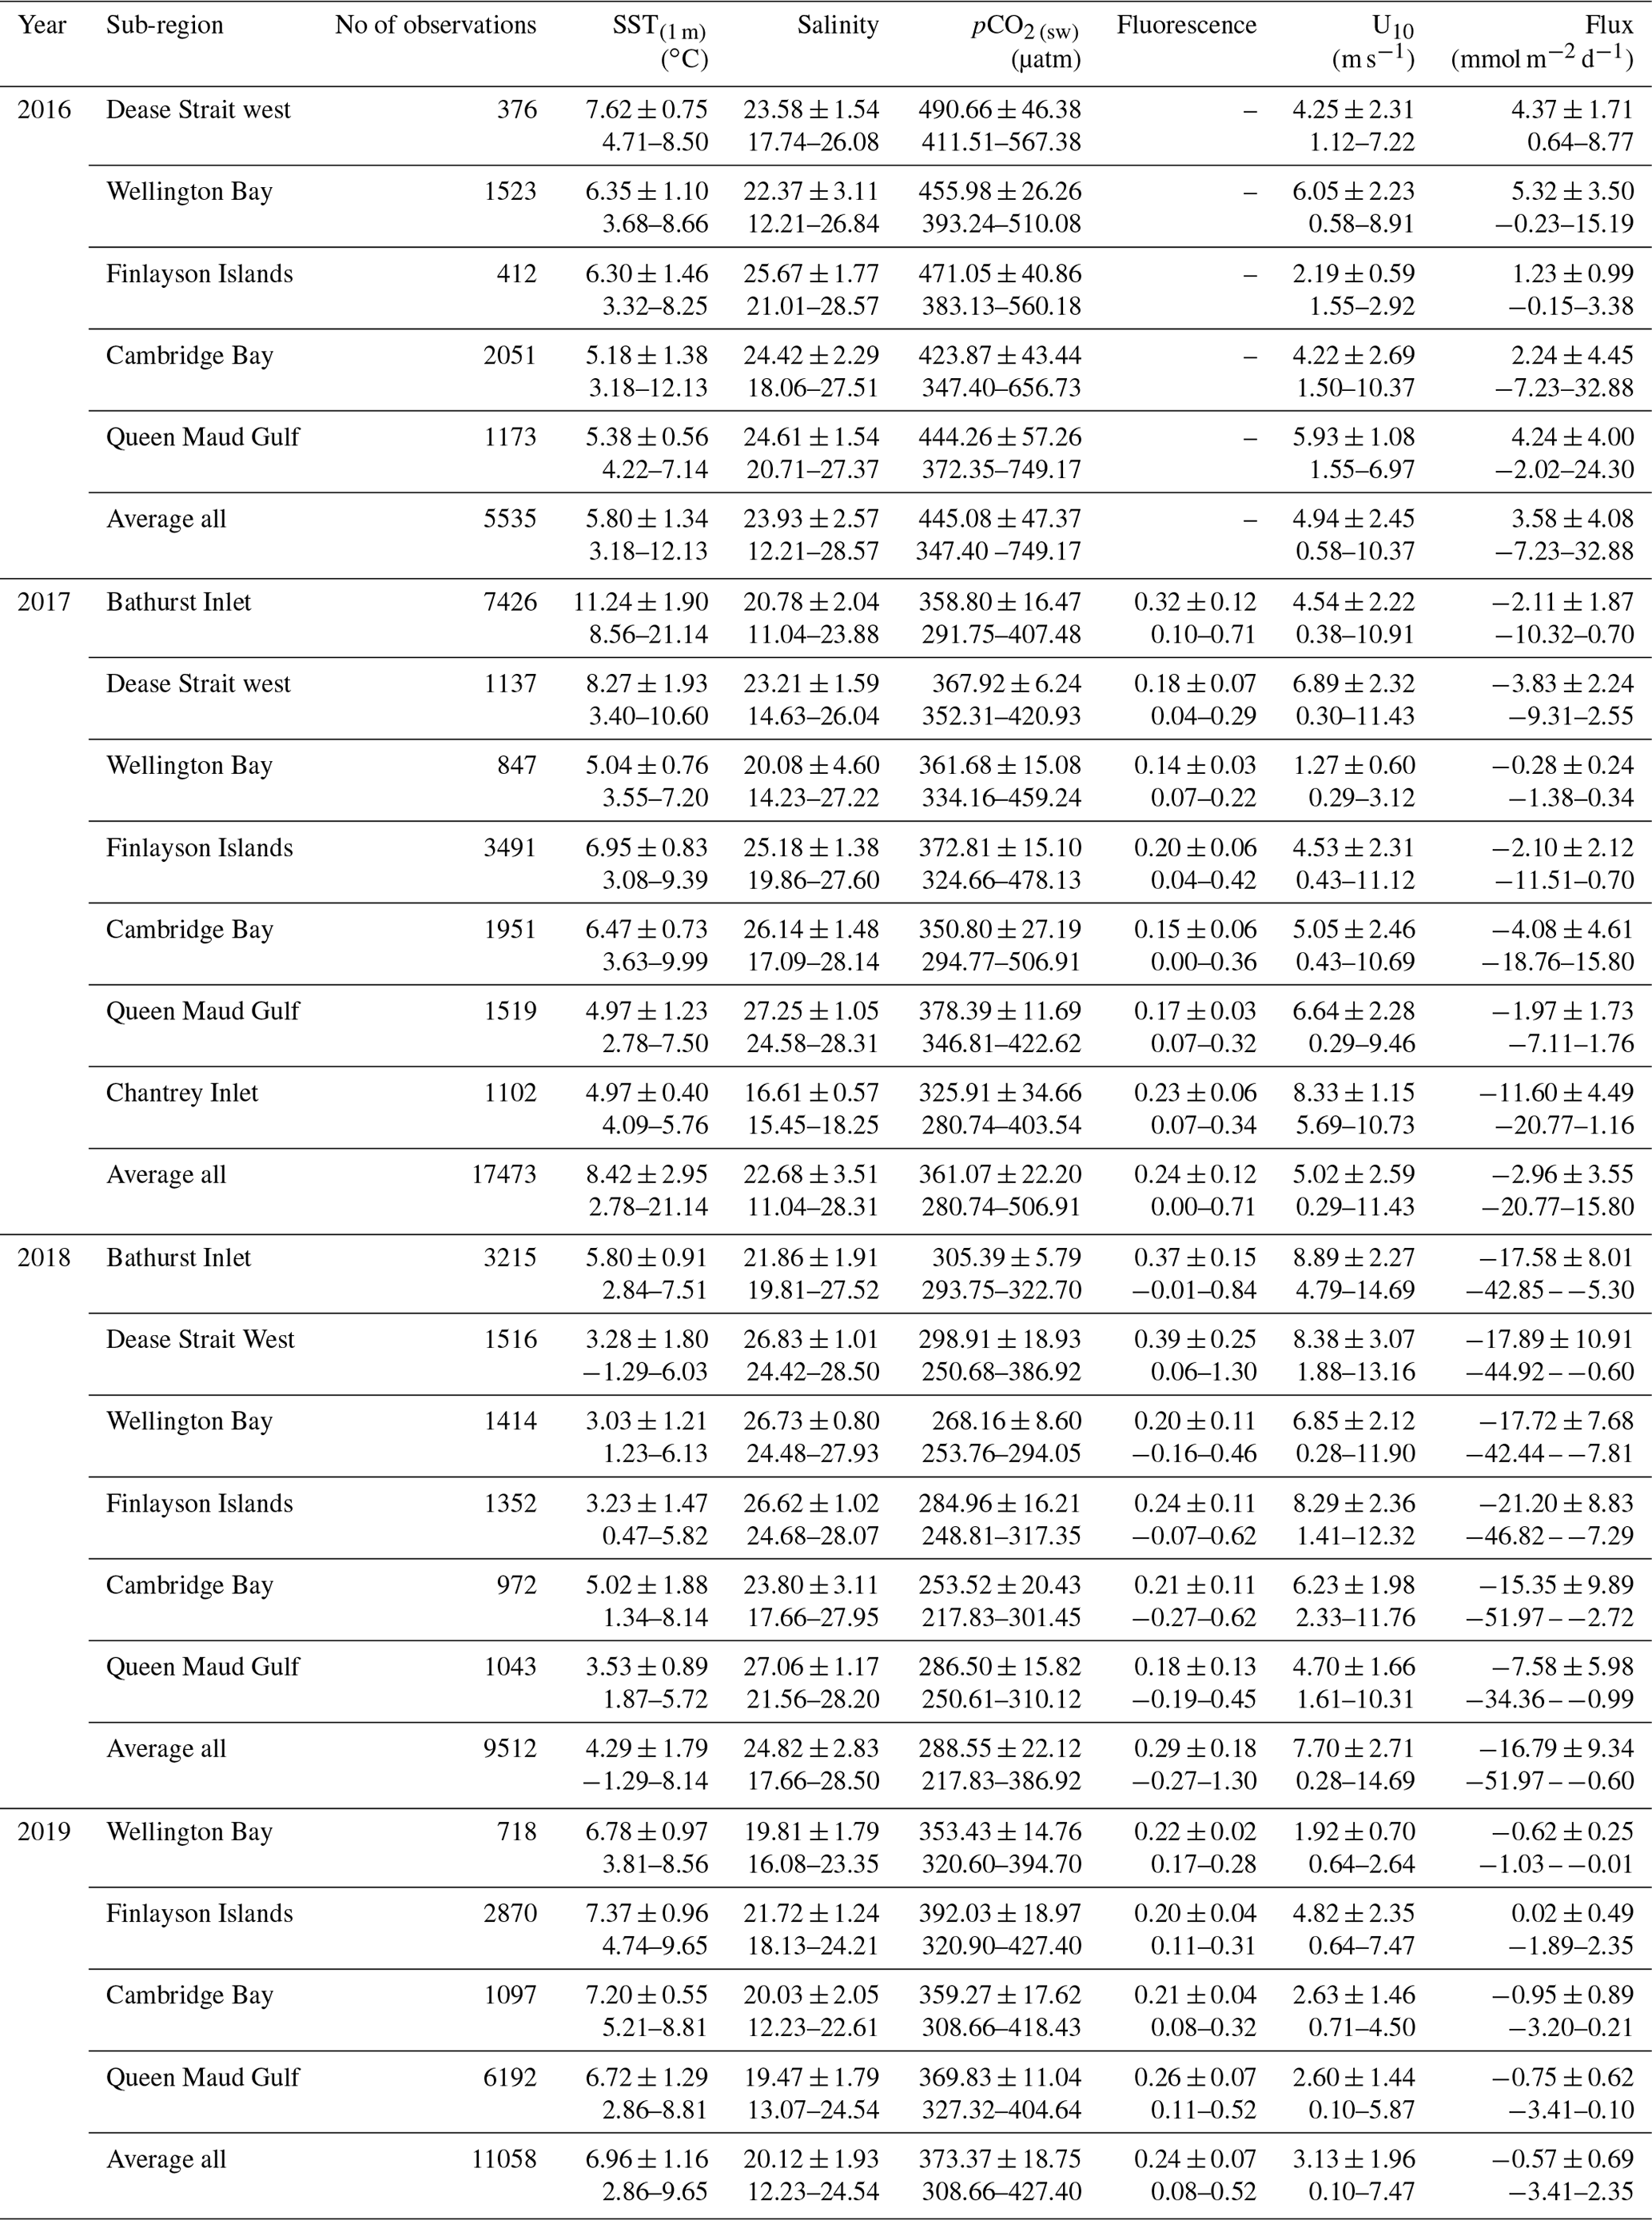
Observations of temperature, salinity, pCO2 (sw), fluorescence, U10, and CO2 flux during the four field seasons are plotted as time series and coloured by the sub-region of the measurement (Fig. 4b–g). Summary statistics (mean, standard deviation, and range) of each variable in each region for all four cruises are presented in Table 1. Plots showing the timing of the cruise track, temperature, salinity, pCO2 (sw), and chlorophyll a fluorescence can be found in the Supplement (Figs. S2 to S6).
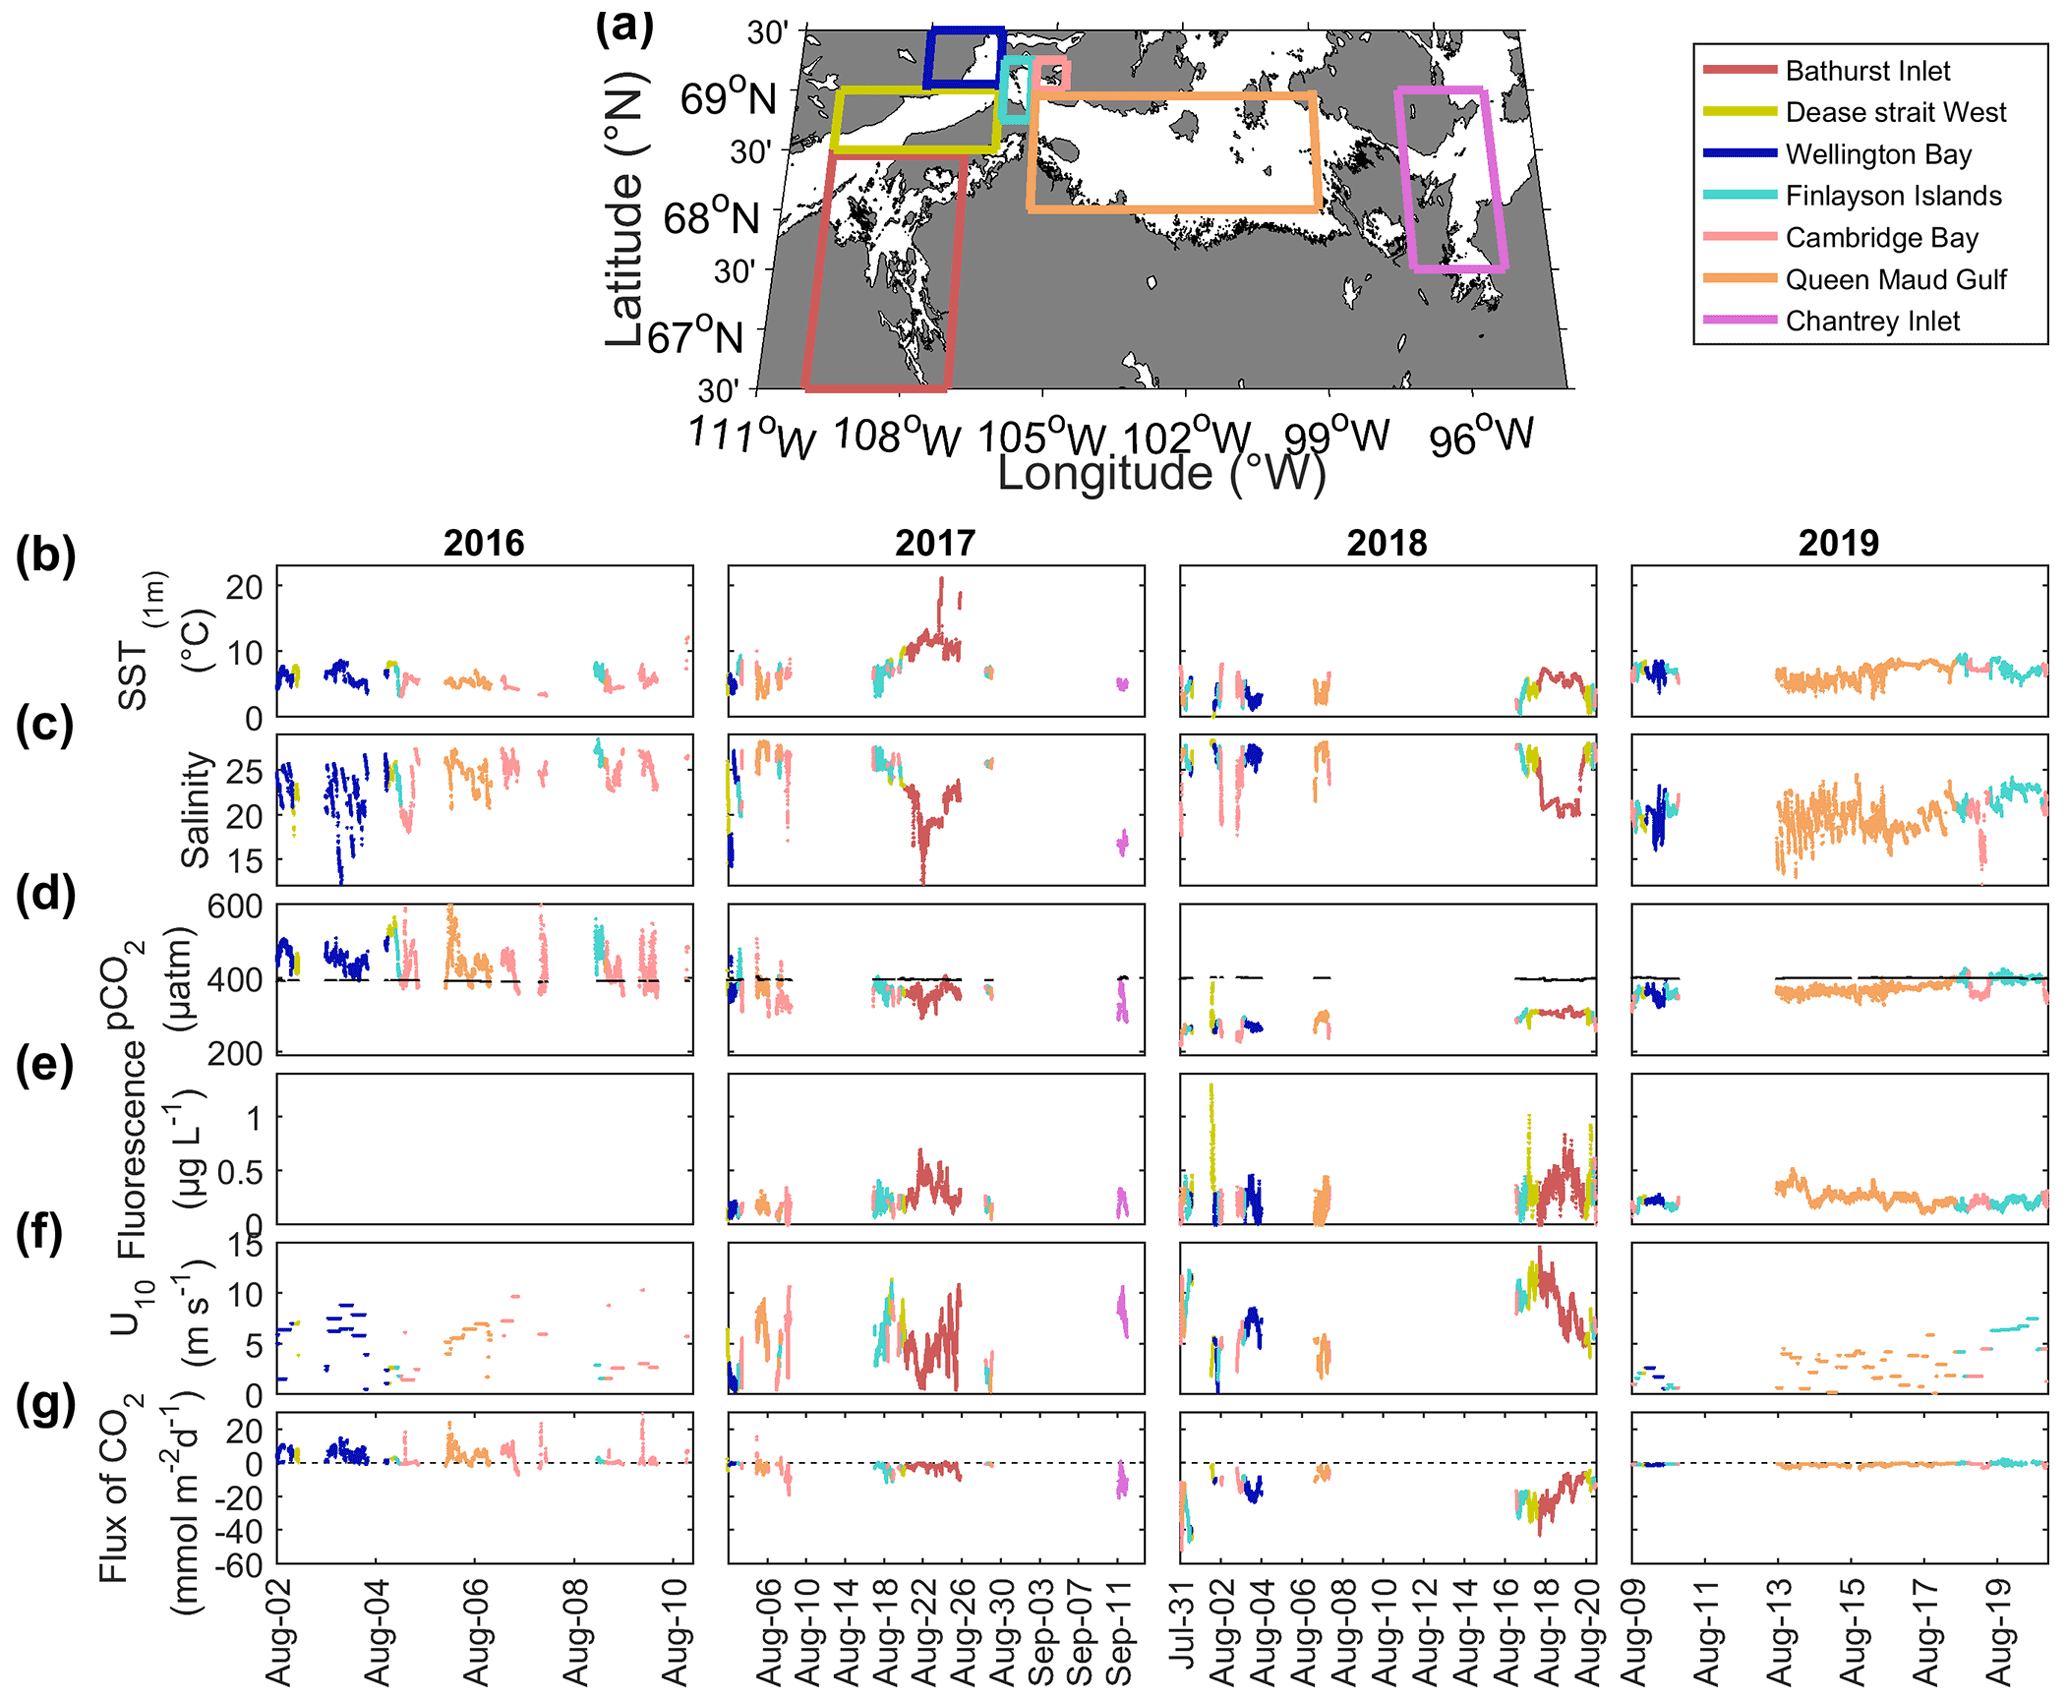
Figure 4(a) Map of Kitikmeot Sea showing the region surveyed by the RV Martin Bergmann between 2016 and 2019. The sampled region was subdivided as described in the main text; these sub-regions are shown as coloured boxes and correspond to the names in the legend. Time series subplots of underway surface ocean (1 m) observations for 2016 through to 2019 of (b) SST(1 m), (c) salinity, (d) pCO2 (sw) (with pCO2 (atm) in black), (e) fluorescence, (f) U10, and (g) flux of CO2 (no flux is indicated by a dashed black line). The time series data are coloured according to the sampling regions in panel (a). The period of measurements was not consistent between years so the date label tick spacing and the range are different between years. Large data gaps correspond to when the ship was in port between cruise legs or data outages. An alternate version of this figure where the y axes are not normalized between years is included in the Supplement (Fig. S7).
SST(1 m) interannual variability was on the order of several degrees (Fig. 4b), for example the SST(1 m) was lowest in 2018 (4.3 ∘C) and highest in 2017 (8.4 ∘C) (Table 1). Inter-region SST(1 m) differences of ∼ 10 ∘C were observed during all four surveys, for example in 2016 the range in SST was 3.18–12.13 ∘C (Table 1). Summertime warming can be observed in the data for certain sub-regions that were visited multiple times, such as the Cambridge Bay in 2016 (SST(1 m) trend of +0.11 ∘C d−1 from 5 to 10 August 2016), or were sampled for a continuous period, such as the Queen Maud Gulf in 2019 (SST(1 m) trend of +0.64 ∘C d−1 from 13 to 19 August 2019) (Fig. 4b). Some of the sub-regions were considerably warmer than others (e.g. Bathurst Inlet was 2.82 ∘C warmer in 2017 and 1.51 ∘C warmer in 2018 compared to the measurement averages for those respective years), whereas other regions were consistently colder (e.g. Queen Maud Gulf was 3.45 ∘C colder in 2017 and 0.76 ∘C colder compared to the measurement averages for those respective years) (Table 1).
There was large interannual variability in surface salinity; for example, average observed salinity in 2019 was 20.12 compared with 24.82 in 2018 (Fig. 4c). Salinity values were much lower in Chantrey Inlet in 2017 (16.61) and Bathurst Inlet in both 2017 (20.78) and 2018 (21.86) relative to the salinities in other regions in those years (Table 1). Salinity ranges on the order of ∼ 10 were observed between regions in all years, for example in 2018 the maximum salinity range was 10.84. The salinity data are marked by rapid changes of ∼ 5 that did not coincide with equivalent temperature changes (Fig. 4c); these salinity transitions are evident in the 2017 and 2018 Bathurst Inlet data, much of the Cambridge Bay data, and the Wellington Bay data from 2016 and 2019. There is evidence of freshening in Wellington Bay from 2 to 4 August 2016 (salinity trend of −0.87 d−1) and in Queen Maud Gulf in 2019 (salinity trend of 0.11 d−1 from the 13 to 19 August 2019), but there does not appear to be a seasonal freshening trend in 2017 or 2018.
There was high interannual pCO2 (sw) variability (Table 1), and average measured pCO2 (sw) was supersaturated (445 µatm) in 2016, undersaturated in 2017 (361 µatm) and 2019 (373 µatm), and highly undersaturated in 2018 (288 µatm) (Fig. 4d). There was also high regional variability in pCO2 (sw) each year; for example, in 2018 pCO2 (sw) ranged from 218 µatm to 387 µatm (Table 1). There were identifiable trends in pCO2 (sw) across all regions in 2018 and 2019 (Fig. 4d); for example, pCO2 (sw) increased by 2.22 µatm d−1 from 31 July to 21 August 2018 and 4.04 µatm d−1 from 9 to 21 August 2019. In all 4 years, Cambridge Bay had lower pCO2 (sw) relative to the other regions; for example, the average pCO2(sw) in Cambridge Bay in 2019 was 359 µatm, whereas the averages in the Finlayson Islands and Queen Maud Gulf were 392 µatm and 370 µatm, respectively (Table 1). Low pCO2 (sw) values were also seen in Bathurst Inlet (e.g. 359 µatm in 2017), Chantrey Inlet (e.g. 326 µatm in 2017) and Wellington Bay (e.g. 268 µatm in 2018) (Table 1) Many low-pCO2 (sw) regions were also low-salinity regions, e.g. Chantrey Inlet and Wellington Bay in 2017 (Table 1). Fluorescence was generally low throughout all the cruises in all years, except for the relatively high fluorescence signal in Bathurst Inlet and around the Finlayson Islands (Fig. 4e). The air–sea CO2 flux (Fig. 4g) reflects the trends in the predictor variables, particularly pCO2 (sw) and U10 (Fig. 4d and f). The air–sea flux calculated in 2016 was 3.58 mmol m−2 d−1, reflecting the fact that the pCO2 (sw) was supersaturated. In 2017 and 2019 surface ocean pCO2 (sw) was quite undersaturated (361 and 373 µatm respectively), the 2017 flux was larger (−2.96 mmol m−2 d−1) than the 2019 flux (−0.57 mmol m−2 d−1) as the wind speed was very low in 2019 (3.1 m s−1). As pCO2 (sw) was highly undersaturated (288 µatm) in 2018, there was a large flux into the ocean −16.79 mmol m−2 d−1.
Table 1Underway surface ocean (1 m) observation summary table for the RV Martin Bergmann cruises from 2016 through 2019. Geographical sub-regions are defined in Fig. 4a. The top row for each item is the mean ± 1 standard deviation, while the bottom row is the measurement range. Table averages are the average of all the observations for each variable for each year and have not been scaled to the spatial extent of each region.
Presented in the results above are the multiyear summertime pCO2 (sw) observations made on RV Martin Bergmann. These data reveal the spatial and interannual variability of pCO2 (sw) throughout the open-water season in the Kitikmeot Sea. To maximize the value of the pCO2 (sw) observations made on RV Martin Bergmann, we will now present and discuss these new measurements alongside previous measurements and in the context of our current understanding of the carbonate system in the region.
4.1 Local scale – comparisons with the ocean carbon observatories
The two local observatories, the ONC mooring in Cambridge Bay and the Qikirtaarjuk Island observatory (Fig. 1), provide measurements throughout the year that are not possible with shipboard observations. The pCO2 (sw) values are directly measured on the ONC mooring, whereas pCO2 (sw) is calculated from the flux derived using measurements from the Qikirtaarjuk Island observatory eddy covariance “EC tower”. Using the pCO2 (sw) observations from these two observatories alongside the new RV Martin Bergmann measurements allows us to construct a multiyear timeline of pCO2 (sw) in the region (Fig. 5). It should be noted that the three measurement sources in Fig. 5 are not co-located, the Qikirtaarjuk Island observatory on the Finlayson Islands is 35 km west of the ONC mooring (Fig. 1) and the Bergmann measurements span a slightly wider area (Fig. 2). Despite the spatial disparity in these measurements, it should be acknowledged that for calculations of global CO2 flux on a grid, the majority of these measurements would fall within the same grid cell. It might be expected that on these sorts of spatial scales the measurements should agree closely, but that is not always the case (Fig. 5).
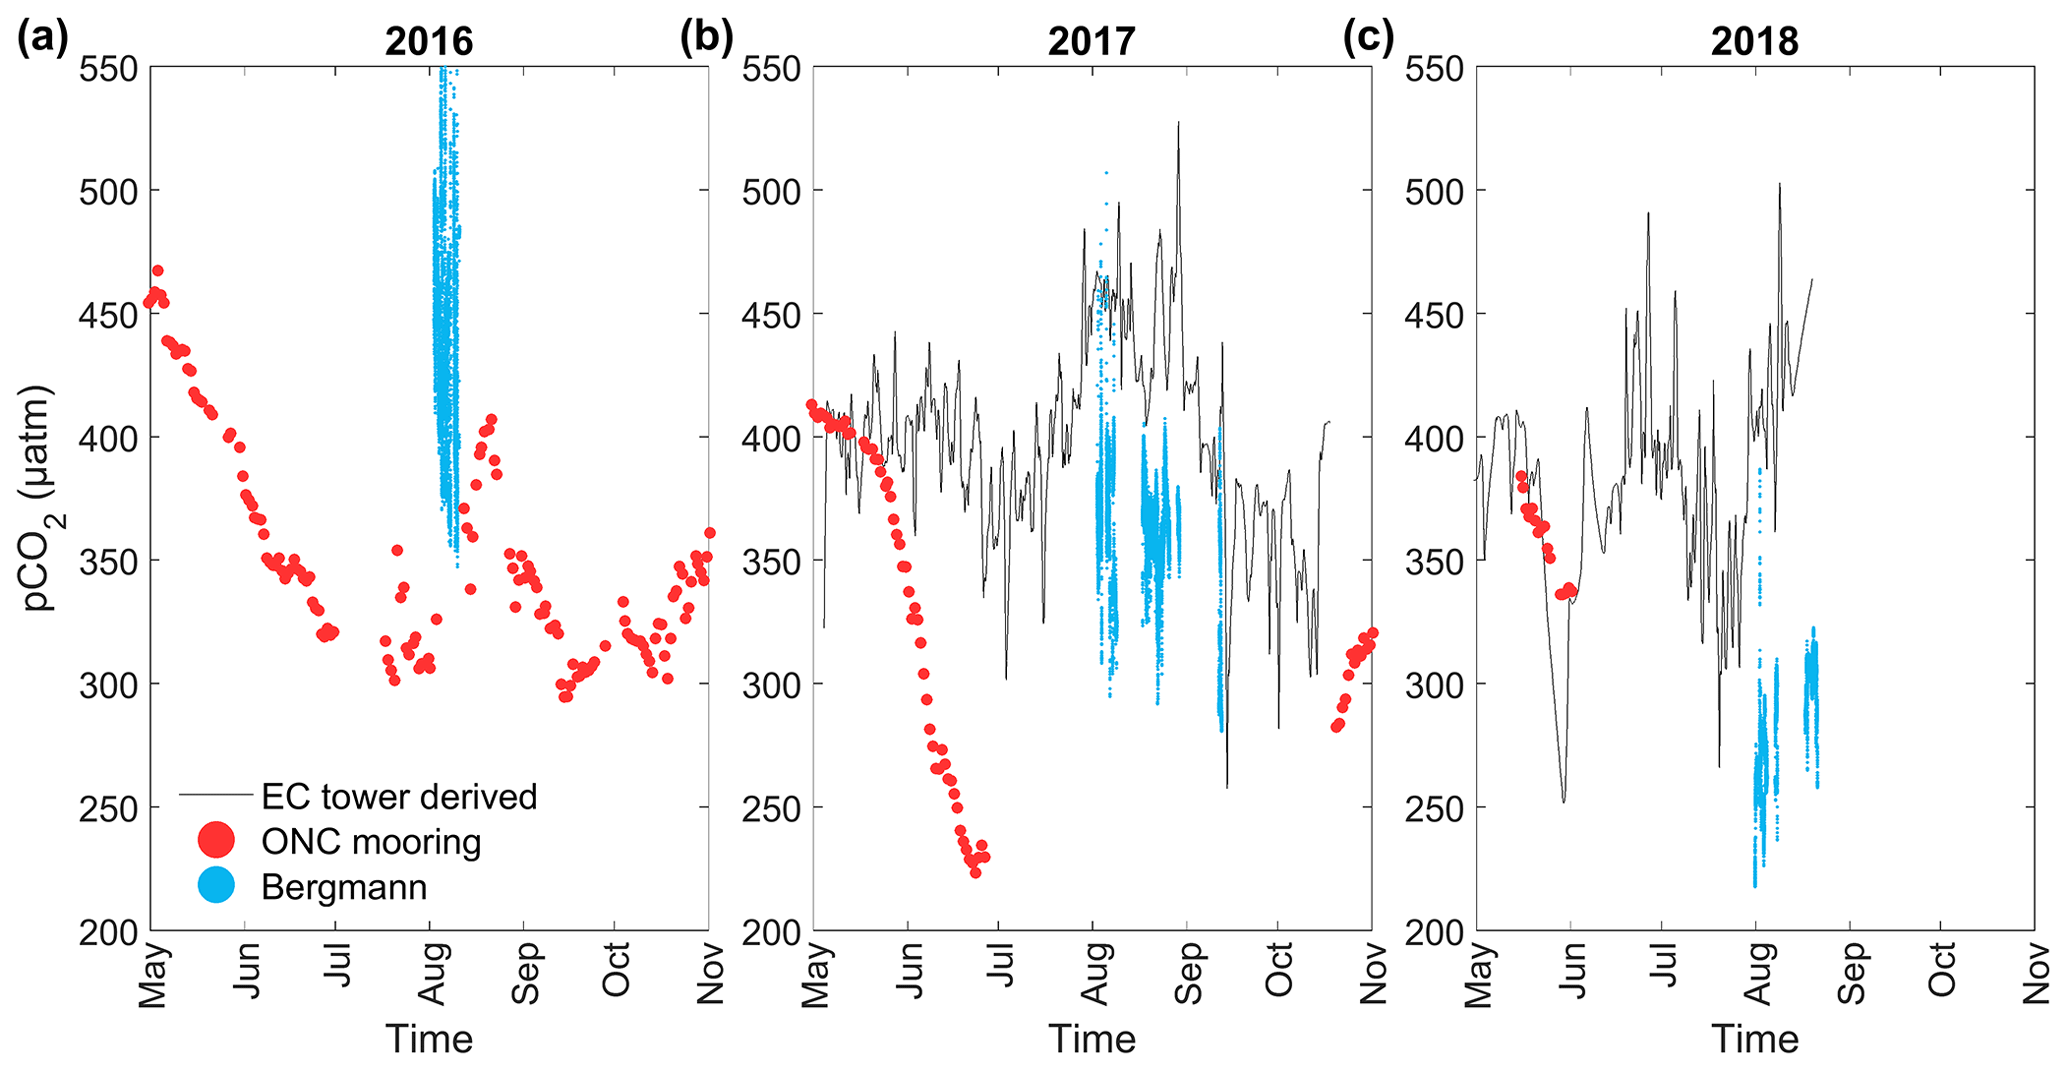
Figure 5Surface pCO2 (sw) from across the Kitikmeot Sea made in (a) 2016, (b) 2017 and (c) 2018. The pCO2 (sw) measurements from the ONC mooring are shown as red dots, all pCO2 (sw) measurements from the RV Martin Bergmann are shown as blue dots and pCO2 (sw) measurements inferred from eddy covariance at the Qikirtaarjuk Island observatory are shown as a black line.
The RV Martin Bergmann pCO2 (sw) data are lower in 2017 (Fig. 5b) and 2018 (Fig. 5c) relative to the values predicted from the EC tower, even when measurements were made in the footprint of the EC tower. For example, from 18:30 to 23:10 on 3 August 2017, pCO2 (sw) from the EC tower was 415 µatm, while from RV Martin Bergmann it was 390 µatm; however, from 05:50 to 06:40 on 1 August 2018, pCO2 (sw) from the EC tower was 409 µatm, while from RV Martin Bergmann it was 262 µatm. Accounting for a thermal skin temperature of 0.17 ∘C in the RV Martin Bergmann data only alters the pCO2 (sw) by about ∼ 3 µatm based on the 4.23 % ∘C−1 Takahashi et al. (1993) constant. For the RV Martin Bergmann pCO2 (sw) to match values from the EC tower, based on the 4.23 % ∘C−1 constant the SST at the surface would need to be 1.46 ∘C greater at the surface on 3 August 2017 and 10.52 ∘C greater at the surface on 1 August 2018 than measured by RV Martin Bergmann at 1 m. Modelling results do not support the existence of temperature differences of a magnitude that can account for the pCO2 (sw) difference on 3 August 2017 (Xu et al., 2021). It is possible that the SST measured from the 13 m mooring that is used to calculate pCO2 is not representative of the surface interface, which would bias the Schmidt number and k0 used in the calculation of pCO2 (sw) from the EC tower; yet, even if this were the case, the magnitude of the impact can not explain the larger pCO2 (sw) differences between the methods (146 µatm). Even though the RV Martin Bergmann measurements are being made close to the surface (at a depth of 1 m), the most likely explanation for the differences in pCO2 (sw) between the two methods is surface stratification in this upper metre. The impact of surface stratification on pCO2 (sw) has been observed elsewhere in the Arctic (Ahmed et al., 2020; Dong et al., 2021b), including for cases where differences can be up to 200 µatm (Miller et al., 2018). Surface stratification in the Kitikmeot Sea is caused by melting of first-year sea ice and the large freshwater input by rivers (rivers alone can contribute an estimated 70 cm of freshwater to the surface annually; Williams et al., 2018). The fact that the EC tower pCO2 (sw) was higher than the RV Martin Bergmann pCO2 (sw) would suggest that this is due to river induced stratification, as Arctic riverine water is typically higher in pCO2 (sw) (Cai et al., 2010), indeed this was true between the 30 June and 2 July 2017 for Freshwater Creek (Manning et al., 2020). Interestingly, the predicted pCO2 (sw) from the EC tower shows a peak in early August 2017 and a downwards trend through to the end of August, something that is also seen in the ship-based pCO2 (sw) observations (Fig. 5b). Similarly, the predicted pCO2 (sw) from the EC tower increases in August 2018 at a similar rate to the increase seen in the shipboard pCO2 (sw) observations (2.22 µatm d−1; Fig. 5c). The fact that similar trends can be observed in the RV Martin Bergmann and the EC tower pCO2 (sw) does suggest that seasonal trends in the region are detectable with both methods. However, the general disagreement between the RV Martin Bergmann measurements and those from the EC tower highlights the need for year-round pCO2 (sw) observations in the flux footprint of the EC tower. Additionally, interfacial pCO2 (sw) measurements and vertical profiles may help reconcile the observed disparities seen between the two measurement sources of data.
There is good agreement in the pCO2 (sw) values between the EC tower and the ONC mooring in May, June and October 2017 (Fig. 5b) and in May and June 2018 (Fig. 5c). The breakdown of stratification at the end of the ice-free summer period and over the winter (Xu et al., 2021) may explain the good agreement between the EC tower and the ONC mooring at these times. In June 2017, the two systems diverge. Specifically, the pCO2 (sw) at the ONC mooring decreases due to a spring bloom (Duke et al., 2021), whereas pCO2 (sw) from the EC tower is not impacted, as the bloom in Cambridge Bay is caused by wastewater discharge (Back et al., 2021) it might be expected that this signal would not detectable at the EC tower.
There appears to be some agreement between the data RV collected by Martin Bergmann and the ONC mooring in the summer of 2016. Unfortunately, the servicing period of the ONC mooring overlapped with the RV Martin Bergmann cruise dates, meaning there was no period of direct overlap between the two data sets. The four periods when the RV Martin Bergmann was moored up within 0.5 km of the mooring were from 5 August 2016 at 05:20 to 5 August 2016 at 11:10, 7 August 2016 at 05:40 to 8 August 2016 at 01:20, 9 August 2016 at 08:20 to 9 August 2016 at 14:30, and 10 August 2016 at 00:50 to 10 August 2016 at 21:40, the average pCO2 (sw) values were 433, 421, 406 and 406 µatm, respectively. pCO2 (sw) at the ONC mooring on 3 August 2016 at 10:00 was 326 µatm, and on 12 August 2016 at 12:40 it was 371 µatm. Disagreement between the ONC mooring and the RV Martin Bergmann here may be due to the different intake depths of the two systems. Stratification may mean the ONC mooring is not always representative of pCO2 (sw) closer to the air–sea interface, especially during parts of ice-free period; however, CTD profiles from 2018 do indicate there is stratification in the surface 10 m in the summer (Back et al., 2021). The spring 2016 measurements from the ONC mooring show that pCO2 (sw) was high in the spring leading into the summer field season, and the trend towards increasing pCO2 (sw) due to warming was captured in August 2016 by both the ONC mooring and the RV Martin Bergmann observations.
Combining the data sources in this way highlights the value of having these different observatories to look at multiyear changes. The observatories provide context to the variability in the summertime pCO2 (sw) measurements from local ships. The intermittence of the measurements from the ONC mooring and the Qikirtaarjuk Island observatory reflects the challenges in making these novel measurements in an extreme environment. Knowledge about how to operate both observatories and prevent instrument outages means that future measurements will build towards much needed continuous and complementary multiyear datasets.
4.2 Regional scales – spatial variability in the underway data
Focusing back on the RV Martin Bergmann data, there is clear evidence of spatial regional variability in the underway data. The pCO2 (sw) values were typically lower by ∼ 20–40 µatm in the small bays (Cambridge Bay, Wellington Bay) and larger inlets surveyed (Bathurst Inlet, Chantrey Inlet) compared to the central channel (e.g. Dease Strait west, the Finlayson Islands and Queen Maud Gulf) (Table 1). The reason for relatively low pCO2 (sw) in the bays and inlets is not readily apparent. Using the 4.23 % ∘C−1 constant from Takahashi et al. (1993) it is possible to test whether the pattern of lower pCO2 (sw) in the bays and inlets was driven by temperature; for a representative 360 µatm value for pCO2 (sw) to be ∼ 20–40 µatm lower it would need to be between 1.35 and 2.78 ∘C colder. Rather than being colder, many of these regions, such as Bathurst Inlet, were warmer, and based on the Takahashi et al. (1993) constant they would thus have a predicted higher pCO2 (sw). Although the fluorescence sensor was not calibrated against in situ measurements, the fluorescence signal was consistent with previous measurements that showed the region to have widespread low primary production at the surface (Martin et al., 2013). In spite of the lack of high surface chlorophyll a concentrations, biological production at depth cannot be ruled out as an explanation for lower pCO2 (sw) in the bays. For example, wastewater discharge has been shown to cause a deep (20–30 m) chlorophyll bloom in Cambridge Bay (Back et al., 2021). A large under-ice (Arrigo et al., 2012; Mundy et al., 2009) or ice edge (Perrette et al., 2011) phytoplankton bloom earlier in the season could also explain lower summertime pCO2 (sw) values in these bays and inlets. It is also possible that these regional differences are driven by regional freshwater inputs; all four identified regions are fed by rivers and there are sharp salinity transitions of ∼ 5 that point to the existence of mixing and fronts (Fig. 4c). Rivers are typically thought to be highly supersaturated in pCO2 (sw) in the Arctic due to organic matter breakdown (Teodoru et al., 2009), potentially contributing to higher pCO2 (sw) in these bays and inlets. However, whilst local rivers are high in pCO2 (sw) (Manning et al., 2020), they are typically unbuffered and thus have much lower DIC relative to seawater. Whilst the average values for riverine TA (565 µmol kg−1) and DIC (533 µmol kg−1) in the CAA are low, maximum measured values for TA (2272 µmol kg−1) and DIC (2252 µmol kg−1) can be as high or higher than in seawater, depending on the bedrock type underlying the drainage basin (Brown et al., 2020). Dilution by ice meltwater that is low in pCO2 (sw) does lower pCO2 (sw) (Cai et al., 2010; Meire et al., 2015), so it may be that sea ice meltwater in these bays and inlets may be contributing to the lower observed pCO2 (sw).
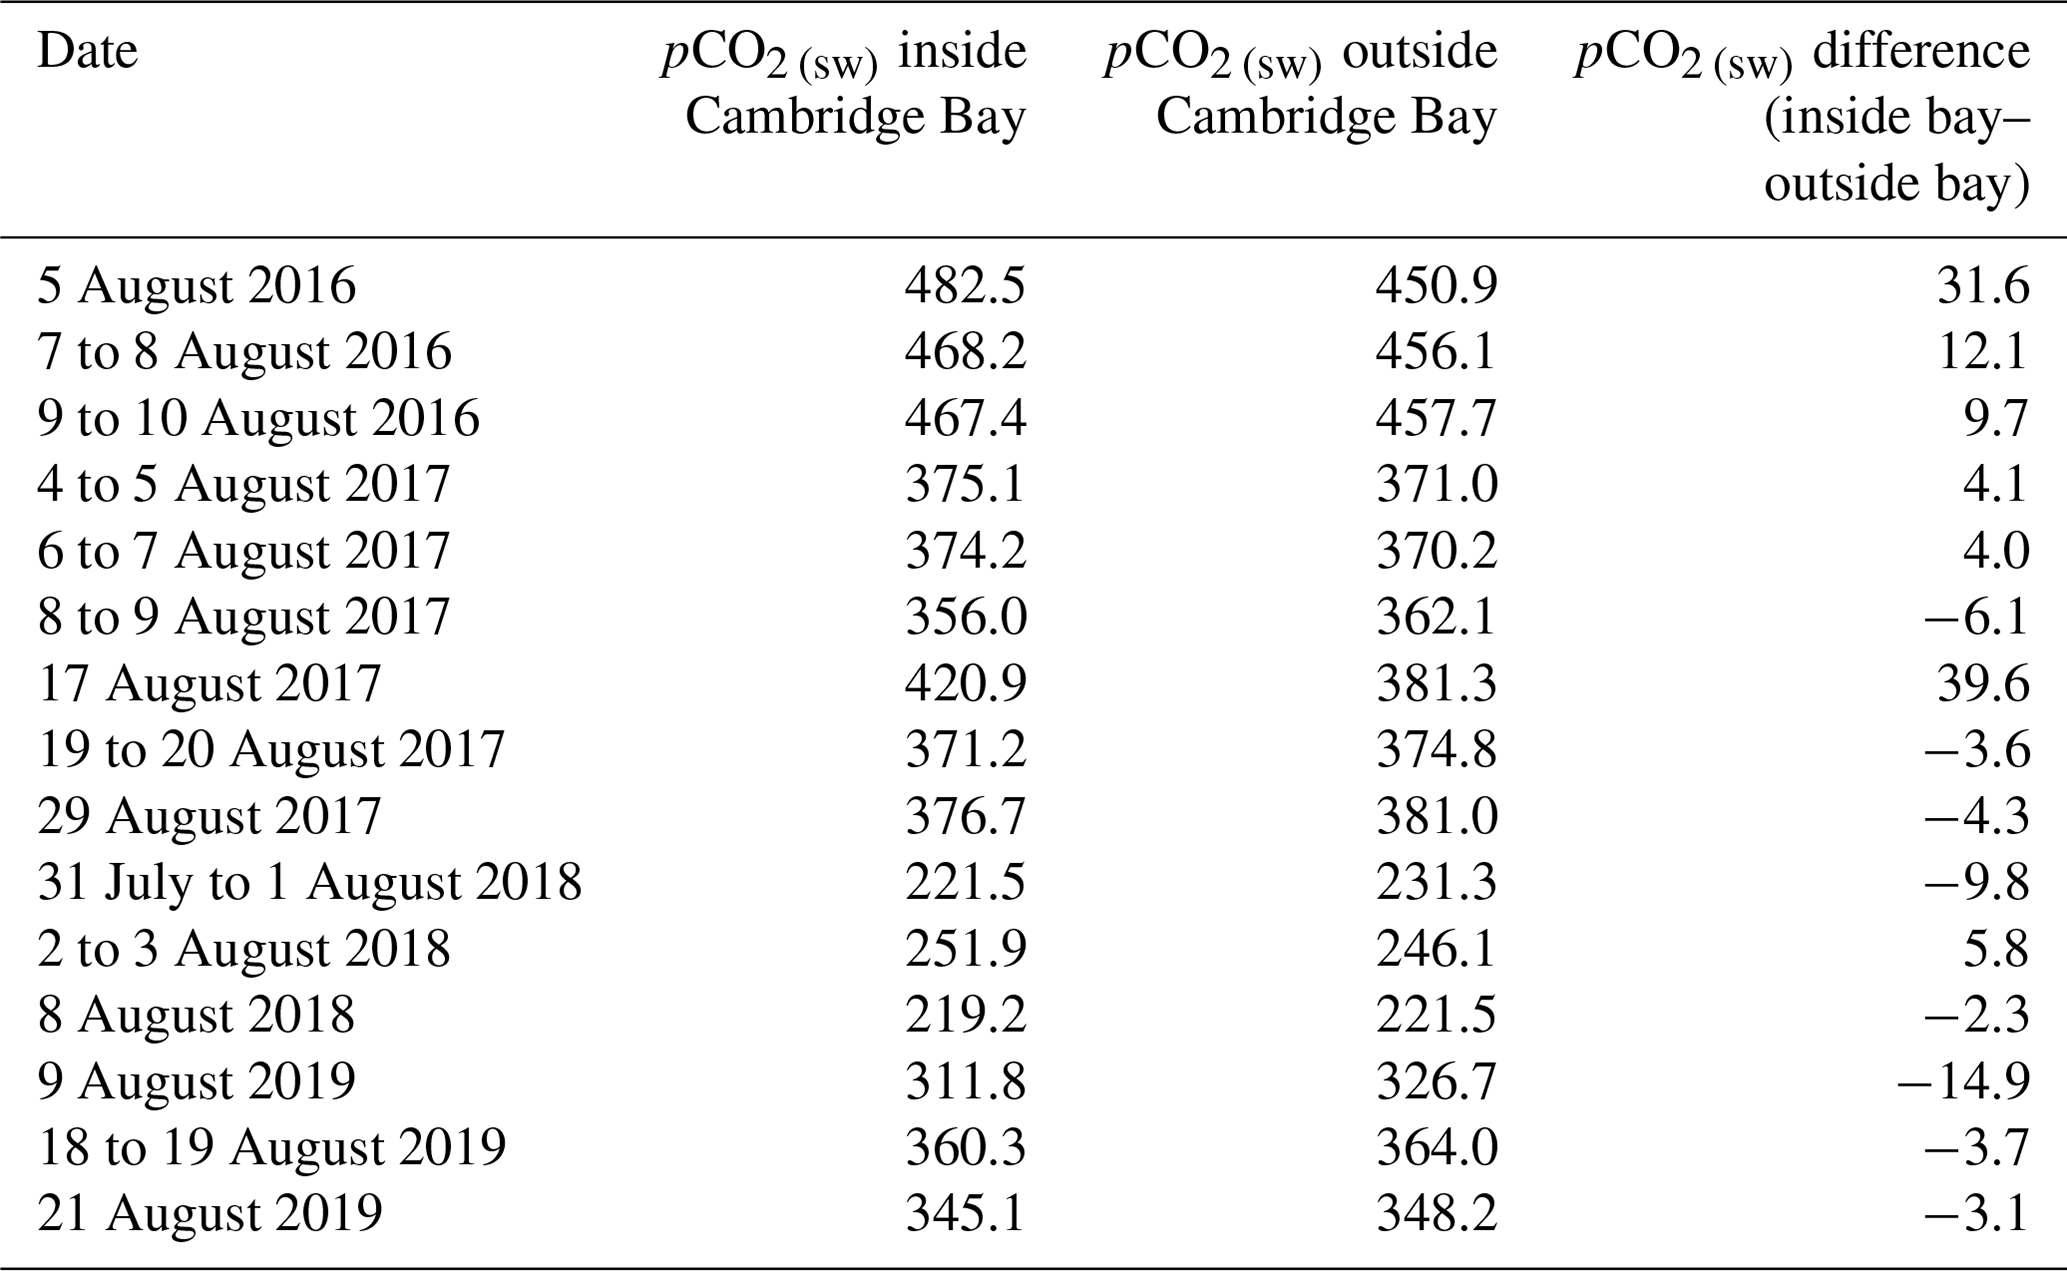
The ONC mooring is located in Cambridge Bay in shallow water (sensor depth 7 m). At this depth the mooring is not impacted by the Freshwater Creek plume, which is detectable at < 2 m (Duke et al., 2021; Manning et al., 2020). It is still unclear how much of an impact being located in the bay has on the representativeness of these measurements for the Kitikmeot region. As the RV Martin Bergmann travelled into and out of the bay multiple times during the 4 years of observations, differences in pCO2 (sw) measured in the bay and outside the bay may help identify whether the ONC mooring site is representative of the region as a whole. All transects into and out of Cambridge Bay are shown in Fig. 6. Two sub-regions are designated, inside the bay and outside the bay; here pCO2 (sw) from the RV Martin Bergmann was averaged every 2 d for which there were data available (Table 2). As seen in Table 2, pCO2 (sw) was similar (typically <± 15 µatm) inside and outside of the bay. On 17 August 2017, pCO2 (sw) was much higher (39.6 µatm) in the bay. As measurements are similar before (8–9 August 2016) and after (19–20 August), it would appear that this difference is caused by a process only occurring in the bay and possibly related to the river plume. Overall, the agreement between the measurements inside and outside of the Bay is encouraging and suggests that pCO2 (sw) in Cambridge Bay at least broadly agrees with that in the main channel. Without more information, it is difficult to conclude whether the mooring is truly representative of the wider Kitikmeot Sea.
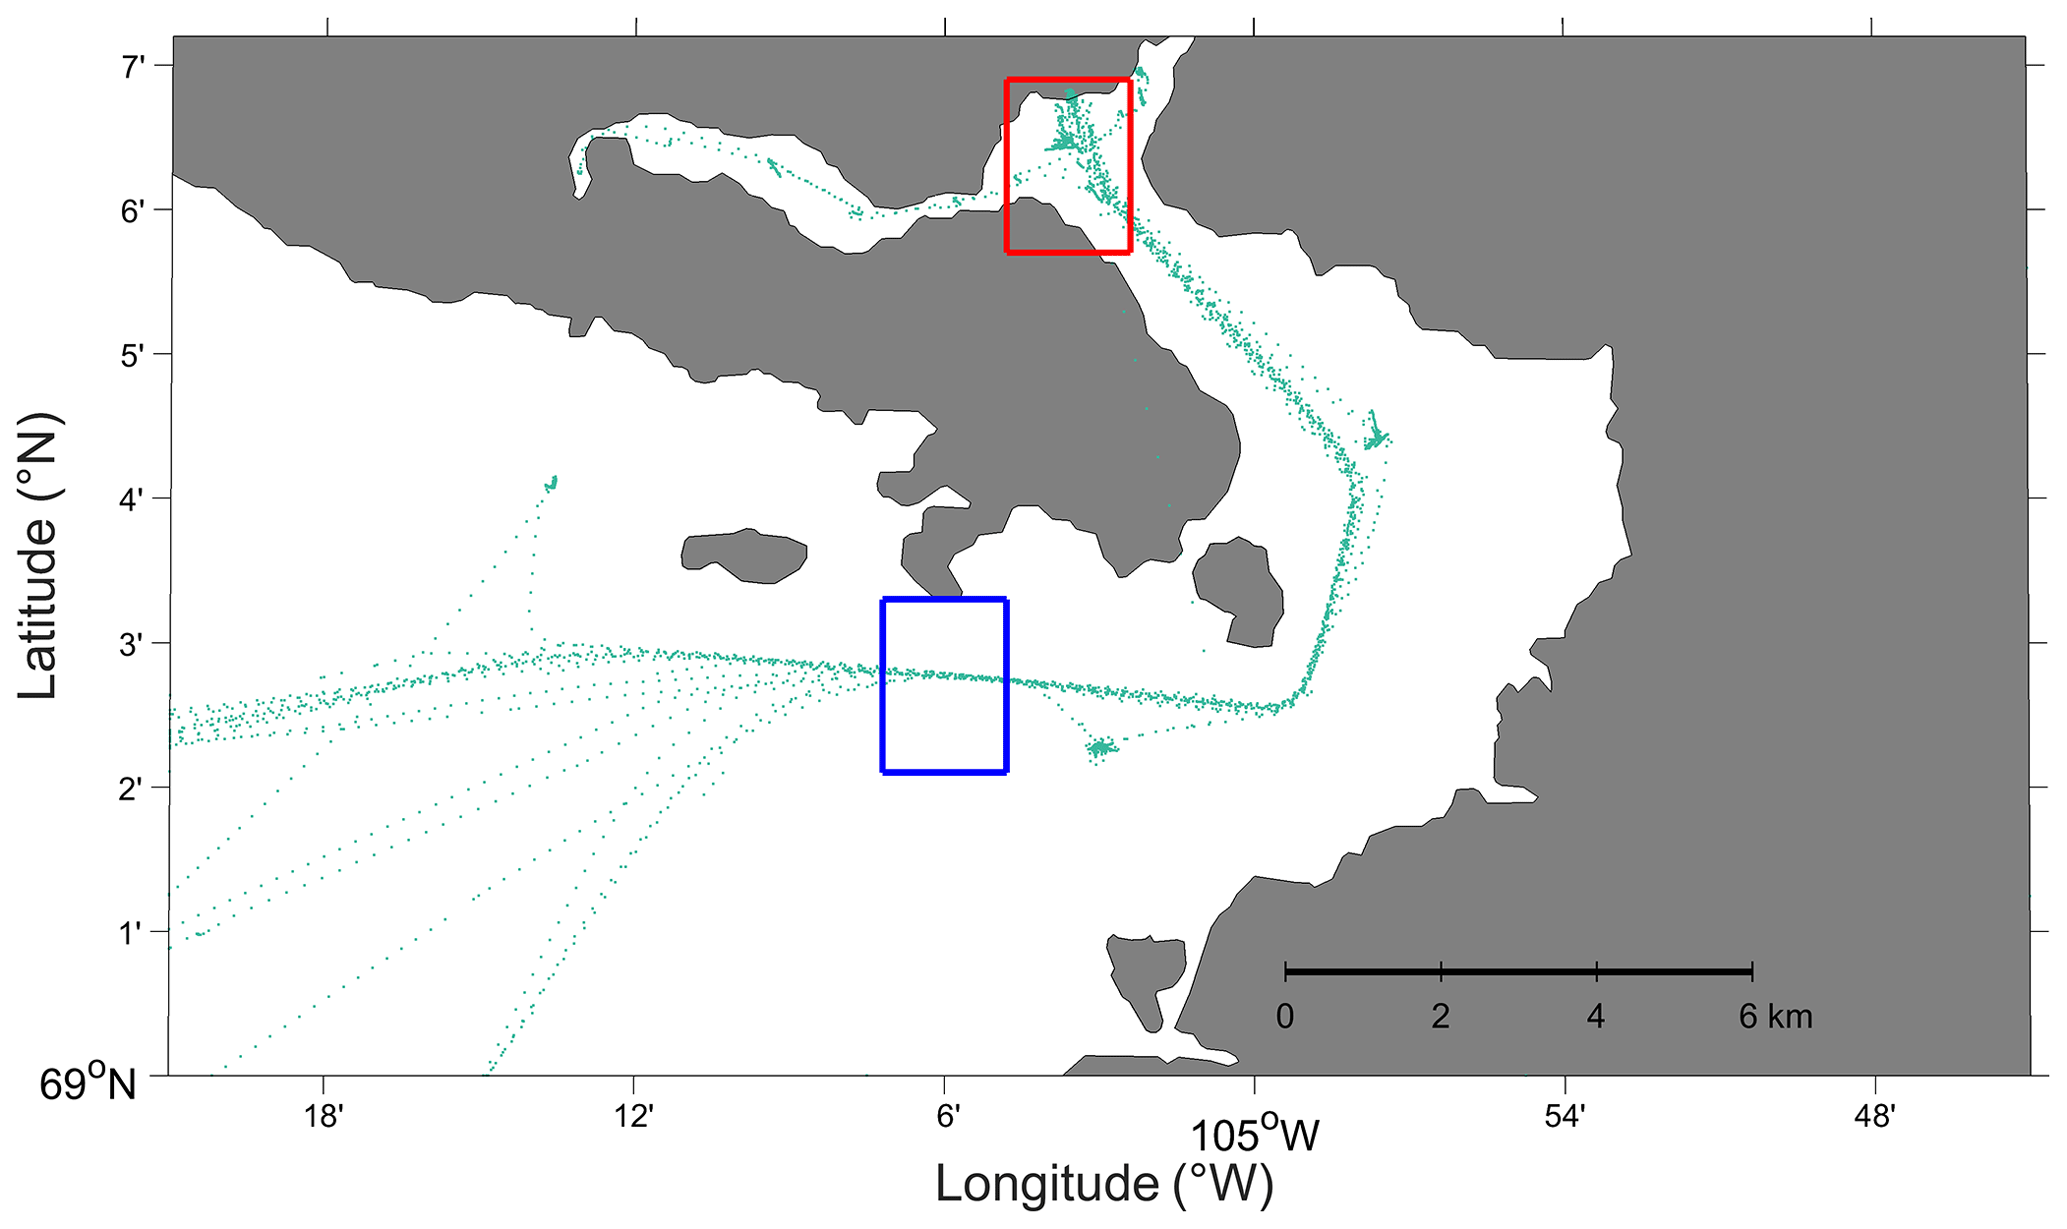
Figure 6Zoomed in view showing the location of all the pCO2 (sw) transects (green) measured in and out of Cambridge Bay during the 4 years of transects. The regions used to define regions inside the bay and outside the bay are shown as a red and blue box, respectively.
Table 2Average pCO2 (sw) measured by the RV Martin Bergmann inside and outside of Cambridge Bay.
4.3 Interannual variability and large-scale seasonal trends
We have identified local-scale differences between the pCO2 (sw) values from the RV Martin Bergmann, the ONC and the Qikirtaarjuk Island observatories and regional scales differences between the bays and inlets and the main channel. However, large differences in the RV Martin Bergmann pCO2 (sw) values occurred between years. The measurement start date of all four cruises spanned a very short window of 10 d (2 August 2016, 2 August 2017, 31 July 2018, 9 August 2019). Ahmed et al. (2019) have established the importance of the timing of sea ice breakup on pCO2 (sw) values in the CAA. During our study, ice breakup began ∼ 2–6 weeks before the start of these cruises (4 July 2016, 22 June 2017, 15 July 2018, 14 July 2019), which we interpret as exerting one of the main controls on the interannual variability in the RV Martin Bergmann pCO2 (sw) data.
The very low pCO2 (sw) values (289 µatm) observed in 2018 (Table 1) could be caused by a combination of low SST(1 m), springtime CO2 depletion by primary production, and recent dilution by sea ice melt (Else et al., 2012; Ahmed et al., 2021; Geilfus et al., 2015) or river runoff (Cai et al., 2010), yet we cannot say with certainty which of these processes was most important in producing these low pCO2 (sw) values. As the ice breakup was late in 2018 (resulting in samples collected shortly after breakup), it can be assumed that surface ocean CO2 exchange with the atmosphere was limited by the ice cover until just before these measurements were made, as sea ice is essentially impermeable to gases (Loose et al., 2011; Butterworth and Else, 2018). Additionally, the presence of sea ice through to the end of July in 2018 meant there was far less warming of the surface seawater (average SST(1 m)=4.32 ∘C); this explanation rules out surface cooling lowering SST(1 m) and thus pCO2(sw). Light penetrating through sea ice between March and June could have driven primary production below and within the ice (Else et al., 2019). Indeed, an increase in under-ice chlorophyll a concentration, together with a draw-down of surface nutrients between April to June 2018, indicates under-ice phytoplankton production during this period (Dalman et al., 2019). However, chlorophyll a concentrations did not exceed 0.6 µg L−1, as production is limited by surface nutrient availability in the region (Back et al., 2021). It is likely that the melting sea ice stratified the surface and diluted surface pCO2 (sw) as has been observed in other parts of the Arctic (Miller et al., 2018; Ahmed et al., 2020); low surface ocean salinity values in the first weeks of the survey support this. Measurements several weeks into the 2018 cruise show that pCO2 (sw) increased quickly in the following weeks (to ∼ 300 µatm), likely due to a combination of air–sea exchange and the observed surface warming. Interestingly, Ahmed et al. (2019) did not observe pCO2 (sw) values below 300 µatm at any point during the 5 years of passing through the Kitikmeot Sea. Therefore, 2018 could be an anomalously low year for pCO2 (sw) or the discrepancy could highlight the fact that Ahmed et al. (2019) did not make any measurements immediately after sea ice breakup in this region. Furthermore, the discrepancy could be influenced by the difference in sampling depth of the two pCO2 systems between the CCGS Amundsen (7 m) and RV Martin Bergmann (1 m). The best way to assess the impact of the sampling depth would be to take simultaneous measurements via the ships intake and at the interface as in Ho and Schanze (2020).
The processes driving the changes in pCO2 (sw) that have been discussed above can be partially quantified using back of the envelope calculations with several assumptions. The individual impact on pCO2 (sw) of dilution by melting sea ice, air–sea gas exchange, net community production (NCP) and warming of seawater are explored across the region for the month of August in 2018.
Firstly, the impact of dilution by sea ice melt can be tested by assuming conservative mixing of TA, DIC and salinity as in (Meire et al., 2015). For the seawater mixing endmember, surface TA (2034.43 µmo kg−1) and DIC (1958.82 µmol kg−1), SST (−1.38 ∘C), and salinity (28.64) are taken from seawater bottle data on 18 June 2018 (Duke et al., 2021) alongside surface silicate (4 µmol L−1) and phosphate (0.5 µmol L−1) from 2018 (Back et al., 2021). Average values from spring 2019 for TA (356.60 µmol kg−1), DIC (340.24 µmol kg−1) and salinity (4.56) in first-year sea ice are used for the sea ice mixing endmember (Else et al., 2022). Taking a sea ice thickness of 1.8 m and assuming water expands 10% when it freezes to form sea ice would suggest melting all the sea ice would add 1.64 m of water to reach the final salinity of 24.82 (the average recorded value from the RV Martin Bergmann measurements) and conservation of salinity would require this freshwater to be mixed with 8.68 m of seawater. The ratio of these two depths can then be used to provide the predicted TA (1768.26 µmol kg−1) and DIC (1702.05 µmol kg−1) for the seawater at a salinity of 24.82. Using CO2SYS v1.1 (Lewis et al., 1998; Van Heuven et al., 2011; Sharp et al., 2020) the calculated pCO2 (sw) value for the initial seawater condition is 369 µatm, and after the melting of sea ice pCO2 (sw) is 302 µatm. The dissociation constants of carbonic acid used in the CO2SYS calculations were those by Mehrbach (1973) and refit by Dickson and Millero (1987), and the HSO dissociation constants were from Dickson (1990). For these calculations temperature was kept constant. As the average measured pCO2 was 289 µatm in 2018, sea ice melt and conservative mixing of seawater can account for the majority (66.75 µatm) of the total change in pCO2 (80 µatm) from the initial seawater conditions in 2018.
Secondly, using the same approach as DeGrandpre et al. (2020) an estimate of the individual and combined impact of air–sea exchange and NCP on pCO2 (sw) can be made using a simple model with the following assumptions: an average flux from the 2018 cruise of −16.79 mmol m−2 d−1; a 40 m mixed-layer depth for Dease Strait (Xu et al., 2021), with a density of 996.49 kg m−3 from SST (−1.38 ∘C) and salinity (28.64); and an upper estimate of NCP (6.63 g C m−2), which is the average integrated rate for Cambridge Bay during the open water season of 2018 (Back et al., 2021). With this configuration a change in DIC (+0.0176 µmol kg−1 h−1) due to air–sea exchange and NCP (−0.003 µmol kg−1 h−1) can be calculated. Taking the combined change in DIC (+0.0142 µmol kg−1 h−1) and substituting it into CO2SYS (Van Heuven et al., 2011; Lewis et al., 1998) with the same initial TA, DIC, silicate and phosphate concentrations as on the 18 June 2018 produces a pCO2 (sw) change of 0.0459 µatm h−1. Scaling this DIC change for the month of August with no other changes in the system would increase pCO2 (sw) by 36.31 µatm (with NCP component reducing pCO2 (sw) by 9.4 µatm, and the air–sea exchange component would increase pCO2 (sw) by 47.34 µatm).
Thirdly, using the 4.23 % ∘C−1 Takahashi et al. (1993) constant, the impact of the 0.078 ∘C d−1 warming trend on pCO2 (sw) can be calculated for the 22 d period from 31 July to 22 August 2018. Using the average pCO2 (sw) value of 289 µatm and SST(1 m) of 4.32 ∘C, an increase in temperature of 1.72 ∘C would predict a pCO2 (sw) of 310 µatm. This increase of 21.78 µatm is less than the 22 d increase of 48.84 µatm based on the 2.22 µatm d−1 trend in the 2018 RV Martin Bergmann data. From this, the impact of warming can account for just under half of the change in pCO2 (sw), and the rest of the increase in pCO2 (sw) could be due to air–sea gas exchange.
To summarize, modelling the processes impacting pCO2 (sw) can account for much of the observed changes in pCO2 (sw) in 2018. Sea ice melt can account for a 66.75 µatm decrease in pCO2 (sw), which is equivalent to 83 % of the observed change. The warming of seawater by 1.72 ∘C in the first 22 d of August would increase pCO2 (sw) by 21.78 µatm. Air–sea gas exchange can account for a 47.34 µatm increase in pCO2 (sw) in the month of August (34.72 µatm if scaled to the first 22 d). NCP can account for a 9.4 µatm decrease in pCO2 (sw) in August (−6.7 µatm if scaled to the first 22 d). The actual observed change in pCO2 (sw) in the first 22 d of August was 48.77 µatm, which is extremely close to the combined pCO2 (sw) change from these three processes 48.68 µatm.
While not as heavily undersaturated as in 2018, pCO2 (sw) was still undersaturated with respect to atmospheric values in both 2017 and 2019. In these 2 years, measurements were made ∼ 4–8 weeks after sea ice breakup and pCO2 (sw) values were in the ∼ 350–390 µatm range. Having been ice free for longer, SST(1 m) was 3–4 ∘C warmer in 2017 and 2019, which accounts for much of the pCO2 (sw) difference relative to 2018. Increased SST(1 m) in 2017 and 2019 and a gradual increase in surface salinity in 2019 mirror the seasonal trends seen in Ahmed et al. (2019) where the CAA becomes saltier and warmer over the summer. The 2017 and 2019 pCO2 (sw) values are similar but still slightly lower than the pCO2 (sw) values observed in Coronation Gulf by Ahmed et al. (2019), which again likely reflects the slightly earlier sampling period of this study, where undersaturated surface waters that have recently become ice free have not had long to equilibrate with the atmosphere or warm up.
Measured pCO2 (sw) was much higher in 2016 (445.08 µatm) compared to 2017 and 2019 around 4 weeks after sea ice breakup. Ahmed et al. (2019) also observed similar pCO2 supersaturation (464.5 µatm) in the region in 2016 when they made their observations ∼ 2 weeks later. pCO2 (sw) supersaturation requires either the upwelling of high pCO2 (sw) deep waters, net heterotrophy, or for pCO2 (sw) to be close to equilibrium with the atmosphere and then for the seawater to subsequently warm (Chierici et al., 2011). The most plausible of these is the warming of the surface waters. However, if SST(1 m) variability was the main factor controlling pCO2 (sw), it is not apparent why there would be supersaturation in 2016 but not in 2017 and 2019, which were both warmer years. The sea ice breakup time in 2016 was similar to both 2017 and 2019, suggesting that the timing of breakup was also not the only determining factor. We propose that the high pCO2 (sw) values observed in 2016 may point to the importance of surface pCO2 (sw) values set in the previous autumn and wintertime modulation of pCO2 (sw). To determine what processes are altering pCO2 (sw) between summertime field seasons would require year-round sampling or a biogeochemical model run over multiple years, which are outside of the scope of this paper.
Clearly, many interacting processes are involved in determining surface ocean pCO2 (sw) values in the Kitikmeot Sea, and as such predicting surface ocean pCO2 (sw) in this region is difficult. Ahmed et al. (2019) proposed a model for pCO2 (sw) in the CAA as a function of weeks since ice breakup, their model underestimated pCO2 (sw) in the Kitikmeot Sea by ∼ 26 µatm, which they suggest may be due to the influence of rivers. Following their approach, the surface pCO2 (sw), SST, and salinity measurements from this study are presented as a function of time since ice melt (when sea ice concentration declines below 85 %; Fig. 7). The RV Martin Bergmann observations are broadly consistent with the general pCO2 model of Ahmed et al. (2019), where low pCO2 (sw) values (∼ 300 µatm) are seen shortly after sea melt and higher values (∼ 300–350 µatm) are seen in the 2 months after sea ice melt. However, the 2016 pCO2 (sw) values are much higher and the 2018 values are much lower than predicted by the model. The model is also not a good predictor of the observed salinity values in 2016 and 2019. The CAA flux estimate (Ahmed and Else, 2019) determined using the Ahmed et al. (2019) model remains the best estimate for the region. However, the model is clearly unable to capture the full interannual variability in the RV Martin Bergmann observations. This could be because as a CAA-wide model it is not tuned to the Kitikmeot Sea where freshwater inputs are greater. Fitting a quadratic equation to the RV Martin Bergmann pCO2 (sw) observations produces the following equation: pCO2 (sw)=-1.7452(X2) + 26.0281(X) + 272.7442 which can be used to model pCO2 (sw), where X is weeks since ice breakup. Both models predict very similar pCO2 (sw) in the first 7 weeks after sea ice breakup; the average difference between the models for this period is 8.01 µatm. The models differ more after 7 weeks after sea ice breakup. At 14 weeks after sea ice breakup, the model of Ahmed et al. (2019) predicts a pCO2 (sw) that is 81.2 µatm higher than the model fit to the RV Martin Bergmann pCO2 (sw) observations. Fundamentally, understanding the drivers of the large interannual variability in pCO2 (sw) seen in the Kitikmeot Sea requires an understanding of the interconnected processes involved and their timing. The interannual variability SST(1 m) and salinity are comparable to the modelling results of Xu et al. (2021). Expanding on that modelling work with a complex biogeochemical model that can incorporate all the known processes impacting pCO2 (sw) may make it possible to accurately reproduce the pCO2 (sw) observations in this region.
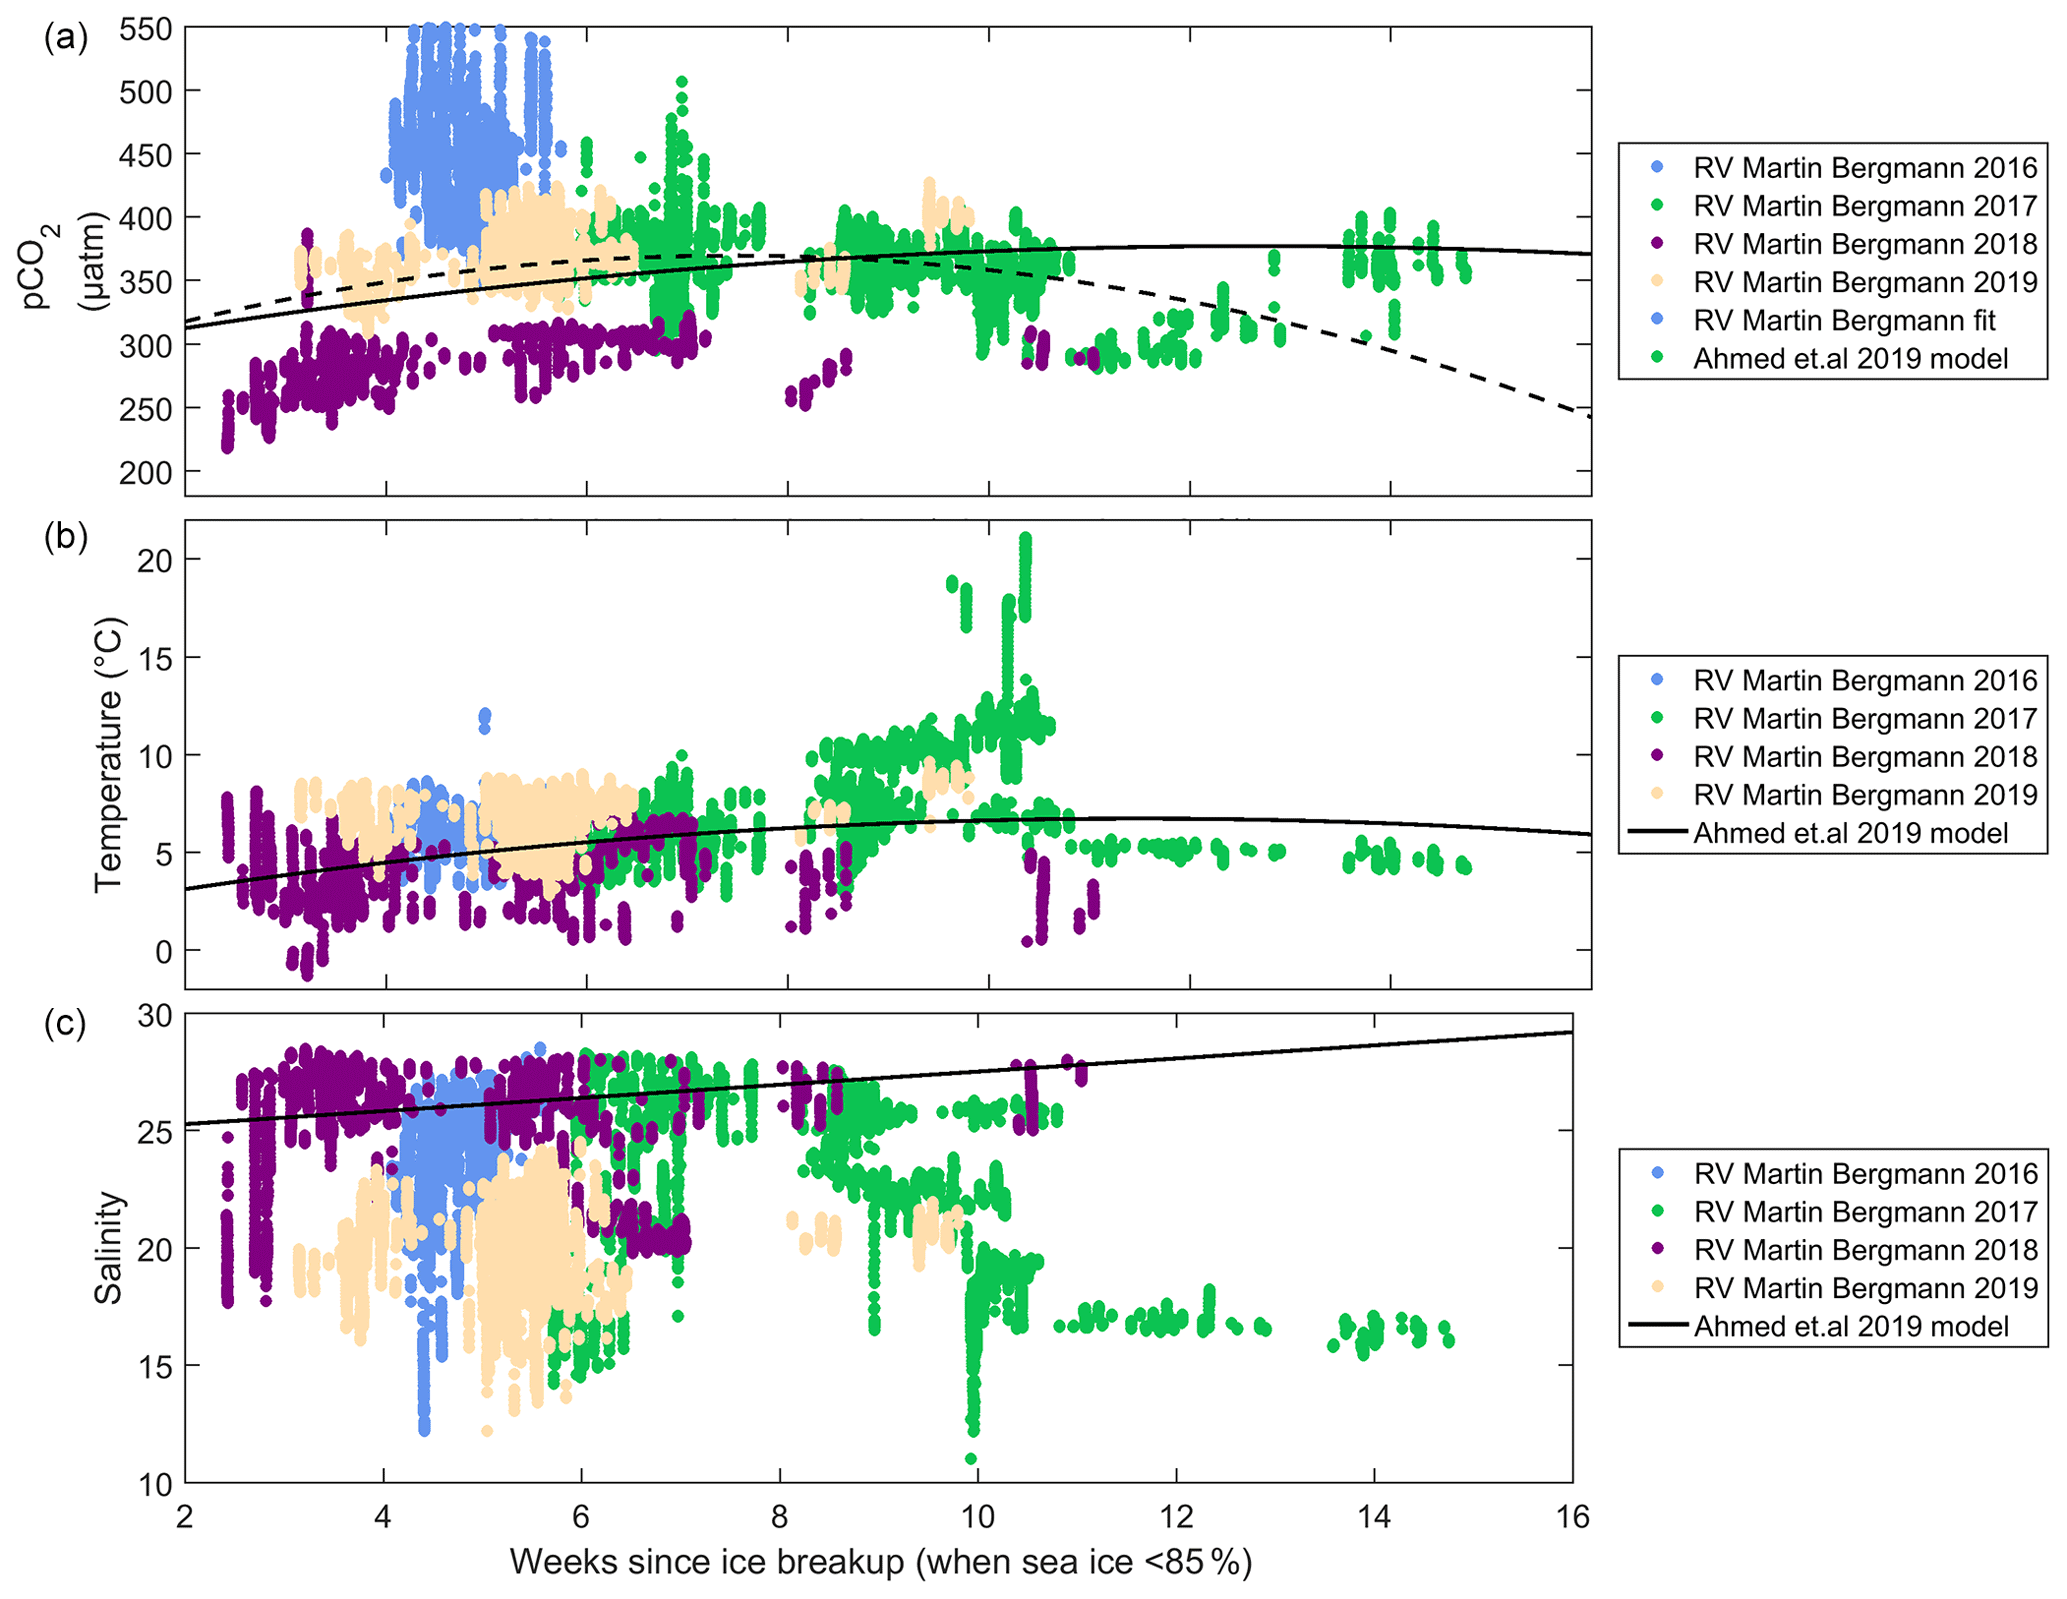
Figure 7Surface (a) pCO2 (sw), (b) SST and (c) salinity from the RV Martin Bergmann as a function of weeks of open water for the years 2016 to 2019. A quadratic fit to the RV Martin Bergmann pCO2 (sw) data is shown as a dashed black line. Black curves represent the model output of Ahmed et al. (2019).
4.4 The Kitikmeot Sea as a sink for atmospheric CO2
The RV Martin Bergmann pCO2 (sw) measurements indicate that the region is a CO2 sink in early August in most years (Table 1). At sea ice breakup, SST(1 m) values are low and there are large ΔpCO2 gradients between the surface ocean and the atmosphere, and these conditions persist for several weeks after sea ice breakup. Warming of the surface ocean is the likely cause of pCO2 (sw) supersaturation in some years, resulting in the region becoming a net source later in the season. Decreasing SST(1 m) at the end of the ice-free season lowers pCO2 (sw), producing a second period when there are larger ΔpCO2 gradients between the ocean and the atmosphere; this is partially identifiable in the RV Martin Bergmann measurements from late in 2017. The size of the CO2 sink throughout the summer, appears not only to be driven by time since ice breakup but also by the absolute surface ocean pCO2 (sw) value at the time of ice breakup. Ahmed and Else (2019) used remote sensing products to identify this region as a net sink when the flux is integrated over the full ice-free period, and our measurements corroborate these findings.
The large variability in pCO2 (sw) measured in the 4 years of observations highlights the fact that in the Arctic single cruises in only part of the ice-free season are likely not capturing the full seasonal variability. Many pCO2 (sw) observations in the Arctic are temporally biased towards the middle of the ice-free season when moving vessels through the Arctic Ocean is easiest. As these single cruises are the only measurements in many of these regions in databases like SOCAT (Bakker, 2016), they could result in biased regional flux estimates. In particular, it should be acknowledged that the majority of the CAA is not included in the state-of-the-art observation-based products (Landschützer et al., 2020).
The ONC mooring and EC tower both provide similar pCO2 (sw) values in spring and autumn, showing good agreement between the two platforms. Measured pCO2 (sw) from the EC tower was sometimes similar to what was measured from the RV Martin Bergmann, whereas at other times it was much higher. Similar seasonal trends, which are likely related to temperature, were seen in pCO2 (sw) from the EC tower and the RV Martin Bergmann. Comparing measurements collected by the RV Martin Bergmann in and out of Cambridge Bay indicates that Cambridge Bay surface ocean pCO2 (sw) is similar to that in Dease Strait in August.
The Kitikmeot Sea was a CO2 sink or a very weak CO2 source over the summers of 2016–2019, consistent with previous measurements from Ahmed and Else (2019). The CO2 sink was highly variable from year to year at the beginning of August (average observed fluxes of +3.58, −2.96, −16.79 and −0.57 mmol m−2 d−1 during the 2016, 2017, 2018, and 2019 cruises, respectively) with average pCO2 (sw) as low as 288.55 µatm and as high as 445.08 µatm. The pCO2 (sw) values were much lower in 2018 due to the much lower SST(1 m) that year. The magnitude of the air–water ΔpCO2 throughout the summer appears to be controlled by the absolute pCO2 (sw) value at the time of ice breakup. Low pCO2 (sw) values increase in August due to exchange with the atmosphere and warming broadly following the predicted trends using the model developed by Ahmed et al. (2019). In years where pCO2 (sw) is high when ice breakup occurs, warming can cause a period of slight pCO2 (sw) supersaturation in summer, in these situations the magnitude of this supersaturation is likely moderated by the air–sea flux reducing pCO2 (sw). pCO2 (sw) was found to be ∼ 20–40 µatm lower in the bays and inlets that were surveyed; this could be driven by increased freshwater inputs into these isolated regions. Lower pCO2 in the bays and inlets would represent an observational bias in the CAA-wide surveys (Ahmed et al., 2019). Local freshwater fluxes into the southern CAA are much greater than elsewhere in the CAA, meaning that this bias might be more prominent in the Kitikmeot Sea. Further observations in these regions may complement the basin-level pCO2 mapping.
These findings provide a more nuanced picture of the considerable interannual variability in pCO2 (sw) observed during repeat cruises in the same region, underscoring how much may be missed by relying on data collected during one-off cruises along the dynamic Arctic coasts. In particular, the pCO2 (sw) at the time of ice melt is very important as it dictates the magnitude and direction of the flux for much of the ice-free period; however, a better understanding of pCO2 (sw) through the ice-covered period is needed to help unravel the seasonal and interannual variability.
The processed underway data from the RV Martin Bergmann, which are the new data described in this paper, are available in the Supplement as MAT files. The raw and processed underway data from the RV Martin Bergmann data are available via Zenodo (Sims, 2023a). The final processed data will also be submitted to the Surface Ocean Carbon Atlas (SOCAT). The wind data and inferred seawater pCO2 data from the EC tower are included in the Supplement as MAT files. The AMSR2 sea ice data https://seaice.uni-bremen.de/sea-ice-concentration/amsre-amsr2/ (Spreen et al., 2008), the NCEP winds https://psl.noaa.gov/data/gridded/data.ncep.reanalysis2.html (Kanamitsu et al., 2002) and the atmospheric pCO2 data from Barrow that were used in this paper are all freely available from their online repositories; literature citations are provided in the main text. Processing code and the code needed to reproduce the figures was written in MATLAB 2016a. The code is provided in the Supplement and is also freely available at Zenodo (Sims, 2023b).
The supplement related to this article is available online at: https://doi.org/10.5194/os-19-837-2023-supplement.
This paper was written by RPS, and all co-authors made contributions to the final paper. BGTE installed the underway system at the start of each field season. The performance of the underway system was monitored by BTGE with help from SFJ, SFG, KAB, PJD and RPS. RPS organized and processed the data. RPS made the figures and interpreted the results with support from MA and BTGE. BJB analysed the data from the EC tower and provided that data for this paper. PJD provided the data from the ONC mooring. BGTE, KAB, CJM and WJW were central in planning the cruise programme. BTGE oversaw completion of the work.
The contact author has declared that none of the authors has any competing interests.
Publisher's note: Copernicus Publications remains neutral with regard to jurisdictional claims in published maps and institutional affiliations.
Parts of this research were completed on or adjacent to Inuit Owned Lands under the authority of the Nunavut Land Claim Agreement, and the work was licensed by the Nunavut Research Institute. We thank the Ekaluktutiak Hunters and Trappers Organization and the community of Cambridge Bay for their hospitality and support of this project. We thank Polar Knowledge Canada and the Canadian High Arctic Research Station for their support and for providing accommodation and vehicles during field campaigns. We thank the captain and crew of the RV Martin Bergmann for all their assistance. We also thank Shawn Marriott and Francis Emingak for all their assistance in the field and Sophia Ahmed for her work on data interpretation. Data from Ocean Networks Canada was accessed under their Creative Commons CC-BY 4.0 License.
This research has been supported by the Marine Environmental Observation Prediction and Response Network (grant no. 1-02-02-004.1), the Kitikmeot Sea Science Study (K3S), Fisheries and Oceans Canada, the Arctic Research Foundation, Natural Sciences and Engineering Research Council of Canada (grant no. RGPIN-2015-04780), the Canada Foundation for Innovation (John R. Edwards Leaders Fund (grant no. 34814)), the University of Calgary Eyes High postdoctoral fellowship programme and Polar Knowledge Canada (Northern Scientific Training Programme).
This paper was edited by Mario Hoppema and reviewed by Wiley Evans and one anonymous referee.
Ahmed, M. and Else, B. G.: The Ocean CO2 Sink in the Canadian Arctic Archipelago: A Present-Day Budget and Past Trends Due to Climate Change, Geophys. Res. Lett., 46, 9777–9785, https://doi.org/10.1029/2019GL083547, 2019.
Ahmed, M., Else, B., Burgers, T., and Papakyriakou, T.: Variability of surface water pCO2 in the Canadian Arctic Archipelago from 2010 to 2016, J. Geophys. Res.-Ocean., 124, 1876–1896, https://doi.org/10.1029/2018JC014639, 2019.
Ahmed, M. M., Else, B. G., Capelle, D., Miller, L. A., and Papakyriakou, T.: Underestimation of surface pCO2 and air-sea CO2 fluxes due to freshwater stratification in an Arctic shelf sea, Hudson Bay, Elementa, 8, 084, https://doi.org/10.1525/elementa.084, 2020.
Ahmed, M. M., Else, B. G., Butterworth, B., Capelle, D. W., Guéguen, C., Miller, L. A., Meilleur, C., and Papakyriakou, T.: Widespread surface water pCO2 undersaturation during ice-melt season in an Arctic continental shelf sea (Hudson Bay, Canada), Elementa, 9, 00130, https://doi.org/10.1525/elementa.2020.00130, 2021.
Arrigo, K. R., Perovich, D. K., Pickart, R. S., Brown, Z. W., Van Dijken, G. L., Lowry, K. E., Mills, M. M., Palmer, M. A., Balch, W. M., and Bahr, F.: Massive phytoplankton blooms under Arctic sea ice, Science, 336, 1408, https://doi.org/10.1126/science.1215065, 2012.
Back, D.-Y., Ha, S.-Y., Else, B., Hanson, M., Jones, S. F., Shin, K.-H., Tatarek, A., Wiktor, J. M., Cicek, N., and Alam, S.: On the impact of wastewater effluent on phytoplankton in the Arctic coastal zone: a case study in the Kitikmeot Sea of the Canadian Arctic, Sci. Total Environ., 764, 143861, https://doi.org/10.1016/j.scitotenv.2020.143861, 2021.
Bakker, D. C. E., Pfeil, B., Landa, C. S., Metzl, N., O'Brien, K. M., Olsen, A., Smith, K., Cosca, C., Harasawa, S., Jones, S. D., Nakaoka, S., Nojiri, Y., Schuster, U., Steinhoff, T., Sweeney, C., Takahashi, T., Tilbrook, B., Wada, C., Wanninkhof, R., Alin, S. R., Balestrini, C. F., Barbero, L., Bates, N. R., Bianchi, A. A., Bonou, F., Boutin, J., Bozec, Y., Burger, E. F., Cai, W.-J., Castle, R. D., Chen, L., Chierici, M., Currie, K., Evans, W., Featherstone, C., Feely, R. A., Fransson, A., Goyet, C., Greenwood, N., Gregor, L., Hankin, S., Hardman-Mountford, N. J., Harlay, J., Hauck, J., Hoppema, M., Humphreys, M. P., Hunt, C. W., Huss, B., Ibánhez, J. S. P., Johannessen, T., Keeling, R., Kitidis, V., Körtzinger, A., Kozyr, A., Krasakopoulou, E., Kuwata, A., Landschützer, P., Lauvset, S. K., Lefèvre, N., Lo Monaco, C., Manke, A., Mathis, J. T., Merlivat, L., Millero, F. J., Monteiro, P. M. S., Munro, D. R., Murata, A., Newberger, T., Omar, A. M., Ono, T., Paterson, K., Pearce, D., Pierrot, D., Robbins, L. L., Saito, S., Salisbury, J., Schlitzer, R., Schneider, B., Schweitzer, R., Sieger, R., Skjelvan, I., Sullivan, K. F., Sutherland, S. C., Sutton, A. J., Tadokoro, K., Telszewski, M., Tuma, M., van Heuven, S. M. A. C., Vandemark, D., Ward, B., Watson, A. J., and Xu, S.: A multi-decade record of high-quality fCO2 data in version 3 of the Surface Ocean CO2 Atlas (SOCAT), Earth Syst. Sci. Data, 8, 383–413, https://doi.org/10.5194/essd-8-383-2016, 2016.
Bates, N. and Mathis, J.: The Arctic Ocean marine carbon cycle: evaluation of air-sea CO2 exchanges, ocean acidification impacts and potential feedbacks, Biogeosciences, 6, 2433–2459, https://doi.org/10.5194/bg-6-2433-2009, 2009.
Brown, K. A., Williams, W. J., Carmack, E. C., Fiske, G., François, R., McLennan, D., and Peucker-Ehrenbrink, B.: Geochemistry of small Canadian Arctic Rivers with diverse geological and hydrological settings, J. Geophys. Res.-Biogeo., 125, e2019JG005414, https://doi.org/10.1029/2019JG005414, 2020.
Butterworth, B. J. and Else, B. G. T.: Dried, closed-path eddy covariance method for measuring carbon dioxide flux over sea ice, Atmos. Meas. Tech., 11, 6075–6090, https://doi.org/10.5194/amt-11-6075-2018, 2018.
Cai, W.-J., Chen, L., Chen, B., Gao, Z., Lee, S. H., Chen, J., Pierrot, D., Sullivan, K., Wang, Y., and Hu, X.: Decrease in the CO2 uptake capacity in an ice-free Arctic Ocean basin, Science, 329, 556–559, https://doi.org/10.1126/science.1189338, 2010.
Chierici, M., Fransson, A., Lansard, B., Miller, L. A., Mucci, A., Shadwick, E., Thomas, H., Tremblay, J., and Papakyriakou, T. N.: Impact of biogeochemical processes and environmental factors on the calcium carbonate saturation state in the Circumpolar Flaw Lead in the Amundsen Gulf, Arctic Ocean, J. Geophys. Re.-Ocean., 116, C00G09, https://doi.org/10.1029/2011JC007184, 2011.
Cruz-García, R., Ortega, P., Guemas, V., Acosta Navarro, J. C., Massonnet, F., and Doblas-Reyes, F. J.: An anatomy of Arctic sea ice forecast biases in the seasonal prediction system with EC-Earth, Clim. Dynam., 56, 1799–1813, https://doi.org/10.1007/s00382-020-05560-4, 2021.
Dalman, L. A., Else, B. G., Barber, D., Carmack, E., Williams, W. J., Campbell, K., Duke, P. J., Kirillov, S., Mundy, C. J., and Tremblay, J.-É.: Enhanced bottom-ice algal biomass across a tidal strait in the Kitikmeot Sea of the Canadian Arctic, Elementa, 7, 22, https://doi.org/10.1525/elementa.361, 2019.
DeGrandpre, M., Evans, W., Timmermans, M. L., Krishfield, R., Williams, B., and Steele, M.: Changes in the Arctic Ocean carbon cycle with diminishing ice cover, Geophys. Res. Lett., 47, e2020GL088051, https://doi.org/10.1002/essoar.10502603.1, 2020.
Dickson, A. G. and Millero, F. J.: A comparison of the equilibrium constants for the dissociation of carbonic acid in seawater media, Deep-Sea Res. Pt. A, 34, 1733–1743, https://doi.org/10.1016/0198-0149(87)90021-5, 1987.
Dickson, A. G.: Thermodynamics of the dissociation of boric acid in synthetic seawater from 273.15 to 318.15 K, Deep-Sea Res. Pt. A, 37, 755–766, https://doi.org/10.1016/0198-0149(90)90004-F, 1990.
Dickson, A. G., Sabine, C. L., and Christian, J. R.: Guide to best practices for ocean CO2 measurements, North Pacific Marine Science Organization, Sidney, British Columbia, 191, https://doi.org/10.25607/OBP-1342, 2007.
Dong, Y., Yang, M., Bakker, D. C. E., Kitidis, V., and Bell, T. G.: Uncertainties in eddy covariance air–sea CO2 flux measurements and implications for gas transfer velocity parameterisations, Atmos. Chem. Phys., 21, 8089–8110, https://doi.org/10.5194/acp-21-8089-2021, 2021a.
Dong, Y., Yang, M., Bakker, D. C. E., Liss, P. S., Kitidis, V., Brown, I., Chierici, M., Fransson, A., and Bell, T. G.: Near-Surface Stratification Due to Ice Melt Biases Arctic Air-Sea CO2 Flux Estimates, Geophys. Res. Lett., 48, e2021GL095266, https://doi.org/10.1029/2021GL095266, 2021b.
Duke, P., Else, B., Jones, S., Marriot, S., Ahmed, M., Nandan, V., Butterworth, B., Gonski, S., Dewey, R., and Sastri, A.: Seasonal marine carbon system processes in an Arctic coastal landfast sea ice environment observed with an innovative underwater sensor platform, Elementa, 9, 00103, https://doi.org/10.1525/elementa.2021.00103, 2021.
Else, B., Galley, R., Papakyriakou, T., Miller, L., Mucci, A., and Barber, D.: Sea surface pCO2 cycles and CO2 fluxes at landfast sea ice edges in Amundsen Gulf, Canada, J. Geophys. Res.-Ocean., 117, C09010, https://doi.org/10.1029/2012JC007901, 2012.
Else, B. G., Whitehead, J. J., Galindo, V., Ferland, J., Mundy, C., Gonski, S. F., Ehn, J. K., Rysgaard, S., and Babin, M.: Response of the Arctic marine inorganic carbon system to ice algae and under-ice phytoplankton blooms: A case study along the fast-ice edge of Baffin Bay, J. Geophys. Res.-Ocean., 124, 1277–1293, https://doi.org/10.1029/2018JC013899, 2019.
Else, B. G., Cranch, A., Sims, R. P., Jones, S., Dalman, L. A., Mundy, C. J., Segal, R. A., Scharien, R. K., and Guha, T.: Variability in sea ice carbonate chemistry: a case study comparing the importance of ikaite precipitation, bottom-ice algae, and currents across an invisible polynya, The Cryosphere, 16, 3685–3701, https://doi.org/10.5194/tc-16-3685-2022, 2022.
Evans, W., Pocock, K., Hare, A., Weekes, C., Hales, B., Jackson, J., Gurney-Smith, H., Mathis, J. T., Alin, S. R., and Feely, R. A.: Marine CO2 patterns in the northern salish sea, Front. Mar. Sci., 5, 536, https://doi.org/10.3389/fmars.2018.00536, 2019.
Ford, J. D., Smit, B., Wandel, J., Allurut, M., Shappa, K., Ittusarjuat, H., and Qrunnut, K.: Climate change in the Arctic: current and future vulnerability in two Inuit communities in Canada, Geogr. J., 174, 45–62, https://doi.org/10.1111/j.1475-4959.2007.00249.x, 2008.
Geilfus, N.-X., Galley, R., Crabeck, O., Papakyriakou, T., Landy, J., Tison, J.-L., and Rysgaard, S.: Inorganic carbon dynamics of melt-pond-covered first-year sea ice in the Canadian Arctic, Biogeosciences, 12, 2047–2061, https://doi.org/10.5194/bg-12-2047-2015, 2015.
Geilfus, N.-X., Pind, M., Else, B., Galley, R., Miller, L., Thomas, H., Gosselin, M., Rysgaard, S., Wang, F., and Papakyriakou, T.: Spatial and temporal variability of seawater pCO2 within the Canadian Arctic Archipelago and Baffin Bay during the summer and autumn 2011, Cont. Shelf Res., 156, 1–10, https://doi.org/10.1016/j.csr.2018.01.006, 2018.
Harris, L. N., Yurkowski, D. J., Gilbert, M. J., Else, B. G., Duke, P. J., Ahmed, M. M., Tallman, R. F., Fisk, A. T., and Moore, J.: Depth and temperature preference of anadromous Arctic char Salvelinus alpinus in the Kitikmeot Sea, a shallow and low-salinity area of the Canadian Arctic, Mar. Ecol. Prog. Ser., 634, 175–197, https://doi.org/10.3354/meps13195, 2020.
Ho, D. T. and Schanze, J. J.: Precipitation-Induced Reduction in Surface Ocean pCO2: Observations From the Eastern Tropical Pacific Ocean, Geophys. Res. Lett., 47, e2020GL088252, https://doi.org/10.1029/2020GL088252, 2020.
Jakobsson, M.: Hypsometry and volume of the Arctic Ocean and its constituent seas, Geochem. Geophy. Geosy., 3, 1–18, https://doi.org/10.1029/2001GC000302, 2002.
JCGM: Evaluation of measurement data – Guide to the expression of uncertainty in measurement, 134, 2008.
Kalnay, E., Kanamitsu, M., Kistler, R., Collins, W., Deaven, D., Gandin, L., Iredell, M., Saha, S., White, G., and Woollen, J.: The NCEP/NCAR 40-year reanalysis project, Bull. Am. Meteorol. Soc., 77, 437–472, https://doi.org/10.1175/1520-0477(1996)077<0437:TNYRP>2.0.CO;2, 1996.
Kanamitsu, M., Ebisuzaki, W., Woollen, J., Yang, S.-K., Hnilo, J. J., Fiorino, M., and Potter, G. L.: NCEP-DOE AMIP-II Reanalysis (R-2), Bull. Am. Meteorol. Soc., 1631–1643, https://doi.org/10.1175/BAMS-83-11-1631, 2002 (data available at https://psl.noaa.gov/data/gridded/data.ncep.reanalysis2.html, last access: 25 January 2021).
Kim, K., Ha, S.-Y., Kim, B. K., Mundy, C., Gough, K. M., Pogorzelec, N. M., and Lee, S. H.: Carbon and nitrogen uptake rates and macromolecular compositions of bottom-ice algae and phytoplankton at Cambridge Bay in Dease Strait, Canada, Ann. Glaciol., 61, 106–116, https://doi.org/10.1017/aog.2020.17, 2020.
Kljun, N., Calanca, P., Rotach, M. W., and Schmid, H. P.: A simple two-dimensional parameterisation for Flux Footprint Prediction (FFP), Geosci. Model Dev., 8, 3695–3713, https://doi.org/10.5194/gmd-8-3695-2015, 2015.
Lan, X., Dlugokencky, E. J., Mund, J. W., Crotwell, A. M., Crotwell, M. J., Moglia, E., Madronich, M., Neff, D., and Thoning, K. W.: Atmospheric Carbon Dioxide Dry Air Mole Fractions from the NOAA GML Carbon Cycle Cooperative Global Air Sampling Network (Version: 2022-07-28) [data set], https://doi.org/10.15138/wkgj-f215, 2022.
Landrum, L. and Holland, M. M.: Extremes become routine in an emerging new Arctic, Nat. Clim. Change, 10, 1108–1115, https://doi.org/10.1038/s41558-020-0892-z, 2020.
Landschützer, P., Laruelle, G. G., Roobaert, A., and Regnier, P.: A uniform pCO2 climatology combining open and coastal oceans, Earth Syst. Sci. Data, 12, 2537–2553, https://doi.org/10.5194/essd-12-2537-2020, 2020.
Lewis, E., Wallace, D., and Allison, L. J.: Program developed for CO2 system calculations, Carbon Dioxide Information Analysis Center, managed by Lockheed Martin Energy Research Corporation for the US Department of Energy Tennessee, https://doi.org/10.2172/639712, 1998.
Loose, B., Schlosser, P., Perovich, D., Ringelberg, D., Ho, D., Takahashi, T., Richter-Menge, J., Reynolds, C., McGillis, W., and Tison, J.-L.: Gas diffusion through columnar laboratory sea ice: implications for mixed-layer ventilation of CO2 in the seasonal ice zone, Tellus B, 63, 23–39, https://doi.org/10.1111/j.1600-0889.2010.00506.x, 2011.
Macdonald, R., Anderson, L., Christensen, J., Miller, L., Semiletov, I., and Stein, R.: The Arctic Ocean: budgets and fluxes, in: Carbon and Nutrient Fluxes in Continental Margins: A Global Synthesis, edited by: Liu, K., Atkinson, , L., Q., and R., T.-M., Springer-Verlag, Berlin Heidelberg, 291–303, https://doi.org/10.1007/978-3-540-92735-8, 2010.
Manning, C. C., Preston, V. L., Jones, S. F., Michel, A. P., Nicholson, D. P., Duke, P. J., Ahmed, M. M., Manganini, K., Else, B. G., and Tortell, P. D.: River inflow dominates methane emissions in an Arctic coastal system, Geophys. Res. Lett., 47, e2020GL087669, https://doi.org/10.1029/2020GL087669, 2020.
Martin, J., Dumont, D., and Tremblay, J. É.: Contribution of subsurface chlorophyll maxima to primary production in the coastal Beaufort Sea (Canadian Arctic): A model assessment, J. Geophys. Res.-Ocean., 118, 5873–5886, https://doi.org/10.1002/2013JC008843, 2013.
Mehrbach, C., Culberson, C. H., Hawley, J. E., and Pytkowicx, R. M.: Measurement of the apparent dissociation constants of carbonic acid in seawater at atmospheric pressure, Limnol. Oceanogr., 18, 897–907, https://doi.org/10.4319/lo.1973.18.6.0897, 1973.
Meire, L., Søgaard, D., Mortensen, J., Meysman, F., Soetaert, K., Arendt, K., Juul-Pedersen, T., Blicher, M., and Rysgaard, S.: Glacial meltwater and primary production are drivers of strong CO2 uptake in fjord and coastal waters adjacent to the Greenland Ice Sheet, Biogeosciences, 12, 2347–2363, https://doi.org/10.5194/bg-12-2347-2015, 2015.
Miller, L. A., Burgers, T. M., Burt, W. J., Granskog, M. A., and Papakyriakou, T. N.: Air-Sea CO2 Flux Estimates in Stratified Arctic Coastal Waters: How Wrong Can We Be?, Geophys. Res. Lett., 46, 235–243, https://doi.org/10.1029/2018GL080099, 2018.
Mundy, C., Gosselin, M., Ehn, J., Gratton, Y., Rossnagel, A., Barber, D. G., Martin, J., Tremblay, J. É., Palmer, M., and Arrigo, K. R.: Contribution of under-ice primary production to an ice-edge upwelling phytoplankton bloom in the Canadian Beaufort Sea, Geophys. Res. Lett., 36, L17601, https://doi.org/10.1029/2009GL038837, 2009.
NGDC, N. G. D. C.: 2‐minute gridded global relief data (ETOPO2) v2, National Geophysical Data Center, NOAA [data set], https://doi.org/10.7289/V5J1012Q, 2006.
Nightingale, P. D., Malin, G., Law, C. S., Watson, A. J., Liss, P. S., Liddicoat, M. I., Boutin, J., and Upstill-Goddard, R. C.: In situ evaluation of air-sea gas exchange parameterizations using novel conservative and volatile tracers, Global Biogeochem. Cy., 14, 373–387, https://doi.org/10.1029/1999GB900091, 2000.
Parmentier, F.-J. W., Christensen, T. R., Sørensen, L. L., Rysgaard, S., McGuire, A. D., Miller, P. A., and Walker, D. A.: The impact of lower sea-ice extent on Arctic greenhouse-gas exchange, Nat. Clim. Change, 3, 195–202, https://doi.org/10.1038/nclimate1784, 2013.
Pawlowicz, R.: M_Map: A mapping package for MATLAB (1.4) [code], 2020.
Perrette, M., Yool, A., Quartly, G., and Popova, E. E.: Near-ubiquity of ice-edge blooms in the Arctic, Biogeosciences, 8, 515–524, https://doi.org/10.5194/bg-8-515-2011, 2011.
Peterson, J. T., Komhyr, W., Waterman, L., Gammon, R., Thoning, K., and Conway, T.: Atmospheric CO2 variations at Barrow, Alaska, 1973–1982, in: Scientific Application of Baseline Observations of Atmospheric Composition (SABOAC), edited by: Ehhalt, D., Pearman, G., and Galbally, I., Springer, Dordrecht, 397–416, https://doi.org/10.1007/978-94-009-3909-7_20, 1987.
Sharp, Jonathan D., Pierrot, Denis, Humphreys, Matthew P., Epitalon, Jean-Marie, Orr, James C., Lewis, Ernie R., and Wallace, Douglas W. R.: CO2SYSv3 for MATLAB (v3.0.1), Zenodo [software], https://doi.org/10.5281/zenodo.3952803, 2020.
Sims, R. P., Schuster, U., Watson, A. J., Yang, M. X., Hopkins, F. E., Stephens, J., and Bell, T. G.: A measurement system for vertical seawater profiles close to the air–sea interface, Ocean Sci., 13, 649–660, https://doi.org/10.5194/os-13-649-2017, 2017.
Sims, R. P.: Martin Bergmann pCO2 dataset 2016–2019 (1.0.0), Zenodo [data set], https://doi.org/10.5281/zenodo.7979465, 2023a.
Sims, R. P.: Richard-Sims/Sims_2023_Bergmann_pCO2: v1.0.0-Publication (v1.0.0-Publication), Zenodo [code], https://doi.org/10.5281/zenodo.7979433, 2023b.
Spreen, G., Kaleschke, L., and Heygster, G.: Sea ice remote sensing using AMSR-E 89-GHz channels, J. Geophys. Res.-Ocean., 113, https://doi.org/10.1029/2005JC003384, 2008 (data set is available at https://seaice.uni-bremen.de/sea-ice-concentration/amsre-amsr2/, last access: 20 June 2020).
Takahashi, T., Olafsson, J., Goddard, J. G., Chipman, D. W., and Sutherland, S.: Seasonal variation of CO2 and nutrients in the high-latitude surface oceans: A comparative study, Global Biogeochem. Cy., 7, 843–878, https://doi.org/10.1029/93GB02263, 1993.
Teodoru, C. R., Del Giorgio, P. A., Prairie, Y. T., and Camire, M.: Patterns in pCO2 in boreal streams and rivers of northern Quebec, Canada, Global Biogeochem. Cy., 23, GB2012, https://doi.org/10.1029/2008GB003404, 2009.
Thoning, K. W., Crotwell, A. M., and Mund, a. J. W.: Atmospheric Carbon Dioxide Dry Air Mole Fractions from continuous measurements at Mauna Loa, Hawaii, Barrow, Alaska, American Samoa and South Pole, (Version 2020-08) [data set], https://doi.org/10.15138/yaf1-bk21, 2020.
Van Heuven, S., Pierrot, D., Rae, J., Lewis, E., and Wallace, D.: MATLAB Program Developed for CO2 System Calculations, ORNL/CDIAC-105b, Carbon Dioxide Information Analysis Center, Oak Ridge National Laboratory, US Department of Energy, Oak Ridge, Tennessee [code], https://cdiac.ess-dive.lbl.gov/ftp/co2sys/CO2SYS_calc_MATLAB_v1.1/ (last access: 28 July 2016), 2011.
Wang, Q., Myers, P. G., Hu, X., and Bush, A. B.: Flow constraints on pathways through the Canadian Arctic Archipelago, Atmos.-Ocean., 50, 373–385, https://doi.org/10.1080/07055900.2012.704348, 2012.
Wanninkhof, R.: Relationship between wind speed and gas exchange over the ocean revisited, Limnol. Oceanogr.-Method., 12, 351–362, https://doi.org/10.4319/lom.2014.12.351, 2014.
Weiss, R. F.: Carbon dioxide in water and seawater: the solubility of a non-ideal gas, Mar. Chem., 2, 203–215, https://doi.org/10.1016/0304-4203(74)90015-2, 1974.
Wessel, P. and Smith, W. H.: A global, self-consistent, hierarchical, high-resolution shoreline database, J. Geophys. Res.-Sol. Ea., 101, 8741–8743, https://doi.org/10.1029/96JB00104, 1996.
Williams, W., Brown, K. A., Bluhm, B., Carmack, E. C., Dalman, L., Danielson, S. L., Else, B. G., Friedriksen, R., Mundy, C., and Rotermund, L. M.: Stratification in the Canadian Arctic Archipelago's Kitikmeot Sea: biological and geochemical consequences, Polar Knowledge Canada, Ottawa, Canada, 46–52, https://doi.org/10.35298/pkc.2018.06, 2018.
Woolf, D. K., Shutler, J. D., Goddijn-Murphy, L., Watson, A., Chapron, B., Nightingale, P. D., Donlon, C. J., Piskozub, J., Yelland, M., and Ashton, I.: Key uncertainties in the recent air-sea flux of CO2, Global Biogeochem. Cy., 33, 1548–1563, https://doi.org/10.1029/2018GB006041, 2019.
Wynja, V., Demers, A.-M., Laforest, S., Lacelle, M., Pasher, J., Duffe, J., Chaudhary, B., Wang, H., and Giles, T.: Mapping coastal information across Canada's northern regions based on low-altitude helicopter videography in support of environmental emergency preparedness efforts, J. Coast. Res., 31, 276–290, https://doi.org/10.2112/JCOASTRES-D-14-00059.1, 2015.
Xu, C., Mikhael, W., Myers, P. G., Else, B., Sims, R. P., and Zhou, Q.: Effects of Seasonal Ice Coverage on the Physical Oceanographic Conditions of the Kitikmeot Sea in the Canadian Arctic Archipelago, Atmos.-Ocean., 59, 1–19, https://doi.org/10.1080/07055900.2021.1965531, 2021.