the Creative Commons Attribution 4.0 License.
the Creative Commons Attribution 4.0 License.
 | 08 Jun 2023
DUACS DT2021 reprocessed altimetry improves sea level retrieval in the coastal band of the European seas
Antonio Sánchez-Román
M. Isabelle Pujol
Yannice Faugère
Ananda Pascual
More than 29 years of altimeter data have been recently reprocessed by the multi-satellite Data Unification and Altimeter Combination System (DUACS) and made available under the name of DT2021 through the Copernicus Marine Service (CMEMS) and the Copernicus Climate Change Service (C3S). New standards have been applied and various geophysical correction parameters have been updated compared to the previous release in order to improve the product quality.
This paper describes the assessment of this new release through the comparison of both the all satellites and the two satellites product with external in situ tide gauge measurements in the coastal areas of the European seas for a time period from 1 January 1993 to 31 May 2020. The aim is to quantify the improvements on the previous DT2018 processing version for the retrieval of sea level in the coastal zone.
The results confirmed that the CMEMS product in the new DT2021 processing version better solves the signal in the coastal band. The all satellites dataset showed a reduction of 3 % in errors when compared with tide gauges and of 5 % in the variance of the differences between the datasets compared to DT2018 reprocessing. Moreover, the all satellites dataset provided more accurate sea level measurements when making a comparison with tide gauges with respect to the climatic two satellites dataset due to the better performance of the former for the assessment of higher than climatic frequency signals. By contrast, the two satellite dataset is the most suitable product for the assessment of long-term sea level sea surface height (SSH) trends in the coastal zone due to its larger stability to the detriment of the all satellites dataset.
- Article
(5166 KB) - Full-text XML
- BibTeX
- EndNote


On December 2021, more than 29 years of Level 3 (L3) and Level 4 (L4) altimetry products were reprocessed, released and made freely available for users as the Delayed Time (DT) DT2021 version (CMEMS-SL-QUID, 2022; PUGS, 2021; Faugère et al., 2022) of the multi-satellite Data Unification and Altimeter Combination System (DUACS) products by the European Copernicus Program (http://marine.copernicus.eu/, last access: 15 July 2022) substituting the former DT2018 product version (Taburet et al., 2019), which is no longer available in the Copernicus Catalogue. Currently, two types of altimetric L4 gridded products generated by the DUACS production system are available: the so-called all satellites global and regional (European seas) gridded products disseminated via the Copernicus Marine Service (CMEMS) project (CMEMS-SL-QUID, 2022) and the two satellites global gridded products distributed via the Copernicus Climate Change Service (C3S) project (PUGS, 2021). Currently, the two satellites products are also distributed via the CMEMS project. The all satellites products are dedicated to the retrieval of mesoscale signals on a global or regional scale, whereas the two satellites ones are dedicated to monitoring the long-term evolution of sea level, thus being suitable for use in climate applications (Taburet et al., 2019).
The Level 2 altimeter standards used to compute sea level anomaly (SLA) in the CMEMS and C3S products are identical (CMEMS-SL-QUID, 2022), but the reference used to compute SLAs differs: CMEMS products use a mean profile of sea surface heights along the theoretical track of the satellites with a repetitive orbit, whilst C3S products use a mean sea surface (MSS) for all missions. In the latest release, new up-to-date standards have been applied and various geophysical correction parameters have been updated compared to the previous DT2018 version (Table A1 in Appendix A). This provides both an improved accuracy of SLA and lower regional sea level biases.
The updates are as follows:
- i.
A new internal tide correction that allows the prediction of the two main tidal constituents of both diurnal and semidiurnal tidal frequencies has been applied. The solution proposed by Zaron (2019) is used (HRET 8.1 version). This correction reduces the coherent signal characteristic of internal tide and provides a more precise reconstruction of mesoscale eddies. The use of the internal tide correction induces a reduction in internal tide signature on along-track data improving the precision of the resulting L4 gridded product (CMEMS-SL-QUID, 2022).
- ii.
A new MSS for non-repetitive missions and recent missions consisting in a hybrid gridded MSS field made up of three different gridded MSS models is used. The SIO MSS model (Sandwell et al., 2017) is used in the open ocean, the CNES_CLS-2015 model (Pujol et al., 2018) is used in coastal areas (distance to the coast less than 20 km), and the DTU15 model (Andersen et al., 2016) is used in the Arctic region (latitude larger than 80∘ N). This hybrid solution contributes to reducing the SLA errors at short wavelengths. A new mean profile (precise MSS along the altimeter tracks) is used for historical repetitive missions (CMEMS products). New mean profiles were estimated along the historical repetitive tracks of TOPEX/Poseidon–Jason, the TOPEX/Poseidon–Jason-interleaved phase, ERS–Envisat–AltiKa, Sentinel-3A and GFO consistent with the different standards used in the DT2021 version. This improves the SLA signal at long wavelengths.
- iii.
A new mean dynamic topography for the global (Mulet et al., 2021) and the Mediterranean and Black seas is applied.
- iv.
An improved long-wavelength error (LWE) correction, delivered in the L3 product, has been computed as the final step of multi-mission cross-calibration processing. Progress with respect to the previous version has been made by first estimating the LWE correction with higher frequency along the different tracks (100 km instead of 500 km used previously) and then by improving the interpolation methodology (optimal interpolation instead of spline used previously) to retrieve the correction on each along-track position. This method is expected to remove local SLA residual biases between neighbouring altimeter tracks.
- v.
And finally, the DT2021 product version includes an upgraded mapping parameterization that contributes to improving the mesoscale signal visible on L4 products. The spatial and temporal correlation scales are optimized improving the reconstruction of the mesoscale signal, a more precise definition of the observation's errors computed with regard to the new altimeter standards is provided, and finally, a more precise estimation and correction of LWE in the mapping process is applied removing local SLA residual biases. A complete description of the different evolutions implemented in the DUACS DT2021 product version can be found in CMEMS-SL-QUID (2022).
The validation (quality check) of altimetry products is a key step in the data processing pipe to assess and characterize the errors associated with the altimetry measurements. This issue is crucial in the coastal zone, where traditional altimetry has been often unable to produce meaningful signals of sea level change due to the typically shallower water, bathymetric gradients and shoreline shapes, among others (Vignudelli et al., 2019; Sánchez-Román et al., 2020). Actually, global and regional products from DT2021 and DT2018 reprocessings are not optimized for the coastal band promoting larger errors in the retrieval of sea level with regard to the open ocean.
Nevertheless, the monitoring of sea level changes in coastal areas is an important societal issue (Pujol et al., 2023). Thus, most of the efforts of the international community in the recent past have been focused on the research and development of techniques for coastal altimetry, with substantial support from space agencies such as the European Space Agency (ESA), the Centre National d'Études Spatiales (CNES) and other research institutions (Cipollini et al., 2017). Efforts of the coastal altimetry community are aimed at extending the capabilities of current altimeters closer to the coastal zone. This includes the application of improved geophysical corrections, data recovery strategies near the coast using new editing criteria and high-frequency along-track sampling associated with updated quality control procedures (Vignudelli et al., 2019). As a result, regional altimeter products such as PISTACH (Mercier et al., 2010), X-TRACK (Roblou et al., 2011; Birol et al., 2017), X-TRACK-ALES (Birol et al., 2021) and ESA EO4SIBS (Grégoire, 2021) focused on the coastal zone have been developed over the last few years (Pujol et al., 2023). These products are disseminated to both the international scientific community and society through regular specific coastal altimetry workshops.
Different metrics are used to assess the quality of altimetry data. They mainly consist in the analysis of the SLA field at different steps of the processing, checks of the consistency of the SLA along the tracks of different altimeters and between gridded and along-track products, and comparisons with external in situ measurements (CMEMS-SL-QUID, 2022). In situ and altimetric observations are complementary and are often assumed to observe the same signals (Wöppelmann and Marcos, 2016). In coastal areas, tide gauge measurements are commonly used. In Taburet et al. (2019), DUACS DT2018 L4 global gridded products were assessed in the coastal areas through a comparison with monthly tide gauge measurements from the Permanent Service for Mean Sea Level (PSMSL) Network (PSMSL, 2016). These authors reported a global reduction of 0.6 % in variance with respect to the previous processing (DUACS DT2014 dataset). Pascual et al. (2006, 2009) investigated the consistency between previous versions of the altimeter L4 gridded products and tide gauge data from the PSMSL repository in the coastal zone reporting mean square differences between the two datasets ranging between 30 % and 90 % on the European coasts. More recently, Sánchez-Román et al. (2020) assessed the quality of DUACS L3 products in the coastal band of the European seas through comparison with independent tide gauge measurements. These authors reported a mean root mean square (rms) difference between both datasets lower than 7 cm for the whole region, with mean values ranging around less than 4 cm in the Mediterranean Basin and around 10 cm for the North-West Shelf (NWS) area (see Fig. 2 in Sánchez-Román et al., 2020, for the location of this region). The quality of the DUACS DT2021 product version has been also assessed through the comparison with monthly tide gauge measurements from the Global Sea Level Observing System (GLOSS)/Climate Variability and Predictability (CLIVAR) network. CMEMS-SL-QUID (2022) reports improved results when using the latest reprocessing with a reduction in variance of the differences between altimetry and tide gauges ranging between 0.2 % and more than 5 % of the tide gauge signal on the European coasts, with respect to the previous product version.

Figure 1Location of the 213 tide gauges of the global product in the Copernicus Catalogue along the European coasts and the western Mediterranean Sea used for a comparison with altimetry data after applying the selection criteria described in the text. Colours indicate the mean square differences between the tide gauge and altimetry sea level (DT2021 all satellites series). Units are the percentage of the tide gauge variance.
This paper focuses on improvements in the latest DUACS DT2021 reprocessing in the retrieval of sea level in the coastal band of the European seas with respect to the previously available DT2018 products. To do that, an intercomparison of L4 global altimetry gridded products and in situ tide gauges located along the European coasts from the Copernicus Catalogue is conducted. The performance of the DT2021 processing all satellites and two satellites versions on the sea level retrieval is also assessed. The paper is organized as follows: the SLA data used, the tide gauge dataset and the method for comparing altimeter and in situ measurements are detailed in Sect. 2. Section 3 describes the performance of the DT2021 processing product version in the retrieval of sea level in the coastal band. Also, the improvements over the previous DT2018 processing product version are assessed. Finally, the discussion and main conclusions are included in Sect. 4.
2.1 Sea level anomaly data
The DUACS reprocessed L4 global satellite SLA maps used in this study correspond to both the DT2021 (CMEMS-SL-QUID, 2022; PUGS, 2021; Faugère et al., 2022) and the DT2018 product (Taburet et al., 2019) versions. SLA gridded products cover the global ocean with a spatial and temporal resolution of 0.25∘ and 1 d, respectively. Two different SLA datasets for each one of the DUACS product versions are considered: the all satellites L4 global gridded product disseminated via the CMEMS and the two satellites L4 global gridded product distributed via the C3S and CMEMS. The first one is computed with a satellite constellation including all the available altimeters at a given time (ranging from two to seven over the period considered in this study; see, e.g., Fig. 1 in International Altimetry Team, 2021; Morrow et al., 2023). As a consequence, the errors are not constant in time since they depend on the number of satellites used. This product focuses on the mesoscale mapping capacity of the altimeter data together with the stability of the overall dataset. The two satellites SLA dataset is obtained by merging a steady number of altimeters (two) in the satellite constellation. Two satellites are the minimum requirement to retrieve mesoscale signals in delayed time conditions (Pascual et al., 2006; Dibarboure et al., 2011). This fact also promotes nearly consistent errors during the whole time period (some variation in the error can occur related to changes in the two satellites constellation). This product focuses on the stability of the global mean sea level (MSL), even if this implies a potential reduction in the spatial sampling of the ocean. The reader is referred to Fig. 1 in Sánchez-Román et al. (2020) for more information about the DUACS procedure flowchart applied to the altimetry data and also to the processing of the tide gauge data used for the comparison with altimetry (next section). The time period investigated common to both DT2021 and DT2018 reprocessings runs from 1 January 1993 to 31 May 2020 due to the presently availability of DUACS DT2018 products. A complete description of the SLA datasets can be found in CMEMS-SL-QUID (2022).
2.2 Tide gauge observations
The sea level records used for a comparison with satellite altimetry were extracted from the Copernicus Catalogue (http://www.marineinsitu.eu, last access: 3 June 2022). The tide gauge stations located in the European seas' domain were initially considered for this study. Following the methodology described in Sánchez-Román et al. (2020), the quality flags of the tide gauge records were checked in order to remove observations with no quality check, potentially bad data and changes in the vertical reference of the tide gauge. Also, observations with values larger than 3 times the standard deviation of the time series were rejected as they might not be representative of ocean sea level changes but local features (e.g. river discharge, Laíz et al., 2013). The final dataset consists of 213 tide gauge stations (Fig. 1) with time series exhibiting between 90 % and 100 % of valid data. The stations and their information are listed in Table B1 in Appendix B.
Before they can be compared with altimeter data, tide gauge measurements have to be processed to remove oceanographic signals whose temporal periods are not resolved by altimetry, thus avoiding important aliasing errors (Vignudelli et al., 2019). We applied the methodology described in Sánchez-Román et al. (2020). In the following we summarize the corrections applied to the tide gauge records.
-
Correction of oceanic tidal effects by filtering tidal components (mainly diurnal and semidiurnal tidal constituents). The u-tide software (Codiga, 2011) is used. The annual and semiannual frequencies, mainly driven by steric effect, are kept in the tidal residuals since they are included in the altimetry data.
-
Removal of the atmospherically induced sea level caused by the action of atmospheric pressure and wind (Dorandeu and Le Traon, 1999; Carrère and Lyard, 2003). The same dynamic atmospheric correction (DAC) as for altimetry is applied for the sake of consistency. The 6-hourly fields of this correction, available from the Archiving, Validation and Interpretation of Satellite Oceanographic Data (AVISO) website, are used. For each tide gauge site, the nearest grid point was selected and used to remove the atmospherically induced sea level from observations, previously converted into 6-hourly records (Marcos et al., 2015).
-
Correction of vertical movements associated with glacial isostatic adjustment (GIA). GIA was regarded as the only source of vertical land motions. Its effects were removed from the sea surface height (SSH) records, previously averaged into daily data, by using the Peltier mantle viscosity model (VM2) (Peltier, 1998, 2004).
2.3 Method for comparing altimeter and in situ tide gauge records
The comparison method of altimetry with tide gauges consisted of collocating both datasets in time and space. As a first step, a 15 d low-pass LOESS filter was applied to altimetry and tide gauge time series to remove the high frequencies that cannot be resolved by the altimetric data (Pascual et al., 2009; Ballarotta et al., 2019; Sánchez-Román et al., 2020). Then, the correlations between each tide gauge record and SLA time series corresponding to grid points within a radius of 1∘ around the tide gauge site were computed and the most correlated altimetry point was chosen. Only long-term monitoring stations with a lifetime of more than 3 years were used in order to allow statistical significance. Statistical analyses were performed using all available data pairs (altimetry–tide gauge). The collocated altimeter and tide gauge measurements were analysed in terms of the rms difference and variance of the time series. In addition, the robustness of the results was investigated according to Sánchez-Román et al. (2017, 2020) using a bootstrap method (Efron and Tibshirani, 1986), which allows us to estimate quantities related to a dataset by averaging estimates from multiple data samples. To do that, the dataset is iteratively resampled with replacement. A total of 1000 iterations were used to ensure that meaningful statistics such as standard deviation could be calculated on the sample of estimated values, thus allowing us to assign measures of accuracy to sample estimates (Sánchez-Román et al., 2020).
3.1 Performance of DUACS DT2021 products in the retrieval of sea level in the coastal band
This section presents the statistics of the comparisons performed between the DUACS DT2021 all satellites and two satellites datasets and the tide gauge observations from the Copernicus Catalogue in the coastal region of the European seas in terms of errors (rms differences) and variance of the differences between the datasets. According to Sánchez-Román et al. (2020), the bootstrapping technique was applied to gain an estimation of the standard errors in the differences between the datasets.
The mean value of the rms difference between the all satellites dataset and tide gauges is 4.11 cm, the variance of the differences (altimetry–tide gauge) is 17 cm2, and the mean distance between the location of the tide gauge and the corresponding altimeter data with the highest correlation is 82 km (Table 1). These values rise to 4.35 cm, 19 cm2 and 87 km, respectively, when using the two satellites dataset. The tide gauge stations (213 stations) common to both datasets were used. Thus, the all satellites dataset reduces the rms differences with tide gauges on the European coasts by 5 %, the variance differences between the datasets by 10 %, and the mean distance between the most correlated altimetry point and tide gauges by 6 %. Also, the number of valid data pairs used to conduct the intercomparison enhanced by 0.2 % when using the all satellites dataset. This is due to the larger number of satellite missions used to generate this dataset that provides lower errors in the optimal interpolation procedure compared to the two satellites dataset.
Table 1Intercomparison of DUACS DT2021 satellite altimetry (ALT) and tide gauge (TG) data from the European coasts in terms of the rms differences (cm) and variance (cm2) of the differences between the datasets. The number of tide gauge stations used in the comparison, the mean distance between tide gauges and the most correlated gridded altimetry points, and the number of total data pairs (altimetry–tide gauge) used in the computation are displayed. The common tide gauge stations for the all satellites and two satellites datasets were used. Values in parentheses show the uncertainties (error bars) computed for the rms differences and variance from the bootstrap method using 1.000 iterations. Finally, the improvement (%) of the all satellites dataset in comparison with tide gauges in terms of lower rms differences, lower variance of the differences (altimetry–tide gauge), and lower mean distance between the most correlated altimetry point and tide gauges with respect to the two satellites dataset is also displayed.
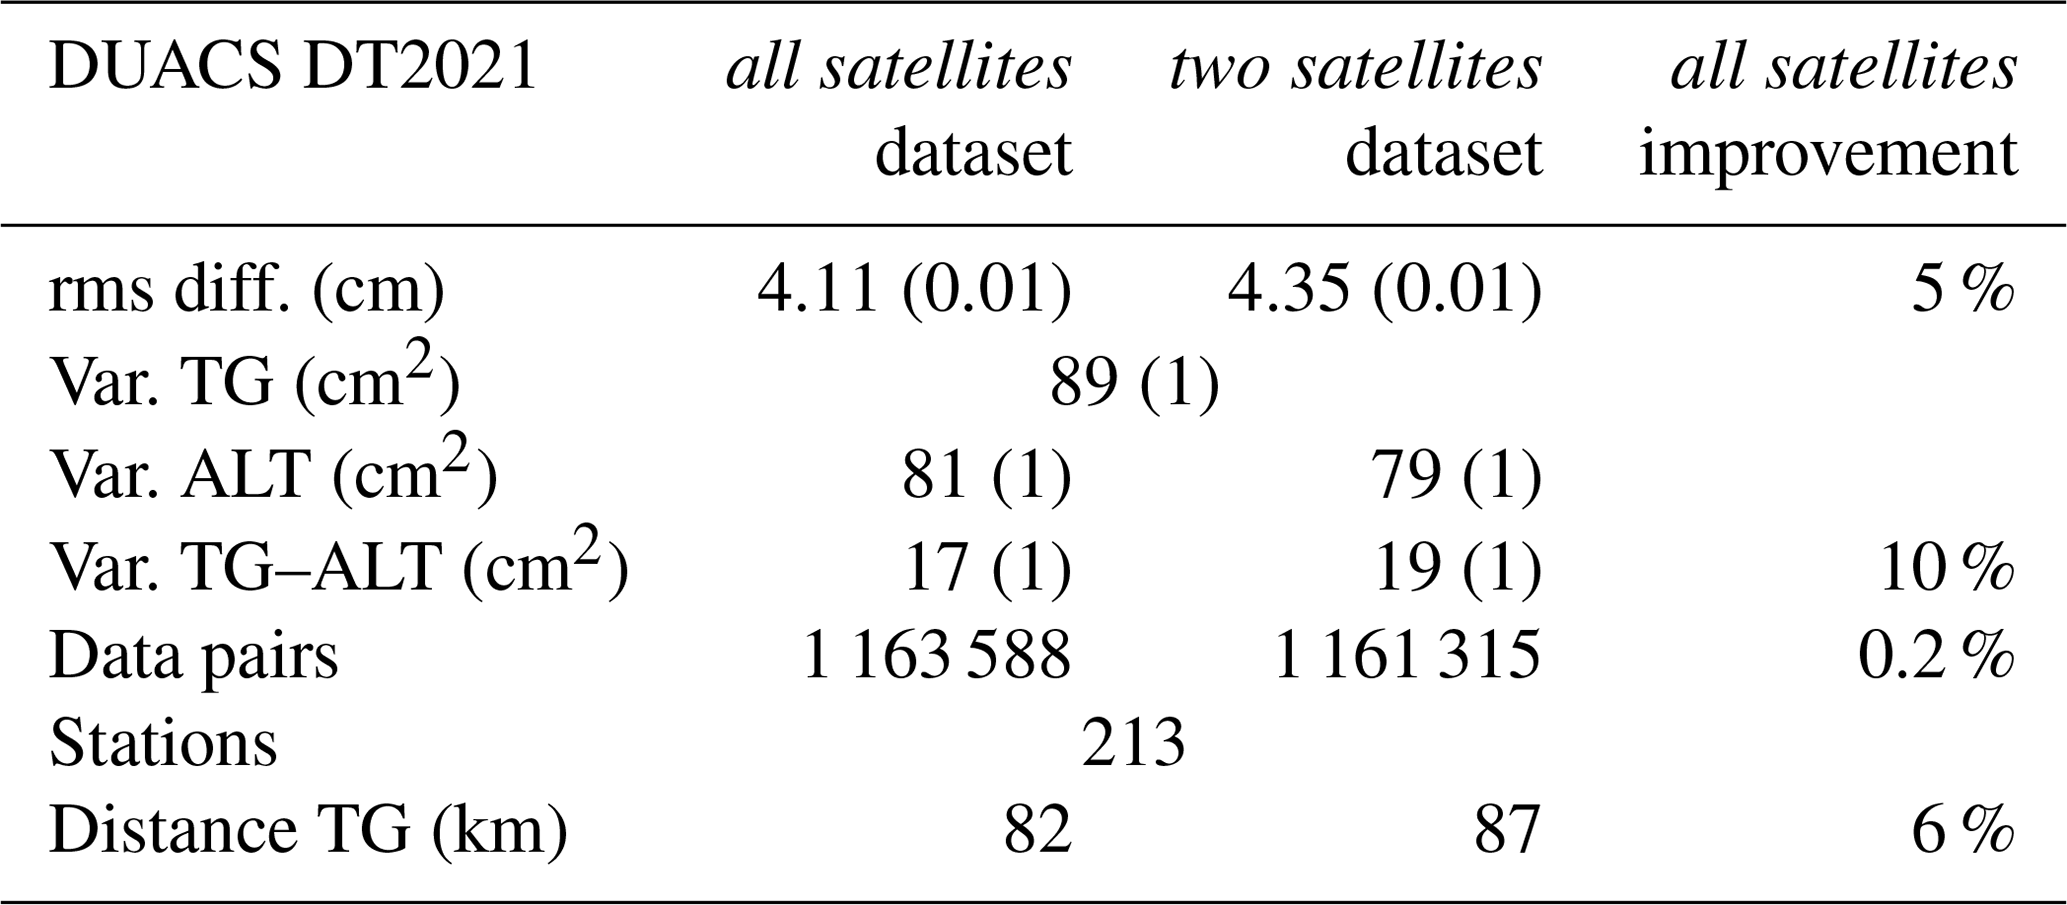
Figure 1 shows the consistency between the DUACS DT2021 all satellites dataset and the tide gauge data computed from Eq. (1) in Sánchez-Román et al. (2020). Consistency is expressed as the mean square differences between both datasets, computed as the variance of the differences (altimetry–tide gauge), in terms of percentage of the tide gauge variance. Overall, mean square differences lower than 5 % are observed in the central and eastern parts of the Baltic Sea, emphasizing the precision of the corrections applied to the altimeter data in the basin, whereas they reach values between 20 % and 30 % for stations located in the connection region with the North Atlantic Ocean. The mean square differences are between 20 % and 50 % for most of the stations located along the Atlantic shore; this includes the Strait of Gibraltar area. Such a large error could be related to imprecisions in the correction applied (i.e. ocean tide and DAC) to the altimeter data (Pascual et al., 2008; Laíz et al., 2016; Sánchez-Román et al., 2020) and also to both the larger spatiotemporal variability observed in this region (figure not shown) and to a larger non-tidal variance with respect to that found in the Baltic Sea (Von Schuckmann et al., 2018). Finally, the Mediterranean and Norwegian seas show mean square differences ranging between 15 % and 30 %, except for the Balearic Islands (western Mediterranean) and the south-western part of Norway where values between 5 % and 15 % are obtained. The consistency between the DUACS DT2021 two satellites dataset and tide gauges (figure not shown) presents quite a similar spatial pattern and results. These outcomes improve the ones reported in Sánchez-Román et al. (2020) from the intercomparison conducted between the Sentinel-3A L3 along-track DUACS DT2018 dataset and tide gauge measurements in the region computed over a period of 2.5 years.
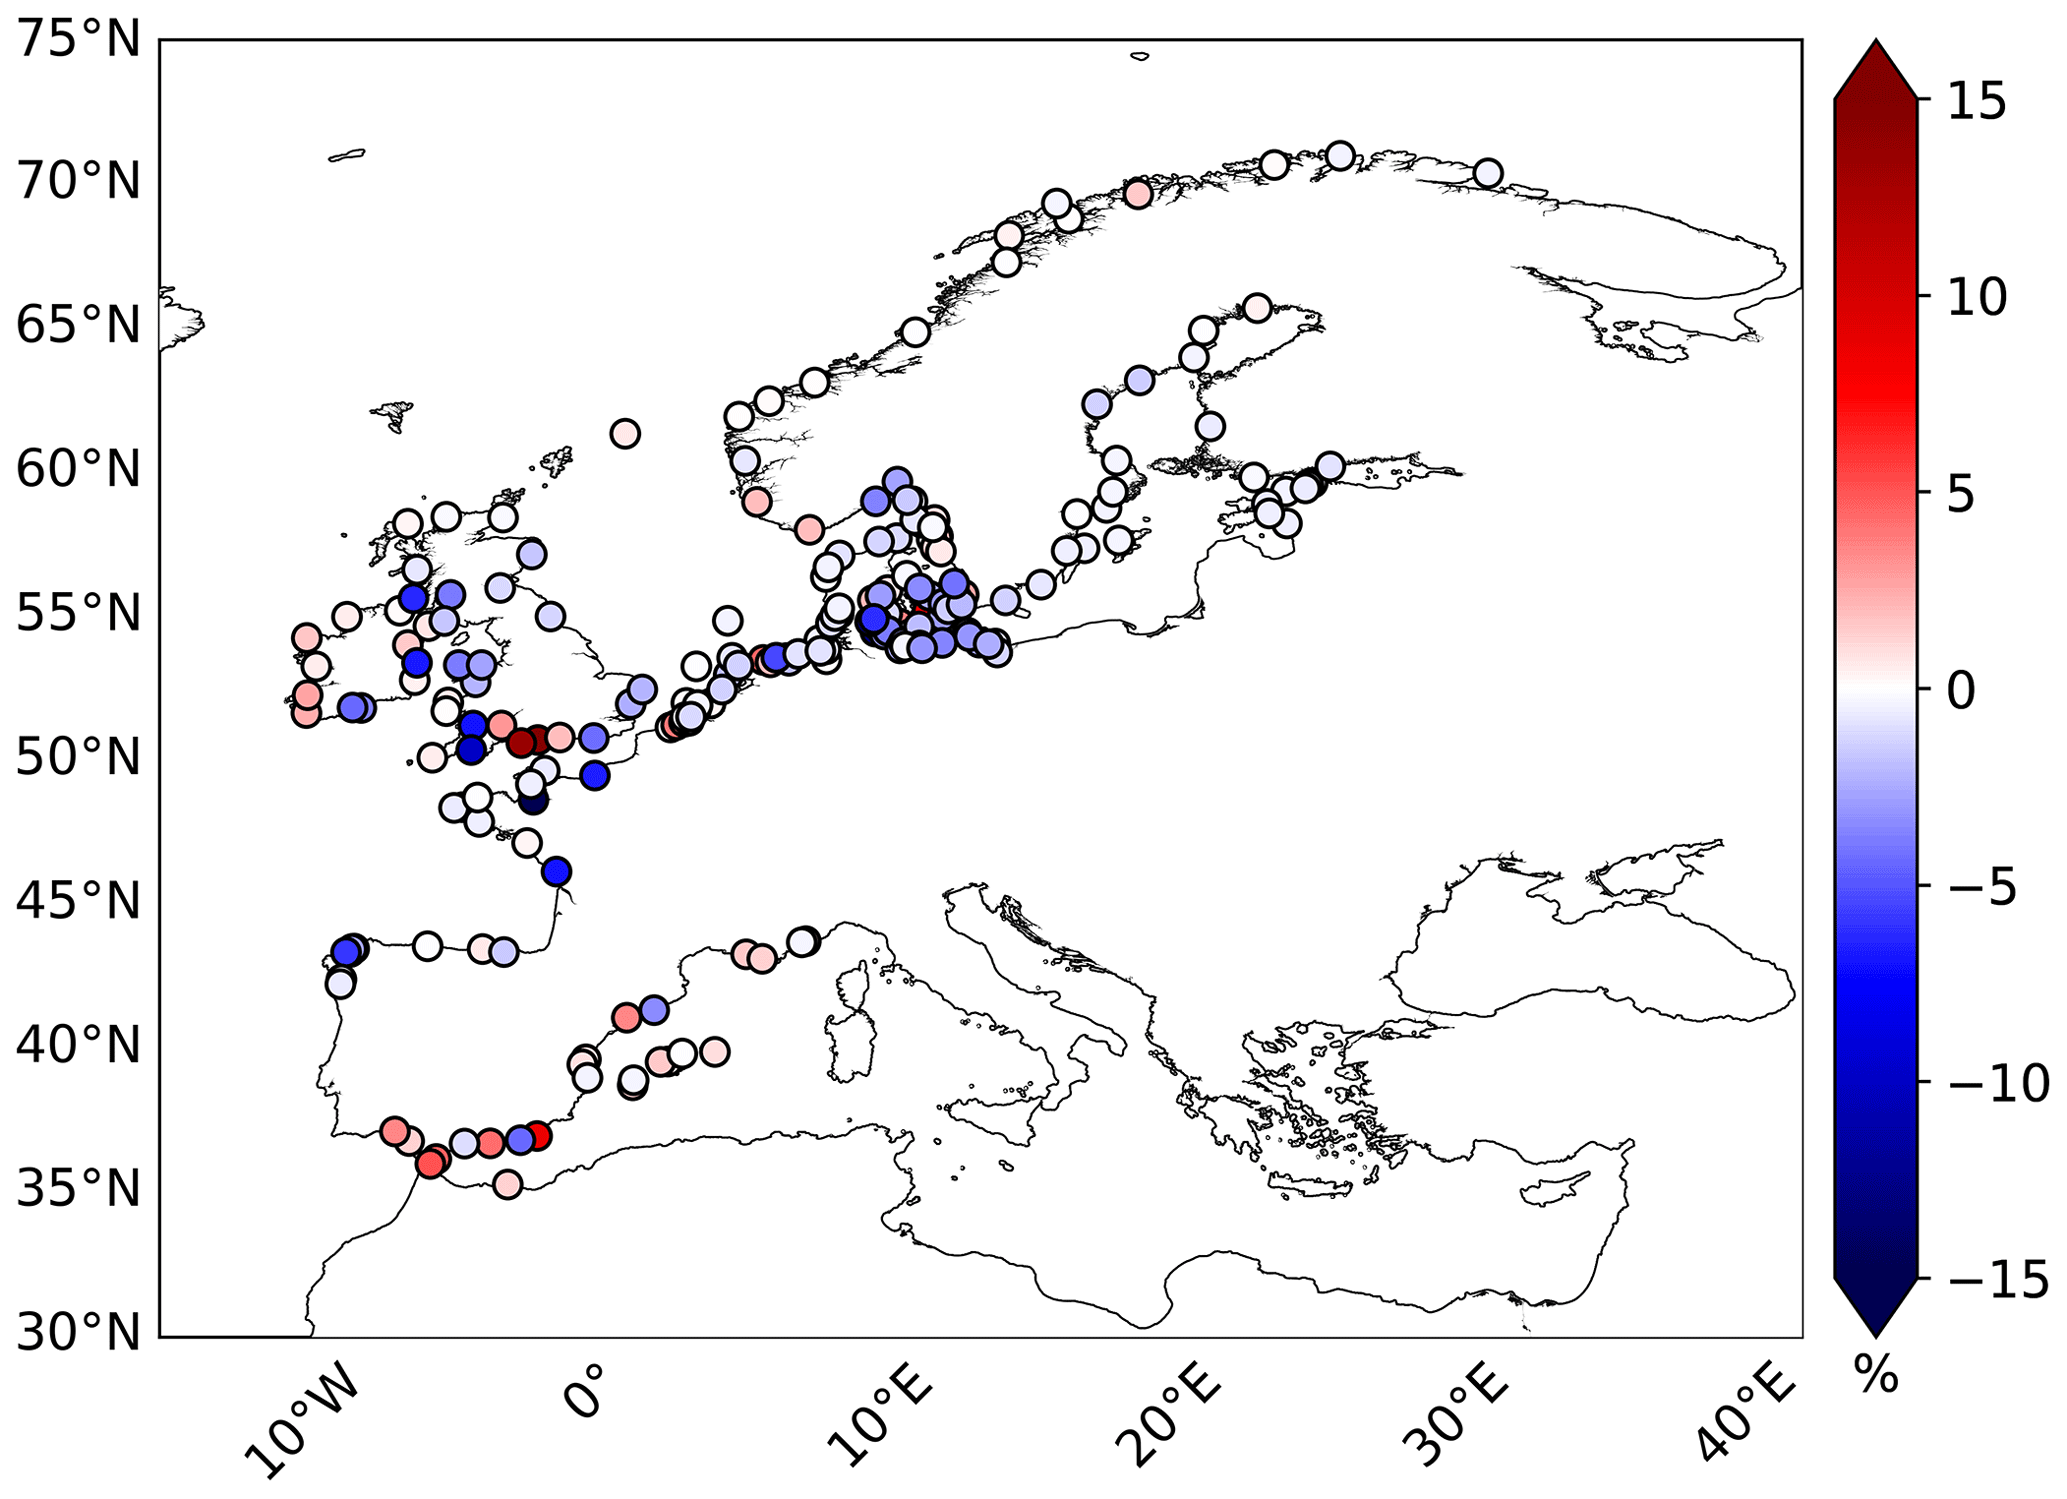
Figure 2Spatial distribution of the differences (DT2021 minus DT2018) for the mean square differences between the tide gauge and altimetry sea level. Units are the percentage of the tidal variance. The SLA all satellites dataset has been used. Blue colours denote an improvement in the DUACS DT2021 reprocessing, whilst red colours indicate its degradation with respect to the DT2018 reprocessing.
3.2 Improvement in DT2021 over DT2018 reprocessing
3.2.1 All satellites SLA dataset
This section focuses on the statistics of the comparisons performed between the DUACS DT2021 and DT2018 reprocessing all satellites datasets and the tide gauge observations. The mean value of the rms difference between the DT2018 processing dataset and tide gauges is 4.22 cm, the variance of the differences (altimetry–tide gauge) is 18 cm2, and the mean distance between the location of the tide gauge and the corresponding altimeter data with the highest correlation is 88 km (Table 2).
Table 2The same as Table 1 but for the intercomparison using the DUACS DT2018 reprocessing. The improvements (%) of the DUACS DT2021 reprocessing all satellites and two satellites SLA datasets with respect to the previous DT2018 reprocessing are also shown.
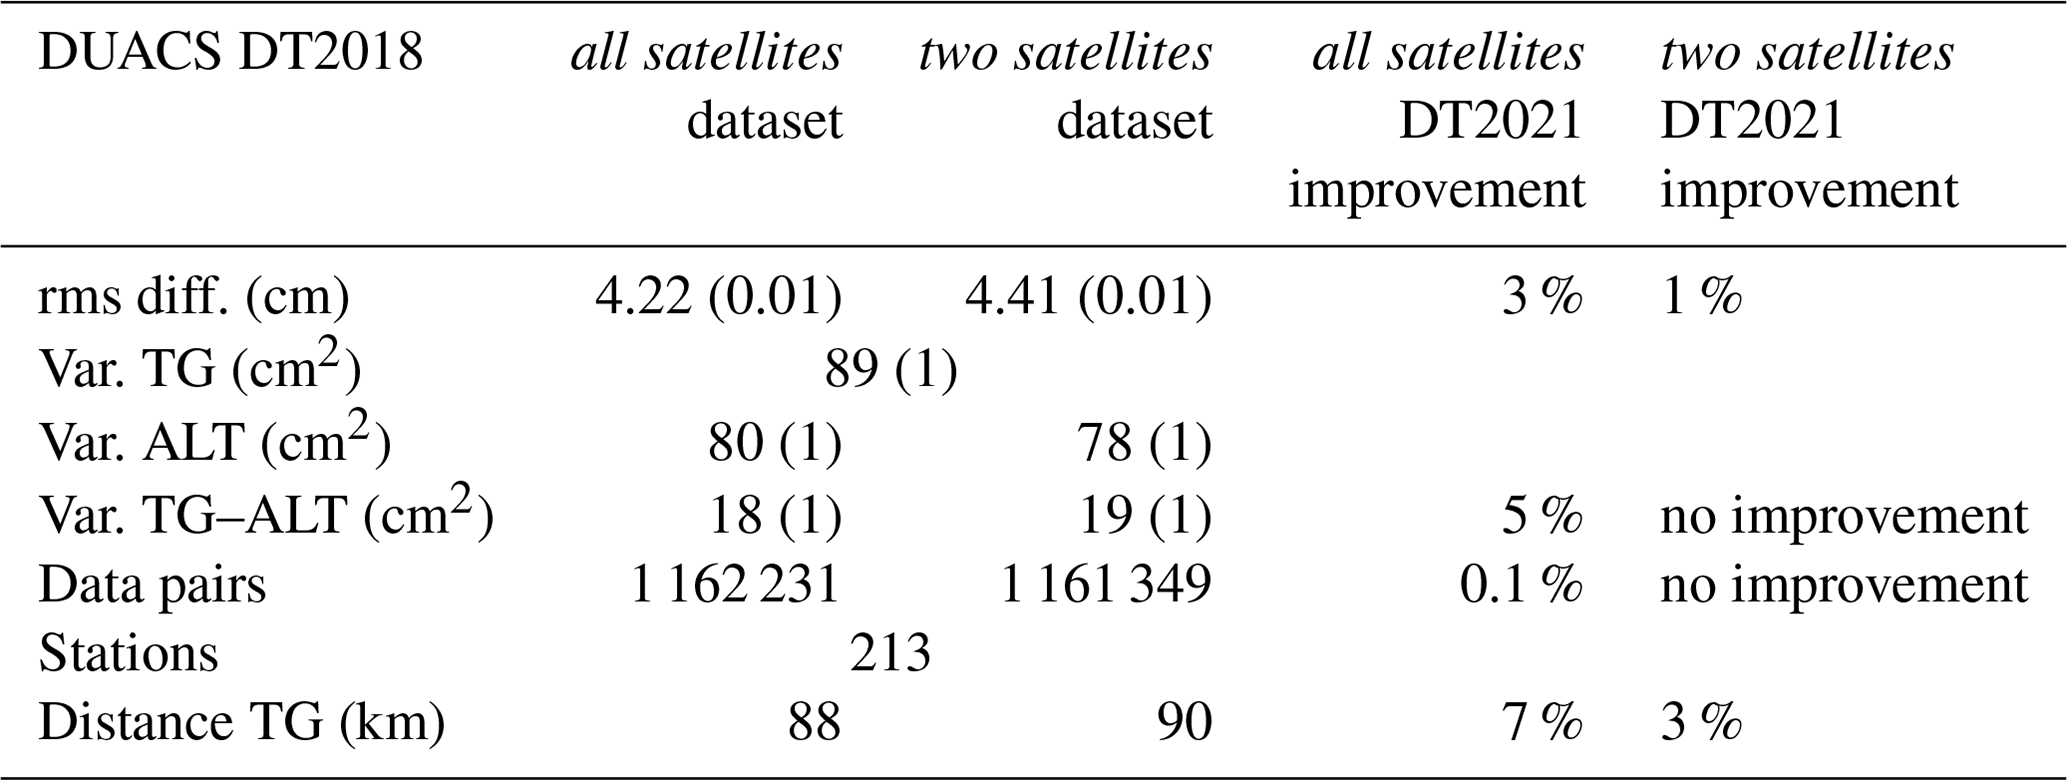
Overall, these values are larger than those reported in the previous section for the comparison using the DT2021 processing dataset (see Table 1). As a consequence, the DT2021 all satellites dataset reduces (i) the errors with tide gauges on the European coasts by 3 %, (ii) the variance of the differences between the datasets by 5 %, and (iii) the mean distance between the most correlated altimetry point and tide gauges by 7 %. Also, the number of valid data pairs used to conduct the intercomparison is enhanced by 0.1 % when using the DT2021 processing all satellites dataset. This highlights the impact of the new DUACS DT2021 reprocessing on the coastal areas that provides more valid measurements, located closer to the tide gauge sites, compared to the DT2018 reprocessing.
The new standards and updated geophysical corrections applied to the DUACS DT2021 reprocessing compared to the previous DT2018 version have a direct impact on the observation of coastal ocean sea level in the gridded products. To characterize this impact, the difference between DT2021 and DT2018 consistency is shown in Fig. 2. The spatial distribution of the differences in consistency shows an overall better performance of the DT2021 reprocessing (blue colours) at the connection region between the Baltic Sea and the eastern North Atlantic Ocean and in most of the Atlantic shore, where an improvement larger than 15 % is found for some tide gauge sites. A degradation of the DT2021 reprocessing is observed in most of the stations located in the western Mediterranean Sea and the southern coasts of Spain, including the Strait of Gibraltar area, and also in some stations located on the coasts of France, England and Ireland. On the other hand, discrepancies are hardly observed between the two reprocessings in the Baltic and Norwegian seas.
3.2.2 Two satellites SLA dataset
We present here the statistics of the intercomparison between the climatic (two satellites) DT2021 and DT2018 processing and tide gauges. The mean value (Table 2) of the rms difference between the DT2018 processing dataset and tide gauges is 4.41 cm, the variance of the differences (altimetry–tide gauge) is 19 cm2, and the mean distance between the location of the tide gauge and the corresponding altimeter data with the highest correlation is 90 km. If these results are compared with those reported above for the comparison using the DT2021 processing dataset (Table 1), it can be observed that the latter only improves the previous DT2018 reprocessing in terms of the errors with tide gauges that are reduced by 1 % and the mean distance between the most correlated altimetry point and tide gauges, reduced by 3 %, whereas the variance of the differences between the datasets and the number of valid data pairs used to conduct the intercomparison are quite similar. Such improvements are around 60 % lower than those reported for the all satellites datasets. This fact is reflected in the spatial distribution of the differences between DT2021 and DT2018 consistency with tide gauges (figure not shown). A better performance of the DT2021 reprocessing is obtained at the connection region between the Baltic Sea and the eastern North Atlantic Ocean and in parts of the Atlantic shore (coasts of United Kingdom and France). There is a degradation of the DT2021 reprocessing in most of the stations located in the western Mediterranean Sea and the southern coasts of Spain; and in some stations located on the coasts of France, England and Ireland. Also, negligible discrepancies between the two reprocessings are found in the Baltic Sea. This spatial pattern is quite similar to that obtained for the all satellites dataset described above. However, a degradation of the DT2021 reprocessing is observed in most of the stations located in both the NWS region (southern coasts of the North Sea) and the Norwegian Sea. This is a novelty with respect to the previous computation emphasizing the overall poorer improvements in the DUACS DT2021 two satellites dataset over the previous reprocessing.
3.3 Performance of DT2021 reprocessing in monitoring the long-term evolution of sea level
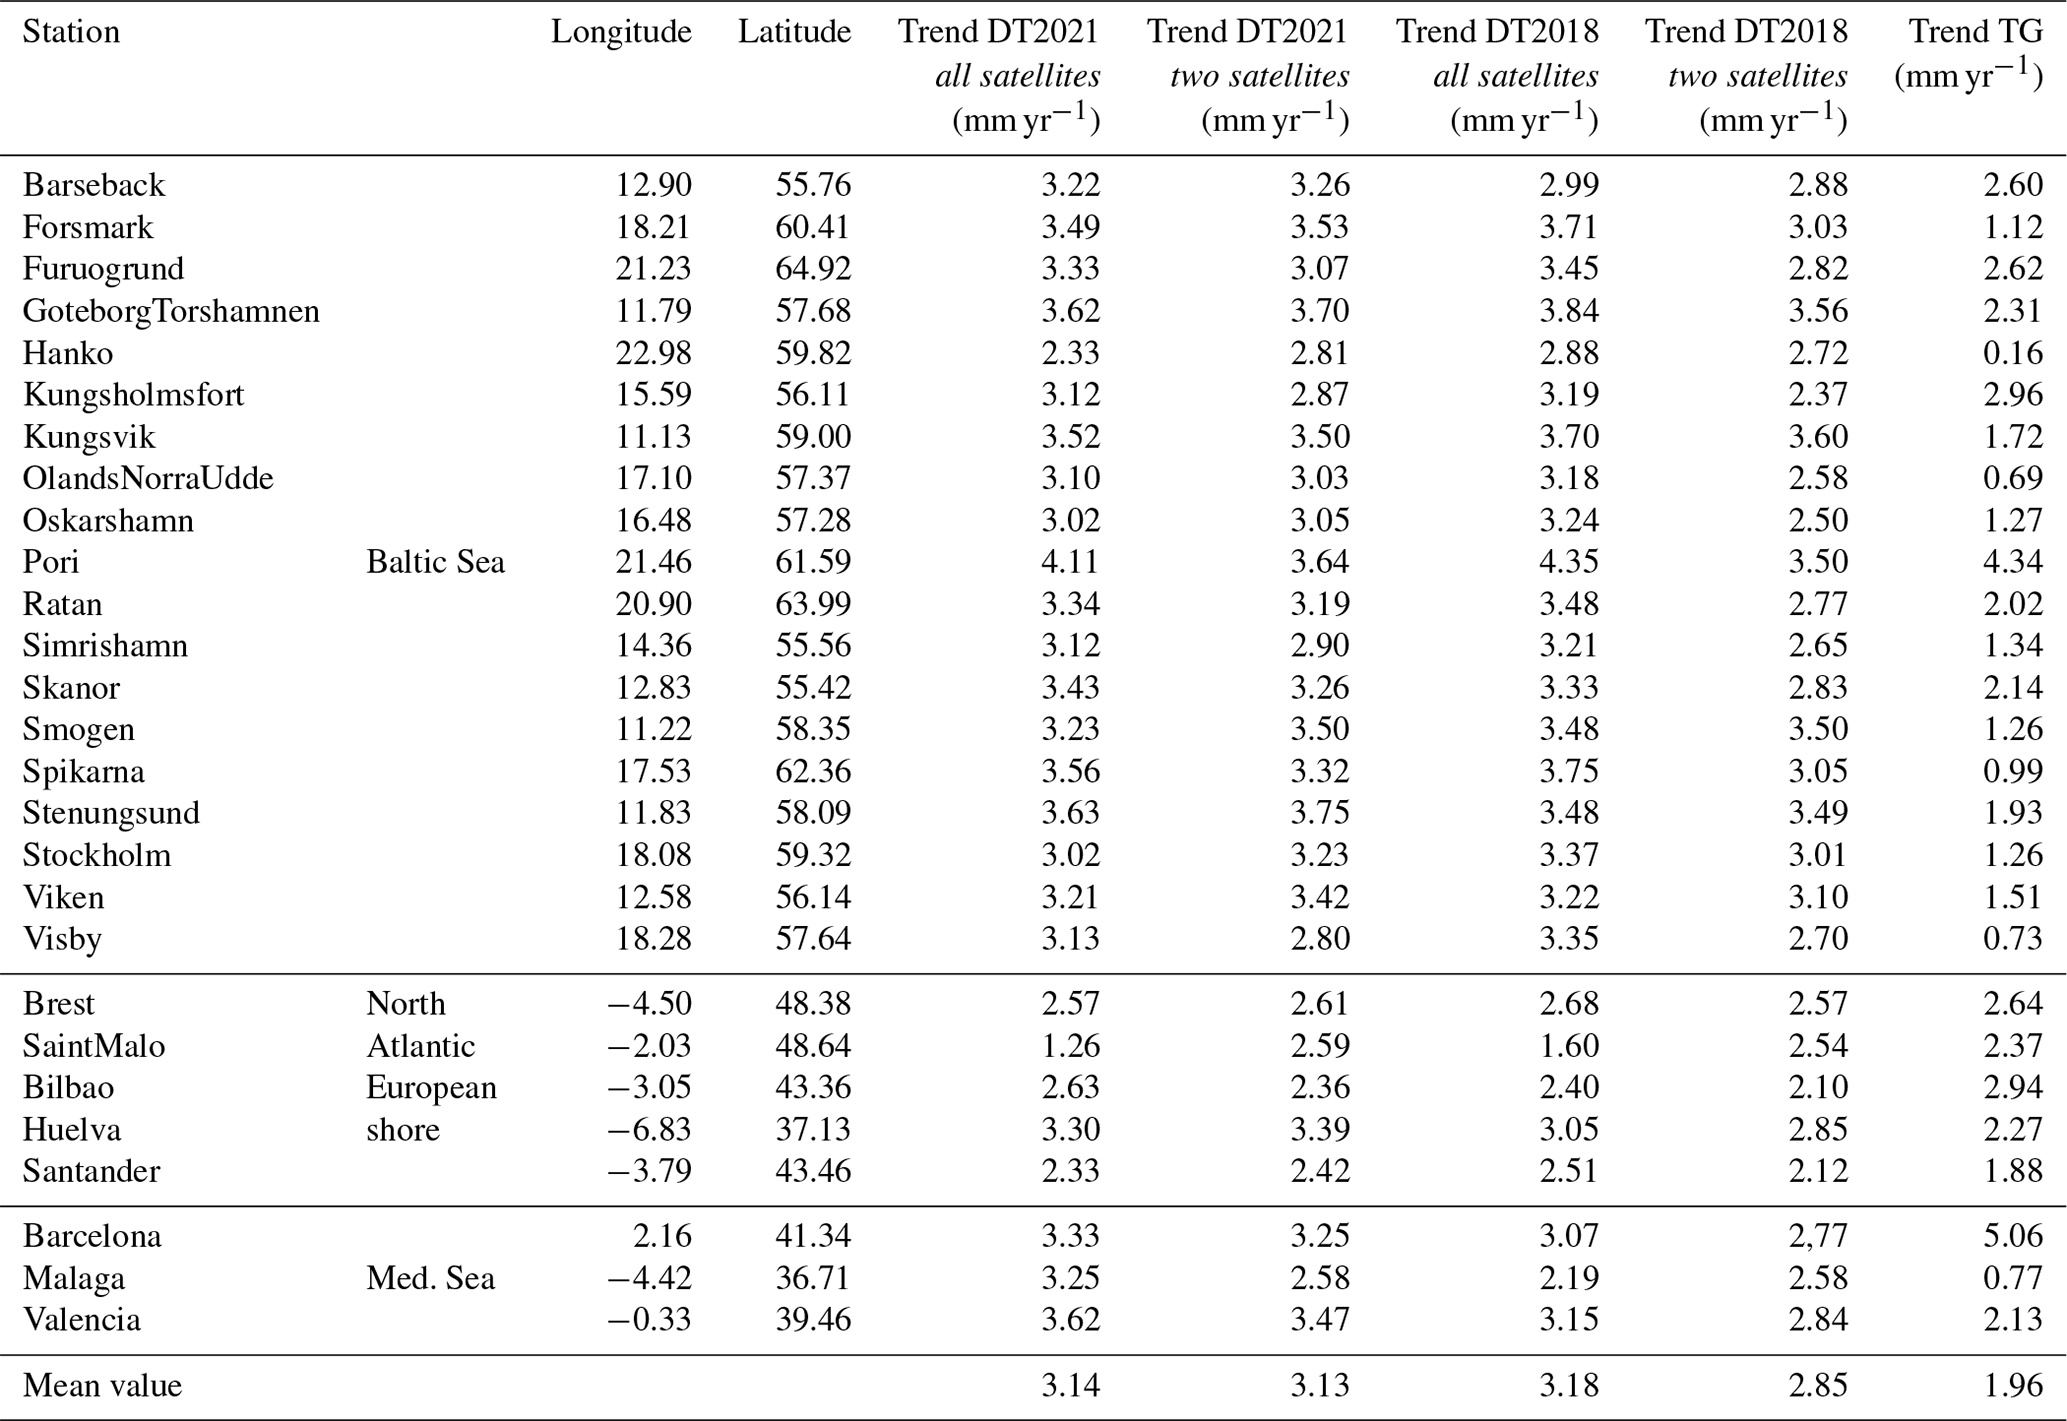
The computation described above has been conducted by using all available information from the tide gauge dataset, thus including time series of different length from a few years to less than 3 decades (Table B1 of Appendix B). To assess the performance of the DUACS DT2021 processing version in monitoring the long-term evolution of sea level in the coastal zone of the European seas the analyses described above were repeated for a specific time period spanning 20 years: from 1 January 2000 to 31 December 2019. This time period has been chosen because of the largest number of available altimeter missions used to generate the all satellites SLA maps. Tide gauge time series with valid data within such a time interval were considered, allowing of the intercomparison altimetry–tide gauges for long-term time series with the same length. Moreover, only tide gauge time series with at least 99 % of valid data were used in order to allow the analysis of linear trends. This reduced the original tide gauge dataset to a subset of 27 stations (Tables B1, B2 of Appendix B) mainly located in the northern half of the Baltic Sea (70 % of stations) with sparse stations distributed along the coasts of France and Spain (Fig. 3). This analysis has also been conducted for the DUACS DT2018 reprocessing for comparison purposes.
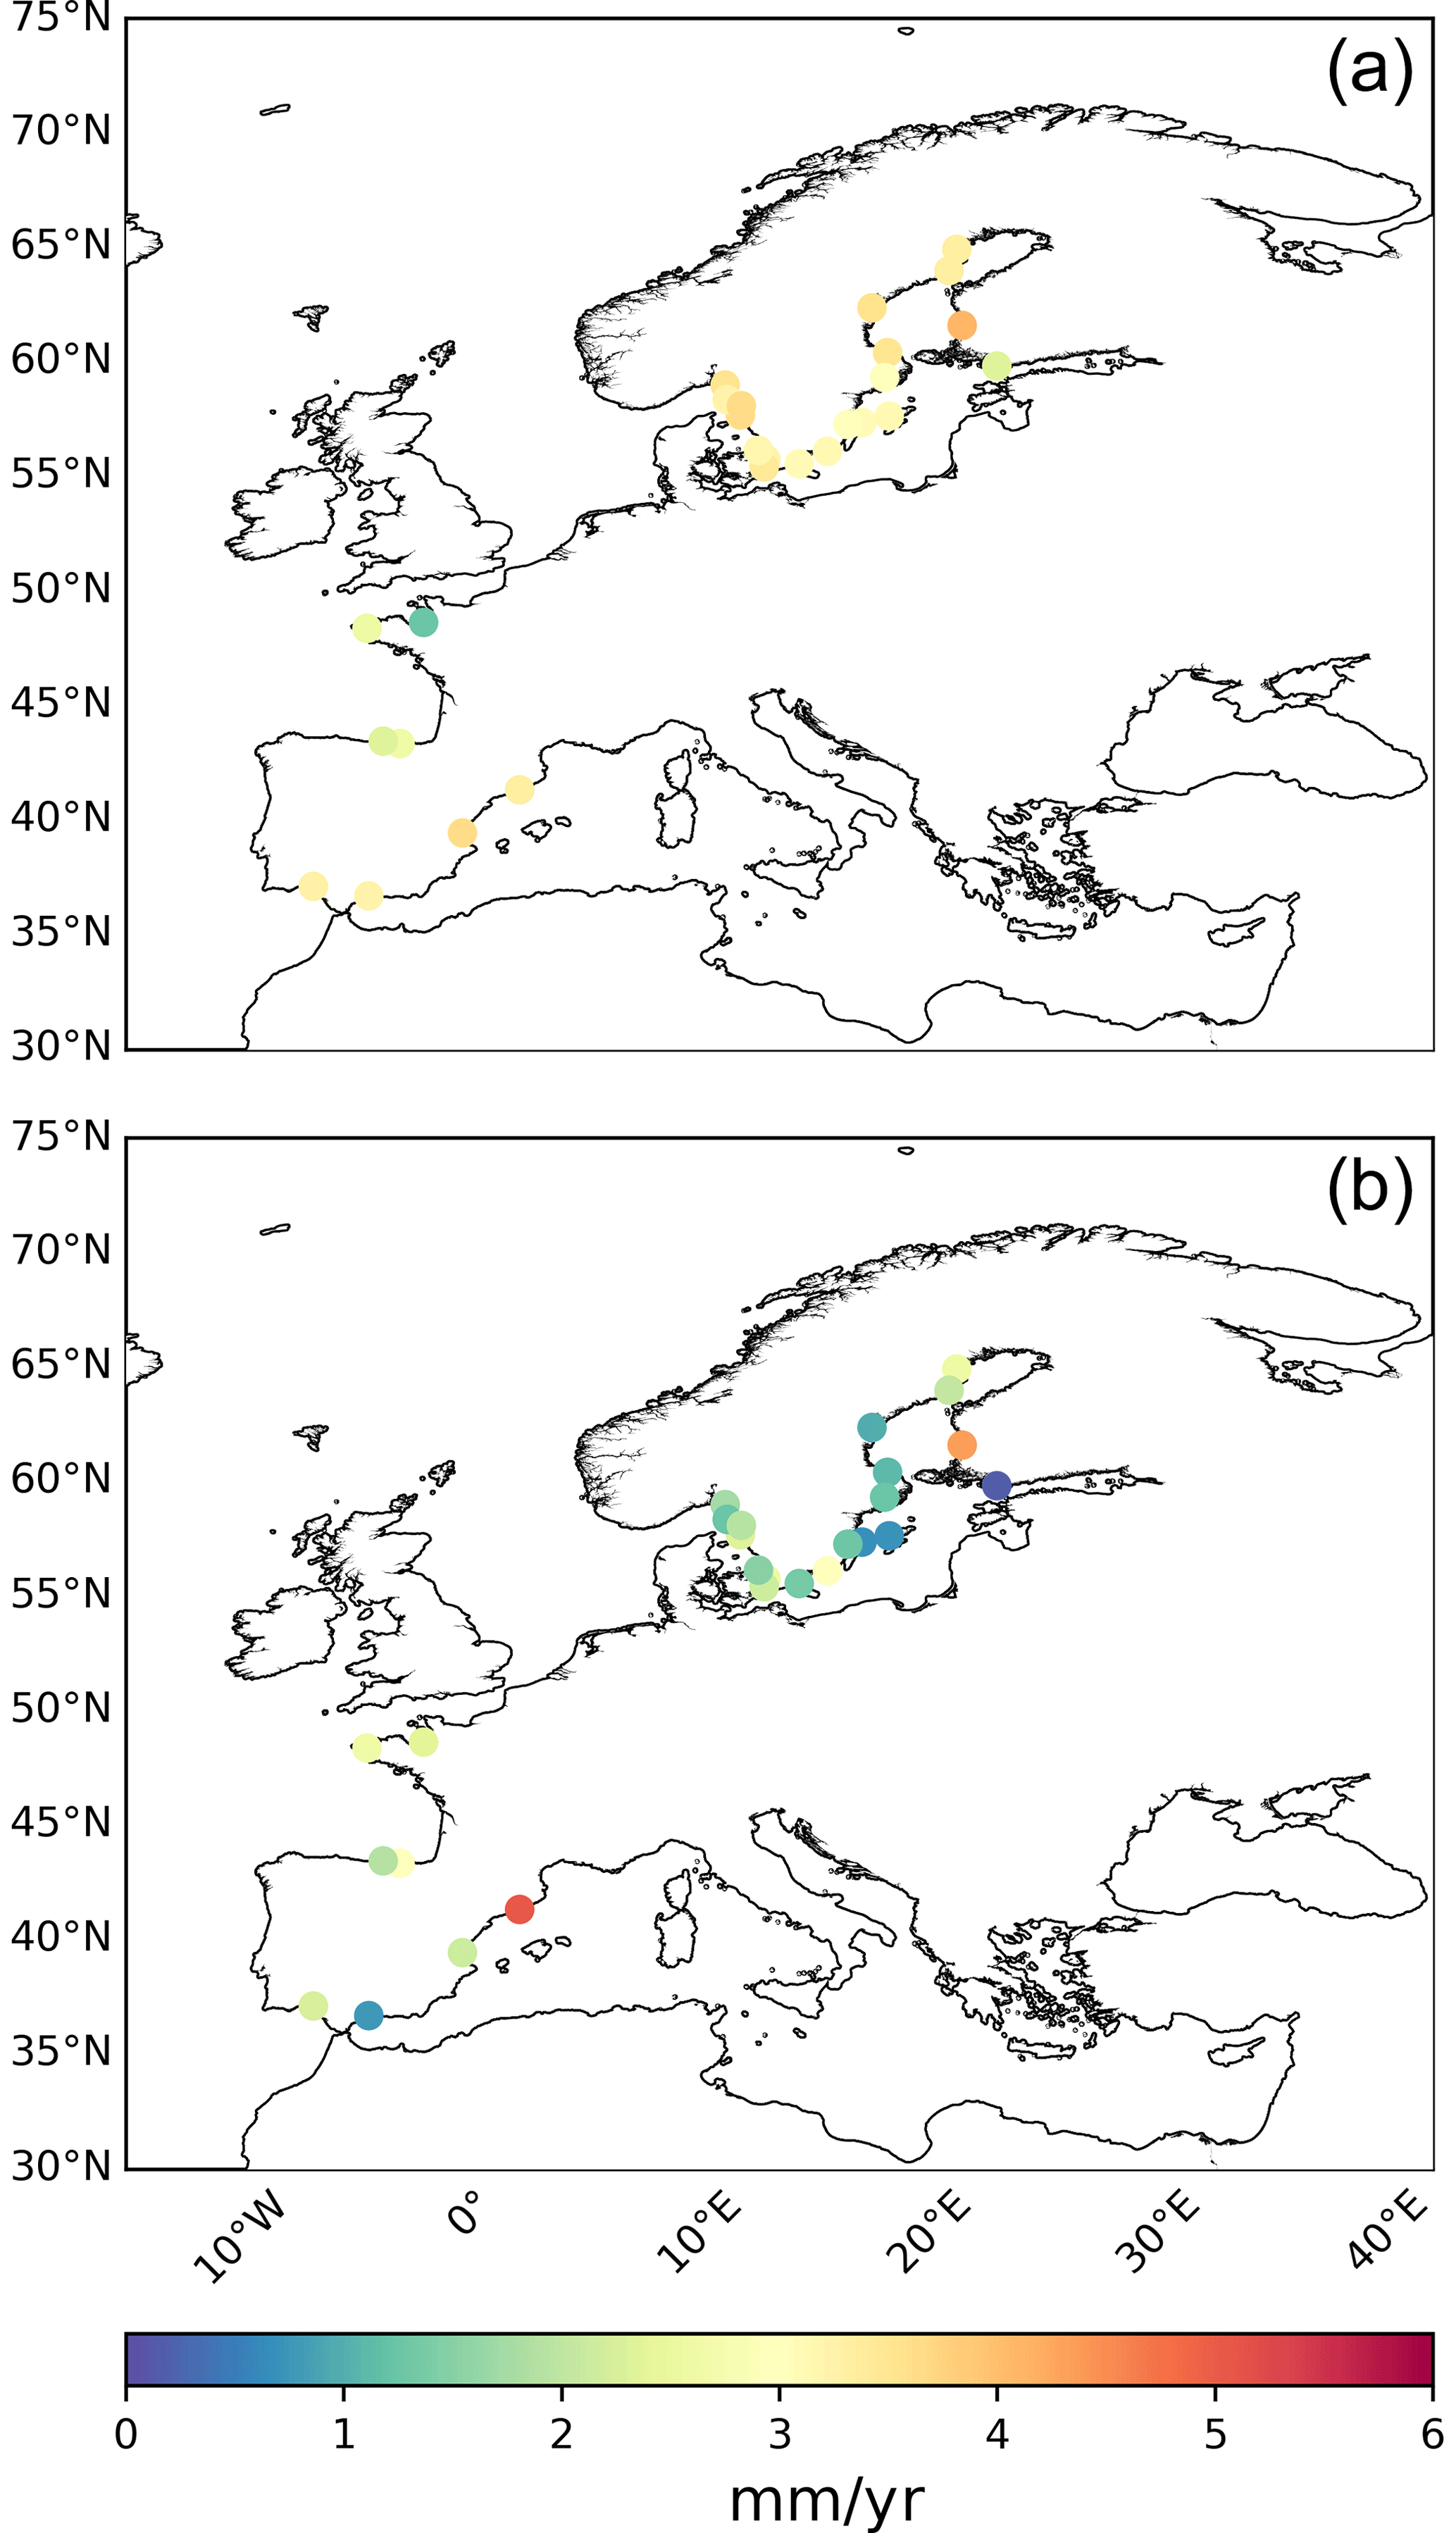
Figure 3Spatial distribution of linear trends (mm yr−1) for altimetry (a) and tide gauges (b) computed from monthly averaged data for the 20-year time period from 1 January 2000 to 31 December 2019. The all satellites dataset from the DUACS DT2021 reprocessing has been used.
Linear trends based on monthly observations at each tide gauge site (Fig. 3 and Table B2 of Appendix B) computed from the DUACS DT2021 all satellites dataset (Fig. 3a) show a homogeneous spatial pattern with overall values varying from 2.30 to 4.10 mm yr−1 in the Baltic and Mediterranean seas and between 2.30 and 3.30 mm yr−1 in the sparse stations located along the North Atlantic European shore, except for the station of SaintMalo that presents a linear trend of 1.26 mm yr−1. Linear trends computed from tide gauges (Fig. 3b) exhibit a more heterogeneous spatial pattern with values ranging between less than 1 mm yr−1 for some stations located in the Baltic Sea and 5.06 mm yr−1 for the station of Barcelona (western Mediterranean Sea). However, most of the tide gauge stations present trend values ranging from 1.30 to 3 mm yr−1. These results provide further evidence, if needed, of the European seas coastal sea level rise, including the westernmost part of the Mediterranean Sea. The differences in trends between the two datasets vary, in absolute values, between near 0 mm yr−1 (Brest station, Atlantic French coast) to close to 2.60 mm yr−1 found in the station of Spikarna (Baltic Sea).
Linear trends computed from the DUACS DT2021 two satellites dataset (figure not shown) exhibit quite a similar spatial pattern with values ranging from 2.60 to 3.80 mm yr−1 in the Baltic and Mediterranean seas and between 2.40 and 3.40 mm yr−1 along the North Atlantic European coasts. However, some discrepancies between the two datasets are observed. These differences, computed as all satellites minus the two satellites datasets are displayed in Fig. 4. Overall larger linear trends (up to 1 mm yr−1) were obtained for the all satellites dataset in the northernmost and central Baltic Sea as well as in the stations located in the Mediterranean Sea, whilst lower values of the same magnitude are mainly observed at the entrance of the Baltic Sea and in most of the stations located along the North Atlantic European shore.
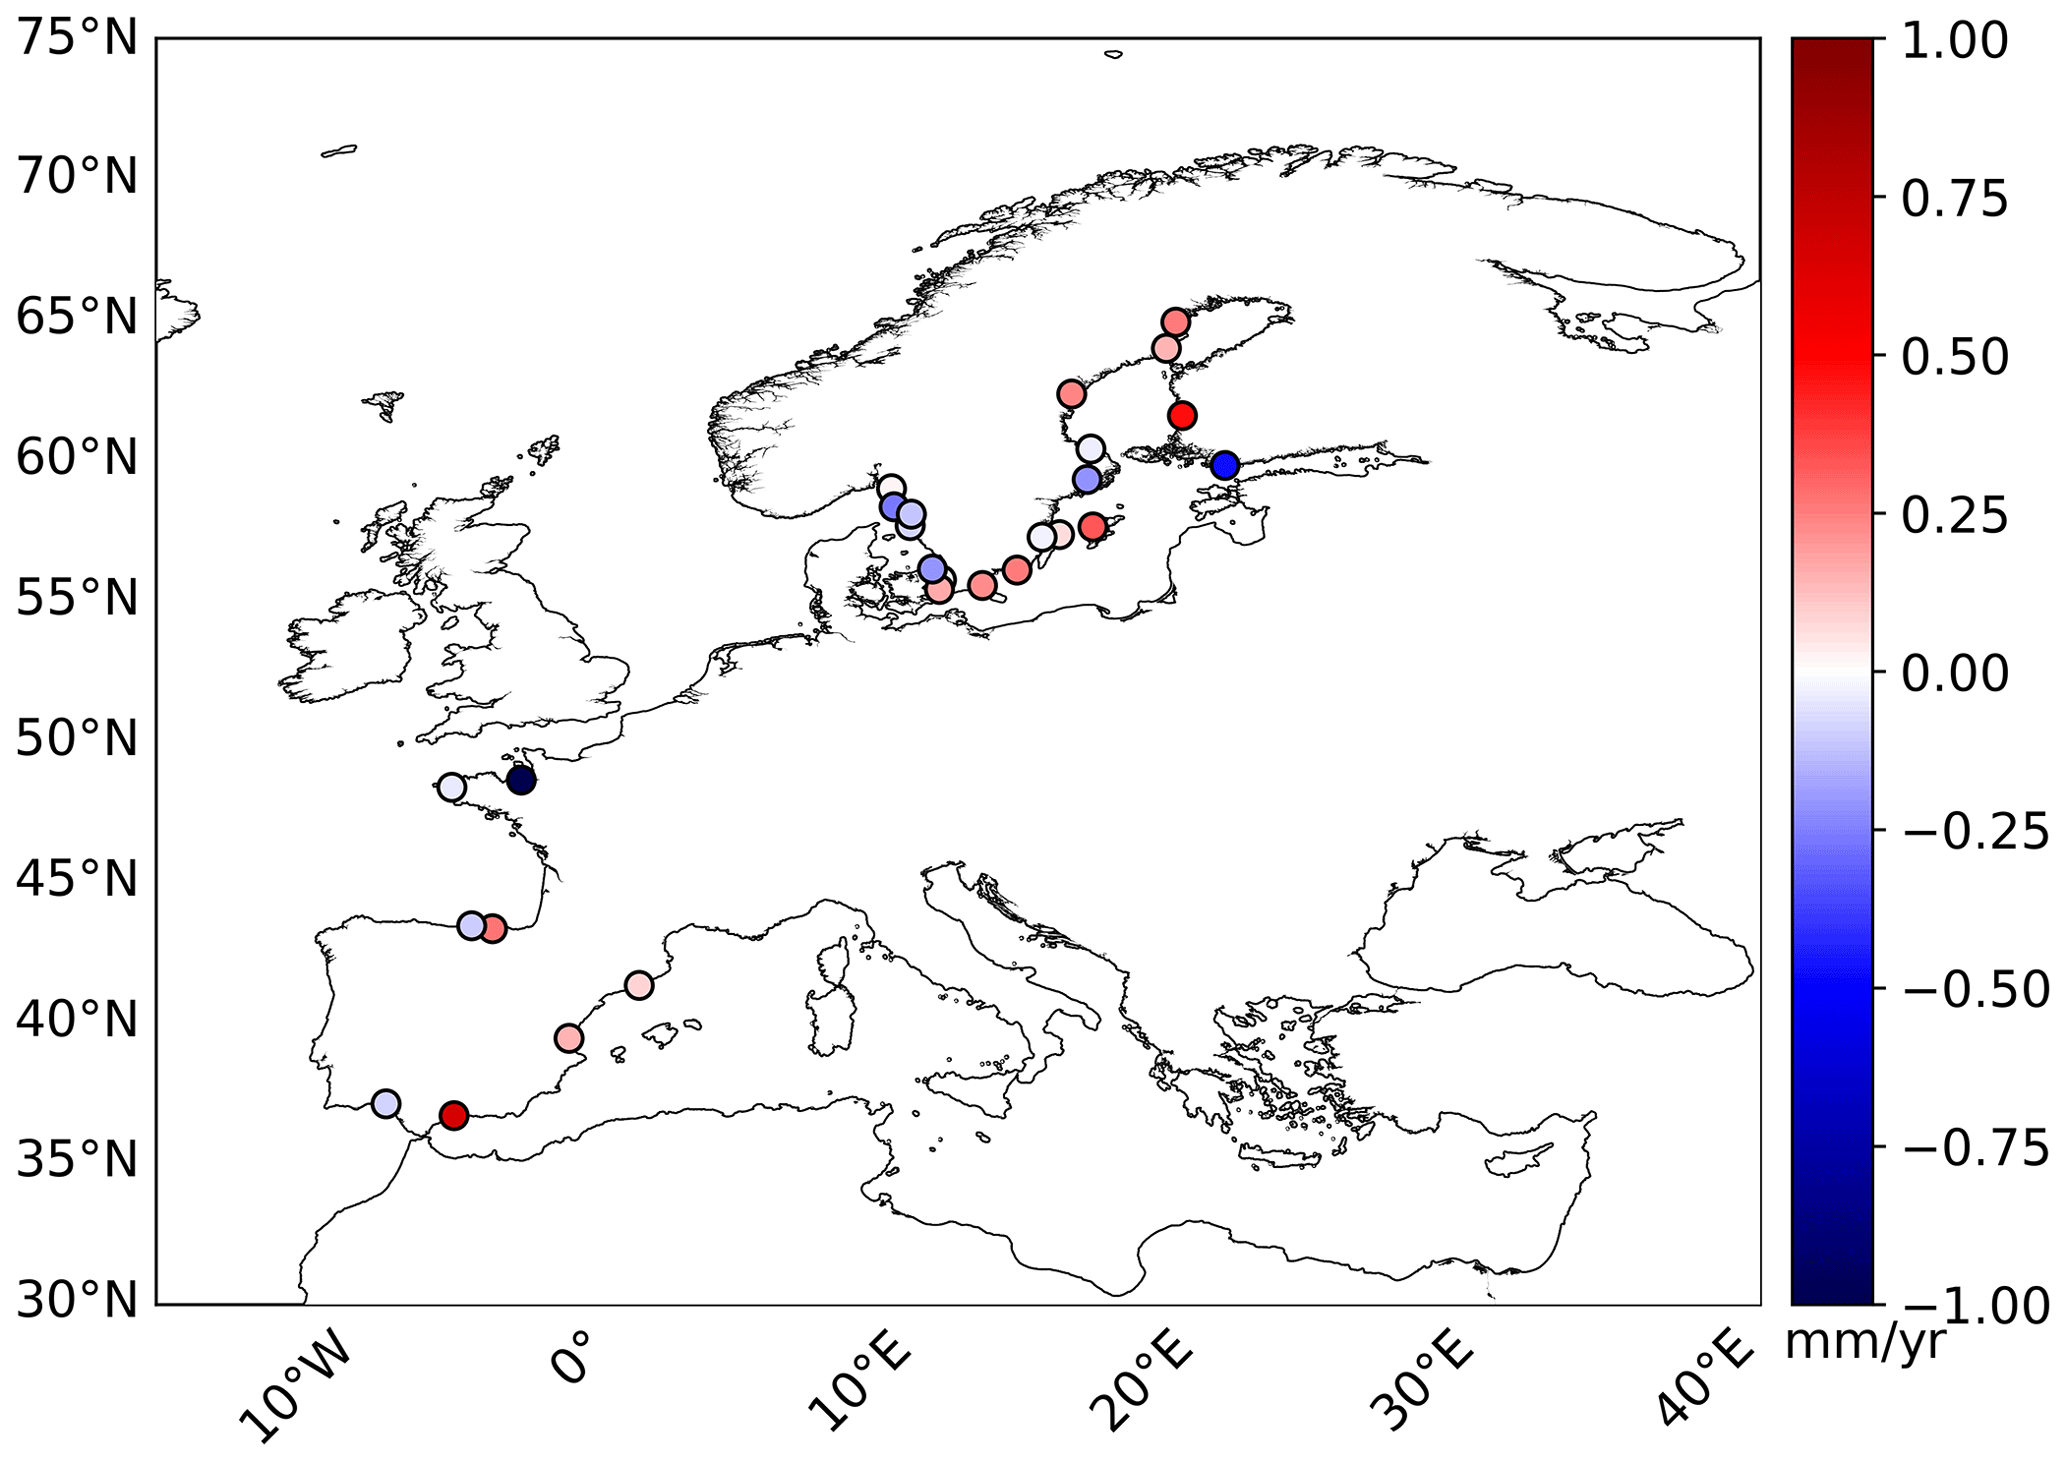
Figure 4Spatial distribution of the differences (all satellites minus two satellites dataset) for the linear trends (mm yr−1) from altimetry computed from monthly averaged data for the 20-year time period from 1 January 2000 to 31 December 2019. The DUACS DT2021 processing version has been used. Blue (red) colours denote lower (larger) trends for the all satellites dataset.
On the other hand, linear trends computed from the DT2018 reprocessing (figures not shown) exhibit quite a similar spatial pattern to that reported for the DT2021 processing version with overall values ranging from 2.20 (2.40) to 4.35 (3.60) mm yr−1 in the Baltic and Mediterranean seas and between 2.40 (2.10) and 3.05 (2.85) mm yr−1 along the North Atlantic European coasts for the all satellites (two satellites) dataset. Thus, hardly any differences in range are observed between the all satellites dataset from the two reprocessings, whereas these differences increase for the two satellites dataset, with a lower variability observed for the DT2018 reprocessing. This fact has an impact on the spatial distribution of the differences between the two processing versions (Fig. 5).
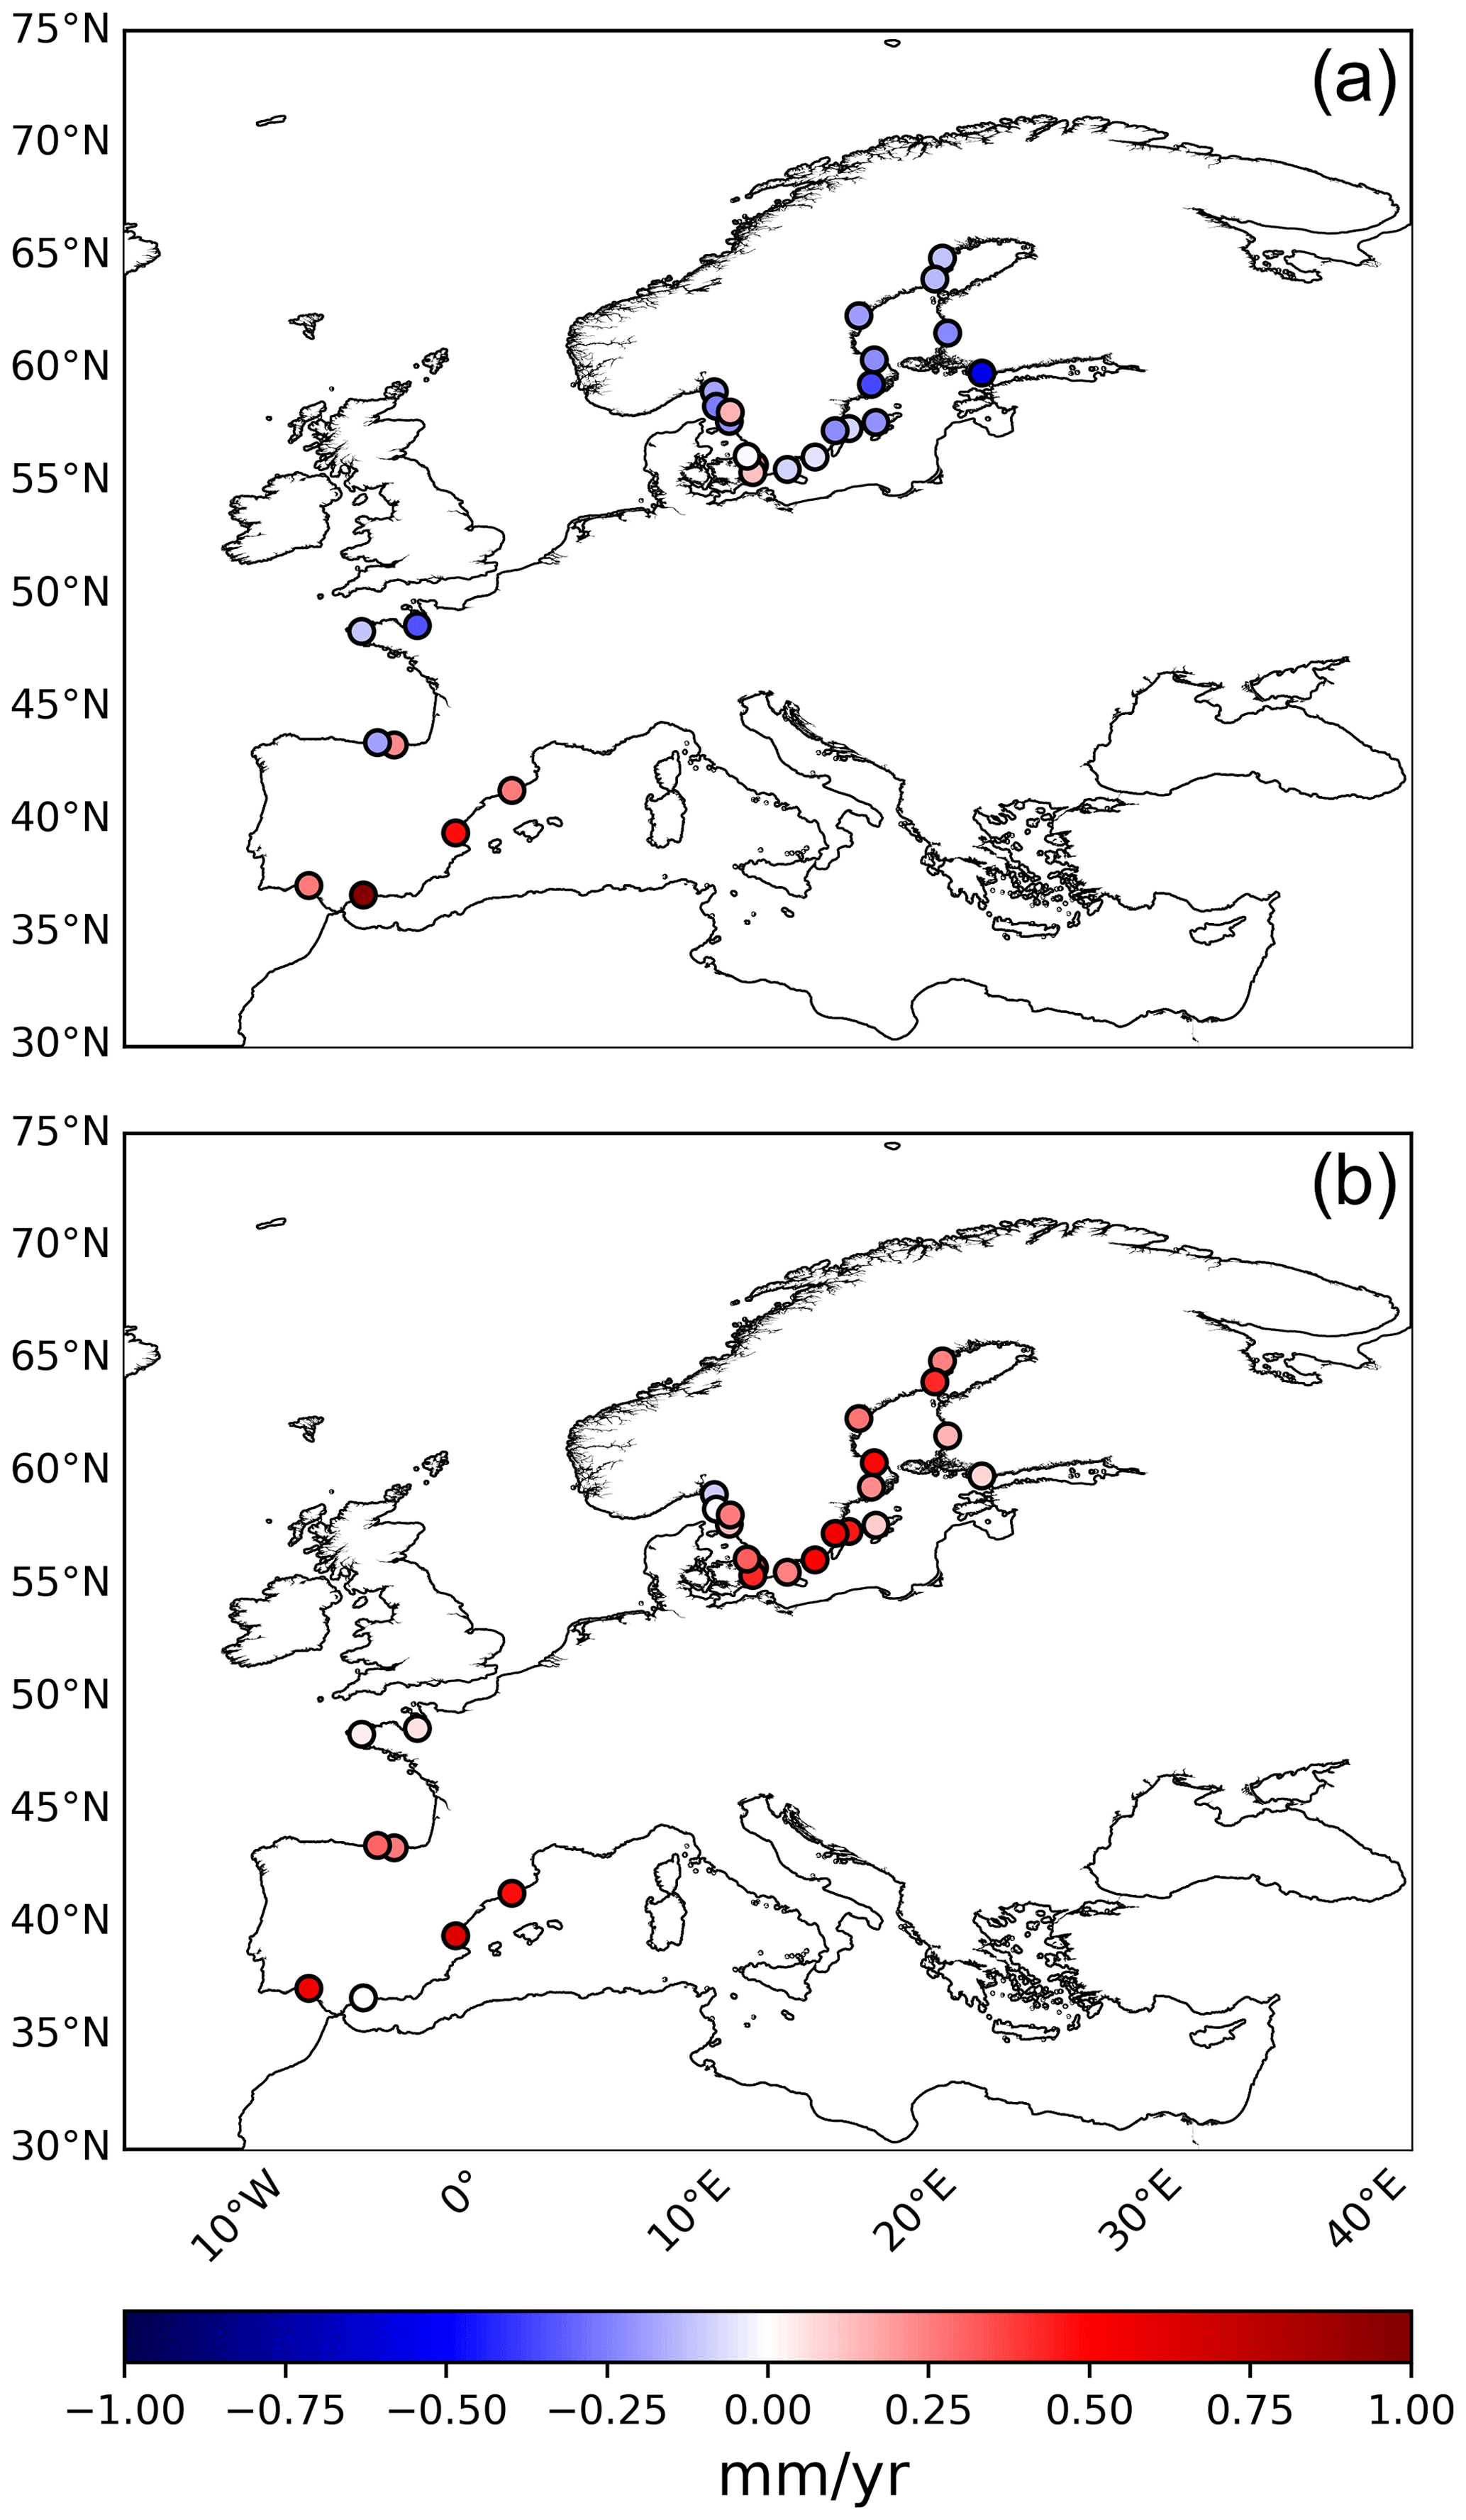
Figure 5Spatial distribution of the differences (DT2021 minus DT2018 reprocessing) for linear trends (mm yr−1) for altimetry computed from the all satellites dataset (a) and the two satellites dataset (b). Monthly averaged data for the 20-year time period from 1 January 2000 to 31 December 2019 have been used. Blue (red) colours denote lower (larger) trends for the DT2021 reprocessing.
For the all satellites dataset (Fig. 5a), two different spatial patterns were observed with lower trends for the DT2021 reprocessing in the Baltic Sea basin and most of the stations located along the North Atlantic European coasts, whereas larger values are obtained for the tide gauge stations located in the western Mediterranean Sea and some sparse stations at the entrance of the Baltic Sea. By contrast, the spatial distribution of the differences between the two reprocessings for the two satellites dataset (Fig. 5b) depicts a homogeneous spatial pattern with overall larger trends for the DT2021 reprocessing except for the tide gauge station of Barseback located in the connection region between the Baltic Sea and the eastern North Atlantic Ocean (Table B2 in the Appendix B). Figure 5 also reveals the differences between the two reprocessings and for the two datasets, when making a comparison with linear trends from tide gauges: the two satellites dataset from the DT2021 processing version presents larger differences with tide gauges with respect to the DT2018 reprocessing in the whole domain, whilst this is only observed for sparse stations along the North Atlantic shore and the stations located in the Mediterranean Sea for the all satellites dataset. Thus, closer results were obtained from the DT2021 all satellites product with respect to the former DT2018 processing version in most of the Baltic Sea region and the stations located along the North Atlantic European coast.
More than 29 years of DUACS Level 3 and Level 4 altimeter data have been recently reprocessed and delivered under the name of the DT2021 processing version through the Copernicus Marine Service and the Copernicus Climate Change Service. The all satellites SLA products include all the available altimeter missions (ranging from two to seven over the period considered in this study), which makes the errors not constant in time since they depend on the number of satellites used. Maps from the all satellites products provide the most accurate sea level estimation with the best spatial and temporal sampling of the ocean at all times. The two satellites SLA dataset is obtained by merging a steady number of altimeters (two) in the satellite constellation. This promotes consistent errors during the whole time period. Maps that include only two satellites are used to compute the most homogeneous and stable sea level record over time and space. Thus, two satellites products are dedicated to monitoring long-term sea level evolution for climate applications and analysing ocean climate indicators such as global and regional MSL evolution (Taburet et al., 2019).
The new standards applied to the DT2021 version and the update of various geophysical correction parameters compared to the previous release improved the all satellites product quality having a direct impact on the observation of coastal ocean sea level in the gridded products. To achieve independent comparisons, SLA from altimetry in the coastal zone of the European seas was examined through comparison with in situ tide gauge measurements. Compared to the previous DT2018 version, an improvement in the all satellites dataset was obtained, with a reduction of 3 % in errors when compared with tide gauges and of 5 % in the variance of the differences between the datasets. The mean distance between the most correlated altimetry point and tide gauges reduced by 7 %. Also, the number of valid data pairs used to conduct the intercomparison enhanced by 0.1 % when using the DT2021 processing. This highlights the impact of the new DUACS DT2021 version on the coastal areas that provides more valid measurements and located closer to the tide gauge sites, compared to DT2018 reprocessing. On the other hand, almost no improvement in the DT2021 two satellites dataset over the previous reprocessing was found when using all available information from the tide gauge dataset (time series of different length) in the computation: errors with tide gauges were reduced by 1 %, and the mean distance between the most correlated altimetry point and tide gauges was reduced by 3 %. The variance of the differences between the datasets and the number of valid data pairs used to conduct the intercomparison were quite similar among the DT2021 and DT2018 processing versions. These improvements were around 60 % lower than those reported for the all satellites datasets. This fact could be explained by differences in the mapping parameters used for the two products: DT2021 mapping parameters (i.e. spatial and temporal correlation scales, a priori errors on the measurements) are evolved in CMEMS products (CMEMS QUID, 2022) with the objective of better retrieving mesoscale signals, whilst no evolution of the mapping parameter was implemented in the C3S DT2021 product (PUGS, 2021).
The quality assessment of DUACS DT2021 reprocessing revealed a better performance of the all satellites products in the retrieval of SSH in the coastal zone with respect to the two satellites products for the time period investigated (27 years). A reduction of 5 % in errors with tide gauges and 10 % in variance difference between altimetry and tide gauges was obtained when using the all satellites dataset with respect to the two satellites product. This is because despite the larger stability of the two satellites dataset, this product is optimized for climatic signal when analysing low-frequency signals (SSH trends). Thus, it performs less well for higher-frequency signals. In this context (analysis of high-frequency signals), the results reported here show that the all satellites dataset should be considered for the analysis of long time series of SSH in the coastal zone of the European seas including all frequency signals. This can be clearly seen in Fig. 6 showing the differences (computed as all satellites minus two satellites datasets) for consistency between altimetry and tide gauges.
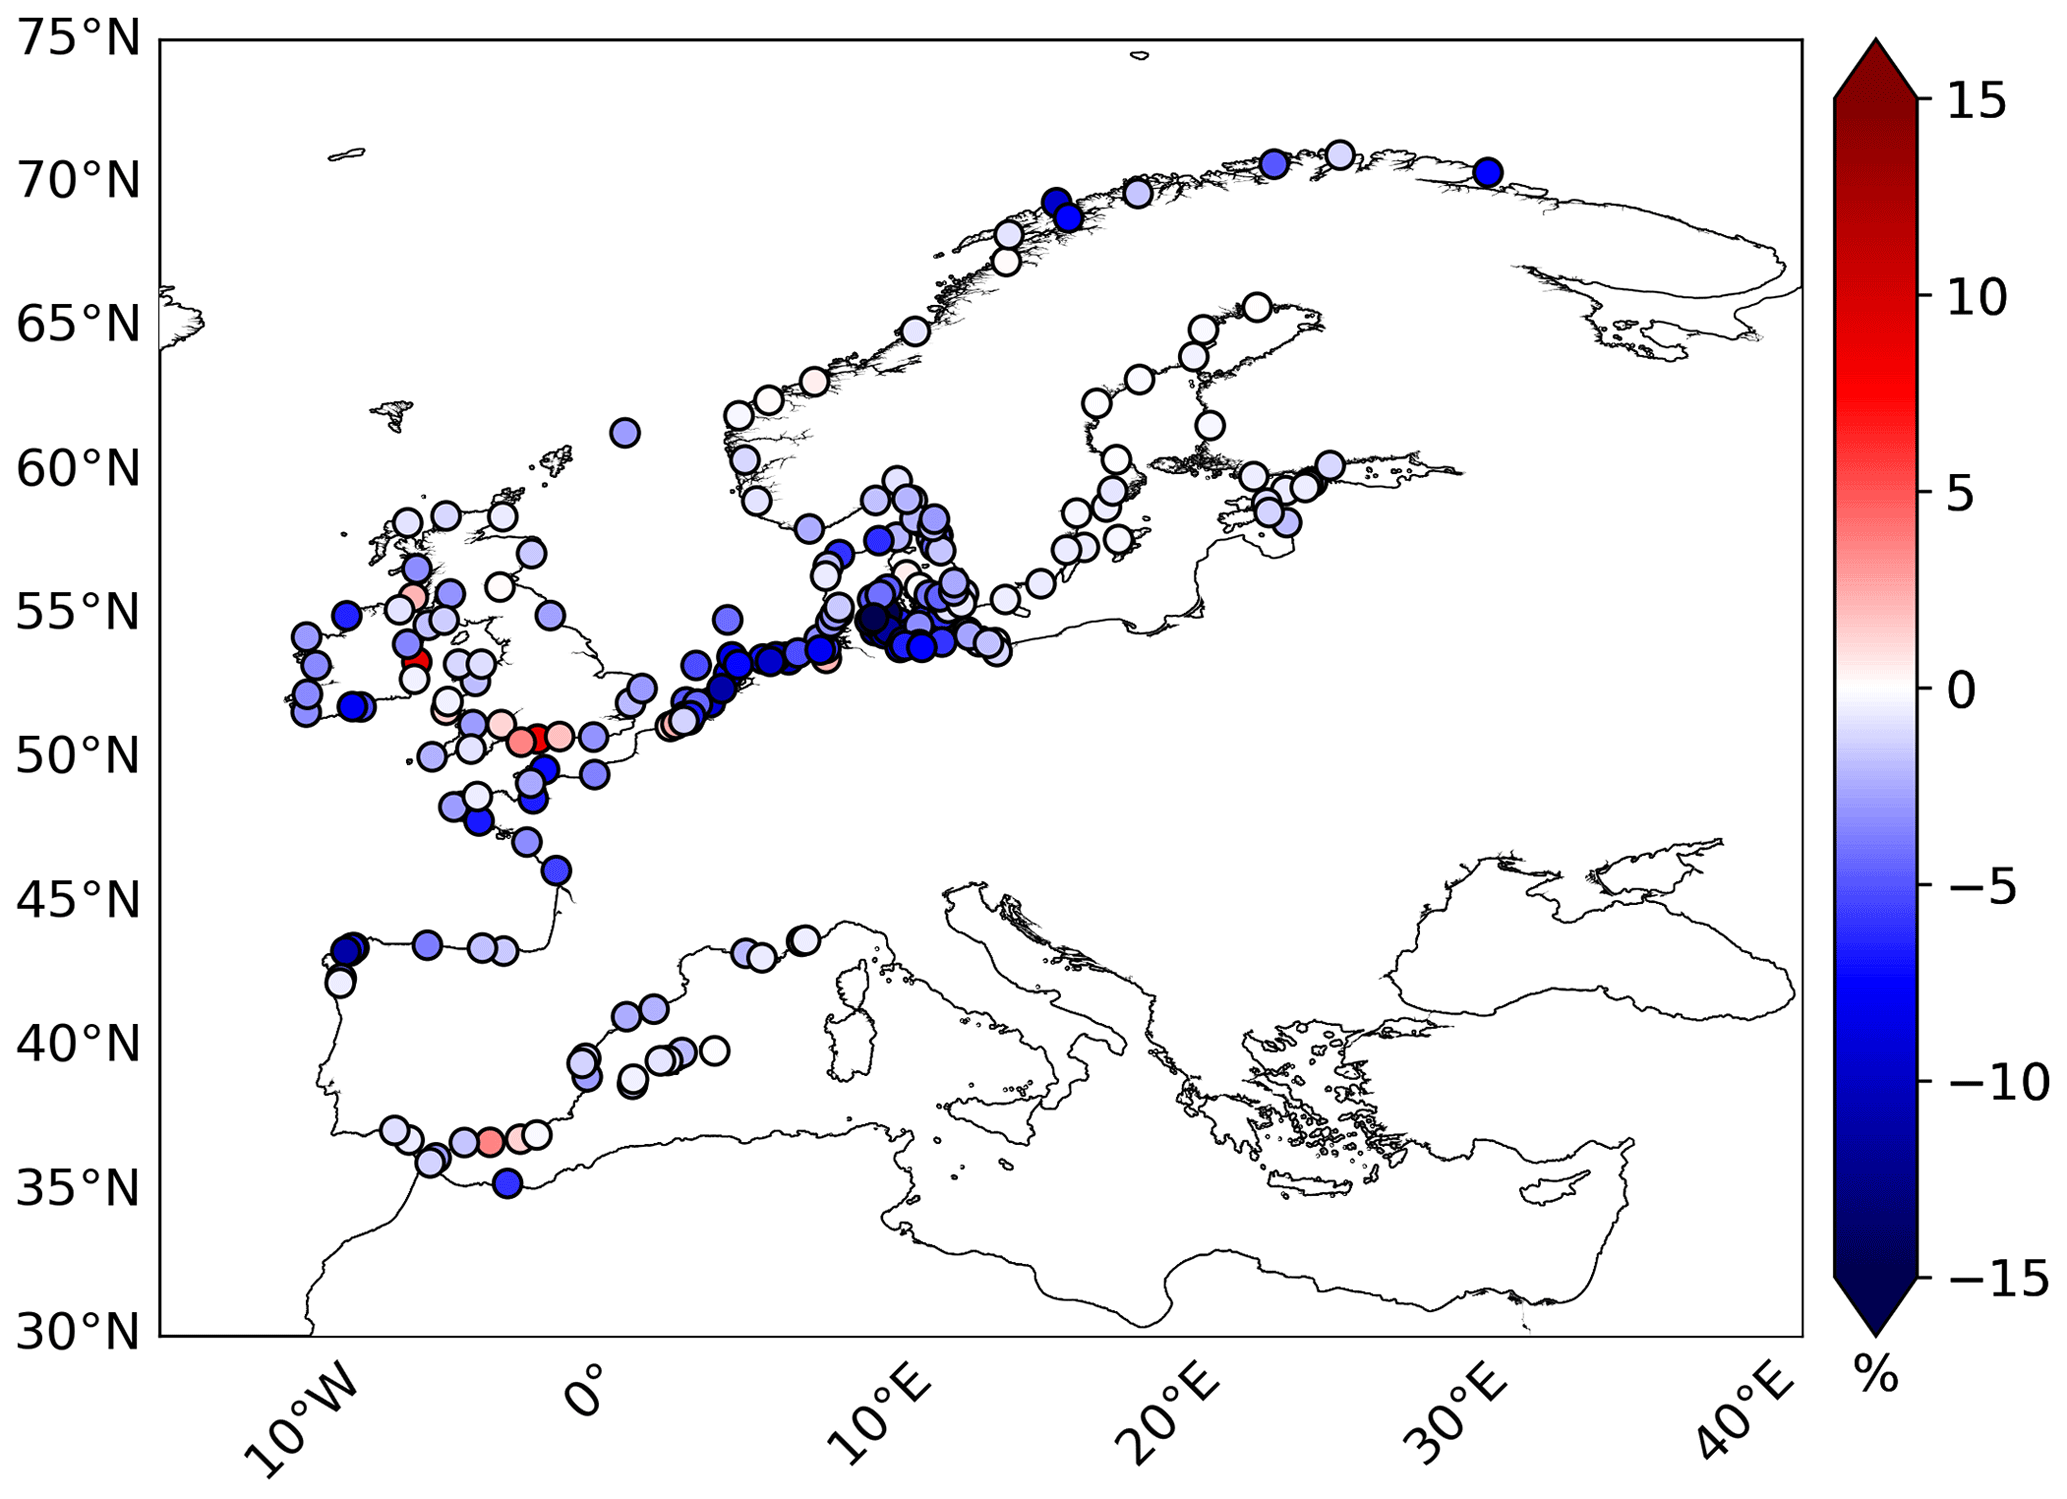
Figure 6Spatial distribution of the differences (all satellites minus two satellites dataset) for the mean square differences between the tide gauge and altimetry sea level. Units are the percentage of the tidal variance. The DUACS DT2021 processing version has been used. Blue (red) colours denote an improvement (degradation) of the all satellites dataset.
An overall better performance (blue colours) of the all satellites product with respect to the two satellites one was observed in the whole domain except in the Baltic Sea and the westernmost part of the Norwegian Sea, where similar results are obtained. The improvement is larger along most of the Atlantic shore, namely at the connection region between the Baltic Sea and the eastern North Atlantic Ocean, the NWS region, and the northern Norwegian Sea, with a reduction in the variance difference between the two datasets larger than 15 %. The Mediterranean Sea and the Strait of Gibraltar area show closer values between the two products with an improvement lower than 5 %. These improvements could be explained by the better sampling of the high-frequency signal in the coastal zone in the all satellites dataset due to the large number of altimeters available to generate the SLA maps compared to the two satellites maps. Improved mapping parameters for mesoscale (and thus high-frequency) processes could also contribute. The observed degradation of the all satellites product with respect to the two satellites one at some tide gauge sites could be due to high-frequency local features badly captured by the all satellites product that translate into larger errors when making a comparison with tide gauges.
Linear trends based on monthly observations at each tide gauge site were computed to assess whether the DUACS DT2021 release can be representative of the local sea level along the European coasts and western Mediterranean Sea. To do that, sea level linear trends for the period 2000–2019 were computed from both the all satellites and two satellites datasets. The analysis was repeated for the DT2018 reprocessing to have a term of comparison. A homogeneous spatial pattern with overall values ranging from 2.30 (2.40) to 4.10 (3.80) mm yr−1 was obtained for the all satellites (two satellites) dataset from the DT2021 reprocessing. This promotes a mean trend for the whole domain of 3.14 (3.13) mm yr−1. These trends differ slightly from those computed from the tide gauge subset covering the 20-year time period that show values ranging between less than 1 and 5.06 mm yr−1; the mean trend for the whole domain is 1.96 mm yr−1.
Thus, trends computed from DT2021 products are on average around 1.2 mm yr−1 larger than those obtained from tide gauges. Similar overestimations in altimetry mean trends were reported by Agha-Karimi et al. (2021) in the Baltic Sea for datasets covering the time period between 1993 and 2020. These discrepancies could be attributed to the heterogeneous distribution of both datasets and also the crustal land uplift due to postglacial rebound resulting from the last glacial age affecting the Baltic Basin, where most of the tide gauge stations are located. This translates into conventional altimetry measurements not being accurate enough in the coastal zone. On the other hand, when using the former DUACS DT2018 processing version, slightly larger discrepancies with tide gauges were obtained for the all satellites dataset, with a mean trend of 3.18 mm yr−1, whilst the two satellites product showed closer values to tide gauges with a mean linear trend of 2.85 mm yr−1.
Overall, linear trend differences (altimetry–tide gauge) for the DT2021 reprocessing varying, in absolute value, from 0.16 to 2.57 mm yr−1, with an average of 1.43 mm yr−1 were obtained for the all satellites dataset. They varied from 0.03 to 2.65 mm yr−1, with an average of 1.40 mm yr−1 for the two satellites dataset. These discrepancies are lower than 1.5 mm yr−1 on average and corroborate the agreement and complementarity of the two techniques to measure sea level variability in the coastal zone. They also emphasize a better performance of the C3S DT2021 dataset in the estimation of sea level linear trends in the coastal zone. This was also corroborated by the computation conducted for the DT2018 reprocessing: lower differences between tide gauge and altimetry trends computed from the two satellites dataset were obtained. Figure 7 displays the spatial distribution of the differences in trend computed as altimetry minus tide gauges for the two satellites dataset from the DT2021 reprocessing. An overall overestimation of trends from altimetry in the whole domain was obtained. By contrast, three tide gauge sites (Bilbao on the Atlantic Spanish coast, Pori on the eastern side of the Baltic Sea and Barcelona in the western Mediterranean Sea; Table B2 in Appendix B) showed a long-term sea level linear trend that was 0.58, 0.70 and 1.81 mm yr−1 larger, respectively, than that found for the closest altimetry point with the largest correlation. The differences in trend could be attributed to the aforementioned factors rendering altimetry measurements not accurate enough in the coastal zone. In any case, the linear trends for the tide gauge of Barcelona described above are of the same order of magnitude than those reported by Taibi and Haddad (2019) computed for the time period from 1993 to 2015 (linear trend of 2.74 mm yr−1 for altimetry; 6.73 mm yr−1 for the tide gauge; trend difference of 3.99 mm yr−1), thus supporting the results obtained here.
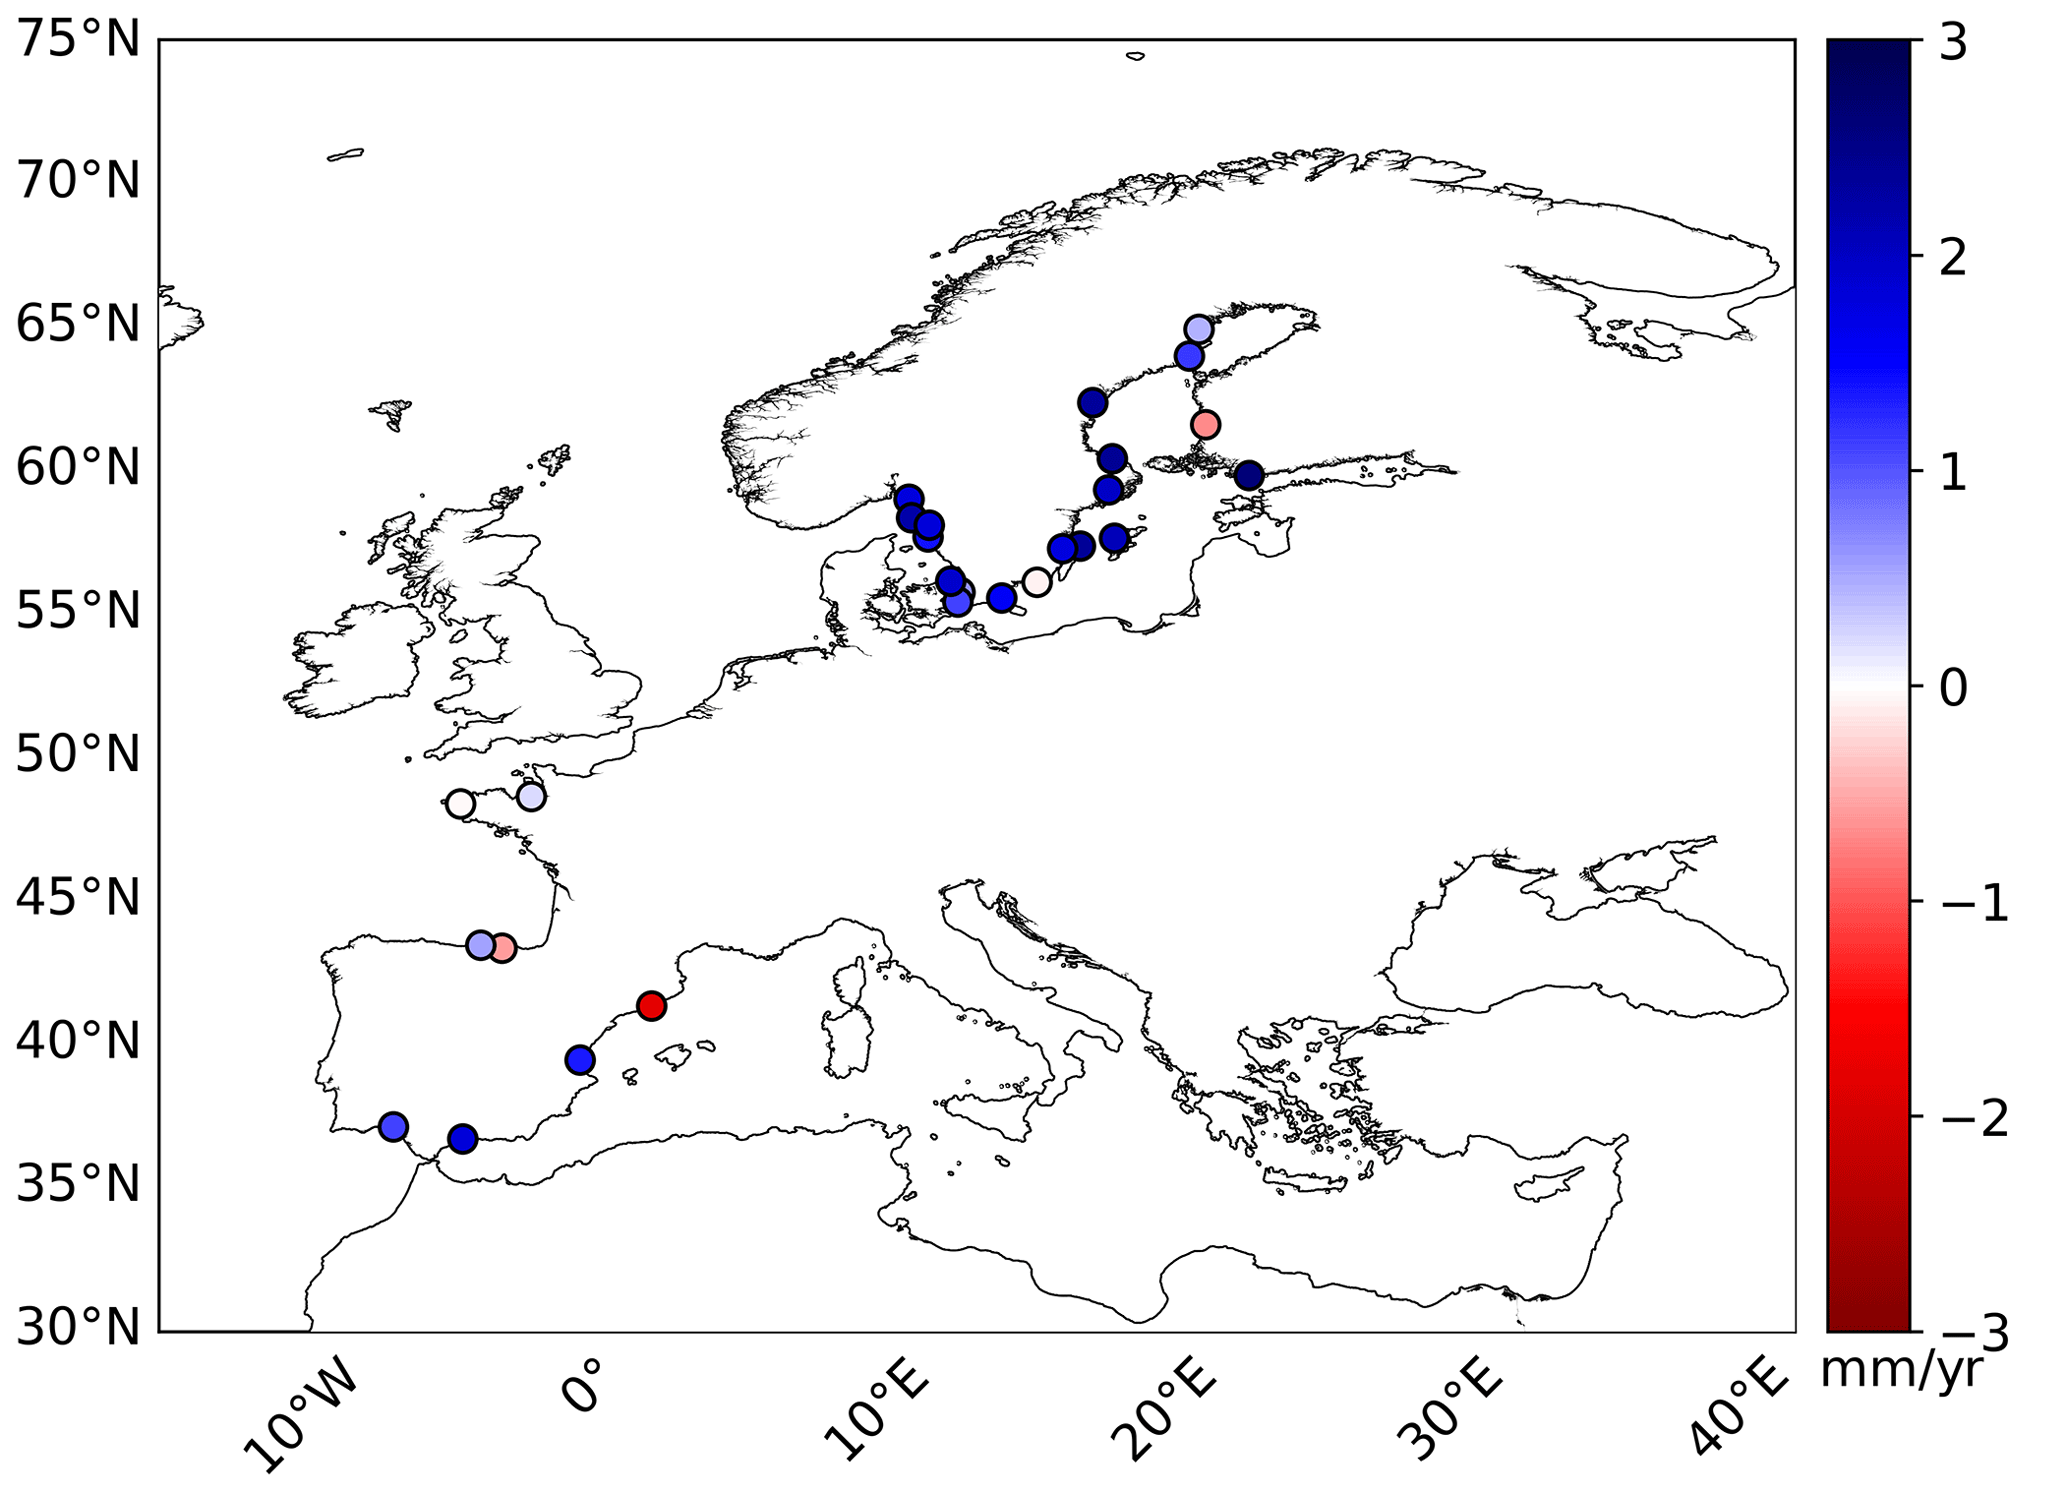
Figure 7Spatial distribution of the differences in linear trends (mm yr−1) between the altimetry and tide gauge sea level computed for the 20-year time period from 1 January 2000 to 31 December 2019. The two satellites dataset from the DUACS DT2021 reprocessing has been used. Blue (red) colours denote a larger (lower) altimetry linear trend.
The intercomparison conducted here between L4 gridded products from the new DUACS DT2021 release and the DT2018 version previously available on the one hand and tide gauges on the other hand have demonstrated the better performance of the new DT2021 version in the retrieval of sea level in the coastal zone of the European seas. Furthermore, the all satellites dataset provided more accurate sea level measurements when making a comparison with tide gauges with respect to the climatic two satellites dataset due to the better performance of the former for the assessment of higher than climatic frequency signals. Conversely, when analysing linear trends from 20-year-long time series the two satellite dataset was the most suitable product for the assessment of long-term sea level SSH trends in the coastal zone due to its larger stability to the detriment of the CMEMS all satellites dataset.
SLA and derived geostrophic velocities from altimeter data have been widely compared with in situ multiplatform measurements by the coastal altimetry community in order to both validate altimetry measurements and demonstrate their capabilities to monitor sea level and surface currents in the coastal zone. Heslop et al. (2017) provided the first multiplatform evaluation evolving data from the Sentinel-3A altimeter in the Balearic Sea (western Mediterranean Sea). Their outcomes demonstrated the capacity of this satellite mission to retrieve fine-scale oceanographic features of around 20 km of diameter showing differences between along-track absolute dynamic topography (ADT) from altimetry and glider-derived dynamic height (DH) data along the satellite track of 1.23 cm. In the same region, Aulicino et al. (2018) compared along-track ADT data from the SARAL/AltiKa mission with glider-derived DH along two satellites tracks. They found a very similar spatial pattern with differences ranging between 1.10 and 2.90 cm. Pascual et al. (2015) also conducted an assessment of SARAL/AltiKa data in the coastal band through the comparison of along-track surface-derived geostrophic velocities with surface velocities from a coastal high-frequency (HF) radar system installed in the Ibiza Channel (Balearic Sea). These authors found that the velocities derived from altimetry solved the general mesoscale features in the region with rms differences with the in situ measurements of 13 cm s−1.
The new Surface Water and Ocean Topography (SWOT) satellite mission, launched in December 2022, is considered to be the next major breakthrough in satellite ocean observation (Morrow et al., 2023). The SWOT mission aims to provide SSH measurements in two dimensions along a wide-swath altimeter track with an expected effective resolution down to wavelengths of 15–30 km (Barceló-Llull et al., 2021). Thus, SWOT observations will fill the gap in our knowledge of the 15–150 km 2D SSH dynamics (Morrow et al., 2019) allowing, in some regions, the observation of the full range of mesoscale features. The assessment of their impact on the large-scale ocean circulation and climate system will be one of the major challenges for the next decade.
Table A1Altimeter standard used in DT2021 release. Changes with the DT2018 reprocessing are highlighted in bold format.
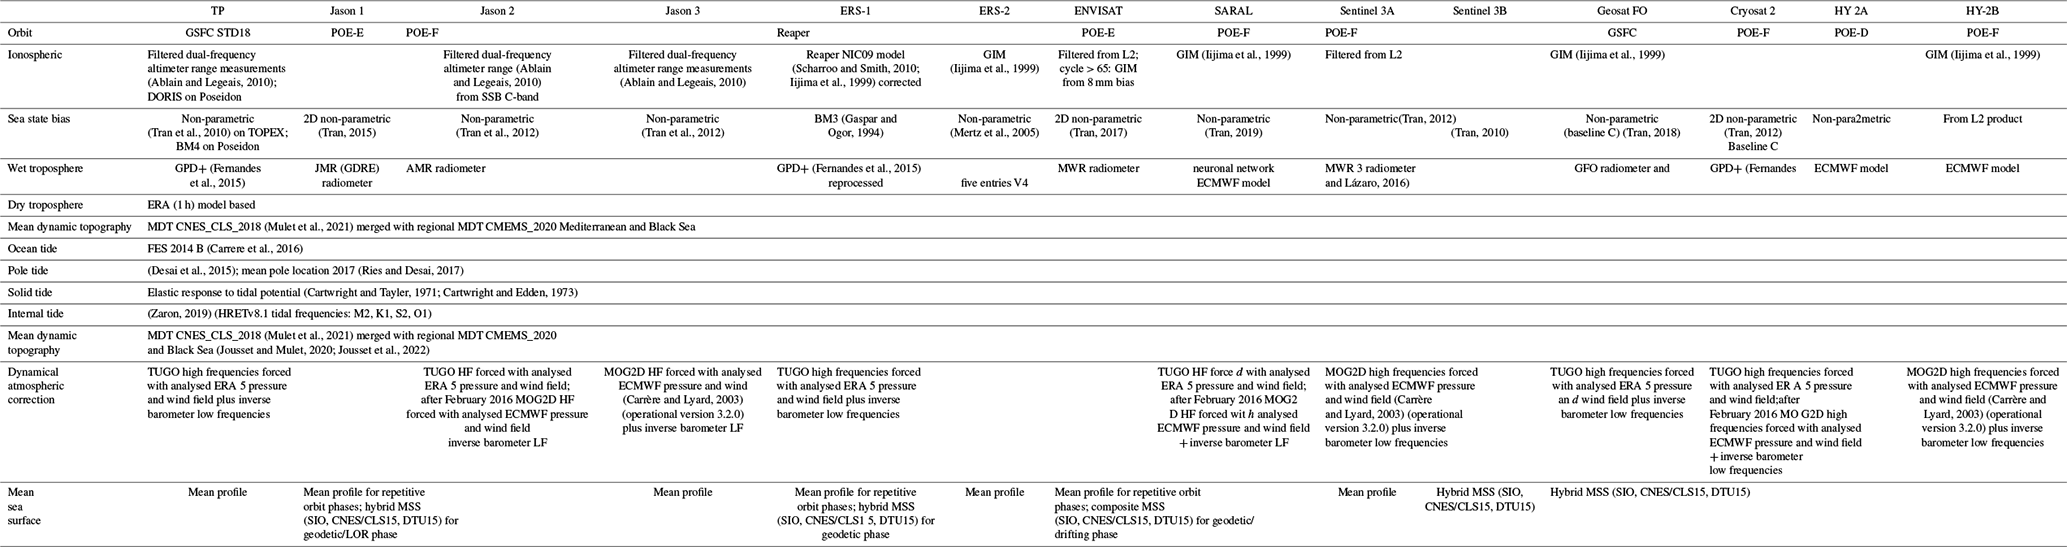
Table B1List of the 213 tide gauge records with their location and time period analysed. Bold stations indicate the tide gauge sites from the subset covering the 20-year period from January 2000 to December 2019 listed in Table B2.
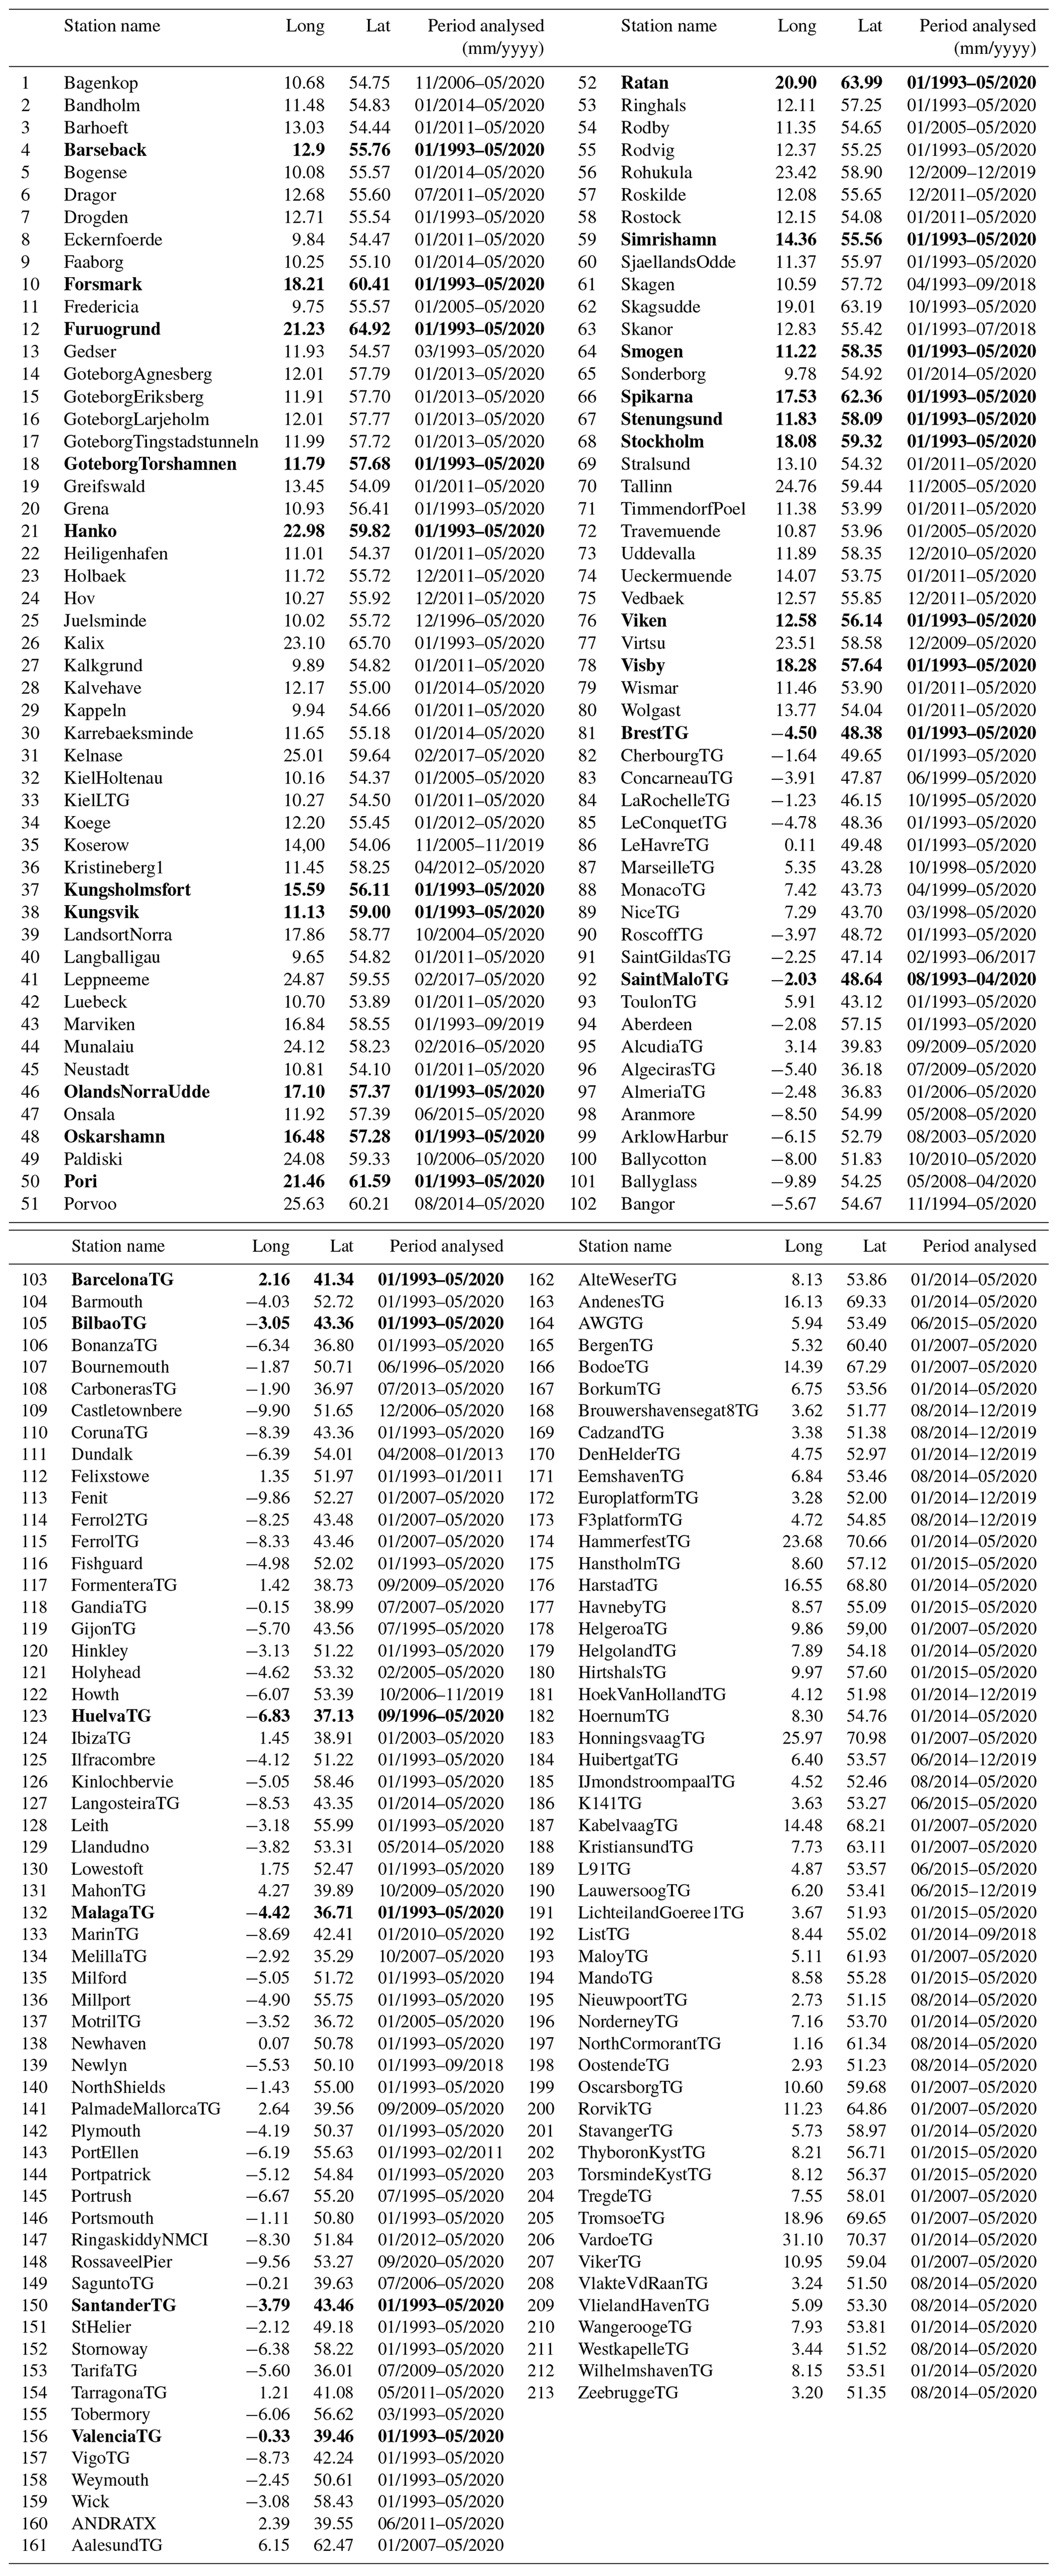
Table B2Tide gauge stations from the subset covering the 20-year period from January 2000 to December 2019 located in the Baltic and Mediterranean seas and along the North Atlantic European shore. The location of the tide gauge sites, the linear trend (mm yr−1) computed from the DUACS DT2021 and DT2018 reprocessing all satellites and two satellites most correlated altimeter grid point to tide gauges, the tide gauges and the mean trend value are displayed.
Altimetry datasets are available from the Copernicus Marine Service web portal (https://resources.marine.copernicus.eu/products/, last access: 15 July 2022, EU Copernicus Marine Service Product, 2023; Copernicus Climate Change Service, Climate Data Store, 2023). Tide gauge measurements are available from the Copernicus Marine INS-TAC data repository web portal (http://www.marineinsitu.eu, last access: 3 June 2022, EU Copernicus Marine Service Product, 2022). Tide gauge data are provided by the following regional in situ data production centres: Puertos del Estado (Spain) for the Iberia–Biscay–Ireland region, HCMR (Greece) for the Mediterranean Sea, IMR (Norway) for the Arctic, SMHI (Sweden) for the Baltic Sea, BSH (Germany) for the North-West Shelf region and Coriolis (France) for the global ocean. The ancillary data used to obtain the dynamic atmospheric correction applied to the altimetry grid point closest to the tide gauge locations are available from the AVISO web page: https://www.aviso.altimetry.fr/en/ (last access: 16 May 2022, LEGOS/CNRS/CLS, 1992).
Conceptualization: ASR, MIP, AP and YF; altimetry data processing: MIP; tide gauge data processing: ASR; statistical analysis: ASR and AP; paper writing: ASR, with input from all co-authors. All authors have read and agreed to the published version of the paper.
The contact author has declared that none of the authors has any competing interests.
Publisher's note: Copernicus Publications remains neutral with regard to jurisdictional claims in published maps and institutional affiliations.
This article is part of the special issue “Oceanography at coastal scales: modelling, coupling, observations, and applications”. It is not associated with a conference.
This study has been conducted in the frame of the Copernicus Marine Service SL-TAC and In Situ TAC (INS-TAC) projects. The Copernicus Marine Service, led by Mercator Ocean, is based on a distributed model of service production, relying on the expertise of a wide network of participating European organizations involved in operational oceanography. We acknowledge the regional in situ data production centres responsible for the collection and distribution of the tide gauge data used in this study: Puertos del Estado (Spain) for the Iberia-Biscay-Ireland region, HCMR (Greece) for the Mediterranean Sea, IMR (Norway) for the Arctic, SMHI (Sweden) for the Baltic Sea, BSH (Germany) for the North-West Shelf region and Coriolis (France) for the global ocean. This work represents a contribution to the CSIC Interdisciplinary Thematic Platform (PTI) Teledetección (PTI-TELEDETECT), and it was carried out within the framework of the activities of the Spanish Government through the “Maria de Maeztu Centre of Excellence” accreditation to IMEDEA (CSIC-UIB) (CEX2021-001198).
This paper was edited by Manuel Espino Infantes and reviewed by two anonymous referees.
Ablain, M. and Legeais, J. F.: SLOOP Tache 2.4: Amélioration du filtrage de la correction ionospherique bifréquence, 2010.
Agha, K. A., Bagherbandi, M., and Horemuz, M.: Multidecadal Sea Level Variability in the Baltic Sea and Its Impact on Acceleration Estimations, Front. Mar. Sci., 8, 702512, https://doi.org/10.3389/fmars.2021.702512, 2021.
Andersen, O., Stenseng, L., Piccioni, G., and Knudsen, P.: The DTU15 MSS (Mean Sea Surface) and DTU15LAT (Lowest Astronomical Tide) reference surface, ESA Living Planet Symposium 2016 – Prague, Czech Republic, Solid Earth & Near Earth Posters, Prague, 1579, http://lps16.esa.int/page_session189.php#1579p (last access: 11 April 2023), 2016.
Aulicino, G., Cotroneo, Y., Ruiz, A., Sánchez Román, A. J., Pascual, A., Fusco, G., Tintoré, J., and Budillon, G.: Monitoring the Algerian Basin through glider observations, satellite altimetry and numerical simulations along a SARAL/AltiKa track, J. Mar. Syst., 179, 55–71, 2018.
Ballarotta, M., Ubelmann, C., Pujol, M.-I., Taburet, G., Fournier, F., Legeais, J.-F., Faugère, Y., Delepoulle, A., Chelton, D., Dibarboure, G., and Picot, N.: On the resolutions of ocean altimetry maps, Ocean Sci., 15, 1091–1109, https://doi.org/10.5194/os-15-1091-2019, 2019.
Barceló-Llull, B., Pascual, A., Sánchez-Román, A., Cutolo, E., d'Ovidio, F., Fifani, G., Ser-Giacomi, E., Ruiz, S., Mason, E., Cyr, F., Doglioli, A., Mourre, B., Allen, J. T., Alou-Font, E., Casas, B., Díaz-Barroso, L., Dumas, F., Gómez-Navarro, L., and Muñoz, C.: Fine-Scale Ocean Currents Derived From in situ Observations in Anticipation of the Upcoming SWOT Altimetric Mission, Front. Mar. Sci., 8, 679844, https://doi.org/10.3389/fmars.2021.679844, 2021.
Birol, F., Fuller, N., Lyard, F., Cancet, M., Niño, F., Delebecque, C., Fleury, S., Toublanc, F., Melet, A., Saraceno, M., and Léger, F.: Coastal applications from nadir altimetry: Example of the X-TRACK regional products, Adv. Space Res., 59, 936–953, 2017.
Birol, F., Léger, F., Passaro, M., Cazenave, A., Niño, F., Calafat, F. M., Shaw, A., Legeais, J.-F., Gouzenes, Y., Schwatke, C., and Benveniste, J.: The X-TRACK/ALES multi-mission processing system: New advances in altimetry towards the coast, Adv. Space Res., 67, 2398–2415, 2021.
Carrère, L. and Lyard, F.: Modeling the barotropic response of the global ocean to atmospheric wind and pressure forcing – comparisons with observations, Geophys. Res. Lett., 30, 1275, https://doi.org/10.1029/2002GL016473, 2003.
Carrere, L., Lyard, F., Allain, D., Cancet, M., Picot, N., Guillot, A., Faugère, Y., Dupuy, S., and Baghi, R.: Final version of the FES2014 global ocean tidal model, which includes a new loading tide solution, OSTST, La Rochelle, France, https://ostst.aviso.altimetry.fr/fileadmin/user_upload/tx_ausyclsseminar/files/Poster_FES2014b_OSTST_2016.pdf (last access: 11 April 2023), 2016.
Cartwright, D. E. and Tayler, R. J.: New Computations of the Tide-generating Potential, Geophys. J. Int., 23, 45–73, https://doi.org/10.1111/j.1365-246X.1971.tb01803.x, 1971.
Cartwright, D. E. and Edden, A. C.: Corrected Tables of Tidal Harmonics, Geophys. J. Int., 33, 253–264, https://doi.org/10.1111/j.1365-246X.1973.tb03420.x, 1973.
Cipollini, P., Calafat, F.-M., Jevrejeva, S., Melet, A., and Prandi, P.: Monitoring sea level in the coastal zone with satellite altimetry and tide gauges, Surv. Geophys., 38, 33–57, https://doi.org/10.1007/s10712-016-9392-0, 2017.
Codiga, D. L.: Unified Tidal Analysis and Prediction Using the UTide Matlab Functions, Technical Report 2011-01, Graduate School of Oceanography, University of Rhode Island, Narragansett, RI, 59 pp., ftp://www.po.gso.uri.edu/pub/downloads/codiga/pubs/2011Codiga-UTide-Report.pdf (last access: 10 June 2022), 2011.
Copernicus Climate Change Service, Climate Data Store: Sea level gridded data from satellite observations for the global ocean from 1993 to present, Copernicus Climate Change Service (C3S) Climate Data Store (CDS) [data set], https://doi.org/10.24381/cds.4c328c78, 2018.
Desai, S., Wahr, J., and Beckley, B.: Revisiting the pole tide for and from satellite altimetry, J. Geodesy, 89, 1233–1243, https://doi.org/10.1007/s00190-015-0848-7, 2015.
Dibarboure, G., Pujol, M.-I., Briol, F., Le Traon, P.-Y., Larni- col, G., Picot, N., Mertz, F., Escudier, P., Ablain, M., and Dufau, C.: Jason-2 in DUACS: first tandem results and impact on processing and products, OSTM Jason-2 Calibration/Validation Special Edition – Part 2, Mar. Geod., 34, 214–241, https://doi.org/10.1080/01490419.2011.584826, 2011.
Dorandeu, J. and Le Traon, P.-Y.: Effects of global mean atmospheric pressure variations on mean sea level changes from Topex/Poseidon, J. Atmos. Ocean. Technol., 16, 1279–1283, 1999.
Efron, B. and Tibshirani, R.: Bootstrap methods for standart errors, condifence intervals, and other measures of statistical accuracy, Stat. Sci., 1, 54–77, 1986.
EU Copernicus Marine Service Product: Global Ocean In Situ Near Real Time Observartions, Mercator Ocean International [data set], https://doi.org/10.48670/moi-00036, 2022.
EU Copernicus Marine Service Product: Global Ocean Gridded L4 Sea Surface Heights And Derived Variables Reprocessed 1993 Ongoing, Mercator Ocean International [data set], https://doi.org/10.48670/moi-00148, 2023.
Faugère, Y., Taburet, G., Ballarotta, M., Pujol, I., Legeais, J. F., Maillard, G., Durand, C., Dagneau, Q., Lievin, M., Sanchez Roman, A., and Dibarboure, G.: DUACS DT2021: 28 years of reprocessed sea level altimetry products, EGU General Assembly 2022, Vienna, Austria, 23–27 May 2022, EGU22-7479, https://doi.org/10.5194/egusphere-egu22-7479, 2022.
Fernandes, M. J., Lázaro, C., Ablain, M., and Pires, N.: Improved wet path delays for all ESA and reference altimetric missions, Remote Sens. Environ., 169, 50–74, https://doi.org/10.1016/j.rse.2015.07.023, 2015.
Fernandes, M. J. and Laìzaro, C.: GPD+ Wet Tropospheric Corrections for CryoSat-2 and GFO Altimetry Missions, Remote Sens., 8, 851, https://doi.org/10.3390/rs8100851, 2016.
Gaspar, P. and Ogor, F.: Estimation and analysis of the sea state bias of the ERS-1 altimeter, technical report of IFREMER contract 94/2.426016/C, 1994.
Greìgoire, M.: EO4SIBS Consortium (ESA Project). Earth Observation Products for Science and Innovation in the Black Sea, Presented at EGU21, Gather Online, https://meetingorganizer.copernicus.org/EGU21/EGU21-10237.html (last access: 12 April 2023) 2021.
Heslop, E. E., Saìnchez-Romaìn, A., Pascual, A., Rodriìguez, D., Reeve, K. A., Faugère, Y., and Raynal, M.: Sentinel-3A views ocean variability more accurately at finer resolution, Geophy. Res. Lett., 44, 1–8, 2017.
Iijima, B. A., Harris, I. L., Ho, C. M., Lindqwister, U. J., Mannucci, A. J., Pi, X., Reyes, M. J., Sparks, L. C., and Wilson, B. D.: Automated daily process for global ionospheric total electron content maps and satellite ocean altimeter ionospheric calibration based on Global Positioning System data, J. Atmos. Sol.-Terr. Phys., 61, 1205–1218, https://doi.org/10.1016/S1364- 6826(99)00067-X, 1999.
International Altimetry Team: Altimetry for the future: Building on 25 years of progress, Adv. Space Res., 68, 319–363, https://doi.org/10.1016/j.asr.2021.01.022, 2021.
Laíz, I., Goìmez-Enri, J., Tejedor, B., Aboitiz, A., and Villares, P.: Seasonal sea level varia- tions in the gulf of Cadiz continental shelf from in-situ measurements and satellite altimetry, Cont. Shelf Res., 53, 77–88, https://doi.org/10.1016/j.csr.2012.12.008, 2013.
Laíz, I., Tejedor, B., Gómez-Enri, J., Aboitiz, A., and Villares, P.: Contributions to the sea level seasonal cycle within the Gulf of Cadiz (Southwestern Iberian Peninsula), J. Mar. Syst., 159, 55–66, https://doi.org/10.1016/j.jmarsys.2016.03.006, 2016.
LEGOS/CNRS/CLS: Dynamic Atmospheric Correction, CNES [data set], https://doi.org/10.24400/527896/A01-2022.001, 1992.
Marcos, M., Pascual, A., and Pujol, I.: Improved satellite altimeter mapped sea level anomalies in the Mediterranean Sea: A comparison with tide gauges, Adv. Space Res., 56, 596–604, https://doi.org/10.1016/j.asr.2015.04.027, 2015.
Mercier, F., Rosmorduc, V., Carrere, L., and Thibaut, P.: Coastal and Hydrology Altimetry Product (PISTACH) Handbook, https://www.aviso.altimetry.fr/fileadmin/documents/data/tools/hdbk_Pistach.pdf (last access: 12 April 2023), 2010.
Mertz, F., Mercier, F., Labroue, S., Tran, N., and Dorandeu, J.: ERS-2 OPR data quality assessment, Long-term monitoring – particular investigation, 2005.
Morrow, R., Fu, L. L., Ardhuin, F., Benkiran, M., Chapron, B., Cosme, E., d'Ovidio, F., Farrar, J. T., Gille, S. T., Lapeyre, G., Le Traon, P.-Y., Pascual, A., Ponte, A., Qiu, B., Rascle, N., Ubelmann, C., Wang, J., and Zaron, E.: Global observations of fine-scale ocean surface topography with the surface water and ocean topography (SWOT) mission, Front. Mar. Sci., 6, 232, https://doi.org/10.3389/fmars.2019.0023, 2019.
Morrow, R., Fu, L. L., Rio, M. H., Ray, R., Prandi, P., Le Traon, P.-Y., Benveniste, J.: Ocean Circulation from Space, Surv, Geophys., https://doi.org/10.1007/s10712-023-09778-9, 2023.
Mulet, S., Rio, M.-H., Etienne, H., Artana, C., Cancet, M., Dibarboure, G., Feng, H., Husson, R., Picot, N., Provost, C., and Strub, P. T.: The new CNES-CLS18 global mean dynamic topography, Ocean Sci., 17, 789–808, https://doi.org/10.5194/os-17-789-2021, 2021.
Pascual, A., Faugère, Y., Larnicol, G., and Le Traon, P.-Y.: Improved description of the ocean mesoscale variability by combining four satellite altimeters, Geophys. Res. Lett., 33, L02611, https://doi.org/10.1029/2005GL024633, 2006.
Pascual, A., Marcos, M., and Gomis, D.: Comparing the sea level response to pressure and wind forcing of two barotropic models: validation with tide gauge and altimetry data, J. Geophys. Res., 113, C07011, https://doi.org/10.1029/2007jc004459, 2008.
Pascual, A., Boone, C., Larnicol, G., and Le Traon, P. Y.: On the quality of real-time altimeter gridded fields: comparison with in situ data, J. Atmos. Ocean. Technol., 26, 556–569, https://doi.org/10.1175/2008JTECHO556.1, 2009.
Pascual, A., Lana, A., Troupin, C., Ruiz, S., Faugère, Y., Escudier R., and Tintoré, J.: Assessing SARAL/AltiKa Data in the Coastal Zone: Comparisons with HF Radar Observations, Mar. Geodesy, 38, 260–276, https://doi.org/10.1080/01490419.2015.1019656, 2015.
Peltier, W. R.: Postglacial Variations in the Level of the Sea: Implications for Climate Dynamics and Solid-Earth Geophysics, Rev. Geophys., 36, 603–689, 1998.
Peltier, W. R.: Global Glacial Isostasy and the Surface of the Ice-Age Earth: The ICE-5G(VM2) model and GRACE, Ann. Rev. Earth. Planet. Sci., 32, 111–149, 2004.
PSMSL: Permanent Service for Mean Sea Level: “Tide Gauge Data”, http://www.psmsl.org/data/obtaining/ (last access: 4 July 2022), 2016.
PUGS: PUGS document of the sea level products version vDT2021 D3.SL.1-v2.0_PUGS_of_v2DT2021_SeaLevel_ products_v1.1, https://datastore.copernicus-climate.eu (last access: 4 July 2022) 2021.
Pujol, M., Schaeffer, P., Faugère, Y., Raynal, M., Dibarboure, G., and Picot, N.: Gauging the Improvement of Recent Mean Sea Surface Models: A New Approach for Identifying and Quantifying Their Errors, J. Geophys. Res.-Ocean., 123, 5889–5911, https://doi.org/10.1029/2017JC013503, 2018
Pujol, M.-I., Dupuy, S., Vergara, O., Sánchez Román, A., Faugère, Y., Prandi, P., Dabat, M.-L., Dagneaux, Q., Lievin, M., Cadier, E., Dibarboure, G., and Picot, N.: Refining the Resolution of DUACS Along-Track Level-3 Sea Level Altimetry Products, Remote Sens., 15, 1–30, https://doi.org/10.3390/rs15030793, 2023.
CMEMS-SL-QUID: QUID document for Sea Level TAC DUACS products CMEMS-SL-QUID-008-032-068, https://catalogue.marine.copernicus.eu/documents/QUID/CMEMS-SL-QUID-008-032-068.pdf (last access: 4 July 2022) 2022.
Ries, J. C. and Desai, S.: Conventional model update for rotational deformation, Vol. 2017, 2017.
Roblou, L., Lamouroux, J., Bouffard, J., Lyard, F., Le Hénaff, M., Lombard, A., Marsaleix, P., De Mey, P., and Birol, F.: Post-processing altimeter data towards coastal applications and integration into coastal models, in: Coastal Altimetry, edited by: Vignudelli, S., Kostianoy, A., Cipollini, P., and Benveniste, J., Springer, Berlin/Heidelberg, Germany, 217–246, 2011.
Sánchez-Román, A., Ruiz, S., Pascual, A., Mourre, B., and Guinehut, S.: On the mesoscale monitoring capability of Argo floats in the Mediterranean Sea, Ocean Sci., 13, 223–234, https://doi.org/10.5194/os-13-223-2017, 2017.
Sánchez-Román, A., Pascual, A., Pujol, M.-I., Taburet, G., Marcos, M., and Faugère, Y.: Assessment of DUACS Sentinel-3A Altimetry Data in the Coastal Band of the European Seas: Comparison with Tide Gauge Measurements, Remote Sens., 12, 3970, https://doi.org/10.3390/rs12233970, 2020.
Sandwell, D., Schaeffer, P., Dibarboure, G., and Picot, N.: High Resolution Mean Sea Surface for SWOT, https://spark.adobe.com/page/MkjujdFYVbHsZ/ (last access: 11 April 2023), 2017.
Scharroo, R. and Smith, W. H. F.: A global positioning system–based climatology for the total electron content in the ionosphere, 115, https://doi.org/10.1029/2009JA014719, 2010.
Taibi, H. and Haddad, M.: Estimating trends of the Mediterranean Sea level changes from tide gauge and satellite altimetry data (1993–2015), J. Ocean. Limnol., 37, 1176–1185, https://doi.org/10.1007/s00343-019-8164-3, 2019.
Taburet, G., Sanchez-Roman, A., Ballarotta, M., Pujol, M.-I., Legeais, J.-F., Fournier, F., Faugere, Y., and Dibarboure, G.: DUACS DT2018: 25 years of reprocessed sea level altimetry products, Ocean Sci., 15, 1207–1224, https://doi.org/10.5194/os-15-1207-2019, 2019.
Tran, N., Labroue, S., Philipps, S., Bronner, E., and Picot, N.: Overview and Update of the Sea State Bias Corrections for the Jason-2, Jason-1 and TOPEX Missions, Mar. Geod., 33, 348–362, https://doi.org/10.1080/01490419.2010.487788, 2010.
Tran, N., Philipps, S., Poisson, J.-C., Urien, S., Bronner, E., and Picot, N.: Impact of GDR_D standards on SSB corrections, OSTST, Venice, Italie, http://www.aviso.altimetry.fr/fileadmin/documents/OSTST/2012/oral/02_friday_28/01_instr_processing_I/01_IP1_Tran.pdf (last access: 11 April 2023), 2012.
Tran, N.: Rapport Annuel d'activité SALP – Activité SSB, 2015.
Tran, N.: Envisat ESL Phase-F: Tuning activities for Envisat reprocessing baseline v3.0 (Wind, SSB, Rain and Ice), 2017.
Tran, N.: ESL Cryosat-2: Tuning activities: wind speed and SSB, 2018.
Tran, N.: Rapport Annuel d'activité SALP - Activité SSB, 2019.
Vignudelli, S., Birol, F., Benveniste, J., Fu, L.-L., Picot, N., Raynal, M., and Roinard, H.: Satellite Altimetry Measurements of Sea Level in the Coastal Zone, Surv. Geophys., 40, 1319–1349, https://doi.org/10.1007/s10712-019-09569-1, 2019.
Von Schuckmann, K., Le Traon, P.-Y., Smith, N., et al.: Copernicus Marine Service Ocean State Report, J. Oper. Ocean., 11, S1–S142, 2018.
Wöppelmann, G. and Marcos, M.: Vertical land motion as a key to understanding sea level change and variability, Rev. Geophys., 54, 64–92, https://doi.org/10.1002/2015RG000502, 2016.
Zaron, E. D.: Baroclinic Tidal Sea Level from Exact-Repeat Mission Altimetry, J. Phys. Oceanogr., 49, 193–210, https://doi.org/10.1175/JPO-D-18-0127.1, 2019.