the Creative Commons Attribution 4.0 License.
the Creative Commons Attribution 4.0 License.
 | 06 Jun 2023
Seasonal overturning variability in the eastern North Atlantic subpolar gyre: a Lagrangian perspective
Oliver John Tooth
Helen Louise Johnson
Chris Wilson
Dafydd Gwyn Evans
Both observations and ocean reanalyses show a pronounced seasonality in the strength of the Atlantic meridional overturning circulation (MOC) within the eastern North Atlantic subpolar gyre (eSPG). However, attributing this overturning seasonality to seasonal dense water formation remains challenging owing to the wide distribution of recirculation timescales within the Iceland and Irminger basins. Here, we investigate the nature of seasonal overturning variability using Lagrangian water parcel trajectories initialised across the Overturning in the Subpolar North Atlantic Program (OSNAP) East section within an eddy-permitting ocean sea ice hindcast. By adopting a Lagrangian perspective, we show that the seasonal minimum of the Eulerian overturning at OSNAP East in autumn results from a combination of enhanced stratification and increased southward transport within the upper East Greenland Current. This convergence of southward transport within the MOC upper limb is explained by decreasing water parcel recirculation times in the upper Irminger Sea, consistent with a gyre-scale response to seasonal wind forcing. To account for the diversity of recirculation times within the eSPG, we also quantify the Lagrangian overturning (LMOC) as the total dense water formation along water parcel trajectories. The majority of water parcels, sourced from the central and southern branches of the North Atlantic Current, fail to return to OSNAP East prior to experiencing wintertime diapycnal transformation into the lower limb, and thus they determine the mean strength of the LMOC within the eSPG (8.9 ± 2.2 Sv). The strong seasonality of the LMOC is explained by a small collection of upper-limb water parcels, circulating rapidly (≤ 8.5 months) in the upper Irminger and central Iceland basins, whose along-stream transformation is determined by their month of arrival at OSNAP East.
- Article
(11475 KB) - Full-text XML
- BibTeX
- EndNote


The Atlantic Meridional Overturning Circulation (MOC) plays a critical role in the global climate system through the uptake and redistribution of heat, freshwater and anthropogenic carbon (McKinley et al., 2017; Bryden et al., 2020; Fay and McKinley, 2021; Li et al., 2021b). At subpolar latitudes, the Overturning in the Subpolar North Atlantic Program (OSNAP) has provided continuous estimates of the MOC since the summer of 2014 (Lozier et al., 2017; Li et al., 2017). By measuring the volume transport and hydrography along two trans-basin observing arrays, OSNAP has revealed that the mean strength and variability of the subpolar overturning circulation is dominated by dense water formation east of Greenland (north of OSNAP East; Fig. 1a), rather than in the Labrador Sea (Lozier et al., 2019; Li et al., 2021a). Further investigation of the sources of North Atlantic Deep Water (NADW) feeding the lower limb of the MOC has shown that dense water formation is distributed approximately equally between the Iceland and Irminger basins and the Nordic Seas (Bringedal et al., 2018; Chafik and Rossby, 2019; Petit et al., 2020). Crucially, however, it is variations in the production of upper NADW within the eastern Subpolar Gyre (eSPG; Fig. 1a), south of the Greenland–Scotland Ridge, which dominates the variability of subpolar overturning on monthly to decadal timescales (Petit et al., 2020; Desbruyères et al., 2019).
Throughout the North Atlantic Ocean, observational and modelling studies demonstrate that the variability of the MOC is larger on seasonal than interannual timescales (Willis, 2010; Mielke et al., 2013; Xu et al., 2014; Lozier et al., 2019). In the eSPG, both observations and ocean reanalyses show a pronounced seasonality in the MOC (Mercier et al., 2015; Li et al., 2021a; Wang et al., 2021), which is closely related to the export of seasonal western boundary density anomalies (Le Bras et al., 2020). Since the formation of dense waters exported along the western boundary is principally governed by surface buoyancy loss over the Iceland and Irminger basins (Brambilla and Talley, 2008; Petit et al., 2020; Pacini et al., 2020), we might anticipate a seasonal cycle of overturning at OSNAP East that closely reflects the seasonality of surface buoyancy forcing within this region. However, the observed amplitude of seasonal overturning variability (∼ 4 Sv where 1 Sv ≡ 1×10⁶ m3 s−1; Mercier et al., 2015; Li et al., 2021a) is typically 5 times smaller than the magnitude of seasonal buoyancy-driven transformation (∼ 20 Sv; Xu et al., 2018b; Petit et al., 2020). This difference reflects the fact that overturning variability depends upon both the transformation of water masses into the lower limb of the MOC and the rate at which they are subsequently exported southward across the OSNAP East section. Given that water masses circulate on timescales ranging from weeks to years within the eSPG (Tooth et al., 2023), it therefore remains an open question to what extent the overturning seasonality measured at OSNAP East can be attributed to seasonal dense water formation.
The recent modelling study of Wang et al. (2021) attributes the seasonality of overturning at OSNAP East to the projection of seasonal density changes in the western Irminger Sea onto the time-mean barotropic transport of the East Greenland Current (EGC). On the one hand, this is consistent with OSNAP observations, which reveal strong seasonality in the thickness of upper Irminger Sea Intermediate Water (ISIW; the lightest component of the MOC lower limb) exported southward in the EGC during 2014–2018 (Le Bras et al., 2020; Li et al., 2021a). However, on the other hand, observations also show pronounced seasonality in the volume transport of the western boundary current, which is closely correlated with the seasonality of wind stress curl over the Irminger Sea (Daniault et al., 2011a, b; Le Bras et al., 2018; Pacini et al., 2020). To our knowledge, no study to date has explored how such seasonal changes in both the density structure and transport of the EGC might act in combination to modulate the seasonality of overturning measured at OSNAP East.
In the traditional Eulerian overturning framework discussed above, seasonal overturning variability is predicated upon the efficient export of lower limb water masses within several months of their formation upstream. At OSNAP East, Le Bras et al. (2020) showed that overturning seasonality is preferentially determined by variations in the formation rate of upper ISIW due to its rapid export southward within the EGC (Pacini et al., 2020). In contrast, variability in the formation rate of deep ISIW formed in the Irminger Sea interior was found to imprint onto interannual Eulerian overturning variability owing to its slower entrainment into the boundary current (Le Bras et al., 2020; Li et al., 2021a). Given the diversity of export times convolved in the western boundary current of the Irminger Sea, it is therefore perhaps unsurprising that changes in the velocity and density field of the EGC alone have been shown to account for only 10 % of the monthly MOC variability at OSNAP East (Li et al., 2021a).
One way to better understand the relationship between seasonal buoyancy-driven transformation and the overturning seasonality recorded at OSNAP East is to explicitly account for the diverse range of water mass export timescales by adopting a Lagrangian frame of reference. In the recent study of Tooth et al. (2023), the authors introduced a novel Lagrangian measure of the density space overturning by quantifying the total dense water formation along water parcel trajectories flowing northward across the OSNAP East section. Here, we extend this Lagrangian overturning framework to identify the circulation pathways responsible for seasonal overturning variability at OSNAP East and characterise their advective timescales and along-stream transformations within the eSPG.
The paper is structured as follows. We begin by introducing the numerical model simulation and Lagrangian particle tracking approach and defining both the Eulerian and Lagrangian overturning in density space at OSNAP East in Sect. 2. Section 3 explores the seasonal Eulerian overturning variability simulated at OSNAP East and addresses the physical mechanisms responsible, including the important role of seasonal water parcel recirculation times in the upper Irminger Sea. In Sect. 4, we introduce a complementary Lagrangian measure of overturning variability at OSNAP East and diagnose the advective timescales of water parcels contributing to the mean strength and seasonality of Lagrangian overturning. We also decompose the seasonal cycle of Lagrangian overturning by circulation pathway and examine the role of along-stream diathermal and diahaline transformations in driving seasonal dense water formation. The paper concludes with a discussion of our principal findings in Sect. 5.
2.1 Model description
In this study we use output from the ORCA025-GJM189 ocean-sea-ice hindcast simulation produced by the Drakkar initiative (Barnier et al., 2006). The simulation uses a global implementation of the Nucleus for European Modeling of the Ocean (NEMO) model coupled to the thermodynamic Louvain-la-Neuve Ice Model version 2 (LIM2) (Fichefet and Morales Maqueda, 1999). The ocean is simulated using the eddy-permitting ORCA025 configuration of the NEMO v3.5 model (Madec et al., 2013), which utilises the ORCA tripolar grid configured with a nominal horizontal resolution of ∘ (27.75 km at the Equator, ∼ 12 km in the Arctic) and 75 unevenly spaced z-coordinate levels in the vertical. Sub-grid-scale parameterisations include horizontal biharmonic viscosity for momentum, Laplacian isopycnal diffusivity for tracers and the turbulent kinetic energy (TKE) turbulent closure scheme for vertical mixing (Barnier et al., 2006). A comprehensive description of the ORCA025-GJM189 configuration can be found in Molines (2021).
The ORCA025-GJM189 hindcast used here simulates the historical period from 1958–2015 initialised from rest. Atmospheric forcing is computed using the CORE bulk formulae and the Drakkar Forcing Set 5.2, which combines surface fluxes from the ERA40 (Uppala et al., 2005) and ERA-Interim reanalyses (Dee et al., 2011). The initial conditions of the simulation are provided by a combination of the Levitus climatological hydrography (Levitus et al., 1998) and the Polar Science Center Hydrographic Climatology (Steele et al., 2001) in the Arctic. A relaxation of sea surface salinity to the Levitus climatological hydrography with a piston velocity of 167 mm d−1, equivalent to a 60 d decay time for 10 m of water depth (Molines, 2021), is included to minimise model drift. Following the approach of MacGilchrist et al. (2020), the first 18 years are discarded to allow for spin-up. The period 1976–2015 is analysed using 5 d mean model output.
There are several motivations for choosing to use the ORCA025-GJM189 hindcast simulation in this study. Firstly, this specific ocean sea ice hindcast has been used in multiple previous Lagrangian analyses investigating the circulation of the subpolar North Atlantic Ocean (Asbjørnsen et al., 2021; MacGilchrist et al., 2020, 2021; Tooth et al., 2023). Secondly, the ORCA025-GJM189 model is configured at a nominal horizontal resolution (∘), which is approximately 4 times finer than the typical resolution used in the ocean component of CMIP6 climate models (e.g. Heuzé, 2021) and is more typical of the climate models involved in the upcoming CMIP7 analysis. Thus, understanding how such eddy-permitting models represent seasonal to interannual subpolar overturning variability is crucial if we are to have confidence in their ability to project future trends in the MOC. Finally, the ORCA025 model configuration has been validated extensively within the subpolar North Atlantic by previous studies exploring the strength and variability of the gyre and overturning circulations on seasonal to multidecadal timescales (e.g. Asbjørnsen et al., 2021; Desbruyères et al., 2013, 2015; de Boisséson et al., 2010, 2012; MacGilchrist et al., 2020; Tooth et al., 2023).
In the eSPG specifically, Tooth et al. (2023) found good agreement between the summertime upper-ocean transports across the OSNAP East section in the ORCA025-GJM189 simulation and the observations of Sarafanov et al. (2010) at 59.5∘ N. Moreover, both Tooth et al. (2023) and de Boisséson et al. (2012) have highlighted the close agreement between the simulated water mass properties of Subpolar Mode Waters (SPMWs) transformed at the surface of the eSPG at eddy-permitting resolution and those observed by Brambilla and Talley (2008) and Thierry et al. (2008). Model biases primarily emerge at depth in the ORCA025-GJM189 simulation, where there is an absence of deep stratification within the eSPG due to excessive mixing between the Nordic Seas overflow and ambient Atlantic Water masses south of the Greenland–Scotland Ridge (MacGilchrist et al., 2020; Tooth et al., 2023). In spite of this, the ORCA025 configuration was chosen by Li et al. (2017) to assess the extent to which observed measurements can faithfully represent fluxes across the OSNAP section, underscoring its ability to reproduce the primary features of the subpolar circulation.
2.2 Lagrangian particle tracking
To evaluate the trajectories of numerical water parcels advected by the time-varying velocity fields of the ORCA025-GJM189 hindcast, we use the Lagrangian offline particle tracking tool TRACMASS (v7.1, Aldama-Campino et al., 2020). TRACMASS determines the trajectory of each water parcel using a stepwise-stationary scheme, which divides the time between successive 5 d mean velocity fields into a series of intermediate time steps. The velocity field at each intermediate time step is determined by linear interpolation and is assumed to be steady for the duration of the step (Döös et al., 2017). A water parcel's trajectory path through each model grid cell can therefore be determined analytically whilst conserving the mass contained within each grid cell (Döös et al., 2013). As such, the volume transport conveyed by each particle is conserved along its entire trajectory because the ocean model is Boussinesq. For a comprehensive description of TRACMASS and its associated trajectory schemes, readers are referred to Döös et al. (2017).
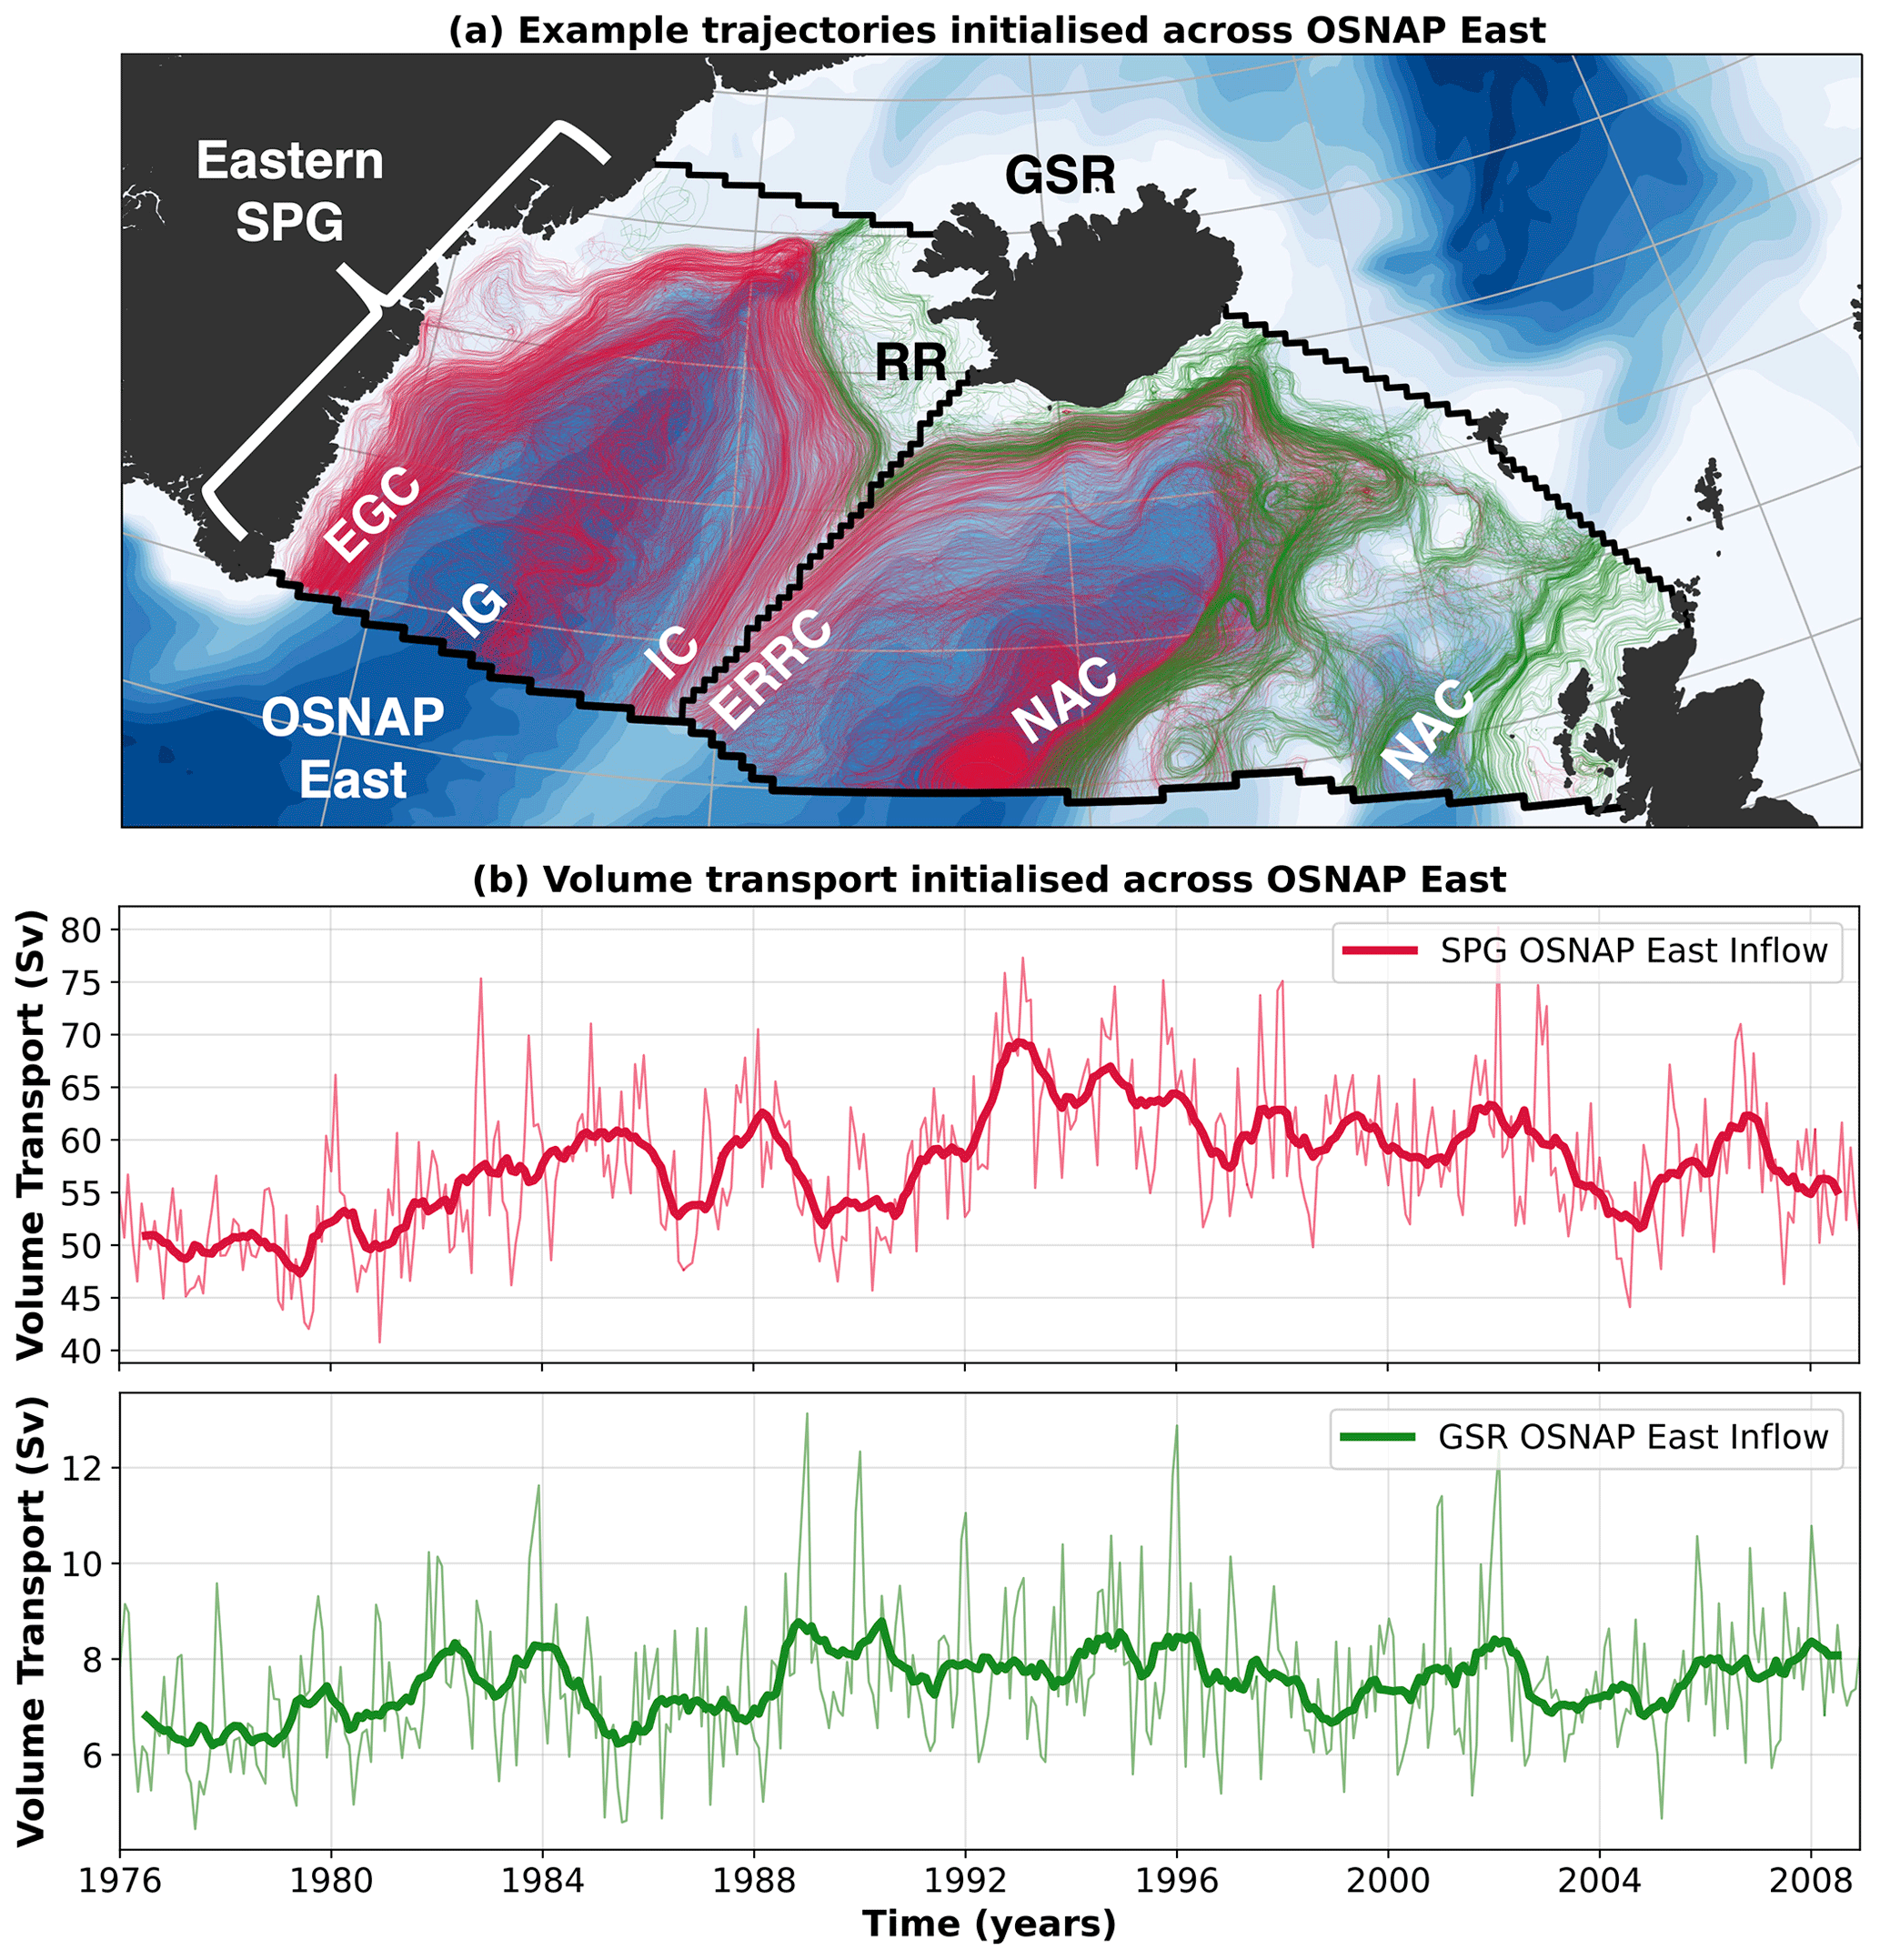
Figure 1Lagrangian trajectories and volume transports across the model-defined OSNAP East section. (a) Example Lagrangian trajectories initialised on the northward inflows across OSNAP East in January 1990. Trajectories of water parcels that recirculate back to OSNAP East within the eSPG (south of the Greenland–Scotland Ridge) are shown in red, whereas green trajectories represent water parcels that cross the Greenland–Scotland Ridge northwards as Atlantic inflows to the Nordic Seas. (b) Monthly volume transports initialised on the northward inflows across OSNAP East that recirculate within the eSPG (red, upper panel) and those that cross the Greenland–Scotland Ridge northwards (green, lower panel). The bold lines overlaid are low-pass-filtered volume transports using a 1-year running mean.
We make use of the Lagrangian experiment documented in Tooth et al. (2023), in which numerical water parcels are initialised in the northward inflows across the OSNAP East section (defined as in Menary et al., 2020) on the earliest available day of each month (based on the centre of the nearest 5 d mean window) for a period of 33 years (1976–2008). In total, more than 11.2 million water parcels are initialised, sampling the entire northward transport across OSNAP East for 396 months. During each monthly initialisation, the strategy for particle release is to distribute particles in proportion to the volume transport through each grid cell, with a minimum of one particle per cell. An increment of 2.5 mSv per particle per cell is used. Once initialised, water parcels are advected solely by the time-evolving velocity field except when found inside the surface mixed layer. Here, we parameterise the effects of vertical convective mixing by introducing random vertical displacements along water parcel trajectories (Paris et al., 2013), governed by a maximum vertical velocity of cm s−1 following Georgiou et al. (2021). Water parcels are removed from the experiment on meeting any one of three conditions: (i) on returning to the OSNAP East section (red trajectories in Fig. 1a), (ii) on crossing the Greenland–Scotland Ridge northwards (green trajectories in Fig. 1a) or (iii) upon reaching the maximum advection time of 7 years. Our decision to terminate water parcels on reaching the Greenland–Scotland Ridge is motivated by recent observations that show that monthly overturning variability at OSNAP East is dominated by surface buoyancy forcing over the Iceland and Irminger basins rather than by variations in the overflow transport exiting the Nordic Seas (Bringedal et al., 2018; Østerhus et al., 2019; Petit et al., 2020). It should also be noted that >99.1 % of water parcels are intercepted on crossing either OSNAP East or the Greenland–Scotland Ridge within the 7-year maximum advection time. The remaining 0.9 % of water parcels almost exclusively circulate at depth within the lower limb of the MOC north of OSNAP East and therefore do not contribute to the strength of overturning.
The position, potential temperature and salinity of each water parcel is output at every grid cell crossing north of OSNAP East and south of the Greenland–Scotland Ridge. Given that tracer variables are defined at the centre of each grid cell, TRACMASS uses a linear interpolation scheme in time and space to determine water parcel properties from the two nearest model T points. The potential density referenced to the surface is then computed using the EOS-80 non-linear equation of state (Fofonoff and Millard, 1983) consistent with our ORCA025 configuration of NEMO (Madec et al., 2013).
2.3 Definitions of the overturning in density space
We use two complementary measures of the overturning in potential density space at OSNAP East in this study. The Eulerian overturning streamfunction, ψ(σ,t), is calculated directly from the time-evolving velocity and potential density fields along the OSNAP East section following Lozier et al. (2019):
where , the velocity normal to the model-defined OSNAP East section (positive values represent northward transports), is first integrated from the eastern coast of Greenland (xw) to the Scottish Shelf (xe). We then obtain the Eulerian overturning streamfunction with respect to potential density, ψ(σ,t), by integrating from the sea surface (σmin) to a particular isopycnal layer (σ).
We denote the isopycnal at which the Eulerian overturning streamfunction reaches a maximum as σMOC, representing the interface between the upper and lower limbs of the MOC at OSNAP East. The maximum overturning, measuring the overall strength of the MOC, therefore equates to the net northward transport within the upper limb integrated along the section. To ensure comparability between our analyses, Eulerian overturning streamfunctions are computed on the earliest available day of each month between 1976–2008.
An important consideration when calculating the Eulerian overturning streamfunction at OSNAP East is how to account for the variability of net throughflow to the Arctic, which is not transformed into the lower limb of the MOC. In Lozier et al. (2019), a prescribed net throughflow of Sv is applied across the OSNAP East section to ensure a zero net meridional mass transport across the combined OSNAP East and OSNAP West sections. Here, as in Menary et al. (2020), we choose not to compensate for the variations in the net throughflow across OSNAP East since this would prevent us from investigating the transport structure of the MOC upper limb in Sect. 3.2. Critically, we find no seasonal signal in the net throughflow across the OSNAP East section, and hence its inclusion in the Eulerian overturning streamfunction does not impact the findings of our study.
To complement the Eulerian density space overturning, we additionally diagnose the strength of the overturning at OSNAP East using a Lagrangian measure recently introduced by Tooth et al. (2023). The Lagrangian overturning function (LOF), , quantifies the total light-to-dense transformation occurring along water parcel trajectories flowing northward across OSNAP East at the earliest available day of each month. To compute , we first extract the 9.8 million water parcels which recirculate back to OSNAP East within the eSPG (south of the Greenland–Scotland Ridge) to form 396 trajectory ensembles, one for each month between 1976–2008 (Fig. 1b). For each monthly ensemble containing N water parcels, the LOF is given by an equation describing the mass overturning across each isopycnal, σ, by water parcels having been initialised on the northward inflow of OSNAP East at time t and advected for a time τ before flowing southward across the section:
where VNorth represents the volume transport distribution of the ensemble water parcels in density space on their northward crossing of the OSNAP East section at time t. This is calculated by integrating the absolute volume transports (Vn) of the N water parcels in discrete potential density bins, where the bin width Δσ is prescribed as 0.01 kg m−3. Once the ensemble of water parcels have been advected for a maximum of years, we construct an equivalent volume transport distribution in density space, VSouth, using the properties of water parcels on their southward crossing of the OSNAP East section at time t+τ, where . Since the volume transport conveyed by each water parcel is conserved along its trajectory, the total northward and southward transports across OSNAP East due to recirculating water parcels are equal in the Lagrangian overturning calculation, and thus there is no net flow across the section. The LOF for each monthly ensemble is obtained by taking the cumulative sum of the net volume transport distribution (i.e. ) from the surface to the ocean floor. In keeping with its Eulerian counterpart, the strength of Lagrangian overturning (LMOC) is given by the maximum of the LOF, which occurs at the isopycnal of maximum Lagrangian overturning σLMOC. We note that the strength and variability of the LMOC is not sensitive to our chosen parameterisation of vertical convective mixing along water parcel trajectories in the surface mixed layer, and therefore its inclusion does not impact the conclusions of this study.
3.1 Seasonal Eulerian overturning at OSNAP East
We begin by exploring the time-mean strength of the density space overturning at OSNAP East in ORCA025-GJM189 from the traditional Eulerian perspective. Over the duration of the study period (1976–2008), the time-mean strength of the monthly MOC at OSNAP East is 16.6±2.7 Sv in ORCA025-GJM189, corresponding closely with observed estimates of the MOC at both 59.5∘ N (16.6±1.1 Sv in 2002–2008; Sarafanov et al., 2012) and OSNAP East (16.8±0.6 Sv in 2014–2018; Li et al., 2021a). The mean isopycnal of maximum Eulerian overturning (σMOC=27.52 kg m−3) is lighter in the simulation compared with observations (27.55 kg m−3), owing to the shoaling of the Subpolar North Atlantic (SPNA) overturning cell in response to the excessive entrainment of ambient Atlantic water by the Nordic seas overflows in the model (MacGilchrist et al., 2020). As shown in Tooth et al. (2023), the simulated mean net throughflow to the Arctic Ocean at OSNAP East is 1.2±1.1 Sv, in close agreement with the 1.0–1.6 Sv required by inverse models (Li et al., 2017; Lherminier et al., 2007). On subtracting this net throughflow from the mean strength of the MOC, we find that, on average, 15.4 Sv of upper-limb waters are overturned north of OSNAP East in this simulation.
Figure 2a shows that the strength of the MOC at OSNAP East exhibits variability on monthly to interannual timescales. Concordant with the previous studies of Lozier et al. (2019) and Mercier et al. (2015), we find that MOC variability at OSNAP East is most pronounced on monthly timescales (SD = ±2.7 Sv), where monthly MOC values range from 7.8 Sv in October 1978 to 28.7 Sv in January 1996. The simulated MOC variability is weaker on interannual timescales (SD of annual means = ±1.0 Sv), in agreement with previous results from ocean models and reanalyses (Xu et al., 2014; Wang et al., 2021). The gradual increase in the MOC from the 1970s to the mid-1990s (+0.1 Sv yr−1, p<0.01) and the subsequent marked decline in the MOC between 1996 and 2000 (−1.3 Sv yr−1, p<0.01) are well-documented trends that are consistently found in both observations (Kieke et al., 2007; Mercier et al., 2015) and numerical modelling studies (Böning et al., 2006; Desbruyères et al., 2013; Xu et al., 2013).
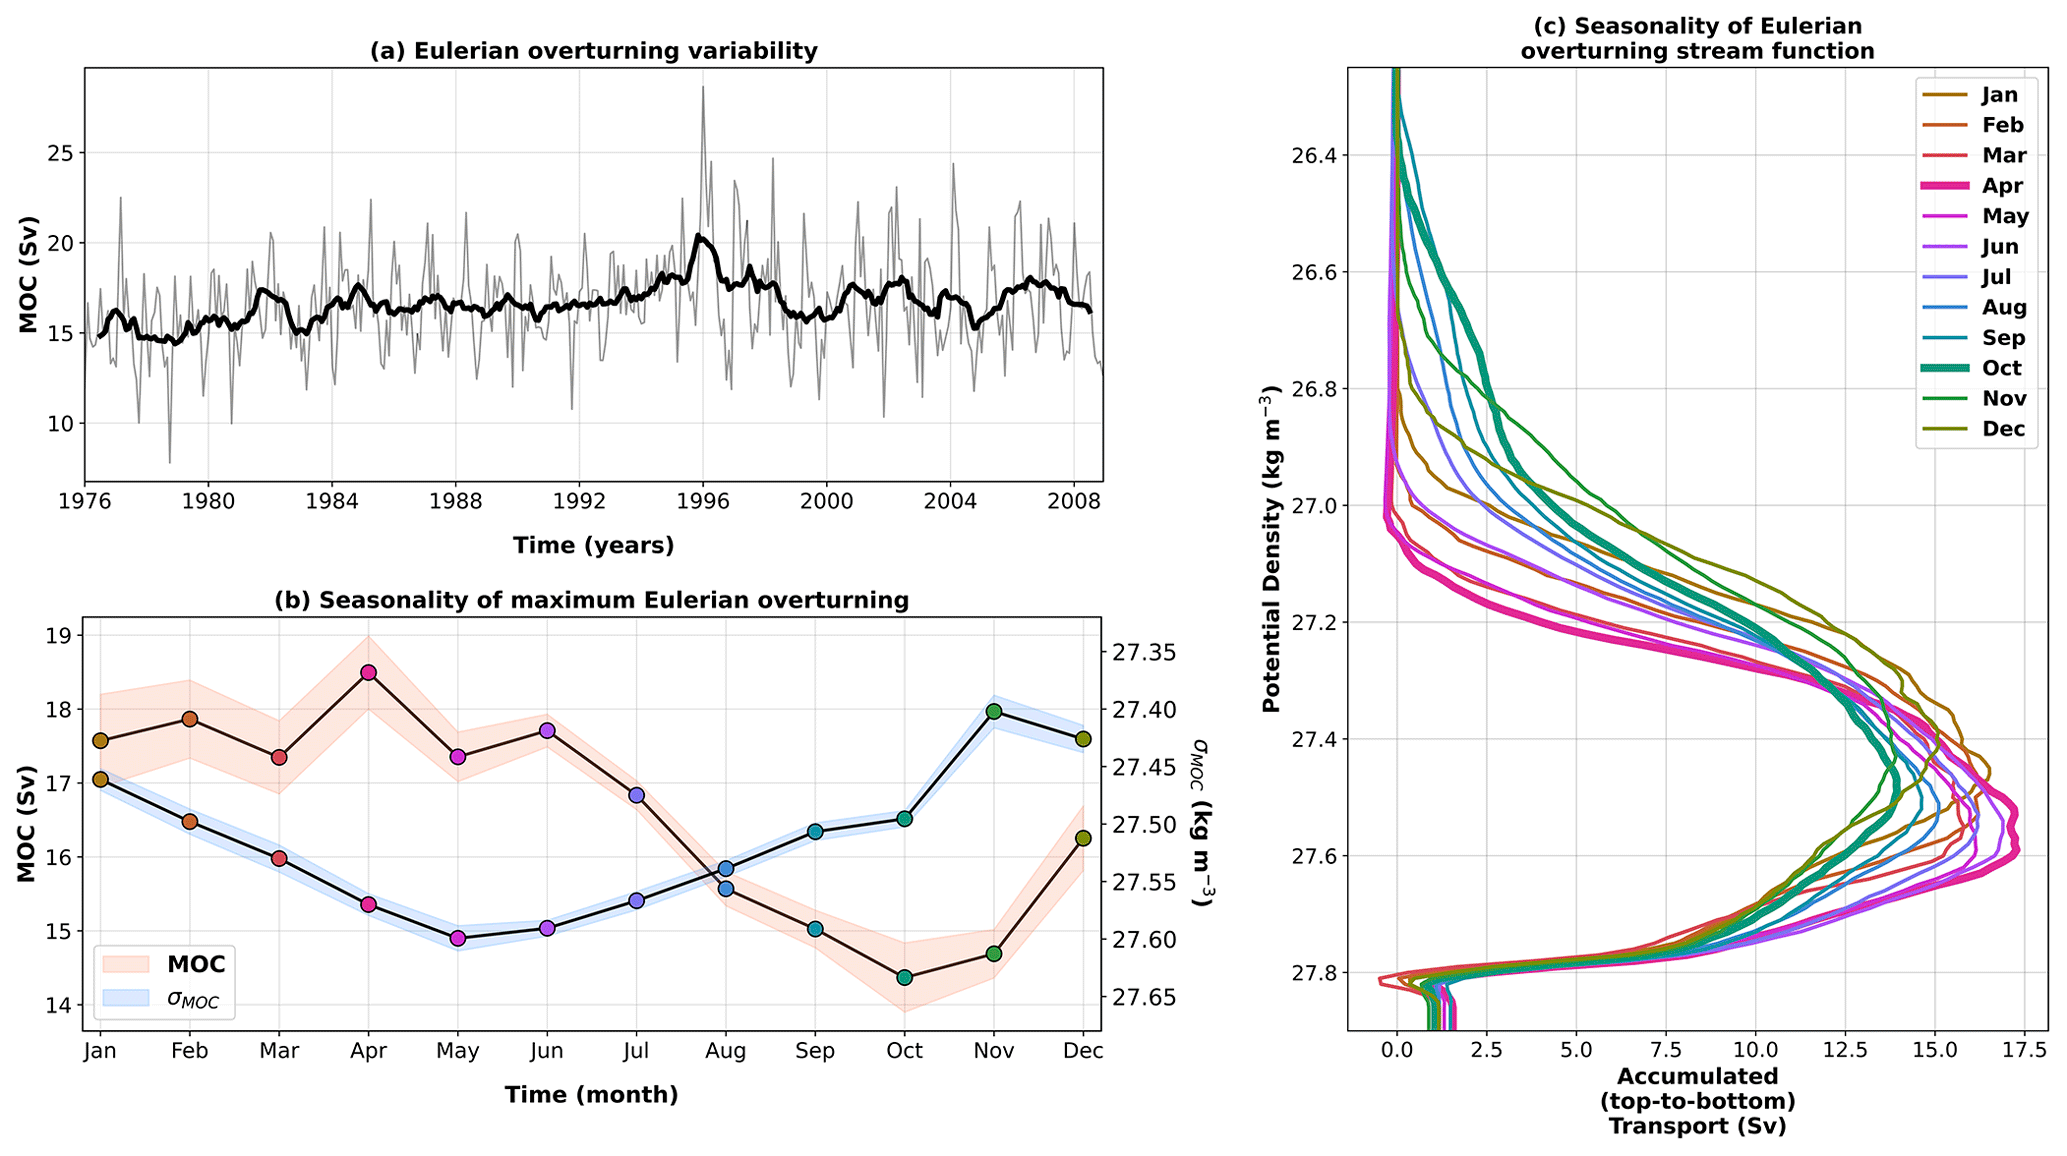
Figure 2Eulerian overturning variability at the model-defined OSNAP East section. (a) Monthly maximum of the Eulerian overturning streamfunction in density space (first available day of each month, grey line) and 1-year annual running mean (black bold line) overlaid for 1976–2008. (b) Mean seasonal cycles of the maximum of the Eulerian overturning streamfunction and the isopycnal of maximum overturning (σMOC) computed from monthly composites. Shading represents ±1 standard error of the monthly estimates. (c) Monthly composites of the Eulerian overturning streamfunction calculated in discrete density space (bin width is 0.01 kg m−3); maximum (April) and minimum (October) months in the MOC seasonal cycle are included in bold.
The intra-annual variability in the MOC at OSNAP East is dominated by the strong seasonal cycle shown in Fig. 2b. The peak-to-peak amplitude of the seasonal cycle is 4.1 Sv, in close agreement with the 4.2 Sv found by Wang et al. (2021) using a ∘ Global Ocean Physics Reanalysis (1993–2016) and the 4.3 Sv seasonal cycle recorded along the Greenland–Portugal Observatoire de la Variabilité Interannuelle et Décennale en Atlantique Nord (OVIDE) section (1993–2010) by Mercier et al. (2015). Figure 2b indicates that, on average, the MOC reaches a maximum in April (18.5 Sv) and a minimum in October (14.4 Sv). We note that, while there is strong consensus that the subpolar MOC reaches a maximum in spring (e.g. Holte and Straneo, 2017; Li et al., 2021a), the occurrence of the seasonal MOC minimum during autumn in this simulation disagrees with the findings of previous reanalysis (August; Wang et al., 2021) and observational (December; Mercier et al., 2015) studies. One possible reason for this inconsistency between studies is that the MOC seasonal cycle, when computed from monthly composites, is non-stationary, such that the timing of the seasonal extrema will be dependent upon the years chosen to compute those composites. This is particularly notable in the results of Wang et al. (2021), where the most probable timing of the minimum of the MOC seasonal cycle at OSNAP East transitions from autumn during the years overlapping our study period (1993–2008) to summer between 2009 and 2016.
Given that the strength of the MOC equates to the net transport above σMOC, seasonal variations in the MOC can be attributed to either changes in the meridional velocity field or to changes in the isopycnal structure at OSNAP East. To understand how the composition of the MOC upper limb evolves on seasonal timescales, Fig. 2c presents monthly composites of the Eulerian overturning streamfunction evaluated at OSNAP East. We note that the maximum values of the monthly mean streamfunctions presented in Fig. 2c underestimate the mean strength of the MOC determined from the maxima of monthly mean streamfunctions in Fig. 2b. This is because the isopycnal of maximum overturning, σMOC, can vary substantially within each of the monthly composites (Lozier et al., 2019). Figure 2c shows that the seasonal maximum of the MOC in April occurs when upper-limb waters flowing northwards across OSNAP East are relatively cold and dense (σMOC=27.57 in Fig. 2b) having experienced intense surface buoyancy loss along the North Atlantic Current (NAC) during the previous winter (Grist et al., 2016). Conversely, the minimum of the MOC seasonal cycle in October is characterised by the arrival of warm and light upper-limb waters (σMOC=27.50 in Fig. 2b) which have been transformed by summertime buoyancy gain in the NAC during the months prior (Li et al., 2021b).
The seasonal cycle of Eulerian overturning at OSNAP East therefore corresponds to the expansion (MOC weakening in summer–autumn) and contraction (MOC strengthening in winter–spring) of the overturning streamfunction in density space, which is consistent with seasonal variations in surface buoyancy forcing over the NAC upstream.
3.2 Mechanisms of seasonal Eulerian overturning variability
To identify the mechanisms responsible for seasonal Eulerian overturning variability, we next decompose the net transport of the MOC upper limb, determined directly from the simulated velocity and potential density fields along OSNAP East into its constituent northward and southward components during April and October (corresponding to the extrema of the MOC seasonal cycle in Fig. 2b). Figure 3 indicates that, in spite of the year-round net northward transport in the upper limb, the seasonal cycle of the MOC results from changes in the southward transport above σMOC at OSNAP East. This is highlighted in Fig. 3c, which shows that the total southward transport in the upper limb increases significantly from −8.7 Sv in April, when the Eulerian overturning reaches its seasonal maximum, to −14.4 Sv when the MOC seasonal minimum occurs in October.
Table 1Mean Eulerian net volume transport (Sv) in the upper limb of the MOC (i.e. above σMOC) for the major currents along the OSNAP East array during April and October. The major currents are defined geographically as follows: East Greenland Current (EGC, 0 km < x≤250 km), Irminger Gyre and Irminger Current (IG & IC, 250 km < x≤750 km), East Reykjanes Ridge Current (ERRC, 750 km < x≤1000 km), central Iceland Basin and Sub-Arctic Front (CIB & SAF, 1000 km < x≤1450 km), and Rockall Plateau and Rockall Trough (RP & RT, 1450 km < x≤2300 km). Note that x corresponds to the distance from Cape Farewell on the eastern Greenland coast.
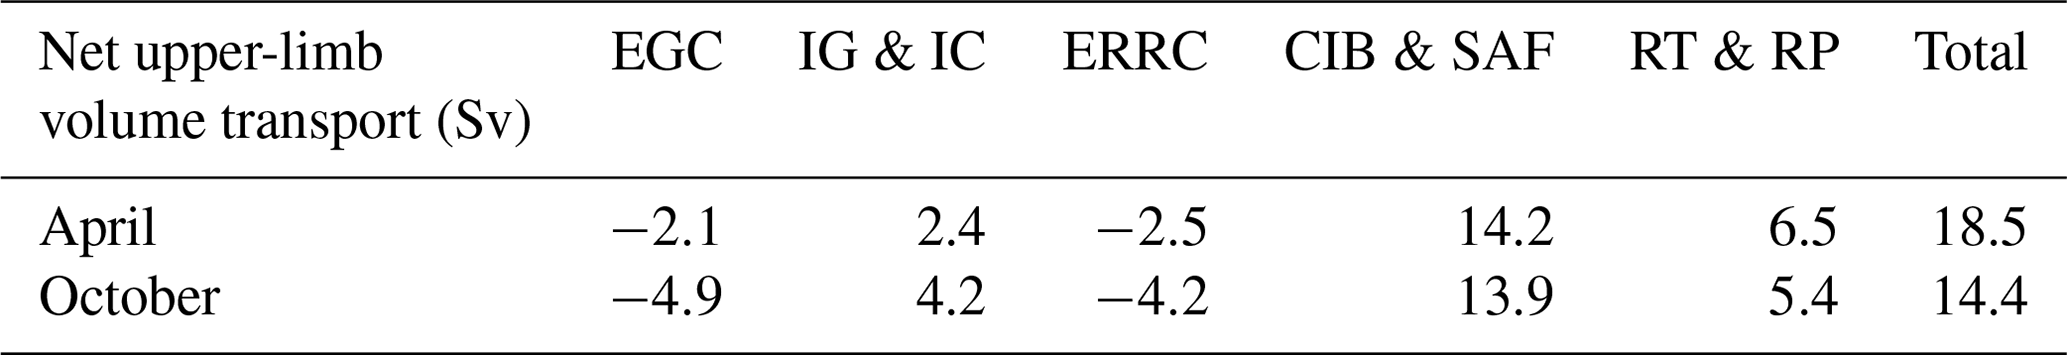
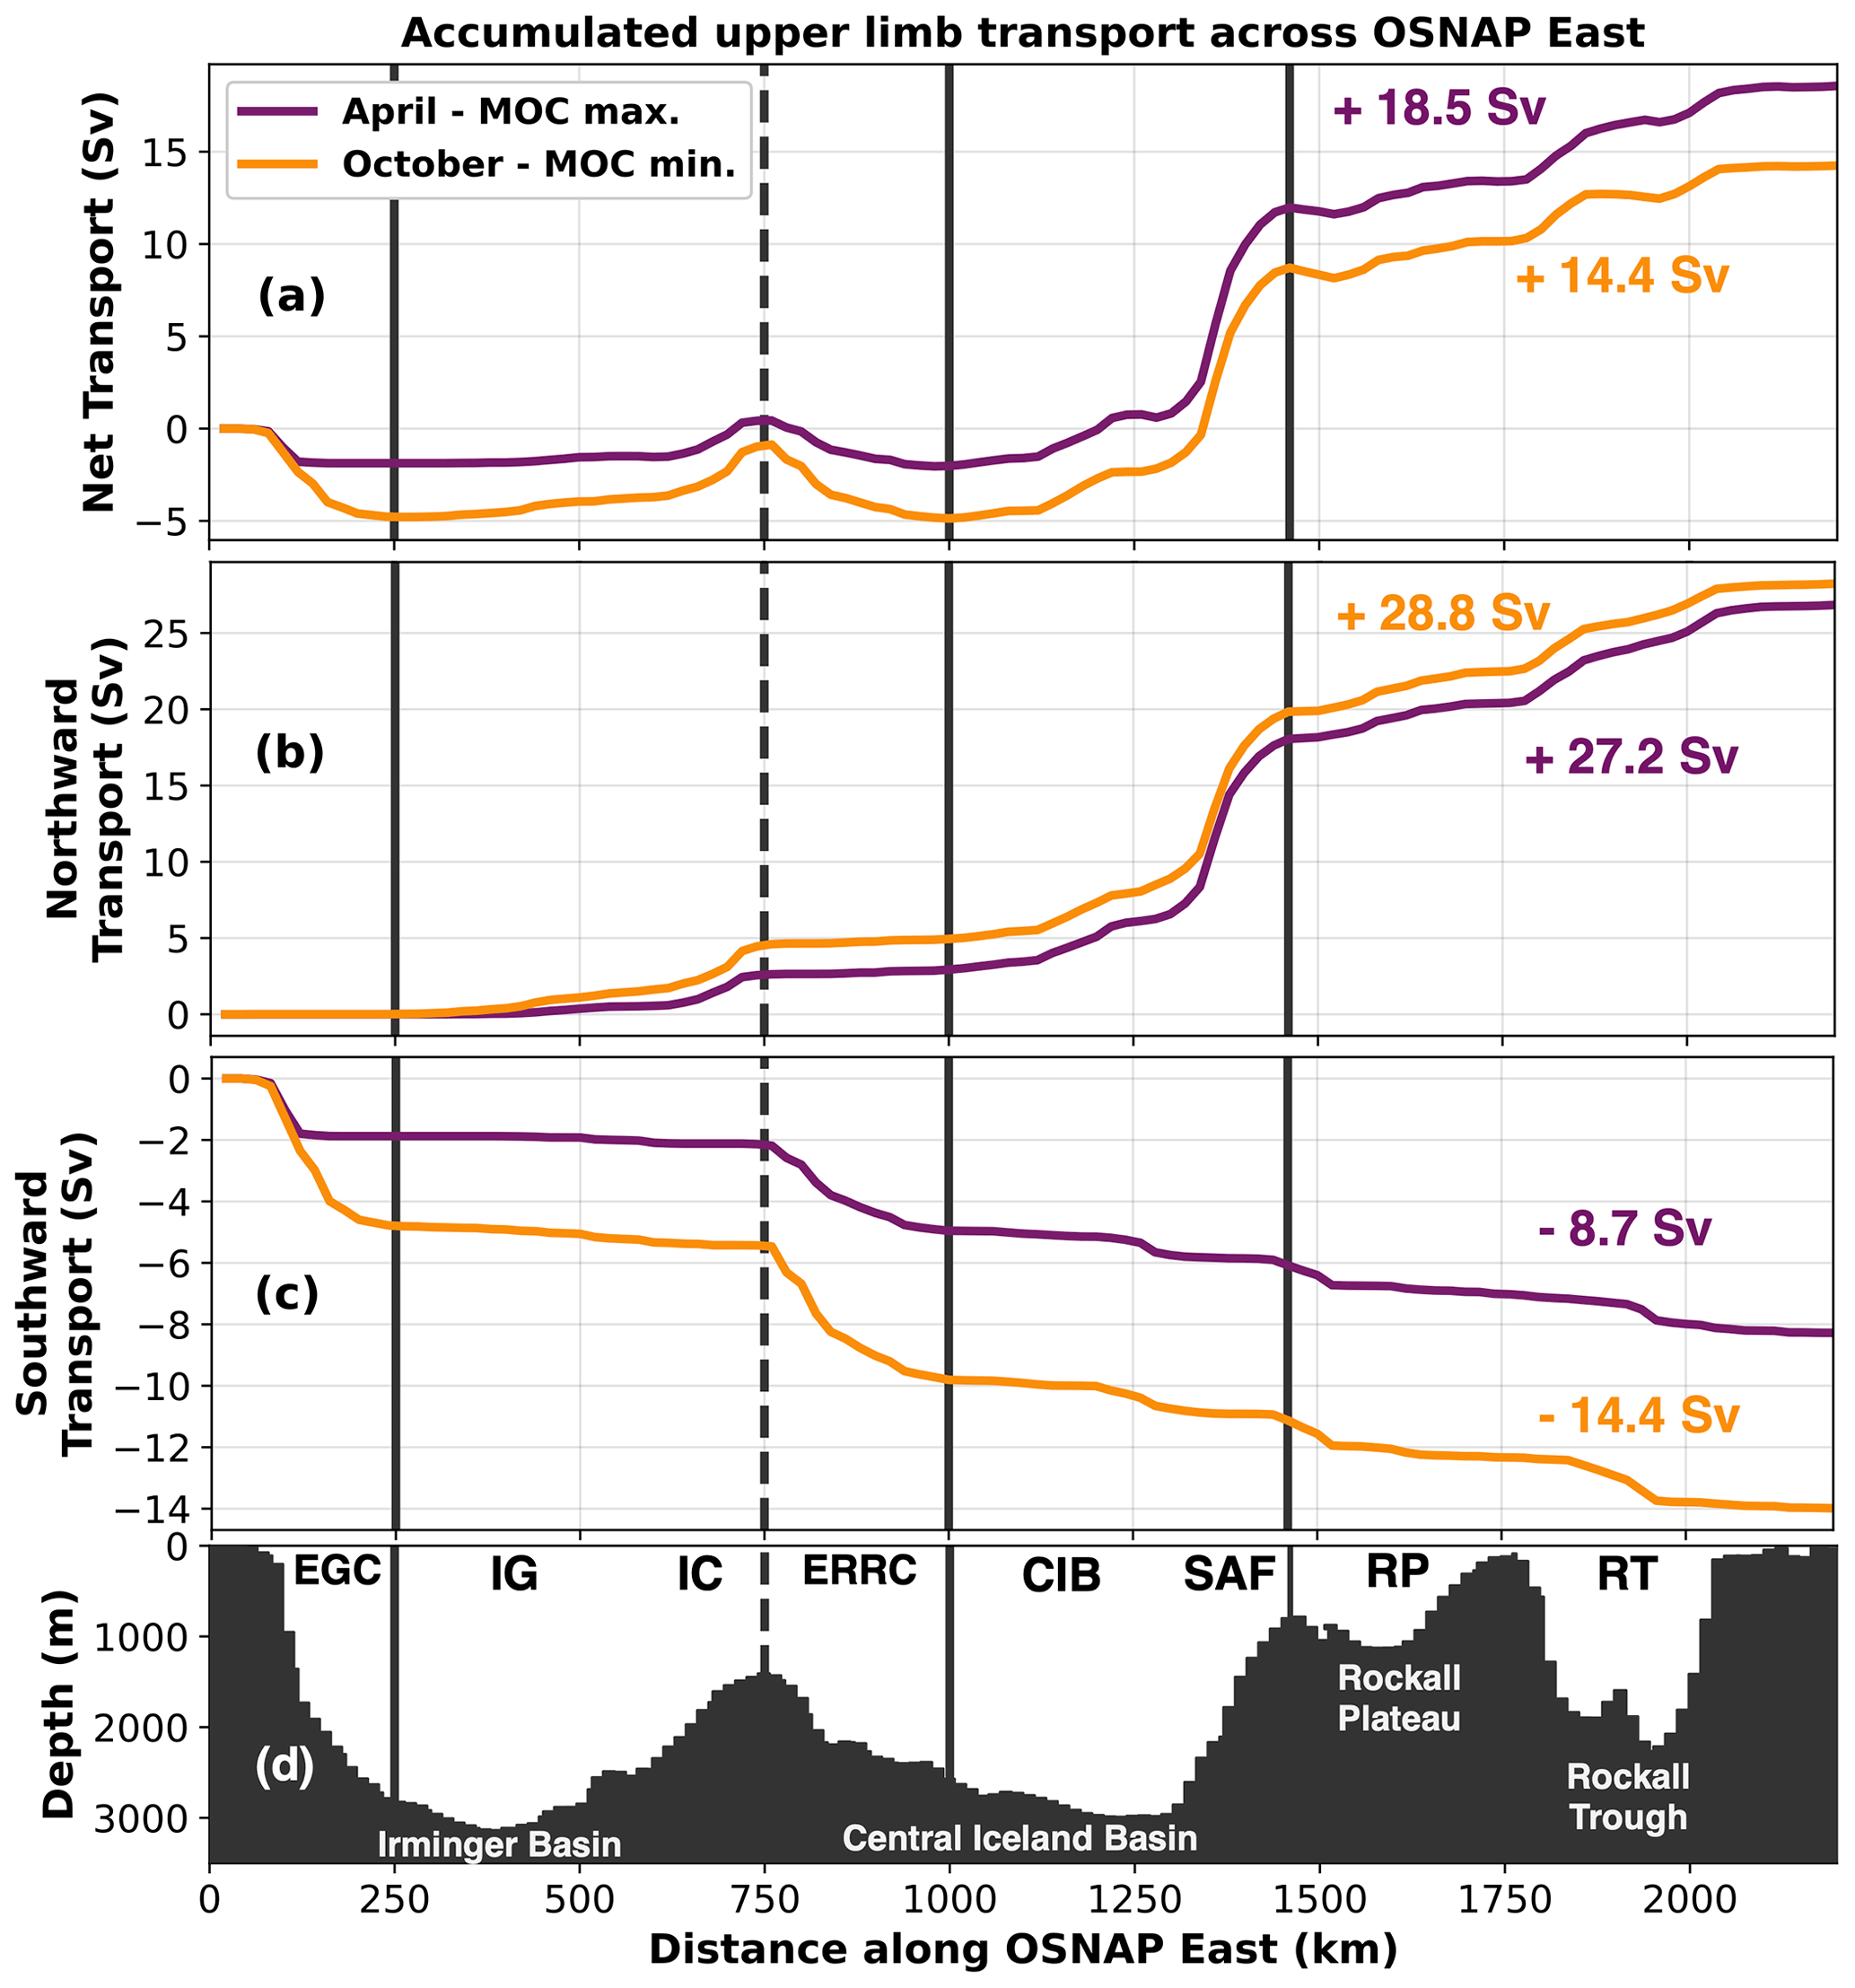
Figure 3Mean Eulerian volume transport in the upper limb (i.e. above σMOC) of the MOC accumulated with distance eastward along the model-defined OSNAP East section. The net upper-limb volume transport (a) is decomposed into its respective northward (b) and southward components (c). The model bathymetry along the OSNAP East array is presented in (d). Vertical lines partition the volume transport across the section into five geographical regions corresponding to the major currents intercepted by the array: East Greenland Current (EGC), Irminger Gyre and Irminger Current (IG & IC), East Reykjanes Ridge Current (ERRC), the central Iceland Basin and Sub-Arctic Front (CIB & SAF), and the Rockall Plateau and Rockall Trough (RP & RT).
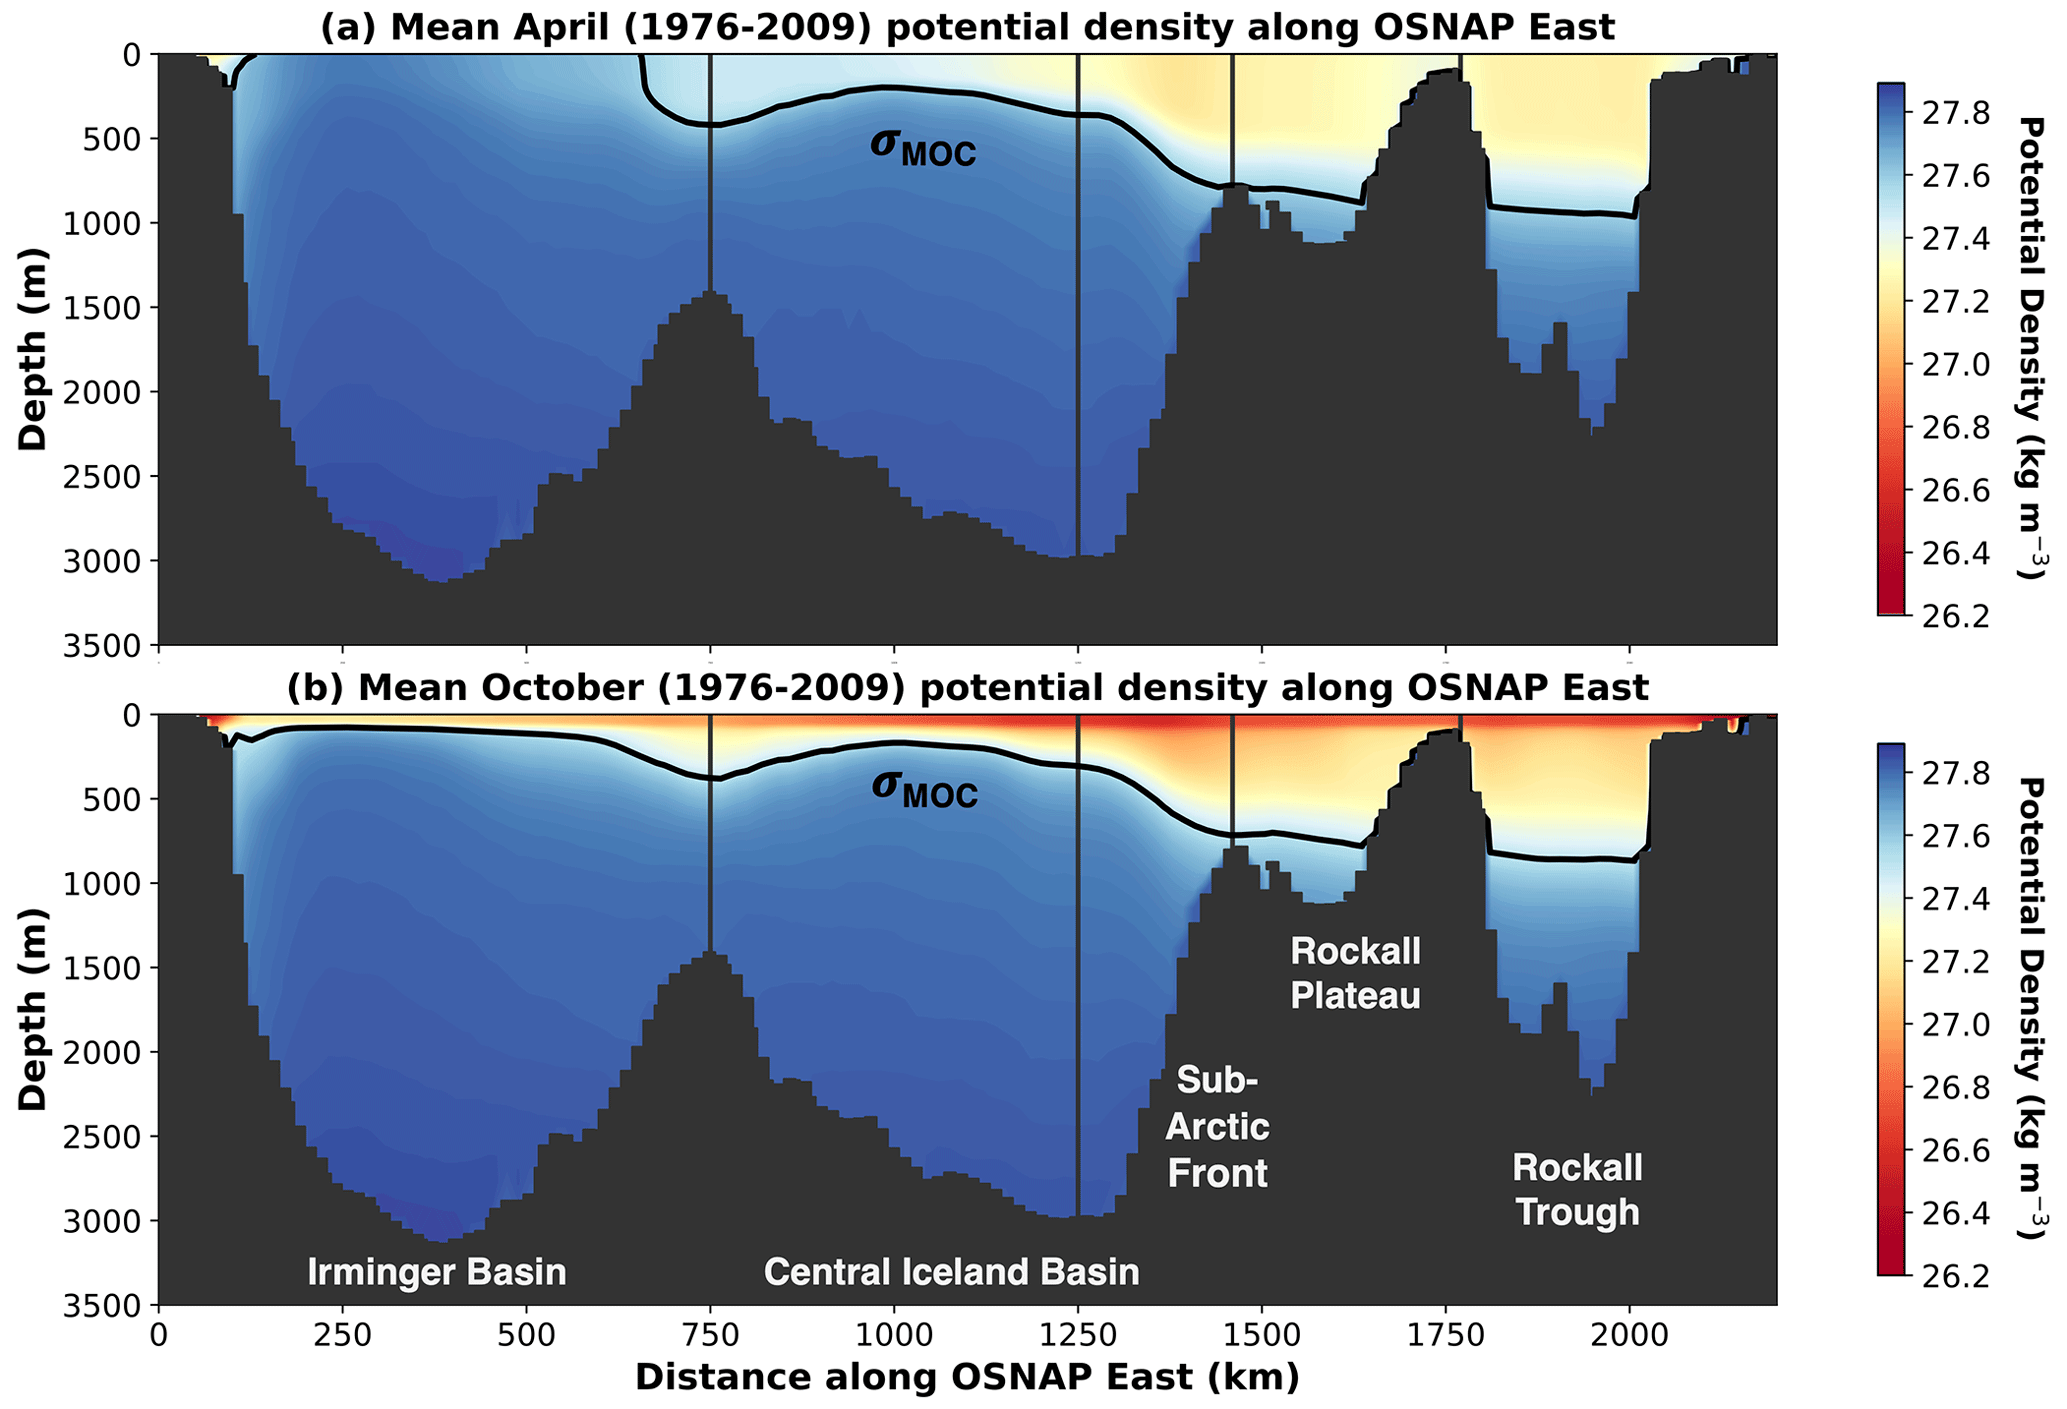
Figure 4Mean potential density along the model-defined OSNAP East section in (a) April and (b) October overlaid by the corresponding mean isopycnal of maximum Eulerian overturning (April: σMOC=27.57 kg m−3; October: σMOC=27.50 kg m−3), denoting the seasonal interface between the upper and lower limbs of the MOC.
By further decomposing the seasonal upper-limb transport according to the major currents crossing the OSNAP East array (Table 1), we find that the seasonal minimum of the MOC results from the combination of a 2.8 Sv strengthening of the EGC southward transport above σMOC and a 1.1 Sv weakening of the southern NAC branch feeding the Rockall Trough and Rockall Plateau. This agrees with the recent results of Wang et al. (2021), who demonstrated that variations in the southward transport along the western boundary of the Irminger Sea play a prominent role in modulating the seasonal cycle of overturning at OSNAP East. Moreover, Wang et al. (2021) showed that the seasonality of the EGC upper-limb transport is principally explained by seasonal density changes in the upper Irminger Sea projecting onto the mean barotropic transport of the western boundary current. To explore this further, Fig. 4 presents the mean potential density field along OSNAP East in April and October and the corresponding locations of σMOC. In April, we find that the erosion of stratification, owing to intense wintertime heat loss, permits deep convective mixing in the Irminger Sea interior (de Jong et al., 2012; de Jong and de Steur, 2016; Piron et al., 2016), such that σMOC (27.57 kg m−3 in April) outcrops at the surface (Fig. 4a). As a consequence, there is a reduction in the total upper-limb northward transport entering the Irminger Sea across OSNAP East (Table 1; see IG & IC), since the majority of water flowing northward does so in the lower limb of the MOC (de Jong et al., 2020). The equal magnitudes of the upper-limb transports entering the Irminger Sea northward (IG & IC) and leaving the Iceland Basin southward via the East Reykjanes Ridge Current (ERRC) in Table 1 is explained by the rapid anticyclonic recirculation of water south of the OSNAP East section. Along the western boundary, the isopycnal of maximum overturning slopes steeply with distance offshore during spring, decreasing the cross-sectional area over which southward flow can contribute to the upper limb of the MOC at OSNAP East. Thus, since less upper-limb southward transport is available in the EGC (−2.1 Sv, Table 1) to compensate for the stronger northward transport above σMOC in the NAC (20.7 Sv, Table 1), the MOC reaches a seasonal maximum in spring.
A contrasting density structure is found in autumn, when Fig. 4b shows that surface heating through summer has restored the stratification in the upper Irminger Sea. This agrees closely with the recent observations of de Jong et al. (2020), who found the lowest monthly mean density along OSNAP East during October. Since the depth of σMOC in Fig. 4b exceeds 100 m throughout the entire Irminger Basin, there is a larger northward upper-limb transport in the Irminger Gyre and the Irminger Current (4.2 Sv). However, this is more than compensated for by the vertical migration of the isopycnal of maximum overturning offshore of the eastern Greenland shelf break, which enables water flowing southward in the upper 200 m of the EGC to be included within the lighter MOC upper limb (σMOC=27.50 kg m−3 in October) as recently observed by Le Bras et al. (2020). This, in conjunction with the weaker transport of warm, saline water flowing northward in the NAC (a change of −1.4 Sv), is therefore responsible for the MOC seasonal minimum in October.
In contrast with the conclusion of Wang et al. (2021), we do not find that the seasonal cycle of the MOC can be accounted for by changes in the density structure of the western Irminger Basin alone. Rather, we propose that seasonal variations in the velocity field of the upper EGC act in conjunction with migrations of σMOC to drive the seasonality of Eulerian overturning at OSNAP East. To demonstrate this, we consider the Lagrangian trajectories of water parcels recirculating exclusively within the upper 250 m of the Irminger Sea. Following Våge et al. (2011), supported by our simulated time-mean current structure, we define a fixed boundary located 500 km from Cape Farewell (see Fig. 3) to differentiate between the cyclonic circulation pathways of the Irminger Gyre (IG), recirculating within the basin interior, and the Irminger Current (IC), positioned on the western flank of the Reykjanes Ridge. Figure 5a shows a strong seasonal signal in the median amount of time water parcels spend north of OSNAP East; recirculation times are longest when water parcels flow northward across OSNAP East during winter and are shortest when they cross the section during summer. For the upper IC pathway, this amounts to water parcels typically spending 8 months circulating along the boundary current following initialisation in February compared with only 6 months when initialised in August (Fig. 5a).
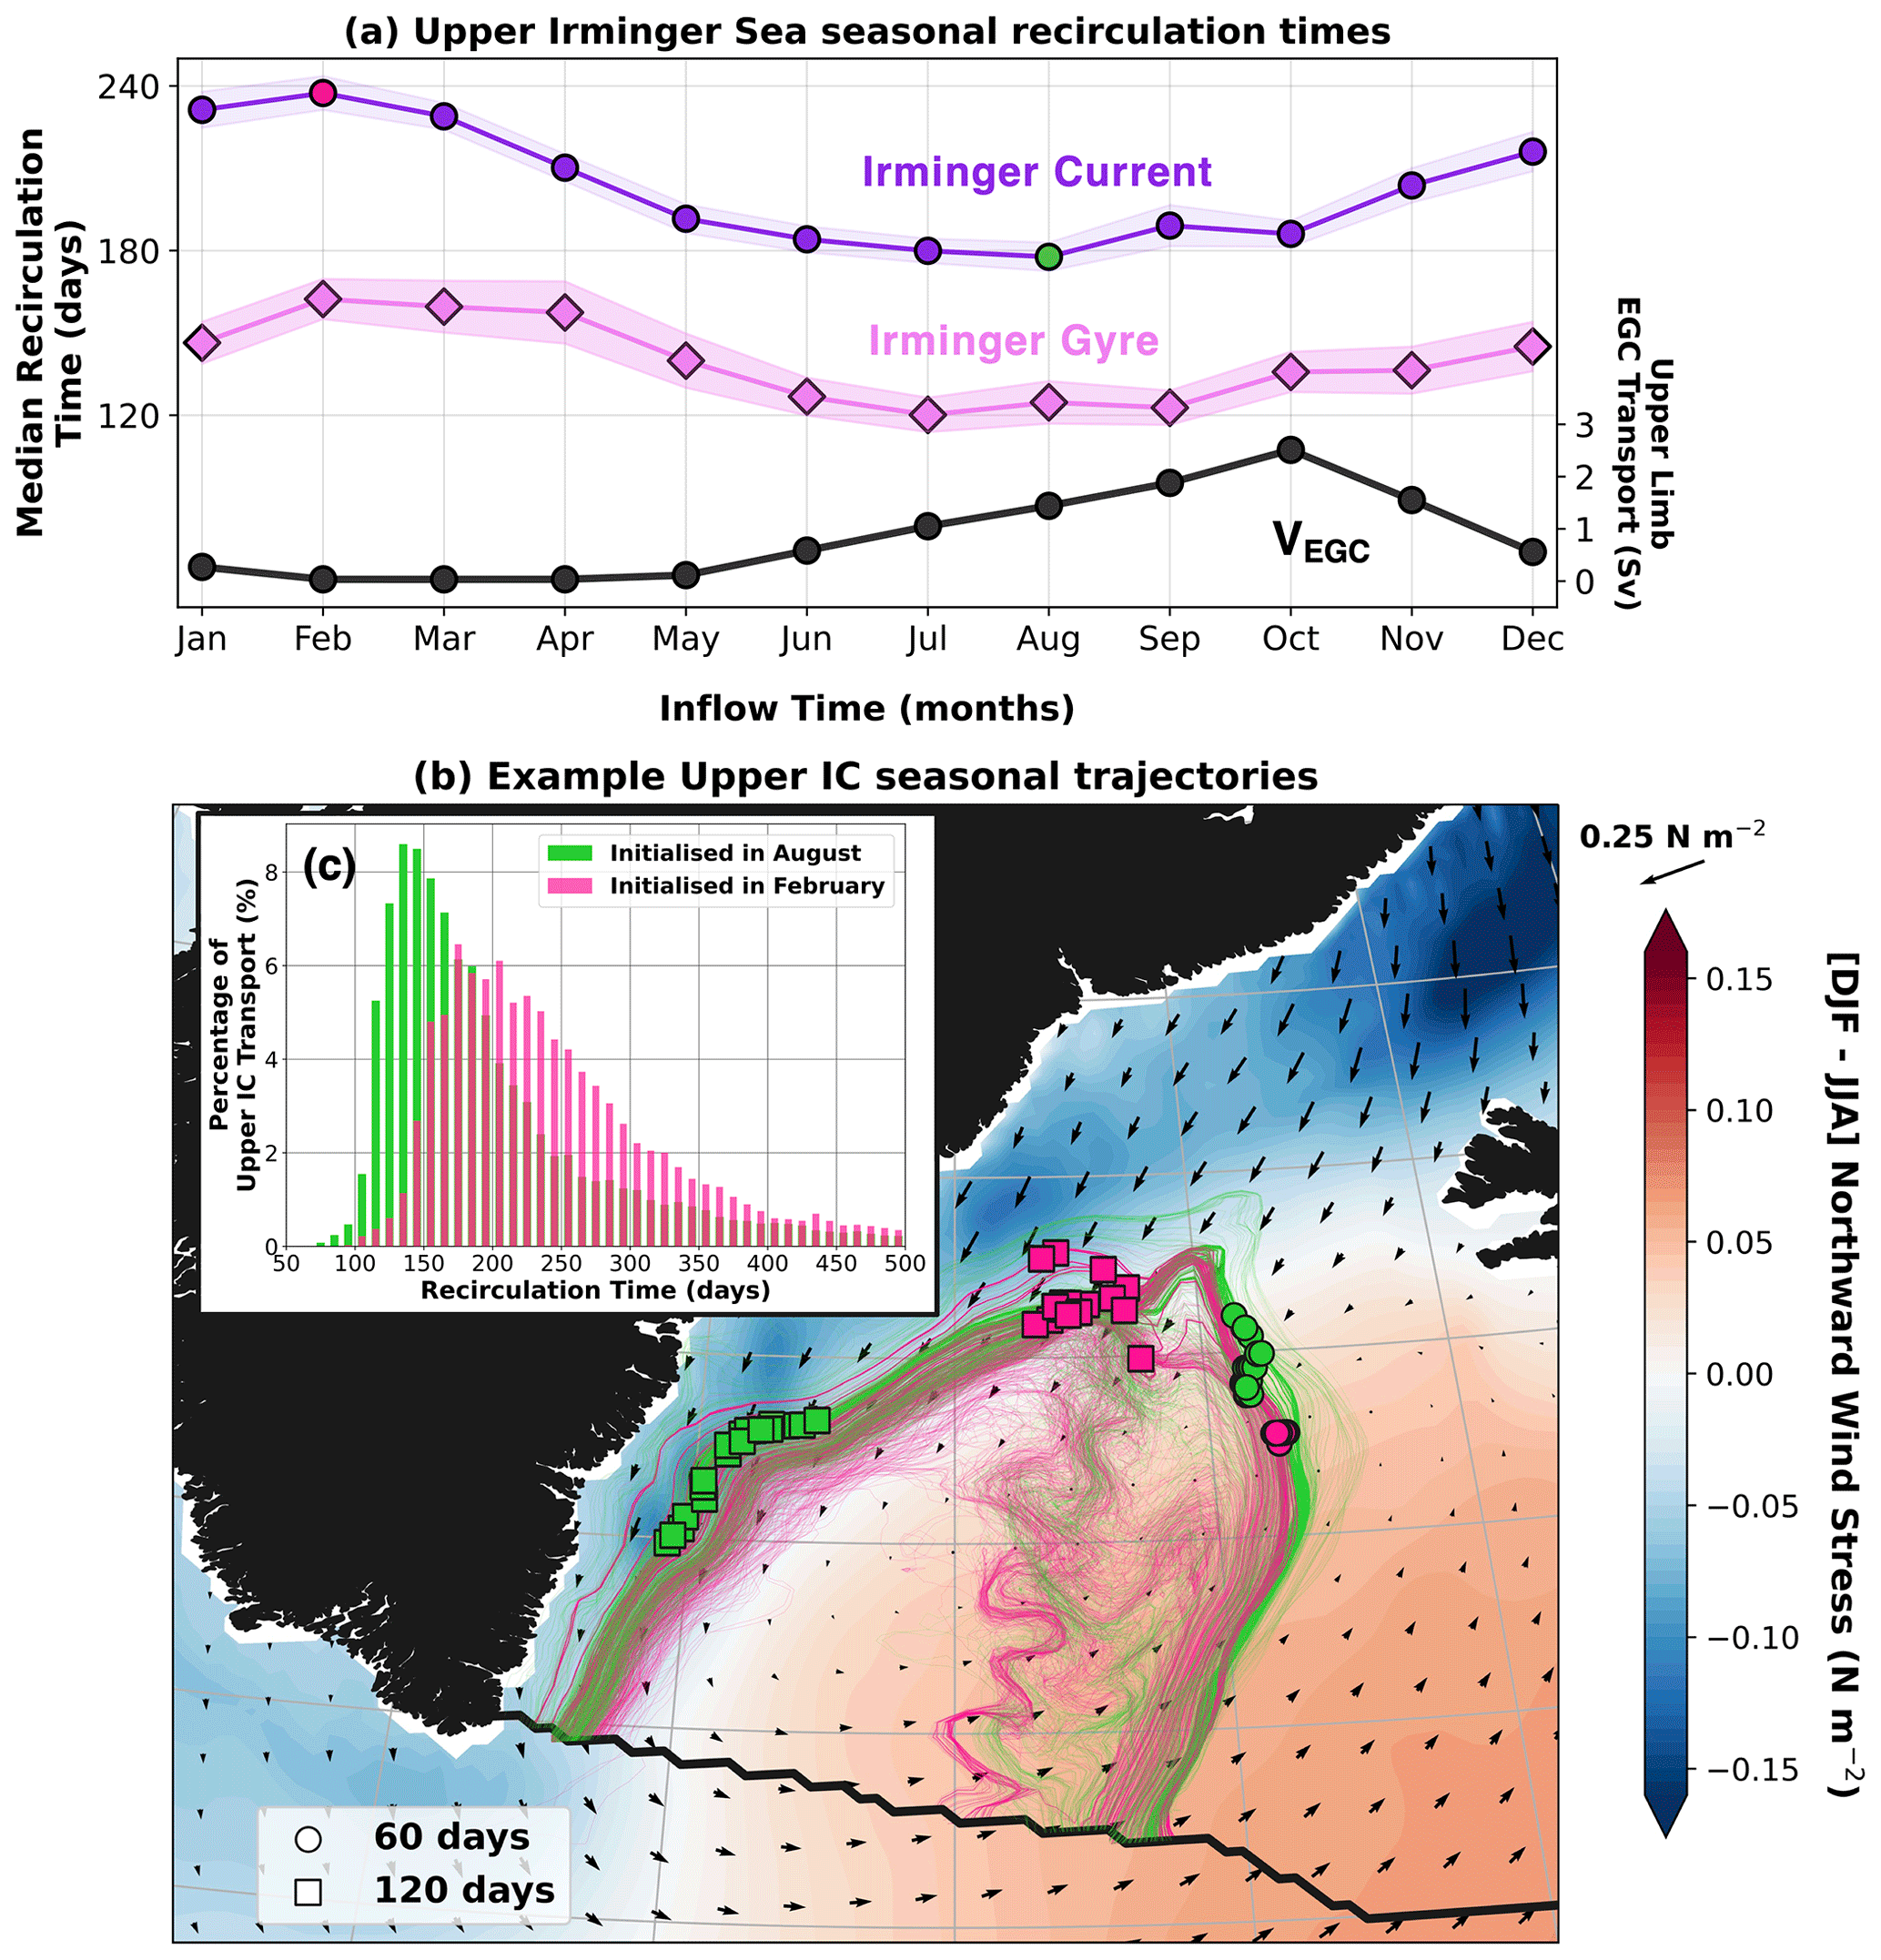
Figure 5(a) Seasonal cycle of median recirculation times north of the model-defined OSNAP East section for water parcels initialised in the upper 250 m of the Irminger Current (IC, purple) and Irminger Gyre (IG, pink) pathways. The total volume transport of upper Irminger Sea water parcels flowing southward in the EGC within the upper limb (i.e. above σMOC) is given by the solid black line (VEGC). Note that, unlike the water parcel recirculation times (purple and pink), the EGC volume transports (black) are plotted according to the month during which they cross OSNAP East southward in the EGC. (b) Example water parcel trajectories flowing northward in the upper 250 m of the Irminger Current during February (pink) and August (green) 2000. The associated median recirculation times are also coloured accordingly in (a). Way point markers show the locations of water parcels remaining within the boundary current at 60 d (circles) and 120 d (squares) following initialisation. Trajectories are superimposed on filled contours of the difference between the mean winter (DJF) and summer (JJA) northward component of the wind stress fields calculated between 1976–2015. The time-mean wind stress field (1976–2015) is shown by the overlying vectors included at the centre of every fourth model grid cell. (c) Distributions of upper IC recirculation times determined from all of the water parcels flowing northward across OSNAP East during February (pink) and August (green) between 1976 and 2008 (i.e. 33 initialisations for each month).
Critically, it is the decrease in upper IG and IC recirculation times between February–May (Fig. 5a) that contributes to the seasonality of Eulerian overturning at OSNAP East. This is because the reduction in the recirculation times of water parcels crossing OSNAP East northwards in the upper IC during spring produces a convergence of water parcels flowing southward in the upper EGC during autumn. The strongest convergence occurs in October, consistent with the observed intensification of the upper EGC at OSNAP East during autumn (Le Bras et al., 2018; Pacini et al., 2020), and amounts to a 1.0 Sv negative anomaly in the full-depth transport of the EGC. While the magnitude of this transport anomaly remains small compared with the typical magnitude of the EGC in this simulation (31.0 Sv), its surface-intensified nature has disproportionate consequences for the strength of the MOC at OSNAP East. Figure 5a shows that the convergence of upper Irminger Sea water parcels within the EGC occurs almost exclusively within the upper limb of the MOC. Thus, by acting in concert with the deepening of σMOC during late summer and autumn (Fig. 4b), the convergence of upper IG and IC water parcels within the boundary current can explain 2.6 Sv of the 2.8 Sv increase in the upper-limb EGC southward transport between April and October, accounting for almost two-thirds of the amplitude of the MOC seasonal cycle at OSNAP East (4.2 Sv).
Previous studies have highlighted the close relationship between seasonal variations in the large-scale circulation of the Irminger Sea and wind stress forcing acting over the basin (Daniault et al., 2011a, b; Le Bras et al., 2018). To determine whether local wind stress forcing can account for the seasonality of water parcel recirculation times in the upper Irminger Sea, we next compare the character of upper IC trajectories flowing northward across OSNAP East in February and August, corresponding to the longest and shortest recirculation times, respectively. Figure 5b shows that the longer median recirculation times of upper IC water parcels flowing northward across OSNAP East in February is due to their slower advection along the boundary current through spring–summer. The weakening of the boundary current is explained by the springtime spin-down of the gyre circulation owing to the decrease in wind stress curl acting over the Irminger Sea (Daniault et al., 2011a). In addition to their slower recirculation times along the boundary current, water parcels flowing northward in February are more likely to be entrained into slower circulation pathways in the basin interior, resulting in a longer tail in the distribution of recirculation times in Fig. 5c. The shorter recirculation times exhibited by upper IC water parcels flowing northward in August results from the autumn–winter spin-up of the gyre during their recirculation north of OSNAP East. Figure 5b shows that water parcels flowing northward in August experience especially fast advection within the EGC, where the strongest northeasterly winds act along the stream. This is consistent with the study of Le Bras et al. (2018), who found that seasonal variations in the wind stress curl, and by extension the EGC transport, are largely determined by changes in the local wind stress field acting along the eastern Greenland coast.
It is important to emphasise that the relationship we have determined between wind stress forcing and seasonal Eulerian overturning variability at OSNAP East may not be applicable throughout the entire SPNA. For example, Wang et al. (2021) showed that dramatic seasonal variations in wind stress curl over the Labrador Sea do not translate into overturning seasonality, given that northward and southward boundary current transports across OSNAP West vary synchronously and thus act to compensate one another on seasonal timescales. This suggests that the larger basin geometry of the eastern SPNA plays an integral role in enabling seasonal wind stress forcing to project onto the seasonal overturning variability recorded at OSNAP East.
4.1 Seasonal Lagrangian overturning at OSNAP East
The Lagrangian overturning framework provides us with an alternative view of the overturning variability at OSNAP East on seasonal timescales. Whereas the Eulerian streamfunction integrates the meridional transports across OSNAP East in density space at a given point in time, the LOF measures the net diapycnal transformation that the total northward transport arriving at OSNAP East will go on to experience during its recirculation within the eSPG. As such, the meridional transports comprising the LOF belong to a single collection of water parcels (sharing a common inflow time), whereas the Eulerian streamfunction includes two unrelated collections of water parcels flowing northwards and southwards, respectively. We should therefore consider the LOF to be a complementary measure of the overturning at OSNAP East, which explicitly accounts for both the transformation and subsequent export of water masses within the eSPG by preserving knowledge of water parcel identity.
Figure 6a presents the strength of the Lagrangian overturning within the eSPG between 1976 and 2008, consistent with our earlier Eulerian analysis (Fig. 2a). The smaller magnitude of Lagrangian overturning in Fig. 6a compared with the Eulerian overturning shown in Fig. 2a is due to the exclusion of water parcels that are overturned north of the Greenland–Scotland Ridge from our analysis. We find that, on average, 8.9±2.2 Sv of water flowing northwards across OSNAP East is transferred from the upper to the lower limb of the LMOC within the Iceland and Irminger basins. This transformation is stronger than the mean Lagrangian overturning found in Tooth et al. (2023) because here we compute the average of the maximum Lagrangian overturning each month as opposed to taking the maximum of the mean LOF as in Tooth et al. (2023). To highlight the fidelity of the simulated Lagrangian overturning at OSNAP East, we note the good agreement between the simulated mean strength of the LMOC and observed estimates of 7.6–10.2 Sv of overturning within the Iceland and Irminger basins (Chafik and Rossby, 2019; Petit et al., 2020; Sarafanov et al., 2012).
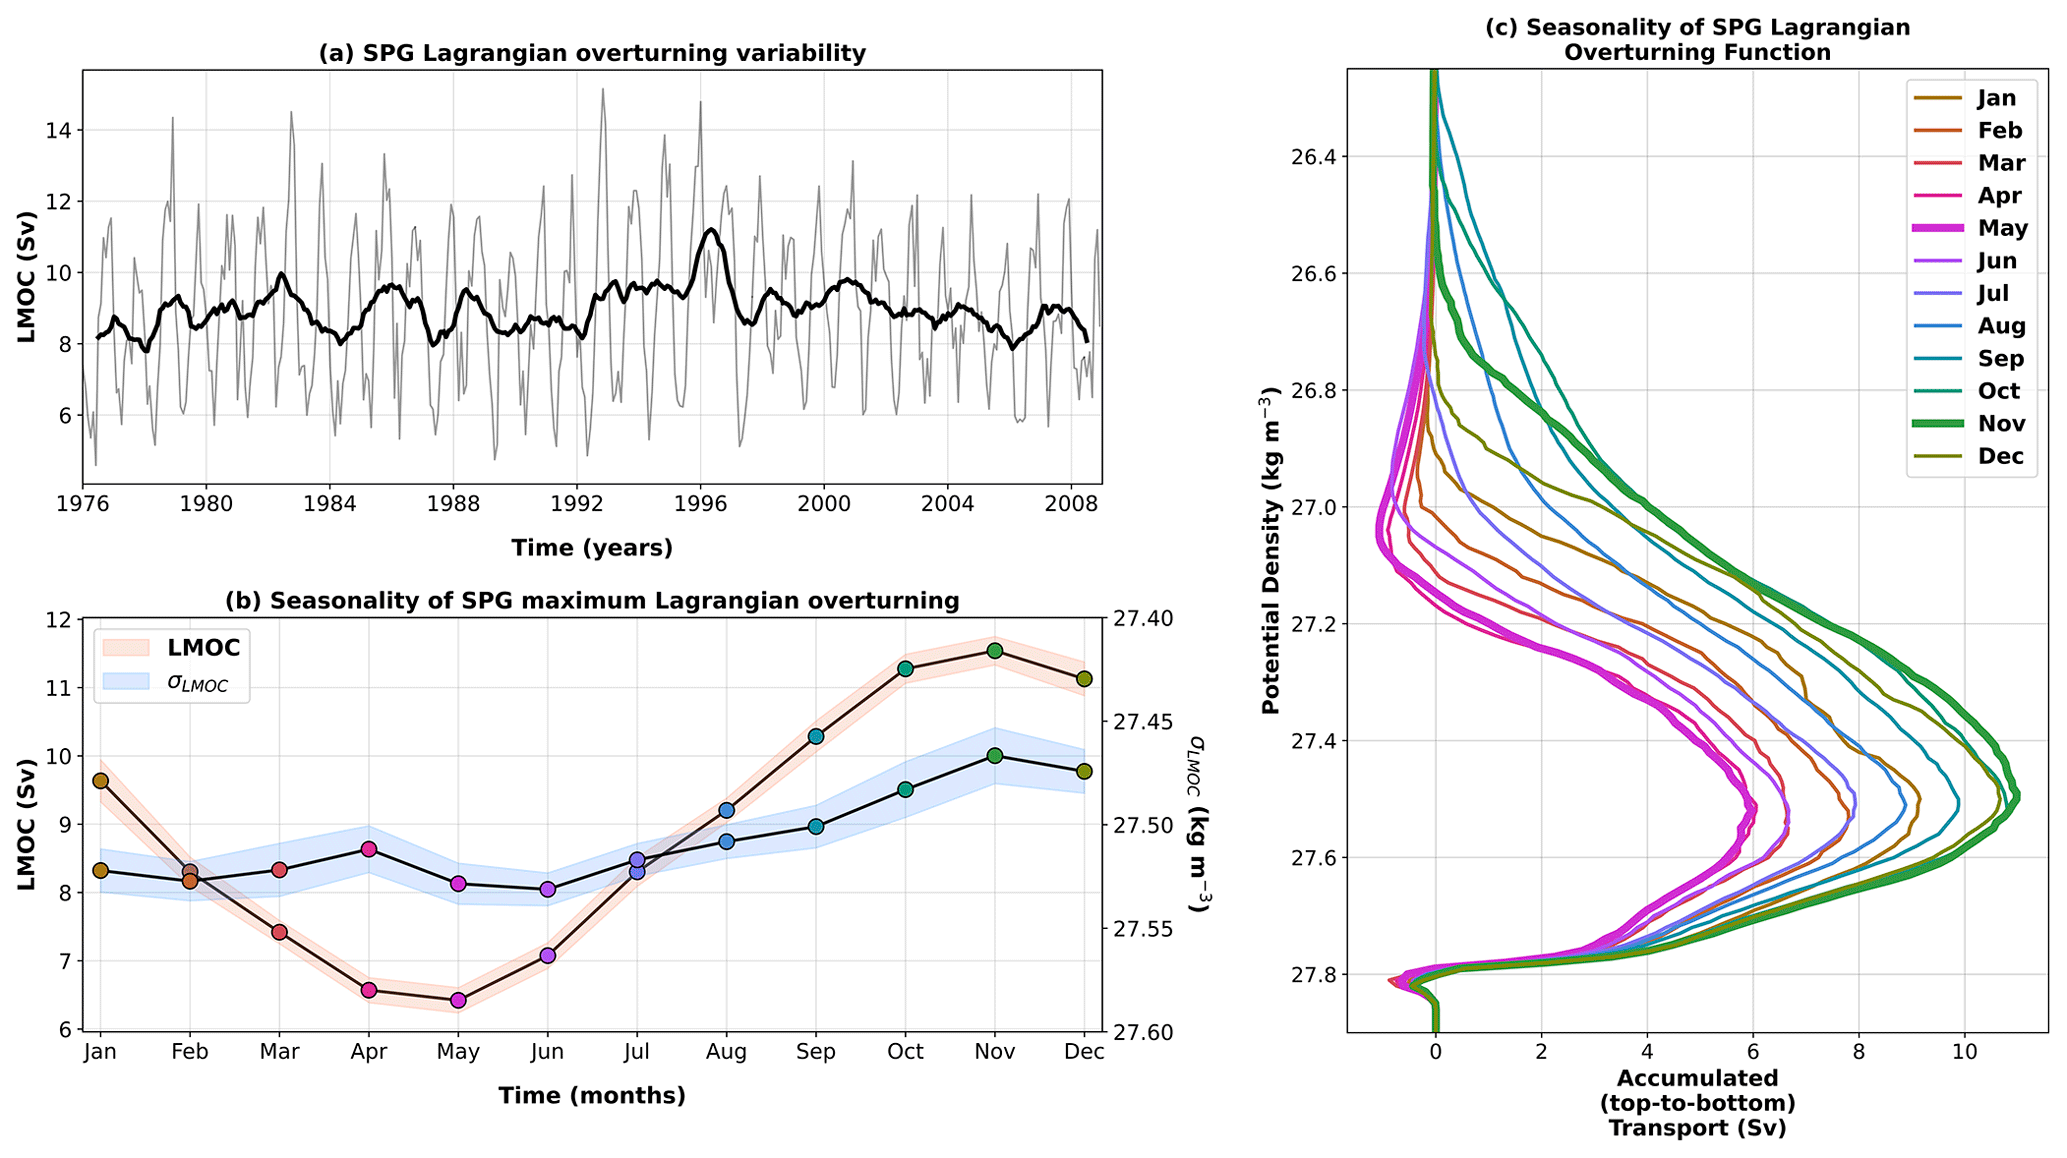
Figure 6Lagrangian overturning variability of the eSPG at the model-defined OSNAP East section. The LOF for any given month describes the subsequent transformation of recirculating water parcels crossing the OSNAP East section northward in that month. (a) Monthly maximum of the Lagrangian overturning function in density space (computed from the subset of particles initialised on the inflow across OSNAP East that recirculate south of the Greenland–Scotland Ridge, grey line) and 1-year annual running mean (bold black line) overlaid for 1976–2008. (b) Mean seasonal cycles of the maximum of the Lagrangian overturning function and the isopycnal of maximum Lagrangian overturning (σLMOC) computed from monthly composites. Shading represents ±1 standard error of the monthly estimates. (c) Monthly composites of the Lagrangian overturning function calculated in discrete density space (bin width is 0.01 kg m−3); maximum (November) and minimum (May) months in the LMOC seasonal cycle are included in bold.
In contrast with the seasonality of the Eulerian overturning at OSNAP East, the seasonal cycle of Lagrangian overturning in Fig. 6b shows a steady increase from a minimum of 6.4 Sv in May to a maximum of 11.5 Sv in November. While the phase difference between the seasonal cycles of the MOC and the LMOC may initially appear counter-intuitive, recall that the strength of the Lagrangian overturning quantifies how much of the total northward transport flowing north across OSNAP East in any given month is transformed from the upper to the lower limb in the Iceland and Irminger basins. Interestingly, the seasonal cycle of the LMOC strength is closely correlated with the seasonality of both σLMOC (Fig. 6b: , p<0.01) and σMOC (Fig. 2b: , p<0.01), suggesting that the potential density of upper-limb water parcels on flowing northward across OSNAP East is an important indicator of their future contribution to overturning seasonality north of the section. This is in marked contrast to the seasonal cycle of the Eulerian MOC, which implies that the coldest and densest upper-limb waters flowing northward across OSNAP East in April lead to a maximum in overturning strength.
To better understand the relationship between the composition of the upper limb and the strength of Lagrangian overturning, Fig. 6c shows how the LOF evolves over the duration of the mean seasonal cycle. Here, we find that the maximum of the LMOC, for water parcels flowing north in November, occurs when relatively light upper-limb water parcels experience sufficient wintertime surface buoyancy loss to enter the lower limb before returning to OSNAP East. Meanwhile, denser upper-limb water parcels arriving at OSNAP East in May, previously transformed by wintertime cooling, experience substantial summertime buoyancy gain north of OSNAP East to become lighter downstream. This negative diapycnal transformation is captured in the pronounced region of negative Lagrangian overturning between 26.8 and 27.2 kg m−3 in Fig. 6c and results in the weakest seasonal volume flux into the lower limb.
The seasonal cycle of Lagrangian overturning at OSNAP East therefore reflects the seasonality of the surface-forced water mass transformation within the Iceland and Irminger basins. The strengthening of the LMOC for water parcels crossing OSNAP East in summer–autumn corresponds to increasing volume flux across σLMOC, owing to intense surface buoyancy loss along water parcel trajectories during the ensuing winter. Meanwhile, the weakening of the LMOC for parcels crossing OSNAP East through winter–spring reflects a decreasing volume flux into the lower limb as water parcels in the upper limb gain buoyancy along their trajectories during the ensuing summer.
4.2 Timescales and origins of seasonal Lagrangian overturning
We have demonstrated that a close phase relationship exists between the seasonal cycle of Lagrangian overturning at OSNAP East and the seasonality of surface buoyancy forcing over the Iceland and Irminger basins. However, we have yet to establish why the magnitude of seasonal variability (SD of LMOC seasonal cycle = ±2.1 Sv) remains small compared with the large seasonal cycle of surface buoyancy-driven transformation (Xu et al., 2018b; Petit et al., 2020). Since wintertime surface buoyancy loss greatly exceeds summertime buoyancy gain over the eSPG (Xu et al., 2018b), the mean strength of the LMOC is governed by the fraction of upper-limb water parcels which fail to return to OSNAP East before the onset of winter and therefore experience sufficient surface buoyancy loss to be transferred into the lower limb during their recirculation. The seasonality of Lagrangian overturning is instead determined by rapidly recirculating water parcels whose diapycnal transformation north of OSNAP East is dependent on the time of year that they arrive at the section. To better distinguish between the origins and advective timescales of water parcels responsible for the mean strength and seasonality of Lagrangian overturning at OSNAP East, we next decompose the LOF according to both the time water parcels spend north of OSNAP East (herein referred to as the water parcel recirculation time, τ) and the distance from the eastern Greenland coast that water parcels flow northward across the section (Fig. 7).
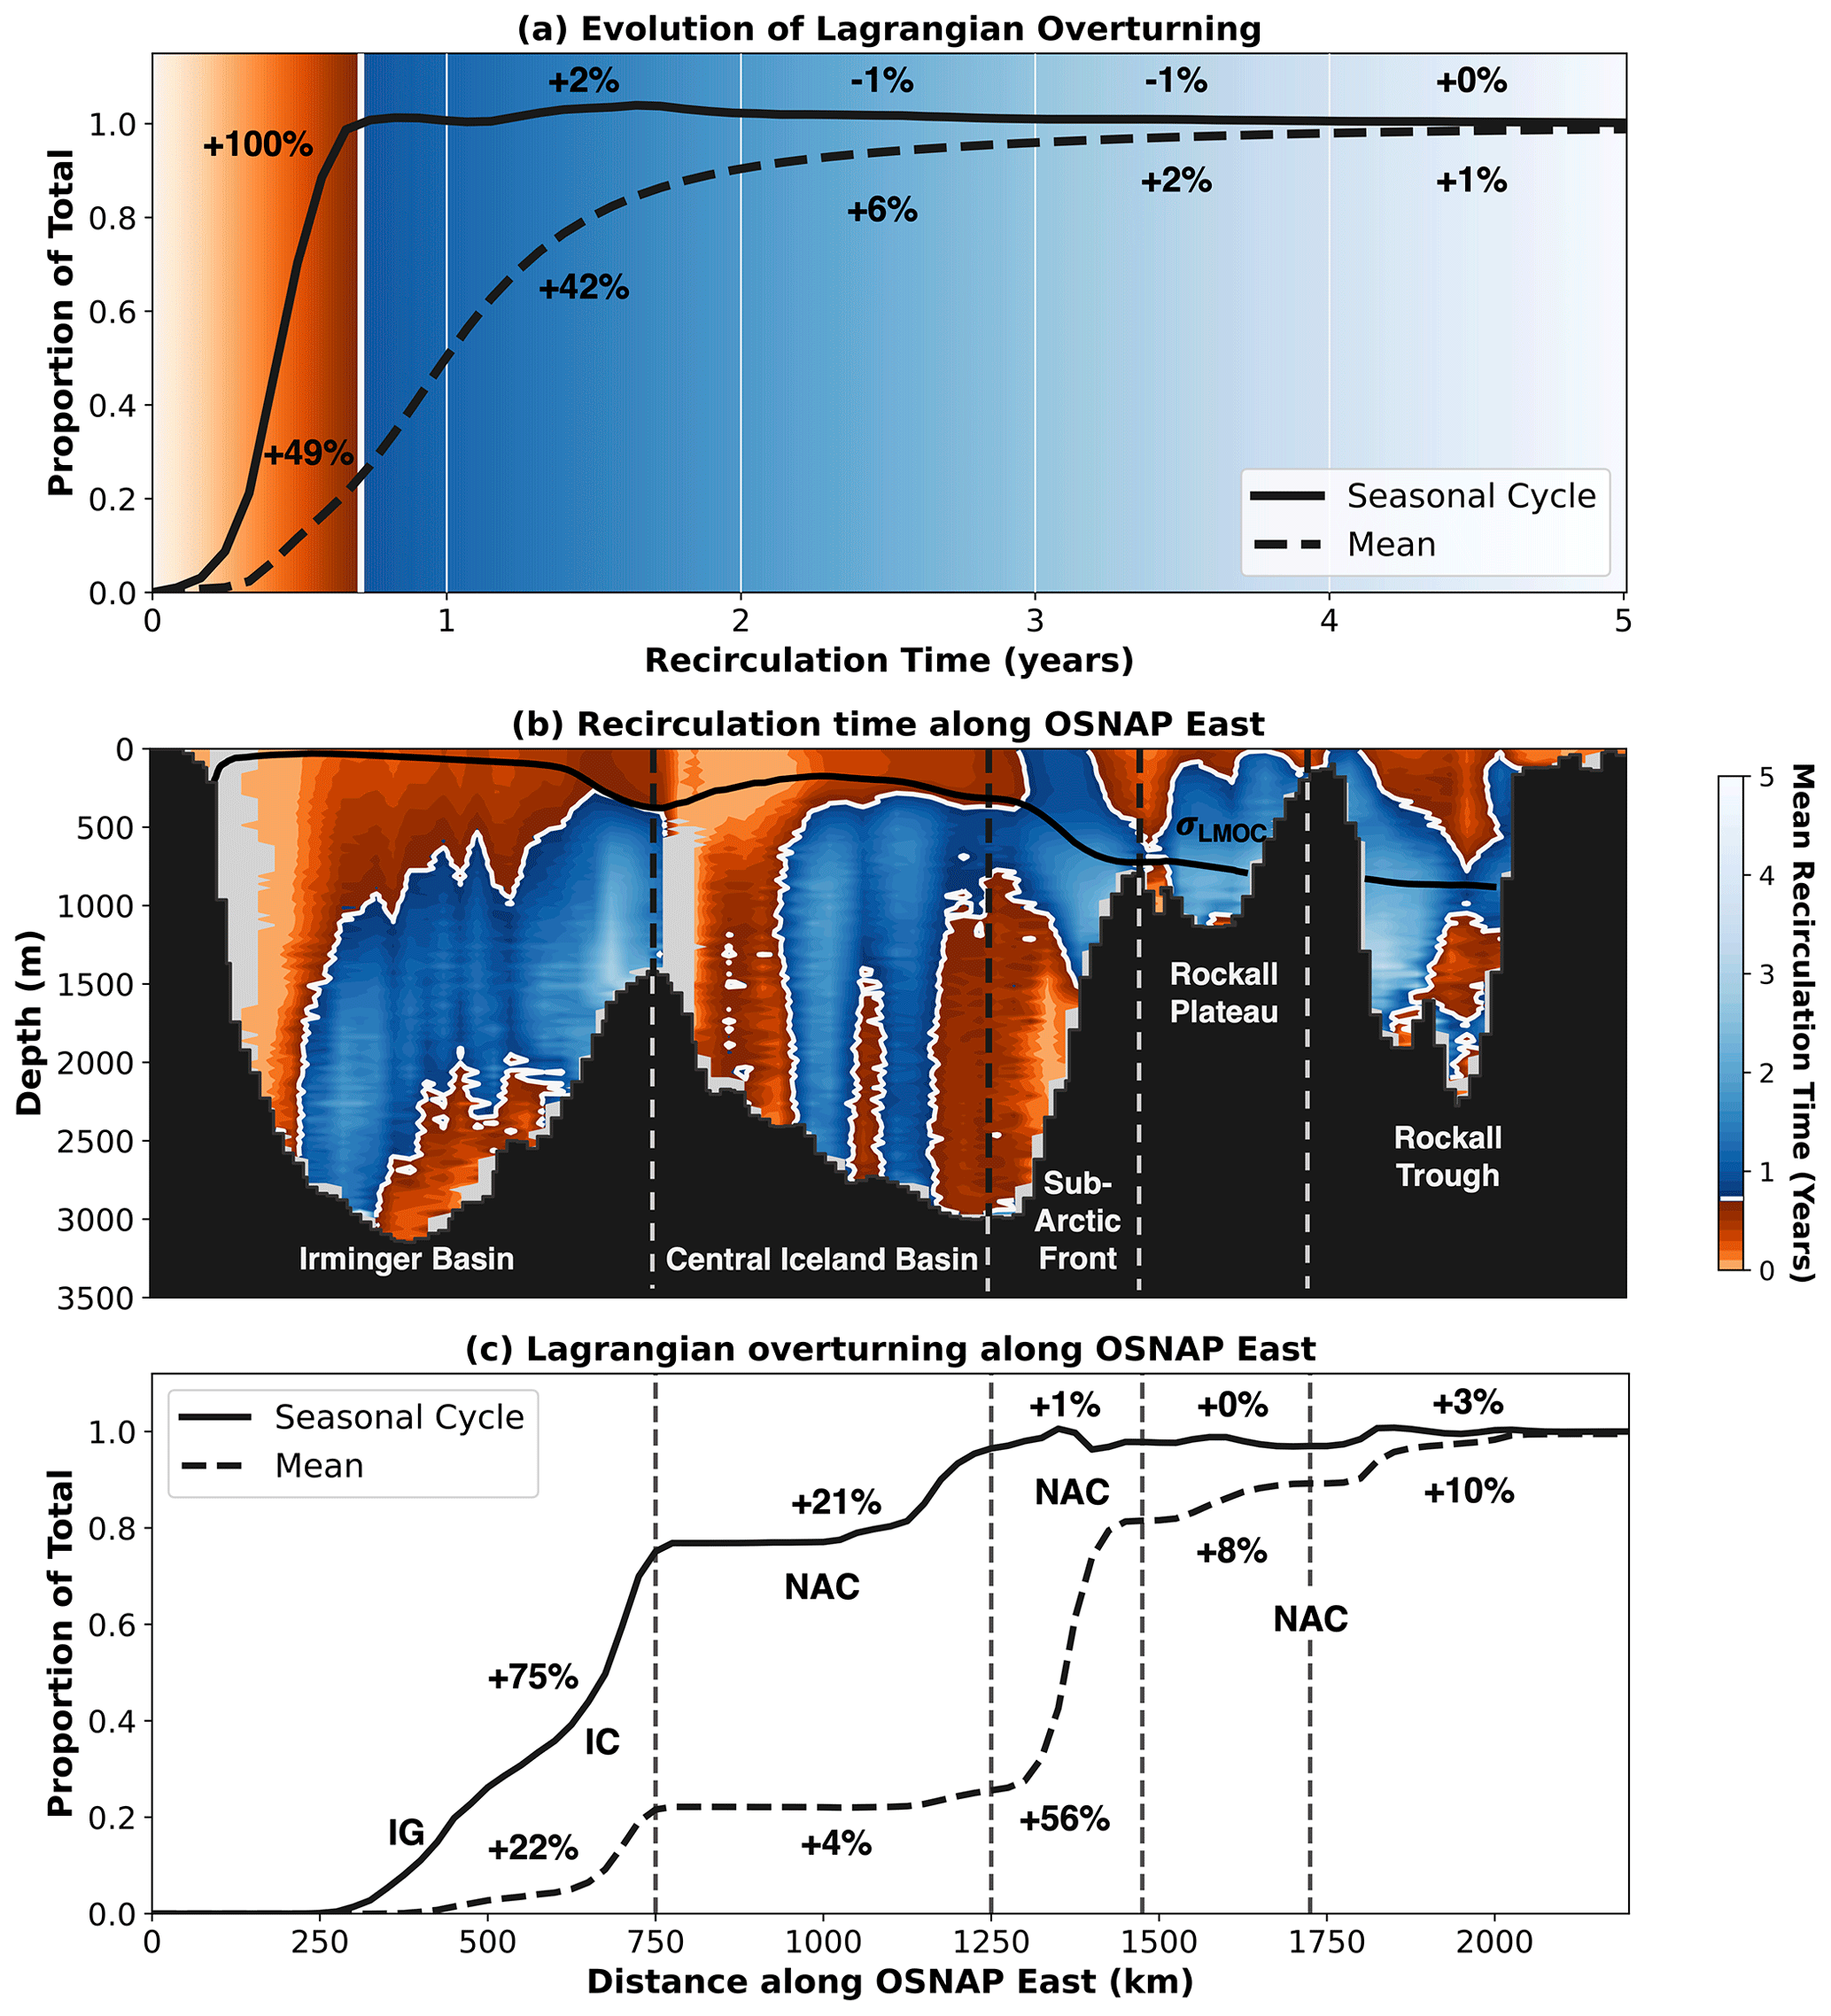
Figure 7Decomposition of the mean strength and seasonality of Lagrangian overturning within the eSPG by recirculation time and distance along OSNAP East. (a) Normalised mean strength and seasonality (amplitude of the seasonal cycle calculated as November–May difference between LMOC monthly composites) of the Lagrangian overturning at σLMOC evaluated as a function of the time in which water parcels recirculate back to the OSNAP East section. (b) Mean recirculation time of water parcels initialised on the northward inflow across OSNAP East as a function of their initial position in x–z space, where x is the distance along the OSNAP East section (km) and z is the depth (m). All 9.8 million eSPG water parcels initialised across 396 months (1976–2008) are binned according to their initial position before computing the mean recirculation time for each bin (Δz=25 m, Δx=25 km). Grey regions coincide with the major southward currents intersected by the OSNAP East array, hence no northward-flowing water parcels are initialised here. (c) Normalised mean strength and seasonality of the Lagrangian overturning at σLMOC accumulated as a function of the distance from the eastern Greenland coast that water parcels flow northward across OSNAP East.
Figure 7a presents the proportion of the mean strength of Lagrangian overturning and amplitude of the seasonal cycle (difference between November-May LMOC monthly composites) accumulated as a function of the time water parcels spend north of OSNAP East (τ). We find that the entire LMOC seasonal cycle and 25 % of the mean strength of Lagrangian overturning can be explained by water parcels that spend less than 8.5 months recirculating within the eSPG. Interestingly, the absence of any further accumulation of seasonal Lagrangian overturning variability after 8.5 months following northward inflow across OSNAP East implies that, irrespective of its time of arrival, once a water parcel has experienced wintertime surface buoyancy loss it can no longer imprint onto the seasonal cycle of Lagrangian overturning. Thus, the remaining 75 % of the mean volume flux into the LMOC lower limb is accounted for by water parcels that spend between 8.5 months and 5 years recirculating within the eSPG and experience at least one winter north of OSNAP East.
To understand how the recirculation time of a water parcel is related to its inflow position along OSNAP East, we next calculate the average recirculation time of water parcels within the eSPG as a function of their northward crossing locations along the section. Figure 7b indicates that, on average, the recirculation times of the major upper-ocean currents intercepted by OSNAP East are shortest in the upper ocean and increase strongly with depth. This is consistent with observations in the eastern SPNA, which show that northward transport is surface intensified in the NAC branches (Holliday et al., 2018; Houpert et al., 2018, 2020) and the Irminger Current (de Jong et al., 2020; Fried and de Jong, 2022) since isopycnals in the upper ocean shoal strongly westward. We attribute the short recirculation times (τ≤8.5 months) found in the lower limb in Fig. 7b to short-lived mesoscale eddies which are partially resolved in the simulated velocity field. A prominent feature of Fig. 7b is the transition from upper-limb pathways that contribute to the seasonal cycle of the LMOC (orange, τ≤8.5 months) in the Irminger and central Iceland Basins to longer pathways (blue, τ>8.5 months) sourced from the central and southern NAC branches that dominate its mean strength. Figure 7c quantifies this distinction, highlighting that 74 % of the mean strength of the LMOC is due to water parcels originating from the Sub-Arctic Front, Rockall Trough and Rockall Plateau, whereas 96 % of the mean seasonal cycle of Lagrangian overturning can be explained by water parcels sourced from the Irminger and central Iceland Basins (x≤1250 km). We note that the recirculation times of water parcels flowing northward in the upper 250 m of the central Iceland and Irminger basins also vary seasonally (see Fig. 5a); however, this does not influence their contribution to the mean seasonal cycle of Lagrangian overturning.
To summarise, we have found a clear distinction between the origins and advective timescales of water parcels responsible for the mean strength and seasonality of Lagrangian overturning at OSNAP East. Seasonal overturning variability is associated with water crossing the section in the upper Irminger and central Iceland basins, where the rapid recirculation of water parcels in less than 8.5 months yields along-stream transformations that are dependent on their time of arrival at OSNAP East. Conversely, the mean strength of the LMOC is determined by water parcels, originating from the central and southern NAC branches, whose longer recirculation time (τ>8.5 months) guarantees their diapycnal transformation into the LMOC lower limb through intense wintertime buoyancy loss.
4.3 Pathways of seasonal Lagrangian overturning
To further investigate the sources of seasonal Lagrangian overturning variability within the eSPG, we classify water parcels according to five cyclonic circulation pathways defined between OSNAP East and the Greenland–Scotland Ridge. The majority of water parcels recirculate exclusively within the Iceland–Rockall (IcRo–IcRo) and Irminger basins (IG and IC; see Fig. 8b for regional definitions). The remaining water parcels cross the section in the NAC and flow westward across the Reykjanes Ridge before returning to OSNAP East via the East Greenland Current, which flows southward along the western boundary of the Irminger Sea. These water parcels are subdivided into two pathways according to their inflow location along the section: the Ic–Irm pathway comprises water parcels sourced from the central NAC branch positioned along the Sub-Arctic Front, while the Ro–Irm pathway originates from the southern NAC branch feeding both the Rockall Trough and the Rockall Plateau (Fig. 8b).
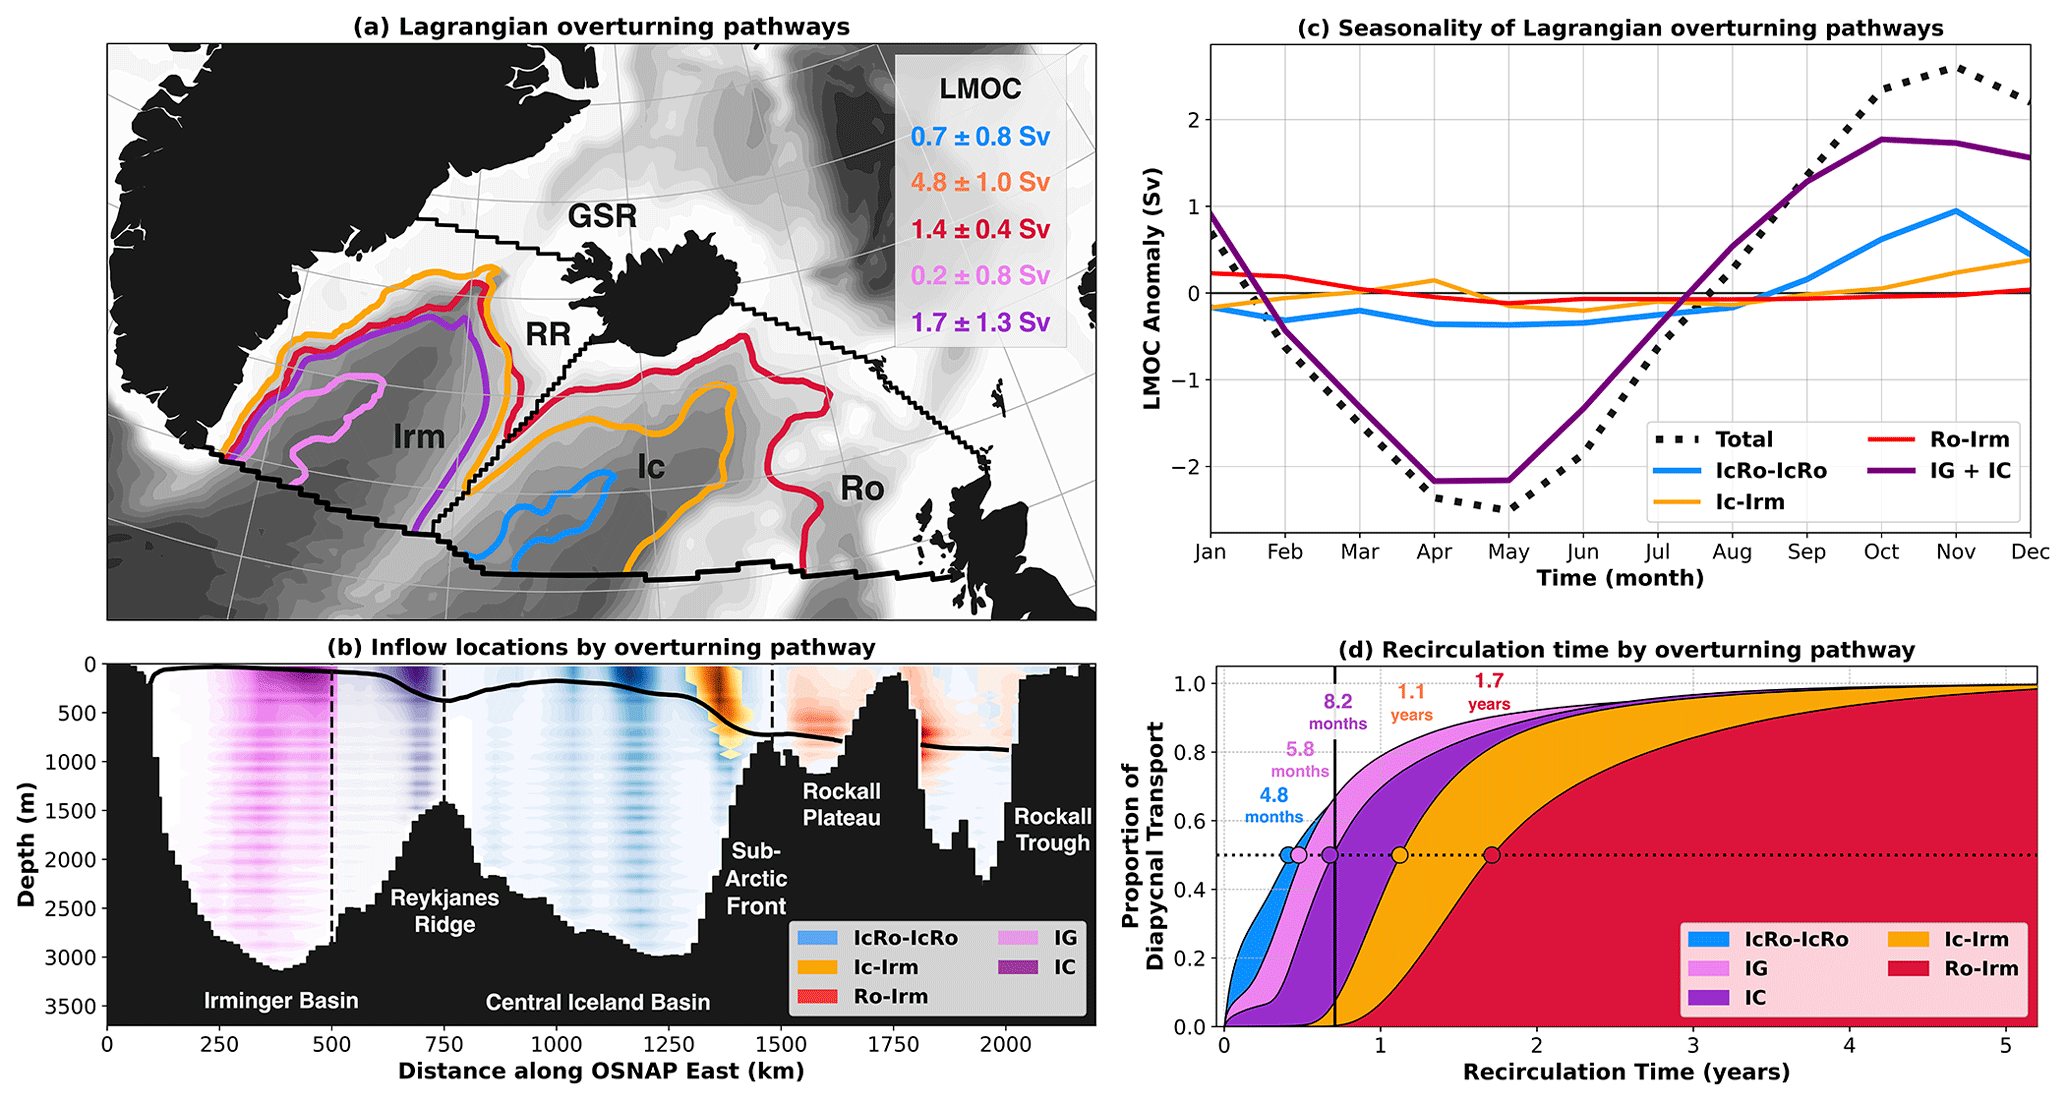
Figure 8Decomposition of the seasonal cycle of Lagrangian overturning by the circulation pathway north of the model-defined OSNAP East section. (a) Example water parcel trajectories illustrating each of the five circulation pathways within the eSPG and their respective contributions to the mean strength of Lagrangian overturning at σLMOC. (b) Inflow locations where water parcels are advected northward across OSNAP East classified by pathway. Water parcel volume transports for each pathway are averaged in discrete x–z space (Δz=25 m, Δx=25 km) using all 396 initialisation months before normalising by the maximum mean transport recorded across all bins (darker shading corresponds to the strongest northward transport for each pathway). (c) Seasonal cycle of the Lagrangian overturning at σLMOC decomposed by circulation pathway north of OSNAP East. For clarity, variations in the LMOC are presented as anomalies about the time-mean overturning determined from monthly composites of each pathway. (d) The proportion of the total diapycnal transport ( kg m−3, where Δσ is the net change in potential density between northward and southward crossing of OSNAP East) to have successfully recirculated back to OSNAP East as a function of the time elapsed following northward flow across the section. Coloured circles correspond to the median recirculation time of each circulation pathway.
Concordant with our earlier analysis, Fig. 8 shows the clear distinction between the circulation pathways responsible for the seasonality of the LMOC and those governing its mean state. We find that the two pathways crossing the Reykjanes Ridge north of OSNAP East account for 70 % of the mean strength of the Lagrangian overturning within the eSPG (Fig. 8a) yet exhibit negligible variability on seasonal timescales (Fig. 8c). This is because the recirculation times of water parcels advected across the ridge north of OSNAP East consistently exceed the critical 8.5 month threshold required to be irreversibly transferred into the lower limb of the LMOC. Water parcels advected along the Ic–Irm pathway typically experience 1.1 years (Fig. 8d) of along-stream surface buoyancy loss in order to transfer 4.8±1.0 Sv of water into the lower limb. As shown in Tooth et al. (2023), the slower Ro–Irm pathway ( years) forms 1.4±0.4 Sv of dense Icelandic Slope Water (Van Aken and De Boer, 1995; Read, 2000) by entraining Iceland–Scotland Overflow Water (ISOW) in the vicinity of the Faroe-Bank Channel (Fig. 8a).
Figure 8c shows that the seasonal cycle of Lagrangian overturning at OSNAP East is dominated by water parcels recirculating exclusively within the Irminger basin (IG + IC). We find that the northward inflows to the IG (x≤500 km) make a disproportionately large contribution to the seasonality of the LMOC (26 %) compared with their limited contribution to its mean strength (3 %). Water parcels advected along the path of the IC (500 km < x≤750 km) explain almost half (49 %) of the seasonal cycle of Lagrangian overturning whilst also accounting for approximately a fifth (19 %) of the mean volume flux into the lower limb. The larger contribution of the IC pathway to the mean Lagrangian overturning is explained by Fig. 8d, which shows that water parcels typically spend 8.2 months recirculating within the IC compared with only 5.8 months within the IG. Since the median recirculation time of the IC pathway is comparable to the 8.5-month threshold required to avoid intense wintertime surface buoyancy loss, it follows that approximately half of all water parcels advected along the boundary current of the Irminger Sea will be transferred into the lower limb north of OSNAP East.
Although diapycnal transformation along the IcRo–IcRo pathway accounts for only a quarter of the seasonal cycle of Lagrangian overturning at OSNAP East, Fig. 8c highlights its critical role in establishing the timing of the seasonal maximum of the LMOC. Notably, it is the rapid recirculation of water parcels from the northern NAC branch to the ERRC within 4.8 months that dominates seasonal overturning variability along this pathway. Figure 8c shows that the largest volume flux into the lower limb of the LMOC occurs for water flowing north in November because then IcRo–IcRo water parcels experience the greatest surface buoyancy loss throughout the ensuing winter spent north of OSNAP East. This is consistent with the results of de Boisséson et al. (2010), who found the strongest net heat loss over the Iceland Basin between November and February.
4.4 Transformation along seasonal overturning pathways
To understand how seasonal Lagrangian overturning variability results from diapycnal transformation along water parcel trajectories, we next calculate the net potential density change of water parcels between northward and southward crossings of OSNAP East, Δσ, as a function of their inflow location along the section. Figure 9a–b highlights the striking disparity between the net diapycnal transformation of water parcels flowing northward in the upper 250 m of the Irminger and central Iceland basins during May (lightening) and November (densification). We find that large negative diapycnal transformations occur along water parcel trajectories sourced from the upper 100 m of the IG and the central Iceland Basin (IcRo–IcRo) in May, consistent with the pronounced region of negative Lagrangian overturning in Fig. 6c. In contrast, water parcels flowing northward into the upper Irminger and central Iceland basins in November undergo strong positive diapycnal transformation north of OSNAP East, and hence they are responsible for the largest seasonal volume flux into the LMOC lower limb.
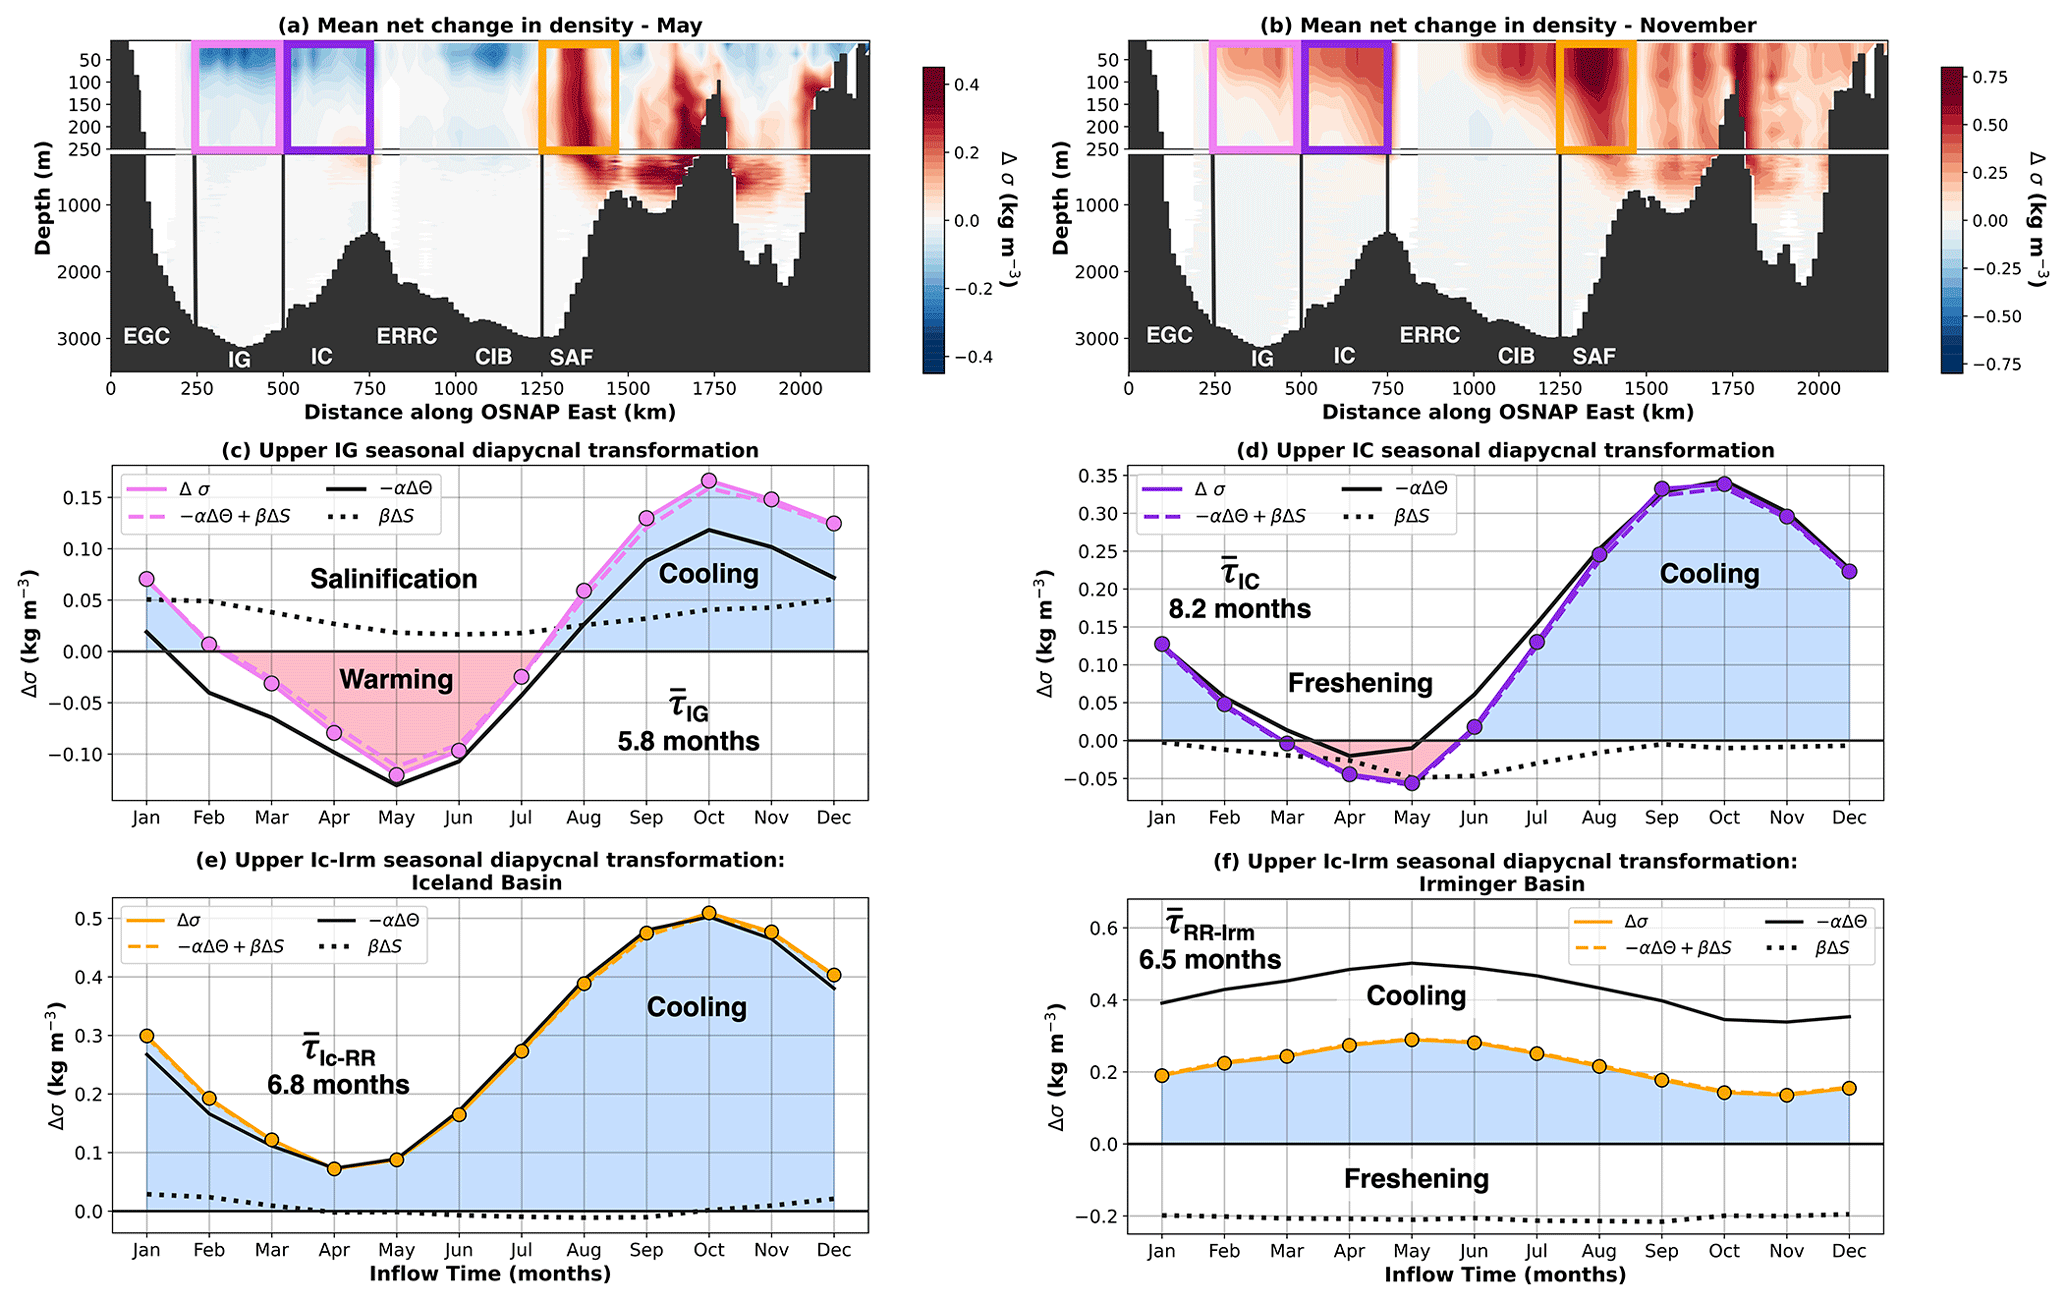
Figure 9(a) Mean net change in potential density of water parcels flowing northward across OSNAP East in May as a function of their inflow location along OSNAP East. The net change in potential density, Δσ (kg m−3), between northward and southward crossings of OSNAP East is computed for each recirculating water parcel before averaging in discrete x–z space (Δz=25 m, x=25 km). Panel (b) is the same as (a) for water parcels flowing northward in November. Vertical solid lines correspond to the geographical limits of the major currents intercepted along the section. Boxes included in the upper 250 m define the upper IG (pink), IC (purple) and Ic–Irm (orange) pathways. (c, d) Mean seasonal cycle of transport-weighted mean net change in potential density and contributions from diathermal (Δθ, solid black line) and diahaline (ΔS, dotted black line) components for the upper (c) IG and (d) IC pathways. Panels (e) and (f) are the same as (c) and (d) for the Ic–Irm pathway once divided into two successive diapycnal transformations in the Iceland (e, Ic–RR) and Irminger basins (f, RR–Irm) using water parcel properties on crossing the Reykjanes Ridge (RR) north of OSNAP East.
Since water parcels recirculating cyclonically along the boundary current of the Irminger Sea typically spend an additional 2.4 months north of OSNAP East compared with those circulating in the interior of the Irminger and central Iceland basins (Fig. 8), we next explore how the character of seasonal water mass transformation differs along boundary and interior pathways within the eSPG. We focus our analysis on the water parcels circulating in the upper 250 m of the Irminger Sea (pink and purple boxes in Fig. 9a–b), since these collectively account for three-quarters of the seasonal cycle of Lagrangian overturning at OSNAP East (Fig. 7c). To determine the relative importance of temperature and salinity changes along boundary and interior pathways, we further decompose the net diapycnal transformation (Δσ) north of OSNAP East into diathermal and diahaline components. We approximate Δσ using a linearised form of the equation of state following the integral approach of Tamsitt et al. (2018):
where θ denotes potential temperature, S denotes salinity, α represents the thermal expansion coefficient, and β represents the haline contraction coefficient. The values of and correspond to the average potential temperature and salinity of a water parcel on its northward and southward crossings of OSNAP East. To validate our approximation, Fig. 9c–d show strong agreement between the seasonal cycles of net diapycnal transformation (solid purple line) along the upper IG and IC pathways and its reconstruction, given by the sum of diathermal (−αΔθ) and diahaline (βΔS) components (dashed purple line).
Consistent with the strong seasonality of surface heat fluxes over the Irminger Basin (de Jong and de Steur, 2016; Piron et al., 2016), we find that the seasonal cycle of diapycnal transformation along both boundary and interior pathways is dominated by diathermal transformation along water parcel trajectories initialised in the upper 250 m. Yet, despite the similar seasonality in their mean potential density on northward inflow, upper IG water parcels exhibit a much broader potential density range (27.52–27.68 kg m−3; Fig. A1b in Appendix A) on southward outflow compared with those recirculating along the upper IC pathway (27.48–27.59 kg m−3; Fig. A1c). This is because the longer recirculation time of the upper IC pathway ( months) allows water parcels to experience a greater surface-forced diathermal transformation along the boundary current (Fig. 9d), thereby damping the seasonality of their water mass properties on inflow. The additional time upper IC water parcels spend north of OSNAP East is also reflected by the shorter 2-month window (April–May in Fig. 9d) during which water parcels flowing north subsequently experience negative diapycnal transformation compared with the 5-month window (March–July in Fig. 9c) for the rapidly recirculating upper IG pathway ( months).
Figure 9c–d highlight the opposing roles of along-stream diahaline transformation along boundary and interior pathways in the upper Irminger Sea. We find that upper IG water parcels rapidly recirculating in the interior of the Irminger Basin experience year-round salinification north of OSNAP East (Fig. 9c). Salinification is strongest when water parcels flow north across the section during winter, suggesting that lateral mixing between the warmer and saltier boundary current and cold, fresh interior waters, sourced from Labrador Sea deep convection (Lavender et al., 2000; Chafik et al., 2022), is enhanced during the ensuing months. This proposition is supported by the recent observations of de Jong et al. (2020), who found that eddy kinetic energy is largest near the surface of the Irminger Current between January and April.
Diahaline transformation along the upper IC pathway is characterised by the freshening of water parcels flowing northward across OSNAP East between February and August. Interestingly, Fig. 9d shows that it is this substantial freshening, rather than summertime heating, which is responsible for the negative diapycnal transformation along water parcel trajectories flowing north in late spring–early summer. The largest freshening along the boundary current is associated with water parcels that flow northward in the IC during May–June and return southward across OSNAP East via the EGC in November–December. This is consistent with observations, which show that the largest freshwater transport of the East Greenland Coastal Current (EGCC) occurs during autumn (Daniault et al., 2011a; Le Bras et al., 2018) following the summertime accumulation of meltwater on the shelf. Moreover, observations indicate that the strongest mixing between cold, fresh EGCC water and comparatively warmer and saltier EGC water occurs in winter (Le Bras et al., 2018), concurrent with the return of the freshest upper IC water parcels across OSNAP East.
We next compare and contrast the boundary and interior modes of seasonal water mass transformation with that of the dominant time-mean Lagrangian overturning pathway sourced from the central branch of the NAC. Figure 9a–b show that water parcels sourced from the upper 250 m of the Ic–Irm pathway (orange box) experience net densification irrespective of the time of year that they flow northward across OSNAP East. Given that the Ic–Irm pathway flows from the Sub-Arctic Front to the EGC via the Reykjanes Ridge, we choose to decompose the net diapycnal transformation north of OSNAP East into two successive transformations taking place in the Iceland and Irminger basins (Fig. 9e–f). We find that upper Ic–Irm water parcels experience sufficient net diapycnal transformation north of OSNAP East to be transferred into the lower limb of the LMOC, irrespective of their water mass properties on inflow (see Fig. A1d). For the lightest water parcels flowing northward in autumn, diapycnal transformation is dominated by intense wintertime heat loss (equivalent to ∼ 0.5 kg m−3) during their initial 6.8 months spent within the Iceland Basin (Fig. 9e). In contrast, the densest water parcels arriving at OSNAP East in spring experience wintertime diathermal transformation (equivalent to ∼ 0.5 kg m−3) during their final 6.5 months spent in the Irminger Basin (Fig. 9f). Thus, we find that wintertime surface buoyancy loss acts as an important damping mechanism of seasonal thermohaline anomalies advected northward into the eSPG. Meanwhile, the transit times of upper Ic–Irm water parcels through the Iceland and Irminger basins account for the 7-month phase shift in the seasonal cycles of diapycnal transformation shown in Fig. 9e–f.
The remarkably consistent density of the upper Ic–Irm pathway on returning southward across OSNAP East in the EGC (27.55±0.01 kg m−3; Fig. A1d) additionally underscores the importance of interior mixing along water parcel trajectories. This is because mixing is associated with the convergence of water masses in T–S space, whereas transformation by surface buoyancy fluxes leads to diverging water mass properties (Groeskamp et al., 2014; Mackay et al., 2020). The strong density compensation between year-round cooling and freshening along the upper Ic–Irm pathway in the Irminger Sea (Fig. 9f) is indicative of a constant background mixing with colder and fresher waters sourced from north of the Greenland–Scotland Ridge. A closer examination shows that this mixing along water parcel trajectories is concentrated between Denmark Strait and the Kangerdlugssuaq Trough in the northern Irminger Basin. On the one hand, this localised freshening of the boundary current is consistent with observations, which have found substantial freshwater transports directed offshore from the East Greenland Shelf (Sutherland and Pickart, 2008; Sutherland et al., 2009; Foukal et al., 2020). However, such cooling and freshening are also consistent with the excessive turbulent mixing between the dense overflows and overlying ambient Atlantic waters documented previously in the ORCA025-GJM189 hindcast (MacGilchrist et al., 2020; Tooth et al., 2023). It therefore remains an outstanding question to what extent the stable composition of the lower limb found in this simulation (see Fig. 6b where kg m−3) represents an artefact of well-established model biases or instead underscores the importance of mixing between Atlantic, Arctic and overflow water masses along the northwestern boundary of the Irminger Sea, as highlighted in Evans et al. (2022).
In this study, we investigate the nature of seasonal overturning variability within the eastern North Atlantic subpolar gyre using Lagrangian water parcel trajectories evaluated within an eddy-permitting ocean sea ice hindcast simulation. To complement the traditional Eulerian overturning streamfunction, we employ the recently introduced Lagrangian overturning function (LOF) in density space (Tooth et al., 2023) to diagnose the net diapycnal transformation along water parcel trajectories evaluated from the northward inflows across a model-defined OSNAP East section. Our analysis demonstrates that the advective timescales over which water masses circulate within the eSPG plays a crucial role in shaping the simulated Eulerian and Lagrangian seasonal overturning variability at OSNAP East.
From an Eulerian perspective, we show that the net transport in the upper limb of the MOC exhibits a pronounced seasonal cycle of 4.1 Sv at OSNAP East, consistent with estimates made using both observations and ocean reanalyses (Mercier et al., 2015; Wang et al., 2021). Moreover, seasonality in the strength of Eulerian overturning is closely related to the density structure along the Irminger Sea western boundary. The weakest Eulerian overturning occurs in October when the outflowing EGC is lightest, yielding a large southward transport (−4.9 Sv) in the upper limb of the MOC. We find the largest Eulerian overturning in April when the density structure of the EGC, closely reflecting that of the basin interior, results in the weakest southward transport (−2.1 Sv) within the density classes of the upper limb and the strongest southward transport in the lower limb. This agrees closely with the results of Holte and Straneo (2017), who used Argo profiling floats to show that the MOC seasonal cycle in the Labrador Sea peaks in spring in conjunction with the outflow of newly formed Labrador Sea Water (LSW) in the Labrador Current.
In contrast with previous studies that attribute the seasonality of Eulerian overturning to the seasonal export of western boundary density anomalies alone (Brandt et al., 2007; Holte and Straneo, 2017; Wang et al., 2021), we also highlight the important role of seasonal wind stress forcing over the Irminger basin. In addition to the deepening of σMOC along the western boundary of the Irminger Sea, the enhanced upper-limb EGC transport responsible for the MOC minimum in October is owed to a convergence of water parcels which flowed northward across OSNAP East in the upper 250 m of the Irminger basin during spring. This convergence is the result of decreasing water parcel recirculation times in the upper Irminger Sea, which is consistent with a spin-up of the eSPG in response to increasing wind stress curl acting over the basin during the ensuing autumn–winter (Daniault et al., 2011a; Le Bras et al., 2018; Pacini et al., 2020). We therefore propose that the seasonal cycle of Eulerian overturning at OSNAP East arises from a complex combination of seasonal dense water formation along the western boundary of the Irminger Sea and the wind-driven modulation of water parcel recirculation times, which determines how efficiently density anomalies can be exported downstream. As such, the proximity of the OSNAP East array to regions of dense water formation exercises an important influence on the seasonality of Eulerian overturning measured at the section. For example, the amplitude of seasonal MOC variability would likely be reduced if the OSNAP East array were deployed further south since a smaller fraction of lower limb waters would be exported across the section within a year of their formation (Le Bras et al., 2020).
From a Lagrangian perspective, we show that the formation of upper NADW along the cyclonic pathways of the eSPG is strongly dependent upon the time of year water parcels flow northward across OSNAP East. The lightest water parcels, arriving at the section in autumn, experience the greatest positive diapycnal transformation due to intense wintertime heat loss along-stream and constitute the strongest seasonal volume flux into the lower limb. Meanwhile, the weakest volume flux into the lower limb is associated with the densest water parcels arriving at OSNAP East in spring and results from summertime heating along the stream. Given the asymmetry between stronger wintertime surface buoyancy loss and weaker summertime buoyancy gain over the Iceland and Irminger basins (de Boisséson et al., 2010; Brambilla et al., 2008; Xu et al., 2018b), it is interesting to frame seasonal Lagrangian overturning variability somewhat analogously to “Stommel's Demon” (Stommel, 1979; Williams et al., 1995). That is to say, water parcels advected northward across OSNAP East in the upper limb of the LMOC are participating in a recirculation race against time to avoid wintertime diapycnal transformation into the lower limb. The majority of upper-limb water parcels, sourced from the central and southern NAC branches, are unsuccessful and hence determine the mean strength of Lagrangian overturning within the eSPG. In contrast, the seasonal cycle of Lagrangian overturning originates from rapidly recirculating (≤8.5 months) water parcels in the upper Irminger and central Iceland basins, whose along-stream diapycnal transformation is dependent on their time of arrival at OSNAP East.
The recent study of MacGilchrist et al. (2021) extended the concept of a seasonal “Demon” by demonstrating that the subduction of water parcels into the interior of the SPNA is additionally modulated by interannual variations in atmospheric forcing, such as the North Atlantic Oscillation (NAO; Hurrell, 1995). Although it is beyond the scope of this study, it would be interesting to establish whether Lagrangian overturning exhibits a similar sensitivity to interannual variations in surface buoyancy forcing over the Iceland and Irminger basins. It may alternatively be the case that enhanced surface heat loss, such as that associated with strong positive phases of the NAO (Visbeck et al., 2003; Bersch et al., 2007), would be of secondary importance to changes in water parcel recirculation times owing to the concordant intensification and contraction of the subpolar gyre circulation (Curry and McCartney, 2001; Flatau et al., 2003; Pollard et al., 2004). Thus, we might anticipate an increase in the amplitude of seasonal Lagrangian overturning variability following positive phases of the NAO since the westward retreat of the Subarctic Front (Pollard et al., 2004; Bersch et al., 1999) favours greater inflow to the Irminger and central Iceland basins, which dominate the seasonality of Lagrangian overturning at OSNAP East.
Through a detailed investigation of the overturning pathways recirculating north of OSNAP East, we identify two dominant modes of seasonal Lagrangian overturning variability operating in the upper 250 m of the eSPG. Approximately half of the seasonal cycle of Lagrangian overturning at OSNAP East is sourced from water parcels rapidly recirculating in the interior of the central Iceland and Irminger basins ( months), while the remainder originates from the longer boundary current encircling the Irminger Sea ( months). Although seasonal diapycnal transformation along both boundary and interior pathways is dominated by the surface-forced diathermal component, diahaline transformations highlight the important and contrasting roles of lateral mixing between water masses along-stream. In the upper Irminger Gyre, the year-round salinification of water parcels owing to boundary–interior exchange acts to reinforce their wintertime densification. Meanwhile, water parcels advected northward across OSNAP East in the Irminger Current during spring experience substantial freshening downstream, consistent with the greater mixing observed between boundary current and Arctic-origin waters along the shelf break during winter (Le Bras et al., 2018). Our proposition that the contrasting diahaline changes along the boundary current (freshening) and within the basin interior (salinification) result from mixing is supported by Xu et al. (2018a), who found that, on average, the mixing-induced diapycnal transformation is negative (lightening) on the inshore side of the boundary current and positive (densification) between the boundary current and the interior. While we have only sought to infer the contributions of air–sea interaction and mixing to the net densification along water parcel trajectories in this study, it would prove valuable for a future study to formally diagnose their respective contributions to the diathermal and diahaline transformations governing the densification of water masses within the eSPG.
The Lagrangian analysis presented in this study also demonstrates how the longest circulation pathways within the eSPG maintain the consistent water mass properties of the LMOC lower limb flowing southward across OSNAP East. By decomposing the seasonal cycle of diapycnal transformation along the dominant Ic–Irm overturning pathway, we show that, provided water parcels spend at least one winter north of OSNAP East, they will experience sufficient surface-forced diathermal transformation to form upper NADW, irrespective of their properties on inflow. We therefore suggest that wintertime surface buoyancy loss over the Iceland and Irminger basins constitutes an important damping mechanism for seasonal thermohaline variability imported northward across OSNAP East. Meanwhile, the stable year-round composition of lower limb waters flowing southward in the EGC results from a constant background mixing with both overflow and Arctic-origin waters along the northwestern boundary of the Irminger Sea. Interestingly, our findings may also be relevant to the recent observational study of Fu et al. (2020), which shows that the strength of the subpolar MOC has remained remarkably stable during the last 3 decades, in spite of the profound hydrographic changes recorded in the upper 1000 m of the eSPG (e.g. Holliday et al., 2008; Lozier et al., 2008; Thierry et al., 2008; Holliday et al., 2020; Desbruyères et al., 2021). This is because we have shown that, given a sufficiently long recirculation time within the eSPG, the combination of surface buoyancy loss and interior mixing north of OSNAP East can act as a sink of upper-ocean thermohaline variability and thereby maintain a consistent volume flux in the lower limb.
It is important to recognise that the conclusions of this study are drawn from a single ocean sea ice hindcast simulation and thus several limitations should be acknowledged. Firstly, the water parcel recirculation timescales identified within the eSPG will be sensitive to our choice of model horizontal resolution, since this governs the representation of submesoscale and mesoscale dynamics. In particular, the study of Blanke et al. (2012) shows that the inclusion of finer-scale structures in the velocity fields simulated by eddy-rich models reduces water parcel transit times despite also increasing the complexity of trajectories (Gary et al., 2011). This is further compounded by the stronger subpolar gyre circulation simulated in eddy-rich models compared with those configured at eddy-permitting resolution (Jackson et al., 2020; Hirschi et al., 2020), which favours shorter recirculation times and hence a larger seasonal Lagrangian overturning signal at OSNAP East.
Secondly, the mixing-induced diapycnal transformations along water parcel trajectories will be dependent upon both model resolution and the chosen parameterisations of lateral eddy mixing and turbulent entrainment in the bottom boundary layer. Although not included in this ORCA025 configuration, previous studies have shown that implementing a modified form of the mesoscale eddy mixing scheme of Gent and McWilliams (1990) at eddy-permitting resolution can significantly improve model hydrography in the SPNA by reducing spurious diapycnal mixing between boundary and interior water masses (Deacu and Myers, 2005a, b). Given their ability to explicitly resolve the effects of mesoscale eddies, we would also expect eddy-rich models (e.g. Böning et al., 2016; Marzocchi et al., 2015; Biastoch et al., 2021; Hirschi et al., 2020) to simulate more realistic mixing along water parcel trajectories. However, this is partly undermined by the well-documented warming and salinification trends in the Labrador and Irminger Seas at eddy-rich resolution (Treguier et al., 2005; Xu et al., 2013; Marzocchi et al., 2015; Pennelly and Myers, 2020), which yield significantly larger than observed diapycnal transformation and hence overturning within the SPNA (Hirschi et al., 2020). Establishing whether the mechanisms governing overturning seasonality are consistent across numerical models should therefore be considered an ongoing priority, especially given that the accurate assessment of long-term trends in the strength of the subpolar MOC is predicated on adequately resolving the variability simulated on seasonal–interannual timescales.
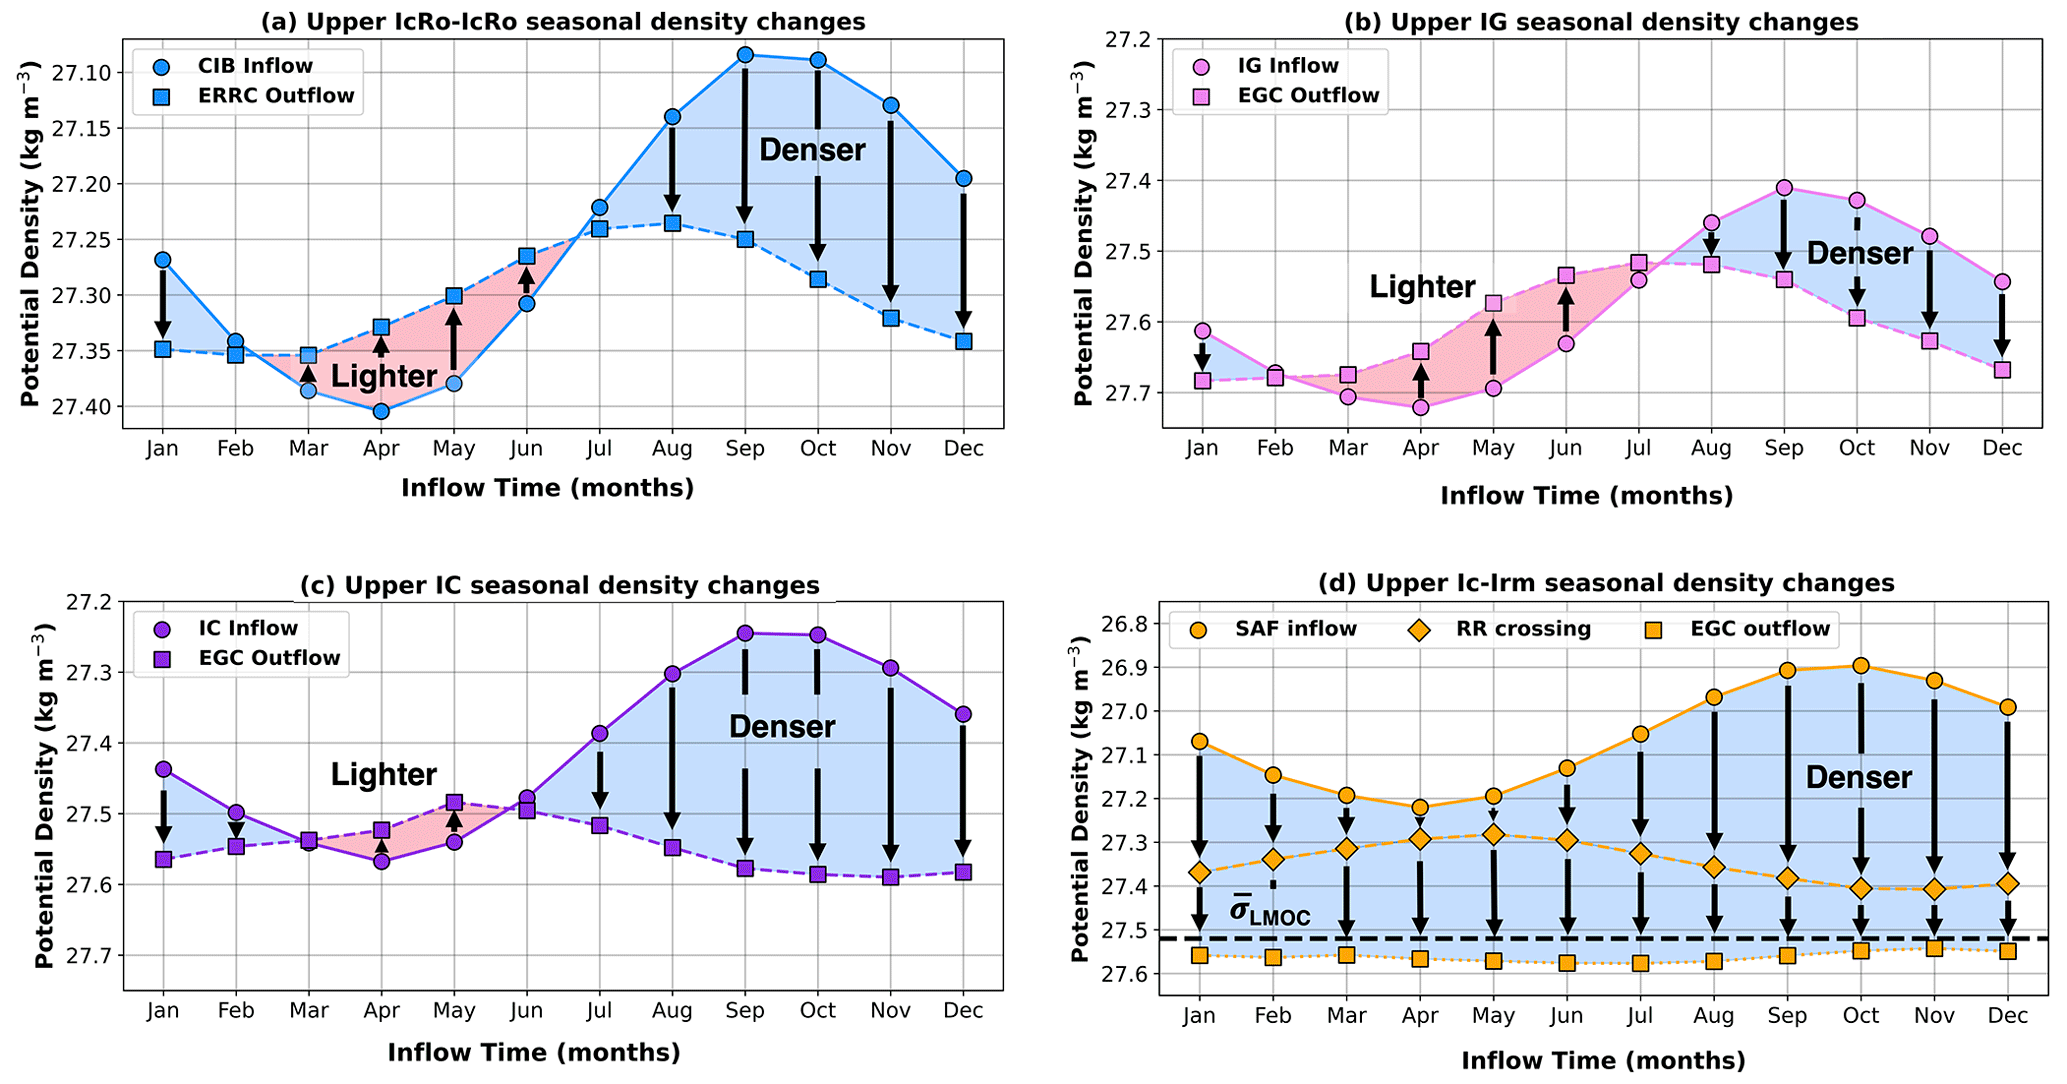
Figure A1Mean seasonal cycles of the transport-weighted mean potential density on northward inflow and southward outflow crossings of the OSNAP East section for the upper 250 m of the (a) IcRo–IcRo, (b) IG and (c) IC pathways. Panel (d) is the same as (a)–(c) but for Sub-Arctic Front inflow (circular markers), Reykjanes Ridge crossing (rhombus markers) and East Greenland Current outflow (square markers) for the upper 250 m of the Ic–Irm pathway. Note that transport-weighted mean potential densities on southward outflow (a–d) and crossing the Reykjanes Ridge (d) are plotted at the month when water parcels originally flowed northward across the OSNAP East section.
The Lagrangian trajectories used in the analysis can be obtained from https://doi.org/10.5281/zenodo.6573900 (Tooth, 2022). The Lagrangian trajectory code TRACMASS, developed by Aldama-Campino et al. (2020), is available from https://doi.org/10.5281/zenodo.4337926. Full details of the NEMO ocean model configuration, including access to forcing files, are available on GitHub (https://github.com/meom-configurations/ORCA025.L75-GJM189.git, last access: 26 March 2023) and have been released with an associated DOI (https://doi.org/10.5281/zenodo.4626012, Molines, 2021).
OJT, HLJ and CW defined the overall research problem and methodology. OJT conducted the Lagrangian experiments, performed the analyses and wrote the manuscript. All authors (OJT, HLJ, CW, DGE) discussed and refined the text and contributed to the interpretation of results.
The contact author has declared that none of the authors has any competing interests.
Publisher's note: Copernicus Publications remains neutral with regard to jurisdictional claims in published maps and institutional affiliations.
The authors would like to thank the European Drakkar project, who carried out the hindcast simulation, and Jean-Marc Molines and Claude Talandier, who kindly provided the data. We additionally thank Laura Jackson, who kindly provided the code to extract the coordinates of OSNAP East array from the ORCA025 model grid.
Oliver John Tooth was supported by the UK Natural Environment Research Council (NE/S007474/1). Helen Louise Johnson was supported by the NERC-NSF grant SNAP-DRAGON (NE/T013494/1). Chris Wilson was jointly supported by the NERC LTS-S CLASS (Climate-Linked Atlantic Sector Science) grant (NE/R015953/1) and the NERC LTS-M CANARI (Climate change in the Arctic-North Atlantic Region and Impacts on the UK) grant (NE/W004984/1). Dafydd Gwyn Evans was supported by the NERC LTS-S CLASS grant (NE/R015953/1).
This paper was edited by Ilker Fer and reviewed by three anonymous referees.
Aldama-Campino, A., Döös, K., Kjellsson, J., and Jönsson, B.: TRACMASS: Formal release of version 7.0 (v7.0-beta), Zenodo [code], https://doi.org/10.5281/zenodo.4337926, 2020. a, b
Asbjørnsen, H., Johnson, H. L., and Arthun, M.: Variable Nordic Seas Inflow Linked to Shifts in North Atlantic Circulation, J. Climate, 34, 7057–7071, https://doi.org/10.1175/JCLI-D-20-0917.1, 2021. a, b
Barnier, B., Madec, G., Penduff, T., Molines, J. M., Treguier, A. M., Le Sommer, J., Beckmann, A., Biastoch, A., Böning, C., Dengg, J., Derval, C., Durand, E., Gulev, S., Remy, E., Talandier, C., Theetten, S., Maltrud, M., McClean, J., and De Cuevas, B.: Impact of partial steps and momentum advection schemes in a global ocean circulation model at eddy-permitting resolution, Ocean Dynam., 56, 543–567, https://doi.org/10.1007/s10236-006-0082-1, 2006. a, b
Bersch, M., Meincke, J., and Sy, A.: Interannual thermohaline changes in the northern North Atlantic 1991–1996, Deep-Sea Res. Pt. II, 46, 55–75, https://doi.org/10.1016/S0967-0645(98)00114-3, 1999. a
Bersch, M., Yashayaev, I., and Koltermann, K. P.: Recent changes of the thermohaline circulation in the subpolar North Atlantic, Ocean Dynam., 57, 223–235, https://doi.org/10.1007/s10236-007-0104-7, 2007. a
Biastoch, A., Schwarzkopf, F. U., Getzlaff, K., Rühs, S., Martin, T., Scheinert, M., Schulzki, T., Handmann, P., Hummels, R., and Böning, C. W.: Regional imprints of changes in the Atlantic Meridional Overturning Circulation in the eddy-rich ocean model VIKING20X, Ocean Sci., 17, 1177–1211, https://doi.org/10.5194/os-17-1177-2021, 2021. a
Blanke, B., Bonhommeau, S., Grima, N., and Drillet, Y.: Sensitivity of advective transfer times across the North Atlantic Ocean to the temporal and spatial resolution of model velocity data: Implication for European eel larval transport, Dynam. Atmos. Oceans, 55–56, 22–44, https://doi.org/10.1016/j.dynatmoce.2012.04.003, 2012. a
Böning, C. W., Behrens, E., Biastoch, A., Getzlaff, K., and Bamber, J. L.: Emerging impact of Greenland meltwater on deepwater formation in the North Atlantic Ocean, Nat. Geosci., 9, 523–527, https://doi.org/10.1038/ngeo2740, 2016. a
Brambilla, E. and Talley, L. D.: Subpolar mode water in the northeastern Atlantic: 1. Averaged properties and mean circulation, J. Geophys. Res.-Oceans, 113, 1–18, https://doi.org/10.1029/2006JC004062, 2008. a, b
Brambilla, E., Talley, L. D., and Robbins, P. E.: Subpolar mode water in the northeastern Atlantic: 2. Origin and transformation, J. Geophys. Res.-Oceans, 113, 1–16, https://doi.org/10.1029/2006JC004063, 2008. a
Brandt, P., Funk, A., Czeschel, L., Eden, C., and Böning, C. W.: Ventilation and transformation of Labrador Sea water and its rapid export in the deep Labrador Current, J. Phys. Oceanogr., 37, 946–961, https://doi.org/10.1175/JPO3044.1, 2007. a
Bringedal, C., Eldevik, T., Øystein Skagseth, Spall, M. A., and Østerhus, S.: Structure and Forcing of Observed Exchanges across the Greenland–Scotland Ridge, J. Climate, 31, 9881–9901, https://doi.org/10.1175/JCLI-D-17-0889.1, 2018. a, b
Bryden, H. L., Johns, W. E., King, B. A., McCarthy, G., McDonagh, E. L., Moat, B. I., and Smeed, D. A.: Reduction in Ocean Heat Transport at 26∘ N since 2008 Cools the Eastern Subpolar Gyre of the North Atlantic Ocean, J/ Climate, 33, 1677–1689, https://doi.org/10.1175/JCLI-D-19-0323.1, 2020. a
Böning, C. W., Scheinert, M., Dengg, J., Biastoch, A., and Funk, A.: Decadal variability of subpolar gyre transport and its reverberation in the North Atlantic overturning, Geophys. Res. Lett., 33, https://doi.org/10.1029/2006GL026906, 2006. a
Chafik, L. and Rossby, T.: Volume, Heat, and Freshwater Divergences in the Subpolar North Atlantic Suggest the Nordic Seas as Key to the State of the Meridional Overturning Circulation, Geophys. Res. Lett., 46, 4799–4808, https://doi.org/10.1029/2019GL082110, 2019. a, b
Chafik, L., Holliday, N. P., Bacon, S., and Rossby, T.: Irminger Sea Is the Center of Action for Subpolar AMOC Variability, Geophys. Res. Lett., 49, e2022GL099133, https://doi.org/10.1029/2022GL099133, 2022. a
Curry, R. G. and McCartney, M. S.: Ocean Gyre Circulation Changes Associated with the North Atlantic Oscillation, J. Phys. Oceanogr., 31, 3374–3400, https://doi.org/10.1175/1520-0485(2001)031<3374:OGCCAW>2.0.CO;2, 2001. a
Daniault, N., Lherminier, P., and Mercier, H.: Circulation and Transport at the Southeast Tip of Greenland, J. Phys. Oceanogr., 41, 437–457, https://doi.org/10.1175/2010JPO4428.1, 2011a. a, b, c, d, e
Daniault, N., Lherminier, P., and Mercier, H.: The 1992–2009 transport variability of the East Greenland-Irminger Current at 60∘ N, Geophys. Res. Lett., 38, L07601, https://doi.org/10.1029/2011GL046863, 2011b. a, b
de Boisséson, E., Thierry, V., Mercier, H., and Caniaux, G.: Mixed layer heat budget in the Iceland Basin from Argo, J. Geophys. Res.-Oceans, 115, 1–15, https://doi.org/10.1029/2010JC006283, 2010. a, b, c
de Boisséson, E., Thierry, V., Mercier, H., Caniaux, G., and Desbruyères, D.: Origin, formation and variability of the Subpolar Mode Water located over the Reykjanes Ridge, J. Geophys. Res.-Oceans, 117, C12005, https://doi.org/10.1029/2011jc007519, 2012. a, b
de Jong, M. F. and de Steur, L.: Strong winter cooling over the Irminger Sea in winter 2014–2015, exceptional deep convection, and the emergence of anomalously low SST, Geophys, Res, Lett,, 42, 7106–7113, https://doi.org/10.1002/2016GL069596, 2016. a, b
de Jong, M. F., Van Aken, H. M., Våge, K., and Pickart, R. S.: Convective mixing in the central Irminger Sea: 2002–2010, Deep-Sea Res. Pt. I, 63, 36–51, https://doi.org/10.1016/j.dsr.2012.01.003, 2012. a
de Jong, M. F., de Steur, L., Fried, N., Bol, R., and Kritsotalakis, S.: Year-Round Measurements of the Irminger Current: Variability of a Two-Core Current System Observed in 2014–2016, J. Geophys. Res.-Oceans, 125, e2020JC016193, https://doi.org/10.1029/2020JC016193, 2020. a, b, c, d
Deacu, D. and Myers, P. G.: Effect of a Variable Eddy Transfer Coefficient in an Eddy-Permitting Model of the Subpolar North Atlantic Ocean, J. Phys. Oceanogr., 35, 289–307, https://doi.org/10.1175/JPO-2674.1, 2005a. a
Deacu, D. and Myers, P. G.: Analysis of an 80-Year Integration of a 1/3-Degree Ocean Model of the Subpolar North Atlantic, J. Oceanogr., 61, 549–555, https://doi.org/10.1007/s10872-005-0062-y, 2005b. a
Dee, D. P., Uppala, S. M., Simmons, A. J., Berrisford, P., Poli, P., Kobayashi, S., Andrae, U., Balmaseda, M. A., Balsamo, G., Bauer, P., Bechtold, P., Beljaars, A. C., van de Berg, L., Bidlot, J., Bormann, N., Delsol, C., Dragani, R., Fuentes, M., Geer, A. J., Haimberger, L., Healy, S. B., Hersbach, H., Hólm, E. V., Isaksen, L., Kållberg, P., Köhler, M., Matricardi, M., Mcnally, A. P., Monge-Sanz, B. M., Morcrette, J. J., Park, B. K., Peubey, C., de Rosnay, P., Tavolato, C., Thépaut, J. N., and Vitart, F.: The ERA-Interim reanalysis: Configuration and performance of the data assimilation system, Q. J. Roy. Meteor. Soc., 137, 553–597, https://doi.org/10.1002/qj.828, 2011. a
Desbruyères, D., Thierry, V., and Mercier, H.: Simulated decadal variability of the meridional overturning circulation across the A25-Ovide section, J. Geophys. Res.-Oceans, 118, 462–475, https://doi.org/10.1029/2012JC008342, 2013. a, b
Desbruyères, D., Mercier, H., and Thierry, V.: On the mechanisms behind decadal heat content changes in the eastern subpolar gyre, Prog. Oceanogr., 132, 262–272, https://doi.org/10.1016/j.pocean.2014.02.005, 2015. a
Desbruyères, D., Chafik, L., and Maze, G.: A shift in the ocean circulation has warmed the subpolar North Atlantic Ocean since 2016, Commun. Earth Environ., 2, 48, https://doi.org/10.1038/s43247-021-00120-y, 2021. a
Desbruyères, D. G., Mercier, H., Maze, G., and Daniault, N.: Surface predictor of overturning circulation and heat content change in the subpolar North Atlantic, Ocean Sci., 15, 809–817, https://doi.org/10.5194/os-15-809-2019, 2019. a
Döös, K., Kjellsson, J., and Jönsson, B.: TRACMASS – A Lagrangian Trajectory Model, in: Preventive Methods for Coastal Protection, edited by: Soomere, T. and Quak, E., Springer, Heidelberg, 225–249, https://doi.org/10.1007/978-3-319-00440-2_7, 2013. a
Döös, K., Jönsson, B., and Kjellsson, J.: Evaluation of oceanic and atmospheric trajectory schemes in the TRACMASS trajectory model v6.0, Geosci. Model Dev., 10, 1733–1749, https://doi.org/10.5194/gmd-10-1733-2017, 2017. a, b
Evans, D. G., Holliday, N. P., Bacon, S., and Le Bras, I.: Mixing and air-sea buoyancy fluxes set the time-mean overturning circulation in the subpolar North Atlantic, EGUsphere [preprint], https://doi.org/10.5194/egusphere-2022-1059, 2022. a
Fay, A. R. and McKinley, G. A.: Observed Regional Fluxes to Constrain Modeled Estimates of the Ocean Carbon Sink, Geophys. Res. Lett., 48, e2021GL095325, https://doi.org/10.1029/2021GL095325, 2021. a
Fichefet, T. and Morales Maqueda, M. A.: Modelling the influence of snow accumulation and snow-ice formation on the seasonal cycle of the Antarctic sea-ice cover, Clim. Dynam., 15, 251–268, https://doi.org/10.1007/s003820050280, 1999. a
Flatau, M. K., Talley, L., and Niiler, P. P.: The North Atlantic Oscillation, surface current velocities, and SST changes in the subpolar North Atlantic, J. Climate, 16, 2355–2369, https://doi.org/10.1175/2787.1, 2003. a
Fofonoff, N. P. and Millard, R. C.: Algorithms for computation of fundamental properties of seawater, UNESCO Technical papers in marine science, 44, 53 pp., http://darchive.mblwhoilibrary.org:8080/handle/1912/2470 (last access: 23 November 2022), 1983. a
Foukal, N. P., Gelderloos, R., and Pickart, R. S.: A continuous pathway for fresh water along the East Greenland shelf, Sci. Adv., 6, eabc4254, https://doi.org/10.1126/sciadv.abc4254, 2020. a
Fried, N. and de Jong, M. F.: The Role of the Irminger Current in the Irminger Sea Northward Transport Variability, J. Geophys. Res.-Oceans, 127, 1–16, https://doi.org/10.1029/2021JC018188, 2022. a
Fu, Y., Feili, L., Karstensen, J., and Wang, C.: A stable Atlantic Meridional Overturning Circulation in a changing North Atlantic Ocean since the 1990s, Sci. Adv., 6, eabc7836, https://doi.org/10.1126/sciadv.abc7836, 2020. a
Gary, S. F., Susan Lozier, M., Böning, C. W., and Biastoch, A.: Deciphering the pathways for the deep limb of the Meridional Overturning Circulation, Deep-Sea Res. Pt. II, 58, 1781–1797, https://doi.org/10.1016/j.dsr2.2010.10.059, 2011. a
Gent, P. R. and McWilliams, J. C.: Isopycnal Mixing in Ocean Circulation Models, J. Phys. Oceanogr., 20, 150–155, https://doi.org/10.1175/1520-0485(1990)020<0150:IMIOCM>2.0.CO;2, 1990. a
Georgiou, S., Ypma, S. L., Brüggemann, N., Sayol, J., van der Boog, C. G., Spence, P., Pietrzak, J. D., and Katsman, C. A.: Direct and Indirect Pathways of Convected Water Masses and Their impacts on the Overturning Dynamics of the Labrador Sea, J. Geophys. Res.-Oceans, 126, 1–19, https://doi.org/10.1029/2020jc016654, 2021. a
Grist, J. P., Josey, S. A., Jacobs, Z. L., Marsh, R., Sinha, B., and Van Sebille, E.: Extreme air–sea interaction over the North Atlantic subpolar gyre during the winter of 2013–2014 and its sub-surface legacy, Clim. Dynam., 46, 4027–4045, https://doi.org/10.1007/s00382-015-2819-3, 2016. a
Groeskamp, S., Zika, J. D., Sloyan, B. M., McDougall, T. J., and McIntosh, P. C.: A Thermohaline Inverse Method for Estimating Diathermohaline Circulation and Mixing, J. Phys. Oceanogr., 44, 2681–2697, https://doi.org/10.1175/JPO-D-14-0039.1, 2014. a
Heuzé, C.: Antarctic Bottom Water and North Atlantic Deep Water in CMIP6 models, Ocean Sci., 17, 59–90, https://doi.org/10.5194/os-17-59-2021, 2021. a
Hirschi, J. J.-M., Barnier, B., Böning, C., Biastoch, A., Blaker, A. T., Coward, A., Danilov, S., Drijfhout, S., Getzlaff, K., Griffies, S. M., Hasumi, H., Hewitt, H., Iovino, D., Kawasaki, T., Kiss, A. E., Koldunov, N., Marzocchi, A., Mecking, J. V., Moat, B., Molines, J.-M., Myers, P. G., Penduff, T., Roberts, M., Treguier, A.-M., Sein, D. V., Sidorenko, D., Small, J., Spence, P., Thompson, L., Weijer, W., and Xu, X.: The Atlantic Meridional Overturning Circulation in High-Resolution Models, J. Geophys. Res.-Oceans, 125, e2019JC015522, https://doi.org/10.1029/2019JC015522, 2020. a, b, c
Holliday, N. P., Hughes, S. L., Bacon, S., Beszczynska-Möller, A., Hansen, B., Lavín, A., Loeng, H., Mork, K. A., Østerhus, S., Sherwin, T., and Walczowski, W.: Reversal of the 1960s to 1990s freshening trend in the northeast North Atlantic and Nordic Seas, Geophys. Res. Lett., 35, 1–5, https://doi.org/10.1029/2007GL032675, 2008. a
Holliday, N. P., Bacon, S., Cunningham, S. A., Gary, S. F., Karstensen, J., King, B. A., Li, F., and Mcdonagh, E. L.: Subpolar North Atlantic Overturning and Gyre-Scale Circulation in the Summers of 2014 and 2016, J. Geophys. Res.-Oceans, 123, 4538–4559, https://doi.org/10.1029/2018JC013841, 2018. a
Holliday, N. P., Bersch, M., Berx, B., Chafik, L., Cunningham, S., Florindo-López, C., Hátún, H., Johns, W., Josey, S. A., Larsen, K. M. H., Mulet, S., Oltmanns, M., Reverdin, G., Rossby, T., Thierry, V., Valdimarsson, H., and Yashayaev, I.: Ocean circulation causes the largest freshening event for 120 years in eastern subpolar North Atlantic, Nat. Commun., 11, 585, https://doi.org/10.1038/s41467-020-14474-y, 2020. a
Holte, J. and Straneo, F.: Seasonal overturning of the Labrador sea as observed by Argo floats, J. Phys. Oceanogr., 47, 2531–2543, https://doi.org/10.1175/JPO-D-17-0051.1, 2017. a, b, c
Houpert, L., Inall, M. E., Dumont, E., Gary, S., Johnson, C., Porter, M., Johns, W. E., and Cunningham, S. A.: Structure and Transport of the North Atlantic Current in the Eastern Subpolar Gyre From Sustained Glider Observations, J. Geophys. Res.-Oceans, 123, 6019–6038, https://doi.org/10.1029/2018JC014162, 2018. a
Houpert, L., Cunningham, S., Fraser, N., Johnson, C., Holliday, N. P., Jones, S., Moat, B., and Rayner, D.: Observed Variability of the North Atlantic Current in the Rockall Trough From 4 Years of Mooring Measurements, J. Geophys. Res.-Oceans, 125, e2020JC016403, https://doi.org/10.1029/2020JC016403, 2020. a
Hurrell, J.: Decadal Trends in the North Atlantic Oscillation: Regional Temperatures and Precipitation, Science, 269, 676–679, https://doi.org/10.1126/science.269.5224.676, 1995. a
Jackson, L. C., Roberts, M. J., Hewitt, H. T., Iovino, D., Koenigk, T., Meccia, V. L., Roberts, C. D., Ruprich-Robert, Y., and Wood, R. A.: Impact of ocean resolution and mean state on the rate of AMOC weakening, Clim. Dynam., 55, 1711–1732, https://doi.org/10.1007/s00382-020-05345-9, 2020. a
Kieke, D., Rhein, M., Stramma, L., Smethie, W. M., Bullister, J. L., and LeBel, D. A.: Changes in the pool of Labrador Sea Water in the subpolar North Atlantic, Geophys. Res. Lett., 34, 1–5, https://doi.org/10.1029/2006GL028959, 2007. a
Lavender, K. L., Davis, R. E., and Owens, W. B.: Mid-depth recirculation observed in the interior Labrador and Irminger seas by direct velocity measurements, Nature, 407, 66–69, https://doi.org/10.1038/35024048, 2000. a
Le Bras, I. A.-A., Straneo, F., Holte, J., and Holliday, N. P.: Seasonality of Freshwater in the East Greenland Current System From 2014 to 2016, J. Geophys. Res.-Oceans, 123, 8828–8848, https://doi.org/10.1029/2018JC014511, 2018. a, b, c, d, e, f, g, h
Le Bras, I. A.-A., Straneo, F., Holte, J., de Jong, M. F., and Holliday, N. P.: Rapid Export of Waters Formed by Convection Near the Irminger Sea's Western Boundary, Geophys. Res. Lett., 47, e2019GL085989, https://doi.org/10.1029/2019GL085989, 2020. a, b, c, d, e, f
Levitus, S., Boyer, T., Conkright, M., O'Brien, T., Antonov, J., Stephens, C., Stathoplos, L., Johnson, D., and Gelfeld, R.: World Ocean Database 1998, Tech. rep., https://repository.library.noaa.gov/view/noaa/49345 (last access: 23 November 2022), 1998. a
Lherminier, P., Mercier, H., Gourcuff, C., Alvarez, M., Bacon, S., and Kermabon, C.: Transports across the 2002 Greenland-Portugal Ovide section and comparison with 1997, J. Geophys. Res.-Oceans, 112, 1–20, https://doi.org/10.1029/2006JC003716, 2007. a
Li, F., Lozier, M. S., and Johns, W. E.: Calculating the meridional volume, heat, and freshwater transports from an observing system in the subpolar North Atlantic: Observing system simulation experiment, J. Atmos. Ocean. Tech., 34, 1483–1500, https://doi.org/10.1175/JTECH-D-16-0247.1, 2017. a, b, c
Li, F., Lozier, M. S., Bacon, S., Bower, A. S., Cunningham, S. A., de Jong, M. F., DeYoung, B., Fraser, N., Fried, N., Han, G., Holliday, N. P., Holte, J., Houpert, L., Inall, M. E., Johns, W. E., Jones, S., Johnson, C., Karstensen, J., Le Bras, I. A., Lherminier, P., Lin, X., Mercier, H., Oltmanns, M., Pacini, A., Petit, T., Pickart, R. S., Rayner, D., Straneo, F., Thierry, V., Visbeck, M., Yashayaev, I., and Zhou, C.: Subpolar North Atlantic western boundary density anomalies and the Meridional Overturning Circulation, Nat. Commun., 12, 1–9, https://doi.org/10.1038/s41467-021-23350-2, 2021a. a, b, c, d, e, f, g, h
Li, F., Lozier, M. S., Holliday, N. P., Johns, W. E., Le Bras, I. A., Moat, B. I., Cunningham, S. A., and de Jong, M. F.: Observation-based estimates of heat and freshwater exchanges from the subtropical North Atlantic to the Arctic, Prog. Oceanogr., 197, 102640, https://doi.org/10.1016/j.pocean.2021.102640, 2021b. a, b
Lozier, M., Leadbetter, S., Williams, R., Roussenov, V., Reed, M., and Moore, N.: The Spatial Pattern and Mechanisms of Heat-Content Change in the North Atlantic, Science, 319, 800–803, https://doi.org/10.1126/science.1146436, 2008. a
Lozier, M. S., Bacon, S., Bower, A. S., Cunningham, S. A., De Jong, M. F., De Steur, L., De Young, B., Fischer, J., Gary, S. F., Greenan, B. J., Heimbmbach, P., Holliday, N. P., Houpert, L., Inall, M. E., Johns, W. E., Johnson, H. L., Karstensen, J., Li, F., Lin, X., Mackay, N., Marshall, D. P., Mercier, H., Myers, P. G., Pickart, R. S., Pillar, H. R., Straneo, F., Thierry, V., Weller, R. A., Williams, R. G., Wilson, C., Yang, J., Zhao, J., and Zika, J. D.: Overturning in the Subpolar north Atlantic program: A new international ocean observing system, B. Am. Meteorol. Soc., 98, 737–752, https://doi.org/10.1175/BAMS-D-16-0057.1, 2017. a
Lozier, M. S., Li, F., Bacon, S., Bahr, F., Bower, A. S., Cunningham, S. A., De Jong, M. F., De Steur, L., DeYoung, B., Fischer, J., Gary, S. F., Greenan, B. J., Holliday, N. P., Houk, A., Houpert, L., Inall, M. E., Johns, W. E., Johnson, H. L., Johnson, C., Karstensen, J., Koman, G., Le Bras, I. A., Lin, X., Mackay, N., Marshall, D. P., Mercier, H., Oltmanns, M., Pickart, R. S., Ramsey, A. L., Rayner, D., Straneo, F., Thierry, V., Torres, D. J., Williams, R. G., Wilson, C., Yang, J., Yashayaev, I., and Zhao, J.: A sea change in our view of overturning in the subpolar North Atlantic, Science, 363, 516–521, https://doi.org/10.1126/science.aau6592, 2019. a, b, c, d, e, f
MacGilchrist, G. A., Johnson, H. L., Marshall, D. P., Lique, C., Thomas, M., Jackson, L. C., and Wood, R. A.: Locations and mechanisms of ocean ventilation in the high-latitude north atlantic in an eddy-permitting ocean model, J. Climate, 33, 10113–10131, https://doi.org/10.1175/JCLI-D-20-0191.1, 2020. a, b, c, d, e, f
MacGilchrist, G. A., Johnson, H. L., Lique, C., and Marshall, D. P.: Demons in the North Atlantic: Variability of Deep Ocean Ventilation, Geophys. Res. Lett., 48, 1–9, https://doi.org/10.1029/2020GL092340, 2021. a, b
Mackay, N., Wilson, C., Holliday, N. P., and Zika, J. D.: The Observation-Based Application of a Regional Thermohaline Inverse Method to Diagnose the Formation and Transformation of Water Masses North of the OSNAP Array from 2013 to 2015, J. Phys. Oceanogr., 50, 1533–1555, https://doi.org/10.1175/JPO-D-19-0188.1, 2020. a
Madec, G., Benshila, R., Bricaud, C., Coward, A., Dobricic, S., Furner, R., and Oddo, P.: NEMO ocean engine, in: Notes du Pôle de modélisation de l'Institut Pierre-Simon Laplace (IPSL) (v3.4, Number 27), Zenodo, https://doi.org/10.5281/zenodo.1464817, 2013. a, b
Marzocchi, A., Hirschi, J. J.-M., Holliday, N. P., Cunningham, S. A., Blaker, A. T., and Coward, A. C.: The North Atlantic subpolar circulation in an eddy-resolving global ocean model, J. Marine Syst., 142, 126–143, https://doi.org/10.1016/j.jmarsys.2014.10.007, 2015. a, b
McKinley, G. A., Fay, A. R., Lovenduski, N. S., and Pilcher, D. J.: Natural Variability and Anthropogenic Trends in the Ocean Carbon Sink, Annu. Rev. Mar. Sci., 9, 125–150, https://doi.org/10.1146/annurev-marine-010816-060529, 2017. a
Menary, M. B., Jackson, L. C., and Lozier, M. S.: Reconciling the Relationship Between the AMOC and Labrador Sea in OSNAP Observations and Climate Models, Geophys. Res. Lett., 47, e2020GL089793, https://doi.org/10.1029/2020GL089793, 2020. a, b
Mercier, H., Lherminier, P., Sarafanov, A., Gaillard, F., Daniault, N., Desbruyères, D., Falina, A., Ferron, B., Gourcuff, C., Huck, T., and Thierry, V.: Variability of the meridional overturning circulation at the Greenland-Portugal OVIDE section from 1993 to 2010, Prog. Oceanogr., 132, 250–261, https://doi.org/10.1016/j.pocean.2013.11.001, 2015. a, b, c, d, e, f, g
Mielke, C., Frajka-Williams, E., and Baehr, J.: Observed and simulated variability of the AMOC at 26∘ N and 41∘ N, Geophys. Res. Lett., 40, 1159–1164, https://doi.org/10.1002/grl.50233, 2013. a
Molines, J.-M.: meom-configurations/ORCA025.L75-GJM189 (V-1.1), Zenodo [code], https://doi.org/10.5281/zenodo.4626012, 2021. a, b, c
Østerhus, S., Woodgate, R., Valdimarsson, H., Turrell, B., de Steur, L., Quadfasel, D., Olsen, S. M., Moritz, M., Lee, C. M., Larsen, K. M. H., Jónsson, S., Johnson, C., Jochumsen, K., Hansen, B., Curry, B., Cunningham, S., and Berx, B.: Arctic Mediterranean exchanges: a consistent volume budget and trends in transports from two decades of observations, Ocean Sci., 15, 379–399, https://doi.org/10.5194/os-15-379-2019, 2019. a
Pacini, A., Pickart, R. S., Bahr, F., Torres, D. J., Ramsey, A. L., Holte, J., Karstensen, J., Oltmanns, M., Straneo, F., Bras, I. A. L., Moore, G. W. K., and de Jong, M. F.: Mean Conditions and Seasonality of the West Greenland Boundary Current System near Cape Farewell, J. Phys. Oceanogr., 50, 2849–2871, https://doi.org/10.1175/JPO-D-20-0086.1, 2020. a, b, c, d, e
Paris, C. B., Helgers, J., van Sebille, E., and Srinivasan, A.: Connectivity Modeling System: A probabilistic modeling tool for the multi-scale tracking of biotic and abiotic variability in the ocean, Environ. Modell. Softw., 42, 47–54, https://doi.org/10.1016/j.envsoft.2012.12.006, 2013. a
Pennelly, C. and Myers, P. G.: Introducing LAB60: A 1/60∘ NEMO 3.6 numerical simulation of the Labrador Sea, Geosci. Model Dev., 13, 4959–4975, https://doi.org/10.5194/gmd-13-4959-2020, 2020. a
Petit, T., Lozier, M. S., Josey, S. A., and Cunningham, S. A.: Atlantic Deep Water Formation Occurs Primarily in the Iceland Basin and Irminger Sea by Local Buoyancy Forcing, Geophys. Res. Lett., 47, e2020GL091028, https://doi.org/10.1029/2020GL091028, 2020. a, b, c, d, e, f, g
Piron, A., Thierry, V., Mercier, H., and Caniaux, G.: Argo float observations of basin-scale deep convection in the Irminger sea during winter 2011–2012, Deep-Sea Res. Pt. I, 109, 76–90, https://doi.org/10.1016/j.dsr.2015.12.012, 2016. a, b
Pollard, R. T., Read, J. F., Holliday, N. P., and Leach, H.: Water masses and circulation pathways through the Iceland Basin during Vivaldi 1996, J. Geophys. Res.-Oceans, 109, C04004, https://doi.org/10.1029/2003JC002067, 2004. a, b
Read, J. F.: CONVEX-91: Water masses and circulation of the Northeast Atlantic subpolar gyre, Prog. Oceanogr., 48, 461–510, https://doi.org/10.1016/S0079-6611(01)00011-8, 2000. a
Sarafanov, A., Mercier, H., Falina, A., Sokov, A., and Lherminier, P.: Cessation and partial reversal of deep water freshening in the northern North Atlantic: Observation-based estimates and attribution, Tellus A, 62, 80–90, https://doi.org/10.1111/j.1600-0870.2009.00418.x, 2010. a
Sarafanov, A., Falina, A., Mercier, H., Sokov, A., Lherminier, P., Gourcuff, C., Gladyshev, S., Gaillard, F., and Daniault, N.: Mean full-depth summer circulation and transports at the northern periphery of the Atlantic Ocean in the 2000s, J. Geophys. Res.-Oceans, 117, 1–22, https://doi.org/10.1029/2011JC007572, 2012. a, b
Steele, M., Morley, R., and Ermold, W.: PHC: a global hydrography with a high quality Arctic Ocean, J. Climate, 14, 2079–2087, https://www.jstor.org/stable/26247422 (last access: 23 November 2022), 2001. a
Stommel, H.: Determination of water mass properties of water pumped down from the Ekman layer to the geostrophic flow below, P. Natl. Acad. Sci. USA, 76, 3051–3055, https://doi.org/10.1073/pnas.76.7.3051, 1979. a
Sutherland, D. A. and Pickart, R. S.: The East Greenland Coastal Current: Structure, variability, and forcing, Prog. Oceanogr., 78, 58–77, https://doi.org/10.1016/j.pocean.2007.09.006, 2008. a
Sutherland, D. A., Pickart, R. S., Peter Jones, E., Azetsu-Scott, K., Jane Eert, A., and Ólafsson, J.: Freshwater composition of the waters off southeast Greenland and their link to the Arctic Ocean, J. Geophys. Res.-Oceans, 114, C05020, https://doi.org/10.1029/2008JC004808, 2009. a
Tamsitt, V., Abernathey, R. P., Mazloff, M. R., Wang, J., and Talley, L. D.: Transformation of Deep Water Masses Along Lagrangian Upwelling Pathways in the Southern Ocean, J. Geophys. Res.-Oceans, 123, 1994–2017, https://doi.org/10.1002/2017JC013409, 2018. a
Thierry, V., de Boisséon, E., and Mercier, H.: Interannual variability of the Subpolar Mode Water properties over the Reykjanes Ridge during 1990–2006, J. Geophys. Res.-Oceans, 113, 1–14, https://doi.org/10.1029/2007JC004443, 2008. a, b
Tooth, O. J.: Lagrangian overturning in the eastern subpolar North Atlantic Ocean – ORCA025-GJM189 Particle Trajectory Dataset, Zenodo [data set], https://doi.org/10.5281/zenodo.6573900, 2022. a
Tooth, O. J., Johnson, H. L., and Wilson, C.: Lagrangian Overturning Pathways in the Eastern Subpolar North Atlantic, J. Climate, 36, 823–844, https://doi.org/10.1175/JCLI-D-21-0985.1, 2023. a, b, c, d, e, f, g, h, i, j, k, l, m, n, o
Treguier, A. M., Theetten, S., Chassignet, E. P., Penduff, T., Smith, R., Talley, L., Beismann, J. O., and Böning, C.: The North Atlantic Subpolar Gyre in Four High-Resolution Models, J. Phys. Oceanogr., 35, 757–774, https://doi.org/10.1175/JPO2720.1, 2005. a
Uppala, S. M., Kållberg, P. W., Simmons, A. J., Andrae, U., da Costa Bechtold, V., Fiorino, M., Gibson, J. K., Haseler, J., Hernandez, A., Kelly, G. A., Li, X., Onogi, K., Saarinen, S., Sokka, N., Allan, R. P., Andersson, E., Arpe, K., Balmaseda, M. A., Beljaars, A. C., van de Berg, L., Bidlot, J., Bormann, N., Caires, S., Chevallier, F., Dethof, A., Dragosavac, M., Fisher, M., Fuentes, M., Hagemann, S., Hólm, E., Hoskins, B. J., Isaksen, L., Janssen, P. A., Jenne, R., McNally, A. P., Mahfouf, J. F., Morcrette, J. J., Rayner, N. A., Saunders, R. W., Simon, P., Sterl, A., Trenberth, K. E., Untch, A., Vasiljevic, D., Viterbo, P., and Woollen, J.: The ERA-40 re-analysis, Q. J. Roy. Meteor. Soc., 131, 2961–3012, https://doi.org/10.1256/qj.04.176, 2005. a
Våge, K., Pickart, R. S., Sarafanov, A., Knutsen, Ø., Mercier, H., Lherminier, P., van Aken, H. M., Meincke, J., Quadfasel, D., and Bacon, S.: The Irminger Gyre: Circulation, convection, and interannual variability, Deep-Sea Res. Pt. I, 58, 590–614, https://doi.org/10.1016/j.dsr.2011.03.001, 2011. a
Van Aken, H. M. and De Boer, C. J.: On the synoptic hydrography of intermediate and deep water masses in the Iceland Basin, Deep-Sea Res. Pt. I, 42, 165–189, https://doi.org/10.1016/0967-0637(94)00042-Q, 1995. a
Visbeck, M., Chassignet, E. P., Curry, R. G., Delworth, T. L., Dickson, R. R., and Krahmann, G.: The Ocean's Response to North Atlantic Oscillation Variability, in: The North Atlantic Oscillation: Climatic Significance and Environmental Impact, edited by: Hurrell, J. W., Kushnir, Y., Ottersen, G., and Visbeck, M., 113–145, American Geophysical Union (AGU), https://doi.org/10.1029/134GM06, 2003. a
Wang, H., Zhao, J., Li, F., and Lin, X.: Seasonal and Interannual Variability of the Meridional Overturning Circulation in the Subpolar North Atlantic Diagnosed From a High Resolution Reanalysis Data Set, J. Geophys. Res.-Oceans, 126, e2020JC017130, https://doi.org/10.1029/2020JC017130, 2021. a, b, c, d, e, f, g, h, i, j, k, l
Williams, R., Marshall, J., and Spall, M. A.: Does Stommel's Mixed Layer “Demon” Work?, J. Phys. Oceanogr., 25, 3089–3102, https://doi.org/10.1175/1520-0485(1995)025<3089:dsmlw>2.0.co;2, 1995. a
Willis, J. K.: Can in situ floats and satellite altimeters detect long-term changes in Atlantic Ocean overturning?, Geophys. Res. Lett., 37, L06602, https://doi.org/10.1029/2010GL042372, 2010. a
Xu, X., Hurlburt, H. E., Schmitz, W. J., Zantopp, R., Fischer, J., and Hogan, P. J.: On the currents and transports connected with the atlantic meridional overturning circulation in the subpolar North Atlantic, J. Geophys. Res.-Oceans, 118, 502–516, https://doi.org/10.1002/jgrc.20065, 2013. a, b
Xu, X., Chassignet, E., Johns, W., Schmitz Jr., W., and Metzger, J.: Intraseasonal to interannual variability of the Atlantic meridional overturning circulation from eddy-resolving simulations and observations, J. Geophys. Res.-Oceans, 119, 5140–5159, https://doi.org/10.1002/2014JC009994, 2014. a, b
Xu, X., Bower, A., Furey, H., and Chassignet, E. P.: Variability of the Iceland-Scotland Overflow Water Transport Through the Charlie-Gibbs Fracture Zone: Results From an Eddying Simulation and Observations, J. Geophys. Res.-Oceans, 123, 5808–5823, https://doi.org/10.1029/2018JC013895, 2018a. a
Xu, X., Rhines, P. B., and Chassignet, E. P.: On mapping the diapycnal water mass transformation of the upper North Atlantic Ocean, J. Phys. Oceanogr., 48, 2233–2258, https://doi.org/10.1175/JPO-D-17-0223.1, 2018b. a, b, c, d
- Abstract
- Introduction
- Model and methods
- Seasonal overturning variability: an Eulerian perspective
- Seasonal overturning variability: a Lagrangian perspective
- Discussion and conclusions
- Appendix A
- Code and data availability
- Author contributions
- Competing interests
- Disclaimer
- Acknowledgements
- Financial support
- Review statement
- References