the Creative Commons Attribution 4.0 License.
the Creative Commons Attribution 4.0 License.
 | 25 May 2023
Seasonal and El Niño–Southern Oscillation-related ocean variability in the Panama Bight
Rafael R. Torres
Estefanía Giraldo
Cristian Muñoz
Ana Caicedo
Ismael Hernández-Carrasco
Alejandro Orfila
In the Panama Bight, two different seasonal surface circulation patterns coincide with a strong mean sea level variation, as observed from 27 years of absolute dynamic topography (ADT) and the use of self-organizing maps. From January to April, a cyclonic gyre with a strong southwestward Panama Jet Surface Current (PJSC) dominates the basin circulation, forced by the Panama surface wind jet that also produces upwelling, reducing sea surface temperature (SST), increasing sea surface salinity (SSS) and causing an ADT decrease. From June to December, the Choco surface wind jet enhances SST, precipitation and river runoff, which reduces SSS, causing an ADT rise, which in turn forces a weak circulation in the bight, vanishing the PJSC. Interannual variability in the region is strongly affected by El Niño–Southern Oscillation (ENSO); however this climatic variability does not modify the seasonal circulation patterns in the Panama Bight. In contrast, the positive (negative) ENSO phase increases (decreases) SST and ADT in the Panama Bight, with a mean annual difference of 0.9 ∘C and 9.6 cm, respectively, between the two conditions, while its effect on SSS is small. However, as the strong seasonal SST, SSS and ADT ranges are up to 2.2 ∘C, 2.59 g kg−1 and 28.3 cm, the seasonal signal dominates over interannual variations in the bight.
- Article
(13243 KB) - Full-text XML
- BibTeX
- EndNote


The Pacific Ocean covers about half of the Earth's oceans' surface and thus with ocean–atmosphere coupled processes affects the entire planet's climate (e.g., Xue et al., 2020). In the eastern tropical Pacific (hereinafter ETP), the westward North Equatorial Current (NEC) and South Equatorial Current (SEC) as well as the eastward North Equatorial Countercurrent (NECC) form the main circulation (Kessler, 2006; Wooster, 1959; Wyrtki, 1966). The Panama Bight is placed on the easternmost side of the ETP, bordered by Central and South America, north of the Equator (Fig. 1). Although the circulation of the large subtropical gyres affects the Panama Bight, due to its sheltered position, local factors dominate its seasonal circulation and ocean properties (Rodríguez Rubio et al., 2007), with the potential to affect a wider region.
The circulation in the Panama Bight has been described in terms of a reversing oceanic gyre, forced by monsoon-like winds with a cyclonic circulation during the boreal winter and an opposite anticyclonic circulation during the boreal summer (Devis-Morales et al., 2008; Rodríguez-Rubio et al., 2003). However, a weakening of the cyclonic circulation during summer has also been proposed (Chaigneau et al., 2006; Dimar, 2020; Kessler, 2006; Stevenson, 1970). This is an important issue that needs to be clarified, as an opposite seasonal circulation will affect ocean–atmosphere processes in the bight such as precipitation, river runoff, the mixed layer depth, ocean vertical stratification, sea level and coastal dynamics, among others. Additionally, these physical factors affect chlorophyll a, the phytoplankton growth and biodiversity in the area (Corredor-Acosta et al., 2020).
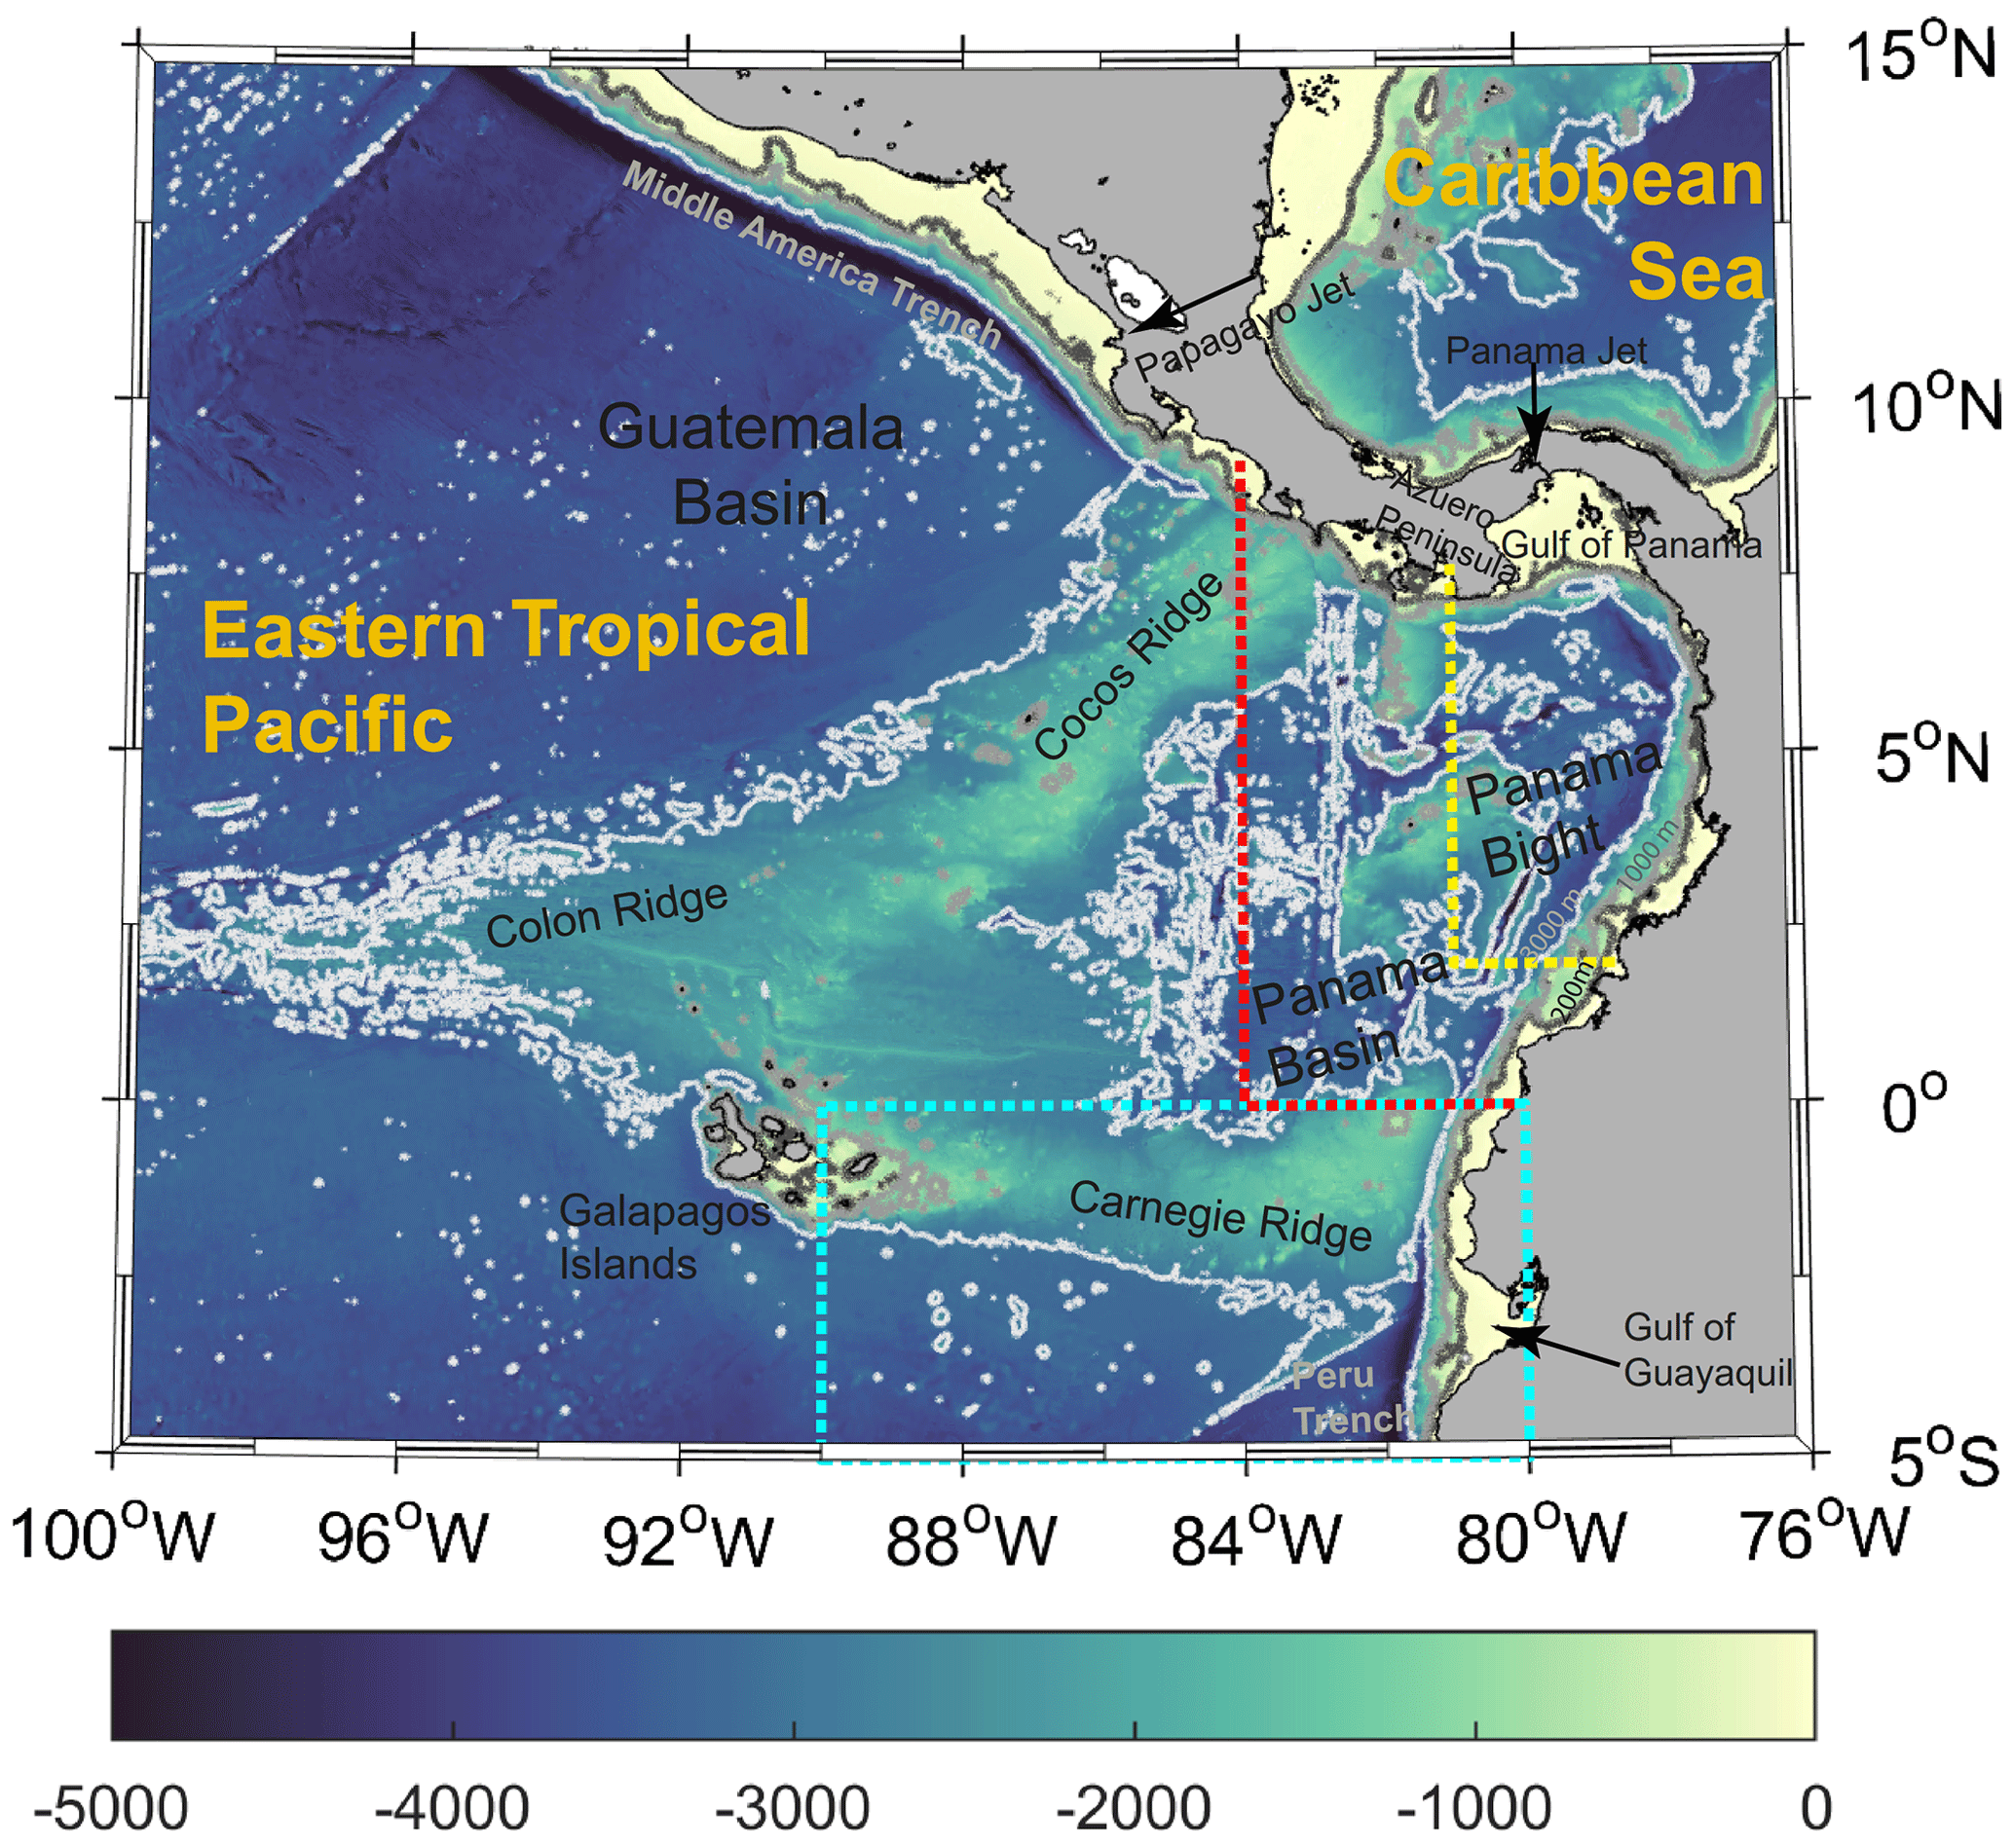
Figure 1Map of the eastern tropical Pacific (ETP) west of 100∘ W. The 200, 1000 and 3000 m isobaths are shown in gray. The limits of the Panama Basin (Bight) are shown in red (yellow). The cyan box displays the northern area used to compute the Niño 1+2.
El Niño–Southern Oscillation (ENSO) severely affects ocean and atmospheric dynamics in the ETP at irregular timescales. During the positive ENSO phase (El Niño), the southern trade winds weaken, with consequences for the coastal upwelling on the Peruvian coasts. Additionally, the western Pacific warm pool migrates towards the east, raising the sea surface temperature (SST) and sea level while deepening the thermocline, which affects the biological productivity and hydrological cycle toward South America's coast. By contrast, the negative ENSO phase (La Niña) enhances the normal conditions, lowering the SST and sea level while shoaling the thermocline toward the east (Cabarcos et al., 2014; Grados et al., 2018; Kessler, 2006; Trenberth, 1997).
Surface dynamics in the ETP east of 120∘ W are more complicated than in the central Pacific, as meridional flow interacts with prevailing zonal currents such as the NECC and SEC. For example, the geostrophic eastward NECC extends towards Central America, merging with the cyclonic circulation around the Costa Rica Dome (Fig. 2), with large variability related to changes in the Papagayo wind jet, which occurs at weekly timescales. Additionally, the westward SEC is mainly observed in two main lobes, about 3∘ S and 3∘ N (Kessler, 2006).
Climate in the Panama Bight is driven by the meridional translation of the Intertropical Convergence Zone (ITCZ) throughout the year. From December to April, the ITCZ moves southward, reaching its southernmost position at ∼1∘ N (Dimar, 2020; Poveda et al., 2006; Villegas et al., 2021). During this season, northern trade winds from the Caribbean Sea cross the Isthmus of Panama through orographic gaps, forming the Panama surface wind jet that affects the Panama Bight ∼400 km towards the Equator (Chelton et al., 2000; Rueda Bayona et al., 2007). The stress from this jet produces distinctive curl dipoles (Kessler, 2006), forcing a cyclonic circulation (counterclockwise) in the Panama Bight, as a response to the sea level drop due to divergence of surface waters to the west, causing upwelling. In this region, upwelling forces SST reduction and sea surface salinity (SSS) increase, due to the upwelling of colder and saltier Subtropical Surface Water (STSW; Fiedler and Lavín, 2006). This gyre, which Chaigneau et al. (2006) named the Panama Bight Cyclonic Gyre (PBCG), is formed by the northward Colombia Coastal Current (Fig. 2), a westward current in the Panama Gulf, a south-southwestward current at ∼81∘ W (Panama Jet Surface Current) and an eastward current closing the gyre at ∼2.5∘ N (Devis-Morales et al., 2008; Rodríguez-Rubio et al., 2003).
Between May and October, the boreal summer, the ITCZ reaches its northernmost position, north of the Panama Isthmus. In this season, the Choco (CHorro del Occidente COlombiano) surface wind jet dominates the area (Poveda and Mesa, 2000). This jet is produced by the southern trade winds that cross the Equator, rotating towards the northeast due to the Coriolis effect and the atmospheric pressure and SST meridional gradients. These gradients occur between the warmer waters in the Panama Bight (lower atmospheric pressure) and the equatorial Cold Tongue (higher atmospheric pressure) formed by coastal and equatorial upwelling and advection of cooler water from the Peru Current (Hastenrath and Lamb, 2004; Zheng et al., 2012). Large SST seasonality in the Cold Tongue also drives the zonal SST gradient across the equatorial Pacific Ocean, which has important impacts on global climate (Karnauskas et al., 2009).
The Choco jet transports large quantities of moisture inland (3774 m3 s−1), forcing a high freshwater contribution during this season and making the Colombian coast one of the rainiest locations on the Earth (Fiedler and Lavín, 2006; Poveda et al., 2006; Poveda and Mesa, 2000; Tsuchiya and Talley, 1998). The coastline geometry together with the Choco jet produces surface water convergence and thermocline deepening in the Panama Bight, raising SST and absolute dynamic topography (ADT) and producing an anticyclonic (clockwise) circulation (Devis Morales, 2009; Fiedler and Talley, 2006; Rodríguez-Rubio et al., 2003). However, there is no consensus on this circulation pattern (Chaigneau et al., 2006; Kessler, 2006).
Strong El Niño events in the altimetry era occur during 1997–1998 and 2015–2016. In this phase, the SST gradient between the equatorial Cold Tongue and the Panama Bight is reduced, reducing the Choco wind jet, moisture inshore transport and precipitation and also generating other complex ocean–atmosphere interactions (Fiedler and Talley, 2006; Poveda et al., 2006), which vary locally and depend on each event's characteristics (Dimar, 2020). However, it seems that in the Panama Bight, negative or weakly positive ENSO events do not significantly change the thermal ocean structure; conversely, strong positive ENSO increases the ocean's heat content and sea level (Devis Morales, 2009).
In this context, we review here the seasonal circulation in the Panama Bight from absolute dynamic topography (ADT), as it includes the mean ocean currents (mean dynamic topography, MDT), as well as temporal sea level variability, as represented by altimeter-derived sea level anomalies (SLAs). Additionally, we extend the circulation assessment to the ETP (east of 100∘ W) to examine the connection between the Panama Bight and equatorial geostrophic currents. We also study ENSO effects on the Panama Bight sea level and determine if this forcing has a significant effect on the seasonal circulation. To understand the steric component of sea level variations, we also assess SST and sea surface salinity (SSS) variability in the region at seasonal and interannual timescales.
Daily maps of ADT from the global ocean gridded L4 product with a resolution for the 1993–2019 period are used (https://data.marine.copernicus.eu/product/SEALEVEL_GLO_PHY_CLIMATE_L4_MY_008_057/description, last access: February 2023). This data set is based on a stable two-satellite constellation, enhancing the stability and homogeneity of the sea level record; therefore the product is dedicated to the monitoring of the sea level long-term evolution for climate applications. This product gave us better results in coastal regions such as the Panama Gulf when compared to the L4 product that merges the measurement from all altimeter missions available (different number of altimeters available over time). Geostrophic currents from the two-satellite product are used, which are computed using a nine-point stencil methodology for latitudes outside the ±5∘ N band (Arbic et al., 2012). In the equatorial band, the Lagerloef et al. (1999) methodology introducing the β-plane approximation is used. Additionally, we download the MDT (CNES-CLS18) and geostrophic currents, corresponding to 1993–2012, which were calculated by merging information from altimeter data as well as GRACE and GOCE gravity field and oceanographic in situ measurements (Mulet et al., 2021).
Monthly SST and SSS fields with the same time span and spatial resolution as ADT were obtained from Copernicus (https://resources.marine.copernicus.eu/product-detail/MULTIOBS_GLO_PHY_TSUV_3D_MYNRT_015_012/INFORMATION, last access: November 2022), merging in situ and satellite observations from different projects (Guinehut et al., 2012). We derive TEOS-10 conservative temperature (Θ) and absolute salinity (SA) using the GSW toolbox version 3.06 (McDougall and Barker, 2011).
The Oceanic Niño Index (ONI) is used to assess ENSO events. Positive/negative ENSO events are identified by five consecutive anomalies of 3-month running SST mean computed in the Niño 3.4 region (5∘ N–5∘ S, 170–120∘ W) that are above/below a threshold of +0.5 ∘C/−0.5 ∘C. Anomalies are computed from 30-year periods, which change every 5 years to account for ocean global warming. Monthly series of SST anomalies based on the ERSST.v5 product (Huang et al., 2017) were downloaded from https://origin.cpc.ncep.noaa.gov/data/indices/ (last access: November 2022). SST anomalies refer to the 1991–2020 period.
To find the months in the 1993–2019 period in which a positive or negative ENSO phase occurred, we use the SST anomaly series from the Niño 1+2 (0–10∘ S, 90–80∘ W) and Niño 3 (5∘ N–5∘ S, 150–90∘ W) oceanic regions following the same methodology used by ONI. The former region is used as an indication of ENSO's local effect on the Panama Bight, as this region covers the equatorial Cold Tongue, whose SST variations affect the Choco surface wind jet. The El Niño 3 region is used to assess if results stand with an ENSO index representative of the central equatorial Pacific. First comparison between indices shows that El Niño 1+2 has a strong response to La Niña events, while El Niño 3 is much less responsive to continental influences (Hanley et al., 2003).
We use two different methodological approaches to assess the regional ocean dynamics. All months are classified in one of the three ENSO-related conditions: normal, positive and negative (Table 1 and Fig. 6f). When El Niño 1+2 is used, normal conditions are the most frequent (58.9 % of occurrence). For positive and negative conditions, all monthly means are computed using between two and eight values, with negative ENSO being more frequent (25.6 %) than the positive ENSO condition (15.4 %). When the El Niño 3 region is used to classify the ENSO conditions, all monthly means are computed using between three and nine values. The frequency of occurrence is similar to that of El Niño 1+2, with 60.2 %, 25.3 % and 14.5 %, respectively (Fig. A2f in the Appendix).
Table 1Niño 1+2 distribution of months for the three conditions: normal, El Niño (positive ENSO) and La Niña (negative ENSO). In bold is the number of months used to assess seasonal differences.
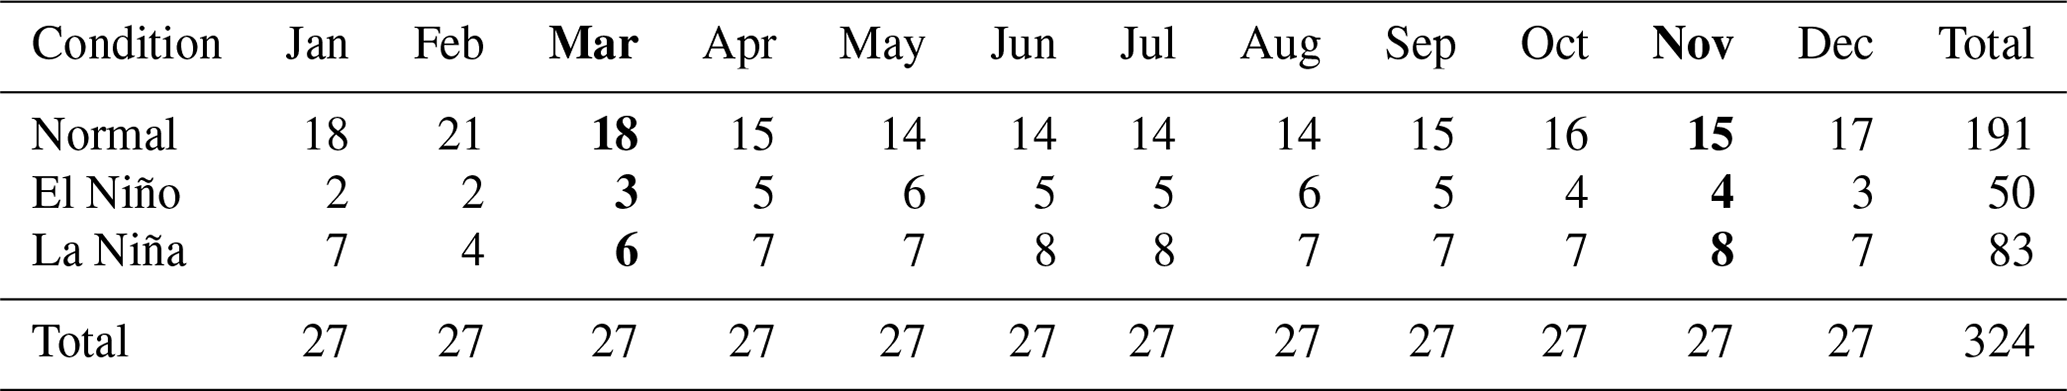
Computing monthly means under the three ENSO-related conditions, based on the Niño 1+2 SST index, assesses seasonal ADT, SST and SSS spatial anomalies, as well as geostrophic currents in the ETP and Panama Bight. For example, from the 27 available values in March (Table 1), 18 are used to compute the March normal condition, 3 for the positive ENSO conditions and 6 for the negative ENSO conditions. Anomalies are computed by subtracting the 1993–2019 spatial mean from the individual monthly data using all data in the ETP (66.5 cm, 26.6 ∘C and 33.8 g kg−1).
Regionally averaged time series are obtained for the ETP, the Panama Bight and the Cold Tongue for the three ENSO-related conditions. Here, the ETP is defined as nodes between 5∘ S–15∘ N and 76–100∘ W. The Panama Bight limits are 1.875–9.125∘ N and 81.125–77.125∘ W. These limits were selected to assess the particular local dynamics, which differ from the rest of the ETP. The Cold Tongue region is placed between 1.125–5.125∘ S and 81.125–88.375∘ W. Note that the Panama Bight and Cold Tongue regions have the same number of nodes (Fig. 4).
The second methodological approach uses self-organizing maps (SOMs) in order to confirm previous results in the ETP. SOMs are a statistical tool used to compress the information contained in a large amount of data into one single set of maps (Kohonen, 1982), reducing the high-dimensional feature space of input data to a lower-dimensional network of units called neurons. SOM analysis has been used in the oceanography context in several studies (Liu et al., 2006; Hernández-Carrasco and Orfila, 2018; López et al., 2022). Learning processes are carried out by an interactive presentation of the input data to a preselected neuronal network, which is modified during the iterative process. Each unit is represented by a weight vector with a number of components equal to the dimension of the input data. During each iteration, the neuron whose weight vector is the closest to the presented sample input data vector, called the best-matching unit (BMU), is updated together with its topological neighbors towards the input sample. When the probability density function of the input data is approximated by SOMs, and each unit is associated with that reference pattern that has a number of components equal to the number of variables in the data set, the training process finishes. The size of the neural network is an important parameter to take into account to maximize the quality of the SOM analysis. The determination of the size of the neural network is empirical and somewhat subjective (Morales-Márquez et al., 2021).
We chose the number of neurons of the network after testing several sizes of the map to check that the cluster structures are shown with sufficient resolution and statistical accuracy. In our case, we have selected for both the temporal and spatial patterns a 3×2 map (six neurons) configuration using monthly data from 1993 to 2019 for the ADT and the zonal (U) and meridional (V) geostrophic velocities in the entire ETP region. The trend and annual and semi-annual cycles were estimated by use of linear regression fitted to the monthly time series obtained from the temporal SOMs. Errors were estimated at the 95 % confidence level. The percentage of explained variance was calculated from the ratio of the residual variance over the variance of the original series after subtracting the mean and trend of the time series, therefore only accounting for the seasonal cycle. A residual time series was obtained after removing the trend and seasonal cycle. We assessed a causal relationship between the monthly residuals and ENSO, using the Niño 3 SST time series and evaluating their correlation coefficient with a significance level of p<0.01. We used El Niño 3 since SOM analysis was performed with data from the entire ETP. In the case of the spatial analysis the evolution of a particular pattern is provided by the BMU for each sample, while in the temporal domain the analysis of the neurons provides temporal patterns, and the BMU is used to localize in space the temporal variability, identifying regions of similar co-variability patterns (Orfila et al., 2021).

Figure 2Mean dynamic topography (MDT) anomalies (color scale) and associated geostrophic circulation (vectors) representative of the 1993–2012 period for the (a) eastern tropical Pacific (ETP) east of 100∘ W and (b) the Panama Basin. MDT anomalies are computed subtracting the ETP regional mean (67.1 cm). South Equatorial Current (SEC), North Equatorial Counter Current (NECC), Costa Rica Dome (CRD), Colombia Coastal Current (CCC) and Panama Jet Surface Current (PJSC) are shown.
To assess the seasonal circulation in the Panama Bight and its interannual variability, we first analyze the mean circulation from the MDT. As a second step, in Sect. 3.2 we describe the seasonal circulation based on normal months where ENSO conditions were not dominant. We further assess the circulation under positive and negative ENSO conditions in Sect. 3.3 in order to observe differences from the normal circulation patterns. In both the seasonal and interannual circulation assessment, we analyze the relationship between sea level variations and steric changes associated with SST and SSS variability. In Sect. 3.4 we analyze regionally averaged ADT, SST, SSS and current speed time series to describe their seasonal behavior under normal, positive and negative ENSO conditions. Finally, in Sect. 3.5 SOMs are used to verify the previously described circulation patterns. In all the sections, we first assess the ETP (east of 100∘ W) in order to contextualize the Panama Bight dynamics, which are described in more detail.
3.1 Mean circulation in the Panama Bight from MDT
Geostrophic currents associated with the MDT (the averaged difference between the mean sea surface and the geoid for the 1993–2012 period) in the ETP portray the SEC as a strong westwards current between 0–4∘ N, distinguishable west of ∼85∘ W (Fig. 2a). The SEC results from geostrophic currents produced by a positive MDT anomaly in the 3 to 5∘ N band and a negative MDT anomaly south of 0.5∘ N, producing a ∼15 cm meridional sea level gradient. The NECC can be identified as an eastward current, less intense than SEC, between 5 and 7∘ N and reaching ∼90∘ W, where it starts a counterclockwise rotation around the Costa Rica Dome, which corresponds to a MDT bowl (upwelling), forced by the Papagayo surface wind jet (Fig. 2a). East of 100∘ W, this circulation responds to a MDT gradient between the positive anomaly in the 3 to 5∘ N band and the negative MDT anomaly at ∼9∘ N. These circulation patterns coincide with the description given by Kessler (2006).
The mean circulation in the Panama Basin (Fig. 2b) differs from the predominant zonal circulation at the same latitudinal band west of ∼84∘ W. In this area, the Panama surface wind jet produces a MDT bowl (upwelling) in the Panama Gulf. The most representative mean circulation feature is a counterclockwise rotation that dominates the northern part of the Panama Bight (east of ∼81∘ W). This circulation shows a strong northward coastal current known as the Colombia Coastal Current (2.5–7.5∘ N), a cyclonic current around the Panama Gulf and the southwestward Panama Jet Surface Current (Devis-Morales et al., 2008). The cyclonic rotational gyre closes with weaker eastward currents at ∼4.5∘ N. Therefore, the mean circulation in the region shown by MDT coincides with the dominant circulation at the beginning of the year when the Panama wind jet affects the Panama Bight. Note that the Panama Jet Surface Current extends southward, connecting with the SEC at ∼2.5∘ N–82∘ W.
3.2 Seasonal circulation in the Panama Bight under normal (no ENSO) conditions
We assess monthly ADT and associated geostrophic circulation based on normal ENSO conditions (Table 1), first in the ETP east of 100∘ W and later in the Panama Bight. Based on the annual observed behavior (Fig. A1), we show results from 2 representative months (Fig. 3b and e). March represents the circulation from January to April, when the Panama wind jet dominates the basin's dynamics. November represents the circulation from June to December, when the Choco wind jet is dominant.
In the ETP positive ADT anomalies are observed from June to December in the band between 1 and 7∘ N, extending toward the Colombian coast (Fig. 3e). In this area, a weak circulation dominates the Panama Bight east of ∼84∘ W, in response to the positive ADT anomaly (Fig. 4f). This circulation shows northward current around 80–82∘ W with speeds below 20 cm s−1 (Fig. 4h). However, the coastal counterclockwise circulation formed by the Colombia Coastal Current (north of ∼4∘ N at the latitude of the San Juan River mouth) and westward circulation in the Panama Gulf are observed with speeds over 20 cm s−1. In this season, the Choco wind jet forces convergence of warm water toward the coast (Fig. 5e). Salinity is reduced due to the increase in precipitation and river outflow (Fig. 5k), reducing surface density and raising ADT in the Panama Bight (black line in Fig. 6a, c and d) and forcing the relatively weaker circulation in the bight. During this season, a clear meridional gradient in the ETP separates cold and saltier waters to the south from warm and fresh waters to the north. In addition, upwelling forced by the Panama and Papagayo surface wind jets is weak as a small signature can be distinguished in SST and SSS.
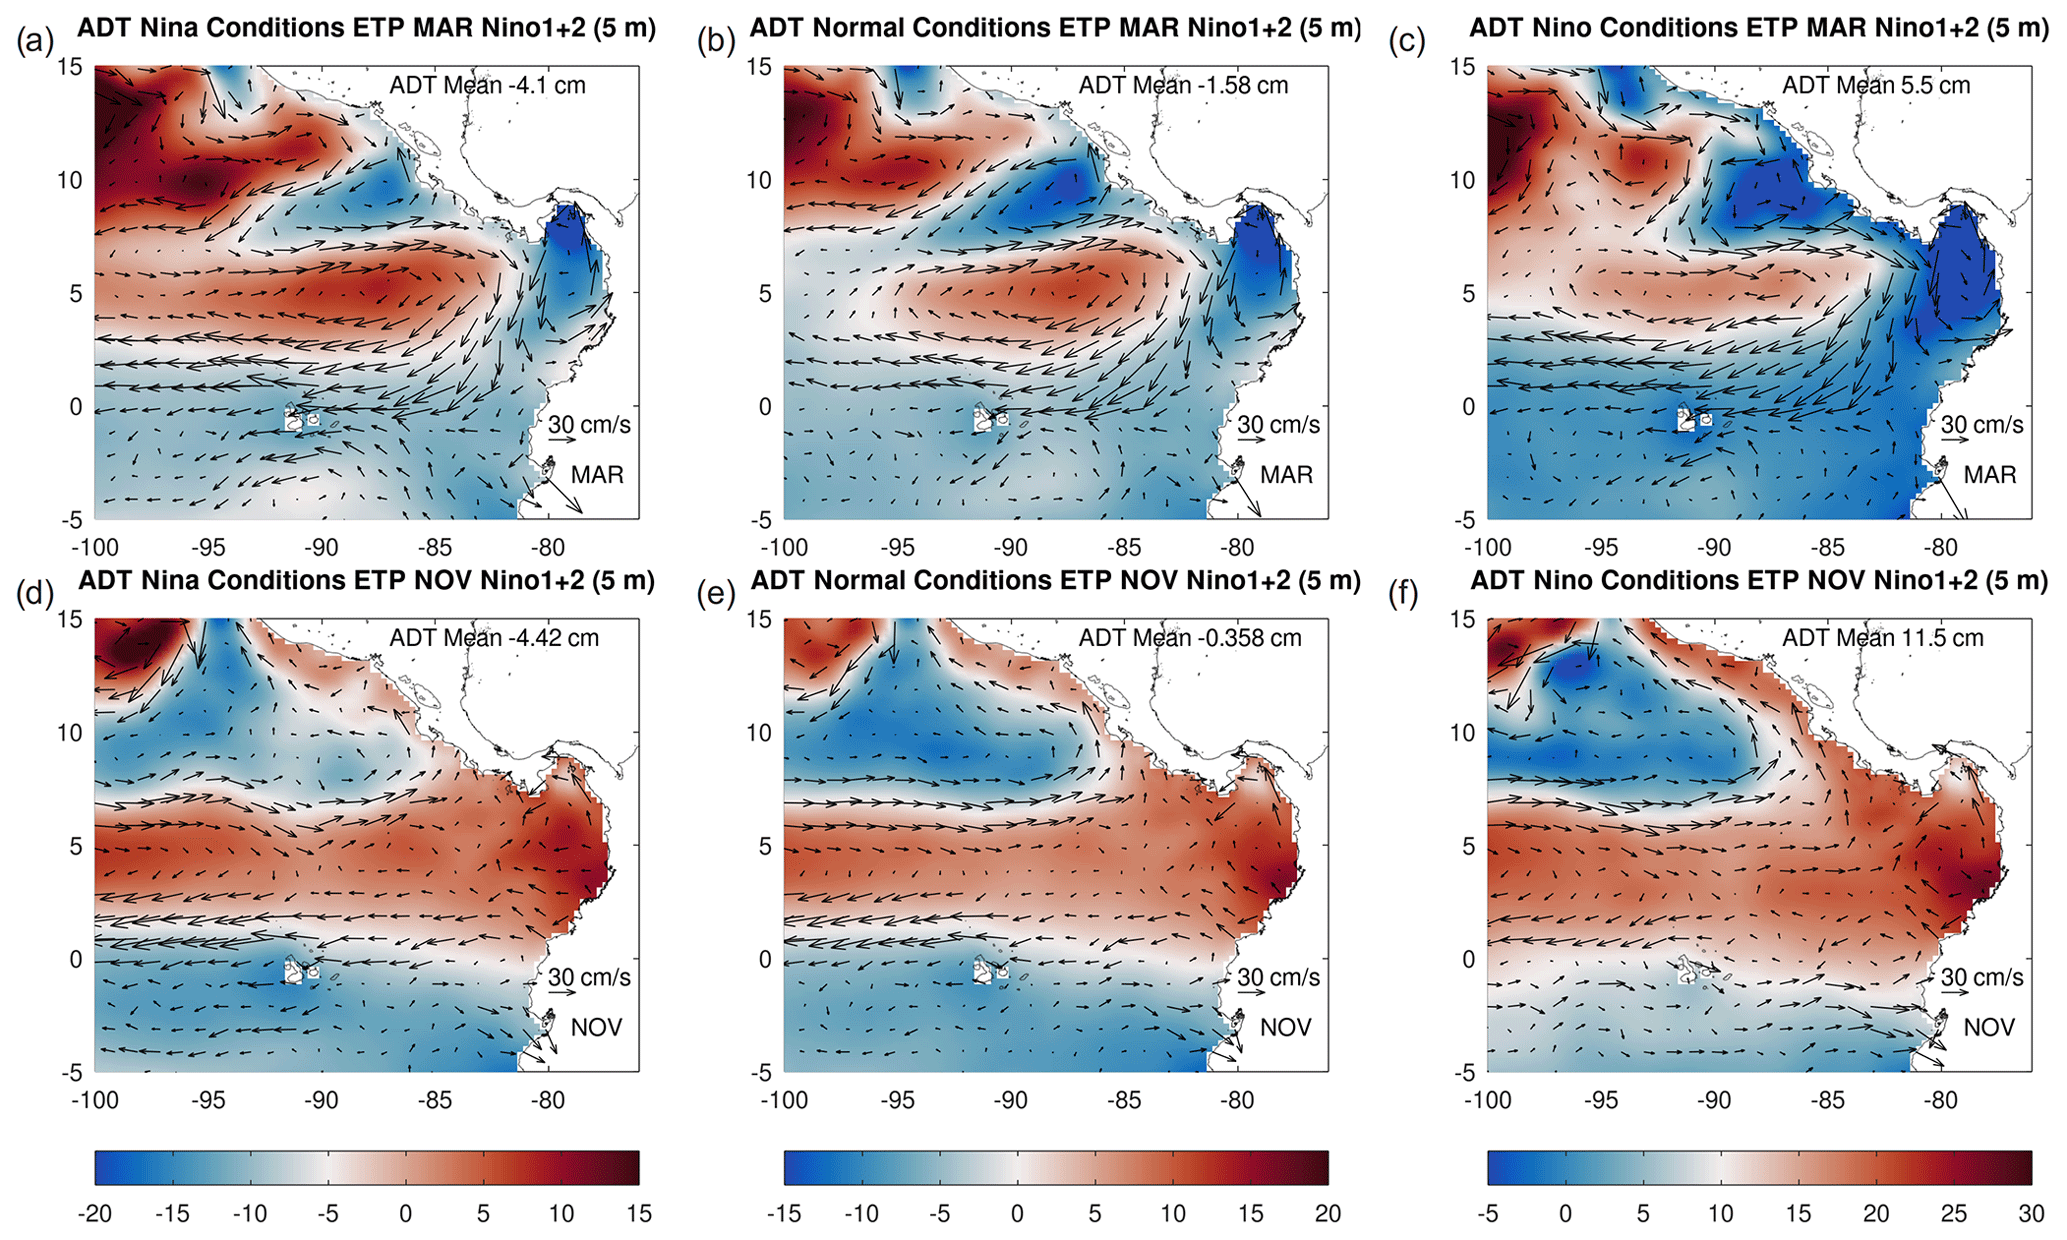
Figure 3Monthly average of ADT anomalies (color scale in centimeters) and associated geostrophic circulation (vectors) for the eastern tropical Pacific (ETP). Seasonal changes are indicated within 2 months: March (a, b, c) and November (d, e, f). ENSO-related conditions (based on Niño 1+2) shown are normal (b, e), negative ENSO (a, d) and positive ENSO (c, f). Each condition has a different color range to highlight the ADT regional gradients, responsible for the geostrophic circulation. ADT anomalies are computed subtracting the ETP regional mean during the 1993–2019 period (66.5 cm). The regional average of the ADT anomalies for each month is shown in the upper right of each panel, which coincides with time series values in Fig. A2a.
From January to April, the Papagayo and Panama wind jets strengthen due to the northern trade winds' intensification in the Caribbean. The circulation in the Costa Rica Dome (negative ADT anomaly) extends southwestward (Fig. 3b), weakening the positive ADT anomaly in the 1–7∘ N band, as is clearly seen in the other season. As a consequence, an anticyclonic circulation (positive ADT anomaly) appears between the Costa Rica Dome and Panama Bight cyclonic circulations. Additionally, colder and saltier surface waters also indicate the upwelling intensification forced by these two surface wind jets. In this season the SST and SSS meridional gradients between the Panama Bight and the Cold Tongue weaken when compared to the other season (Fig. 5b and h). Note a warming during these months of the Cold Tongue, observed at the south of the ETP, with small seasonal changes in its salinity, except for a northern coastal migration.
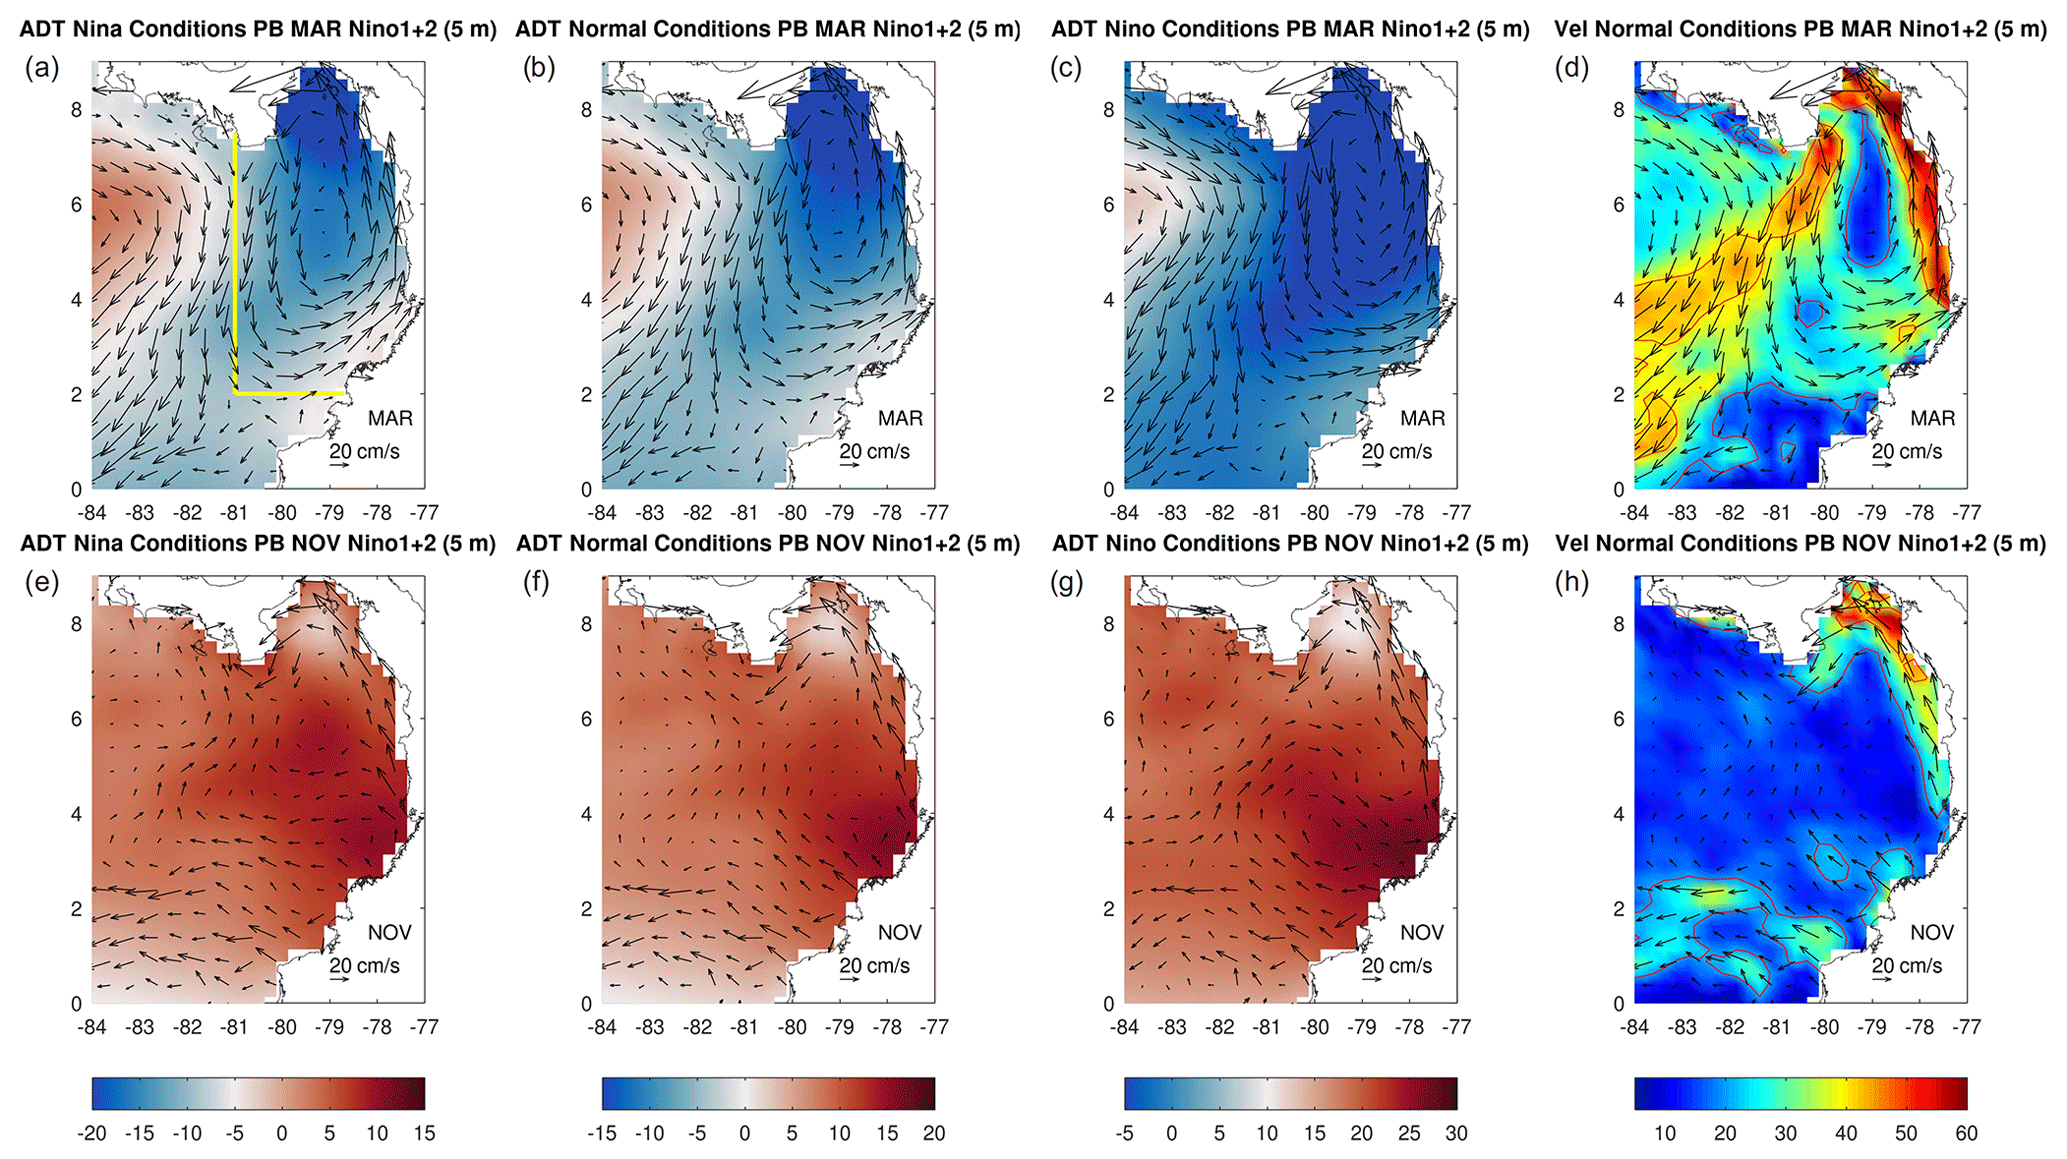
Figure 4Monthly averaged ADT anomalies (color scale in centimeters) and associated geostrophic circulation (vectors) for the Panama Basin. Seasonal changes are indicated within 2 months: March (a, b, c) and November (e, f, g). ENSO-related conditions (based on Niño 1+2) shown are normal (b, f), negative ENSO (a, e) and positive ENSO (c, g). Each condition has a different color range to highlight the ADT regional gradients, responsible for the geostrophic circulation. ADT anomalies are computed subtracting the ETP regional mean during the 1993–2019 period (66.5 cm). Geostrophic vectors and their speed (color scale in centimeters per second) for normal conditions are included for the same months (d, h) with 20 and 40 cm s−1 contours included. In (a) the yellow line indicates the Panama Bight area used to compute regionally averaged time series shown in Fig. 6a to d.
In this season, the Panama Bight is dominated by a strong cyclonic circulation (Fig. 4b), in response to the ADT drop (Fig. 6a black line), forced by the Panama wind jet (which produces Ekman transport to the west) and the corresponding upwelling intensification (SST decreases, and SSS increases, as seen in Fig. 5b and h). The SSS increases in the bight due to precipitation and river outflow reduction during this season, contributing to the ADT drop (Fig. 6). The relatively stronger cyclonic circulation is composed of the Panama Jet Surface Current, extending from the Azuero Peninsula (7.2∘ N, 81∘ W) on the southern coast of Panama to the southwest, with speeds >40 cm s−1 (Fig. 4d), turning into a westward flow at ∼85∘ W (Fig. 3b) and merging at ∼90∘ W with the SEC. A limb of the Panama Jet Surface Current turns into an eastward flow at ∼2–4∘ N, reaching the coast. At this latitude, the northward Colombia Coastal Current is distinguishable, with speeds >40 cm s−1 between ∼4∘ N and the Panama Gulf, where currents become westward. Interestingly, the Colombia Coastal Current north of ∼4∘ N and cyclonic circulation in the Panama Gulf are permanent features throughout the year, with seasonal variations in their speed.
Seasonal ADT, SST and SSS variations in the Panama Bight are strong and respond to local dynamics, which differ from those from the ETP (Figs. 6 and A2 comparison). Seasonality in the spatially averaged ETP time series results from a combination of different ocean patterns observed in this region such as the SEC, NECC, Costa Rica Dome, southern Cold Tongue and circulation in the Panama Bight. Therefore, in Sect. 3.5 we explore ETP circulation patterns and their seasonality using SOM analysis.
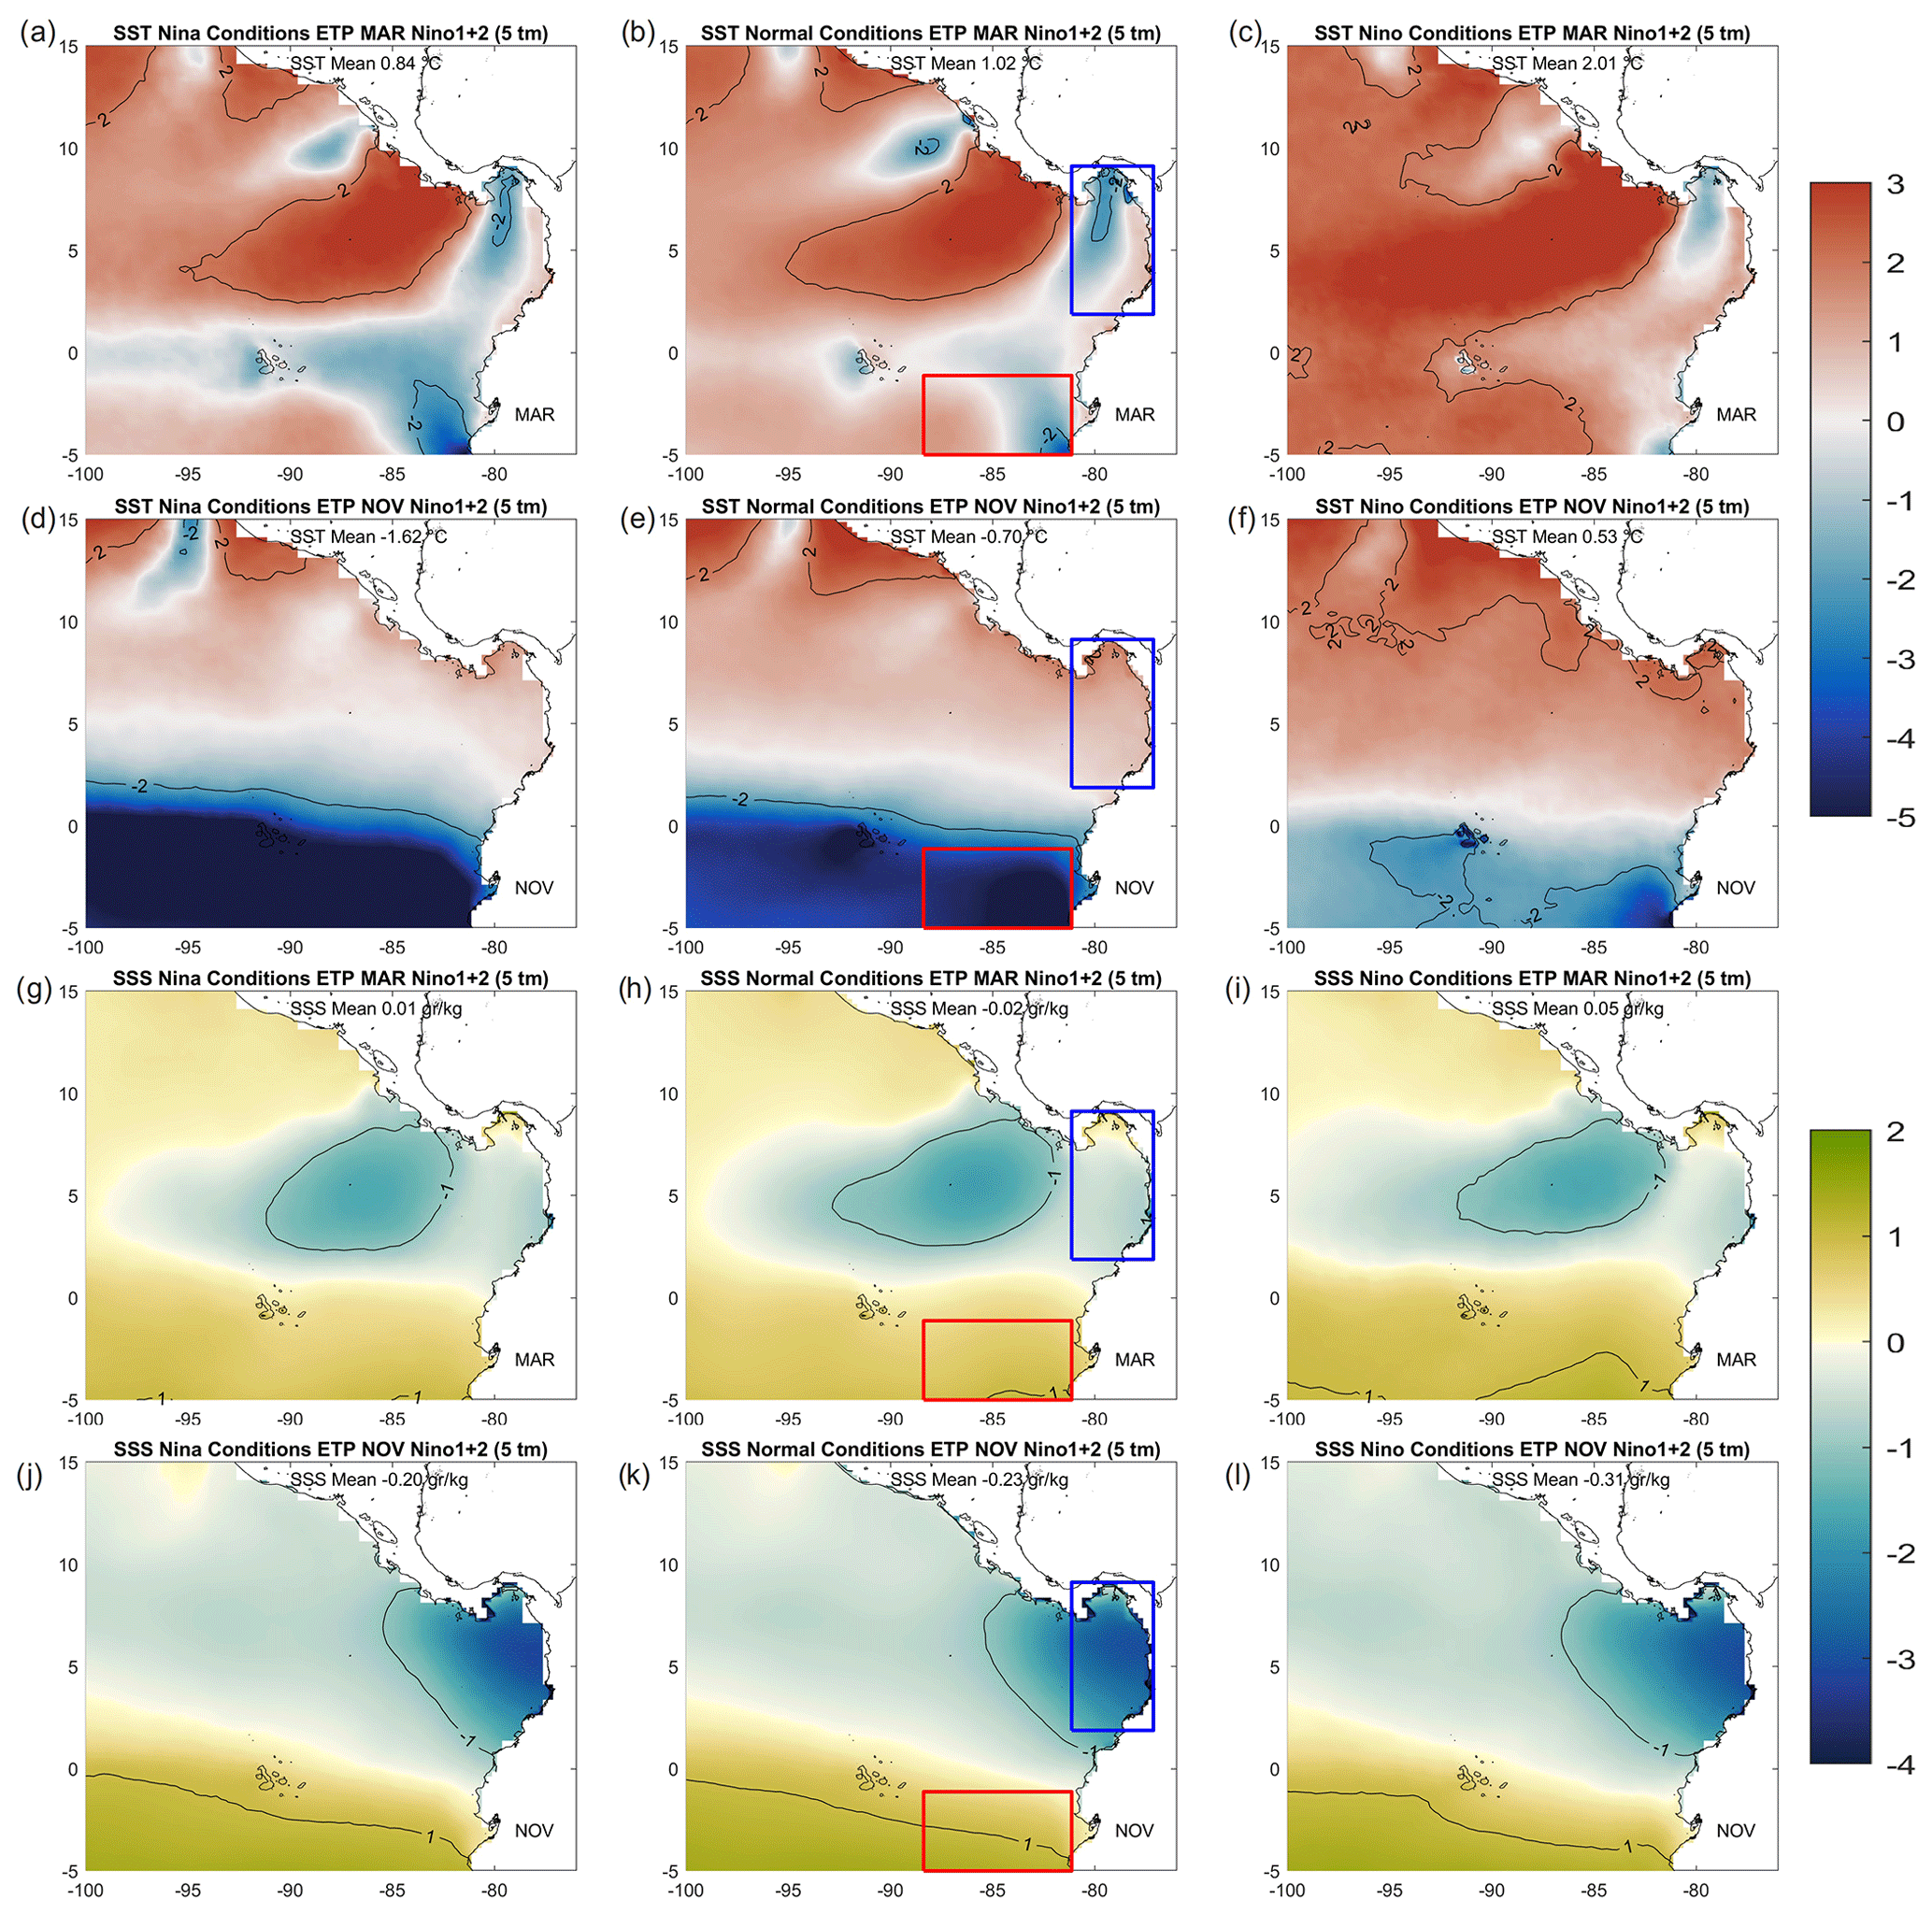
Figure 5Monthly averaged anomalies of sea surface temperature (SST; a to f) in degrees Celsius and sea surface salinity (SSS; g to l) in grams per kilogram for the eastern tropical Pacific (ETP). Seasonal changes are indicated within 2 months: March (a, b, c and g, h, i) and November (d, e, f and j, k, l). ENSO-related conditions (based on Niño 1+2) shown are negative ENSO (first column), normal (second column) and positive ENSO (third column). Anomalies are computed subtracting the ETP regional mean during the 1993–2019 period (26.6 ∘C and 33.8 g kg−1). The regional average of the anomalies for each month is shown in the upper right of each panel, which coincides with time series values in Fig. A2c, d.
We also compare geostrophic currents' seasonality from ADT with the annual MDT (Fig. 2). West of ∼84∘ W, ADT and geostrophic circulation from July to December coincide with the annual MDT circulation. In contrast, the ADT and circulation in the Panama Bight from January to April coincide with the annual MDT, especially due to the presence of the Panama Jet Surface Current.
3.3 Variations in the Panama Bight seasonal circulation related to ENSO
In this section we assess the influence of ENSO on the ETP and Panama Bight seasonal ocean dynamics. Only 2 years corresponding to the strong positive ENSO condition of 1997–1998 and 2015–2016 present this phase during January and February (Fig. 6f). Although this is a small number of outputs, we believe that even for these months, results accurately indicate El Niño conditions since there are two dominant seasonal dynamics in all the variables assessed, which are observed in the similar patterns from January to April or from May to December. For example, in the first quarter of the year, the 12 available positive ENSO months (Table 1) show very similar ocean dynamics during this season.
In the ETP, El Niño events increase SST, while the negative phase reduces it; in contrast, a small interannual variation is observed in SSS (Figs. 6 and A2). As a consequence, changes in temperature dominate a region-wide sea level rise during El Niño and sea level drop during La Niña in the entire ETP, including the Panama Bight (Fig. 6). We assess if such sea level changes affect the seasonal circulation patterns observed under normal conditions (Sect. 3.2). At this point we want to remark that surface currents respond to ADT gradients and not to basin-wide sea level variations. Therefore, we highlight ADT gradients under all the ENSO-related conditions shown in Figs. 3 and 4 by shifting the ADT color limits but maintaining a 35 cm range, defined from the ADT variability under normal conditions. For negative/positive ENSO, ADT color limits are shifted −5 cm/+10 cm with respect to the normal months.
Both El Niño and La Niña seasonal circulation patterns in the ETP are very similar to the circulation observed in normal months. From June to November, the relatively higher ADT anomalies in the 1 to 7∘ N band, extending to the Colombian coast, persist (Fig. 3). A weaker circulation in the Panama Bight and vanishing of the Panama Jet Surface Current are also observed (Fig. 4). Similarly, from January to April, the Papagayo and Panama wind jets' forcing is observed under all ENSO conditions, including the Costa Rica Dome, the strong cyclonic circulation in the Panama Bight and the anticyclonic circulation between them. Therefore, a distinctive seasonal circulation pattern dominates the Panama Bight regardless of the ENSO-related ADT mean shifts. In addition, large interannual differences in the Panama Bight circulation speed are not observed (Fig. 6b).
We also assess if the small interannual variations observed in the seasonal circulation stand when other ENSO indexes are used. For this purpose, we use the Niño 3 index to determine positive and negative ENSO anomalies. Although positive/negative ENSO months show large differences between the two indices (comparison of Figs. 6f and A2f), the seasonality of the geostrophic currents does not change, showing small interannual variations in both cases. This indicates that our results stand even if ENSO variability is assessed from an open-ocean region.
The seasonal circulation patterns in the Panama Bight, as well as the small variations related to ENSO, coincide with results from Chaigneau et al. (2006), which were based on 25 years of satellite-tracked drifter trajectories. However, a study from Corredor et al. (2011) reports statistical differences in surface current speed calculated in four sub-regions placed in the ETP, for September to November. Although their methodology uses total currents, estimated as the sum of Ekman and surface geostrophic currents, such statistical differences in the current speed might exist in some specific areas. For this reason we report small differences in the ENSO-related circulation patterns in both the ETP and Panama Bight.
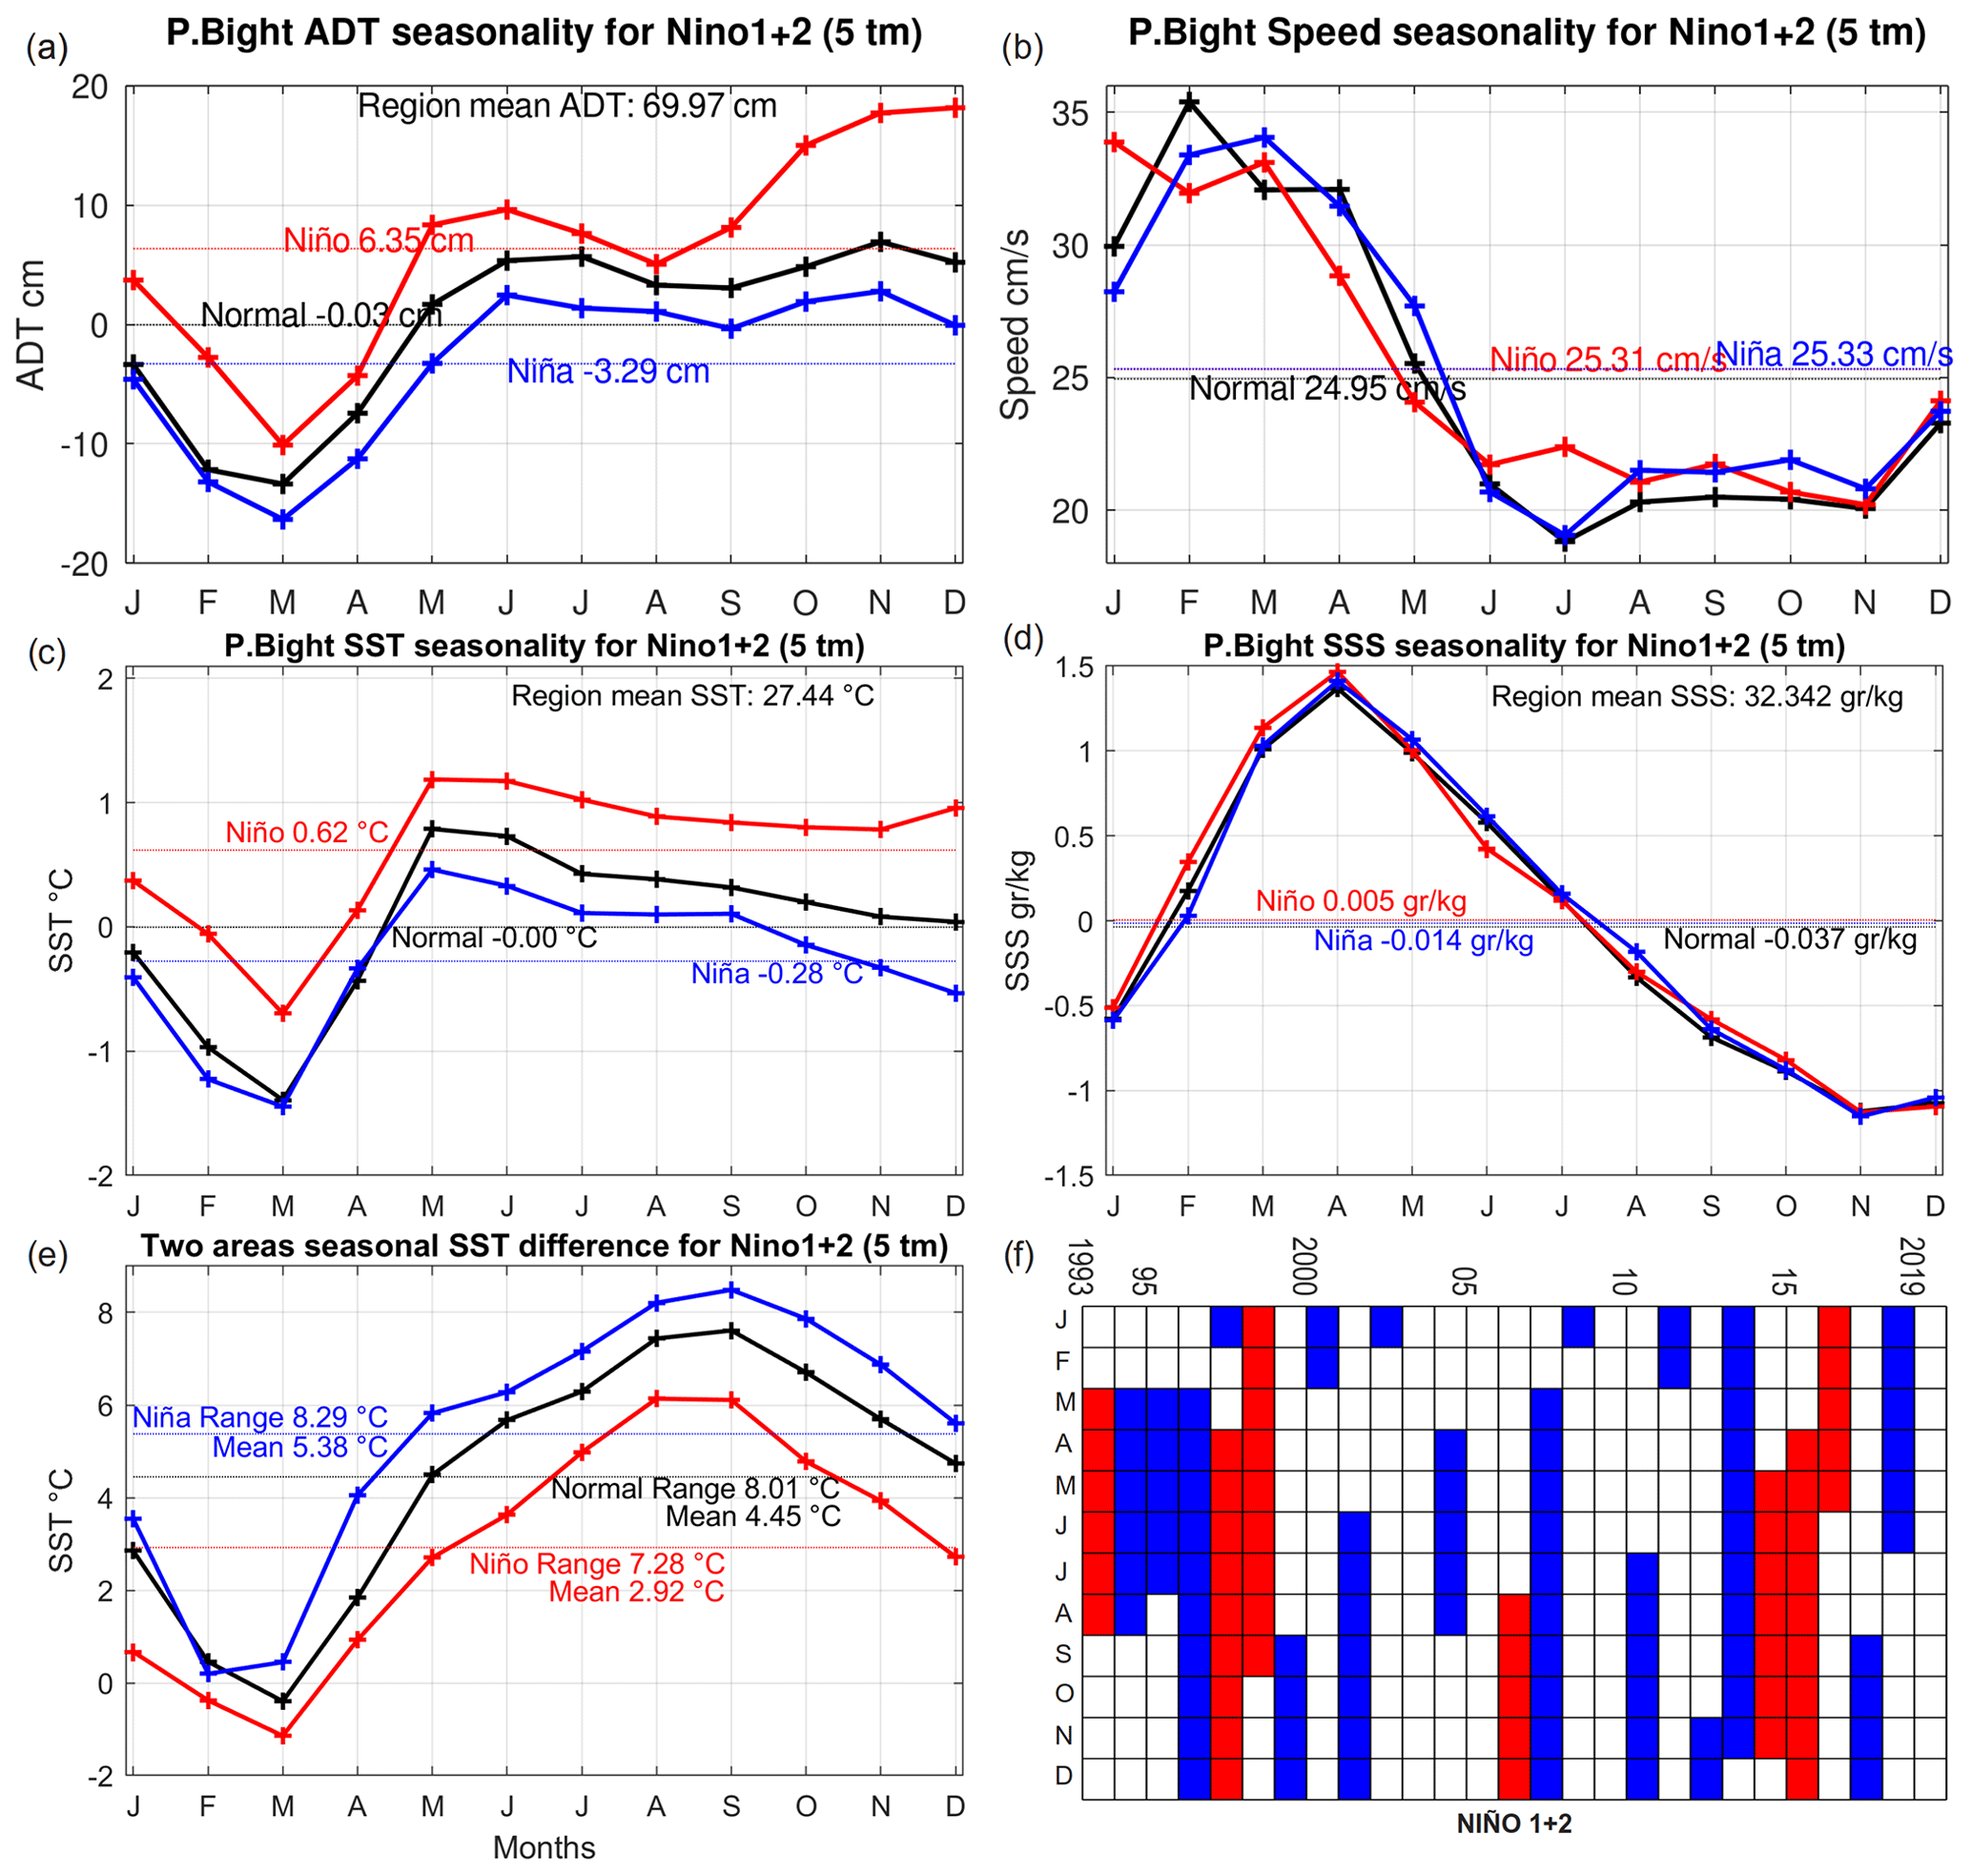
Figure 6Monthly spatially averaged values in the Panama Bight for 1993–2019, differentiating three ENSO-related conditions (based on Niño 1+2) – normal (black), negative (blue) and positive (red) – showing each time series annual mean. (a) Absolute dynamic topography (ADT) anomalies in centimeters. (b) Geostrophic current speed in centimeters per second. (c) Sea surface temperature (SST) anomalies in degrees Celsius. (d) Sea surface salinity (SSS) anomalies in grams per kilogram. Anomalies are computed subtracting the corresponding regional and temporal mean (value shown in the top of each panel). (e) Monthly SST difference between the warm Panama Bight and the Cold Tongue areas shown in Fig. 5. (f) Matrix indicating the monthly ENSO-related condition between 1993–2019, based on the Niño 1+2 region (Sect. 2). Normal months in white, negative and positive ENSO conditions in blue and red, respectively.
3.4 Regionally averaged seasonal and interannual variations in the Panama Bight
The assessment of seasonal and interannual regionally averaged ADT variations is important to evaluate sea level extremes that severely affect the coastal zone. Results in the previous section demonstrate that ENSO does not significantly affect ADT gradients in the study area and thus does not affect the dominant seasonal circulation in the ETP and Panama Bight. However, ENSO affects the ADT regional mean, which we study in more detail here. As previously mentioned, the ETP 27-year regional ADT mean is 66.5 cm above the geoid, while for the Panama Bight this value is 70.0 cm. The spatially averaged time series of ETP (Fig. A2) result from the combination of different circulation patterns (Fig. 2). Interannual variations in the mean ADT are crucial to understand ENSO effects on regional sea level. The higher ADT mean corresponds to the El Niño conditions (9.1 cm), while the lower is for La Niña (−3.8 cm). This difference is clearly related to the warmer SST under positive ENSO conditions and relatively colder SST under negative ENSO conditions. Small interannual changes are observed in SSS, which do not significantly modify the seasonal signal. Additionally, in the ETP, differences in geostrophic velocities are not noticeable under the three ENSO-related conditions. The annual-mean differences under the three conditions are below 0.3 cm s−1 (all of them around 23.1 cm s−1). These results support the small impact on circulation (mean speed) due to ENSO variability in the ETP.
The regionally averaged ADT time series in the Panama Bight responds to the two distinctive oceanic circulation patterns observed throughout the year (Fig. 4) whose seasonality is not strongly affected by ENSO (Fig. 6). The lowest ADT occurs from January to April, indicating the sub-regional sea level drop due to the strong cyclonic circulation forced by the Panama wind jet. The upwelling intensification during these months is clearly observed in the SST drop and SSS increase. In contrast, from June to December higher ADT results from warmer and fresher surface waters as a consequence of the dominant Choco surface wind jet. The ADT seasonal range is 20.3 cm in the Panama Bight during normal months, which coincides with the seasonal cycle previously reported from tide gauges and from a regression fitted to altimetry data (Dimar, 2020, chap. 5). Large seasonal differences are also observed in the geostrophic currents' velocity. Stronger currents occur from January to April, while slower and less variable currents occur from June to December. Therefore, the cyclonic circulation associated with the Panama wind jet is also the fastest. The seasonal speed range under normal conditions is 16.6 cm s−1, between February and July, thus over half the mean speed (Fig. 6b).
ADT seasonality is similar for all ENSO-related conditions; therefore seasonality dominates over the interannual sea level shifts in the Panama Bight (Fig. 6a). In this region, the ADT annual mean is higher (6.4 cm) under El Niño conditions and lower during La Niña (−3.3 cm), which is a smaller difference than what was observed for the ETP. Note that the ADT annual mean during El Niño is 2.8 cm lower in the Panama Bight than in the ETP due to a weaker ocean warming in the bight (0.56 ∘C below the ETP annual mean). The largest seasonal ADT range is found during El Niño in the Panama Bight (28.3 cm), as a consequence of a larger temperature increase from October to December due to the El Niño peak at the end of the year. Additionally, currents' mean speed and seasonality in the Panama Bight are very similar under the three ENSO-related conditions (Fig. 6b), indicating that ENSO phenomena affect mainly the sub-regional sea level and not the circulation patterns (mean speed).
SSS has a strong seasonal cycle (up to 2.59 g kg−1 during El Niño) with small interannual variations in the Panama Bight (Fig. 6d). This was unexpected as the literature indicates that ENSO affects local precipitation and river runoff, which will also affect SSS. To explore the reasons behind the small interannual SSS variations, we assess the SST spatial gradient between the southern Cold Tongue and the Panama Bight (areas shown in Fig. 5), as this gradient modulates the Choco surface wind jet.
SST monthly means in the Cold Tongue show larger seasonal variability than SST in the Panama Bight (Fig. A2e), with warmer months from January to April (ITCZ at its southernmost position produces weaker upwelling in the Cold Tongue). Under normal ENSO conditions, only in March is the SST in the Panama Bight colder than the SST in the Cold Tongue. In both areas, El Niño (La Niña) conditions show warmer (colder) SST; however, shifts from normal conditions are larger in the Cold Tongue. Note that the coldest SST in the Cold Tongue occurs in September under La Niña conditions, which would indicate stronger upwelling as a consequence of stronger southern trade winds.
From May to December the SST differences between the Panama Bight and Cold Tongue are larger (Fig. 6e), which coincides with the intensification of the Choco surface wind jet in the former area. These results are in accordance with the literature (Poveda and Mesa, 2000; Hastenrath and Lamb, 2004). Additionally, a larger SST difference between the Panama Bight and the Cold Tongue occurs during La Niña, with an annual mean of 5.4 ∘C and seasonal range of 8.3 ∘C, while they are smaller under El Niño conditions (2.9 and 7.3 ∘C). These results indicate that under positive ENSO conditions, the Choco surface wind jet will be weaker than under normal conditions (smaller SST differences between the two areas from May to December), while the opposite will happen under negative ENSO conditions.
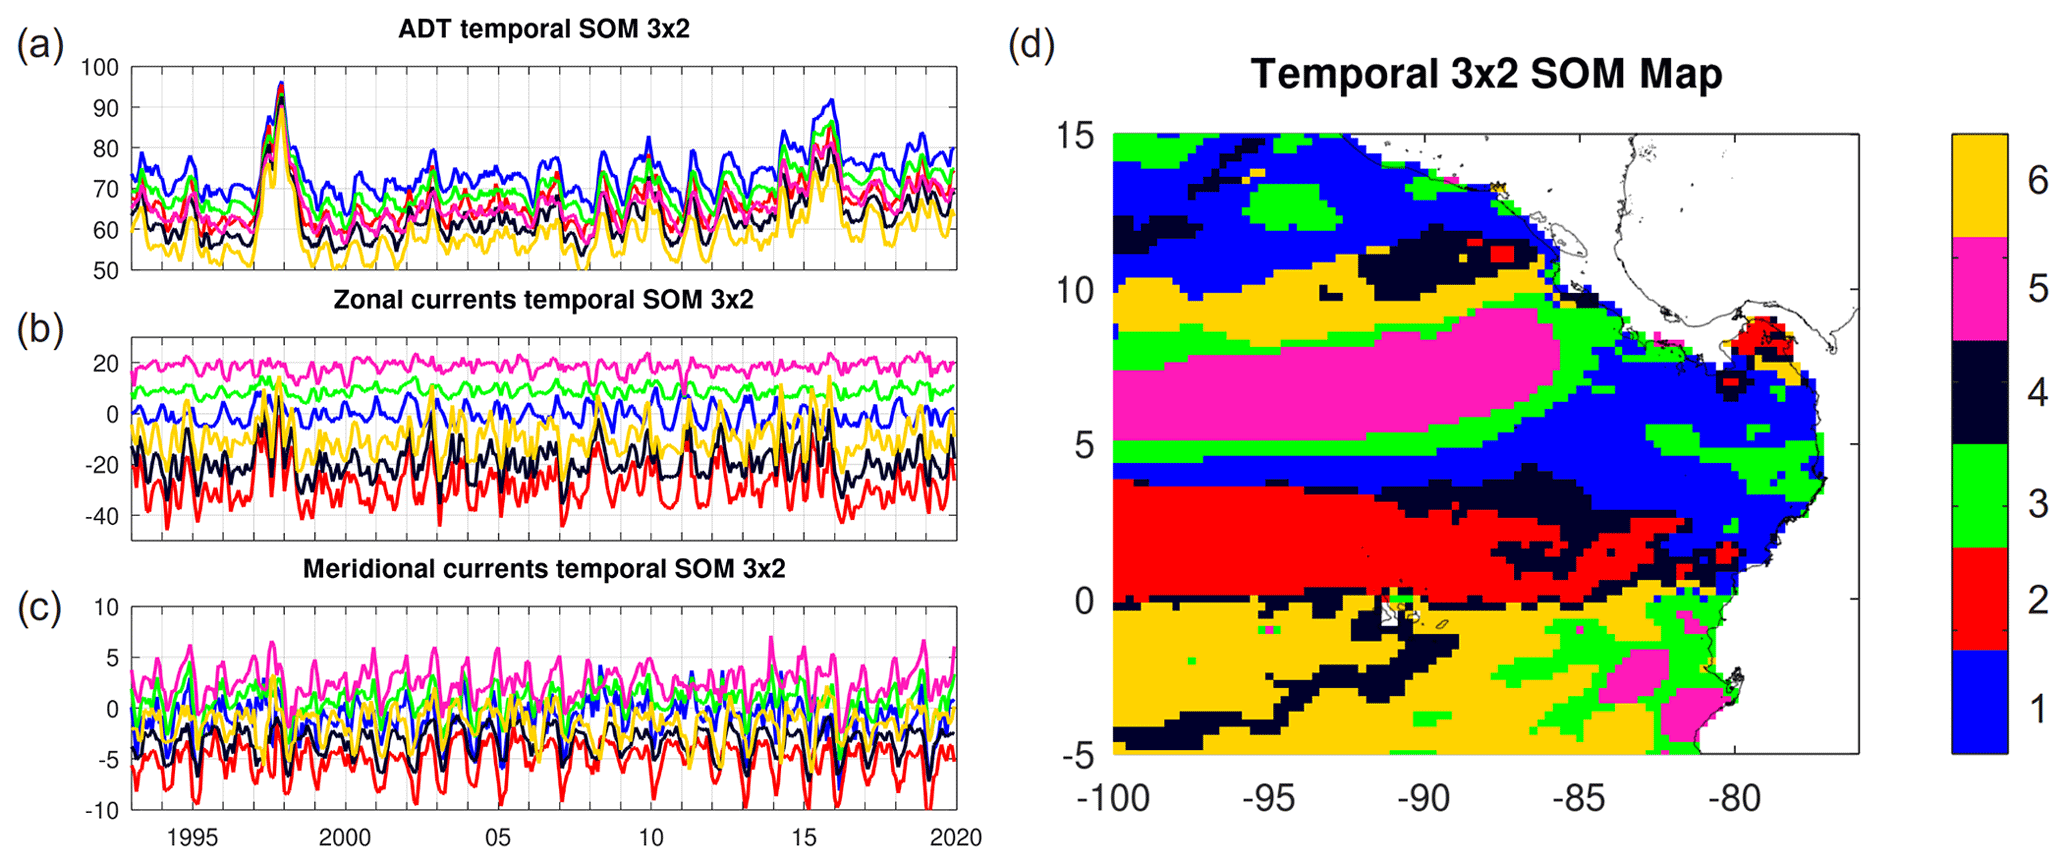
Figure 7(a) Absolute dynamic topography (cm) and (b) zonal and (c) meridional geostrophic current (cm s−1) time series from 1993 to 2019, which results from a 3×2 SOM temporal analysis in the eastern tropical Pacific. (d) Sub-regions represented by the six temporal SOM patterns.
Under El Niño conditions, warmer SST enhances precipitation in the Panama Bight, which is expected to reduce SSS. However, we speculate that small ENSO-related SSS variations found in the Panama Bight are due to compensating mechanisms acting differently in the two seasons. In the first quarter of the year, positive ENSO strengthens the Panama surface wind jet (e.g., Sayol et al., 2022), enhancing upwelling in the Panama Bight, which would increase SSS, which would in turn be reduced (compensated) due to enhanced precipitation. From May to December, a weaker Choco surface wind jet reduces the inshore moisture transport to the Panama Bight, therefore compensating precipitation increase due to warmer SST. The opposite mechanism will occur under La Niña conditions. Bear in mind that small interannual SSS variations in the Panama Bight do not necessarily indicate small ENSO-related variations in coastal precipitation, which is an active topic of study (e.g., Sayol et al., 2022).
We also assess results from this section using the Niño 3 index (not shown). We found a larger difference among the ADT annual means for the three ENSO-related conditions in the Panama Bight. The mean for El Niño is 7.0 cm, and for La Niña it is −3.6 cm. However, regional ADT and current speed seasonality is very similar to the results using the Niño 1+2 index. Therefore, we did not find large differences in the results we report in this section when ENSO variability is assessed from a larger equatorial area in the open ocean. However, we believe that using the Niño 1+2 index is more appropriate to assess circulation variations in the Panama Bight, as dynamics in this region (e.g., Cold Tongue) affect our study area (e.g., Choco wind jet).
3.5 Circulation patterns in the eastern tropical Pacific from SOM analysis
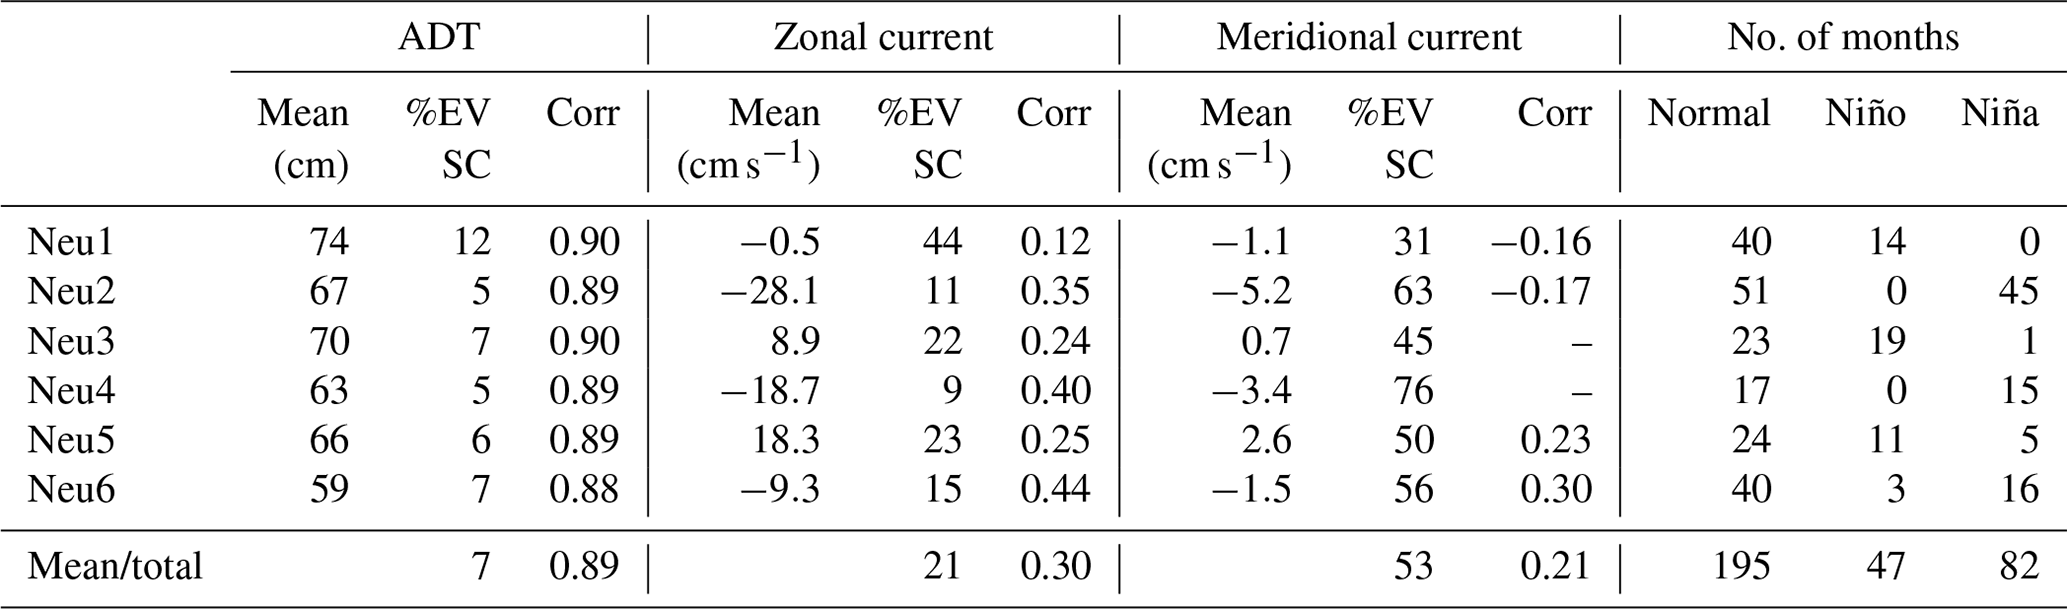
Results from the SOM analysis in the temporal domain support previous findings in the ETP, which indicate that surface currents' strong seasonality dominates over interannual variations associated with ENSO; in contrast, ADT is strongly modulated by El Niño (Fig. 7a). The seasonal cycle's explained variance in the zonal and meridional currents is 21 % and 53 %, respectively, when the six neurons are averaged, while their correlation mean with Niño 3 is 0.30 and 0.21, respectively (Table 2). Conversely, the seasonal cycle's mean explained variance in ADT is only 7 %, while the mean correlation with Niño 3 is 0.89. Slightly weaker mean correlations are found with Niño 3.4 (0.81) and Niño 1+2 (0.86).
Zonal currents dominate the circulation in the ETP, with a mean value 1 order of magnitude larger than meridional currents (Table 2). A comparison between the temporal SOM spatial distribution (Fig. 7d) and main currents in the ETP (Fig. 2) allows us to identify the second neuron with the SEC and the fifth neuron with the NECC, extending to the east as part of the southern limit of the Costa Rica Dome. The former has the strongest westward flow (−28.1 cm s−1) and the latter the strongest eastward flow (18.3 cm s−1). Additionally, neuron 6 seems to be related to the westward circulation in the Costa Rica Dome (northern side) and Cold Tongue (west of 89∘ W), characterized by small mean ADT. Note that neurons 2, 4 and 6, which are mainly westward, can reverse and become eastward during strong El Niño events, such as the one in 1997–1998 (Fig. 7b).
Table 2Temporal SOM 3×2 neurons (Neu) of variability for absolute dynamic topography (ADT) and zonal (U) and meridional (V) currents. Mean, percentage of explained variance of the seasonal cycle (%EV SC) and significant correlations (Corr) with Niño 3 are shown. The number of months of occurrence of the different ENSO conditions (Niño 3) for the six spatial SOM neurons is included.
Neurons 1 and 3 dominate the Panama Bight (Fig. 7d). Neuron 1 is the only one in which mean (southward) meridional currents are larger than mean zonal currents. However, both neurons have large seasonality; therefore they regularly change direction (except U in neuron 3), which agrees with the seasonal circulation variations forced by the surface wind jet in the Panama Bight (Fig. 3). In the Panama Gulf, neuron 2 supports the permanent westward currents shown in Fig. 4.
The six SOM neurons in the spatial domain mainly indicate two different circulation patterns (Fig. 8a). Neurons 5 and 6 show the dominant circulation from January to April (Sect. 3.2), when the effect of the Panama and Papagayo surface wind jets is observed in a stronger Panama Jet Surface Current and the northern boundary of the Costa Rica Dome. In contrast, the other neurons show the dominant circulation from June to December. However, neurons 3 and 4 differ from 1 and 2 mainly in the area south of the Azuero Peninsula, as in the former neurons southward circulation prevails, while in the latter neurons, northward circulation is observed. Therefore, neurons 3 and 4 seem to be transitional circulation patterns. The temporal occurrence, shown in the BMU (Fig. 8b), corroborates the former description. Neurons 5 and 6 always occur between January and April (91.7 % of the months), while neurons 1 and 2 occur mostly between June and November (89.5 % of the months). Neurons 3 and 4 together are observed in 75 months, 65.3 % occurring in May and December, during the two seasons' transition.
Regional-mean ADT shows large differences between the odd and even neurons. Even neurons show smaller ADT spatial mean (60.4 to 61.8 cm) than odd neurons (71.2 to 72.6 cm). This ADT shift corresponds to what is expected from La Niña and El Niño conditions, respectively (Fig. A2). Furthermore, odd and even neurons do not show large differences in circulation (when compared in the same row in Fig. 8a), except for the strongest westward currents in the Cold Tongue and SEC, as expected from La Niña conditions. These results corroborate that in the ETP ENSO strongly affects the mean ADT, but not the circulation seasonality (Sect. 3.3). To highlight this relation, we combine the BMUs with the prevailing ENSO condition (Fig. 8b). From 82 months under La Niña conditions, 92.7 % coincide with even neurons. From 47 months under El Niño conditions, 93.6 % coincide with odd neurons (Table 2). Similar results were obtained when ENSO variability was calculated with Niño 1+2; however the relation with the spatial SOM neurons deteriorates, as even neurons coincide with 84.3 % of La Niña months, while odd neurons coincide with 76 % of El Niño months.
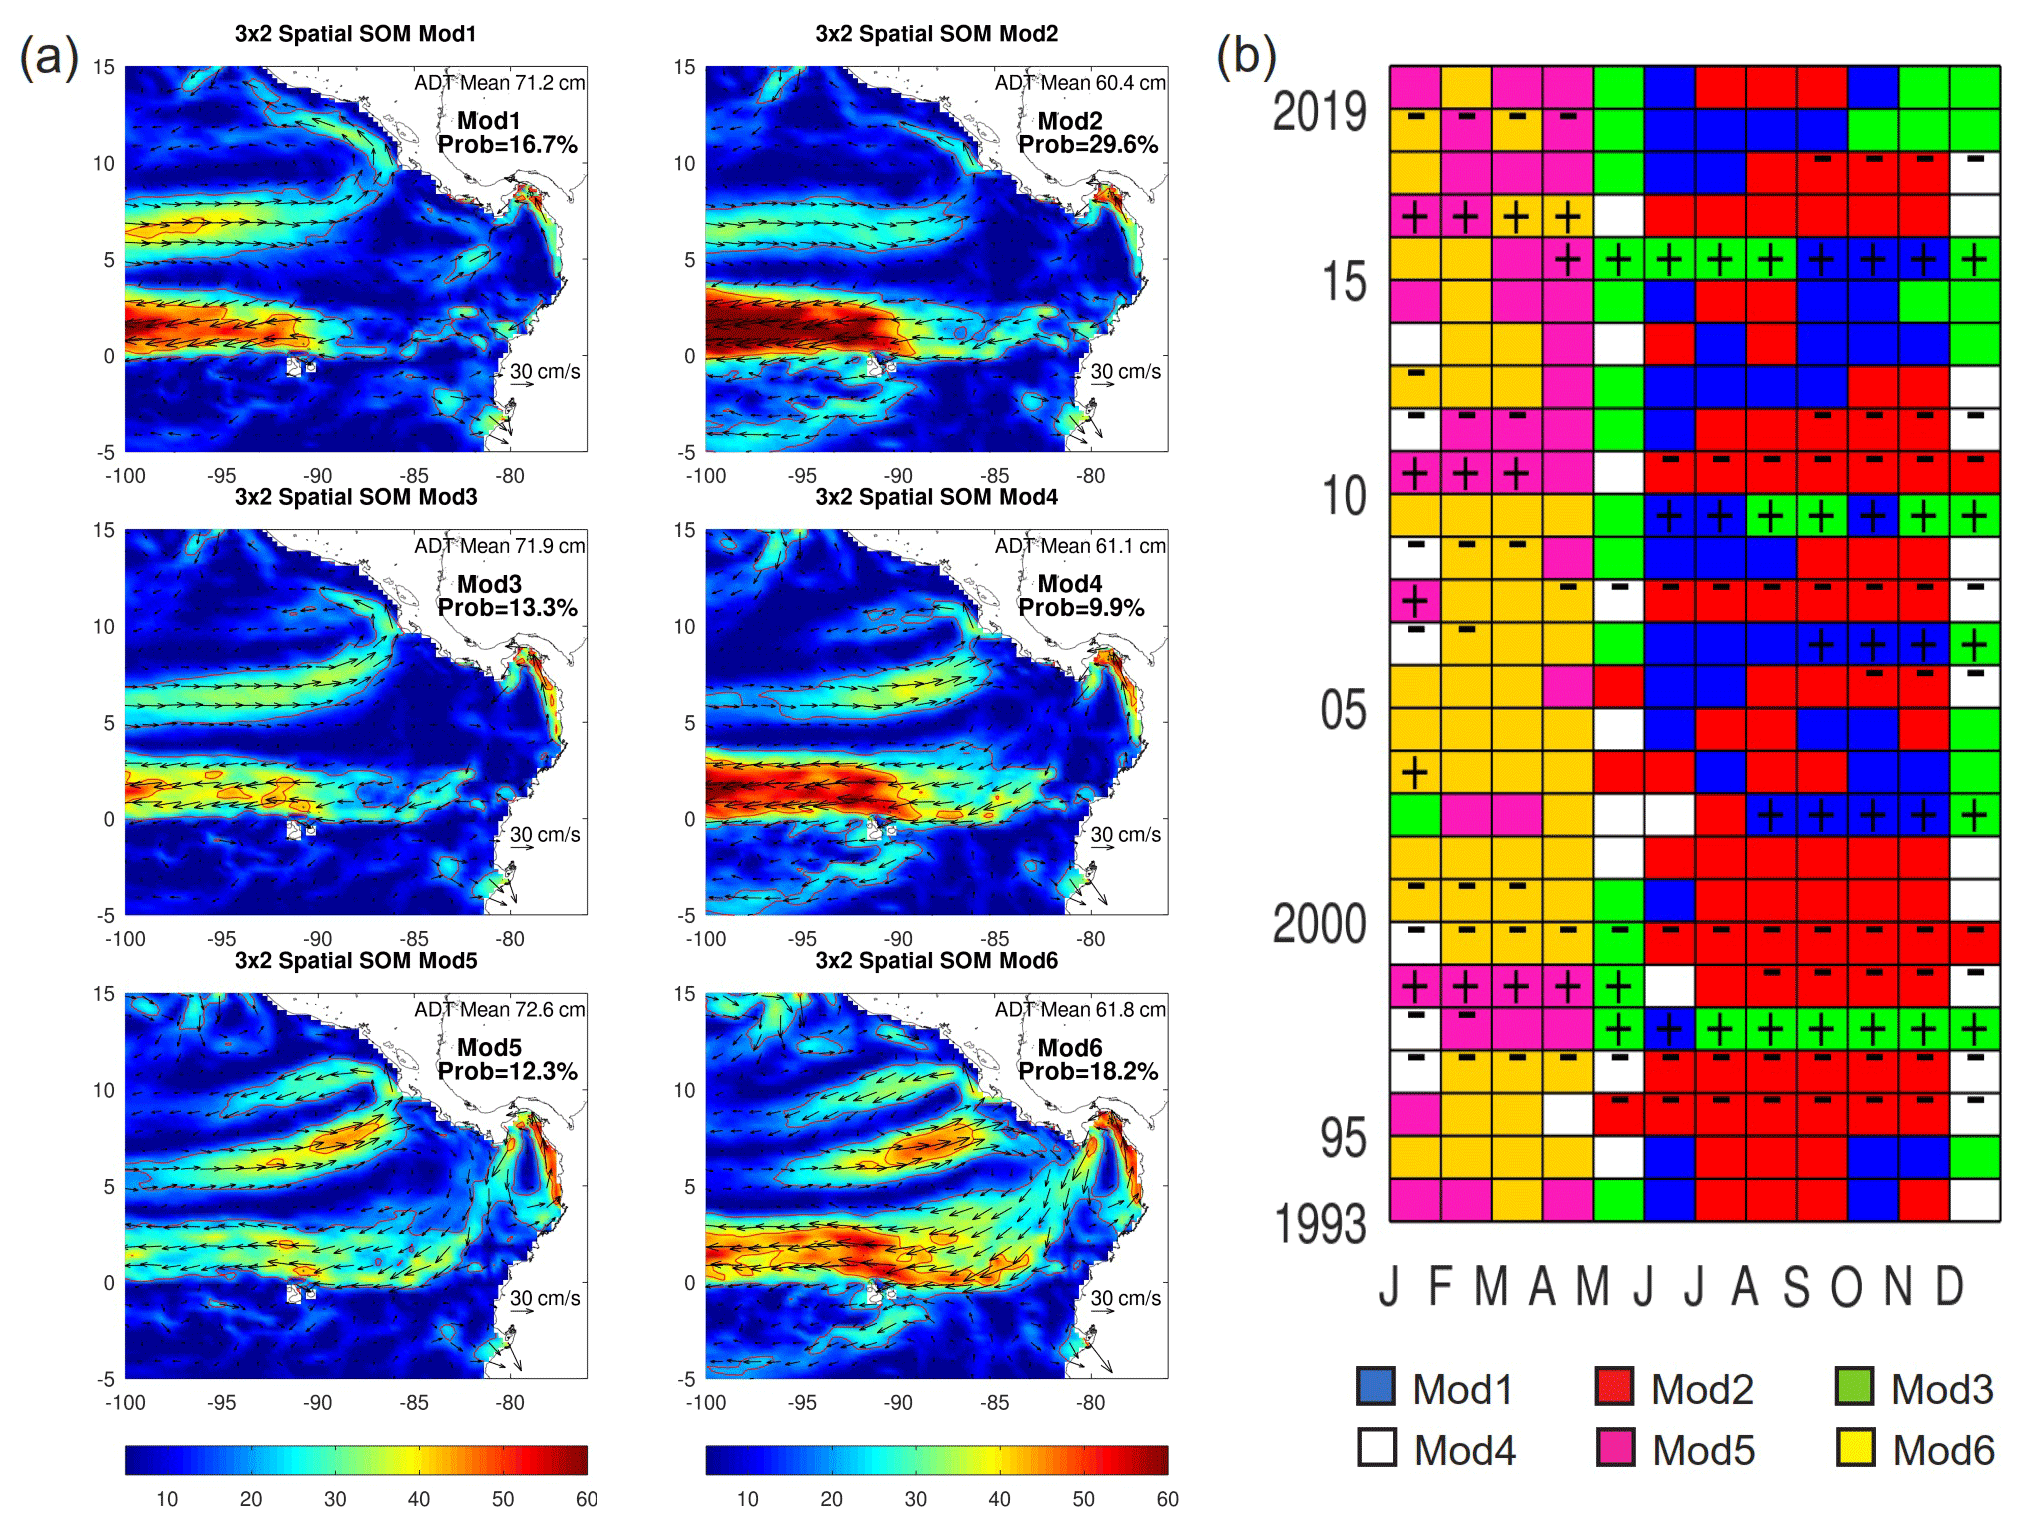
Figure 8(a) Spatial patterns of geostrophic speed (color scale) and currents (vectors in centimeters per second), which result from a 3×2 SOM spatial analysis in the eastern tropical Pacific, computed from 1993 to 2019; 20 and 40 cm s−1 contours are included. (b) Monthly best-matching unit (BMU) of SOM patterns, indicating negative (−) and positive (+) ENSO-related conditions, based on the Niño 3 region.
Seasonal ocean circulation in the Panama Bight has been assessed using 27 years of ADT. We take advantage of this larger time series to build upon the dispute of the reverse seasonal circulation in the bight (Sect. 2), as reported in previous works, based on shorter SLA time series and hydrographic data (Devis-Morales et al., 2008; Rodríguez-Rubio et al., 2003). We find the northward Colombia Coastal Current (north of ∼4∘ N) and westward circulation in the Panama Gulf as permanent features, with seasonal differences in their speed. The most relevant seasonal difference is in the southwestward Panama Jet Surface Current, which is strong in the first third of the year and vanishes during the remaining months, when the circulation in the Panama Bight is weaker and more variable (Fig. 4). Therefore, large seasonal differences are found in the Panama Bight circulation, which we would not catalogue as a reverse circulation characterized by an anticyclonic gyre during the boreal summer. These results are in agreement with Chaigneau et al. (2006), whose description of the Panama Bight circulation was based on 25 years of satellite-tracked drifter trajectories.
The mean circulation in the ETP (east of 100∘ W) was analyzed from the MDT altimetry product (1993–2012 period). West of ∼84∘ W, MDT is similar to the ETP circulation that dominates from June to December in the ADT. In the Panama Bight, MDT shows the cyclonic circulation from January to April seen in the ADT, when the Panama surface wind jet dominates the region (Fig. 2). Therefore, the mean annual circulation should be used with caution to represent the dominant seasonal circulation in the Panama Bight.
The seasonal circulation assessment in the Panama Bight shows that from January to April, a stronger cyclonic circulation responds to the ADT drop (Fig. 4), produced by upwelling forced by the Panama surface wind jet, which also reduces SST and increases SSS (Fig. 6). From June to December, a weaker circulation responds to the ADT rise (density reduction), produced by convergence of surface warm waters dragged by the Choco surface wind jet, which also transport moisture inshore, enhancing precipitation and river outflow, which reduces SSS. During this season, the Panama Jet Surface Current is not observed, while it is >40 cm s−1 during the first third of the year. Therefore, the Panama Bight has a strong seasonal variation in SST, SSS, sea level and circulation. The variations in these physical factors affect the biosphere, as chlorophyll a availability in the basin is modulated by these changes (Corredor-Acosta et al., 2020). In the ETP seasonal circulation variations do not change as much as in the Panama Bight (Fig. 2), showing the zonal presence of the SEC and NECC west of ∼90∘ W as permanent features; although the cyclonic Costa Rica Dome is also a permanent feature, its intensity varies seasonally (Fig. 8).
We further assess the ENSO effect on seasonal circulation and sea level in the study area using the coastal Niño 1+2 index. However, if the open ocean Niño 3 index replaces this index, results are very similar. We find that the seasonal SST, SSS, sea level and circulation patterns are not largely modified by positive or negative ENSO phases (Fig. 6). This coincides with small differences reported in the ETP mean surface circulation due to ENSO, based on drifter trajectories (Chaigneau et al., 2006). In contrast, the regionally averaged SST and sea level of the ETP and Panama Bight are shifted by ENSO, with a mean SST and ADT increase in the positive phase and a mean SST and ADT decrease in the negative phase. The mean ADT (SST) difference between the two ENSO conditions is 12.9 cm (1.8 ∘C) in the ETP and 9.6 cm (0.9 ∘C) in the Panama Bight. Still, seasonal ranges of these two variables in the Panama Bight (up to 28.3 cm during El Niño and 2.2 ∘C under regular conditions) dominate over the interannual ADT and SST shifts.
In the western–central tropical Pacific, La Niña (El Niño) reduces (increases) freshwater flux, affecting interannual SSS variability (Zhang et al., 2012). In contrast, SSS in the ETP is not affected by ENSO, maintaining its strong seasonal cycle in the Panama Bight (range up to 2.6 g kg−1 during El Niño). To understand this result, we assess the SST gradient between the warm Panama Bight and the Cold Tongue, as it modulates the Choco surface wind jet (Poveda and Mesa, 2000). We speculate that this small ENSO effect on SSS is due to a local compensating mechanism in the Panama Bight (Sect. 3.4). ENSO increases the SST, which enhances precipitation (reduces SSS) the entire year. This effect is compensated differently in the two observed seasons. In the first third of the year, ENSO affects the Panama wind jet strength, which enhances upwelling and increases SSS. In the rest of the year, positive ENSO reduces the Choco wind jet strength, decreasing inshore moisture transport and precipitation (increasing SSS). Such complex mechanisms should be studied in more detail as well as ENSO's influence on coastal precipitation and river runoff.
We use six spatial and temporal neurons obtained from SOM analysis to assess the ETP circulation, as well as the ADT seasonal variability and its relation to ENSO conditions. SOM results confirm the different seasonal circulation patterns in the Panama Bight, which are not strongly affected by ENSO. Results also support the strong ENSO effect on the ETP mean ADT, increasing (decreasing) mean sea level during El Niño (La Niña).
The seasonal description of the circulation in the Panama Bight, as well as the ENSO-related interannual variations, is useful to assess regional fluctuations in ocean dynamics. These dynamic changes will have implications for maritime activities such as navigation, but this seasonality and these interannual variations might also affect local climate through ocean–atmosphere fluxes, determine biosphere cycles, force extreme sea levels and enhance erosion, affecting coastal communities. For example, sea level extremes that affect the coastal areas of Panama and Colombia in the Pacific Ocean will increase their flooding probability in December under El Niño conditions, when the monthly mean sea level is 18.2 cm higher than the multiannual ADT mean. Therefore, the study of these air–sea interactions and their temporal variations and relation with global warming in the region should be encouraged.

Figure A1Monthly averaged ADT anomalies (color scale in centimeters) and associated geostrophic circulation (vectors) for the eastern tropical Pacific (ETP). ENSO-related normal conditions (based on Niño 1+2). ADT anomalies are computed subtracting the ETP regional mean during the 1993–2019 period (66.5 cm). The regional average of the ADT anomalies for each month is shown in the upper right of each panel, coinciding with the black line in Fig. A2a time series.
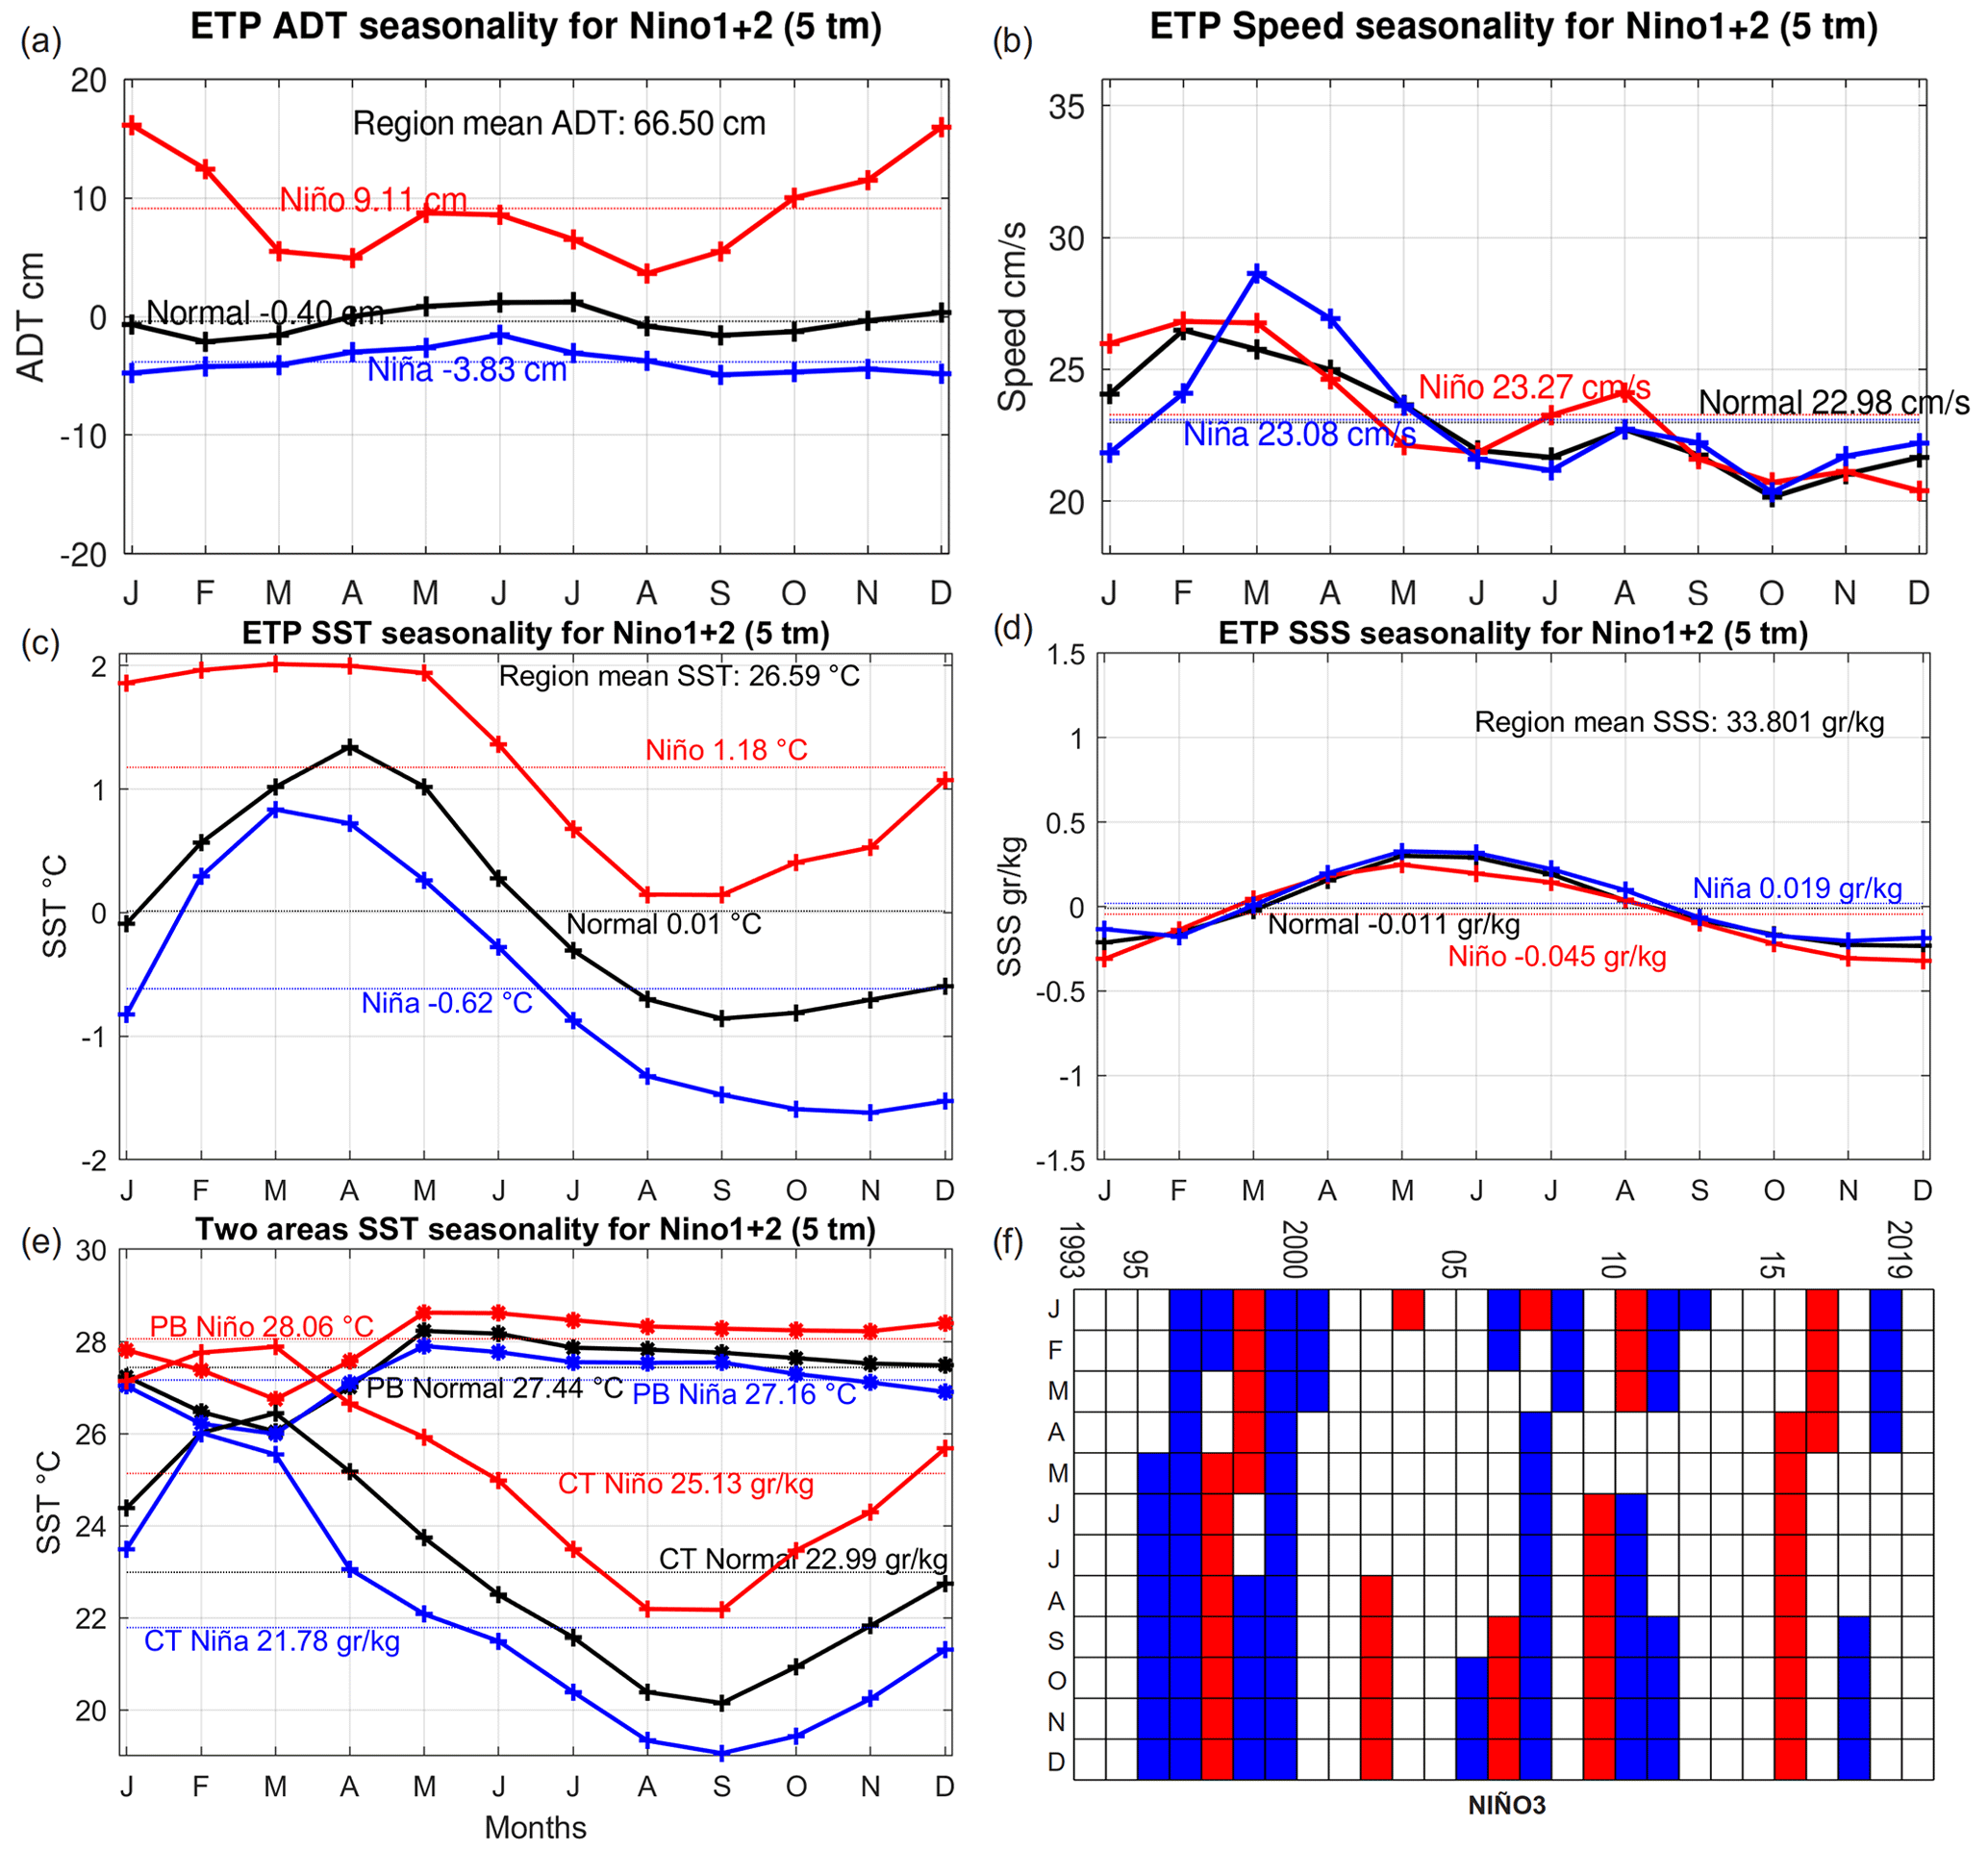
Figure A2Monthly spatially averaged values in the eastern tropical Pacific for 1993–2019, differentiating three ENSO-related conditions (based on Niño 1+2) – normal (black), negative (blue) and positive (red) – showing each time series annual mean. (a) Absolute dynamic topography (ADT) anomalies in centimeters. (b) Geostrophic current speed in centimeters per second. (c) Sea surface temperature (SST) anomalies in degrees Celsius. (d) Sea surface salinity (SSS) anomalies in grams per kilogram. Anomalies are computed subtracting the corresponding regional and temporal mean (value shown in the top of each panel). (e) Monthly SST of the warm Panama Bight (PB) and the Cold Tongue (CT) areas shown in Fig. 5. (f) Matrix indicating the monthly ENSO-related condition between 1993–2019, based on the Niño 3 region (Sect. 2). Normal months in white, negative ENSO in blue and positive ENSO in red.
Software code is available upon request to the authors.
The data sets are available from the corresponding authors on reasonable request.
RRT and AC conceived the idea of the study with the support of EG and CM. IHC, AO and AC performed SOM assessment. All authors contributed to data processing, figure preparation and analysis of results. RRT prepared the manuscript with contributions from AO.
The contact author has declared that none of the authors has any competing interests.
Publisher’s note: Copernicus Publications remains neutral with regard to jurisdictional claims in published maps and institutional affiliations.
The present research was carried out in the framework of the AEI accreditation “Maria de Maeztu Centre of Excellence” given to IMEDEA (CSIC-UIB) (CEX2021-001198). Alejandro Orfila acknowledges financial support from the project LAMARCA (PID2021-123352OB-C31), funded by MICIN/AEI/FEDER and UE, and from the project Tech2Coast (TED2021-130949B-I00), funded by MCIN/AEI and the EU “NextGenerationEU/PRTR”. Ismael Hernández-Carrasco is supported by the TRITOP project (UIB2021-PD06), funded by the Universidad de las Islas Baleares – FEDER (UE).
This research has been supported by the Ministerio de Ciencia e Innovación (grant nos. PID2021-123352OB-C31 and TED2021-130949B-I00).
We acknowledge support of the publication fee by the CSIC Open Access Publication Support Initiative through its Unit of Information Resources for Research (URICI).
This paper was edited by Karen J. Heywood and reviewed by two anonymous referees.
Arbic, B. K., Scott, R. B., Chelton, D. B., Richman, J. G., and Shriver, J. F.: Effects of stencil width on surface ocean geostrophic velocity and vorticity estimation from gridded satellite altimeter data, J. Geophys. Res.-Oceans, 117, C03029, https://doi.org/10.1029/2011JC007367, 2012.
Cabarcos, E., Flores, J.-A., and Sierro, F. J.: High-resolution productivity record and reconstruction of ENSO dynamics during the Holocene in the Eastern Equatorial Pacific using coccolithophores, The Holocene, 24, 176–187, https://doi.org/10.1177/0959683613516818, 2014.
Chaigneau, A., Abarca del Rio, R., and Colas, F.: Lagrangian study of the Panama Bight and surrounding regions, J. Geophys. Res.-Oceans, 111, C09013 https://doi.org/10.1029/2006JC003530, 2006.
Chelton, D. B., Freilich, M. H., and Esbensen, S. K.: Satellite Observations of the Wind Jets off the Pacific Coast of Central America. Part I: Case Studies and Statistical Characteristics, Mon. Weather Rev., 128, 1993–2018, https://doi.org/10.1175/1520-0493(2000)128<1993:SOOTWJ>2.0.CO;2, 2000.
Corredor-Acosta, A., Cortés-Chong, N., Acosta, A., Pizarro-Koch, M., Vargas, A., Medellín-Mora, J., Saldías, G. S., Echeverry-Guerra, V., Gutiérrez-Fuentes, J., and Betancur-Turizo, S.: Spatio-Temporal Variability of Chlorophyll a and Environmental Variables in the Panama Bight, Remote Sens., 12, 2150, https://doi.org/10.3390/rs12132150, 2020.
Devis-Morales, A.: Ciclo anual de temperatura, salinidad y circulación en la cuenca pacífica colombiana con énfasis en su región costera y respuesta de la cuenca a eventos El Niño/La Niña recientes, Universidad de Concepción. Facultad de Ciencias Naturales y Oceanográficas, Departamento de Oceanografía, PhD thesis, http://repositorio.udec.cl/jspui/handle/11594/777 (last access: 16 May 2023), 2009.
Devis-Morales, A., Schneider, W., Montoya-Sánchez, R. A., and Rodríguez-Rubio, E.: Monsoon-like winds reverse oceanic circulation in the Panama Bight, Geophys. Res. Lett., 35, L20607, https://doi.org/10.1029/2008GL035172, 2008.
Dimar: Compilación Oceanográfica de la Cuenca Pacífica Colombiana II, Dirección General Marítima, Bogotá, https://doi.org/10.26640/5412668, 2020.
Fiedler, P. C. and Lavín, M. F.: Introduction: A review of eastern tropical Pacific oceanography, Prog. Oceanogr., 69, 94–100, https://doi.org/10.1016/j.pocean.2006.03.006, 2006.
Fiedler, P. C. and Talley, L. D.: Hydrography of the eastern tropical Pacific: A review, Prog. Oceanogr., 69, 143–180, https://doi.org/10.1016/j.pocean.2006.03.008, 2006.
Grados, C., Chaigneau, A., Echevin, V., and Dominguez, N.: Upper ocean hydrology of the Northern Humboldt Current System at seasonal, interannual and interdecadal scales, Prog. Oceanogr., 165, 123–144, https://doi.org/10.1016/j.pocean.2018.05.005, 2018.
Guinehut, S., Dhomps, A.-L., Larnicol, G., and Le Traon, P.-Y.: High resolution 3-D temperature and salinity fields derived from in situ and satellite observations, Ocean Sci., 8, 845–857, https://doi.org/10.5194/os-8-845-2012, 2012.
Hanley, D. E., Bourassa, M. A., O'Brien, J. J., Smith, S. R., and Spade, E. R.: A Quantitative Evaluation of ENSO Indices, J. Climate, 16, 1249–1258, https://doi.org/10.1175/1520-0442(2003)16<1249:AQEOEI>2.0.CO;2, 2003.
Hastenrath, S. and Lamb, P. J.: Climate dynamics of atmosphere and ocean in the equatorial zone: a synthesis, Int. J. Climatol., 24, 1601–1612, https://doi.org/10.1002/joc.1086, 2004.
Hernández-Carrasco, I. and Orfila, A.: The Role of an Intense Front on the Connectivity of the Western Mediterranean Sea: The Cartagena-Tenes Front, J. Geophys. Res.-Oceans, 123, 4398–4422, https://doi.org/10.1029/2017JC013613, 2018.
Huang, B., Thorne, P. W., Banzon, V. F., Boyer, T., Chepurin, G., Lawrimore, J. H., Menne, M. J., Smith, T. M., Vose, R. S., and Zhang, H.-M.: Extended Reconstructed Sea Surface Temperature, Version 5 (ERSSTv5): Upgrades, Validations, and Intercomparisons, J. Climate, 30, 8179–8205, https://doi.org/10.1175/JCLI-D-16-0836.1, 2017.
Karnauskas, K. B., Seager, R., Kaplan, A., Kushnir, Y., and Cane, M. A.: Observed Strengthening of the Zonal Sea Surface Temperature Gradient across the Equatorial Pacific Ocean, J. Climate, 22, 4316–4321, https://doi.org/10.1175/2009JCLI2936.1, 2009.
Kessler, W. S.: The circulation of the eastern tropical Pacific: A review, Prog. Oceanogr., 69, 181–217, https://doi.org/10.1016/j.pocean.2006.03.009, 2006.
Kohonen, T.: Self-organized formation of topologically correct feature maps, Biol. Cybern., 43, 59–69, https://doi.org/10.1007/BF00337288, 1982.
Lagerloef, G. S. E., Mitchum, G. T., Lukas, R. B., and Niiler, P. P.: Tropical Pacific near-surface currents estimated from altimeter, wind, and drifter data, J. Geophys. Res.-Oceans, 104, 23313–23326, https://doi.org/10.1029/1999JC900197, 1999.
Liu, Y., Weisberg, R. H., and Mooers, C. N. K.: Performance evaluation of the self-organizing map for feature extraction, J. Geophys. Res.-Oceans, 111, C05018, https://doi.org/10.1029/2005JC003117, 2006.
López-Alzate, M. E., Sayol, J. M., Hernández-Carrasco, I., Osorio, A. F., Mason, E., and Orfila, A.: Mesoscale eddy variability in the Caribbean Sea, Ocean Dynam., 72, 679–693, https://doi.org/10.1007/s10236-022-01525-9, 2022.
McDougall, T. J. and Barker, P. M.: Getting started with TEOS-10 and the Gibbs Seawater (GSW) Oceanographic Toolbox, SCOR/IAPSO WG127, 28 pp., 2011.
Morales-Márquez, V., Hernández-Carrasco, I., Simarro, G., Rossi, V., and Orfila, A.: Regionalizing the Impacts of Wind- and Wave-Induced Currents on Surface Ocean Dynamics: A Long-Term Variability Analysis in the Mediterranean Sea, J. Geophys. Res.-Oceans, 126, e2020JC017104, https://doi.org/10.1029/2020JC017104, 2021.
Mulet, S., Rio, M.-H., Etienne, H., Artana, C., Cancet, M., Dibarboure, G., Feng, H., Husson, R., Picot, N., Provost, C., and Strub, P. T.: The new CNES-CLS18 global mean dynamic topography, Ocean Sci., 17, 789–808, https://doi.org/10.5194/os-17-789-2021, 2021.
Orfila, A., Urbano-Latorre, C. P., Sayol, J. M., Gonzalez-Montes, S., Caceres-Euse, A., Hernández-Carrasco, I., and Muñoz, Á. G.: On the Impact of the Caribbean Counter Current in the Guajira Upwelling System, Front. Mar. Sci., 8, 626823, https://doi.org/10.3389/fmars.2021.626823, 2021.
Poveda, G. and Mesa, O. J.: On the existence of Lloró (the rainiest locality on Earth): Enhanced ocean-land-atmosphere interaction by a low-level jet, Geophys. Res. Lett., 27, 1675–1678, https://doi.org/10.1029/1999GL006091, 2000.
Poveda, G., Waylen, P. R., and Pulwarty, R. S.: Annual and inter-annual variability of the present climate in northern South America and southern Mesoamerica, Palaeogeogr. Palaeocl., 234, 3–27, https://doi.org/10.1016/j.palaeo.2005.10.031, 2006.
Rodríguez-Rubio, E., Schneider, W., and Río, R. A. del: On the seasonal circulation within the Panama Bight derived from satellite observations of wind, altimetry and sea surface temperature, Geophys. Res. Lett., 30, 1410, https://doi.org/10.1029/2002GL016794, 2003.
Rodríguez-Rubio, E., Ortiz-Galvis, J. R., and Rueda-Bayona, J. G.: Aspectos oceanográficos, in: Santuario de Fauna y Flora Malpelo: descubrimiento en marcha, Dirección General Marítima, https://doi.org/10.26640/43.2007, 2007.
Rueda-Bayona, J. G., Rodríguez-Rubio, E., and Ortiz-Galvis, J. R.: Caracterización espacio temporal del campo de vientos superficiales del Pacífico colombiano y el Golfo de Panamá a partir de sensores remotos y datos in situ, Bol. Científico CCCP, 49–68, 2007.
Sayol, J.-M., Vásquez, L. M., Valencia, J. L., Linero-Cueto, J. R., García-García, D., Vigo, I., and Orfila, A.: Extension and application of an observation-based local climate index aimed to anticipate the impact of El Niño–Southern Oscillation events on Colombia, Int. J. Climatol., 42, 5403–5429, https://doi.org/10.1002/joc.7540, 2022.
Stevenson, M.: Circulation in the Panama Bight, J. Geophys. Res., 75, 659–672, https://doi.org/10.1029/JC075i003p00659, 1970.
Trenberth, K. E.: The Definition of El Niño, B. Am. Meteorol. Soc., 78, 2771–2778, https://doi.org/10.1175/1520-0477(1997)078<2771:TDOENO>2.0.CO;2, 1997.
Tsuchiya, M. and Talley, L. D.: A Pacific hydrographic section at 88∘ W: Water-property distribution, J. Geophys. Res.-Oceans, 103, 12899–12918, https://doi.org/10.1029/97JC03415, 1998.
Villegas, N., Malikov, I., and Farneti, R.: Sea surface temperature in continental and insular coastal Colombian waters: observations of the recent past and near-term numerical projections, Lat. Am. J. Aquat. Res., 49, 307–328, https://doi.org/10.3856/vol49-issue2-fulltext-2481, 2021.
Wooster, W. S.: Oceanographic observations in the Panama Bight, “Askoy” Expedition, 1941, B. Am. Mus. Nat. Hist., 118, 113–152, 1959.
Wyrtki, K.: Oceanography of the Eastern Equatorial Pacific Ocean, in: Oceanography and Marine Biology: An Annual Review, Vol. 4, Allen and Unwin Ltd, London, 33–68, 1966.
Xue, P., Malanotte-Rizzoli, P., Wei, J., and Eltahir, E. A. B.: Coupled Ocean-Atmosphere Modeling Over the Maritime Continent: A Review, J. Geophys. Res.-Oceans, 125, e2019JC014978, https://doi.org/10.1029/2019JC014978, 2020.
Zhang, R.-H., Zheng, F., Pei, Y., Zheng, Q., and Wang, Z.: Modulation of El Nino-Southern Oscillation by Freshwater Flux and Salinity Variability in the Tropical Pacific, Adv. Atmos. Sci., 29, 647–660, https://doi.org/10.1007/s00376-012-1235-4, 2012.
Zheng, Y., Lin, J.-L., and Shinoda, T.: The equatorial Pacific cold tongue simulated by IPCC AR4 coupled GCMs: Upper ocean heat budget and feedback analysis, J. Geophys. Res.-Oceans, 117, C05024, https://doi.org/10.1029/2011JC007746, 2012.